urbanisation in bangalore - environmental information...
TRANSCRIPT
“I will tell the story as I go along of small cities no less than of great. Most of those that were great once are small today; and those which in
my own lifetime have grown to greatness, were small enough in the
old days.”-- HerodotusHerodotus
(The introductory quote in Jacobs, 1969)

Urbanisation in BangaloreUrbanisation in Bangalore
H. S. Sudhira

OverviewOverview
What is Urbanisation?Looking at Cities as Complex Social SystemsBangalore
An Overview of the CityAnalysing Change for Bangalore CityDevelopment Characteristics across Bangalore
Policies, Planning and ProgramsPoints to ponder

What is Urbanisation?What is Urbanisation?
Evolution of Humans against other life formsOrganization of social systems – 3 levels
1st Level: Hunter – Gatherer2nd Level: Initial Settlements – River Valleys3rd Level: Urban Areas / Towns and Cities
Changing patterns of activity1st Level: Hunting, Collection of fruits, etc.2nd Level: Agriculture – Growing crops, harvesting…3rd Level: Industrialization – Fossil-fuel based
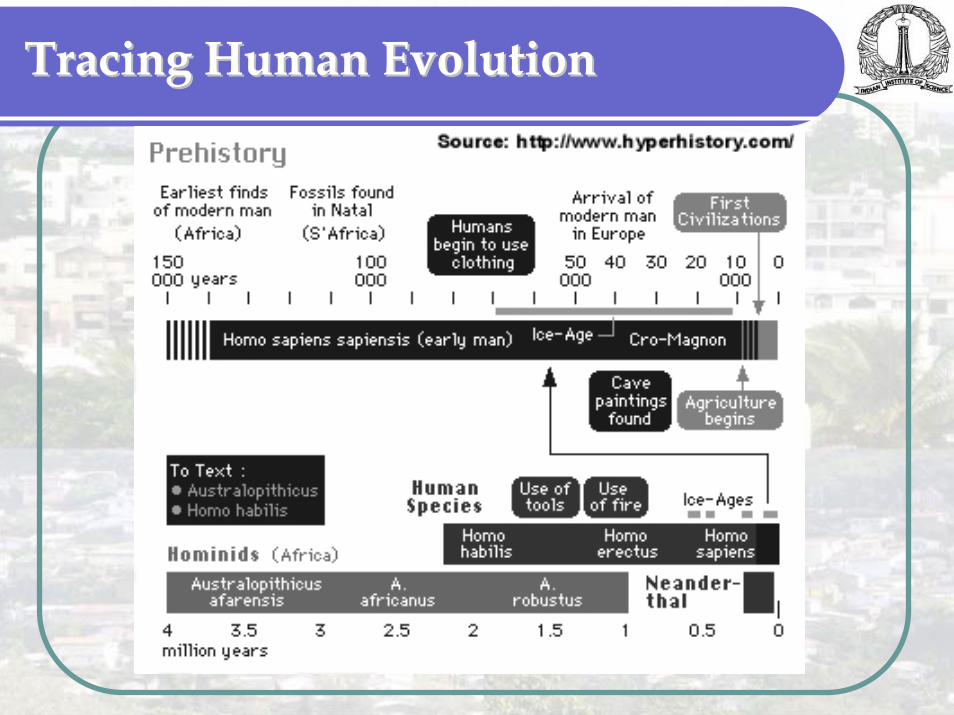
Tracing Human EvolutionTracing Human Evolution

What is Urbanisation?What is Urbanisation?
3rd Level – Post IndustrializationHumans colonizing in large settlementsSupported by surplus food made possible by advances in agriculturePost 18th Century, transformation of human population from largely Rural-Agrarian to Urban-Non-AgrarianCurrently moving towards Urban ~ Service-oriented economies from Industrial and Manufacturing centers

What is Urbanization?What is Urbanization?
Urbanization characterized by the proportional change in urban to total populationTypically characterized by large scale migration from rural-urbanIndia is experiencing Urbanization only since last 60 – 70 yearsNorth America and North-Western Europe are 80 % urbanized and no scope for further urbanizationCurrently India is urbanizing at 3 – 4 % than avg. population growth of 1 – 2 %India is about 27.2 % urbanized, while Karnataka is about 34 %; according to 2001 Census

What is Urbanization?What is Urbanization?
A causal phenomenon of Human Design and Evolutionary EmergenceHuman Design & Evolutionary Emergence
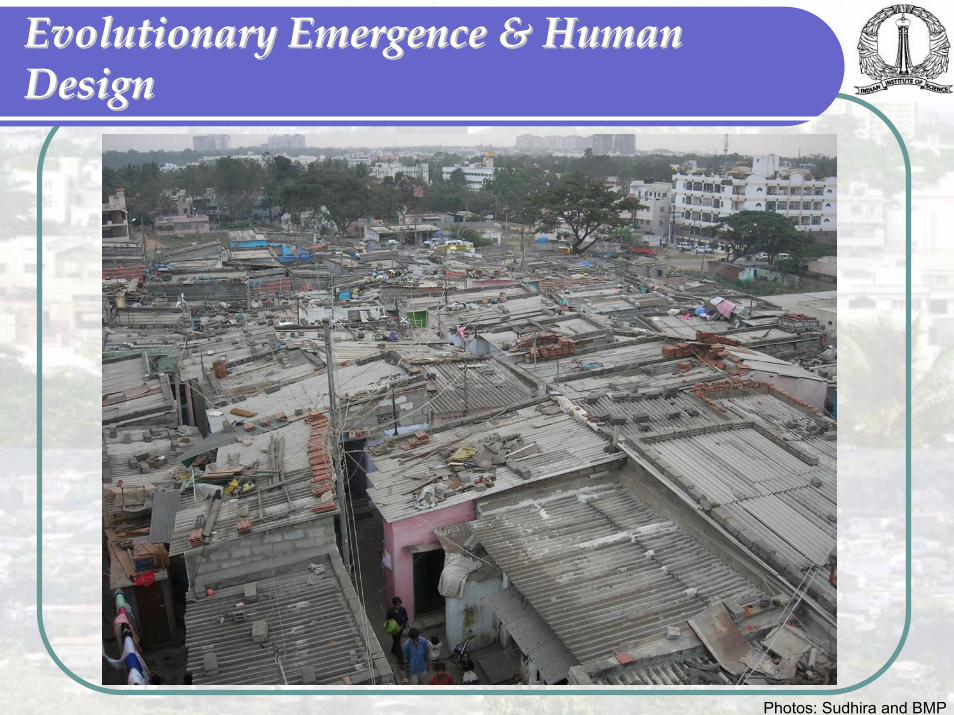
Evolutionary Emergence &Evolutionary Emergence & Human Human DesignDesign
Photos: Sudhira and BMP

Evolutionary Emergence &Evolutionary Emergence & Human Human DesignDesign
Photos: Sudhira
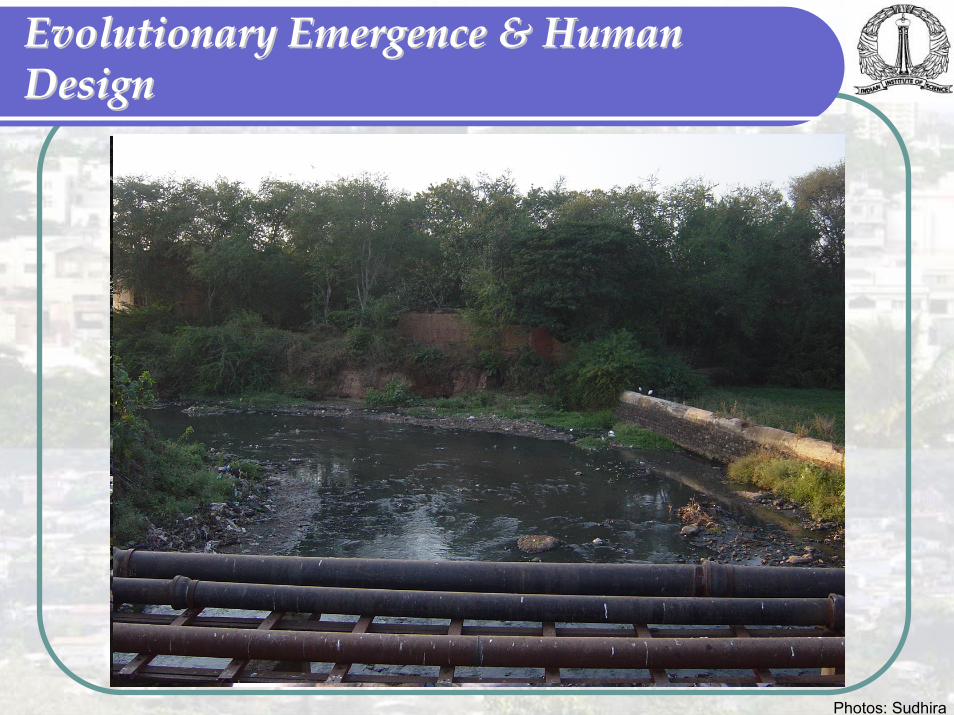
Evolutionary Emergence &Evolutionary Emergence & Human Human DesignDesign
Photos: Sudhira

Cities as Complex Social SystemsCities as Complex Social Systems
Urbanization and Evolutionary Emergence!Towns and Cities – as forms of Human Social OrganizationTowns and Cities depict strange pattern!Scaling in urban systems – Zipf’s LawRank-size of towns and cities fit a power law –depicting hierarchy and urban primacyTowns and cities of Karnataka and India fit Power law for last 100 yearsEssentially Bangalore ranked 1 in population 100 years ago and continues to do so
The Idea of EmergenceThe Idea of Emergence
How systems grow and evolveBiological EvolutionCities and Evolution – Urban EvolutionPuzzles!!
Size of a city and rank – correlated!Popular as Zipf’s law / Pareto law
Size of a city and growth – uncorrelated!Gibrat’s law
Why?Historical path dependence and lock in

Scaling and Urban SystemsScaling and Urban Systems
Evolution of towns and cities since about 8000 yearsPersistence of scaling behaviour in urban systemsAre the scaling effects observed in urban systems produced by the hierarchical organization of societies? Are they emergent properties linked with the historical process of urbanization? Could they disappear after the end of the urban transition?
Emergence of Urban SystemsEmergence of Urban Systems
Implications from Scaling behaviour Organization of human societies in structurally similar pattern as observed in different places irrespective of
Geographic boundaries, Political boundaries and Political economies
New Towns and Larger Urban Agglomerations
Evolution of Towns and Cities in Evolution of Towns and Cities in KarnatakaKarnataka
Dynamics of City-Size DistributionsVerifying for Zipf’s law for Karnataka from 1901 – 2001Verifying for Zipf’s law for India – 2001

Verifying Zipf’s law as applied to cities Verifying Zipf’s law as applied to cities in Karnataka for 2001in Karnataka for 2001
y = 3E+06x-1.0393
R2 = 0.9396
-
1,000,000
2,000,000
3,000,000
4,000,000
5,000,000
6,000,000
1 8 15 22 29 36 43 50 57 64 71 78 85 92 99 106 113 120 127 134 141 148 155 162 169 176 183 190 197 204 211 218 225 232
Rank of Cities
Popu
latio
n (s
ize)
Rank-SizePower (Rank-Size)
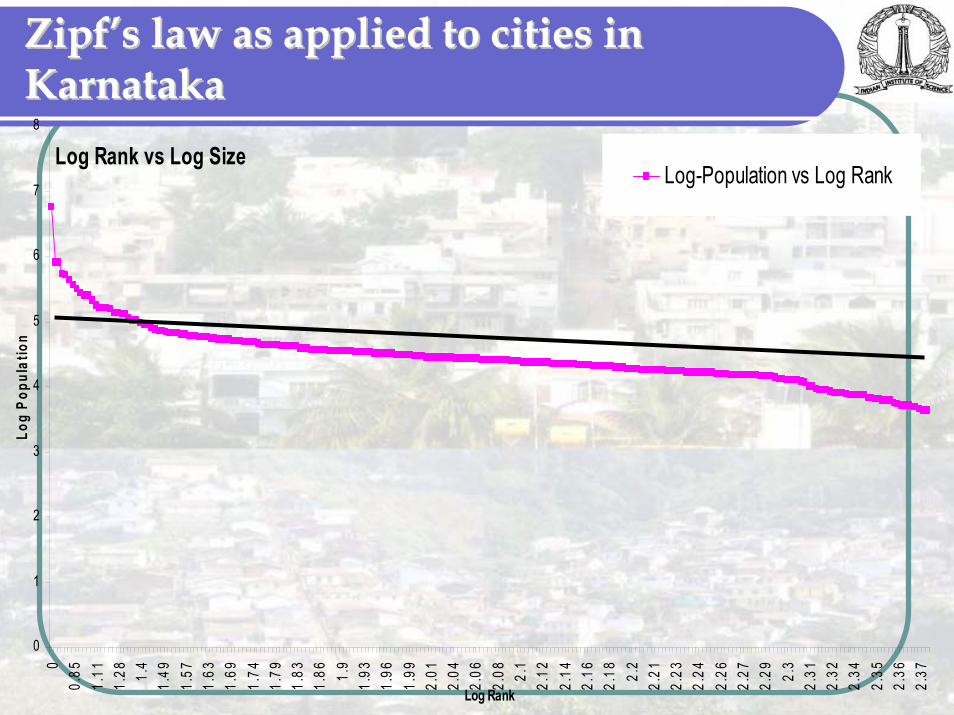
Zipf’s law as applied to cities in Zipf’s law as applied to cities in KarnatakaKarnataka
Log Rank vs Log Size
0
1
2
3
4
5
6
7
8
00.
851.
111.
28 1.4
1.49
1.57
1.63
1.69
1.74
1.79
1.83
1.86 1.
91.
931.
961.
992.
012.
042.
062.
08 2.1
2.12
2.14
2.16
2.18 2.
22.
212.
232.
242.
262.
272.
29 2.3
2.31
2.32
2.34
2.35
2.36
2.37
Log Rank
Log
Popu
latio
n
Log-Population vs Log Rank

Verifying Zipf’s law as applied to cities Verifying Zipf’s law as applied to cities in Indiain India
y = 6E+07x-1.2067
R2 = 0.9583
0
10,000,000
20,000,000
30,000,000
40,000,000
50,000,000
60,000,000
70,000,000
1 12 23 34 45 56 67 78 89 100 111 122 133 144 155 166 177 188 199 210 221 232 243 254 265 276 287 298 309 320 331 342 353 364 375Rank
Popu
latio
n
Total Population Power (Total Population)
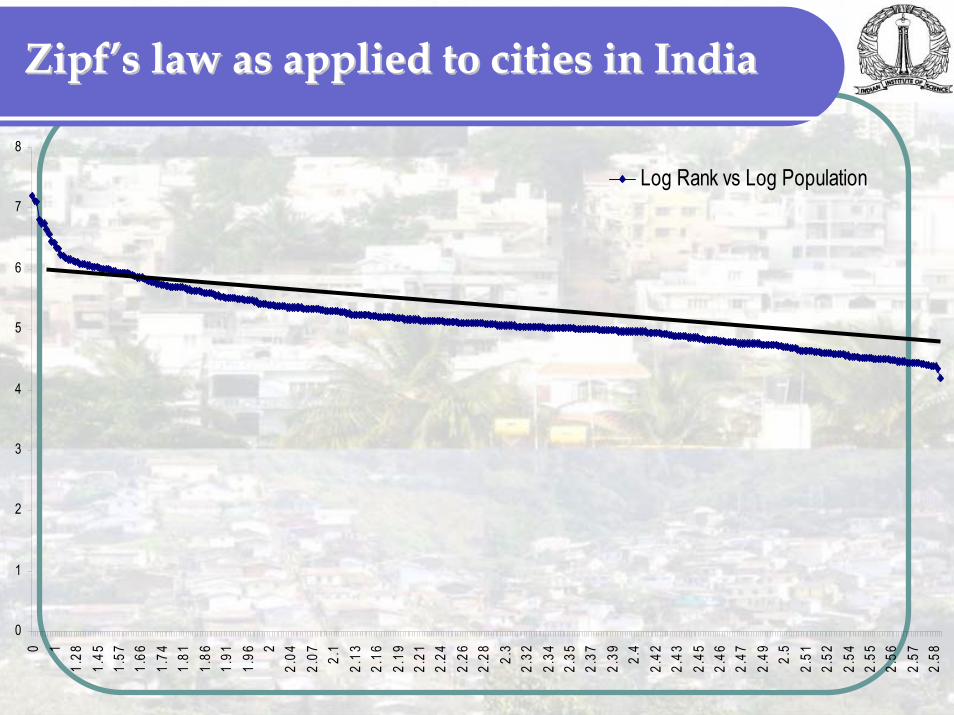
Zipf’s law as applied to cities in IndiaZipf’s law as applied to cities in India
0
1
2
3
4
5
6
7
8
0 11.
281.
451.
571.
661.
741.
811.
861.
911.
96 22.
042.
07 2.1
2.13
2.16
2.19
2.21
2.24
2.26
2.28 2.
32.
322.
342.
352.
372.
39 2.4
2.42
2.43
2.45
2.46
2.47
2.49 2.
52.
512.
522.
542.
552.
562.
572.
58
Log Rank vs Log Population

Evolution of Towns and Cities in Evolution of Towns and Cities in Karnataka from 1901 Karnataka from 1901 -- 2001 2001
Evolution of Towns and Cities
2.5
3
3.5
4
4.5
5
5.5
6
6.5
7
00.903
091.176
09131.342
42271.462
3981.556
30251.633
46851.698
971.755
87491.806
181.851
25831.892
09461.929
41891.963
78781.995
63522.025
30592.053
07842.079
18122.103
80372.127
10482.149
21912.170
26172.190
33172.209
5152.227
88672.245
51272.262
45112.278
75362.294
46622.309
63022.324
28252.338
45652.352
18252.365
488
Log-Rank
Log-
Popu
latio
n
log-pop-1901log-pop-1911log-pop-1921
log-pop-1931log-pop-1941log-pop-1951log-pop-1961log-pop-1971log-pop-1981
log-pop-1991log-pop-2001
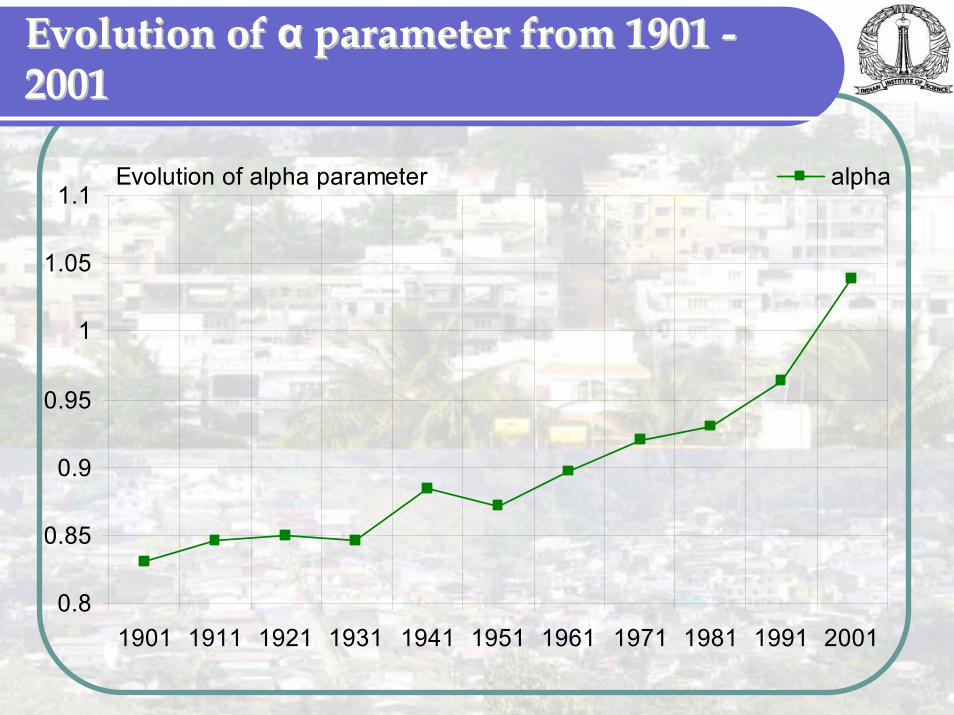
Evolution of Evolution of αα parameter from 1901 parameter from 1901 --20012001
Evolution of alpha parameter
0.8
0.85
0.9
0.95
1
1.05
1.1
1901 1911 1921 1931 1941 1951 1961 1971 1981 1991 2001
alpha

Evolution of Evolution of αα parameter parameter Year α (alpha) R 2 Pk P1
1901 0.8307 0.9341 177976 1630911911 0.8455 0.9212 181396 1894851921 0.8503 0.9491 209419 2400541931 0.8456 0.9562 243477 3097851941 0.8838 0.9528 333558 4109671951 0.8719 0.9669 462989 7863431961 0.8973 0.9651 619737 12069611971 0.9199 0.9441 895520 16642081981 0.9306 0.9801 1294733 29217511991 0.9628 0.9784 1812023 41302882001 1.0393 0.9396 3002970 5686844
Patterns in Urban SystemsPatterns in Urban Systems
In the case of urban systems, scaling effects could be studied by relating either cities population size, their occupied surface, density of activities, speed of transports, income levels and/or accessibility in transportation systems... To consider the question of urban spatial expansion at two scales of analysis, trying to understand two contrasting processes:
at the level of the city, slower growth in surface than in population, increasing urban densities, then rapid urban sprawl with a larger increase in surface than in population during the last decades, inside a general model of spatial distribution characterized by a rather steep but recently decreasing density gradient from the centre to the periphery; and growth in size and number of cities but with increasing size inequalities (and local concentrations) at the scale of the interurban processes (national or regional territories)
Patterns in Urban SystemsPatterns in Urban Systems
In both cases, the controlling parameters could be the means of transportation, with varying speeds over time, and their typical spatial range that is different when adapting to the daily urban system or to the connection within networks of citiesBut perhaps other social (economic) or physical processes have to be included to provide a consistent model at both scales
BendakaaluruBendakaaluru -- Bangalore Bangalore -- BengalooruBengalooru
Courtesy: Google Inc. and HyperCam
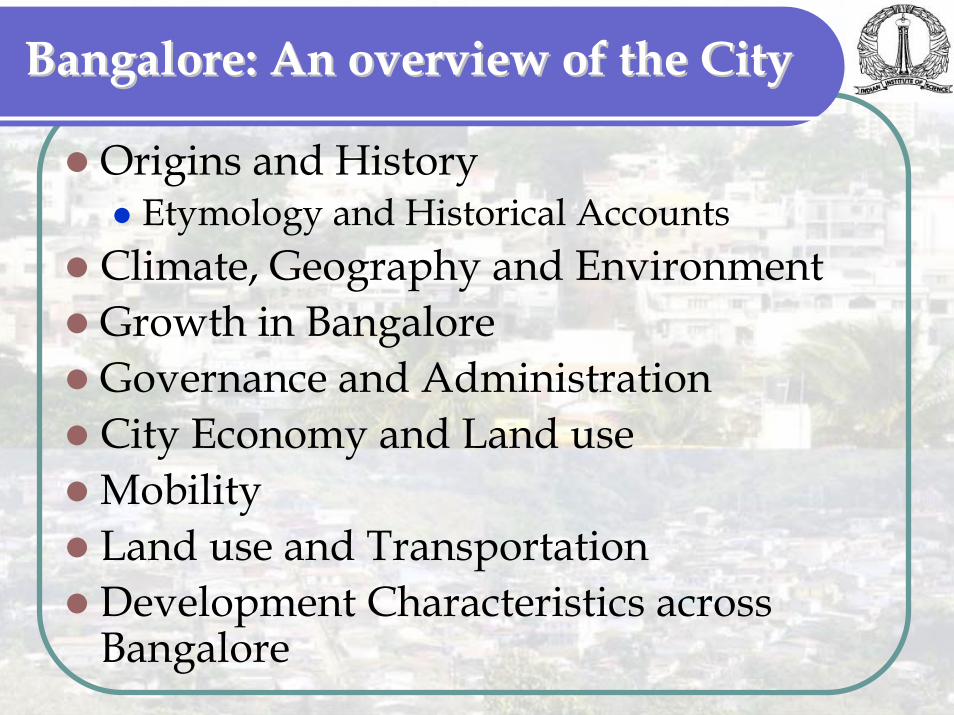
Bangalore: An overview of the CityBangalore: An overview of the City
Origins and HistoryEtymology and Historical Accounts
Climate, Geography and EnvironmentGrowth in BangaloreGovernance and AdministrationCity Economy and Land useMobilityLand use and TransportationDevelopment Characteristics across Bangalore

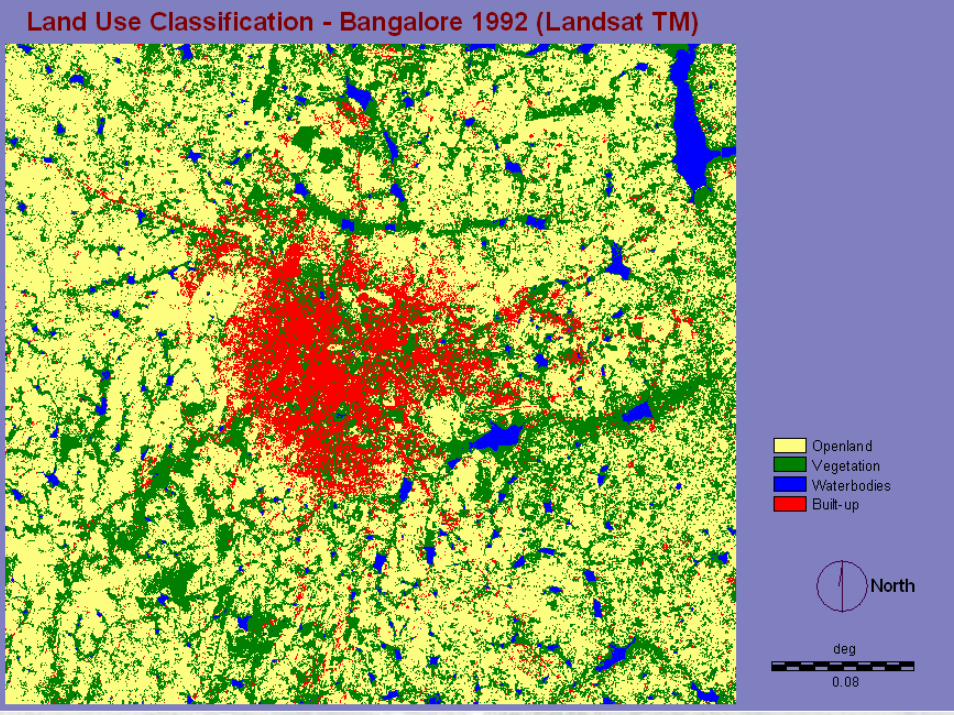
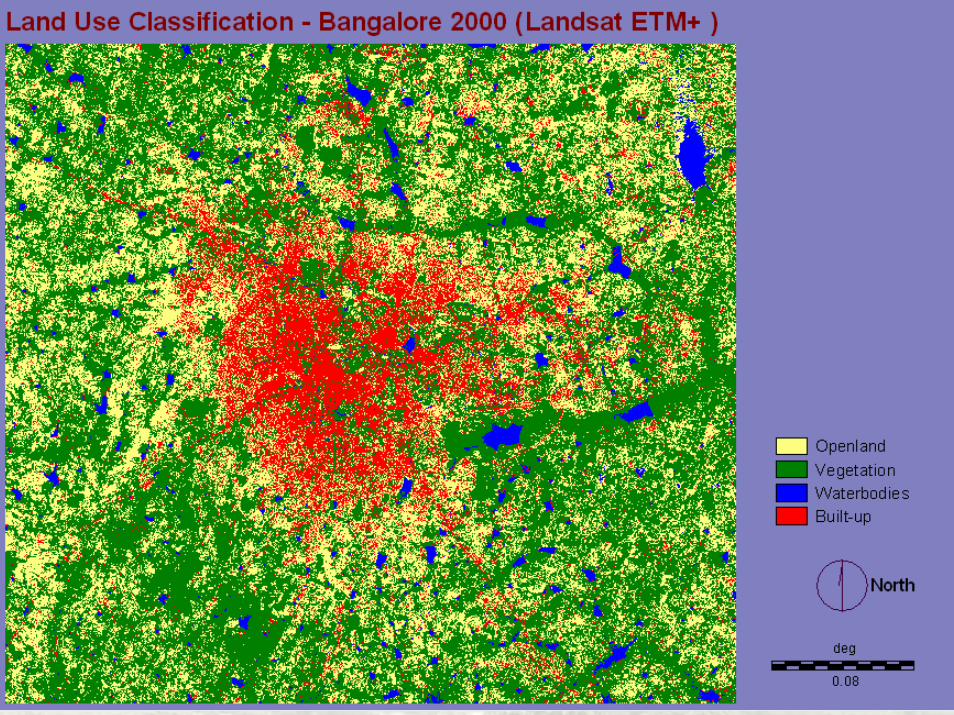
GROWTH OF GROWTH OF BANGALORE BANGALORE
CITYCITY
Maps: Directorate of Census Operations and BMP

Bangalore City Corporation limits over Bangalore City Corporation limits over the yearsthe years
Sl. No. Year Area (sq. km)
1. 1949 692. 1963-64 1123. 1969 1344. 1979 1615. 1995 2266. 2006 696
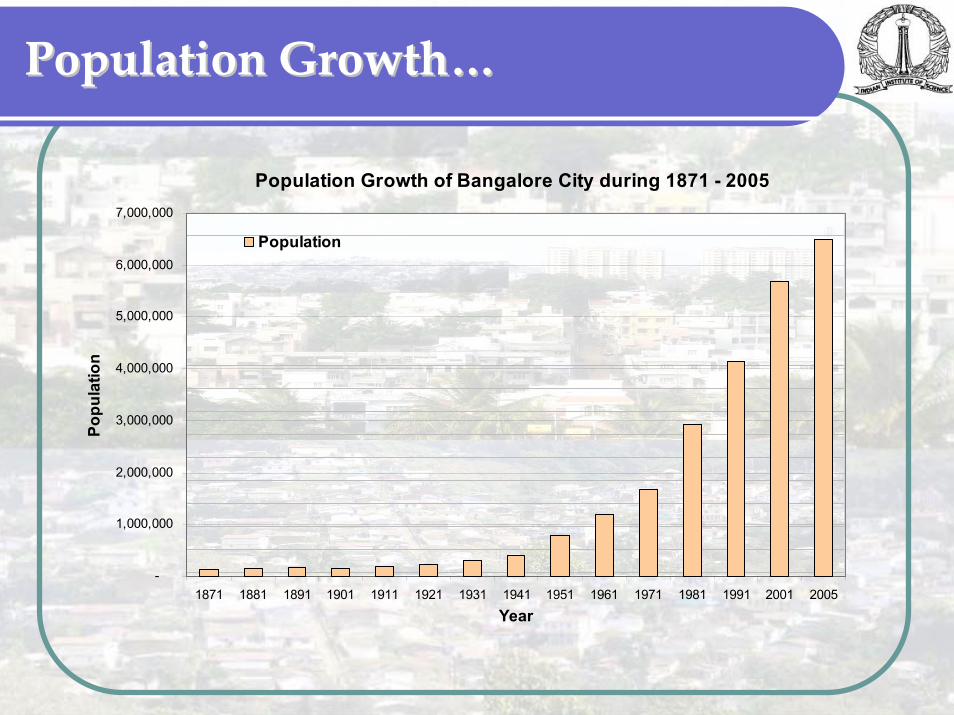
Population Growth…Population Growth…
Population Growth of Bangalore City during 1871 - 2005
-
1,000,000
2,000,000
3,000,000
4,000,000
5,000,000
6,000,000
7,000,000
1871 1881 1891 1901 1911 1921 1931 1941 1951 1961 1971 1981 1991 2001 2005
Year
Popu
latio
n
Population
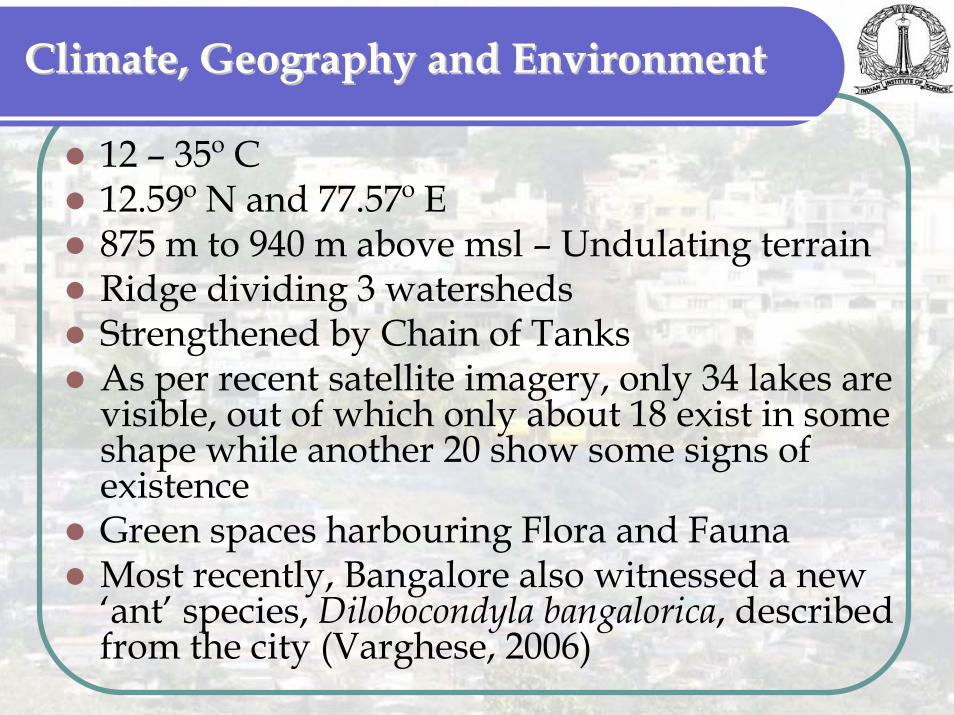
Climate, Geography and EnvironmentClimate, Geography and Environment
12 – 35º C12.59º N and 77.57º E875 m to 940 m above msl – Undulating terrainRidge dividing 3 watershedsStrengthened by Chain of TanksAs per recent satellite imagery, only 34 lakes are visible, out of which only about 18 exist in some shape while another 20 show some signs of existenceGreen spaces harbouring Flora and FaunaMost recently, Bangalore also witnessed a new ‘ant’ species, Dilobocondyla bangalorica, described from the city (Varghese, 2006)

Bangalore LakesBangalore Lakes
Sudhira, 2006. Bangalore Lakes, Wayfaring Map. Available Online: http://www.wayfaring.com/maps/show/19613

BangaloreBangalore
Governance and AdministrationMultitude of organisations – coordination and changing mandatesCommon Geographic Unit / BoundaryHence no information to interpret across domains
City Economy and Land UseCore City Functions – JobsMoving jobs on the periphery – inducing mobility to the outskirtsInputs for City: Water, Energy, Labour, Food, WorkWhat can Bangalore say as its own?
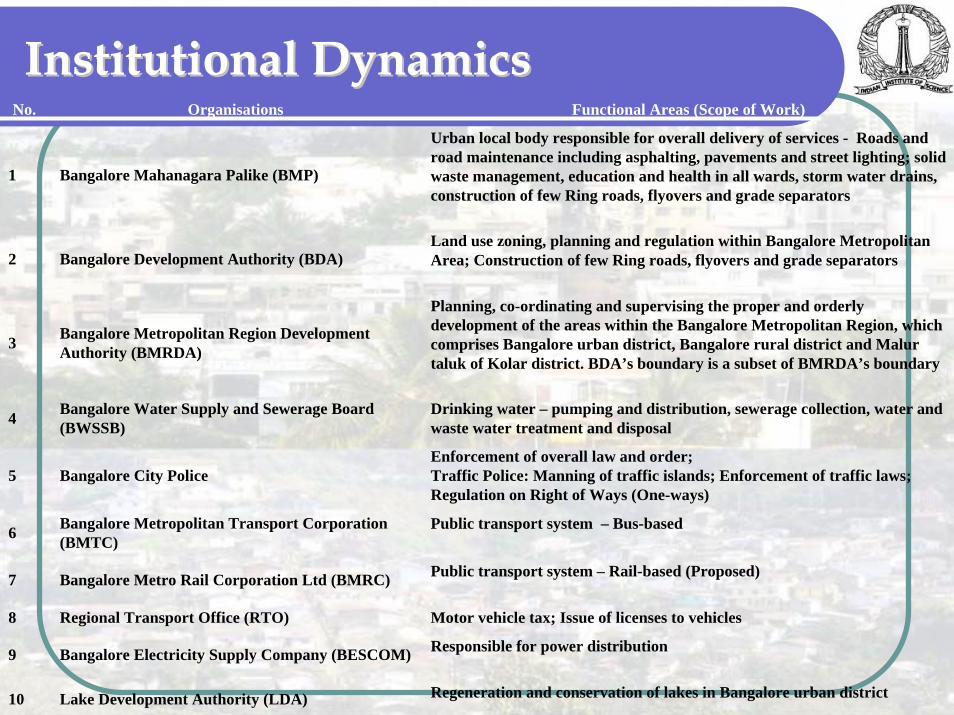
Institutional DynamicsInstitutional DynamicsNo. Organisations Functional Areas (Scope of Work)
1 Bangalore Mahanagara Palike (BMP)
Urban local body responsible for overall delivery of services - Roads and road maintenance including asphalting, pavements and street lighting; solid waste management, education and health in all wards, storm water drains, construction of few Ring roads, flyovers and grade separators
2 Bangalore Development Authority (BDA)Land use zoning, planning and regulation within Bangalore Metropolitan Area; Construction of few Ring roads, flyovers and grade separators
3 Bangalore Metropolitan Region Development Authority (BMRDA)
Planning, co-ordinating and supervising the proper and orderly development of the areas within the Bangalore Metropolitan Region, which comprises Bangalore urban district, Bangalore rural district and Malurtaluk of Kolar district. BDA’s boundary is a subset of BMRDA’s boundary
4 Bangalore Water Supply and Sewerage Board (BWSSB)
Drinking water – pumping and distribution, sewerage collection, water and waste water treatment and disposal
5 Bangalore City Police Enforcement of overall law and order;Traffic Police: Manning of traffic islands; Enforcement of traffic laws; Regulation on Right of Ways (One-ways)
6 Bangalore Metropolitan Transport Corporation (BMTC)
Public transport system – Bus-based
7 Bangalore Metro Rail Corporation Ltd (BMRC) Public transport system – Rail-based (Proposed)
8 Regional Transport Office (RTO) Motor vehicle tax; Issue of licenses to vehicles
9 Bangalore Electricity Supply Company (BESCOM) Responsible for power distribution
10 Lake Development Authority (LDA) Regeneration and conservation of lakes in Bangalore urban district
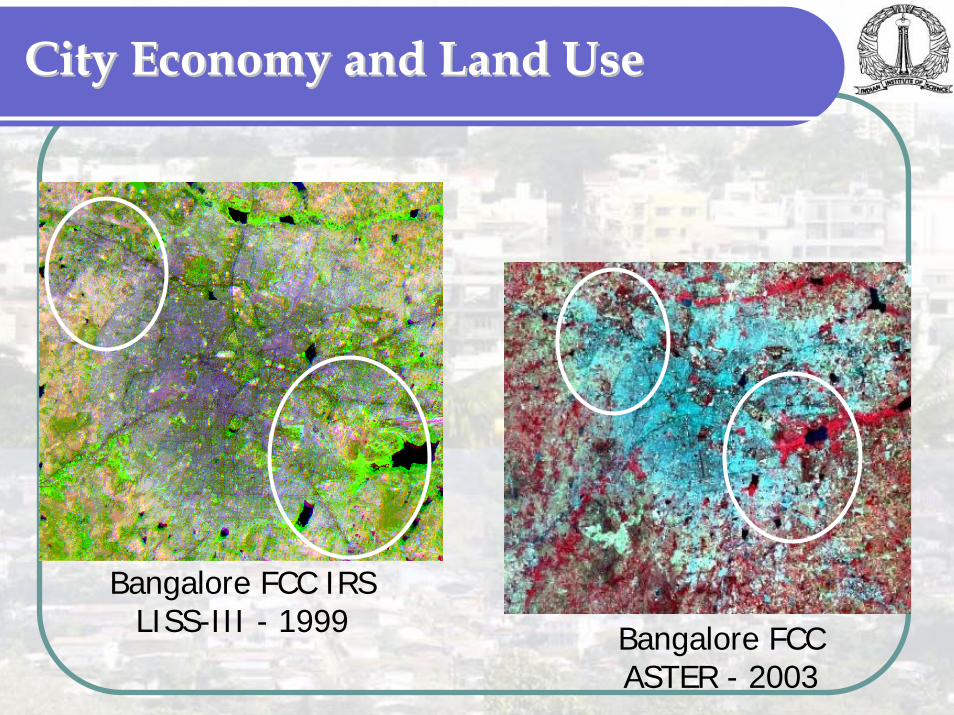
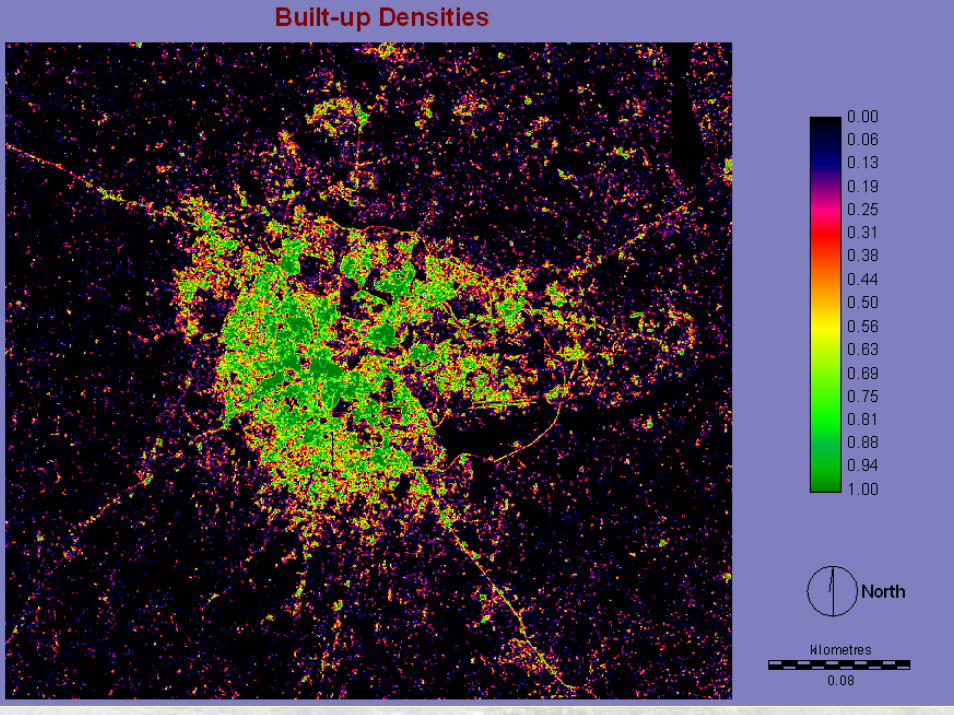
City Economy and Land UseCity Economy and Land Use
Bangalore FCC IRS LISS-III - 1999 Bangalore FCC
ASTER - 2003

Bangalore and MobilityBangalore and Mobility
MobilitySystems Analysis for MobilityPresence of Braess Paradox for transportation networks Stakeholders involvedMultitude of organisations and no information
Systems Analysis – Systems ThinkingRepresented by Causal Loop Diagrams

Causal Loop Diagram for MobilityCausal Loop Diagram for Mobility
Road Widening /Other Construction
Pressure toReduce
Congestion
Travel Time
Road Capacity
Traffic Volume Attractivenessof Driving
Trips per day
Average TripLength
Desired TravelTime
Adequacy ofPublic Transport
Public TransitFarePublic Transit
Ridership
Vehicles perPerson
Vehicles in theRegion
Population andEconomic Activity
Extent of City withinDesired Travel Time
+
+
- +-
+
+
-+
+++
+
+ +
-
-
+
+
+
--
B1
CapacityExpansionR1
Outgrowthof City
B2
DiscretionaryTrips
B3
Extra TravelB4
Take PublicTransport?
Corridor development in light of Corridor development in light of BRAESS ParadoxBRAESS Paradox
Originally presented by Braess in 1968. It consists of a phenomenon which contradicts the common sense:
in a congested traffic network, when a new link connecting two points (e.g. origin and destination) is constructed, it is possible that there is no reduction regarding the time necessary to commute from the origin to the destination. Actually, frequently this time increases and so the costs for the commuters

BMP Master Plan for Transportation BMP Master Plan for Transportation NetworksNetworks
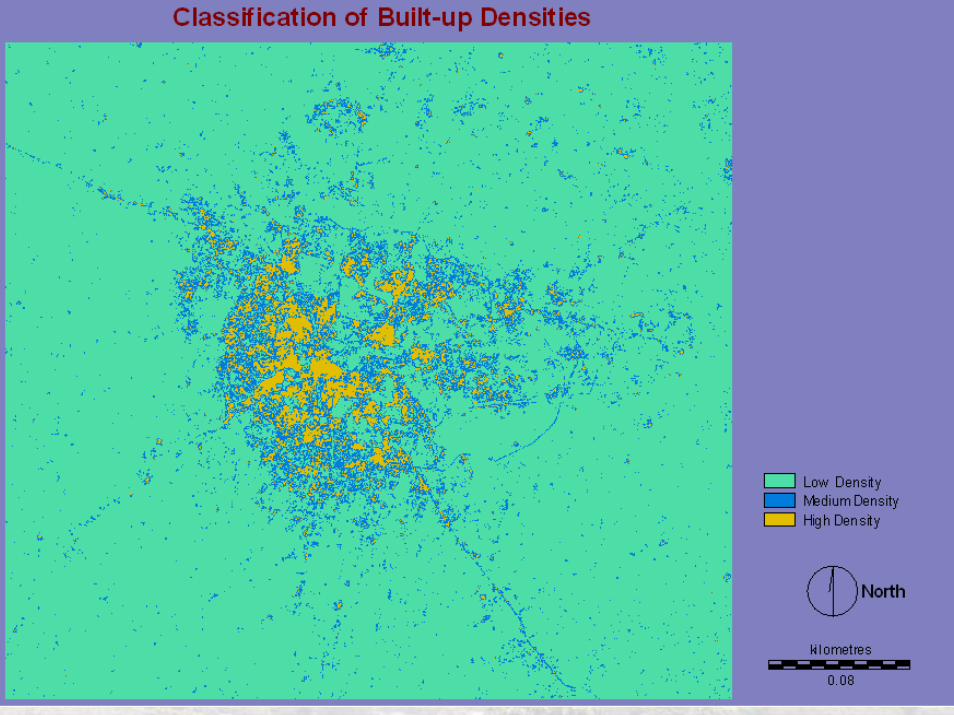
Land Use and TransportationLand Use and Transportation
Changing land use patterns… out growth of urban areas
The percentage of parks and open spaces including lakes and tanks is around 2.5 to 3 % down from 4.4 % in 2002The built-up was 16 % in 2000 and is currently estimated to be around 23-24 %
Creation of ring road – Sinks of sprawlLegitimizing/demarcating the extent of outgrowth

Migration as a factor for Urban GrowthMigration as a factor for Urban Growth
Why Migration?LivelihoodIrregular rainfall and failing crops
Decision to Migrate, ifExpected real income in Urban > Expected real income in RuralProbability of finding a job in Urban > 0
Migration as a factor for Urban GrowthMigration as a factor for Urban Growth
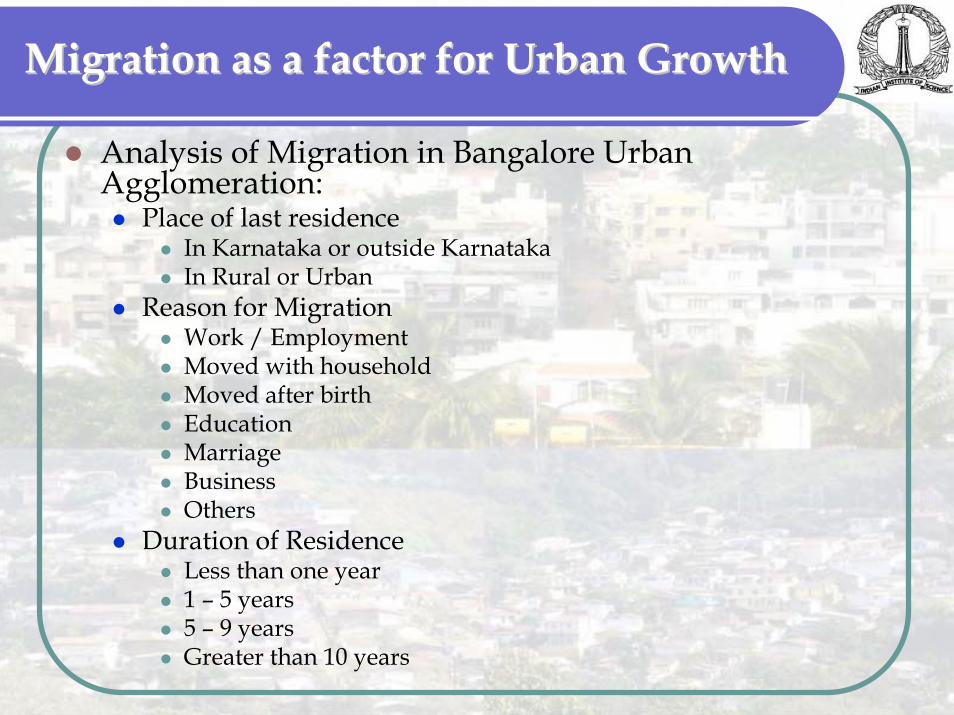
Analysis of Migration in Bangalore Urban Agglomeration:
Place of last residenceIn Karnataka or outside KarnatakaIn Rural or Urban
Reason for MigrationWork / EmploymentMoved with householdMoved after birthEducationMarriageBusinessOthers
Duration of ResidenceLess than one year1 – 5 years5 – 9 years Greater than 10 years

Migrants in all Duration of Residence Migrants in all Duration of Residence and the Reasons for Migrationand the Reasons for Migration
0
100,000
200,000
300,000
400,000
500,000
600,000Work/employment Persons
Business Persons
Education Persons
Marriage PersonsMoved after birth Persons
Moved with household Persons
Others Persons
AllUrbanRural
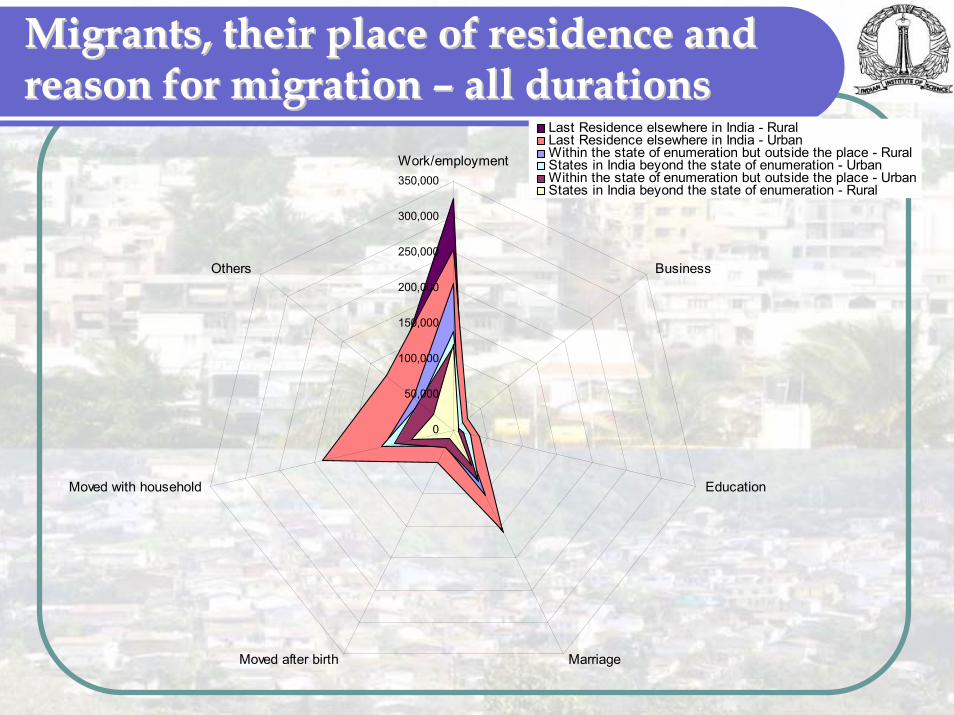
Migrants, their place of residence and Migrants, their place of residence and reason for migration reason for migration –– all durationsall durations
0
50,000
100,000
150,000
200,000
250,000
300,000
350,000Work/employment
Business
Education
MarriageMoved after birth
Moved with household
Others
Last Residence elsewhere in India - RuralLast Residence elsewhere in India - UrbanWithin the state of enumeration but outside the place - RuralStates in India beyond the state of enumeration - UrbanWithin the state of enumeration but outside the place - UrbanStates in India beyond the state of enumeration - Rural
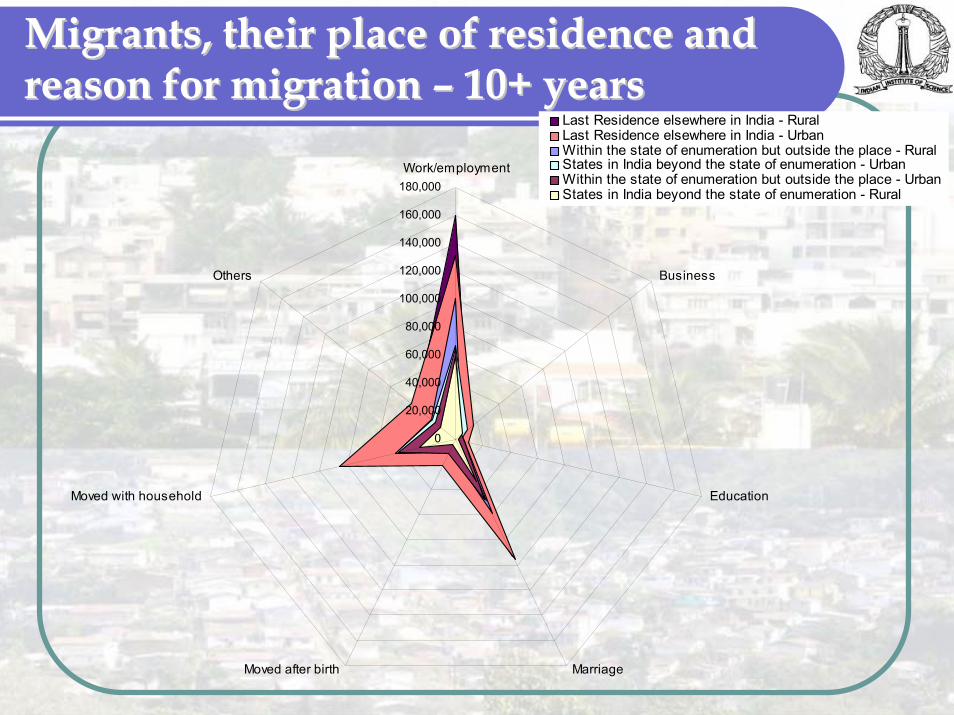
Migrants, their place of residence and Migrants, their place of residence and reason for migration reason for migration –– 10+ years10+ years
0
20,000
40,000
60,000
80,000
100,000
120,000
140,000
160,000
180,000Work/employment
Business
Education
MarriageMoved after birth
Moved with household
Others
Last Residence elsewhere in India - RuralLast Residence elsewhere in India - UrbanWithin the state of enumeration but outside the place - RuralStates in India beyond the state of enumeration - UrbanWithin the state of enumeration but outside the place - UrbanStates in India beyond the state of enumeration - Rural
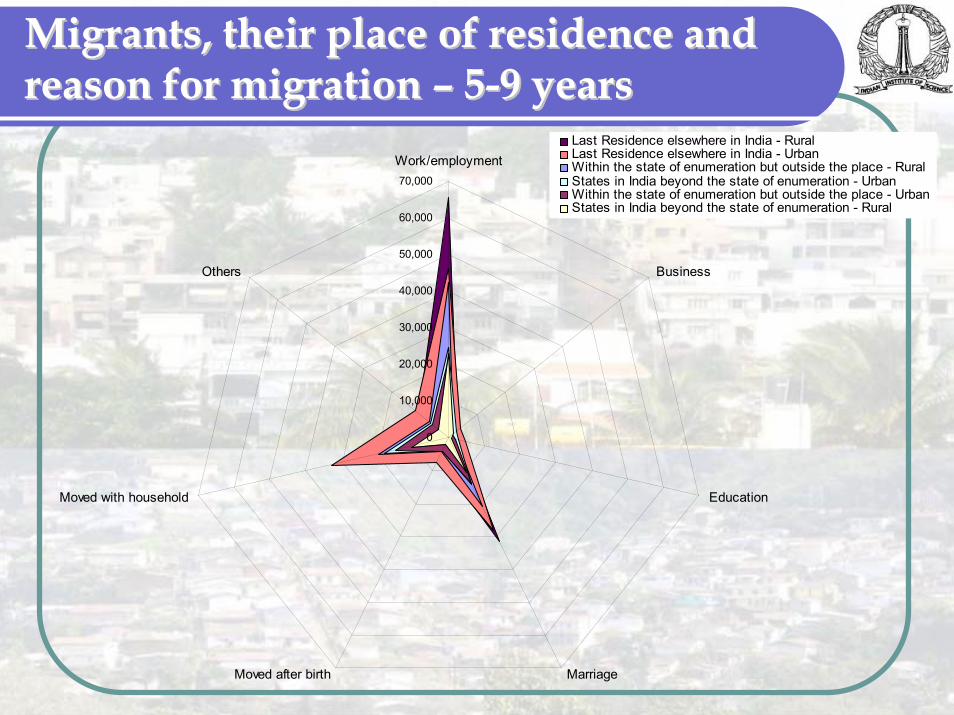
Migrants, their place of residence and Migrants, their place of residence and reason for migration reason for migration –– 55--9 years9 years
0
10,000
20,000
30,000
40,000
50,000
60,000
70,000
Work/employment
Business
Education
MarriageMoved after birth
Moved with household
Others
Last Residence elsewhere in India - RuralLast Residence elsewhere in India - UrbanWithin the state of enumeration but outside the place - RuralStates in India beyond the state of enumeration - UrbanWithin the state of enumeration but outside the place - UrbanStates in India beyond the state of enumeration - Rural
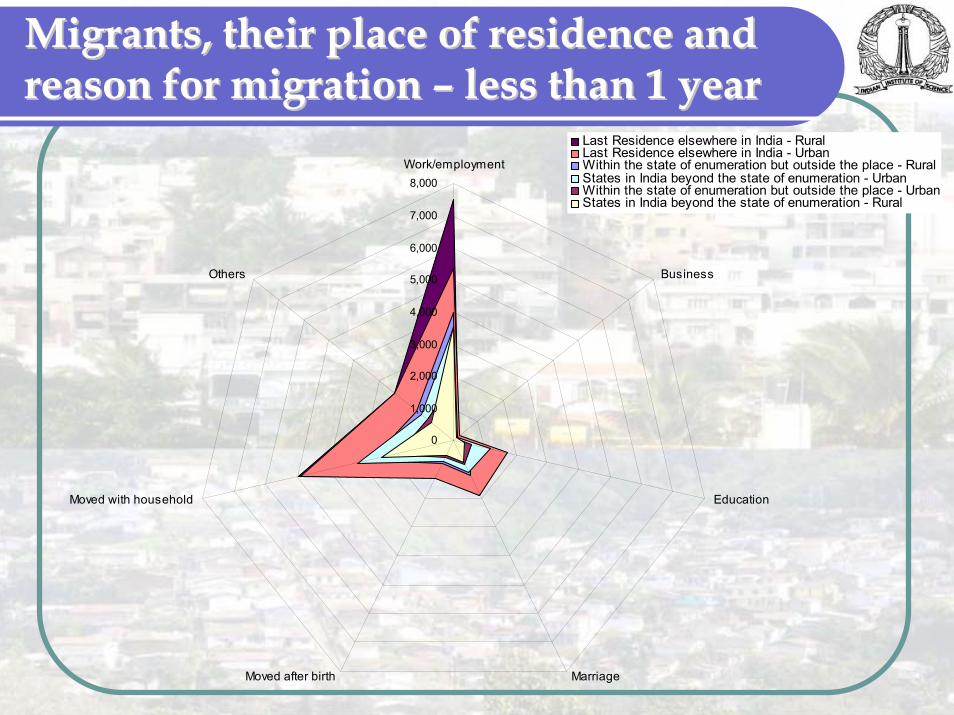
Migrants, their place of residence and Migrants, their place of residence and reason for migration reason for migration –– less than 1 yearless than 1 year
0
1,000
2,000
3,000
4,000
5,000
6,000
7,000
8,000Work/employment
Business
Education
MarriageMoved after birth
Moved with household
Others
Last Residence elsewhere in India - RuralLast Residence elsewhere in India - UrbanWithin the state of enumeration but outside the place - RuralStates in India beyond the state of enumeration - UrbanWithin the state of enumeration but outside the place - UrbanStates in India beyond the state of enumeration - Rural
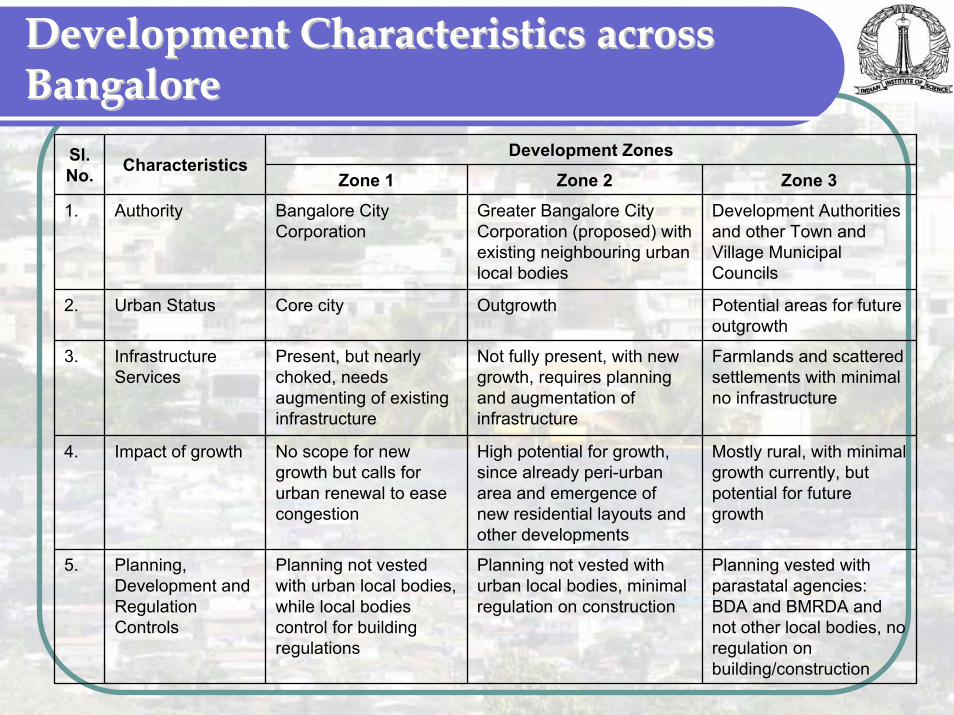
Development Characteristics across Development Characteristics across BangaloreBangalore
Development ZonesSl. No. Characteristics
Zone 1 Zone 2 Zone 3
1. Authority Bangalore City Corporation
Greater Bangalore City Corporation (proposed) with existing neighbouring urban local bodies
Development Authorities and other Town and Village Municipal Councils
2. Urban Status Core city Outgrowth Potential areas for future outgrowth
3. Infrastructure Services
Present, but nearly choked, needs augmenting of existing infrastructure
Not fully present, with new growth, requires planning and augmentation of infrastructure
Farmlands and scattered settlements with minimal no infrastructure
4. Impact of growth No scope for new growth but calls for urban renewal to ease congestion
High potential for growth, since already peri-urban area and emergence of new residential layouts and other developments
Mostly rural, with minimal growth currently, but potential for future growth
5. Planning, Development and Regulation Controls
Planning not vested with urban local bodies, while local bodies control for building regulations
Planning not vested with urban local bodies, minimal regulation on construction
Planning vested with parastatal agencies: BDA and BMRDA and not other local bodies, no regulation on building/construction
Policies, Planning and ProgramsPolicies, Planning and Programs
Policies and PlanningInformation & IndicatorsDynamics and Models Evaluation of Policies
Capturing the multitude of processes in urban systemsPrograms
State govt. initiativesJnNURM

Planning trendsPlanning trends
Multiple Agencies and PlansComprehensive Development Plans – BDACity Development Plans – BMPInfrastructure Development and Investment Plan –KUIDFCComprehensive Traffic and Transportation Plan –Rites
Coordination ?Planning for Life, with Philosophy, Culture, Tradition, and ResourcesSpatial Planning Support Systems ?
Prototype Simulations…

Points to ponderPoints to ponder
Does evolution of new cities follow any underlying principle?Does emergence of large cities irrespective of the international / national / regional economic / political boundary follow Zipf’s law? Alright, if they are following Zipf’s law what do they suggest? Are urban systems and hence urban evolution self-organizing?If rank - size distribution is the accepted, what do deviations at the end suggest?
Points to ponder…Points to ponder…
Central questions are:When do we know / ascribe the emergence of new cities? When do we know / ascribe the decline of large cities
And when does these large cities collapse? (recall Herodotus quote)Any possible ways to detect at least half-life of these cities?
Points to ponder…Points to ponder…
Is Bangalore’s growth self-organizing?How long will Bangalore retain its rank in Karnataka?Does ‘planning’ aid in addressing cities at different scales?
Near-to-Short term / Immediate: Requires Operational PlanningShort-to-Medium: 5-10 yearsLong-term: 10+ years
What will be the fate of cities beyond the fossil fuel regime?

More Questions, than Answers!!More Questions, than Answers!!
Thanks very much!
Where do we go!?Where do we go!?

Zipf’s Law / Power LawZipf’s Law / Power Law
Originally, Zipf's law stated that, in a corpus of natural language utterances, the frequency of any word is roughly inversely proportional to its rank in the frequency table So, the most frequent word will occur approximately twice as often as the second most frequent word, which occurs twice as often as the fourth most frequent word, etc The term has come to be used to refer to any of a family of related power law probability distributions
Zipf's law is most easily observed by scatter plotting the data,with the axes being log (rank order) and log (frequency) For example, "the" as described above would appear at x = log(1), y = log(69971) If the points are close to a single straight line, the distribution follows Zipf's law
Source: Wikipedia
Zipf’s rankZipf’s rank--size rulesize rule
Zipf had expressed such a regularity as an inverse geometric progression between the population Pi of a city and its rank Ri in a national set of towns and cities, giving an approximate size of one half of the largest city population for the population of the second city and one third for the third one, and so on…This “rank size-rule” formulated as Pi = P1 / Rihas been generalized as a Pareto-type distribution of the number of cities according to their size,
Pi = K / Ri α, where the parameter K has a value close to P1 and α is around 1