urban subwatershed restoration manual series 3 … subwatershed restoration manual series ......
TRANSCRIPT

Urban Subwatershed Restoration Manual Series
Urban Stormwater Retrofit Practices
Appendices
August 2007
3
Manual 3


Appendix A: Retrofit Reconnaissance Investigation Form and Retrofit Field
Guide Template


Retrofit Reconnaissance Investigation RRI
Page 1 of 4 Unique Site ID:
WATERSHED: SUBWATERSHED: UNIQUE SITE ID:
DATE: ASSESSED BY: CAMERA ID: PICTURES:
GPS ID: LMK ID: LAT: LONG:
SITE DESCRIPTION Name: Address:
Ownership: Public Private Unknown If Public, Government Jurisdiction: Local State DOT Other:
Corresponding USSR/USA Field Sheet? Yes No If yes, Unique Site ID:
Proposed Retrofit Location: Storage
Existing Pond Above Roadway Culvert Below Outfall In Conveyance System In Road ROW Near Large Parking Lot Other:
On-Site
Hotspot Operation Individual Rooftop Small Parking Lot Small Impervious Area Individual Street Landscape / Hardscape Underground Other:
DRAINAGE AREA TO PROPOSED RETROFIT
Drainage Area ≈ Imperviousness ≈ % Impervious Area ≈
Notes:
Drainage Area Land Use: Residential
SFH (< 1 ac lots) SFH (> 1 ac lots) Townhouses Multi-Family
Commercial
Institutional Industrial Transport-Related Park Undeveloped Other:
EXISTING STORMWATER MANAGEMENT Existing Stormwater Practice: Yes No Possible If Yes, Describe:
Describe Existing Site Conditions, Including Existing Site Drainage and Conveyance:
Existing Head Available and Points Where Measured:

Retrofit Reconnaissance Investigation RRI
Page 2 of 4 Unique Site ID:
PROPOSED RETROFIT
Purpose of Retrofit: Water Quality Recharge Channel Protection Flood Control Demonstration / Education Repair Other:
Retrofit Volume Computations - Target Storage:
Retrofit Volume Computations - Available Storage:
Proposed Treatment Option: Extended Detention Wet Pond Created Wetland Bioretention Filtering Practice Infiltration Swale Other:
Describe Elements of Proposed Retrofit, Including Surface Area, Maximum Depth of Treatment, and Conveyance:
SITE CONSTRAINTS
Adjacent Land Use: Residential Commercial Institutional Industrial Transport-Related Park Undeveloped Other:
Possible Conflicts Due to Adjacent Land Use? Yes No If Yes, Describe:
Access: No Constraints
Constrained due to Slope Space Utilities Tree Impacts Structures Property Ownership Other:
Conflicts with Existing Utilities: None Unknown
Yes Possible Sewer Water Gas Cable Electric Electric to Streetlights Overhead Wires Other:
Potential Permitting Factors: Dam Safety Permits Necessary Probable Not Probable Impacts to Wetlands Probable Not Probable Impacts to a Stream Probable Not Probable Floodplain Fill Probable Not Probable Impacts to Forests Probable Not Probable Impacts to Specimen Trees Probable Not Probable How many? Approx. DBH Other factors:
Soils: Soil auger test holes: Yes No Evidence of poor infiltration (clays, fines): Yes No Evidence of shallow bedrock: Yes No Evidence of high water table (gleying, saturation): Yes No

Retrofit Reconnaissance Investigation RRI
Page 3 of 4 Unique Site ID:
SKETCH

Retrofit Reconnaissance Investigation RRI
Page 4 of 4 Unique Site ID:
DESIGN OR DELIVERY NOTES
FOLLOW-UP NEEDED TO COMPLETE FIELD CONCEPT Confirm property ownership Obtain existing stormwater practice as-builts Confirm drainage area Obtain site as-builts Confirm drainage area impervious cover Obtain detailed topography Confirm volume computations Obtain utility mapping Complete concept sketch Confirm storm drain invert elevations
Confirm soil types Other:
INITIAL FEASIBILITY AND CONSTRUCTION CONSIDERATIONS
SITE CANDIDATE FOR FURTHER INVESTIGATION: YES NO MAYBE IS SITE CANDIDATE FOR EARLY ACTION PROJECT(S): YES NO MAYBE IF NO, SITE CANDIDATE FOR OTHER RESTORATION PROJECT(S): YES NO MAYBE IF YES, TYPE(S):
Retrofit Reconnaissance Field Guide
THIS RRI FIELD GUIDE TEMPLATE SHOULD BE COMPLETED WITH LOCAL DATA
AND ADAPTED TO MEET THE NEEDS OF LOCAL RETROFIT FIELD CREWS
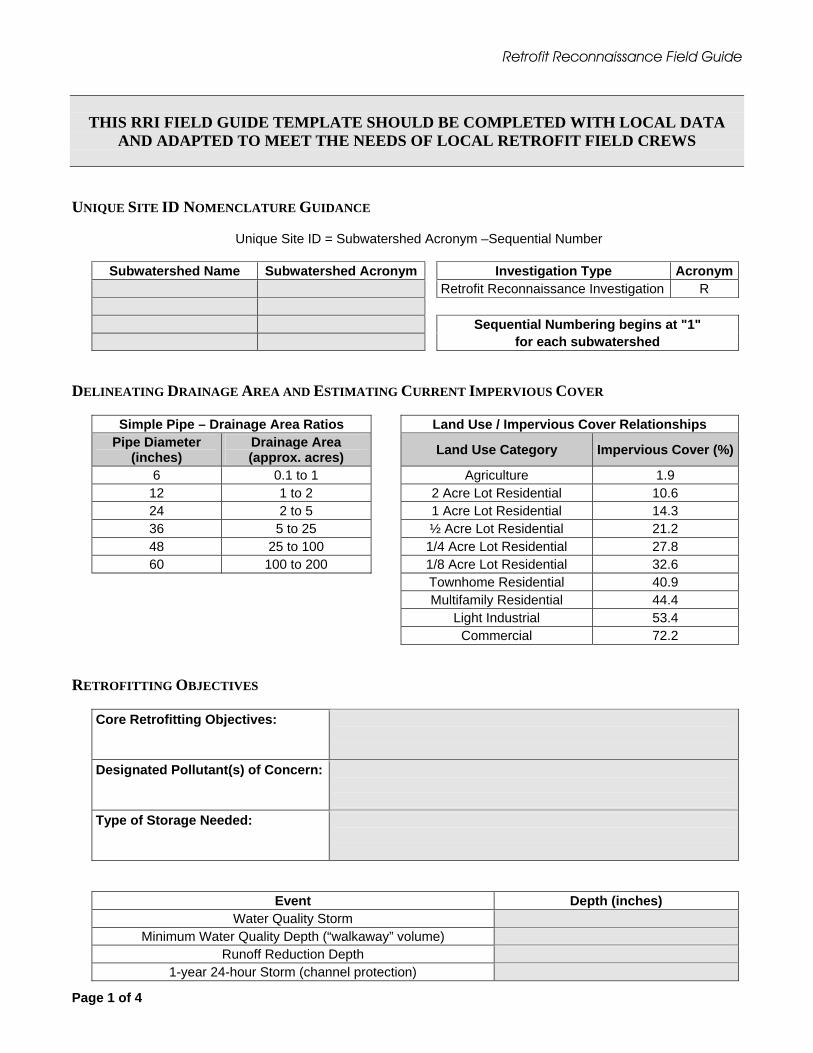
UNIQUE SITE ID NOMENCLATURE GUIDANCE
Unique Site ID = Subwatershed Acronym –Sequential Number
Subwatershed Name Subwatershed Acronym Investigation Type Acronym
Retrofit Reconnaissance Investigation R Sequential Numbering begins at "1" for each subwatershed
DELINEATING DRAINAGE AREA AND ESTIMATING CURRENT IMPERVIOUS COVER
Simple Pipe – Drainage Area Ratios Land Use / Impervious Cover Relationships Pipe Diameter
(inches) Drainage Area (approx. acres) Land Use Category Impervious Cover (%)
6 0.1 to 1 Agriculture 1.9 12 1 to 2 2 Acre Lot Residential 10.6 24 2 to 5 1 Acre Lot Residential 14.3 36 5 to 25 ½ Acre Lot Residential 21.2 48 25 to 100 1/4 Acre Lot Residential 27.8 60 100 to 200 1/8 Acre Lot Residential 32.6
Townhome Residential 40.9 Multifamily Residential 44.4 Light Industrial 53.4 Commercial 72.2
RETROFITTING OBJECTIVES
Core Retrofitting Objectives:
Designated Pollutant(s) of Concern:
Type of Storage Needed:
Event Depth (inches) Water Quality Storm
Minimum Water Quality Depth (“walkaway” volume) Runoff Reduction Depth
1-year 24-hour Storm (channel protection)
Page 1 of 4

Retrofit Reconnaissance Field Guide
Event Depth (inches) 2-year 24-hour Storm
10-year 24-hour Storm 100-year 24-hour Storm
PREFERRED STORMWATER TREATMENT OPTIONS
Ability of Stormwater Treatment Options to Address Retrofit Objectives Stormwater Treatment Option
Retrofit Objective Extended Detention
Wet Ponds Wetlands Bioretention Filtering Infiltration Swales Other
Correct Past Mistakes Reduce Flood Damage
Education / Demonstration
Trap Trash & Floatables Reduce Flows to Combined Sewer Renovate Stream
Corridor Reduce Bank Erosion Support Stream Repair
Full Watershed Restoration
KEY = Primary stormwater treatment option to address objective = Secondary stormwater treatment option = Supplemental stormwater treatment option
Comparison of Pollutant Removal Capability
Stormwater Pollutant Stormwater Treatment
Option TSS TP TN Metals Bacteria Organic Carbon Oil & Grease
Extended Detention X X Wet Ponds Wetlands X Bioretention X Filtering Infiltration ? Swales X X Rooftop Varies KEY
= Excellent Removal (76 to 100%) = Good Removal (51 to 75%) = Fair Removal (26 to 51%)
X = Low Removal (0 to 25%) ? = Unknown Removal
NOTES See Profile Sheets in Chapter 2 for precise removal rates and ranges and Appendix B for documentation on derivation of removal rates
Page 2 of 4
Retrofit Reconnaissance Field Guide
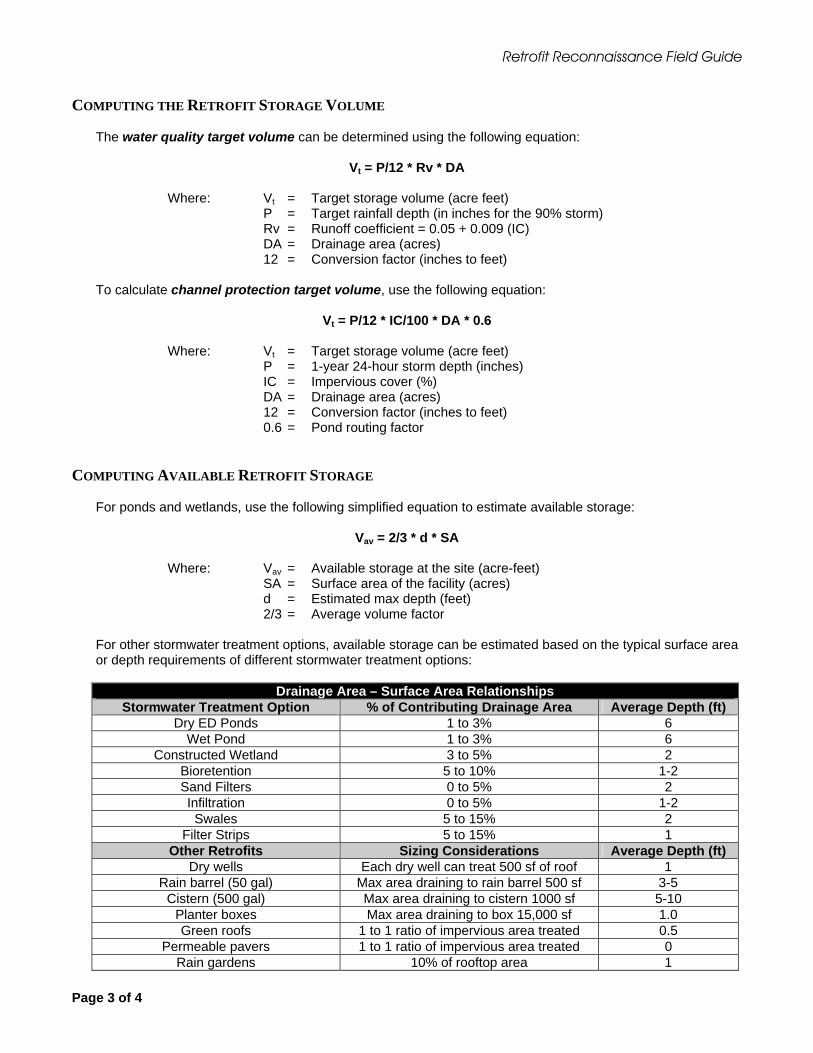
COMPUTING THE RETROFIT STORAGE VOLUME The water quality target volume can be determined using the following equation:
Vt = P/12 * Rv * DA
Where: Vt = Target storage volume (acre feet) P = Target rainfall depth (in inches for the 90% storm) Rv = Runoff coefficient = 0.05 + 0.009 (IC) DA = Drainage area (acres) 12 = Conversion factor (inches to feet)
To calculate channel protection target volume, use the following equation:
Vt = P/12 * IC/100 * DA * 0.6
Where: Vt = Target storage volume (acre feet) P = 1-year 24-hour storm depth (inches) IC = Impervious cover (%) DA = Drainage area (acres) 12 = Conversion factor (inches to feet) 0.6 = Pond routing factor
COMPUTING AVAILABLE RETROFIT STORAGE For ponds and wetlands, use the following simplified equation to estimate available storage:
Vav = 2/3 * d * SA
Where: Vav = Available storage at the site (acre-feet) SA = Surface area of the facility (acres) d = Estimated max depth (feet) 2/3 = Average volume factor
For other stormwater treatment options, available storage can be estimated based on the typical surface area or depth requirements of different stormwater treatment options:
Drainage Area – Surface Area Relationships Stormwater Treatment Option % of Contributing Drainage Area Average Depth (ft)
Dry ED Ponds 1 to 3% 6 Wet Pond 1 to 3% 6
Constructed Wetland 3 to 5% 2 Bioretention 5 to 10% 1-2 Sand Filters 0 to 5% 2 Infiltration 0 to 5% 1-2 Swales 5 to 15% 2
Filter Strips 5 to 15% 1 Other Retrofits Sizing Considerations Average Depth (ft)
Dry wells Each dry well can treat 500 sf of roof 1 Rain barrel (50 gal) Max area draining to rain barrel 500 sf 3-5
Cistern (500 gal) Max area draining to cistern 1000 sf 5-10 Planter boxes Max area draining to box 15,000 sf 1.0 Green roofs 1 to 1 ratio of impervious area treated 0.5
Permeable pavers 1 to 1 ratio of impervious area treated 0 Rain gardens 10% of rooftop area 1
Page 3 of 4

Retrofit Reconnaissance Field Guide
MINIMUM SETBACKS
Minimum Distance… * To Be Maintained From… 10 feet Property Line 25 feet Building Foundation 100 feet Septic System Fields 100 feet Private Well
1,200 feet Public Water Supply Well 400 feet Surface Drinking Water Source 100 feet Surface Water
Do not submerge Sewer Line 10 feet Dry Utilities 15 feet Overhead Wires 10 feet Road (Seepage) 30 feet Highway
* Confirm that these common setbacks are consistent with local regulations
EMERGENCY CONTACT INFORMATION
Field Crew #1 cell phone: Field Crew #2 cell phone: Fire, non-emergency: Police, non-Emergency: Illegal dumping hotline: Blocked storm drain inlet or pipe: Erosion or drainage problems on private property: Erosion or drainage problems on public property: Sanitary sewer problems: Sediment from construction site entering stream: Septic leaks / septic tanks: Stormwater pond safety or maintenance issue: Swimming pool discharge: Trash and debris in parks and streams: Water main break:
Page 4 of 4

Appendix B: Defining Retrofit Pollutant Load Reduction


Urban Subwatershed Restoration Manual 3 B-1
Appendix B: Defining Retrofit Pollutant Load Reduction
I. The Simple Method The Simple Method estimates the annual pollutant load exported in stormwater runoff from small urban catchments (Schueler, 1987). The Simple Method sacrifices some precision for the sake of simplicity and ease of use, but is a reasonably accurate way to predict the pollutant load reduced by individual stormwater retrofits. The annual pollutant load exported in pounds per year from the contributing drainage area to a retrofit can be determined by solving the equation provided in Table B.1. Each of the terms in the equation can be extracted from data contained in a retrofit concept design. Depth of Rainfall (P) P represents the depth of precipitation that falls on the contributing drainage area of the retrofit site during the course of a normal year. Annual rainfall data for select U.S. cities can be obtained from Table 1.2 or derived from local rainfall gages with reliable, long-term (> 20 years) records.
Correction Factor (Pj) Some of the storms that occur during a given year are so minor that they generate no stormwater runoff. The rainfall from these small storms produce is stored in surface depressions and either evaporates into the air or infiltrates into the ground. To account for these storms, the correction factor (Pj) is used. The design team can analyze local rainfall-runoff patterns to determine the value of Pj or simply use prior analyses from the Washington DC area that indicate Pj is approximately 10% of the annual rainfall depth (Schueler, 1987). The default value for Pj should be 0.9 unless local rainfall-runoff analyses are available. Runoff Coefficient (Rv) The runoff coefficient (Rv) is a useful measure of a development site’s response to rainfall events. In theory, it is calculated using the equation provided in Table B.2.
Table B.1: Pollutant Load Export Equation L = [(P)(Pj)(Rv) ÷ (12)a](C)(A)(2.72)a Where: L = Average annual pollutant load (pounds) P = Average annual rainfall depth (inches) Pj = Fraction of rainfall events that produce runoff Rv = Runoff coefficient, which expresses the fraction of rainfall that is converted into runoff C = Event mean concentration of the pollutant in urban runoff (mg/l) A = Area of the contributing drainage (acres) a 12 and 2.72 are unit conversion factors

Appendix B: Defining Retrofit Pollutant Load Reduction
B-2 Urban Subwatershed Restoration Manual 3
The designer is trying to solve the equation for R and does not know the value of Rv. A study of rainfall/runoff relationships for many small watersheds across the U.S. showed that Rv has a distinctly linear relationship with impervious cover (Schueler, 1987). The runoff coefficient increases in direct proportion to the percent impervious cover (I) present in a catchment. The resulting equation shown in Table B.3 can be used to estimate Rv for the contributing drainage area to a retrofit site. Site Area (A) The contributing drainage area (A, in acres) can be directly obtained from the drainage area provided in the retrofit concept plan.
Table B.3: Calculating the Runoff Coefficient
Rv = 0.05 + 0.009(I) Where: I = The amount of impervious cover on the site, expressed as a percentage of the total site area. “I” should be expressed as a whole number within the equation (i.e. a site that is 75% impervious would use I = 75 when calculating Rv)
Pollutant Concentration (C) The last input data needed is the event mean concentration (EMC) of the stormwater pollutant of concern (C) for the retrofit site. Ideally, local stormwater quality monitoring data would be used to define the value of C,
although such data may not be available. As an alternative, designers can consult national stormwater quality monitoring databases that define event mean concentration statistics derived from a large population of runoff monitoring samples. The National Stormwater Quality Database (NSQD) is an extremely helpful tool to define expected EMCs for a wide range of different stormwater pollutants (Pitt et al., 2004). Table B.4 summarizes EMCs for more than 20 common stormwater pollutants in runoff from residential, commercial, industrial, roadway and open space land uses. An updated NSQD is scheduled for release in late 2007. Some designers may want to choose an alternative EMC value to represent a particular stormwater hotspot or because an on-site retrofit serves a single urban source area. While much less monitoring data is available to characterize hotspot runoff, some of the published data significantly depart from the EMC values predicted by the NSQD. Designers may wish to consult Table B.5 in these situations. Proper Use of the Simple Method Several caveats should be observed when applying the Simple Method: • The Simple Method provides an estimate
of the stormwater pollutant load exported from individual retrofit sites less than one square mile in area. More sophisticated water quality simulation models are needed to analyze larger drainage areas.
• It is important to remember that the
Simple Method do not represent the total pollutant load exported from a retrofit site, particularly when the contributing drainage area is large enough to generate
Table B.2: The Runoff Coefficient Rv = R/P Where: R = Volume of storm runoff (watershed-inches) P = Volume of storm rainfall (watershed-inches)

Urban Subwatershed Restoration Manual 3 B-3
appreciable baseflow. The baseflow pollutant load can safely be neglected at the scale of a retrofit site, until the contributing drainage area exceeds about a hundred acres. For example, in a large, sparsely developed subwatershed (e.g. impervious cover of less than 5%), as much as 75% of the annual storm water
runoff volume may occur as baseflow instead of surface runoff (Schueler, 1987). In this case, the pollutant load carried by baseflow may be equivalent to the amount of pollution carried by surface runoff.
Table B.4: Summary of Pollutant EMCs in Stormwater Runoff
All Data Residential Commercial Industrial Freeways Open Space
# of Storms Sampled 3,765 1,042 527 566 185 49
Median Event Mean Concentrations (mg/L or ppm, except where noted) TDS 80 72 72 86 77.5 125 TSS 59 49 43 81 99 48.5 BOD5 8.6 9.0 11.0 9.0 8.0 5.4 COD 53 54.5 58 58.6 100 42.1 Fecal Coliform1 5,091 7,000 4,600 2,400 1,700 7,200 NO2 + NO3 0.60 0.60 0.6 0.69 0.28 0.59 TKN 1.4 1.5 1.5 1.4 2.0 0.74 Total N 2.0 2.1 2.1 2.09 2.28 1.33 Dissolved P 0.13 0.18 0.11 0.10 0.20 0.13 Total P 0.27 0.31 0.22 0.25 0.25 0.31 Dissolved Cu2 8.0 7.0 7.57 8.0 10.9 -- Total Cu2 16 12 17 20.8 34.7 10 Dissolved Zn2 52 31.5 59 112 51 -- Total Zn2 116 73 150 199 200 40 Source: Pitt et al., 2004. 1 MPN/100 mL, which represents the most probable number (MPN) of bacteria that would be found in 100 mL of water 2 Cu and Zn values are shown in Fg/l

Appendix B: Defining Retrofit Pollutant Load Reduction
B-4 Urban Subwatershed Restoration Manual 3
Table B.5: Summary of Pollutant EMCs Associated with Stormwater Hotspots
TSS Total P Total N Fecal Coliform1 Total Cu2 Total Zn2
Land Use Median Event Mean Concentrations (mg/L or ppm, except where noted) Lawns 602 2.1 9.1 2,400 17 50 Landscaping 37 -- -- 9,400 94 263 Residential Roof 19 0.11 1.5 26 200 312 Commercial Roof 9 0.14 2.1 110 7 256 Industrial Roof 17 -- -- 580 62 1390 Res/Comm Parking Lot 27 0.15 1.9 180 51 139
Industrial Parking Lot 228 -- -- 270 34 224
Driveway 173 0.56 2.1 1,700 17 107 Local Residential Street 172 0.55 1.4 3,700 25 173
Commercial Street 468 -- -- 1,200 73 450 Gas Station 31 -- -- -- 88 290 Auto Recycler 335 -- -- -- 103 520 Heavy Industry 124 -- -- -- 148 1600 Sources: Claytor et al., 1996; Steuer et al., 1997; Bannerman, 1993; and Waschbuch, 2000. 1 MPN/100 mL, which represents the most probable number (MPN) of bacteria that would be found in 100 mL of water 2 Cu and Zn values are shown in Fg/l
II. Calculating Pollutant Loads and Pollutant Load Reduction Pollutant load reduction by individual stormwater retrofits is computed in a six-step process, as shown in Table B.6, and described below: Step 1: Calculate CDA Impervious Cover This step calculates the impervious cover (I) present in the drainage area contributing to the proposed retrofit. Operationally, impervious cover is defined as any hard surface in the catchment that cannot infiltrate rainfall, such as rooftops, roads, sidewalks, driveways and any other compacted gravel or dirt surfaces. As a general rule, man-made surfaces that are not vegetated should be considered impervious. Chapter 4.3 describes the methods used to
measure or estimate impervious cover in the retrofit contributing drainage area (Cappiella and Brown, 2001). Unless upland restoration practices remove or disconnect impervious cover in the contributing drainage area, impervious cover before and after the retrofit will be the same. Step 2: Calculate Pre-Retrofit Pollutant Load The second step computes the pollutant load exported from the drainage area prior to the retrofit using the equation shown in Table B.7. Step 3: Identify the Stormwater Retrofit This step identifies the stormwater treatment option(s) that will be applied to the retrofit site, which can be taken directly from the retrofit concept design.

Appendix B: Defining Retrofit Pollutant Load Reduction
Urban Subwatershed Restoration Manual 3 B-5
Table B.6: Process for Calculating Pre- and Post-Retrofit Pollutant Loads
Step Task 1 Calculate Site Imperviousness 2 Calculate the Pre-Retrofit Pollutant Load 3 Identify the Stormwater Retrofit
4 Determine the Retrofit Pollutant Removal Efficiency 5 Calculate the Post-Retrofit Pollutant Load 6 Calculate the Pollutant Load Reduction of the Retrofit
Table B.7: Method for Calculating Pre-Retrofit Pollutant Loading
Lpre = [(P)(Pj)(Rv)/12a](C)(A)(2.72)a Where: Lpre = Average annual pollutant load exported from the site prior to stormwater retrofitting (pounds) P = Average annual rainfall depth (inches) Pj = Fraction of rainfall events that produce runoff Rv = Runoff coefficient C = Event mean concentration of the pollutant in urban runoff (mg/l) A = Area of the contributing drainage area (acres) a 12 and 2.72 are unit conversion factors
Step 4: Use the Design Point Method to Determine Retrofit Pollutant Removal Efficiency Median pollutant removal rates for each stormwater treatment option are presented in Chapter 3. These rates need to be adjusted to account for site-specific factors and design features than can enhance or reduce their pollutant removal rates using the design point method. The method consists of a series of tables that award or deduct points for certain site-specific conditions and design factors present at the individual retrofit site. The designer selects the appropriate design point table for the stormwater treatment option they plan to use, reviews the proposed retrofit design and
computes a total retrofit design score. If the design score is positive, the removal rate for the pollutant of concern is increased using the equation provided in Table B.8. If the retrofit score is negative, the removal rate is reduced using the equation provided in Table B.9. The example provided in Box B.1 illustrates the use of the design point method on a hypothetical retrofit site. Note that the net design score excludes the design factors that only influence phosphorus removal, while the net phosphorus score includes them. The designer should use the net phosphorus score to adjust the phosphorus removal rate and the net design score to adjust the removal rates for all other pollutants.

Appendix B: Defining Retrofit Pollutant Load Reduction
B-6 Urban Subwatershed Restoration Manual 3
Box B.1: Applying the Design Point Method A bioretention retrofit is being proposed to serve a contributing drainage area that is one acre in size and 35% impervious. After review of the retrofit concept design, the designer awards the following points for the project: Negative Factors that Reduce Removal Rates
Does not provide full WQv, due to space constraints Filter bed less than 18 inches deep, due to limited available head Single cell design, due to space constraints Underdrain needed, to address cold climate conditions and impermeable soils
Positive Factors that Enhance Removal Rates
Filter media soil P-Index less than 30, to enhance phosphorus removal Upflow pipe on underdrain, to enhance nitrogen removal
Design Factors X Points Exceeds target WQv by more than 50% + 3 Exceeds target WQv by more than 25% + 2 Tested filter media soil P Index less than 30 (phosphorus only) X + 3 Filter bed deeper than 30 inches + 1 Two cell design with pretreatment + 1 Permeable soils; no underdrain needed + 2 Upflow pipe on underdrain X +1 Impermeable soils; underdrain needed X - 1 Filter bed less than 18 inches deep X - 1 Single cell design X - 1 Bioretention cell is less than 5% of CDA -1 Does not provide full water quality storage volume X - 2 Filter media not tested for P Index (phosphorus only) - 3 NET DESIGN SCORE (max of 5 points) - 4 NET PHOSPHORUS SCORE - 1
Since both design scores are negative (-4 and -1), the median pollutant removal rates are decreased using the equation provided in Table B.9. The adjusted removal rates for the retrofit are shown below: Total Suspended Solids 24% Bacteria 26% Total Phosphorus -11% Hydrocarbons 82% Total Nitrogen 41% Chloride 00% Total Zinc 48% Trash/Debris 82% Total Copper 48%
Table B.8: Adjusting Removal Rates for Retrofits with a Positive Design Score
Adjusted RR = Median RR + [(DS ÷ 5) ∗ (High End RR – Median RR)] Where: RR = Removal rate (%) DS = Design score Note: A maximum of five positive design points is allowed
Table B.9: Adjusting Removal Rates for Retrofits with a Negative Design Score
Adjusted RR = Median RR + [(DS ÷ 5) ∗ (Median RR – Low End RR)] Where: RR = Removal rate (%) DS = Design score Note: A maximum of five negative design points is allowed

Appendix B: Defining Retrofit Pollutant Load Reduction
Urban Subwatershed Restoration Manual 3 B-7
The example shows why it is so important to maximize site and design factors to enhance the pollutant removal performance of the retrofit. In many cases, the designer may revise their concept design to include design features that can attain a higher net design point score. Step 5: Calculate Post-Retrofit Pollutant Load This step calculates the pollutant load exported from the drainage area contributing to the retrofit using the equation shown in Table B.10. Step 6: Calculate the Pollutant Load Reduction of the Retrofit The final step calculates the pollutant load reduced by the proposed stormwater retrofit, which is simply the post-retrofit pollutant load, subtracted from the pre-retrofit pollutant load (Table B.11).
Table B.10: Method for Calculating Post-Retrofit Pollutant Loading
Lpost = Lpre * [1 - (RR)] Where: Lpost = Annual pollutant load exported from the site after stormwater retrofit (pounds/yr) RR = Adjusted removal rate (%) calculated in Step 4 Lpre = Annual pollutant load exported from the site before the stormwater retrofit (pounds/year)
Table B.11: Method for Calculating the Pollutant Load Reduction of the Retrofit
LR = Lpost – Lpre Where: LR = Annual pollutant load removed by the proposed retrofit (pounds/year) Lpost = Annual pollutant load exported from the site after stormwater retrofitting (pounds/year) Lpre = Annual pollutant load exported from the site prior to stormwater retrofitting (pounds/year)

Appendix B: Defining Retrofit Pollutant Load Reduction
B-8 Urban Subwatershed Restoration Manual 3
III. Design Point Tables This section presents the design point tables for seven stormwater treatment options.
1. ED Retrofits
Design Factors X Points Wet ED or Multiple Cell Design + 2 Exceeds target WQv by more than 25% + 1 Exceeds target WQv by more than 50% + 2 Off-line design + 1 Flow path greater than 1.5 to 1 + 1 Sediment forebay + 1 Constructed wetland elements included in design + 1 On-line design - 1 Flow path less than 1:1 - 1 Pond SA/CDA ratio less than 2% - 2 Does not provide full WQv volume - 2 Pond intersects with groundwater - 2 NET DESIGN SCORE (max. of 5 points)
2. Wet Pond Retrofits
Design Factors X Points Wet ED or Multiple Pond Design + 2 Exceeds target WQv by more than 50% + 2 Exceeds target WQv by more than 25% + 1 Off-line design + 1 Flow path greater than 1.5 to 1 + 1 Sediment forebay at major outfalls + 1 Wetland elements cover at least 10% of surface area + 1 Single cell pond - 1 Flow path less than 1:1 - 1 On-line design - 1 Pond SA/CDA ratio less than 2% - 2 Does not provide full WQv volume - 2 Pond intersects with groundwater - 2 NET DESIGN SCORE (max of 5 points)
3. Wetland Retrofits Design Factors X Points Pond-Wetland or Multiple Cell Design + 2 Exceeds target WQv by more than 50% + 2 Complex wetland microtopography + 2 Exceeds target WQv by more than 25% + 1 Flow path greater than 1.5 to 1 + 1 Wooded wetland design + 1 Off-line design + 1 No forebay or pretreatment features - 1 Wetland intersects with groundwater - 1 Flow path is less than 1:1 - 1 No wetland planting plan specified - 2 Wetland SA to CDA ratio is less than 1.5% - 2 Does not provide full WQv volume - 2 NET DESIGN SCORE (max of 5 points)

Appendix B: Defining Retrofit Pollutant Load Reduction
Urban Subwatershed Restoration Manual 3 B-9
4. Bioretention Retrofits
Design Factors X Points Exceeds target WQv by more than 50% + 3 Exceeds target WQv by more than 25% + 2 Tested filter media soil P Index less than 30 (phosphorus only) + 3 Filter bed deeper than 30 inches + 1 Two cell design with pretreatment + 1 Permeable soils; no underdrain needed + 2 Upflow pipe on underdrain +1 Impermeable soils; underdrain needed - 1 Filter bed less than 18 inches deep - 1 Single cell design - 1 Bioretention cell is less than 5% of CDA -1 Does not provide full water quality storage volume - 2 Filter media not tested for P Index (phosphorus only) - 3 NET DESIGN SCORE (max of 5 points) NET PHOSPHORUS SCORE (max of 5 points)
5. Filtering Retrofits
Design Factors X Points Exceeds target WQv by more than 50% + 3 Exceeds target WQv by more than 25% + 2 Site is a severe or confirmed hotspot + 2 Organic media used within filter bed (all pollutants except N/P) + 2 Two cells with at least 25% WQv allocated to pretreatment + 1 Filter bed SA is at least 2.5% of CDA + 1 Filter bed exposed to sunlight + 1 Off-line design w/ storm bypass + 1 Dry pretreatment - 1 On-line design, w/o storm bypass - 1 Underground design (except MCTT) - 1 Filter design is hard to access for maintenance - 2 Does not provide full WQv volume - 3 NET DESIGN SCORE (max of 5 points)
6. Infiltration Retrofits Design Factors X Points
Exceeds target WQv by more than 50% + 3 Exceeds target WQv by more than 25% + 2 Tested infiltration rates between 1.0 and 4.0 in/hr + 2 At least two forms of pretreatment prior to infiltration + 2 CDA is nearly 100% impervious + 1 Off-line design w/ cleanout pipe + 1 Underdrain utilized - 1 Filter fabric used on trench bottom - 1 CDA more than 1.0 acre - 1 Soil infiltration rates < 1.0 in/hr or > 4.0 in/hr - 2 Pervious areas or construction clearing in CDA - 2 Does not provide full WQv volume - 3 NET DESIGN SCORE (max of 5 points)

Appendix B: Defining Retrofit Pollutant Load Reduction
B-10 Urban Subwatershed Restoration Manual 3
7. Swale Retrofits Design Factors X Points
Exceeds target WQv by more than 50% + 3 Dry or wet swale design + 2 Exceeds target WQv by more than 25% + 2 Longitudinal swale slope between 0.5 to 2.0% + 1 Velocity within swale < 1 fps during WQ storm + 1 Measured soil infiltration rates exceed 1.0 in/hr + 1 Multiple cells with pretreatment + 1 Off-line design w/ storm bypass + 1 Longitudinal swale slope < 0.5% or > 2% - 1 Measured soil infiltration rates less than 1.0 in/hr - 1 Swale sideslopes more than 5:1 h:v - 1 Swale intersects groundwater (except wet swale) - 1 No pretreatment to the swale or channel - 1 Swales conveys stormflows up to 10 year storm - 2 Does not provide full WQv volume - 2 Grass channel - 3 NET DESIGN SCORE (max of 5 points)

Appendix C: Deriving the Channel Protection Storage Volume


Appendix C: Deriving the Channel Protection Storage Volume
Appendix C: Deriving the Channel Protection Storage Volume Channel protection can help mitigate the impacts of development on streams by preventing an increased frequency of channel-forming events. The most commonly used channel protection method provides 24 hours of extended detention of the runoff generated by the 1-year, 24-hour storm. This method stores and gradually releases runoff so that critical erosive velocities in downstream channels are not exceeded. This appendix presents a technique that can be used to estimate the channel protection storage volume for an individual stormwater retrofit. I. Storage Volume Estimation The method used to estimate the channel protection volume was first proposed by Harrington (1987) and uses a modified version of the graphical peak discharge design procedure presented in Technical Reference 55 (TR-55) (NRCS, 1986). A seven-step method is presented to help designers compute several common hydrologic parameters needed to estimate the channel protection storage volume (Table C.1). Step 1: Compute the 1-Year, 24-Hour Runoff Volume The first step calculates the 1-year, 24-hour runoff volume using either the Curve Number (CN) Method presented in TR-55 or the Simple Method (Appendix B), although the two methods will yield different results. Previous studies have found that the CN Method tends to underestimate the volume
of runoff created by rainfall events of less than 2 inches (NYDEC, 2003) and that its accuracy may be limited when the runoff created by a storm is less than 0.5 inches (NRCS, 1986). The Simple Method also has its caveats (Appendix B). The designer may want to estimate the required channel protection volume using both methods and compare the results. Step 2: Determine the Time of Concentration for the Subwatershed The time of concentration (Tc) is the time that it takes for stormwater runoff to travel from the most hydraulically distant point in a subwatershed to the retrofit site. It is computed by delineating the stormwater flow path over pervious areas, open channels and storm drain pipes to get to the retrofit using standard velocity equations to compute the time it takes for stormwater runoff to travel the longest route. TR-55 presents more specific guidance on computing Tc. Step 3: Compute the Initial Abstraction and Initial Abstraction Ratio The initial abstraction (Ia) term represents all rainfall losses that occur before runoff begins. The losses include water retained in surface depressions, water intercepted by vegetation and water lost to evaporation and infiltration. Ia is highly variable but generally correlates with soil and land cover parameters and is directly related to the CN of the subwatershed (NRCS, 1986). If the CN Method was used to calculate the 1-year, 24-hour runoff volume (Step 1), the value of CN is already known and the value of Ia can
Urban Subwatershed Restoration Manual 3 C-1

Appendix C: Deriving the Channel Protection Storage Volume
be obtained from Table C.2 or can be calculated using the following equation: Ia = 200/CN – 2 Where: Ia = Initial abstraction (inches) CN = Subwatershed curve number (dimensionless) If the 1-year, 24-hour runoff volume was calculated using the Simple Method, the value of CN can be back calculated using the following relationship between the runoff volume, curve number and precipitation depth (NYDEC, 2003): CN = 1000/[10 + 5P + 10Q – 10(Q2 + 1.25QP)1/2] Where: P = Rainfall resulting from the 1-year, 24-hour storm event (inches) Q = Runoff volume resulting from the 1-year, 24-hour storm event (inches)
The value of Ia can then be obtained from Table C.2 or by using the equation provided above. Once Ia is computed, the initial abstraction ratio (Ia/P) can be computed simply by dividing the initial abstraction by the rainfall depth. This ratio represents the fraction of the rainfall that is retained in surface depressions, intercepted by vegetation or lost to evaporation and infiltration. Step 4: Compute the Uncontrolled Peak Discharge The next step computes the uncontrolled peak discharge from the subwatershed (NRCS, 1986). This requires the determination of the unit peak discharge factor (qu). This value can readily be determined using the values of Tc and Ia/P and knowledge of the rainfall distribution (Type I, IA, II, III) within the subwatershed (Figure C.1). With this information, the proper value of qu can be selected from Figure C.2, C.3, C.4, or C.5.
Table C.1: Process for Estimating Channel Protection Volume Step No. Task
1 Compute the 1-Year, 24-Hour Runoff Volume 2 Determine the Time of Concentration for the Subwatershed 3 Compute the Initial Abstraction and Initial Abstraction Ratio 4 Compute the Uncontrolled Peak Discharge (Inflow) 5 Find the Ratio of the Uncontrolled Peak Discharge to the Controlled Peak
Discharge 6 Calculate the Ratio of Storage Volume to Runoff Volume 7 Determine the Extended Detention Storage Volume
C-2 Urban Subwatershed Restoration Manual 3

Appendix C: Deriving the Channel Protection Storage Volume
Table C.2: The Relationship Between CN and IaSource: NRCS, 1986
Urban Subwatershed Restoration Manual 3 C-3

Appendix C: Deriving the Channel Protection Storage Volume
Figure C.1: NRCS Rainfall Distribution Boundaries
Source: NRCS, 1986
C-4 Urban Subwatershed Restoration Manual 3

Appendix C: Deriving the Channel Protection Storage Volume
Figure C.2: Unit Peak Discharge for NRCS (SCS) Type I Rainfall Distribution
Source: NRCS, 1986
Urban Subwatershed Restoration Manual 3 C-5

Appendix C: Deriving the Channel Protection Storage Volume
Figure C.3: Unit Peak Discharge for NRCS (SCS) Type IA Rainfall Distribution
Source: NRCS, 1986
C-6 Urban Subwatershed Restoration Manual 3

Appendix C: Deriving the Channel Protection Storage Volume
Figure C.4: Unit Peak Discharge for NRCS (SCS) Type II Rainfall Distribution
Source: NRCS, 1986
Urban Subwatershed Restoration Manual 3 C-7

Appendix C: Deriving the Channel Protection Storage Volume
Figure C.5: Unit Peak Discharge for NRCS (SCS) Type III Rainfall Distribution
Source: NRCS, 1986
If the computed initial abstraction ratio (Ia/P) is outside the range of values provided in Figures C.2 - C.5, then the appropriate boundary value should be used. Linear interpolation can be used to estimate the unit peak discharge when the value of Ia/P falls between the values provided in the figures (NRCS, 1986). Using the value of the unit peak discharge (qu), the uncontrolled peak discharge (qi) resulting from the 1-year, 24-hour storm event can be estimated using the following equation: qi = (qu)(A)(Q)
Where: qi = Uncontrolled peak discharge (cfs) qu = Unit peak discharge (csm/in) Q = Runoff volume resulting from the 1-year, 24-hour storm event (inches) A = Area of the subwatershed (sq. miles) Step 5: Find the Ratio of the Uncontrolled Peak Discharge to the Controlled Peak Discharge The next step involves determining the ratio of the uncontrolled peak discharge to the controlled peak discharge (qo/qi). Once the unit peak discharge (qu) and required extended detention time (T) (e.g. typically 24 hours) are known, Figure C.6 can be used to determine the value of qo/qi.
C-8 Urban Subwatershed Restoration Manual 3

Appendix C: Deriving the Channel Protection Storage Volume
Figure C.6: Calculating the Ratio of the Uncontrolled Peak Discharge to the Controlled Peak Discharge
Source: MSSC, 2005
If the retrofit discharges to a cold water trout stream, it may be wise to limit the extended detention time to a maximum of 12 hours to reduce the stream warming effect. Step 6: Calculate the Ratio of Storage Volume to Runoff Volume The next step calculates the ratio of storage volume to runoff volume (Vs/Vr). Using the value of qo/qi obtained from Figure C.6 and the appropriate rainfall distribution (Type I, IA, II, III), the value of Vs/Vr can be obtained from Figure C.7. The ratio of storage volume to runoff volume (Vs/Vr), can also be calculated
numerically for a Type II or Type III rainfall distribution: Vs/Vr = 0.683 – (1.43)(qo/qi) + (1.64)(qo/qi)2 – (0.804)(qo/qi)3
Where: Vs = Required storage volume (acre-feet) Vr = Runoff volume (acre-feet) qo = Controlled peak discharge/peak outflow discharge (cfs) qi = Uncontrolled peak discharge/peak inflow discharge (cfs) Step 7: Determine the Extended Detention Storage Volume
Urban Subwatershed Restoration Manual 3 C-9

Appendix C: Deriving the Channel Protection Storage Volume
The final step in the process is to determine the required extended detention storage volume. Using the value of Vs/Vr obtained from Figure C.7 (or the equation provided in Step 6), the required extended detention volume can be calculated using the following equation:
Vs = (Vs/Vr)(Vr) Where: Vs = Required storage volume (acre-feet) Vr = Runoff volume (acre-feet)
Figure C.7: Calculating the Ratio of Storage Volume to Runoff Volume
Source: NRCS, 1986
C-10 Urban Subwatershed Restoration Manual 3

Appendix C: Deriving the Channel Protection Storage Volume
II. Estimated Channel Protection Volumes for Select U.S. Cities Table C.3 provides an estimate of the channel protection volume needed for various levels of watershed impervious cover in select U.S. cities. A short-cut design rule is that the storage capacity
needed to provide channel protection is about 60% of the runoff volume generated by the 1-year, 24-hour storm. This rule was used to derive the estimates. Designers can quickly refer to this table to initially estimate the target channel protection storage volume needed at a retrofit site.
Table C.3: Estimated CPv for Select U.S. Cities (cubic feet/acre) Watershed Imperviousness (%)
10% 30% 60% 90%
City 1-Yr, 24-Hr
Rainfall (in.)
CPv (cf per acre)1
Atlanta, GA 3.6 1,098 2,509 4,626 6,743 Knoxville, TN 2.5 762 1,742 3,213 4,683 New York City, NY 2.7 823 1,882 3,470 5,057 Greensboro, NC 2.7 823 1,882 3,470 5,057 Boston, MA 2.6 793 1,812 3,341 4,870 Baltimore, MD 2.6 793 1,812 3,341 4,870 Buffalo, NY 2.0 610 1,394 2,570 3,746 Washington, DC 2.6 793 1,812 3,341 4,870 Columbus, OH 2.2 671 1,533 2,827 4,121 Kansas City, MO 3.2 976 2,230 4,112 5,994 Seattle, WA 1.6 488 1,115 2,056 2,997 Burlington, VT 1.7 518 1,185 2,185 3,184 Dallas, TX 3.2 976 2,230 4,112 5,994 Austin, TX 3.2 976 2,230 4,112 5,994 Minneapolis, MN 2.4 732 1,673 3,084 4,495 Coeur D’Alene, ID 1.1 335 767 1,414 2,060 Salt Lake City, UT 1.1 335 767 1,414 2,060 Denver, CO 1.4 427 976 1,799 2,622 Phoenix, AZ 1.1 335 767 1,414 2,060 Las Vegas, NV 0.8 244 558 1,028 1,498
Urban Subwatershed Restoration Manual 3 C-11

Appendix C: Deriving the Channel Protection Storage Volume
C-12 Urban Subwatershed Restoration Manual 3

Appendix D: Retrofit Pollutant Removal Rates


Appendix D: Retrofit Pollutant Removal Rates
Appendix D: Retrofit Pollutant Removal Rates I. Basic Approach This appendix documents how the pollutant removal rates for the stormwater treatment options presented in Chapter 3 were derived. The basic approach used to derive the pollutant removal rates was to update the National Pollutant Removal Performance Database (Winer, 2000) with new performance studies published in the last five years. The updated database was then statistically analyzed to derive new median and quartile values for each major group of stormwater treatment practices. The low end and high end are the 25th and 75th quartiles, respectively. Also, removal rates were rounded to the nearest 5 % for ease of use. Where data gaps remained, engineering judgment was used to derive pollutant removal rates as described in Section II. These removal rates are indicated by bold type in the ensuing tables and designers should regard them as a provisional estimate until additional pollutant removal performance data becomes available. The notes section of the tables can provide more information on these derived rates. II. Documentation of Pollutant Removal Rates Recurring data gaps existed for organic carbon, hydrocarbons, chlorides, trash/debris and, for some practices, bacteria. The particular assumptions to derive removal rates for these pollutants are summarized below. • Organic Carbon – Organic carbon is
used to describe all total organic carbon, BOD or COD removal data contained in
the original database (Winer, 2000). Very little new monitoring data was available, so the medians and quartiles were re-computed from the 2000 database.
• Hydrocarbons - Previous studies have
found that the ability of stormwater treatment practices to remove petroleum hydrocarbons is closely related to their ability to remove suspended solids (Winer, 2000). This is due to the fact that hydrocarbons quickly adsorb to sediment particles and organic matter suspended in stormwater runoff (Schueler and Shepp, 1993). Consequently, hydrocarbon removal was assumed to be generally comparable to total suspended solids removal.
• Chlorides - Because chloride is
extremely soluble, it is very difficult to remove from stormwater runoff. A review of 10 performance monitoring studies in cold climate regions failed to find any instance of positive removal rates for chlorides for any stormwater treatment practice. Indeed, many practices actually had negative removal rates. It was therefore assumed that chloride removal rates would be zero for all stormwater treatment options.
• Trash/Debris – No performance
monitoring data were available to define removal rates for trash and debris. It was assumed that the pollutant removal mechanisms for trash and debris are similar to those used to remove total suspended solids (e.g. gravitational settling, screening). One key difference is that some materials float on the
Urban Subwatershed Restoration Manual 3 D-1

Appendix D: Retrofit Pollutant Removal Rates
surface, although most would still be trapped in the stormwater practice unless there was a major overflow. It was therefore assumed that trash and debris
removal rates would be equal or slightly greater than the suspended solids removal rate for most stormwater practices.
Table D.1: Range of Reported Removal Rates for Dry Extended Detention Ponds Pollutant Low End Median High End
Total Suspended Solids 20 50 70 Total Phosphorus 15 20 25 Soluble Phosphorus -10 -5 10 Total Nitrogen 5 25 30 Organic Carbon 15 25 35 Total Zinc 0 30 60 Total Copper 20 30 40 Bacteria 25 35 50 Hydrocarbons 40 70 80 Chloride 0 0 0 Trash/Debris 65 80 85 Notes: Ten monitoring studies evaluated the performance of dry ED ponds for most parameters. Only two monitoring studies were available on bacteria removal rates for dry extended detention ponds, so engineering judgment was needed to establish the final removal rates. The primary mechanisms that facilitate bacteria removal are exposure to UV light and gravitational settling (Schueler, 1999). These removal mechanisms have been documented for wet ponds, which have been more extensively monitored for bacteria removal in wet ponds. Since stormwater runoff is not retained within dry ED ponds for as long as wet ponds, settling times and exposure to UV light are reduced. Dry ED ponds also have a greater risk of sediment resuspension than wet ponds, which can reintroduce previously removed bacteria back into the water column. It was therefore assumed that bacteria removal rates for dry ED ponds were approximately half of those measured for wet ponds.
Table D.2: Range of Reported Removal Rates for Wet Ponds
Pollutant Low End Median High End Total Suspended Solids 60 80 90 Total Phosphorus 40 50 75 Soluble Phosphorus 40 65 75 Total Nitrogen 15 30 40 Organic Carbon 25 45 65 Total Zinc 40 65 70 Total Copper 45 60 75 Bacteria 50 70 95 Hydrocarbons 60 80 90 Chloride 0 0 0 Trash/Debris 75 90 95 Note: 46 wet ponds have been monitored over the past two decades so the removal rate range shown above should be reasonably accurate. Hydrocarbon and trash/debris removal rates should be considered provisional
D-2 Urban Subwatershed Restoration Manual 3

Appendix D: Retrofit Pollutant Removal Rates
Table D.3: Range of Reported Removal Rates for Stormwater Wetlands
Pollutant Low End Median High End Total Suspended Solids 45 70 85 Total Phosphorus 15 50 75 Soluble Phosphorus 5 25 55 Total Nitrogen 0 25 55 Organic Carbon 0 20 45 Total Zinc 30 40 70 Total Copper 20 50 65 Bacteria 40 60 85 Hydrocarbons 50 75 90 Chloride 0 0 0 Trash/Debris 75 90 95 Notes: 40 monitoring studies were available to define rates for total suspended solids, total phosphorus, soluble phosphorus, total nitrogen, organic carbon, total zinc and total copper for constructed wetlands. Only three studies measured bacteria removal by constructed wetlands. Research profiled in Strecker et al. (2004) indicated bacterial removal rates for constructed wetlands is generally positive, but typically lower than wet ponds. It was therefore assumed that bacteria removal rates would be at least 10% lower than in wet ponds.
Table D.4: Range of Reported Removal Rates for Bioretention Areas Pollutant Low End Median High End
Total Suspended Solids 15 60 75 Total Phosphorus -75 5 30 Soluble Phosphorus -10 5 50 Total Nitrogen 40 45 55 Organic Carbon 40 55 70 Total Zinc 40 80 95 Total Copper 40 80 95 Bacteria 25 40 70 Hydrocarbons 80 90 95 Chloride 0 0 0 Trash/Debris 80 90 95 Notes: Ten new bioretention monitoring studies have been released in the last few years that meet the quality control criteria to be included in the updated database so it is now possible to define removal rates for total phosphorus, soluble phosphorus, total nitrogen, total zinc and total copper. Surprisingly, there were only four studies to define the total suspended solids removal rate. Similar pollutant removal mechanisms operate in both bioretention and filtering practices (sedimentation, filtration). The median total suspended solids removal rate for filtering practices is similar to the high end rate for bioretention, which suggests that bioretention rates can be expected to go up as more performance data becomes available. No bacteria removal rates were available in the literature as of 2006. Initial research reported by Hunt and his colleagues in 2007 suggest that bacteria removal rates were high. Therefore, it was once again assumed that bioretention would function in the same manner as filtering practices and have similar removal rates. The phosphorus removal rates reported for bioretention are clearly bi-modal. Sites where the soil media had high phosphorus content tended to leach phosphorus and experience negative removal rates. Sites where soils with a low P-index volume consistently performed at the upper end of the phosphorus removal range. Again, as more performance data become available and soil media testing becomes standard, the range of rates for bioretention is expected to shift.
Urban Subwatershed Restoration Manual 3 D-3

Appendix D: Retrofit Pollutant Removal Rates
Table D.5: Range of Reported Removal Rates for Stormwater Filters
Pollutant Low End Median High End Total Suspended Solids 80 85 90 Total Phosphorus 40 60 65 Soluble Phosphorus -10 5 65 Total Nitrogen 30 30 50 Organic Carbon 40 55 70 Total Zinc 70 90 90 Total Copper 35 40 70 Bacteria 25 40 70 Hydrocarbons 80 85 95 Chloride 0 0 0 Trash/Debris 85 90 95 Note: Nearly 20 studies have evaluated filtering practices, so reliable removal rates are reported for total suspended solids, total phosphorus, soluble phosphorus, total nitrogen, total zinc, total copper and bacteria. It should be noted that while total nitrogen removal is positive, most filters leak nitrate-nitrogen. Also, performance of vertical sand filters and the MCTT were excluded from the statistical analysis.
Table D.6: Range of Reported Removal Rates for Infiltration Practices Pollutant Low End Median High End
Total Suspended Solids 60 90 95 Total Phosphorus 50 65 95 Soluble Phosphorus 55 85 95 Total Nitrogen 0 40 65 Organic Carbon 80 90 95 Total Zinc 65 65 85 Total Copper 60 85 90 Bacteria 25 40 70 Hydrocarbons 60 90 95 Chloride 0 0 0 Trash/Debris 85 90 95 Notes: Performance monitoring data for infiltration practices continue to be limited although the number of studies had doubled since 2000 (N=12). Total phosphorus, total nitrogen and total zinc all meet the minimum five-study test to be included for statistical analysis. Only three studies were available to characterize total suspended solids, soluble phosphorus and total copper removal rates. Recent research tends to confirm the range in removal rates (UNHSC, 2005). No data was found for hydrocarbon, chloride and trash/debris removal, so these were estimated using the general removal assumptions described earlier. Bacteria removal rates were also lacking, so it was once again assumed that they would be similar to those reported for filtering practices.
D-4 Urban Subwatershed Restoration Manual 3

Appendix D: Retrofit Pollutant Removal Rates
Table D.7: Range of Reported Removal Rates for Swales Pollutant Low End Median High End
Total Suspended Solids 70 80 90 Total Phosphorus -15 25 45 Soluble Phosphorus -95 -40 25 Total Nitrogen 40 55 75 Organic Carbon 55 70 85 Total Zinc 60 70 80 Total Copper 45 65 80 Bacteria - 65 -25 25 Hydrocarbons 70 80 90 Chloride 0 0 0 Trash/Debris 0 0 50 Notes: 17 studies were available from the database to establish removal rates for total suspended solids, total phosphorus, soluble phosphorus, total nitrogen, total zinc and total copper. Only four studies were available for bacteria removal and all were negative. However, a positive 25% rate was established for the high end, since pollutant removal mechanisms in dry swales should have some capability to remove bacteria in the soil. Several studies monitored chloride and found only negative removal. No removal data was available for trash/debris, although it was presumed to be low due to washout of trash during high flows. A 50% removal rate was established for the high end for swale designs that contain treatment cells with actual trapping capability.
Urban Subwatershed Restoration Manual 3 D-5

Appendix D: Retrofit Pollutant Removal Rates
D-6 Urban Subwatershed Restoration Manual 3

Appendix E: Derivation of Unit Costs for Stormwater Retrofits and New
Stormwater Treatment Construction


Appendix E: Derivation of Unit Costs for Stormwater Retrofits and New Stormwater Treatment Construction I. Basic Approach, Findings and Caveats A. Basic Cost Approach The cost analysis involved a review of existing cost studies for new stormwater treatment options including studies by Wossink and Hunt (2003), Brown and Schueler (1997), Hathaway and Hunt (2006), WDNR (2003), LGPC (2003), Chicago DEP (2003), Liptan and Strecker (2003) and WSSI (2006). In addition, Hoyt (2007) performed an analysis of actual retrofit construction costs for nearly 100 projects around the country with the following sample size: new storage retrofits (N= 16), pond retrofits (N=31), on-site bioretention retrofits (N =18) and other retrofits (N = 29). The basic approach was as follows: • All construction costs were indexed and
updated to 2006 dollars using the Engineering News Record Construction Cost Index (RS Means, 2006)
• All studies that utilized cost equations were solved for common retrofit boundary conditions to create a cost range (e.g., drainage area and impervious cover). For example, the range in pond costs was bounded at the high end (10 acres CDA, 15% IC) and the low end (250 acres CDA and 65% IC)
• Retrofit costs were expressed on a common basis ($/cubic foot treated or $/impervious acre treated)
• Total costs were calculated as the base construction cost multiplied by the design/engineering (D&E) rate. Both factors differed between new BMP and retrofit construction
• While a median cost is given for each new stormwater practice or retrofit type, cots are best expressed as a range. In most cases, the range was defined as the 25 to 75% quartiles of the known costs.
• When multiple cost estimates differed for the same retrofit practice, original studies were analyzed for cost-specific factors to explain the difference in terms of design or labor factors that might develop more predictive cost categories.
• Some engineering judgment was needed to classify costs such as the differential costs between new stormwater and retrofit construction.
B. Findings • Retrofit costs are extremely variable
depending on site conditions and retrofit design complexity. In many cases, construction costs were an order of magnitude different for the same volume of stormwater treated (Table E.1).
• Retrofit base construction costs generally exceeded the cost of new stormwater practices by a factor of 1.5 to 6.
• Construction costs for storage retrofits are generally lower than on-site retrofits based on the cost per impervious acre treated. The most influential retrofit cost
Urban Subwatershed Restoration Manual 3 E-1

Appendix E: Derivation of Unit Costs for Stormwater Retrofits and New Stormwater Treatment Construction
factor is the total acreage of impervious cover treated by a retrofit. Unit costs decline as acreage treated increases. By contrast, smaller on-site retrofits that treat less than a ½ acre of impervious cover tend to be two orders of magnitude more expensive per treated area than storage retrofit practices.
• Design and engineering (D&E) costs for storage retrofits exceed those for new stormwater practices when their much higher base retrofit construction costs are factored in.
• The D&E estimate for pond construction derived by Brown and Schueler (1997) of 32% was used to define costs for project management, design, permitting,
landscaping and erosion and sediment control
• A 32% D&E rate also applies to on-site retrofits, based on Hoyt’s 2007 review of the D&E costs for 17 projects.
• The components of D&E costs differ between storage retrofits (where permitting, and engineering studies dominate) than on-site retrofits (where design and project management dominates).
• A 40% D&E rate should be used for any retrofit requiring major environmental permits.
• The D&E rate differs based on retrofit location. For example, a 5% value was assigned for little retrofits, rain barrels and small rain gardens
Table E.1: Retrofit Construction Costs
2006 $ to Treat an Impervious Acre Retrofit Type Low End 1 Median High End
Pond Retrofit $ 3,600 $ 11,100 $ 37,100 New Storage Retrofit $ 9,000 $ 19,400 $ 32,200 Urban On-site Retrofit 2 $ 58,000 $ 88,000 $ 150,000 1 Low end is the 25% quartile value, high end is the 75th quartile value 2 Mean contributing drainage area to practice = 0.58 acres
Table E.2: Base Construction Costs for New Stormwater Practices BMPs 2006 $ per impervious acre treated
Stormwater Practice Low End Median High End Source: Constructed Wetlands 1 $ 2,000 $ 2,900 $ 9,600 Cost Equation Extended Detention 1 2,200 3,800 7,500 Cost Equation Wet Ponds 1 3,100 8,350 28,750 Cost Equation Water Quality Swales 2 10,900 18,150 36,300 Derived Bioretention 19,900 25,400 41,750 Cost Equation Infiltration 3 19,900 25,400 41,750 Derived Residential Rooftop 10,900 27,200 49,000 Derived Filtering Practices 18,150 58,100 79.900 Cost Equation Non-Residential Roof 21,800 90,750 1,100,000 Derived 1 based on typical range of CDA and IC noted in the basic approach section 2 Derived from a cost per square foot 3 Assumed to be comparable to bioretention costs Please check documentation notes for all practices later in Part II of this Appendix
E-2 Urban Subwatershed Restoration Manual 3

Appendix E: Derivation of Unit Costs for Stormwater Retrofits and New Stormwater Treatment Construction
Base retrofit costs can be compared to the costs for constructing new stormwater practices shown in Table E.2. The cost ranges shown for new stormwater practices should not be used to estimate retrofit costs unless the designer is confident that all the site conditions outlined in Table E.3 can be
met. Few proposed retrofit sites will meet these conditions. Table E.4 compares the range in unit treatment costs for a large number of retrofit techniques while Chapter 2 offers more detailed cost data for each retrofit location in a subwatershed.
Table E.3: Guidance on when new STO cost equations can be used
• Abundant surface land is present on the site to provide flexibility in retrofit layout and design
• Site has adequate head and has no major utilities to work around • Site topography is such that a neutral earthwork balance can be achieved (i.e., no off-
site hauling) • No flow splitters, riser modifications or other special plumbing is needed to make the
site work • No significant environmental permits are required • No major landscaping or planting plan is needed in the design
Table E.4 Range of Retrofit Costs (2006 $ per cubic foot of runoff treated)
Retrofit Technique Median Cost Range Pond Retrofits $ 3.00 $ 1.00 to 10.00 Rain Gardens $ 4.00 $ 3.00 to 5.00 New Storage Retrofits $ 5.00 $ 2.50 to 9.00 Larger Bioretention Retrofits $ 10.50 $ 7.50 to 17.25
Water Quality Swale Retrofit $ 12.50 $ 7.00 to 22.00
Cisterns $ 15.00 $ 6.00 to 25.00 French Drain/Dry Well $ 12.00 $ 10.50 to 13.50 Infiltration Retrofits $ 15.00 $ 10.00 to 23.00 Rain Barrels $ 25.00 $ 12.50 to 40.00 Structural Sand Filter $ 20.00 $ 16.00 to 22.00 Impervious Cover Conversion $ 20.00 $ 18.50 to 21.50
Stormwater Planter $ 27.00 $ 18.00 to 36.00 Small Bioretention Retrofits $ 30.00 $ 25.00 to 40.00
Underground Sand Filter $ 65.00 $ 28.00 to 75.00 Stormwater Tree Pits $ 70.00 $ 58.00 to 83.00 Permeable Pavers $ 120.00 $ 96.00 to 144.00 Extensive Green Rooftops $ 225.00 $ 144.00 to 300.00 Intensive Green Rooftops $ 360.00 $ 300.00 to 420.00 Note: Costs shown are base construction costs and do not include additional D&E costs, which can range from 5 to 40%
Urban Subwatershed Restoration Manual 3 E-3
Appendix E: Derivation of Unit Costs for Stormwater Retrofits and New Stormwater Treatment Construction
C. Caveats The cost analysis described herein is subject to a number of important caveats that should be fully understood before using it to estimate retrofit project costs. • Construction costs vary regionally based
on labor rates, construction materials and design standards. The new construction cost data were largely drawn from North Carolina and Maryland studies, while retrofit cost data were derived from a larger national cross-section of projects (VA, NY, DE, CA, TX, OR, MD, OR, VA).
• Most on-site retrofits included in the
national cost database were experimental designs or demonstration projects that had high initial construction costs. It is expected that unit retrofit costs will stay the same or even decline in future years as designers gain more experience and utilize more cost-effective and standardized construction techniques for these practices.
• All construction costs shown here
exclude land acquisition costs. If land must be acquired, retrofit costs increase sharply, and some costly retrofit options, such as underground treatment, become more cost-effective.
• Construction costs do not include the
costs needed to find the retrofit site (i.e., costs to perform a retrofit inventory, develop a concept design, assess project feasibility or rank priority projects in a subwatershed plan).
• Limited data were available to derive
costs for several stormwater treatment options including infiltration and water quality swales, and some on-site retrofit
techniques (e.g., expanded tree pits). These estimates should be viewed with caution until more actual retrofit cost data is generated.
• The base construction cost does not
include costs for retrofit design and engineering (D&E) that is estimated by multiplying base construction cost of storage retrofits by a fixed percentage ranging from 5 to 40%. For on-site retrofits, the D&E factor ranges from 5 to 32%.
• Retrofit costs can be extremely variable,
and actual costs for individual retrofit projects can significantly exceed the range shown, depending on site conditions. Designers should carefully evaluate the retrofit construction inflators/deflators shown in Chapter 2 and adjust their cost estimates accordingly.
• The construction cost for several on-site
retrofits such as permeable pavers and green rooftops do not reflect the incremental cost difference of the surface they substitute or replace (e.g., regular asphalt vs. permeable pavers; conventional rooftop vs. green rooftop). If the surface needs replacing, actual retrofit costs should be expressed as the incremental cost difference from the conventional surface and the new retrofit.
• Reported costs for several on-site
retrofits such as bioretention, rain gardens, and rain barrels vary greatly depending on whether it is assumed they will be designed and installed by volunteers or by paid contractors. Even when on-site retrofits are installed by volunteers, localities may still need to
E-4 Urban Subwatershed Restoration Manual 3

Appendix E: Derivation of Unit Costs for Stormwater Retrofits and New Stormwater Treatment Construction
incur a retrofit delivery cost to make them happen.
• The water quality sizing assumption for
this retrofit cost analysis was treatment of one inch of runoff per impervious acre acre (or 3630 cubic feet of storage per impervious acre). If local water quality sizing target criteria depart from this assumption, the cost data should be adjusted accordingly.
II. Documentation of Unit Cost Data This section outlines the assumptions and methods used to derive unit costs for new stormwater practices and retrofit practices.
A. ED Ponds New Construction: The Brown and Schueler (1997) ED pond cost equation was updated to 2006 dollars using the ENR Construction Cost Index, which yielded the following equation: CC = (11.54)(Vs
0.780) Where Vs = storage volume in cubic feet The equation was then solved for a common set of retrofit boundary conditions to create a range of expected construction costs: Low end: 250 acre contributing drainage area (CDA) and 65% impervious cover (IC) Average: 50 acre CDA and 35% IC High end: 10 acre CDA and 15% IC
The base construction costs for each boundary condition were then converted into costs per impervious acre treated. Retrofit Construction: The new storage retrofit database compiled by Hoyt (2007)
contained numerous retrofits that used ED in combination with other stormwater practices to achieve full retrofit treatment. When these results are compared to the costs for new ED pond construction, it is evident that retrofits are about five times more expensive (median: $19,440 per impervious acre treated vs. $3,800). The median retrofit cost for new storage retrofits in Table E.1 should be used if the proposed ED retrofit is combined with wetland and/or wet pond treatment. The lower end cost of $ 9,000 is more appropriate for standalone ED retrofits. The new ED pond cost equation can be used if the retrofit satisfies the construction conditions outlined in Table E.3. B. Wet Pond New Construction: The same basic methods were used to update the three new wet pond construction costs from Brown and Schueler (1997) and Wossink and Hunt (2003). The updated 2006 equations are as follows: Wet extended detention ponds CC = (12.02)(Vs
0.750) Wet ponds CC = (277.89)(Vs
0.553) Wet ponds: CC = (17,333)(A0.672) where A = contributing drainage area (acres) and only applies to CDA from 1 to 67 acres The three equations were solved for the same retrofit boundary conditions established for ED ponds to define a low, middle and high-end range for expected construction costs. The results from all three equations were averaged, although the low end of the W&H equation was omitted because it was outside of the data range of its sample ponds. Unit construction costs for
Urban Subwatershed Restoration Manual 3 E-5

Appendix E: Derivation of Unit Costs for Stormwater Retrofits and New Stormwater Treatment Construction
each boundary condition were then converted into cost per impervious acre treated. Retrofit Construction: The new storage retrofit database compiled by Hoyt (2007) contained numerous retrofits that relied on wet ponds for water quality treatment. When these costs are compared to the costs for new wet pond construction, it is evident that retrofits are about 2.3 times more expensive than new stormwater wetland construction (median: $19,440 vs. $8,350). This difference is reasonable given the more complicated construction conditions expected at wet pond retrofit sites. The median retrofit cost shown in Table E.1 is recommended for planning purposes, subject to the construction cost inflators/deflators outlined in Chapter 2. In rare cases, the new wet pond cost equations can be used if the retrofit site satisfies the new development construction conditions outlined in Table E.3. C. Constructed Wetlands New Construction: The same basic methods were used to update the two wetland construction costs derived by Brown and Schueler (1997) and Wossink and Hunt (2003) into 2006 dollars. The adjusted equations are as follows: All ponds and wetlands
CC = (29.43)(Vs0.701)
Stormwater wetlands CC = (4,800)(A0.484) Note: Equation applies to 4 – 200 acre CDA
The equations were solved for the previously stated retrofit boundary conditions to create a range of expected construction costs, although the cost estimates generated between the two
equations were not always in close agreement. For example, the low-end wetland cost estimate predicted by the Wossink and Hunt equation was omitted from the analysis because it is outside of the range of their wetland sample population. Some engineering judgment was needed to reconcile the low-end, middle and high-end unit costs for constructed wetlands. Retrofit Construction: The new storage retrofit database compiled by Hoyt (2007) contained numerous retrofits that combined constructed wetlands with ED and/or wet ponds to achieve treatment. When these results are compared to the costs for new constructed wetland construction, retrofits appear to be nearly 7 times more expensive (median: $19,440 vs. $2,900). At first glance, this discrepancy is difficult to explain, but involves the inherent difference between new and retrofit construction of stormwater wetlands. The cost for new constructed wetlands is comparatively low since their shallow design requires much less excavation (which is normally the greatest component of base construction cost). Designers essentially rely on a greater site footprint to save excavation costs, which is seldom available in a retrofitting situation. Very few retrofits in the Hoyt (2007) database were solely constructed wetlands; most devoted considerable storage to extended detention and wet pond treatment in order to squeeze the wetland into a tight retrofit site. Consequently, the median new storage retrofit unit cost in Table E.1 is reasonable to use if constructed wetlands are designed with ED or wet ponds cells. Designers may wish to adjust this cost higher or lower depending of the site-specific construction cost inflators/deflators outlined in Chapter 2. If it is an ideal site, and corresponds to the new development construction conditions
E-6 Urban Subwatershed Restoration Manual 3

Appendix E: Derivation of Unit Costs for Stormwater Retrofits and New Stormwater Treatment Construction
outlined in Table E.3, the most appropriate new constructed wetland cost equation can be used as an alternate. D. Bioretention New Construction: Several equations were updated to estimate new bioretention costs on projects greater than one acre in contributing drainage area (Brown and Schueler, 1997 and Wossink and Hunt 2003). Adjusted to 2006 dollars, the two equations are:
CC = (8.02)(WQv
0.990) CC = (12,664)(A1.088) (clay soils) These equations apply to more engineered bioretention areas and typically include underdrains, soil media and some type of pretreatment cell. The Wossink and Hunt equation for bioretention in sandy soils (where underdrains are not needed and less soil amendment is required) were not used, since this is not a common condition for retrofits on disturbed urban soils. The equations were solved for several hypothetical retrofit situations to establish expected boundary conditions as follows: 1.0 acre CDA and 100% IC 1.5 acre CDA and 65% IC 3.0 acre CDA and 35% IC This approach helped define a low-end, middle and high-end unit costs for bioretention. Some engineering judgment was needed since the two equations were not always in agreement. For example, the low-end prediction from the Wossink and Hunt equation appeared unrealistically low and the middle value of ($5.50/cubic foot) was used to tie down the low end unit cost for new bioretention construction instead. The resulting cost estimates were then compared against the unit costs for rain gardens
reported by Hathaway and Hunt (2006) and were found to be in general agreement. Retrofit Construction: The cost of bioretention retrofits varies greatly depending on the contributing drainage area, design objective, installer and site conditions at the proposed retrofit site. Therefore, a four-tiered approach was used to define retrofit costs: 1. Small highly urban retrofits: The Hoyt
(2007) database contained numerous bioretention retrofits built on highly urban uses with less than a half acre of CDA. The median cost for these bioretention retrofits was 3.5 times greater than the cost for a new bioretention area ($88,000 vs. $25,500 per impervious acre treated). The higher cost is due to need for demolition, extensive landscaping, full media replacement, underdrains and new connections to existing storm drain system. In addition, these retrofits are all professionally installed. Consequently, an average cost range of $25 to $40 per cubic foot treated is recommended for bioretention retrofits with less than 0.5 acre CDA. The higher end of the range applies when bioretention retrofits are designed as a landscape feature (i.e., special stone, intensive plant materials and special grading/berms).
2. Rain gardens: Numerous researchers have reported a much lower unit cost ($3 to $5 per cubic foot) to construct rain gardens (Hathaway and Hunt, 2006, WDNR (2003) and WSSI (2006). The term “rain gardens” is used here to define shallow bioretention areas in relatively permeable soils that lack underdrains and are installed with volunteer labor. This situation may occur
Urban Subwatershed Restoration Manual 3 E-7

Appendix E: Derivation of Unit Costs for Stormwater Retrofits and New Stormwater Treatment Construction
for homeowner installation of rain gardens and some demonstration retrofits.
3. Typical bioretention retrofits: Most
bioretention retrofits fall between these two extremes, but are still likely to exceed the costs for new bioretention areas. Bioretention retrofits typically require more pretreatment, re-grading, new inlets and intensive landscaping than their new development counterparts. Not much data, however, were available to define this cost difference. Based on engineering judgment, a multiplier of 1.5 was applied to the new bioretention unit cost data to reflect the expected costs for typical bioretention retrofits ($10.50 per cubic foot treated, range of $7.50 to $17.75). Designers should adjust the project estimate to reflect the site-specific construction cost inflators/deflators described in Chapter 3.
4. Ideal bioretention retrofits. Some
proposed sites are a natural for bioretention retrofit (e.g., abundant treatment area located in a depression, use of simple curb cuts to direct runoff into the retrofit, sandy soils, a simple planting plan etc.). Retrofit sites that satisfy the new development site conditions in Table E.3 may use unit costs for new bioretention construction (median $7.00 range of $5.50 to 10.50 per cubic foot treated)
E. Filtering Practices New Construction: The costs for new stormwater filters depend on the complexity of their design, so a tiered cost estimation approach was followed. Sand filters were classified into three categories, as follows:
1. Surface sand filter (no concrete poured
and no major structural elements) 2. Structural sand filter (perimeter or
surface filter w/ two cells with major concrete/structural elements or special media)
3. Underground sand filter (deep excavation, concrete vault construction and special treatment media)
The Brown and Schueler (1997) cost equation was updated to 2006 dollars to define costs for surface sand filters, whereas the Wossink and Hunt (2003) equation was relied on to define costs for structural sand filters:
CC = (59,678)(A0.882) Note: Applies to CDA of 0.5 to 9 acres The cost equations were solved the equation for typical retrofit boundary conditions, as follows: 1.0 acre CDA and 100% IC 1.5 acre CDA and 65% IC 3.0 acre CDA and 35% IC Based on these boundary conditions, expected low-end, middle and high-end values were determined for surface and structural sand filters. Some engineering judgment was used to adjust the high end predictions of the Wossink and Hunt equation downward, based on cross-checking with earlier cost estimates reported by Schueler (2000a). Two sources were used to derive unit construction costs for underground sand filters (Schueler, 2000a) and Hoyt’s 2007 review of nine underground and multi-chamber treatment train retrofit projects. The costs were quite variable, but a
E-8 Urban Subwatershed Restoration Manual 3

Appendix E: Derivation of Unit Costs for Stormwater Retrofits and New Stormwater Treatment Construction
projected cost range of $28 to $75 covered most of the projects.Retrofit Construction – Given limited cost data and the similarity between new and retrofit filter costs, the three tier approach for estimating filtering practice costs was not adjusted to account for retrofitting. It was also reasoned was that most sand filters for new development are built at tight and constrained sites that are comparable to most retrofit situations. F. Infiltration Practices New Construction - No new construction cost data was discovered in the literature to estimate the unit costs to construct new infiltration practices. Given the inherent similarity in the construction process between bioretention and infiltration, it was therefore assumed that infiltration construction costs would be equivalent for new bioretention areas (see Table E.2).
Retrofit Construction – Very little infiltration retrofit cost data has been reported, presumably because of poor urban soil conditions have limited their use. It was assumed that infiltration retrofit costs would be twice that of new bioretention areas to account for expanded soil testing, pretreatment cells, erosion and sediment control and landscaping. H. Water Quality Swales New Construction – Several assumptions and methods were needed to derive unit construction costs for new water quality swales, which are frequently reported on a linear foot (Claytor, 2003) or a square foot basis (Hathaway and Hunt (2006). Most estimates are for grass swales that use checkdams to get surface storage. No data were available for dry swales which are similar in construction to bioretention areas
(e.g., underdrains and full media replacement). It was assumed that this class of water quality swales would be equivalent to the high end of new bioretention areas reported in Table E.2 The unit costs for water quality swales reported by Claytor (2003) were updated to 2006 dollars, and were converted to a per cubic foot basis using the following common retrofit channel conditions: • 4 foot bottom width, 6 inch average
ponding depth, 3:1 side slopes ($8.20/cubic foot )
• 8 foot bottom width, 6 inch average ponding depth, 3:1 side slopes ($4.75/cubic foot)
• 12 foot bottom width, 6 inch average ponding depth, 3:1 side slopes ($3.50/cubic foot)
Consequently, the low end for new water quality swale costs was established using the Claytor approach, and the high end using “running” bioretention.
Retrofit Construction- Swale retrofit costs were assumed to be twice that of new water quality swale construction due to the need for greater re-grading, creation of multiple cells, vegetation establishment, soil amendments, and work within tight easements. I. Other On-Site Retrofit Techniques The last group of retrofit cost data is the data for individual on-site practices. Cost data for these practices were derived from recent cost studies. Cost data were generally converted to a per cubic foot basis using unit conversions and assumptions about typical treatment areas. The particular methods used to derive the cost data for each of the
Urban Subwatershed Restoration Manual 3 E-9
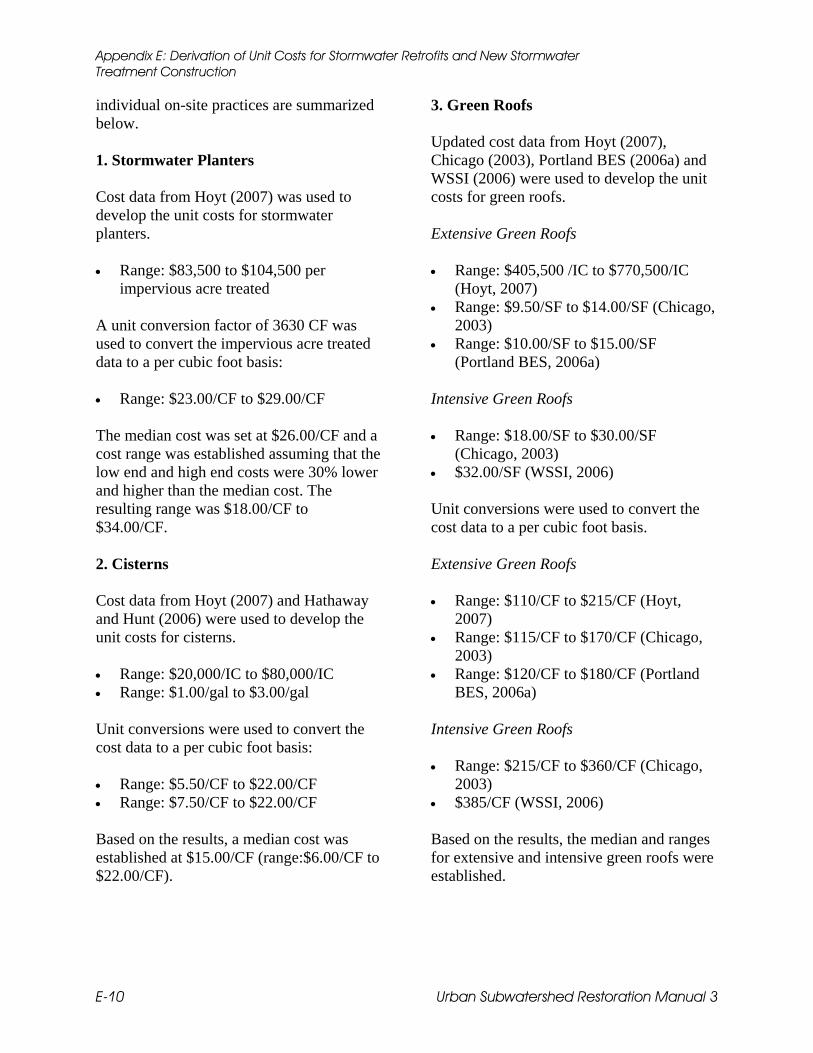
Appendix E: Derivation of Unit Costs for Stormwater Retrofits and New Stormwater Treatment Construction
individual on-site practices are summarized below. 1. Stormwater Planters Cost data from Hoyt (2007) was used to develop the unit costs for stormwater planters.
• Range: $83,500 to $104,500 per
impervious acre treated A unit conversion factor of 3630 CF was used to convert the impervious acre treated data to a per cubic foot basis:
• Range: $23.00/CF to $29.00/CF The median cost was set at $26.00/CF and a cost range was established assuming that the low end and high end costs were 30% lower and higher than the median cost. The resulting range was $18.00/CF to $34.00/CF. 2. Cisterns Cost data from Hoyt (2007) and Hathaway and Hunt (2006) were used to develop the unit costs for cisterns.
• Range: $20,000/IC to $80,000/IC • Range: $1.00/gal to $3.00/gal Unit conversions were used to convert the cost data to a per cubic foot basis:
• Range: $5.50/CF to $22.00/CF • Range: $7.50/CF to $22.00/CF Based on the results, a median cost was established at $15.00/CF (range:$6.00/CF to $22.00/CF).
3. Green Roofs Updated cost data from Hoyt (2007), Chicago (2003), Portland BES (2006a) and WSSI (2006) were used to develop the unit costs for green roofs. Extensive Green Roofs • Range: $405,500 /IC to $770,500/IC
(Hoyt, 2007) • Range: $9.50/SF to $14.00/SF (Chicago,
2003) • Range: $10.00/SF to $15.00/SF
(Portland BES, 2006a) Intensive Green Roofs • Range: $18.00/SF to $30.00/SF
(Chicago, 2003) • $32.00/SF (WSSI, 2006) Unit conversions were used to convert the cost data to a per cubic foot basis. Extensive Green Roofs
• Range: $110/CF to $215/CF (Hoyt,
2007) • Range: $115/CF to $170/CF (Chicago,
2003) • Range: $120/CF to $180/CF (Portland
BES, 2006a)
Intensive Green Roofs
• Range: $215/CF to $360/CF (Chicago, 2003)
• $385/CF (WSSI, 2006) Based on the results, the median and ranges for extensive and intensive green roofs were established.
E-10 Urban Subwatershed Restoration Manual 3

Appendix E: Derivation of Unit Costs for Stormwater Retrofits and New Stormwater Treatment Construction
Extensive Green Roofs • Range: $110/CF to $225/CF • Median: $170/CF Intensive Green Roofs • Range: $225/CF to $400/CF • Median: $310/CF 4. Permeable Pavers Hathaway and Hunt (2006) re ported a $10/SF unit cost for permeable pavers. Unit conversions, based on treating one inch of runoff from one impervious acre (e.g. 3,630 CF), were used to convert the cost data to a per cubic foot basis. • $120/CF The range of costs was established by assuming that the low end and high end costs are 30% lower and higher, respectively, than the median cost. The resulting cost range was $80/CF to $160/CF. 5. Rain Barrels Cost data from Hathaway and Hunt (2006) and Portland BES (2006b) were used to develop the unit costs for rain barrels.
• Range: $50 to $300 per 55 gallon rain
barrel (Portland BES, 2006b) • $320 per 55 gallon rain barrel
(Hathaway & Hunt, 2006) Unit conversions were used to convert the cost data to a per cubic foot basis.
• Range: $7.50/CF to $41.00/CF (Portland
BES, 2006b) • $43.50/CF (Hathaway & Hunt, 2006)
Based on the results, the median and range were set at $25.00/CF and $7.50/CF to $40.00/CF, respectively. 6. Rain Gardens Cost data from Hathaway and Hunt (2006) and WDNR (2003) were used to develop the unit costs for rain gardens.
• Range: $3.00/SF to $5.00/SF (Hathaway
& Hunt, 2006) • Range (homeowner installation):
$3.00/SF to $5.00/SF (WDNR, 2003) • Range (professional installation):
$12.00/SF to $15.00/SF (WDNR, 2003)
The costs were converted to a cubic foot basis assuming the runoff from one inch of rainfall from one impervious acre (3,630 CF) and assuming a 12 inch ponding depth within the rain gardens.
Based on the results, three categories of rain garden installation were defined. These included volunteer installation, professional installation with standard landscaping and professional installation with deluxe landscaping: Volunteer Installation It was assumed that the cost data presented by Hathaway and Hunt (2006) represented the construction cost for rain gardens installed by volunteers. Therefore, the median and range were set at $4.00/CF and $3.00/CF to $5.00/CF, respectively, for rain gardens installed by volunteers. Professional Installation with Standard Landscaping We assumed that the construction cost for professionally installed rain gardens with standard landscaping was somewhere between the other two types of installations (e.g. volunteer installation and professional
Urban Subwatershed Restoration Manual 3 E-11

Appendix E: Derivation of Unit Costs for Stormwater Retrofits and New Stormwater Treatment Construction
installation with deluxe landscaping). The median and range were set at $7.50/CF and $5.00/CF to $10.00/CF, respectively. This cost data matches well with the cost data presented for the “ideal bioretention retrofit” scenario. The two applications are very similar (e.g. professional installation, practice located in depressional area, simple conveyance to practice, sandy soils with no need for underdrain, simple planting plan), so the construction cost of the two practices should be similar. Professional Installation with Deluxe Landscaping It was assumed that the cost data presented by WDNR (2003) represented the construction cost for professionally installed rain gardens with deluxe landscaping (e.g. decorative stone, intensive landscaping). Therefore, the median and range were set at $12.50/CF and $10.00/CF to $15.00/CF, respectively. 7. French Drains/Dry Wells Cost data from LGPC (2003) was used to develop the unit costs for french drains and dry wells.
• Range: $15/LF to $17/LF In order to convert the cost data to a per cubic foot basis, the length of a french drain needed to treat one inch of runoff from one impervious acre was calculated. It was assumed that the french drain would be 2 feet deep and 2 feet wide (e.g. the dimensions of a typical french drain) and that the gravel used to fill the french drain would have a void ratio of 0.35. Based on these assumptions, 2,595 linear feet of french drain would be needed to treat 1 acre
of impervious cover (e.g. [43,560 SF ∗ 1 IN] ÷ [12 IN/FT ∗ 2 FT * 0.35] ÷ 2 FT = 2,595 FT). • Range: $10.50/CF to $12.50/CF Based on the results, the range was set at $10.50/CF to $12.50/CF. The average unit cost (e.g. $11.50/CF) was set as the median. 8. Impervious Cover Conversion Cost data from RS Means (2006) were used to develop the unit costs for impervious cover conversion. • Asphalt Removal: $40,000/AC • Concrete Removal: $55,000/AC • Site Restoration: $26,150/AC Site restoration includes soil preparation, fine grading, seeding and erosion control (Table 1). A unit conversion, based on treating one inch of runoff from one impervious acre (e.g. 3,630 CF), was used to convert the cost data to a per cubic foot basis.
• Asphalt Removal: $11.00/CF • Concrete Removal: $15.00/CF • Site Restoration: $7.00/CF
The range was established by assuming that the costs for asphalt and concrete removal represent the low end and high end costs, respectively, for impervious cover removal. The range was therefore set at $18.00/CF to $22.00/CF. The average unit cost (e.g. $20.00/CF) was set as the median cost.
E-12 Urban Subwatershed Restoration Manual 3

Appendix E: Derivation of Unit Costs for Stormwater Retrofits and New Stormwater Treatment Construction
Table 1: Site Restoration for Impervious Cover Conversion
Description Unit Cost Unit Soil preparation (till topsoil) $0.05 SF Fine grading $0.25 SF Seeding (prairie/meadow mix) $0.05 SF
Erosion control blanket $0.25 SF Total cost $0.60 SF Source: RS Means, 2006
9. Filter Strips Cost data from RS Means (2006) were used to develop the unit costs for filter strips.
• Site Restoration: $0.70/SF • Level Spreader: $4.00/LF
Site restoration includes brush clearing and removal, soil preparation, fine grading, seeding and erosion control (Table 2). A unit conversion based on treating one inch of runoff from one impervious acre (e.g. 3,630 CF) was used to convert the square foot filter strip cost data to a per cubic foot basis. To convert the unit cost for the level spreader, it was assumed that the overland flow path in the filter strip’s contributing drainage area would be 75 feet long (the use of a longer overland flow path would not ensure that sheet flow is provided to the filter strip). Based on this assumption, 580 linear feet of filter strip and level spreader would be needed to treat 1 acre of impervious surface (e.g. 43,560 SF ÷ 75 FT = 580 FT).
• Level Spreader: $2,320/IC • Level Spreader: $0.60/CF
To convert the unit cost for site restoration, it was assumed that the minimum filter strip width would be 25 feet and the maximum
filter strip width would be 75 feet. Based on these assumptions, a minimum of 14,500 square feet and a maximum of 43,500 square feet would be need to treat 1 acre of impervious cover (e.g. 580 FT ∗ 25 FT = 14,500 SF and 580 FT ∗ 75 FT = 43,500 SF) • Site Restoration: $10,000/IC to
$30,500/IC • Site Restoration: $3.00/CF to $8.50/CF Based on the results, the range was set at $3.50/CF to $8.50/CF. The average unit cost ($6.00/CF) was set as the median. 10. Soil Compost Amendment Cost data provided by Schueler (2000b), updated to 2006 dollars, was used to develop the unit costs for soil compost amendments. • Range: $0.27/SF to $0.98/SF Unit conversions were used to convert the cost data to a per cubic foot basis.
• Range: $3.20/CF to $11.80/SF Based on the results, the median and range were set at $7.50/CF and $3.20/CF to $11.80/CF, respectively. 11. Street Bioretention Areas The cost data compiled by Hoyt (2007) includes data from a number of small bioretention retrofits built in highly urbanized areas with less than 0.5 acres of contributing drainage area. The construction of these retrofits requires professional installation and demolition, soil replacement, underdrains, connections to the existing storm drain system and extensive landscaping.
Urban Subwatershed Restoration Manual 3 E-13

Appendix E: Derivation of Unit Costs for Stormwater Retrofits and New Stormwater Treatment Construction
The construction of street bioretention areas requires equally careful construction. Therefore, the construction cost of street bioretention areas was assumed to be the same as that of small, highly urban bioretention retrofits. The median and range were set at $30.00/CF and $25.00/CF to $40.00/CF, respectively. The higher end of the range should be used when the bioretention area is designed as a landscape feature (e.g., decorative stone, intensive landscaping)
Table E.2: Site Restoration for Filter Strips Description Unit Cost Unit
Site preparation (brush clearing and removal) $0.10 SF Soil preparation (till topsoil) $0.05 SF Fine grading $0.25 SF Seeding (prairie/meadow mix) $0.05 SF Erosion control blanket $0.25 SF Total cost $0.70 SF Level spreader (based on 1 CF stone/LF) $4.00 LF Source: RS Means, 2006
E-14 Urban Subwatershed Restoration Manual 3

Appendix F: Rooftop Retrofit Design Sheets


Appendix F: Rooftop Retrofit Design Sheets
Rooftop Retrofit Design Sheets
RR-1 STORMWATER PLANTERS
Stormwater or foundation planters are an on-site retrofit practice that can treat rooftop runoff. They consist of confined planters that store and/or infiltrate runoff through a soil bed to reduce runoff volumes and pollutant loads (Figure 1). Two major design variations exist based on the condition of the underlying soil. The infiltration planter is designed to allow runoff to first filter through the planter soil and then infiltrate down through native soils. The filter or flow-through planter box has compacted bottom soils or an impervious liner that prevents infiltration. When it overflows, water surcharges from the bottom of the planter after it filters through the soil through a perforated underdrain and discharges to the storm drain system. Both planter designs are sized to temporarily store runoff in a reservoir above the planter soil. Stormwater planters combine an aesthetic landscaping feature with a functional form of stormwater treatment. Stormwater planters generally receive runoff from adjacent rooftop downspouts. As runoff passes through the planter, pollutants are captured on soils. Stormwater planters are landscaped with plants that are tolerant to both periods of drought and inundation. Stormwater planters are useful in treating rooftop runoff in highly urban areas, such as a central business district. They can also be used to establish a pervious area within the hardscape of a plaza, courtyard, riverfront, or streetscape. While they treat a very small drainage area, they can be incorporated into municipal or corporate demonstration projects. Since each planter treats runoff from a few hundred to a few thousand square feet of
contributing rooftop (plus the additional area of the planter bed itself), it takes quite a few planters to provide meaningful stormwater treatment in a subwatershed. On the other hand, planters are one of the few on-site or storage retrofit options available to treat ultra-urban sites. The two primary factors to assess when considering stormwater planter retrofits are the contributing roof area to each roof leader, and how and where the excess runoff will be discharged from the planter. A planter designed to encourage infiltration should have adequate waterproofing and dewatering components to prevent foundation seepage. Design Two basic design variations for stormwater planters are the infiltration planter and the filter planter. An infiltration planter filters rooftop runoff through planter soils followed by infiltration
Figure 1: Portland Stormwater Planter
Urban Subwatershed Restoration Manual 3 F-1

Appendix F: Rooftop Retrofit Design Sheets
into soils below the planter (Figure 2). The recommended minimum width is 30 inches; length and shape can be decided by architectural considerations. The planter should be sized to temporarily store at least one-half inch of runoff from the contributing rooftop area in a reservoir above the planter bed. Infiltration planters should be placed at least ten feet away from a building to prevent possible flooding or basement seepage damage. A filter planter has an impervious liner on the bottom of the planter. The minimum planter width is 18 inches with the shape and length governed by architectural considerations. Runoff is temporarily stored in a reservoir located above the planter bed. Overflow pipes are installed to discharge runoff when maximum ponding depths are exceeded to avoid water spilling over the side of the planter (Figure 3). Since a filter planter is self-
contained and does not infiltrate into the ground, it can be installed right next to a building. All planters should be placed at grade level or above ground, and sized to allow captured runoff to drain out within four hours after a storm event. Plant materials should be capable of withstanding moist and seasonally dry conditions. Planting media should have an infiltration rate of at least two inches per hour. The sand and gravel on the bottom of the planter should have a minimum infiltration rate of five inches per hour. The planter can be constructed of stone, concrete, brick, wood or other durable material. If treated wood is used, care should be taken so that trace metals and creosote do not leach out of the planter. Supplemental irrigation may be necessary in some regions to ensure plant survival during dry weather.
Figure 2: Infiltration Planter Schematic (left) and Infiltration Planter Box (right) Source: Portland Stormwater Manual, 2002
F-2 Urban Subwatershed Restoration Manual 3

Appendix F: Rooftop Retrofit Design Sheets
Figure 3: Finished Flow-Through Stormwater Planter (left) and Schematic (right) Construction - It is advisable to use a single contractor throughout the construction and landscaping maintenance. Contractors should understand the purpose of stormwater planters including appropriate sizing, filtering media, setbacks from current utilities and buildings and care and maintenance of planted material. Maintenance - Maintenance for stormwater planters involves routine landscaping, checking the integrity of the planter structure, and removal of organic matter. Planter container and overflow pipes should be inspected annually to ensure continued efficiency. Particular care should be taken to ensure that desired infiltration rates are being maintained through the planter soil and subsoils.
Cost – The median cost to construct stormwater planters is estimated to be $27.00 per cubic foot of runoff treated (ranging from $18.00 to $36.00) Further Resources City of Portland. 2004. Stormwater Management Manual – Revised. http://www.portlandonline.com/bes/index.cfm?c=35122& Low Impact Development (LID) Center www.lowimpactdevelopment.org/ New York State. New York State Stormwater Management Design Manual: Stormwater Planters. http://www.rpi.edu/~kilduff/Stormwater/planters1.pdf
Urban Subwatershed Restoration Manual 3 F-3

Appendix F: Rooftop Retrofit Design Sheets
F-4 Urban Subwatershed Restoration Manual 3

Appendix F: Rooftop Retrofit Design Sheets
Rooftop Retrofit Design Sheets
RR-2 CISTERNS
Cisterns capture and reuse rooftop runoff from non-residential sites in a subwatershed. They consist of devices that retain runoff storage volume in aboveground or underground storage tanks (Figure 1). Runoff collected in the tank can be used for outdoor watering, gray water needs or in some cases, even drinking water supply. Stored rainwater provides an opportunity to conserve water and reduce water utility bills. Cisterns are generally much larger than rain barrels and typically have a capacity of more than 10,000 gallons. Since outdoor residential irrigation can account for up to 40% of domestic water consumption in the hot summer months, cisterns can conserve water and reduce the demand on the municipal water system (LID Center, 2003).Cisterns are not yet widely used in most regions of the country but can be incorporated into high-density green buildings. Feasibility Cisterns are an effective on-site retrofit option for treating rooftop runoff from selected commercial, industrial, institutional and municipal sites. In many cases, cisterns are a component of “green buildings,” such as those certified by LEED. They are particularly useful on sites that are nearly completely built out, and simply represent an aboveground or underground storage alternative. When assessing a potential cistern retrofit site, designers need to consider the total contributing roof area, as well as the existing
“plumbing” system that moves water off of the roof. The capacity required in the cistern can be quickly estimated by a simple storage rule: storage of one inch of runoff from a thousand square feet of roof translates to 83 cubic feet of cistern capacity. The next critical factor is the how the cistern will be de-watered in between storms (i.e., pumped to the storm drain system during dry weather, used for supplemental irrigation, or pumped indoors for gray water plumbing). The last design factor to consider is whether the building owner is capable of operating the cistern. Local rainfall data should be thoroughly analyzed before sizing cisterns. A monthly rain and snowfall budget may be needed to accurately size a cistern for a site. If freezing conditions are expected in the winter months, cisterns may need to be located below the frost line or inside the building. Lack of space and the presence of surrounding trees can constrain the use of cisterns. Space problems can be overcome if the cistern is located on the roof or underground. Overhead trees can be a source of falling leaves that can clog the holding tank, or attract rodents and birds whose droppings can contaminate the tank. Cisterns should be located away from trees or other overhead vegetation. If the cistern will be used for gray water or potable water use, designers should also consult the local water authority to see what permits are needed.
Urban Subwatershed Restoration Manual 3 F-5

Appendix F: Rooftop Retrofit Design Sheets
Cost - The cost of cisterns varies depending on their construction material and whether they are located above or below ground. The reported cost is $15,000 per cubic foot of runoff treated, with a range of $6,000 to $25,000.
Implementation
Figure 1b: Large Building Cistern System, Austin, TX
Figure 1a: Wooden Cisterns at the Chesapeake Bay Foundation Headquarters
Design - Most cisterns are prefabricated units that are sized to meet the required needs of the roof. Typical materials used to construct cisterns are wood, metal and reinforced concrete with a watertight compound. All materials should be sealed using a water safe, non-toxic substance. The cistern should also be equipped with a manhole opening to permit access for cleaning, inspection, and maintenance.
Further Resources Low Impact Development (LID) Center. Rain barrels and Cisterns. http://www.lid-stormwater.net/raincist/raincist_home.htm
Construction - It is advisable to have an experienced contractor that is familiar with cistern sizing, installation materials, and proper site placement.
Chesapeake Bay Foundation (CBF). 2003. Phillip Merrill Environmental Center http://www.cbf.org/site/PageServer?pagename=about_merrillcenter_water_main
Maintenance - Maintenance requirements for cisterns are relatively low if they are only intended to provide supplemental irrigation water. Cisterns designed for drinking water supply have much higher maintenance requirements, such as frequent water quality testing and inspection of filtering systems. Cisterns, along with all their accessories should undergo regular inspections at least twice a year.
University of Florida. Cisterns to Collect Non-Potable Water for Domestic Use. http://edis.ifas.ufl.edu/BODY_AE029
F-6 Urban Subwatershed Restoration Manual 3

Appendix F: Rooftop Retrofit Design Sheets
Rooftop Retrofit Design Sheets
RR-3 GREEN ROOFTOPS Description Green rooftops are used to store and treat rooftop runoff. Also known as a “living roof” or “eco-roof,” they consist of a layer of vegetation and soil installed on top of a conventional roof (Figure 1). A green rooftop can be installed on small garages and larger industrial, commercial and municipal buildings. Green rooftops can be designed as extensive or intensive systems. Extensive systems have a thin layer of soil and a cover of grass or moss, while intensive systems have a thicker soil layer, may contain shrubs, trees and other vegetation, and are designed as a landscape amenity. Green rooftops can be applied to both new and existing roofs, and can be installed on flat roofs or even roofs with slopes up to 30% provided special strapping and erosion control devices are used (Peck and Kuhn, 2003). Reduction of runoff volume from green roofs is greater in areas where total annual rainfall is low because a greater percentage of rainfall is lost to evapotranspiration (Stephens, et al, 2002). Green roofs retain from 15 to 90% of rainfall, with reports of 65 to 100% in summer and 10 to 40% in winter (Liptan and Strecker, 2003; Roofscapes, Inc., 2003). Green roofs are most effective in reducing runoff volume for land uses with high percentages of rooftop coverage such as commercial, industrial and multifamily housing (Stephens, et al, 2002). Green roofs also provide owners with many additional benefits, including insulation, energy savings, aesthetic value, wildlife habitat, and improved air quality. Some studies have also found that green roofs can
extend the life of a conventional roof by up to 20 years. Feasibility Green rooftops are a useful on-site retrofit option for new municipal construction, commercial, multi-family, or institutional buildings. In many cases, green rooftops are a component of “green buildings,” such as those specified by LEED. They are particularly useful on sites that are nearly completely built out. Other good opportunities to retrofit rooftops are conventional rooftops that have reached the end of their design life and need replacement. Incremental replacement of conventional rooftops with green rooftops can be an effective, long-range (e.g., 20 + years) strategy to incrementally control runoff in ultra-urban subwatersheds.
Figure 1: Green Rooftop on Chicago’s City Hall Source: Roofscapes Inc. www.roofmeadow.com
Urban Subwatershed Restoration Manual 3 F-7

Appendix F: Rooftop Retrofit Design Sheets
Many building owners are hesitant to make the conversion to green roofs, given the higher initial capital cost (despite the long term energy savings). Therefore municipalities need to develop an effective delivery mechanism in the form of credits or subsidies or even modify their current building codes to permit green rooftops. Regional and Climatic Considerations - Plant selection for green rooftops is an integral design consideration, which is governed by local climate and design objectives (Figure 2). A qualified botanist or landscape architect should be consulted when choosing plant material. For extensive systems, plant material should be confined to hardier, indigenous varieties of grass and sedum. Root size and depth should also be considered to ensure that the plant will stabilize the shallow soil media. Plant choices can be much more diverse for intensive systems. The location of the building plays an important role in the design process. The height of the roof, its exposure to wind, snow loading, orientation to the sun, and shading by surrounding buildings all have an impact on the selection of appropriate plant species. Site Constraints and Permits - The key factors to consider when investigating a rooftop retrofit includes its area, age, and accessibility, structural capacity, and commitment of ownership.
Structural Capacity of the Roof: A key constraint is whether the existing roof can support the additional weight of soil and plants. A licensed structural engineer or architect should conduct a structural analysis to determine the type of green roof system and any needed structural reinforcement. Access to the Roof: Safe access must be available for workers and materials during both construction and maintenance. Local Building Codes: Building codes often differ in each municipality, and local planning and zoning authorities should be consulted to obtain proper permits.
Figure 3: Cross-section of Intensive Green Roof
Source: Unterlage, 1997
Figure 2: Extensive Cross-SectionSource: Unterlage, 1997
F-8 Urban Subwatershed Restoration Manual 3

Appendix F: Rooftop Retrofit Design Sheets
Implementation Each green rooftop is unique, given the purpose of the building, its architecture and the preferences of the builder and end user. Several common features should be kept in mind during green rooftop design, construction and maintenance. Design – The two design options are the extensive and intensive systems, which vary in cost, depth of growing medium and choice of plants. Extensive systems are characterized by low weight, lower capital cost, minimal plant diversity, and reduced maintenance requirements (Figure 2). The growing medium is usually a mixture of sand, gravel, crushed brick, peat, or organic matter combined with soil. The soil media ranges between two and six inches in depth and increases the roof load by 16 to 35 pounds per square foot when fully saturated. Generally, extensive systems can be retrofit on most existing roofs without costly structural reinforcement. Since the growing medium is shallow and the microclimate is harsh, plant species should be low and hardy, which typically involves alpine or arid species, such as sedum. Intensive systems have a deeper soil layer and a corresponding greater weight (Figure 3). Intensive systems have higher construction costs, greater plant diversity, and more expensive landscaping and maintenance needs. In many cases, intensive roofs are accessible to the public and are incorporated into the building as an interactive architectural feature (Figure 4). The growing medium is often soil based and ranges in depth from eight to 24 inches, with a saturated roof loading of between 60 and 200 pounds per square foot. Designers can use a diverse range of trees, shrubs and groundcover because the deeper growing medium allows longer root systems. This allows the designer to develop a more complex ecosystem. Maintenance
requirements, however, are more costly and continuous, compared to extensive systems. In some cases, supplemental irrigation systems may be needed. Both a structural engineer and an experienced installer are recommended for intensive systems. Designers should indicate how they will handle excess runoff that cannot be absorbed by the green rooftop, which is normally drained using downspouts. Most retrofits should be able to use the existing rooftop drainage system with only minor modifications. Construction – An experienced installer should be used to avoid conflicts and maintain accountability. The green roof should be constructed in sections for easier inspection and maintenance access to the membrane and roof drains. Maintenance - A green roof should be inspected after construction for plant establishment, leaks and other functional or structural concerns. Maintenance may include watering, fertilizing and weeding, which are greatest in the first two years as plants become established. The use of native vegetation is recommended to reduce plant maintenance. Irrigation and fertilization is only required during the first year before plants are established. After the first year, maintenance consists of two visits a year for weeding of invasive species, and membrane inspections .
Urban Subwatershed Restoration Manual 3 F-9

Appendix F: Rooftop Retrofit Design Sheets
Cost – The estimated cost for extensive green rooftops is $225.00 per cubic foot treated (ranging from $144 to $300). Intensive green rooftops are even more expensive with a median of $360.00 per cubic foot treated (ranging from $300 to $420). While green rooftops are more expensive than other retrofit options, their lifecycle costs may be comparable to traditional roofs, when energy savings and roof longevity are factored in. Operation and maintenance costs are $0.09 to $0.23 per square foot per year (Stephens, et al., 2002). Design costs typically run 5-10% of the total project cost and administration and site review costs are 2.5 - 5% of the total project cost (Peck and Kuhn, 2003). Further Resources City of Chicago. Rooftop Gardens and Green Roofs. http://egov.cityofchicago.org/city/webportal/p
ortalDeptCategoryAction.do?deptCategoryOID=-536889314&contentType=COC_EDITORIAL&topChannelName=Dept&entityName=Environment&deptMainCategoryOID=-536887205 TectaGreen, Tecta America Corp. Green Roof Systems. http://www.greenroof.com/greenroofsys.shtml Peck, S. and M. Kuhn. Design Guidelines for Green Roofs. http://www.aaa.ab.ca/pages/members/documents/GreenRoofs_000.pdf Roofscapes, Inc. Green Technology for the Urban Environment. www.roofmeadow.com Greenroofs.com. http://www.greenroofs.com Minnesota Urban Small Sites BMP Manual: Stormwater Best Management Practices for Cold Climates. http://www.metrocouncil.org/environment/Watershed/bmp/manual.htm
Figure 4: Benches and pathways can be incorporated into green roofs
Maryland Department of the Environment. Green Roof - Fact Sheet. http://www.mde.state.md.us/assets/document/sedimentStormwater/SWM_greenroof.pdf
F-10 Urban Subwatershed Restoration Manual 3

Appendix F: Rooftop Retrofit Design Sheets
Rooftop Retrofit Design Sheets
RR-4 RAIN BARRELS
F-11
Description Rain barrels are used to capture, store and reuse residential rooftop runoff. They consist of a simple stormwater collection device that stores rainwater from individual rooftop downspouts. Stored water can be used as a source of outdoor water for car washing or lawn or garden watering. The rooftop runoff stored in a rain barrel would normally flow onto a paved surface and eventually into a storm drain. Rain barrels typically have a capacity of 50 to 100 gallons of water (Figure 1). Rain barrels can be applied to new and existing residential developments. They are most applicable for single family residential and townhouse uses. Rain barrels can have benefits on both a site level and subwatershed wide basis. Rain barrels promote water conservation, reduce water demand, and lower irrigation costs and demand (a rain barrel can save homeowners about 1,300 gallons of water during the peak summer months). Rain barrels are inexpensive and easy to build and install and create stronger watershed awareness. Feasibility Rain barrels are a common on-site retrofit practice to treat rooftop runoff from individual homes. Because each rain barrel retrofit treats such a small area, dozens or hundreds are needed to make a measurable difference at the subwatershed level. Consequently, widespread homeowner implementation of rain barrels
requires targeted education, technical assistance and financial subsidies. The potential to retrofit with rain barrels is normally evaluated as part of the neighborhood source assessment of the USSR. The most important factor is the proportion of existing homes that are directly connected to the storm drain system. In general, neighborhoods with residential lot sizes as small as 4000 square feet can be effectively retrofit with rain barrels (Figure 2). Negative neighborhood factors include the presence of basements, limited space for barrel de-watering, and lack of active homeowner association. Regional and Climatic Considerations - Several issues pertaining to water quality, climate, and algae and mosquito control
Figure 1: Installed Rain Barrel
Urban Subwatershed Restoration Manual 3
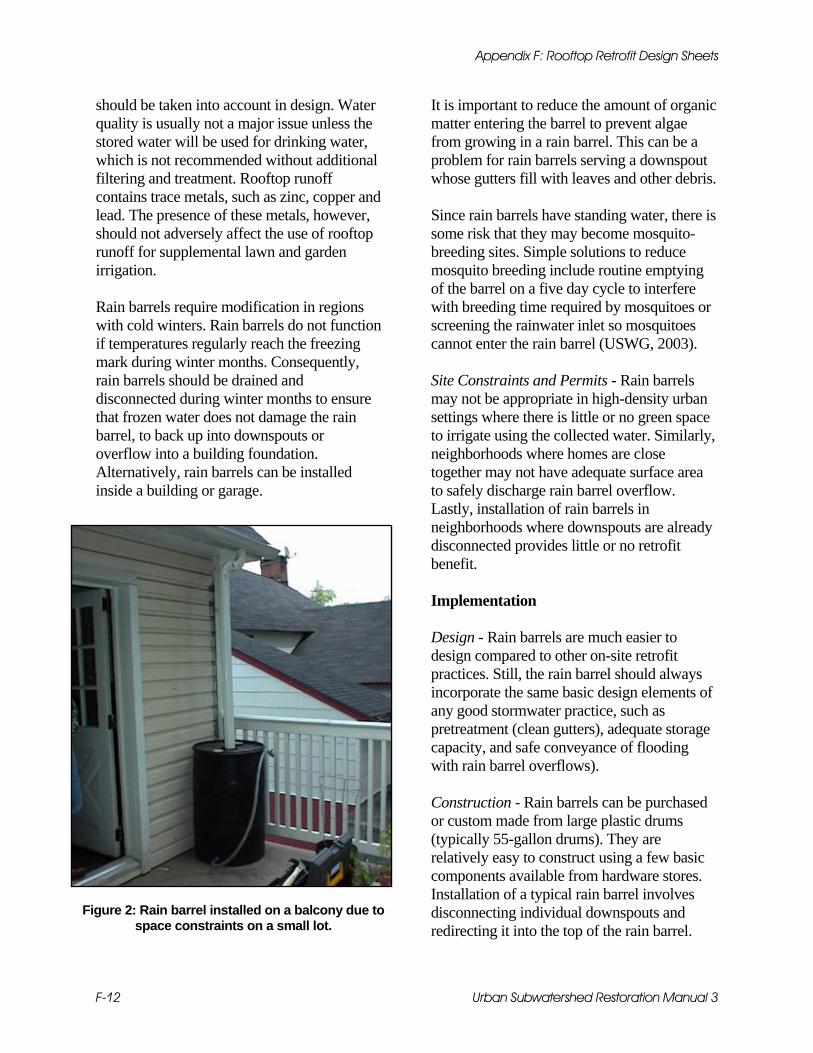
Appendix F: Rooftop Retrofit Design Sheets
should be taken into account in design. Water quality is usually not a major issue unless the stored water will be used for drinking water, which is not recommended without additional filtering and treatment. Rooftop runoff contains trace metals, such as zinc, copper and lead. The presence of these metals, however, should not adversely affect the use of rooftop runoff for supplemental lawn and garden irrigation. Rain barrels require modification in regions with cold winters. Rain barrels do not function if temperatures regularly reach the freezing mark during winter months. Consequently, rain barrels should be drained and disconnected during winter months to ensure that frozen water does not damage the rain barrel, to back up into downspouts or overflow into a building foundation. Alternatively, rain barrels can be installed inside a building or garage.
It is important to reduce the amount of organic matter entering the barrel to prevent algae from growing in a rain barrel. This can be a problem for rain barrels serving a downspout whose gutters fill with leaves and other debris. Since rain barrels have standing water, there is some risk that they may become mosquito-breeding sites. Simple solutions to reduce mosquito breeding include routine emptying of the barrel on a five day cycle to interfere with breeding time required by mosquitoes or screening the rainwater inlet so mosquitoes cannot enter the rain barrel (USWG, 2003). Site Constraints and Permits - Rain barrels may not be appropriate in high-density urban settings where there is little or no green space to irrigate using the collected water. Similarly, neighborhoods where homes are close together may not have adequate surface area to safely discharge rain barrel overflow. Lastly, installation of rain barrels in neighborhoods where downspouts are already disconnected provides little or no retrofit benefit. Implementation Design - Rain barrels are much easier to design compared to other on-site retrofit practices. Still, the rain barrel should always incorporate the same basic design elements of any good stormwater practice, such as pretreatment (clean gutters), adequate storage capacity, and safe conveyance of flooding with rain barrel overflows). Construction - Rain barrels can be purchased or custom made from large plastic drums (typically 55-gallon drums). They are relatively easy to construct using a few basic components available from hardware stores. Installation of a typical rain barrel involves disconnecting individual downspouts and redirecting it into the top of the rain barrel.
Figure 2: Rain barrel installed on a balcony due to space constraints on a small lot.
F-12 Urban Subwatershed Restoration Manual 3

Appendix F: Rooftop Retrofit Design Sheets
Rain barrels have an overflow pipe that redirects the rainwater back into the downspout or onto the lawn or other pervious surface when the rain barrel is full. Other rain barrel components may include spigots, connector barrels, mosquito proofing, and even water filters (CWP, 2003). Maintenance – The maintenance required for rain barrels involves regular dewatering of the barrel to preserve capacity for the next storm event. Roof gutters should be inspected to ensure that leaves and organic matter are not entering the downspout to the rain barrel. In addition, the rain barrel, gutters, and downspouts need to be checked for leaks or obstructions. Lastly, the overflow pipe should be checked to ensure that overflow is draining in a non-erosive manner Cost - Although costs vary across manufacturers, the average cost of a single rain barrel ranges from about $50 to $300, with an average of about $150 The cost per cubic foot treated is about $25 per cubic foot treated (ranging from $7 to $40) Costs can be reduced if volunteers or watershed groups perform the instillation. Consult Profile Sheet 0S-10 for some helpful resources on rain barrel delivery.
Further Resources The following internet resources are recommended for a detailed description on how to build and install a rain barrel. How to Build and Install a Rain Barrel http://www.cwp.org/Community_Watersheds/brochure.pdf Rain Barrels for Dummies: Unofficial Guidance for Backyard Retrofitters. http://www.cwp.org/Community_Watersheds/Rain_Barrel.htm King County, WA. Rain Barrel Information and Sources for the Pacific Northwest. http://dnr.metrokc.gov/wlr/PI/rainbarrels.htm Low Impact Development Center (LID). Rain Barrels and Cisterns. http://www.lid-stormwater.net/raincist/raincist_maintain.htm Maryland Green Building Program: Building a Simple Rain Barrel. http://www.dnr.state.md.us/ed/rainbarrel.html City of Bremerton. Rain Barrel Program: A Modern Spin On An Old Idea. http://www.cityofbremerton.com/content/sw_makeyourownrainbarrel.html Portland, OR Downspout Disconnection Program http://www.portlandonline.com/bes/index.cfm?c=43081
Urban Subwatershed Restoration Manual 3 F-13

Appendix F: Rooftop Retrofit Design Sheets
F-14 Urban Subwatershed Restoration Manual 3
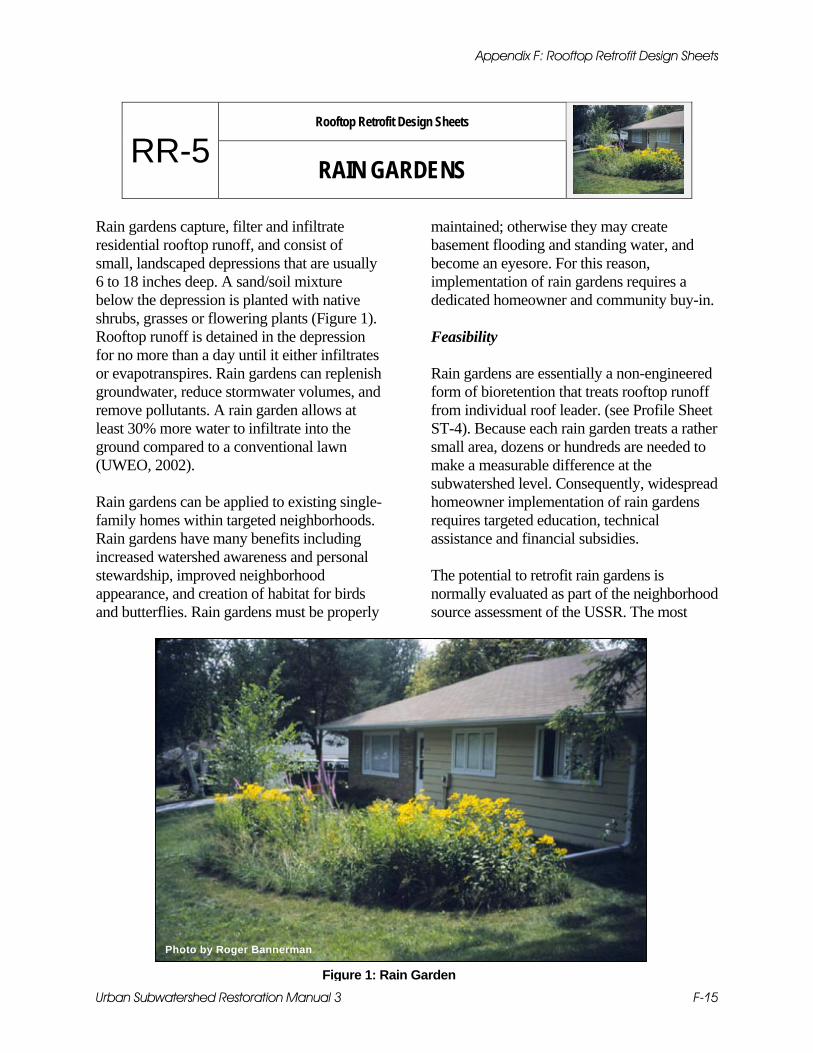
Appendix F: Rooftop Retrofit Design Sheets
Rooftop Retrofit Design Sheets
RR-5 RAIN GARDENS Rain gardens capture, filter and infiltrate residential rooftop runoff, and consist of small, landscaped depressions that are usually 6 to 18 inches deep. A sand/soil mixture below the depression is planted with native shrubs, grasses or flowering plants (Figure 1). Rooftop runoff is detained in the depression for no more than a day until it either infiltrates or evapotranspires. Rain gardens can replenish groundwater, reduce stormwater volumes, and remove pollutants. A rain garden allows at least 30% more water to infiltrate into the ground compared to a conventional lawn (UWEO, 2002). Rain gardens can be applied to existing single-family homes within targeted neighborhoods. Rain gardens have many benefits including increased watershed awareness and personal stewardship, improved neighborhood appearance, and creation of habitat for birds and butterflies. Rain gardens must be properly
maintained; otherwise they may create basement flooding and standing water, and become an eyesore. For this reason, implementation of rain gardens requires a dedicated homeowner and community buy-in. Feasibility Rain gardens are essentially a non-engineered form of bioretention that treats rooftop runoff from individual roof leader. (see Profile Sheet ST-4). Because each rain garden treats a rather small area, dozens or hundreds are needed to make a measurable difference at the subwatershed level. Consequently, widespread homeowner implementation of rain gardens requires targeted education, technical assistance and financial subsidies. The potential to retrofit rain gardens is normally evaluated as part of the neighborhood source assessment of the USSR. The most
Photo by Roger Bannerman
Figure 1: Rain Garden Urban Subwatershed Restoration Manual 3 F-15

Appendix F: Rooftop Retrofit Design Sheets
important factor is the proportion of existing homes that are directly connected to storm drain system. In general, neighborhoods with large residential lot sizes are most suitable (1/4 acre lots and larger). Negative neighborhood factors include the presence of basements, compacted soils, and poor neighborhood awareness. Positive factors are large rooftop areas that are directly connected to the storm drain system, lots with extensive tree canopy and good neighborhood housekeeping. Regional and Climatic Considerations - One common misperception associated with rain gardens is that they provide a breeding ground for mosquitoes. Mosquitoes need three to seven days to breed, and standing water in the rain garden should last for only a few hours after most storms USWG, 2003). Plant selection is also an important element of a successful rain garden. Considerations should include drought-tolerant plants that will not require much watering, but can withstand wet soils for up to 24 hours. Plant selection also depends on the amount of sun the garden receives. Xeriscaping (the practice of landscaping to conserve water) is recommended in arid climates (Figure 2). For a listing of the native plants in your region, visit: http://plants.usda.gov/ (USDA NRCS). This database allows the user to search for plants by name (common or scientific) or by state or county. Site Constraints and Permits - The site constraints for rain gardens include soils and proximity to the house. The garden should be located a minimum of 10 feet away from the house to prevent basement seepage. Rain gardens work best in areas with well-drained soils. However, performance can be enhanced
in poorly draining soils by providing an underdrain system or soil amendments. Implementation Design - The surface area of a rain garden should be between 20% and 30% of the roof area it drains to it to ensure it can temporarily hold water from a 1-inch rainstorm. Further guidance on sizing a rain garden is provided in Table 1. To ensure that the water flows from the impervious surface to the garden, maintain at least a 1% slope from the lawn down to the rain garden (a shallow swale can be used). A downspout extension can be used to direct rooftop flow into the garden. Construction - Construction of rain gardens is simple but requires physical labor to dig the garden, prepare the soil, and plant desired species. Select plants that have a well-established root system and plant them approximately one foot apart (UWEO, 2002). More information on how to install rain gardens can be found online in the Further Resources section.
Figure 2: Xeriscaped Garden
F-16 Urban Subwatershed Restoration Manual 3

Appendix F: Rooftop Retrofit Design Sheets
Table 1: Rain Garden Sizing Example 30’ x 30’ house footprint
¼ of this area drains to one downspout
15’ x 15’ = 225 sf
20% of 225sf = 45sf
30% of 225sf = 67.5 sf The rain garden area should be between 45 and 67.5 square feet, depending on the soil
type (use 20% for sandier soils in Soil Group A) Maintenance - Maintenance of rain gardens is essential to ensure public acceptance and proper performance, and reduce nuisance problems. Typical maintenance includes periodic watering and weeding. The use of native plants can significantly reduce overall yard maintenance needs since they require less mowing, watering and fertilizer than conventional lawns. Cost - The cost to construct a rain garden includes labor for construction and design, plants, and soil mixture. Design and construction costs can vary widely depending on the complexity of the project. Rain gardens typically cost about $4.00 per cubic foot of runoff treated (ranging from $3 to $5). Do-it- yourselfers can create beautiful rain gardens for a fraction of this cost. Further Resources Center for Watershed Protection How to Install a Rain Garden. http://www.cwp.org/Community_Watersheds/brochure.pdf UWEO (University of Wisconsin Extension Office). Rain Gardens: http://clean-water.uwex.edu/pubs/pdf/home.gardens.pdf Bannerman, R. and E. Considine. 2003. Rain Gardens: A how-to manual for homeowners http://www.dnr.state.wi.us/org/water/wm/dsfm/shore/documents/rgmanual.pdf
Center for Watershed Protection . Rain Garden Applications and Simple Calculations. http://www.cwp.org/Community_Watersheds/Rain_Garden.htm Friends of Bassett Creek. 2000. Rain Gardens: Gardening with Water Quality in Mind. http://www.mninter.net/~stack/bassett/gardens.html. Minneapolis, MN Neighborhood Rain Gardens http://www.fultonneighborhood.org/lfrwm.htm Portland, OR Downspout Disconnection Program http://www.portlandonline.com/bes/index.cfm?c=43081 Rain Gardens for Stormwater Bioretention and Ecological Restoration.. http://www.nwf.org/campusecology/files/reillyprop.pdf “Plotting to Infiltrate? Try Rain Gardens.” Yard and Garden Line News 3(6). http://www.extension.umn.edu/yardandgarden/YGLNews/YGLN-May0101.html West Michigan Environmental Action Council and the City of Grand Rapids RainGardens.org. http://www.raingardens.org
Urban Subwatershed Restoration Manual 3 F-17

Appendix F: Rooftop Retrofit Design Sheets
F-18 Urban Subwatershed Restoration Manual 3

Appendix F: Rooftop Retrofit Design Sheets
French drains and dry wells are an on-site retrofit practice that can capture and infiltrate residential rooftop runoff. Runoff from rooftop leaders is directed to the trench via a downspout or swale, is temporarily stored in the voids of the stone-filled trench, and ultimately percolates into the ground. The terms french drain and dry well are often used interchangeably since they perform the same function, however, their design and
application differ slightly. A french drain is a shallow underground trench with a perforated pipes running along the bottom (Figure 1). A typical dry well is a deeper and shorter excavated trench with perforated pipes that run both vertically and horizontally through the stone (Figure 2).
Rooftop Retrofit Design Sheets
RR-6 FRENCH DRAINS and DRY WELLS
Figure 1: Schematic of French Drain
Figure 2: Schematic of Dry Well
Urban Subwatershed Restoration Manual 3 F-19
Appendix F: Rooftop Retrofit Design Sheets
French drains are almost exclusively used for residential sites, whereas dry wells can be used at both residential and commercial sites. Each practice serves a small drainage area, such as a single rooftop or roof leader. While not much space is needed to install these practices, very high-density neighborhoods will have limited opportunities. Feasibility Because each french drain/dry well treats a rather small area, dozens or hundreds are needed to make a measurable difference at the subwatershed level. Consequently, widespread homeowner implementation of these practices requires targeted technical assistance and financial subsidies. The potential to retrofit with french drains/drywells is normally evaluated as part of the Neighborhood Source Assessment of the USSR The most important factor is the proportion of existing homes that are directly connected to the storm drain system. In general, neighborhoods with large residential lot sizes are most suitable (1/4 acre lots and larger). Negative neighborhood factors include the presence of basements, compacted soils, and poor neighborhood awareness or involvement. Positive factors are large rooftop areas that are directly connected to the storm drain system, lots with extensive tree canopy, and neighborhoods known for good housekeeping and active involvement. Regional and Climatic Considerations - Dry wells and french drains do not function during winter months in colder climates unless the trench extends below the frost line. Also, dry
wells are not feasible in regions with high water tables. Site Constraints and Permits - The three main site constraints pertaining to french drains and dry wells are soils, hydrology and slope (LGPC, 2003). The soils must be permeable enough to ensure adequate infiltration within 48 hours. An infiltration rate of at least 0.5 inches per hour is recommended for underlying soils. To limit the risk of groundwater contamination, the bottom of these devices should be located at least three feet above the seasonally high water table or bedrock layer. Steep slopes and fill soils should also be avoided. These practices should be located on the down slope side of buildings and extend at least ten feet from building foundations to prevent potential seepage into basements (ARC, 2001). Implementation Design - Several design features can make french drains and dry wells more effective. First, it is important to provide pretreatment to reduce the high rate of clogging typically associated with these practices. While pretreatment options are limited, a screen placed on top of rooftop gutters can help to filter out materials such as leaves and other debris (LGPC, 2003). Guidance for sizing a french drain is provided in Table 1. The design should provide some type of runoff bypass to direct large storm flows away from the house. The bypass is often an aboveground opening of the downspout as shown in Figures 1 and 2.
F-20 Urban Subwatershed Restoration Manual 3

Appendix F: Rooftop Retrofit Design Sheets
Table 1: French Drain Sizing Example
French Drain Surface Area = (DA)(P)12(D)(V)
30’ x 30’ house footprint
¼ of this area drains to downspout
Rainfall Depth (P) = 1”
Drainage Area (DA) = 15’x 15’ = 225ft2
Depth of Proposed Trench (D) = 2ft
Voids Ratio for Gravel (V) = 0.35
(225)(1) 12(2)(0.35) = 26.8 ft2
Trench dimensions: 13’ length; 2’ wide; 2’ deep Notes: Depth (D) can vary depending on site constraints Rainfall Depth (P) can vary; should reflect retrofit water quality target volume or local water quality criteria
Construction - Dry wells generally require more construction effort than other on-site practices due to the deeper excavation required. These practices require relatively simple materials, such as perforated pipe, stone (two to four inches in diameter) and filter fabric. Basic construction involves digging a slightly sloped trench (to carry the water away from the house), lining the sides of the trench with the filter fabric, laying the perforated pipe, and then backfilling the trench with gravel or stone. Maintenance - Because these practices are out of sight, maintenance tends to be neglected. Regular maintenance consists of a cleaning out leaves and debris caught in the gutter screen and periodic replacement of the reservoir with clean rock. Inspection of the observation well should be done annually to ensure that the stone fill is level to the ground surface and that the filter fabric has not become clogged with material (ADEQ, 2000).
Cost – The unit cost to install these practices is about $12.00 per cubic foot treated (ranging from $10.50 to $13.50). Further Resources Guidance for Design, Installation, and Operation and Maintenance of Dry Wells. Phoenix, AZ. http://www.azdeq.gov/environ/water/permits/download/dwguid.pdf Stormwater Management Guide for Minor Projects. http://www.lgpc.state.ny.us/pdf/strmguid.htm Development Planning for Stormwater Management: A Manual for the Standard Urban Stormwater Mitigation Plan. http://www.ladpw.org/wmd/NPDES/table_contents.cfm New York State Stormwater Management Design Manual. http://www.dec.ny.gov/chemical/29072.html
Urban Subwatershed Restoration Manual 3 F-21

Appendix F: Rooftop Retrofit Design Sheets
New Jersey Stormwater Best Management Practices Manual. Standard for Dry Wells. http://www.njstormwater.org/tier_A/pdf/NJ_SWBMP_9.3%20print.pdf Houston Landscape Images: Drainage System Components. http://www.houstonlandscape.com/Drain_Systems.htm
Grounds Magazine. How to Install a French Drain http://www.grounds-mag.com/mag/grounds_maintenance_install_french_drain/
F-22 Urban Subwatershed Restoration Manual 3

Appendix F: Rooftop Retrofit Design Sheets
Rooftop Retrofit Design Sheets
RR-7 PERMEABLE PAVERS
Permeable pavers treat or reduce parking lot runoff using a porous or semi-porous material on driveways, access roads, parking lots and walkways. Permeable pavers can also allow for surface storage or infiltration of runoff, which can reduce stormwater flows compared to traditional surfaces like concrete or asphalt pavement. The basic design presented here is for permeable pavers, which consist of a permeable asphalt or concrete surface that allows stormwater to quickly infiltrate into soils or a shallow underground stone reservoir (Figure 1). Runoff then percolates into the soil, where it recharges groundwater and traps stormwater pollutants. Other materials include grass paving blocks, interlocking concrete modules and brick pavers to provide some infiltration and detention of runoff. Feasibility Permeable pavers can be used as a retrofit to treat runoff from parking lots or adjacent rooftops. Good opportunities can be found in spillover parking areas, schools, municipal facilities and urban hardscapes (see Profile Sheet OS-12). Other opportunities include redevelopment of commercial sites, especially when parking lots are renovated or expanded. It is extremely important to confirm that local soils can support adequate infiltration, since past grading, filling, disturbance and compaction can greatly alter their original
infiltration qualities. The greatest opportunity to retrofit infiltration exists for sensitive or impacted subwatersheds, where some of the original soil structure may still exist. By contrast, most of the soils in subwatersheds are not likely to be suitable for infiltration. Some regions of the country still have highly permeable soils, which do allow for widespread use of permeable pavers (e.g., glacial tills, sand). When evaluating a proposed permeable paver retrofit, designers should assess the same constraints for infiltration practices (see Profile Sheet ST-6d in Appendix I). Additional factors to consider include traffic volume and the intended use and ownership of the surface. Permeable pavers are much more versatile, because they do rely less on soil infiltration as compared to surface storage to provide runoff treatment. Regional and Climate Concerns - Permeable pavers can be applied in most regions of the country, but needs to be adapted to meet the unique challenges of cold climates. Permeable pavers should not be used when sand or other
Figure 1: Permeable Pavement
Urban Subwatershed Restoration Manual 3 F-23

Appendix F: Rooftop Retrofit Design Sheets
materials are applied for winter traction since they quickly clog the pavers. Similarly, care should be taken when applying salt to permeable pavers, since chlorides can migrate into the groundwater. Permeable pavers have been successfully used in cold climate in Norway where design features were incorporated to reduce frost heave. Further, some experience suggests that snow melts faster on a porous surface because of rapid drainage below the snow surfaces. Site Constraints and Permits – Permeable pavers has the same site constraints of any infiltration practice and should meet the following criteria: • Soils need to have an infiltration rate
between one-half and three inches per hour
• The bottom of the stone reservoir should be completely flat so that infiltrated runoff will be able to infiltrate through the entire surface
• Permeable pavers should be located at least three feet above the seasonally high groundwater table, and at least 100 feet away from drinking water wells
• Permeable pavers should not be used to treat stormwater hotspot areas due to the potential for groundwater contamination
Implementation Design - Pretreatment, treatment, conveyance, and maintenance reduction should be considered in all permeable pavers retrofits. In most permeable pavers designs, the pavers itself acts as pretreatment to the stone reservoir below. Because the surface serves this purpose, frequent maintenance of the pavers surface is critical to prevent clogging. Another pretreatment element is a fine gravel layer above the coarse gravel treatment reservoir. The effectiveness of both of these
pretreatment measures can be inconsistent, which is one reason frequent vacuum sweeping is needed to keep the surface clean. One design option intended as a backup water removal mechanism within a permeable pavers system is an "overflow edge.” An “overflow-edge” is a trench surrounding the edge of a permeable pavers area. The trench connects to the stone reservoir below the surface of the pavers. Although this feature does not in itself reduce maintenance requirements, it acts as a backup in case the surface clogs. If the surface clogs, stormwater will flow over the surface and into the trench, where some infiltration and treatment will occur. The stone reservoir below the pavers should be composed of layers of small stone and be sized for the WQv storm event. Variations to the reservoir design include the use of perforated corrugated metal piping, plastic arch pipe, and plastic lattice blocks. Water is conveyed through the stone reservoir from the surface of the pavers, then infiltrates into the underlying soil at the bottom of this stone reservoir. A layer of sand or choker stone should be placed below the stone reservoir to prevent preferential flow paths and to maintain a flat bottom. Designs should include methods to convey larger storms to the storm drain system. One option is to set storm drain inlets slightly above the surface elevation of the pavers. This allows for temporary ponding above the surface if the surface clogs, but bypasses larger flows that are too large to be treated by the system. Variations in the design of permeable pavers can address treatment of offsite sources. In one design variation, the stone reservoir below the filter can also treat runoff from other sources such as rooftop runoff. In this design, pipes are connected to the stone reservoir to
F-24 Urban Subwatershed Restoration Manual 3

Appendix F: Rooftop Retrofit Design Sheets
direct flow throughout the bottom of the storage reservoir. Construction - Installation of permeable pavers is a specialized project and should involve experienced contractors. It is also important to ensure that the drainage area is fully stabilized prior to construction to slightly prevent sediment from clogging the pavers. Maintenance - Permeable pavers requires slightly more maintenance than traditional pavement in order to ensure continued porosity of the surface. Owners should understand that using a sealer or repaving permeable pavers is not a viable option. Areas contributing to the permeable pavers site need to be mowed and bare areas should be seeded. The surface should be vacuumed three to four times each year to remove sediment and debris. A carefully worded maintenance agreement is essential to provide specific guidance for the parking lot. The agreement should clearly specify how to conduct routine maintenance tasks, and repave the surface when the pavers reaches the end of their design life. Ideally, signs should be posted on the site identifying permeable paver areas to increase public awareness. Inspections of permeable pavers should include inspection of surface for spalling or deterioration and testing to ensure that water is draining between storms. Adequate drawdown should occur within 24 to 48 hours. Cost - Permeable pavers are more expensive than traditional asphalt or concrete pavement. While traditional pavement is approximately $.50 to $1.00 per square foot, permeable pavers can range from $2 to $3 per square foot, depending on the design. The cost per cubic foot of runoff treated is about $120.00 (ranging from $96.00 to $144.00). However, if
the cost estimates were to include the savings due to a reduced need for storm drains and land consumption for stormwater treatment, the cost differential for permeable pavers drops sharply. Further Resources BioPaver. http://www.biopaver.com/problems.html Concrete Network. Permeable/Porous Pavers. http://www.concretenetwork.com/concrete/porous_concrete_pavers/ Green Builder. A Source Book for Green and Sustainable Building: Pervious Paving Materials. http://www.greenbuilder.com/sourcebook/PerviousMaterials.html Pavers Search. Paver Products and Resources for Homeowners and Professionals. http://www.paversearch.com/permeable-pavers-menu.htm Puget Sound Online. Natural Approaches to Stormwater Management: Permeable Pavement. http://www.psat.wa.gov/Publications/LID_studies/permeable_pavement.htm
Urban Subwatershed Restoration Manual 3 F-25

Appendix F: Rooftop Retrofit Design Sheets
F-26 Urban Subwatershed Restoration Manual 3

Appendix G: Example Concept Design


Center for Watershed Protection Page 1 of 6
R-9 Stormwater Planter at St. Martin Church Location The sidewalk on Fayette Street adjacent to St. Martin Church at the intersection of Fulton and Fayette Streets. Site Description The downspouts on the Fayette Street side of St. Martin Church discharge to a trench drain, which then discharges directly to the street (Figures 1 and 2). Proposed Practice The proposed practice for this site is an aboveground, flow-through stormwater planter that will capture and treat rooftop runoff. Stormwater planters are small landscaped stormwater treatment practices that use soil filtration to reduce stormwater quantity and improve water quality, similar to rain gardens and green roofs. Flow-through planters are contained planters with an underdrain system that conveys filtered stormwater to the storm drain system (Figure 3) Visual Glossary Reference • #3. Planter boxes Drainage Area • The northern portion of the roof drains to the
downspout where the stormwater planter will be located. The drainage area to this downspout is approximately 2,500 ft2.
An aerial view of the estimated drainage area is attached.
Figure 1: Downspout from St. Martin Church on Fayette.
Figure 2: Sidewalk along Fayette where stormwater planter will be located.

R-9 Stormwater Planter at St. Martin Church DRAFT
Center for Watershed Protection Page 2 of 6
Figure 3: Plan view (top) and cross section view (bottom) of a flow-through stormwater planter (Source: Portland, OR, 2004).

R-9 Stormwater Planter at St. Martin Church DRAFT
Center for Watershed Protection Page 3 of 6
Sizing Computations • Stormwater runoff volume treated = 0.25 in, or ≈ 50 ft3 • Target surface area of the stormwater planter = 67.5 ft2 • Proposed dimensions of the planter = 9 ft by 7.5 ft • Minimum soil depth = 1.5 ft • Average ponding depth = 0.5 ft • Maximum ponding depth = 1.0 ft • Filter time ≈ 4 hours Detailed sizing computations are attached. Features The stormwater planter will be placed on the sidewalk adjacent to the north side of the church on Fayette Street (Figure 4). Specific design notes follow: • The planter will be an aboveground system – excavation will not be necessary. • The downspout will be shortened and directed into the top of the planter. To prevent erosion,
splash rocks should be placed below the downspout. • The planter has been designed to pond water for 4 hours, with a maximum ponding depth of
12 inches. The dimensions of the proposed planter are 9 feet (along building) by 7.5 feet. • The planting medium depth will be 18 inches. The gravel drainage layer will have a depth of
12 inches. Filter fabric will separate the planting medium from the gravel drainage layer, and should extend upwards along the walls of the planter to the top of the planting medium.
• A 4-inch vertical hooded PVC pipe will serve as an overflow control to redirect high flows out of the planter to the existing trench drain. This will require that a hole be “punched through” the pavement covering the trench drain to allow for insertion of the overflow pipe. The invert of the pipe’s “hood” should be set 4 inches below the top of the planter.
• A 4-inch perforated PVC pipe in the drainage layer will direct treated runoff to the existing trench drain. This perforated PVC pipe should be connected to the vertical PVC overflow pipe. The over end of the perforated PVC pipe should be capped.
• Native plant species that are adaptable to the wet/dry conditions that will be present need to be selected.
A plan view and a cross section view of the proposed stormwater planter are attached. Construction Sequence • Cut the downspout so that the end can be
placed over the stormwater planter. Use a downspout elbow to direct the end of the downspout into the stormwater planter. Figure 4: Proposed location of the stormwater
planter, along the building between the window and corner (to the right of the door).

R-9 Stormwater Planter at St. Martin Church DRAFT
Center for Watershed Protection Page 4 of 6
• Construct planter with the interior dimensions shown on the attached drawings. Drill hole through bottom of planter and sidewalk to allow for insertion of overflow control pipe.
• Assemble the vertical hooded PVC overflow pipe. Drill holes in the PVC pipe that will serve as the underdrain. Attached the perforated underdrain pipe to the overflow pipe. Set in the planter.
• Place 12 inches of 3/8” to 5/8” washed gravel in the bottom of the planter. • Lay filter fabric across the top of the gravel drainage layer. The filter fabric should extend
upwards along the walls of the planter to the top of the planting medium. • Fill the planter with 18 inches of planting media. Slight overfilling is recommended to
account for settlement. • Presoak the planting media prior to planting vegetation to allow for settlement. • Excavate or fill to achieve proper design elevation, leaving space for the upper layer of
mulch that will bring the surface to final elevation (approx. 12 inches below the top of the planter).
• Place several 2” to 4” splash stones under the downspout. • Plant vegetation and mulch. Materials Specifications Planter box: • The planter box should be constructed with the interior dimensions shown on the attached
drawings. The surface dimensions of the planting bed should be 9.0 ft by 7.5 ft. • Materials suitable for planter wall construction include stone, concrete, brick, clay, plastic,
wood, or other durable material. • Treated wood may leach toxic chemicals and contaminate stormwater, and should not be
used. • A pre-manufactured container, such as a concrete vault, may be suitable for this practice. • If using wood or some other permeable materials, the walls and bottom of the planter box
should be lined with an impermeable membrane. Downspout elbow: • One downspout elbow Splash rocks: • Several 2” to 4” diameter rocks. Planting medium: • Approx. 101 ft3 ≈ 3.8 yd3 of well-blended, homogenous mixture of 50-60% construction
sand; 20-30% top soil; and 20-30% organic leaf compost. This mixture should be a uniform mix, free of stones, stumps, etc.
o Sand – clean construction sand, free of deleterious materials. AASHTO M-6 or ASTM C-33 with grain size of 0.02” – 0.04”.
o Top soil – sandy loam, loamy sand, or loam texture per USDA textural triangle with less than 5% clay content.
o Organic leaf compost – aged leaf mulch.

R-9 Stormwater Planter at St. Martin Church DRAFT
Center for Watershed Protection Page 5 of 6
Filter fabric: • Approx. 117 ft2 of filter fabric. • This filter fabric should meet a minimum permittivity rate of 75 gal/min/ft2. Gravel: • Approx. 67.5 ft3 ≈ 2.5 yd3 of 3/8” to 5/8”washed gravel Underdrain and overflow drain system: • Approx. 11 feet of 4” PVC schedule 40 pipe. • One 4” PVC schedule 40 hood or trap (two 90o elbow PVC socket fittings may be used
instead). • One 4” PVC schedule 40 cap socket fitting. • The perforated underdrain may be connected to the vertical overflow drain using a Schedule
40 Tee PVC Socket Fitting • The perforated underdrain pipe may be created by drilling holes in 4” PVC Schedule 40 pipe.
The holes should be 1/4” in diameter, 6” center to center, along three longitudinal rows. Planting Considerations • Vegetation selected for the stormwater planter should be relatively self-sustaining and
adaptable. • Native plant species are recommended, and fertilizer and pesticide use should be avoided
whenever possible. • Vegetation should be able to withstand extended dry and wet periods. Vegetation may be in
standing water for up to four hours. • Tree planting is discouraged in the planter due to the depth of planting medium (18”). A sample of appropriate plant materials is attached (MDE, 2000). Maintenance Considerations • Following completion, the stormwater planter should be inspected after each storm event
greater than 0.5 inches, and at least twice in the first six months. Subsequently, inspections should be conducted annually and after storm events equal to or greater than the 1-year storm event.
• Routine maintenance activities include pruning and replacing dead or dying vegetation, plant thinning, and erosion repair.
Specific inspection and maintenance considerations include: • Downspout: Debris shall be removed routinely (e.g., no less than every 6 months) and upon
discovery. Damaged pipe shall be repaired upon discovery. • Splash Blocks: Should be replaced if necessary. • Planter: Water should drain from reservoir within 3-4 hours of storm event. Sources of
clogging shall be identified and corrected. Topsoil may need to be amended with sand or replaced all together.

R-9 Stormwater Planter at St. Martin Church DRAFT
Center for Watershed Protection Page 6 of 6
• Planting medium: Excavation and replacement of the soil and gravel layer may be necessary to correct low infiltration rates. Sediment accumulation should be hand removed with minimum damage to vegetation. Sediment should be removed if it is more than 4 inches thick or so thick as to damage or kill vegetation. Litter and debris shall be removed routinely (e.g., no less than quarterly) and upon discovery.
• Planter: Any structural deficiencies in the planter including rot, cracks, and failure should be repaired.
• Overflow Pipe: Damaged pipe shall be repaired or replaced upon discovery. • Vegetation: Should be healthy and dense enough to provide filtering while protecting
underlying soils from erosion. Mulch shall be replenished at least annually. Vegetation that limits access or interferes with planter operation should be pruned or removed. Fallen leaves and debris from deciduous plant foliage should be raked and removed.

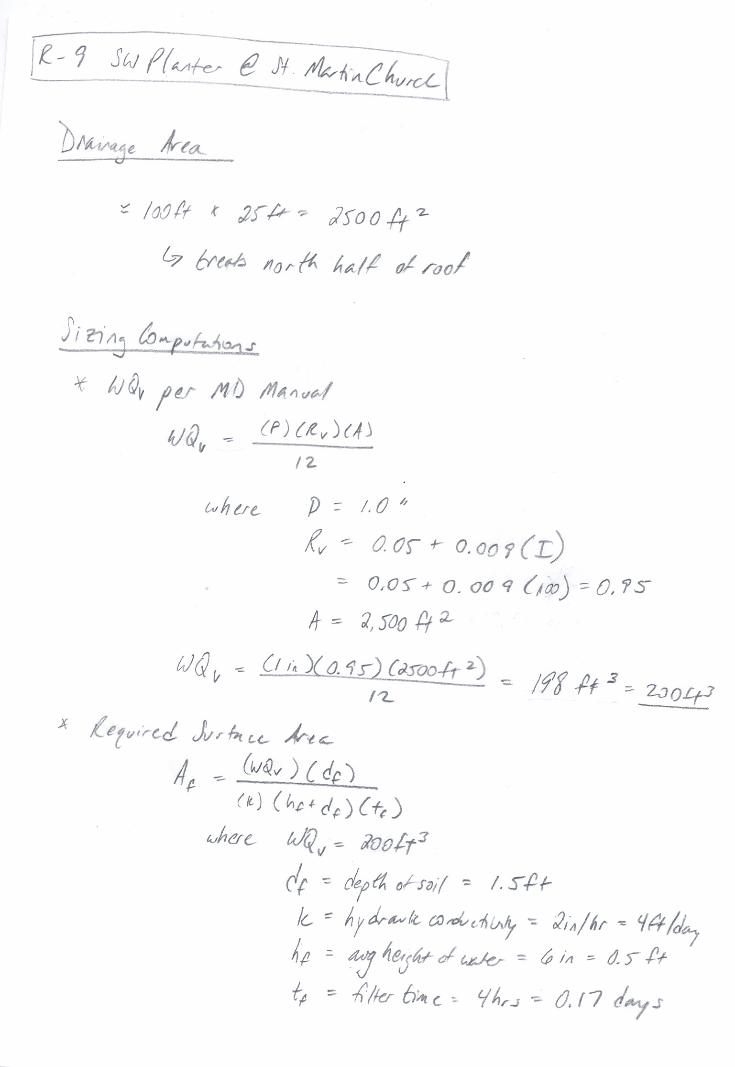


Appendix H: Infiltration Testing Procedures


Urban Subwatershed Restoration Manual 3 H-1
Appendix H: Infiltration Testing Procedures If a retrofit site appears to have soils that will permit the infiltration of stormwater runoff, the use of an infiltration retrofit may be possible. On-site testing should be conducted to establish the infiltration capacity of the native soils and determine the feasibility of the infiltration retrofit. This appendix presents a basic infiltration testing procedure that can be used determine soil infiltration rates at a retrofit site. I. Test Pit/Boring Procedures
1. 1 test pit or standard soil boring
should be provided for every 200 square feet of proposed infiltration or bioretention facility.
2. The location of each test pit or
standard soil boring should correspond to the location of the proposed facility.
3. Excavate each test pit or dig each
standard soil boring to a depth at least 2 feet below the bottom of the proposed facility.
4. If the groundwater table is located
within three feet of the bottom of the proposed facility, determine the depth to the groundwater table immediately upon excavation and again 24 hours after excavation.
5. Conduct Standard Penetration Testing (SPT) every 2 feet to a depth that is 2 feet below the bottom of the proposed facility.
6. Determine the USDA or Unified Soil
Classification system textures at the bottom of the proposed facility and at a depth that is 2 feet below the bottom of the proposed facility. All soil horizons should be classified and described.
7. If bedrock is located within two feet
of the bottom of the proposed facility, determine the depth to the bedrock layer.
8. Test pit/soil boring stakes should be
left in the field to identify where soil investigations were performed.
II. Infiltration Testing Procedures 1. 1 infiltration test should be provided
for every 200 square feet of proposed infiltration or bioretention facility.
2. The location of each infiltration test
should correspond to the location of the proposed facility.
3. Install a test casing (e.g., rigid, 4 to 6
inch diameter pipe) to a depth 24 inches below the bottom of the proposed infiltration or bioretention facility.
4. Remove all loose material from sides
the test casing and any smeared soil surfaces from the bottom of the test
Appendix H: Infiltration Testing Procedures
H-2 Urban Subwatershed Restoration Manual 3
casing to provide a natural soil interface into which water may percolate. If desired, a 2-inch layer of coarse sand or fine gravel may be placed at the bottom of the test casing to prevent clogging and scouring of the underlying soils. Fill test casing with clean water to a depth of 24 inches and allow underlying soils to pre-soak for 24 hours.
5. 24 hours later, refill the test casing
with another 24 inches of clean water and measure the drop in water level within the test casing after one hour. Repeat the procedure three additional times by filling the test casing with clean water and measuring the drop
in water level after one hour. A total of four observations will be completed. The infiltration rate of the underlying soils may either be reported as the average of all four observations or the value of the last observation. The infiltration rate should be reported in inches per hour.
6. Infiltration testing can be performed
within an open test pit or a standard soil boring.
7. After infiltration testing is
completed, the test casing should be removed and the test pit or soil boring backfilled and restored.

Appendix I: Retrofit Design Sheets


Appendix I: Retrofit Design Sheets
Retrofit Design Sheets ST-1d
EXTENDED DETENTION Typical Constraints Some common constraints for retrofitting extended detention ponds include: Space Required: A typical ED pond requires a footprint of 1 to 3% of its contributing drainage area, depending on depth of the pond (the deeper the pond, the smaller footprint needed). Available Head: Bottom elevations for ED retrofits are typically determined by the existing elevation of the downstream conveyance system (e.g., a stream, channel or pipe). Backwater in the upstream conveyance system can also constrain the head available at the retrofit site. Typically, a minimum of about six to 10 feet of head is needed to construct an ED retrofit. Contributing Drainage Area: A minimum contributing drainage area is recommended for each ED design variant. For micropool ED ponds, a minimum of 10 acres is suggested in humid regions to sustain a permanent micropool to prevent clogging. A minimum of 25 acres is recommended in humid regions to maintain constant water elevations in wet ED ponds and ED wetlands. The minimum drainage area may increase in arid or semi-arid climates. A water balance should be conducted if the designer needs to maintain a constant pool elevation. ED may still work on drainage areas less than 10 acres, but designers should be aware that these “pocket” ponds will have very small orifices that will be
prone to clogging, experience fluctuating water levels, and generate future maintenance problems.
Minimum Setbacks: Local ordinances and design criteria should be consulted to determine minimum setbacks to property lines, structures, and wells. Generally, ED retrofits should be setback at least 10 feet from property lines, 25 feet from building foundations, 50 feet from septic system fields, and 100 feet from private wells. Utilities: Site designers should check to see if any utilities cross the proposed retrofit site. ED retrofits should not submerge existing sewer manholes as this can lead to infiltration/inflow problems and make maintenance access more difficult. Dry utilities such as underground electric or cable should never be inundated. Depth to Water Table: The depth to the groundwater table is typically not a major concern for ED retrofits. In fact, intercepting a high water table can sustain a shallow pool or pocket wetland within the retrofit. Designers should keep in mind that groundwater inputs may reduce retrofit pollutant removal capability and could sharply increase excavation costs. Depth to Bedrock: If bedrock layers are discovered near the surface of the proposed retrofit, it may be too difficult or expensive to excavate the storage needed for ED retrofits.
Urban Subwatershed Restoration Manual 3 I-1

Appendix I: Retrofit Design Sheets
Special Community and Environmental Considerations about ED Retrofits ED retrofits can create several community and environmental concerns to anticipate during design: Aesthetics: ED retrofits tend to accumulate sediment and trash, especially if they are undersized. Many residents perceive dry ED ponds as being unsightly and creating nuisance conditions. Fluctuating water levels in ED retrofits also create a tough landscaping environment. In general, designers should avoid retrofit designs that rely solely on dry ED. Existing Wetlands: ED retrofits should not be constructed within existing natural wetlands nor should they inundate or otherwise change the hydroperiod of existing wetlands. Existing Forests: Clearing of mature trees should be avoided during retrofit layout. Designers should be aware that even modest changes in inundation frequency can kill upstream trees (Wright et al., 2007). Stream Warming Risk: ED ponds have less risk of stream warming than other pond options, but can warm streams if their low flow channel is not shaded. If the retrofit discharges to temperature-sensitive waters, the pond should be forested and have a maximum detention time of 12 hours or less to minimize potential stream warming. Safety Risk: Dry ED ponds are generally considered to be safer than other pond options since they have few deep pools. Steep side-slopes and unfenced headwalls, however, can still create some safety risks.
Mosquito Risk: The fluctuating water levels within dry ED ponds have potential to create conditions that lead to mosquito breeding. Mosquitoes tend to be more prevalent in irregularly flooded ponds than in ponds with a permanent pool (Santana et al., 1994). Designers can minimize the risk by combining ED with a wet pond or wetland. ED Retrofit Design Issues ED retrofits are normally squeezed into very tight sites, so designers are always tempted to eliminate standard design features to maximize storage. However, designers should think twice before dropping the following critical design features: Low Flow Orifice: Unless the drainage area to an ED retrofit is unusually large, the diameter of the ED orifice will be less than six inches in diameter. Small diameter pipes are prone to chronic clogging by organic debris and sediment. Retrofit designers should always look at upstream conditions to assess the potential for higher sediment and woody debris loads. The risk of clogging in such small openings can be reduced by:
− Sticking to a minimum orifice
diameter of three inches or greater, even if this means walking away from the proposed retrofit site.
− Protecting the ED low flow orifice by installing a reverse-sloped pipe that extends to mid-depth of the permanent pool or micropool.
− Providing an over-sized forebay to trap sediment, trash and debris before it reaches the ED low flow orifice.
− Installing a trash rack to screen the low flow orifice.
I-2 Urban Subwatershed Restoration Manual 3

Appendix I: Retrofit Design Sheets
Maximum Vertical Depth of ED: Designers often seek to maximize the depth of ED retrofits to treat a greater volume of runoff within a smaller footprint. Increasing the vertical fluctuation or “bounce” within an ED retrofit, however, can reduce pollutant removal, promote invasive species and create a difficult landscaping environment. In the context of retrofitting, the vertical elevation of ED storage should not extend more than 5 feet above the normal water surface elevation. The bounce effect is not as critical for channel protection or flood control storm events. These storms can exceed the 5 foot vertical limit if they are managed by a multi-stage outlet structure.
ED Retrofit Pond Maintenance Issues
Several maintenance issues can be addressed during retrofit design and future maintenance operations: Clogging: Retrofits are prone to higher clogging risk at the ED low flow orifice and any upstream flow splitters. These aspects of retrofit plumbing should be inspected at least twice a year after initial construction. Designers should provide easy access to both the micropool and the pond drain to allow maintenance crews to dewater the retrofit. Sediment Removal: Good maintenance access is also needed to allow crews to remove accumulated sediments. Designers should check to see whether sediments can be spoiled on-site or must be hauled away. The frequency of sediment removal should be increased if:
o A micropool is used within the ED retrofit
o The retrofit is undersized relative to the target WQv
o Significant development activity or winter road sanding is projected to occur in the retrofit’s contributing drainage area
Vegetation Management: The constantly changing hydrologic regime of ED retrofits makes it hard to mow or manage vegetative growth. The bottom of dry ED retrofits often become soggy, and water-loving trees such as willows may take over. Retrofit designers should carefully evaluate how vegetation will be cost-effectively managed in the future. Landscape architects can prepare a planting plan that allows the retrofit to mature into a native forest in the right places yet keeps mowable turf along the embankment and all access areas. The wooded wetland concept proposed by Cappiella et al., (2005) may be a good option for many ED retrofits.
Trash Removal: Trash, debris and litter tend to accumulate in the forebay, micropool and on the bottom of ED ponds. The maintenance plan should schedule cleanups at least once a year. A retrofit maintenance plan should be created to address each of the items listed above. The maintenance plan should identify the responsible party and contain a legally enforceable agreement that specifies maintenance duties and schedules. Adaptation ED for Special Climates and Terrain Cold Climates: Winter conditions can cause freezing problems within inlets, flow splitters, and ED outlet pipes due to ice formation. Designers can minimize these problems by:
• Not submerging inlet pipes
Urban Subwatershed Restoration Manual 3 I-3

Appendix I: Retrofit Design Sheets
• Increasing the slope of inlet pipes by a minimum of 1% to discourage standing water and potential ice formation in upstream pipes
• Placing all pipes below the frost line to prevent frost heave and pipe freezing
• Designing low flow orifices to withdraw at least six inches below the typical ice layer
• Placing trash racks at a shallow angle to prevent ice formation
Sand loadings to ED retrofits may increase due to winter road maintenance. Consequently, designers may want to over-size forebays and/or micropools to account for the higher sedimentation rate. ED retrofits can also be designed to operate in a seasonal mode that provides additional WQv storage to treat snowmelt runoff (MSSC, 2005; Caraco et al., 1997). Arid regions: Water rights can be significant issue when it comes to capturing and detaining stormwater runoff in Western states. Also, ED retrofits in arid regions are subject to high sediment loads and may lack vigorous vegetative cover unless they receive supplemental irrigation (Caraco, 2000). The higher evaporation rates and limited inflows of arid regions always make it hard to sustain a permanent pool in the micropool and/or forebay. Designers may want to compute a water balance to determine if pools can be sustained, or if supplemental irrigation will be needed to maintain vegetative cover.
Karst Terrain: Geotechnical investigations are recommended when ED retrofit ponds are situated in active karst areas to minimize the risk of groundwater contamination and avoid sinkhole formation. An impermeable liner and a minimum three foot vertical
separation distance from the underlying rock layer is recommended. Costs to Install ED Retrofits Extended detention ranks among the least expensive stormwater options, particularly when free storage can be obtained at pond and crossing retrofit sites (SR-1 and SR-2). The cost to install dry ED ponds at new development sites can be determined from the cost equations of Brown and Schueler (1997). The equations (updated to 2006 dollars) predict the base construction cost of new ED construction based on the storage volume of the pond, including excavation, control structures, and appurtenances: BCC = (10.97)(Vs
0.780)
Vs = Total storage volume (ft3) BCC = Base construction cost (2006 dollars) The median cost to construct a new ED pond is about $3,800 per impervious acre treated (range: $2,200 to $7,500). Please note that ED retrofit construction costs are generally at least three times greater (see Chapter 2 and Appendix E). Design Resources Several state stormwater manuals provide extensive guidance on ED pond design: Georgia Stormwater Management Manual http://www.georgiastormwater.com Minnesota Stormwater Management Manual http://www.pca.state.mn.us/water/stormwater/stormwater-manual.html Vermont Stormwater Management Manual http://www.anr.state.vt.us/dec/waterq/cfm/ref/Ref_Stormwater.cfm
I-4 Urban Subwatershed Restoration Manual 3

Appendix I: Retrofit Design Sheets
Retrofit Design Sheets ST-2d
WET PONDS
Typical Constraints Some common constraints hinder the use of wet pond retrofits in developed watersheds: Space Required: The proposed surface area for a wet pond retrofit should be at least 1 to 3 % of its contributing drainage area, depending on the pond’s depth. Contributing Drainage Area: A minimum contributing drainage area of 10 to 25 acres is recommended for wet pond retrofits to maintain constant water elevations, although these can vary by design type and climatic region. Smaller drainage areas may be treated if the retrofit will intercept the groundwater table (but this may reduce pollutant removal and increase excavation costs). Wet ponds can still work on drainage areas less than 10 acres, but designers should be aware that these “pocket” ponds will be prone to clogging, experience fluctuating water levels, and generate more nuisance conditions. A water balance should be conducted if the designer needs to maintain constant pool elevations. Utilities: Most utilities do not permit existing underground pipes or dry utilities to be submerged as a result of retrofit construction. It may be possible to submerge water or sewer lines if manholes are raised above the maximum water surface elevation of the pond and if the pipes were originally constructed in a watertight manner. Excavation: Wet ponds normally entail several feet of excavation. Retrofit designers
need to understand the quality of subsoils in terms of their suitability for embankment fill, potential excavation problems and whether they need to be hauled off-site. Available Head: The depth of a wet pond retrofit is usually determined by the head available on the site. The bottom elevation is normally set by the existing downstream conveyance system to which the retrofit discharges (e.g., a stream, channel or pipe). While it is possible to excavate a pool below the outlet invert, this resulting dead storage may not mix well with the rest of the pond, thereby reducing performance and creating nuisance problems. Typically, a minimum of six to eight feet of head are needed to construct a wet pond retrofit. Minimum Setbacks: Local ordinances and design criteria should be consulted to determine minimum setbacks to property lines, structures, and wells. As a general rule, wet pond retrofits should be setback at least 10 feet from property lines, 25 feet from building foundations, 50 feet from septic system fields, and 100 feet from private wells. Depth to Water Table: The depth to the water table can be a design concern for wet pond retrofits. If the water table is close to the surface, it may make excavation difficult and expensive. Groundwater inputs can also reduce the pollutant removal rates. On the other hand, a high groundwater table can help provide a constant pool elevation to maintain a pocket pond when the contributing drainage area is small.
Urban Subwatershed Restoration Manual 3 I-5

Appendix I: Retrofit Design Sheets
Depth to Bedrock: If bedrock layers occur near the surface of a proposed retrofit, it may be too expensive to blast the site to get enough storage volume. Community and Environmental Considerations for Wet Pond Retrofits Wet ponds are readily accepted by communities if they are properly designed and maintained. Pond retrofits, however, can generate several community and environmental concerns: Aesthetic Issues: Many residents feel that wet ponds are an attractive landscape feature, promote a greater sense of community and are an attractive habitat for fish and wildlife. Designers should note that these benefits are often diminished if retrofits are under-sized or have small contributing drainage areas. Existing Wetlands: A wet pond retrofit should not be constructed within an existing natural wetland. Any discharges from the retrofit into an existing natural wetland should be minimized to prevent changes to its hydroperiod. Existing Forests: Construction of wet pond retrofits may involve major clearing of existing forest cover. Designers can expect a great deal of neighborhood opposition if they do not make a concerted effort to save mature trees during retrofit design and layout. Stream Warming Risk: Wet ponds can warm streams by two to 10 degrees Fahrenheit, although this may not be a major problem for degraded urban streams (Galli, 1990). To minimize stream warming, wet pond retrofits should be shaded and provide shorter ED detention times (e.g., 12 hours vs. 24).
Safety Risk: Pond safety is an important community concern, as young children have perished by drowning in wet ponds after falling through the ice. Gentle side slopes and safety benches should be provided to avoid potentially dangerous drop-offs, especially when retrofits are located near residential areas. Residents may request fences around the pond or its outfalls in some retrofit situations. Mosquito Risk: Mosquitoes are not a major problem for larger wet ponds (Santana et al., 1994; Ladd and Frankenburg, 2003). However, fluctuating water levels in smaller or under-sized wet ponds could pose some risk for mosquito breeding. Mosquito problems can be minimized through simple design features and maintenance operations described in Chapter 4 and MSSC (2005). Geese and Waterfowl: Wet ponds with extensive turf and shallow shorelines can attract nuisance populations of resident geese and other waterfowl whose droppings can reduce pond nutrient and bacteria removal. Several design and landscaping features can make a pond retrofit much less attractive to geese (see Schueler, 1992). Wet Pond Retrofit Design Issues Wet pond retrofits are often squeezed into very tight sites, so designers can be tempted to eliminate standard design features in order to obtain maximum pool storage. It is generally advisable to sacrifice some storage volume in order to incorporate design features critical to retrofit performance, function and longevity. The following design features should be included in wet pond retrofits: Pretreatment: Sediment forebays located at major inlets help extend the longevity of wet pond retrofits. Each forebay should be sized
I-6 Urban Subwatershed Restoration Manual 3

Appendix I: Retrofit Design Sheets
to have about 10% of the total retrofit storage volume and have easy access for sediment cleanouts. Long Flow Path: Retrofits should have an irregular shape and a long flow path from inlet to outlet to increase residence time and pond performance (ideally 2:1). Internal berms can be used to extend flow paths and create multiple pond cells. Safety/Access Bench: Retrofits should include a flat bench just outside of the perimeter of the permanent pool to allow for maintenance access and reduce safety risks. The bench can be variable in width (10 to 15 feet). Aquatic Bench: Aquatic benches are shallow areas just inside the perimeter of the normal pool that promote growth of aquatic and wetland plants. The bench also serves as a safety feature, reduces shoreline erosion and conceals floatable trash. In retrofit situations, the aquatic bench can vary in width from three to 10 feet. Avoid Deep Pools: Designers often seek to maximize the depth of a wet pond retrofit to store a greater runoff volume within a smaller footprint. Pool depths greater than eight feet, however, should be avoided in most retrofit situations. Deep ponds can cause seasonal pond stratification that release pollutants stored in bottom sediments back into the water column (and have a much greater safety risk). Wet Pond Retrofit Maintenance Issues
Wet ponds normally have less routine maintenance requirements than other stormwater treatment options. The frequency of maintenance operations may need to be scaled up if retrofits are undersized or have a small contributing drainage area. Designers should consult
CWP (2004b) for more information on wet pond maintenance problems and solutions. Several maintenance issues can be addressed during retrofit design and future maintenance operations: Maintenance Access: Good maintenance access should always be provided to the sediment forebay, access bench, riser and outlet structure so crews can more easily perform maintenance tasks. The riser structure should be placed within the embankment. Sediment Removal: Sediments excavated from wet ponds are not normally classified as toxic or hazardous material, and can be safely disposed by either land application or land filling. Sediment testing may be needed prior to sediment disposal if the retrofit serves a hotspot land use.
Clogging: There is always some risk that the low flow orifice or upstream flow splitter may clog. These aspects of retrofit hydraulics should be inspected frequently after construction. The retrofit should have a pond drain so crews can de-water the pond to relieve clogging and remove sediments. Vegetation Management: The maintenance plan should clearly outline how vegetation in the pond and its buffer will be managed or harvested in the future. Methods to establish desired aquatic plants and control invasive plant species should be outlined. Annual mowing of the pond buffer is only required along maintenance rights-of-way and the embankment. The remaining buffer can be managed as a meadow (mowing every other year) or as forest. Trash Removal: The maintenance plan should schedule a shoreline cleanup at least once a year to remove trash and floatables.
Urban Subwatershed Restoration Manual 3 I-7

Appendix I: Retrofit Design Sheets
Adapting Wet Ponds for Special Climates and Terrain Cold climates: The performance of wet pond retrofits in cold climates can be enhanced when designers:
• Treat larger runoff volumes in the spring
by adopting seasonal operation of the permanent pool (see MSSC, 2005)
• Plant salt-tolerant vegetation in pond benches
• Do not submerge inlet pipes and provide a minimum 1% pipe slope to discourage ice formation
• Locate low flow orifices so they withdraw at least 6 inches below the typical ice layer
• Angle trash racks to prevent ice formation
• Oversize riser and weir structures to avoid ice formation and freezing pipe
• Increase forebay size if road sanding is prevalent in the contributing drainage area
Arid Climates: Wet pond retrofits require special design in regions with low annual rainfall or high evapotranspiration. Ponds are generally not a preferred option if the permanent pool cannot be maintained without supplemental irrigation. Some tips for designing wet ponds in arid climates include the following:
• Pond vegetation flourishes when
temperatures are warm and the growing season is long or year-round, which can result in prolific growth of algae, wetland plants, shrubs and trees (Figure 1). Regular mowing or even plant harvesting should be considered to keep vegetative growth in check.
• Designers should always check to make sure there is an adequate water balance to support a permanent pool throughout the
year- otherwise the potential of algal blooms, odors and other nuisances can increase sharply. When in doubt, install a clay or synthetic liner to prevent water loss via infiltration.
• Arid regions generate higher sediment loads, so designers should consider adding extra sediment trapping capability in retrofit forebays (Caraco, 2000).
Karst Terrain: Deep pools increase the risk of sinkhole formation and groundwater contamination in regions with active karst. Designers should always conduct geotechnical investigations to assess this risk. Pond retrofits in karst areas should include impermeable liners and maintain at least three feet of vertical separation from the underlying rock layer. Wet Pond Installation Costs Wet ponds are more expensive on a unit area basis than constructed wetlands and ED ponds, primarily due to the need for deeper excavation and safety features such as side-slope control and benches (Wossink and Hunt, 2003). Several cost equations (updated to 2006 dollars) can predict the
Figure 1: Warm temperatures have led to algal blooms in this wet pond.
I-8 Urban Subwatershed Restoration Manual 3

Appendix I: Retrofit Design Sheets
base construction cost of new wet ponds, given their proposed storage volume or drainage area treated. Wet Extended Detention Ponds (Brown and Schueler, 1997) BCC = (10.97)(Vs
0.750)
Wet Ponds (Brown and Schueler, 1997) BCC = (263.99)(Vs
0. 553)
Wet Ponds (Wossink and Hunt, 2003) BCC = (17,333)(A 0.672 )
Vs = Total storage volume (ft3) A = area treated (acres) BCC = Base construction cost (2006 dollars) Solving these equations for a range of common pond sizes yields a median construction cost for a new wet pond of $ 8,350 per impervious acre treated (range: $ 3,100 to $28,750). Please note that the wet pond retrofit construction costs are typically 1.5 to 2 times higher than new pond construction (see Chapter 2 and Appendix E).
Wet Pond Design Resources Many existing state and local stormwater manuals provide extensive guidance on wet pond design: Vermont Stormwater Management Manual http://www.anr.state.vt.us/dec/waterq/cfm/ref/Ref_Stormwater.cfm Minnesota Stormwater Management Manual http://www.pca.state.mn.us/water/stormwater/stormwater-manual.html Austin, TX Drainage Criteria Manual http://www.cityofaustin.org/watershed/publications.htm New York State Stormwater Management Design Manual http://www.dec.state.ny.us/website/dow/toolbox/swmanual/index.html Maryland Stormwater Design Manual http://www.mde.state.md.us/Programs/WaterPrograms/SedimentandStormwater/stormwater_design/index.asp
Urban Subwatershed Restoration Manual 3 I-9

Appendix I: Retrofit Design Sheets
I-10 Urban Subwatershed Restoration Manual 3

Appendix I: Retrofit Design Sheets
Retrofit Design Sheets ST-3d
CONSTRUCTED WETLANDS
Typical Constraints Constructed wetlands are subject to several constraints when it comes to retrofitting: Contributing Drainage Area: The contributing drainage area must be large enough to sustain a permanent water level within a stormwater wetland. A minimum of 25 acres of drainage area is typically needed to maintain constant water elevations in humid regions, although the precise area varies based on local hydrology. The minimum drainage area can be relaxed if the bottom of the retrofit intercepts the groundwater table or if designers are willing to accept periodic wetland drawdown. Designers should note that these “pocket” wetlands will have lower pollutant removal, higher excavation costs, and a greater risk of invasive plant colonization. Space Requirements: Wetland retrofits require a footprint ranging between 3 and 5% of the contributing drainage area, depending on the average depth of the wetland and the extent of its deep pool features. Available Head: The depth of a wetland retrofit is usually constrained by the head available on the site. The bottom elevation is fixed by the elevation of the existing downstream conveyance system to which the retrofit will ultimately discharge. Head requirements for constructed wetlands are typically less than wet ponds because of their shallow nature - a minimum of two to four feet of head is usually needed.
Minimum Setbacks: Local ordinances and design criteria should be consulted to determine minimum setbacks to property lines, structures, utilities, and wells. As a general rule, wetland retrofits should be setback at least 10 feet from property lines, 25 feet from building foundations, 50 feet from septic system fields and 100 feet from private wells. Depth to Water Table: The depth to the groundwater table is not a major constraint for constructed wetlands as a high water table can maintain wetland conditions within the retrofit. Designers should keep in mind that high groundwater inputs may reduce pollutant removal rates and increase excavation costs. Community and Environmental Considerations for Constructed Wetlands Constructed wetlands can generate several community and environmental concerns: Aesthetics: Wetland retrofits can create wildlife habitat and become an attractive community feature. Designers should carefully think through how the wetland community will evolve over time, as the future plant community seldom resembles the one initially planted. Constructed wetlands require continual vegetative management to maintain desired wetland species, control woody growth and prevent invasive plants from taking over. Existing Wetlands: It can be tempting to construct a stormwater wetland within an existing natural wetland, but this should
Urban Subwatershed Restoration Manual 3 I-11

Appendix I: Retrofit Design Sheets
never be done unless it is part of a broader effort to restore a degraded urban wetland approved by the local or state wetland review authority. Designers should investigate the wetland status of adjacent areas to determine if the discharge from the constructed wetland will change the hydroperiod of a downstream natural wetland (see Cappiella et al., 2006b, for guidance on minimizing stormwater discharges to existing wetlands). Regulatory Status: Constructed wetlands built for the express purpose of stormwater treatment are not considered jurisdictional wetlands in most regions of the country, but designers should check with their wetland permit authority to ensure this is the case. Existing Forests: Given the large footprint of constructed wetlands, there is a strong chance that construction may cause extensive tree clearing. Designers should preserve mature trees during retrofit layout, and may want to use a wooded wetland concept to create a forested wetland community (see Cappiella et al., 2006b). Stream Warming Risk: Constructed wetlands have a moderate risk of stream warming. If the retrofit discharges to temperature-sensitive waters, designers should consider the wooded wetland design, and any ED storage should be released in less than 12 hours. Safety Risk: Constructed wetlands are safer than other pond options, although forebays and micropools should be designed with benches to reduce safety risks. Mosquito Risk: Mosquito control can be a concern for stormwater wetlands if they are under-sized or have a small contributing drainage area. Few mosquito problems are reported for well designed, properly-sized
and frequently maintained constructed wetlands (Santana et al., 1994) but no design can eliminate them completely. Simple precautions can be taken to minimize mosquito breeding habitat within a wetland retrofit, such as constant inflows, benches that create habitat for natural predators, and constant pool elevations (see Walton 2003 and MSSC, 2005). Design Issues for Constructed Wetland Retrofits Several elements should be considered when designing constructed wetland retrofits: Sediment Forebays: Forebays should be located at all major inlets to trap sediment and preserve the capacity of the main wetland treatment cell. A major inlet is defined as serving at least 10% of the retrofit is contributing drainage area. The forebay should be at least four feet deep, contain about 15% of the total retrofit WQv, and have a variable width aquatic bench.
Constructed Wetland Layout: The layout of the stormwater wetland affects its pollutant removal capability and plant diversity. Performance is enhanced when the wetland has multiple cells, longer flowpaths, and a high surface area to volume ratio. Whenever possible, constructed wetlands should be irregularly shaped with a long, sinuous flow path. Microtopography: Retrofits should have variable microtopography - a mix of shallow, intermediate, and deep areas that promote dense and diverse vegetative cover.
Planting Strategy: Wetland retrofits should outline a realistic, long-term planting strategy to establish and maintain desired wetland vegetation. The plan should indicate how wetland plants will be established
I-12 Urban Subwatershed Restoration Manual 3

Appendix I: Retrofit Design Sheets
within each pondscaping zone (e.g., wetland plants, seed-mixes, volunteer colonization, and tree and shrub stock) and whether soil amendments are needed to get plants started. The future species trajectory of wetland retrofits is hard to predict, so several different strategies should be considered. Several excellent resources on wetland planting strategies are available (Schueler, 1992; and Shaw and Schmidt, 2003).
Wooded Wetland vs. Emergent Wetland Model: The traditional model for constructed wetlands has been a shallow emergent marsh. In many parts of the country, however, forested wetlands are the most common natural wetland community. In these regions, it may be desirable to design the wetland as a wooded wetland to more closely match local wetland types and reduce future wetland management problems (Cappiella et al., 2006a). Maintenance Access: Good maintenance access should always be provided to the forebay so that crews can remove sediments and preserve wetland treatment capacity. More frequent sediment removal will be needed if the retrofit is undersized or has a small contributing drainage area. Maintenance Issues for Constructed Wetland Retrofits Several maintenance issues can be addressed during the design of constructed wetland retrofits: Sediment Removal: Frequent sediment removal from the forebay is essential to maintain the function and performance of a constructed wetland. Maintenance plans should schedule cleanouts every five years or so, or when inspections indicate that 50% of the forebay capacity has been lost. Designers should also check to see whether
removed sediments can be spoiled on-site or must be hauled away. Sediments excavated from constructed wetlands are not usually considered toxic or hazardous, and can be safely disposed by either land application or land filling. Clogging: There is always some risk that the low flow orifice and any upstream flow splitters may clog. Clogging can quickly change design water elevations for the wetland and possibly kill wetland vegetation. The inlet and outlet structures to the wetland should be inspected frequently to discover any clogging problems. Vegetation Management: Managing wetland vegetation is an important ongoing maintenance task. Designers should expect significant changes in wetland species composition over time. Invasive plants should be dealt with as soon as they colonize the wetland. Vegetation may need to be periodically harvested if the retrofit becomes overgrown. Construction contracts should include a care and replacement warranty extending at least two growing seasons after initial planting to selectively replant portions of the wetland that fail to take. Trash Removal: Cleanups should be scheduled at least once a year to remove trash and debris from the retrofit. Adapting Constructed Wetlands for Special Climates and Terrain Cold Climates: Wetland performance decreases when snowmelt runoff delivers high pollutant loads. Shallow constructed wetlands can freeze in the winter, which allows runoff to flow over the ice layer and exit without treatment. Inlet and outlet structures close to the surface may also freeze, further diminishing wetland performance. Several design tips can
Urban Subwatershed Restoration Manual 3 I-13

Appendix I: Retrofit Design Sheets
improve wintertime performance for wetland retrofits (see Profile Sheets ST-1d and ST-2d).
Salt loadings are higher in cold climates due to winter road maintenance. High chloride inputs have a detrimental effect on native wetland vegetation, and can shift the wetland to more salt-tolerant species such as cattails (Wright et al., 2007). Designers should choose salt-tolerant species when crafting their planting plan and consider reducing salt application in the contributing drainage area to the retrofit.
Arid Climates: Constructed wetlands are hard to establish in regions with low annual rainfall and high evapotranspiration rates. These climates make it difficult to maintain a constant pool water elevation throughout the growing season. Designers should always check to make sure there is an adequate water balance to support a wetland throughout the year - otherwise the potential of algal blooms, odors and other nuisances will increase sharply. When in doubt, install clay or synthetic liners to prevent water loss via infiltration. Wetland vegetation flourishes when temperatures are warm and the growing season is long or year-round. Regular mowing or even harvesting should be considered to keep vegetative growth in check.
Karst Terrain: Even shallow pools in active karst terrain can increase the risk of sinkhole formation and groundwater contamination. Designers should always conduct geotechnical investigations in karst terrain to assess this risk. If in doubt, designers should employ an impermeable liner and maintain at least three feet of vertical separation from the underlying karst layer.
Constructed Wetland Installation Costs Constructed wetlands are less expensive on a unit area basis than wet ponds and extended detention ponds since they require less excavation and need fewer safety features (Wossink & Hunt, 2003). On the other hand, some constructed wetlands have a larger surface footprint. These construction cost savings may disappear if land must be acquired to install the retrofit. Wossink and Hunt (2003) developed an equation to predict the cost of new wetland construction based on the acreage of the contributing drainage area treated (updated to 2006 dollars): BCC = (4,465)(A0.484)
Where: A = Size of contributing drainage area
(acres) BCC = Base construction cost (2006 dollars)
Brown and Schueler (1997) devised a similar equation for new wetland and pond construction based on storage volume needed that yields slightly higher costs: BCC = (27.95)(Vs
0.701) Where: Vs = Total storage volume (ft3) BCC = Base construction cost (2006 dollars) Based on typical wetland sizes, the equations yield a median construction cost of $2,900 per impervious acre treated (range: $2,000 to $9,600). Few retrofit sites will meet the criteria for use of these equations. Under most retrofit conditions, wetland retrofit construction costs will be 3 to 4 times greater than new wetland construction (see Chapter 2 and Appendix E).
I-14 Urban Subwatershed Restoration Manual 3

Appendix I: Retrofit Design Sheets
Constructed Wetland Design Resources Vermont Stormwater Management Manual http://www.anr.state.vt.us/dec/waterq/cfm/re
f/Ref_Stormwater.cfm Connecticut 2004 Stormwater Management
Manual http://dep.state.ct.us/wtr/stormwater/strmwtr
man.htm#download Stormwater Management Manual for
Western Washington http://www.ecy.wa.gov/programs/wq/storm
water/manual.html Minnesota Stormwater Manual http://www.pca.state.mn.us/water/stormwate
r/stormwater-manual.html
Urban Subwatershed Restoration Manual 3 I-15

Appendix I: Retrofit Design Sheets
I-16 Urban Subwatershed Restoration Manual 3

Appendix I: Retrofit Design Sheets
Retrofit Design Sheets ST-4d
BIORETENTION Typical Constraints Bioretention can be applied in most soils or topography since runoff percolates through an engineered soil bed and is returned to the stormwater system. Key constraints when retrofitting with bioretention include: Available Space: Not every open area will be a good candidate for bioretention. To start with, designers should look for open areas that are at least five to 10% of the contributing drainage area and are free of underground utilities. Site Topography: Bioretention is best applied when contributing slopes are more than 1% and less than 5%. Ideally, the proposed treatment area will be located in depression to minimize excavation costs. Available Head: Bioretention retrofits are fundamentally constrained by the invert elevation of the existing conveyance system they discharge to. These elevations generally establish the bottom elevation needed to tie the underdrain from the bioretention area into the storm drain system. In general, four to five feet of elevation above this invert is needed to drive stormwater through a proposed bioretention area. Less head is needed if underlying soils are permeable enough to dispense with the underdrain. Water Table: Bioretention should always be separated from the water table to ensure groundwater does not intersect with the filter bed. Mixing can lead to possible
groundwater contamination or practice failure. A separation distance of 3 feet is recommended between the bottom of the filter bed and the seasonally high water table. Overhead Wires: Designers should also check whether future tree growth in the bioretention area will interfere with existing overhead utility lines.
Soils: Soil conditions do not constrain the use of bioretention although they determine whether an underdrain is needed. Impermeable soils in Hydrologic Soil Group C or D usually require an underdrain, whereas A or B soils often do not. Designers should verify soil permeability when designing a bioretention retrofit, using the on-site soil investigation methods presented in Appendix H. Community and Environmental Considerations for Bioretention Retrofits Bioretention is a popular practice, since it can meet local landscaping requirements and improve site appearance. The only major drawbacks relate to who will handle future landscape maintenance and whether landowners will modify or replace the bioretention area in the future. If bioretention areas will be installed on private lots, homeowners need to be educated on their routine maintenance tasks and fully understand their intended stormwater function.
Urban Subwatershed Restoration Manual 3 I-17

Appendix I: Retrofit Design Sheets
Design Issues for Bioretention Several issues should be considered when designing bioretention retrofits: Pretreatment: Pretreatment can prevent premature clogging and prolong the effective function of bioretention retrofits. Several pretreatment measures can be used, including directing runoff over a grass filter strip, adding a three to six inch drop or installing a pea gravel diaphragm that spreads flow evenly and drops out larger sediment particles. A two-cell design is recommended when bioretention is used as a storage retrofit or for larger on-site applications. The first cell is a sediment forebay that pretreats runoff and traps sediment before discharge into the main bioretention cell. Landscaping is critical to the function and appearance of bioretention areas. Where possible, a combination of native trees, shrubs, and herbaceous plant species are preferred. Plants should be able to tolerate both wet and dry conditions. Most upland vegetation does not do well in the deepest center areas that are more frequently inundated. “Wet footed” plants, such as wetland forbs, should be planted near the center, whereas upland species are better for the edges of the bioretention area. Regional lists of plant species suitable for bioretention areas can be found at the end of this profile sheet. Type of media: The choice of filter media is important to provide adequate drainage, support plant growth and optimize pollutant removal within the filter bed. Early design guidance recommended a mix of 50-60% sand, 20-30% topsoil and 20-30% organic leaf compost. The topsoil component should consist of loamy sand, sandy loam, or loam with a clay content no greater than 5%.
Hunt and Lord (2006a) has recently advocated a bioretention soil mix with a greater proportion of sand (85-88% sand; 8-12% fines; and 3-5% organic matter) as a more effective choice for pollutant removal. They also strongly recommend that topsoil be tested to ensure that it has a low phosphorus index value to prevent phosphorus leaching. If nitrogen removal is the goal, it may be advisable to increase the percentage of soil fines. Designers should also ensure that the media is well mixed and homogeneous. The media should have an infiltration rate of 1.0 to 2.0 inches per hour as recent research indicates that pollutant removal is optimized in this range.
Depth of Media: Early bioretention design guidance recommended a minimum filter bed depth of 4 feet. However, the filter bed may be reduced in depth to 1.5 to 2.5 feet in certain retrofit applications, particularly when available head is limited. Research has shown that good pollutant removal can still be achieved in filter beds as shallow as 1.5 feet, with the possible exception of nitrogen (Davis, 2005, and Hunt et al., 2006). It is doubtful that filter beds less than 1.5 feet deep can provide reliable pollutant removal efficiency over the long run. Designers should also remember that filter beds need to be at least 4 feet deep to provide enough soil volume for the root structure of mature trees (i.e., use turf, perennials or shrubs instead of trees for shallower filter beds). Underdrain: In many bioretention retrofits, filtered runoff will be collected by a perforated underdrain and conveyed to the storm drain system. If the site has permeable soils, however, the underdrain can be reduced or eliminated altogether. The need for an underdrain depends on the
I-18 Urban Subwatershed Restoration Manual 3

Appendix I: Retrofit Design Sheets
permeability of the underlying soils, which have often been previously altered or compacted in many retrofit situations. Soil permeability rates should always be verified when designing a bioretention retrofit (see Appendix H). If an underdrain is required at a bioretention retrofit, it should have a minimum diameter of 6 inches and be placed in a foot deep gravel bed. Overflow: Designers should always incorporate an overflow structure to safely bypass larger storms around the bioretention retrofit. The invert of the overflow should be placed at the maximum water surface elevation of the bioretention area, which is typically 6 to 12 inches above the surface of the filter bed. Surface Cover: A three-inch layer of hardwood mulch on the surface of the filter bed enhances plant survival, suppresses weed growth, and pretreats runoff before it reaches the filter bed. Shredded hardwood bark mulch makes a very good surface cover, as it retains a significant amount of nitrogen and typically will not float away. On the other hand, hardwood mulch needs to be replaced every few years, may not be durable or attractive enough for certain retrofit situations, and may not be available in some regions of the country. In these situations, designers may wish to consider alternative covers such as turf, river stone, gravel or pumice stone. Contributing Drainage Area: Designers should always verify that the actual contributing area and inlet elevations are accurately determined at the retrofit site. Designers should walk the site during a rainstorm to look at actual flowpaths to the proposed treatment area, and confirm these boundaries using fine resolution topographic surveys.
Bioretention Maintenance Issues Bioretention requires seasonal landscaping maintenance to establish and maintain vigorous plant cover: Vegetation Management: Vegetation management is an important to sustain the pollutant removal and landscaping benefits of the bioretention area. The construction contract should include a care and replacement warranty to ensure vegetation gets properly established and survives during the first growing season after construction.
Surface Cover/Filter Bed: The surface of the filter bed can become clogged with fine sediments over time. Core aeration or deep tilling may relieve the problem. The surface cover layer will need to be removed and replaced every two or three years. The inlets and pretreatment measures for the bioretention retrofit also need frequent inspections to ensure they are working properly and to remove deposited sediments.
Training Landscape Contractors: Maintenance can be performed by landscaping contractors who are already providing similar landscaping services on the property, but they will need training on bioretention maintenance tasks. Adapting Bioretention for Special Climates and Terrain Bioretention areas can be applied almost everywhere, with the proper design modifications: Arid Climates: Bioretention areas should be landscaped with drought-tolerant plant species. A xeriscaping approach is preferred since supplemental irrigation makes little sense in arid and semi-arid climates. It may
Urban Subwatershed Restoration Manual 3 I-19

Appendix I: Retrofit Design Sheets
also be advisable to switch from mulch to a more durable surface cover such as riverstone or pumice. The planting plan may also have fewer trees and plants to minimize the need for supplemental irrigation. Designers should recognize that longer growing seasons increase both the frequency and cost of landscape maintenance. Cold Climates: Bioretention areas can be used for snow storage as long as an overflow is provided and they are planted with salt-tolerant, non-woody plant species (for a species list, consult MSSC, 2005). While several studies have shown that bioretention operates effectively in winter conditions, it is a good idea to extend the filter bed and underdrain pipe below the frost line and/or oversize the underdrain by one pipe size to reduce the freezing potential. Karst Terrain: Bioretention should utilize impermeable liners and underdrains when located in an active karst area. A geotechnical investigation may be needed to confirm that three feet of vertical separation exists from the underlying rock layer.
Bioretention Installation Costs The cost to construct bioretention areas are extremely variable, and are strongly influenced by the area treated, the depth of filter bed, the presence or absence of an underdrain and whether it is professionally designed, installed or landscaped. Wossink and Hunt (2003) report that bioretention has the lowest construction costs of all new stormwater treatment options serving smaller drainage areas from 1 to 5 acres. On the other hand, the unit costs to retrofit bioretention in highly urban settings may be 10 to 20 times higher (See Appendix E). The long-term maintenance costs for bioretention areas are not expected to be very different from normal landscaping maintenance costs.
Brown and Schueler (1997) developed equations to predict the base construction cost of bioretention as a function of the water quality volume provided. When these equations are adjusted to 2006 dollars, they yield: BCC = (7.62)(WQv
0.990)
Where: WQv = Water quality volume (ft3) BCC = Base construction cost (2006 dollars) More recently, Wossink and Hunt (2003) developed equations to predict the cost of new bioretention construction as a function of their contributing drainage area. This equation yields lower cost estimates compared to the Brown equation: BCC = (11,781)(A1.088)
Where: A = Size of contributing drainage area
(acres) BCC = Base construction cost (2006 dollars) Using these equations, it is possible to establish median bioretention costs of $25,400 per impervious acre treated (range: $19,900 to $41,750). Construction cost drops sharply when site soils are permeable enough to dispense with an underdrain (although this is not a common retrofit situation).
I-20 Urban Subwatershed Restoration Manual 3

Appendix I: Retrofit Design Sheets
Bioretention Design Resources Low Impact Development Technical Guidance Manual for Puget Sound, WA http://www.psat.wa.gov/Publications/LID_tech_manual05/lid_index.htm
Several state and local stormwater manuals provide useful bioretention design guidance: Prince George’s Co., MD Bioretention Manual
Wisconsin Stormwater Management Technical Standards http://www.dnr.state.wi.us/org/water/wm/nps/stormwater/techstds.htm#Post
http://www.goprincegeorgescounty.com/Government/AgencyIndex/DER/ESD/Bioretention/bioretention.asp?nivel=foldmenu(7) Lake Co., OH Bioretention Guidance Manual
Maryland Stormwater Design Manual http://www.mde.state.md.us/Programs/WaterPrograms/SedimentandStormwater/stormwater_design/index.asp http://www2.lakecountyohio.org/smd/Forms
.htm
Urban Subwatershed Restoration Manual 3 I-21

Appendix I: Retrofit Design Sheets
I-22 Urban Subwatershed Restoration Manual 3

Appendix I: Retrofit Design Sheets
Retrofit Design Sheets ST-5d
FILTRATION Typical Constraints Stormwater filters can be applied in most regions of the country and most types of urban land. It is important to note that stormwater filters are not always cost-effective to retrofit on a widespread basis, given their high unit cost and small area served. Design constraints for filter retrofits include: Available Head: The principal retrofit constraint for stormwater filters is available head which is defined as the vertical distance between the top elevation of the filter and the bottom elevation of the existing storm drain system that accepts its runoff. Designers can quickly estimate available head at a proposed retrofit site by locating the closest stormwater inlet or manhole. The difference in elevation between the surface and the invert elevation of the underground storm drain pipe gives a rough approximation of the available head. The head required for stormwater filters ranges from two to ten feet, depending on the design variant. Thus, it is difficult to employ filters in extremely flat terrain since they require gravity flow through the filter. The one exception is the perimeter sand filter, which can be applied at sites with as little as two feet of head. Contributing Drainage Area: Sand filters are best applied on small sites that are as close to 100% impervious as possible. A maximum contributing drainage area of five acres is recommended for surface sand
filters, and a maximum contributing drainage area of two acres is recommended for perimeter or underground filters (Claytor and Schueler, 1996). Filters have been used on larger drainage areas in the past, but they tend to experience greater clogging problems.
Space Required: The amount of space required for a filter retrofit depends on the design variant selected. Both sand and organic surface filters typically consume about 2 to 3% of the contributing drainage area, while perimeter sand filters typically consume less than 1%. Underground stormwater filters generally consume no surface land except manholes needed for maintenance access. Community and Environmental Concerns for Filter Retrofits Stormwater filters have a few community and environmental concerns: Aesthetics: The main drawback with stormwater filters is their appearance - many are imposing concrete boxes that tend to accumulate a lot of trash and debris. Retrofit designers should try to soften up the appearance of surface filters and make sure they are routinely maintained. Mosquito Breeding: There is a risk that underground and perimeter filters may create potential habitat for mosquito breeding. If this is a concern, designers
Urban Subwatershed Restoration Manual 3 I-23

Appendix I: Retrofit Design Sheets
should keep standing water in sedimentation chambers to a minimum. Groundwater: Filters are recommended when groundwater protection is an issue since they do not normally interact with groundwater and therefore have less potential to contaminate it. Design Issues for Filter Retrofit Applications Several unique design issues are involved with filter retrofits, as follows: Pretreatment: Adequate pretreatment is needed to prevent premature filter clogging and ensure retrofit longevity. Either wet or dry pretreatment chambers can be used to capture and remove coarse sediment particles before they reach the filter bed. Designers should allocate at least 25% of the total WQv to pretreatment. Additional pretreatment measures may include a grass filter strip installed prior to the filter and regular sweeping of the street or parking lot. If a proprietary filter is used, designers should check to see whether the device has adequate pretreatment volume. The sedimentation chamber should be designed to allow maintenance crews to get vactor trucks close to the retrofit for cleanouts.
Type of Media: The normal filter media consists of clean, washed concrete sand with individual grains between 0.02 and 0.04 inches in diameter. Alternatively, organic media can be used, such as a peat/sand mixture or a leaf compost mixture. The decision to use organic media in a stormwater filter depends on which stormwater pollutants are targeted for removal. Organic media may enhance pollutant removal performance with respect to metals and hydrocarbons (Claytor & Schueler, 1996). Recent research, however,
has shown that organic media can actually leach soluble nitrate and phosphorus, suggesting it is a poor choice when nutrients are the pollutant of concern.
Type of Filter: The choice of which sand design filter design to apply depends on available space and head, and the desired level of pollutant removal. In ultra-urban situations where surface space is at a premium, underground sand filters are often the only design that can be used. Surface and perimeter filters are often a more economical choice when adequate surface area is available. Depth of Media: The depth of the filter media plays a role in how quickly stormwater moves through the filter bed and how well it removes pollutants. Recent design guidance recommends that a minimum filter bed depth ranging from 18 and 24 inches. Impervious Drainage Area: In retrofit situations, the contributing drainage area should be as close to 100% impervious as possible in order to reduce the risk that eroded sediments will clog the filter.
Overflow: Most filtering practices are designed as off-line systems so that all flows enter the filter, but larger flows overflow to an outlet chamber, and are not treated. Exceptions include the perimeter filter and most underground filters. Runoff from larger storm events should be bypassed using an overflow structure or a flow splitter. Claytor and Schueler (1996) and ARC (2001) provide design guidance for flow splitters for filtering practices.
Drawdown: Stormwater filters should be designed to drain or dewater within 48 hours after a storm event to reduce the potential for nuisance conditions.
I-24 Urban Subwatershed Restoration Manual 3

Appendix I: Retrofit Design Sheets
Maintenance Issues for Filter Retrofits Several maintenance issues can addressed during retrofit design to reduce future maintenance operations, including: Access: Good maintenance access is needed to allow crews to perform regular inspections and maintenance activities. Stormwater filters should be clearly visible at the retrofit site so inspectors and maintenance crews can easily find them. Adequate signs or markings should be provided at manhole access points for underground filters. Confined Space Issues: Underground filters are often classified as an underground confined space. Consequently, special OSHA rules and training are needed to protect the workers that access them. These procedures often involve training on confined space entry, venting and the use of gas probes. Sediment/Filter Bed Removal: Sediments will need to be regularly removed from the pretreatment chamber every three to five years. The filter bed media may also need to be replaced on the same schedule. Site Inspections: Regular site inspections are critical to schedule sediment removal operations, replace filter media and relieve any surface clogging. Frequent inspections are especially needed for underground and perimeter filter retrofits since they are out of sight and can be easily forgotten. Sediment Testing: Designers should check to see whether the filter is treating runoff from a hotspot site. If so, crews may need to test sediments before disposing of trapped sediments or filter bed media. Sediment testing is not needed if the filter does not
receive runoff from a designated stormwater hotspot.
Adapting Filters for Special Climates and Terrain Stormwater filters can be successfully employed when certain design modifications are made: Cold Climates: Surface or perimeter filters may not always be effective during the winter months. The main problem is ice that forms over and within the filter bed. Ice formation may briefly cause nuisance flooding if the filter bed is still frozen when spring melt occurs. To avoid these problems, filters should be inspected before the onset of winter (prior to the first freeze) to dewater wet chambers and scarify the filter surface. Other measures to improve winter performance include:
• Placing a weir placed between the
pretreatment chamber and filter bed to reduce ice formation as a more effective substitute than a traditional standpipe orifice.
• Extending the filter bed below the frost line to prevent freezing within the filter bed
• Oversizing the underdrain to encourage more rapid drainage to minimize freezing of the filter bed
• Expanding the sediment chamber to account for road sanding. Pretreatment chambers should be sized for up to 40% of the WQv
Arid Climates: Designers may want to increase storage in the pretreatment chamber to handle higher sediment loads expected in arid climates. Dry sedimentation chambers should be sized up to 40% of the WQv. Wet pretreatment is seldom feasible in arid climates.
Urban Subwatershed Restoration Manual 3 I-25

Appendix I: Retrofit Design Sheets
Karst Terrain: Stormwater filters are a good option in active karst areas since they are not connected to groundwater and therefore minimize the risk of sinkhole formation and groundwater contamination. Installation Costs for Filtering Practices Stormwater filters have one of the highest unit construction costs of any stormwater treatment option treating small drainage areas. The cost to construct a stormwater filter depends on the region and design variant used (Table 1). For surface sand filters, Brown and Schueler (1997) reported construction costs ranging between about $3.00 and $8.00 per cubic foot of water quality volume treated (2006 dollars). Wossink and Hunt (2003) developed a cost prediction equation for stormwater filter construction based on drainage area treated. The updated equation is: BCC = (55,515)(A0.882)
Where: A = Size of contributing drainage area
(acres) BCC = Base construction cost (2006 dollars) While underground and perimeter sand filters are the most expensive filtering practice, they consume minimal surface land, making them a cost-effective practice
in ultra-urban areas where land prices are at a premium. Design Resources Several existing stormwater manuals provide useful guidance on stormwater filter design: District of Columbia Stormwater Management Guidebook http://dchealth.dc.gov/DOH/site/default.asp?dohNav=|33110| The Minnesota Stormwater Manual http://www.pca.state.mn.us/water/stormwater/stormwater-manual.html Maryland Stormwater Design Manual http://www.mde.state.md.us/Programs/WaterPrograms/SedimentandStormwater/stormwater_design/index.asp Design of Stormwater Filtering Systems. Center for Watershed Protection http://www.cwp.org/PublicationStore/special.htm Georgia Stormwater Management Manual http://www.georgiastormwater.com
Table 1: Construction Costs for Various Stormwater Filters (2006 Dollars)
Design Variant Median Cost Per Impervious Acre Treated
Range in Cost
Simple Surface Filter $ 18,150 $ 10,900 to $29,000 Structural Sand Filter $ 72,000 $ 58,100 to $79,900 Underground Sand Filter $ 234,000 $ 100,800 to $ 270,000 See Appendix E: Simple surface filter lacks structural elements and reinforced concrete
I-26 Urban Subwatershed Restoration Manual 3

Appendix I: Retrofit Design Sheets
Retrofit Design Sheets ST-6d
INFILTRATION Typical Constraints Numerous constraints need to be assessed to ensure infiltration is feasible at a proposed retrofit site, including: Soils: Soil permeability is the single biggest factor when evaluating infiltration retrofits. A minimum infiltration rate of at least 0.5 inches/hour is needed to make the retrofit work. Several studies have shown that ultimate infiltration rates decline by as much as 50% from initial rates, so designers should be very conservative and not force infiltration on questionable soils. On-site infiltration investigations should always be conducted to establish the actual infiltration capacity of underlying soils using methods presented in Appendix H.
Avoid Stormwater Hotspots: Never infiltrate runoff from a hotspot operation. Make sure to conduct a HSI on all operations in the contributing area to determine the potential risk of groundwater contamination. If a site is classified as a stormwater hotspot, then runoff must be fully treated by another practice prior to infiltration. Contributing Drainage Area: Infiltration retrofits are best applied to small contributing drainage areas that are as close to 100% impervious as possible. If the contributing contains any pervious area, it must be properly stabilized with dense vegetation, both during and after construction, to prevent eroded sediments from prematurely clogging the facility.
Additionally, the maximum contributing drainage area to an infiltration trench should be limited to one acre or less. The maximum contributing drainage area to underground infiltration systems should be limited to five acres or less. Infiltration practices serving larger drainage areas tend to experience more chronic clogging problems. Space Required: The typical footprint of an infiltration retrofit ranges from 5 to 10% of its contributing drainage area, but varies depending on its depth, storage void, space, and infiltration rate.
Minimum Setbacks: As a general rule, infiltration retrofits should be setback at least 10 feet from property lines, 25 feet from building foundations, 100 feet from septic system fields, 100 feet from private wells, 100 feet from surface waters, 400 feet from surface drinking water sources and 1,200 feet from public water supply wells. Depth to Water Table/Bedrock: Infiltration retrofits should be separated at least three feet from the water table to ensure groundwater never intersects with the floor of the infiltration practice, which could cause groundwater contamination or practice failure. A three foot separation distance should be maintained between the bottom of the infiltration retrofit and any confining bedrock layer.
Urban Subwatershed Restoration Manual 3 I-27

Appendix I: Retrofit Design Sheets
Community and Environmental Considerations for Infiltration Retrofits Several community and environmental concerns can arise when infiltration retrofits are proposed: Nuisance Conditions: Poorly designed infiltration retrofits can create potential nuisance problems such as basement flooding, poor yard drainage and standing water. In most cases, these problems can be minimized through adequate setbacks, on-site soil testing and pretreatment.
Mosquito Risk: Infiltration retrofits can potentially create mosquito breeding conditions if they clog and have standing water for extended periods. Groundwater Protection: Communities that rely on groundwater for drinking water are often concerned about potential stormwater contamination. Designers should investigate the prevailing land use in the contributing drainage area. Runoff from potential stormwater hotspots should never be infiltrated. For residential and institutional land uses, infiltration is desirable since it replenishes groundwater supplies. Infiltration retrofits in these areas should have over-sized and redundant pretreatment to reduce the risk that stormwater pollutants or spills will reach groundwater. Groundwater Injection Permits: Groundwater injection permits may be required in some areas of the country. Designers should investigate whether or not a proposed infiltration retrofit is subject to a state or local groundwater injection permit.
Design Issues for Infiltration Retrofit Applications The design of infiltration retrofits should be more conservative than the design of new infiltration practices to promote longevity. A series of design elements can minimize the risk of practice failure: Pretreatment is essential to extend the longevity of infiltration retrofits. Designers should include at least two pretreatment measures in every retrofit, such as grass swales, filter strips, sump pits, sediment forebays or plunge pools. Off-line Design: Infiltration retrofits should be designed off-line so they only receive the target WQv and bypass larger storm flows. A flow splitter or overflow structure can be used for this purpose; design guidance for small flow splitters can be found in Claytor and Schueler (1996) and ARC (2001). Small Contributing Drainage Areas: The contributing drainage area to each infiltration retrofit should be less than one acre, and be distributed in multiple locations around the site. Ideally, the contributing drainage area should be entirely impervious to preclude the possibility that eroded sediments from pervious areas will clog the retrofit. Designers should also try to keep the depth of the infiltration retrofit to less than four to six feet. Rapid Drawdown: When possible, infiltration retrofits should be sized so that the target WQv rapidly infiltrates within 24 to 36 hours (rather than the standard 48 hour drawdown limit for new practices). This design approach provides a factor of safety to prevent nuisance ponding conditions.
I-28 Urban Subwatershed Restoration Manual 3
Appendix I: Retrofit Design Sheets
Conservative Infiltration Rates. Underlying soils should have a minimum infiltration rate of at least 0.5 inches per hour. Several test pits are needed to measure the infiltration rates across a proposed retrofit site. Appendix H provides guidance on performing infiltration testing. However, infiltration rates of 1.0 to 2.0 inches per hour are ideal. Designers may wish to cut measured infiltration rates in half to approximate the long term infiltration rate.
No Filter Fabric on Bottom: The use of geotextile filter fabric along the bottom of infiltration retrofits should be avoided. Experience has shown that filter fabric is prone to clogging, and that a layer of coarse washed stone (choker stone) is a more effective substitute.
Figure 1: Failed Infiltration Trench
Observation Wells: One or more observation wells should be installed within infiltration retrofits so that drawdown rate can be measured after storm events. Observation wells typically consist of perforated PVC pipes that are four to six inches in diameter and extend from the surface to the bottom of the infiltration retrofit. Maintenance Issues with Infiltration Retrofits Historically, infiltration practices have had a high failure rate compared to other stormwater treatment options (Galli, 1992). A conservative retrofit design approach should greatly reduce the risk of initial retrofit failure (Figure 1). Even so, the future performance of infiltration requires a strong commitment to regular inspection and maintenance. Designers should only choose infiltration when they are confident that the landowner or municipal agency will be a responsible maintainer in the future. The
maintainer should be expected to handle the following ongoing tasks:
Site Inspections: Regular site inspections are critical to the performance and longevity of infiltration retrofits. The drawdown rate of the retrofit should be measured at the observation wells at least twice a year. It is recommended that infiltration rates be checked in observation wells three days following a storm event greater than one half inch in depth. If standing water is still observed in the well after three days, this is a clear sign that that clogging has become a problem. Additionally, pretreatment devices and flow diversion structures should be checked for sediment buildup and structural damage. Sediment Removal/Trench Reconstruction: Sediment will need to be regularly removed from pretreatment facilities. If major clogging occurs, the practice may need to be reconstructed. Good maintenance access is needed to allow crews and heavy equipment to perform maintenance tasks.
A maintenance plan should be created that identifies the party responsible for maintenance and specifies ongoing maintenance tasks over a prescribed schedule.
Urban Subwatershed Restoration Manual 3 I-29

Appendix I: Retrofit Design Sheets
Installation Costs for Infiltration Retrofits
Adapting Infiltration for Special Climates and Terrain
Very little construction cost information about infiltration practices is available. Because their construction methods are similar, the cost for infiltration practices are assumed to be comparable to bioretention areas (Appendix E). Consequently, the cost to construct infiltration practices at new development sites is estimated to be $25,400 per impervious acre treated (range: $19,900 to $41,750). Few retrofit sites will meet new development conditions; however, most retrofits will cost 1.5 to 2.0 times more than new infiltration practices.
Although infiltration practices have been successfully employed in both cold and arid climates, several design modifications are needed to ensure they function properly: Cold Climates: Infiltration retrofits are generally not feasible in extremely cold climates experiencing permafrost, but they can be designed to withstand more moderate winter conditions. The main problem is ice forming in the voids or the subsoils below which may briefly cause nuisance flooding when spring melt occurs. These problems can be avoided if the bottom of the retrofit extends below the frost line.
Infiltration Design Resources Several recent stormwater manuals present updated design criteria for infiltration practices:
If the retrofit treats roadside runoff, it may be desirable to divert flow in the winter to prevent movement of chlorides into groundwater and prevent clogging by road sand. Alternatively, pretreatment measures can be oversized to account for the additional sediment load caused by road sanding (up to 40% of the WQv). Care should be taken to ensure that infiltration retrofits are setback at least 25 feet from roadways to prevent potential frost heaving of road pavements.
New Jersey Stormwater Best Management Practices Manual http://www.nj.gov/dep/watershedmgt/bmpmanualfeb2004.htm Pennsylvania Draft Stormwater Best Management Practices Manual http://www.dep.state.pa.us/dep/subject/advcoun/Stormwater/stormwatercomm.htm
Arid Climates: The key concern in arid and semi-arid watersheds is the greater risk of potential clogging due to higher sediment loads. Consequently, over-sized pretreatment should be strongly emphasized, and the contributing drainage area should be kept as close to 100% impervious as possible.
Green Technology: The Delaware Urban Runoff Management Approach http://www.dnrec.state.de.us/DNREC2000/Divisions/Soil/Stormwater/New/GT_Stds%20&%20Specs_06-05.pdf New York State Stormwater Management Design Manual
Karst Terrain: Infiltration retrofits should not be used in active karst regions unless geotechnical investigations have eliminated concerns about sinkhole formation and groundwater contamination.
http://www.dec.state.ny.us/website/dow/toolbox/swmanual/index.html
I-30 Urban Subwatershed Restoration Manual 3

Appendix I: Retrofit Design Sheets
Retrofit Design Sheets ST-7d
SWALES
Typical Constraints Constraints to consider when evaluating a potential swale retrofit include: Contributing Drainage Area: The maximum contributing drainage area to a swale retrofit should be five acres and preferably less. Space Required: Swale retrofits usually consume about five to 15% of their contributing drainage area. Site Topography: Site topography constrains swale retrofits; some gradient is needed to provide water quality treatment but not so much that treatment is impeded. Swales generally work best on sites with relatively flat slopes (e.g., less than 5% slope for grass channels and 2% for wet and dry swales). Steeper slopes create rapid runoff velocities that can cause erosion and do not allow enough contact time for infiltration or filtering. Swales perform poorly in extremely flat terrain because they lack enough grade to create storage cells, and lack head to drive the system. Available Head: A minimum amount of head is needed to implement each swale retrofit. Dry swales typically require three to five feet of head since they require a filter bed and underdrain. Wet swales require about two feet of head, whereas grass swales need only a foot. Designers should measure gradient in the field to ensure enough head exists to drive the swale retrofit.
Hydraulic Capacity of Existing Open Channel: Most open channels were originally sized with enough capacity to convey runoff from the ten-year storm, and be non-erosive during the two-year design storm event. In many cases, the open channel may be under-capacity due to upstream development or past sedimentation. The capacity of the existing open channel should be verified during the retrofit project investigation. Field observations that may indicate an existing channel is undersized channel include excessive erosion of the channel side slopes, poor vegetative stabilization and overbank debris.
Width of Existing Right of Way or Easement: Designers should investigate whether the existing right of way or stormwater easement is wide enough to accommodate retrofit construction and maintenance access. In most cases, the existing channel will need to be widened or flows split into adjacent off-channel treatment cells. Depth to Water Table: Designers should separate the bottom of the swale from the groundwater by at least two feet for dry swales and grass channels. It is permissible to intersect the water table for wet swales, since the pool enhances water quality treatment. Soils: Soil permeability influences which swale design variant will work best in the existing channel. Designers should note that past construction and compaction may have severely reduced the permeability of the
Urban Subwatershed Restoration Manual 3 I-31

Appendix I: Retrofit Design Sheets
original swale soils. Several on-site tests should be conducted at the proposed retrofit to measure actual soil infiltration retrofit rates (see Appendix H). In general, grass swales are restricted to soils in Hydrologic Soil Groups A or B. Dry swales also work well on these soils, but can be applied to more impermeable C or D soils if an underdrain is used. Wet swales work best on more impermeable C or D soils. Utilities: Many utilities run along or underneath open channels, so designers should always check for utility lines or crossings at each swale retrofit site. The presence of dry or wet utilities usually renders a swale retrofit infeasible. Community and Environmental Considerations for Swale Retrofits Swale retrofits are normally accepted by communities if they are properly designed and maintained, but require approval by multiple landowners to secure additional right of way. The main concerns of adjacent residents are perceptions that swale retrofits will create nuisance conditions or will be hard to maintain. Common concerns include the continued ability to mow grass, landscape preferences, weeds, standing water, and mosquitoes. For these reasons, wet swales are not recommended in residential settings - the shallow, standing water in the swale is often viewed as a potential nuisance by homeowners. Dry swales are a much better alternative. Key Design Issues for Swale Retrofits Several design elements can ensure the swale retrofit performs effectively over the long run: Pretreatment: Adequate pretreatment is needed to trap sediments before they reach the main treatment cell of the swale retrofit.
A small sediment forebay located at the upstream end of the swale often works best. A pea gravel flow spreader along the top of each bank can pretreat lateral runoff from the road shoulder to the swale.
Swale Dimensions: Swales should have a bottom width ranging from two to eight feet to ensure an adequate surface area exists along the bottom of the swale for filtering. If a swale will be wider than eight feet, designers should incorporate berms, check dams, level spreaders or multi-level cross sections to prevent braiding and erosion within the swale bottom. Swale retrofits should be designed with a parabolic or trapezoidal cross section and have side slopes no steeper than 3:1 (h:v). Designers should seek side slopes much less than 3:1 to promote more treatment of lateral sheet flow, if space is available.
Ponding Depth: Drop structures or check dams can be used to create ponding cells along the length of the swale. The maximum ponding depth in a swale should not exceed 18 inches at the most downstream point. The average ponding depth throughout the swale should be 12 inches.
Drawdown: Dry swale retrofits should be designed so that the desired WQv is completely filtered within six hours or less. This drawdown time can be achieved by using a sandy soil mix or an underdrain along the bottom of the swale. No minimum drawdown time is required for wet swale retrofits. Swale Media: Dry swales require replacement of native soils with a prepared soil media. The soil media provides adequate drainage, supports plant growth and facilitates pollutant removal within the dry swale. The soil media should have an infiltration rate of at least one foot per day
I-32 Urban Subwatershed Restoration Manual 3

Appendix I: Retrofit Design Sheets
and be comprised of a mix of native soil, sand and organic compost similar to bioretention design recommendations presented in ST-4. At least 18 inches of soil media should be mixed into the swale bottom. Underdrain: Underdrains are provided in dry swale retrofits to ensure they drain properly after storms. The underdrain should have a minimum diameter of 6 inches and be encased in a foot deep gravel bed. Underdrains are not needed in wet swales or grass channels. Swale Maintenance Requirements Swale maintenance often fits within normal turf management operations that are already being performed. Swale retrofits are often located near landowners that have real or perceived concerns on how the swale may affect their front yards and property value. Therefore, designers should consider how to: • Minimize standing water • Minimize interference of check dams
with regular mowing • Manage vegetative growth in the future • Educate residents on how to properly
maintain the swale over time Regular inspections should be conducted on the swale retrofit to schedule maintenance operations such as sediment removal, spot revegetation and inlet stabilization. Maintenance crews may need to be educated on the purpose and maintenance needs of swale retrofits installed along streets or highway right-of-way.
Adapting Swales for Special Climates and Terrain Swale retrofits can be applied in most climates and terrain with some design modifications: Cold Climates: Swales can store snow and treat snowmelt runoff. If roadway salt is applied, swales should be planted with salt-tolerant and non-woody plant species. Consult the Minnesota Stormwater Manual for a list of salt-tolerant grass species (MSSC, 2005). The dry swale underdrain pipe should extend below the frost line and be oversized by one pipe size to reduce the chances of freeze-up. Arid Climates: It is extremely hard to maintain a wet swale retrofit in arid and semi-arid climates. Swales should be planted with drought-tolerant vegetation and the planting plan should specify fewer broad-leaved plants to minimize the need for supplemental irrigation. A xeriscaping approach is preferred for any swale in arid or semi-arid regions since irrigation makes little sense and is expensive in these regions. Karst Terrain: Swale retrofits should utilize impermeable liners and underdrains to prevent sinkhole formation in active karst areas.
Urban Subwatershed Restoration Manual 3 I-33

Appendix I: Retrofit Design Sheets
Swale Installation Costs Stormwater Management Manual for Western Washington http://www.ecy.wa.gov/programs/wq/stormwater/manual.html#How_to_Find_the_Stormwater_Manual_on_the
Only limited cost data has been published on swale construction costs. Equations to estimate swale costs for new construction are outlined in Appendix E. The projected cost for swales at new development sites is estimated to be $18,150 per impervious acre treated (range: $10,900 to $36,300). Few retrofit sites will meet the construction conditions for new development sites; most swale retrofits will cost about twice as much, particularly if they involve off-channel treatment.
CNMI and Guam Stormwater Management Manual http://www.guamepa.govguam.net/programs/water/index.html
Swale Design Tools New York State Stormwater Management Design Manual
http://www.dec.state.ny.us/website/dow/toolbox/swmanual/index.html Vermont Stormwater Management Manual http://www.anr.state.vt.us/dec/waterq/cfm/ref/Ref_Stormwater.cfm
I-34 Urban Subwatershed Restoration Manual 3