urban poverty in asia - asian development bank · urban poverty in asia. mandaluyong city,...
TRANSCRIPT

ASIAN DEVELOPMENT BANK
URBAN POVERTY
IN ASIA

URBAN POVERTY
IN ASIA
ASIAN DEVELOPMENT BANK

© 2014 Asian Development Bank
All rights reserved. Published in 2014. Printed in the Philippines.
ISBN 978-92-9254-663-2 (Print), 978-92-9254-664-9 (e-ISBN)Publication Stock No. RPT146730-2
Cataloging-In-Publication Data
Asian Development Bank. Urban poverty in Asia.Mandaluyong City, Philippines: Asian Development Bank, 2014.
1. Urban Poverty 2. Asia I. Asian Development Bank.
The views expressed in this publication are those of the authors and do not necessarily reflect the views and policies of the Asian Development Bank (ADB) or its Board of Governors or the governments they represent.
ADB does not guarantee the accuracy of the data included in this publication and accepts no responsibility for any consequence of their use.
By making any designation of or reference to a particular territory or geographic area, or by using the term “country” in this document, ADB does not intend to make any judgments as to the legal or other status of any territory or area.
ADB encourages printing or copying information exclusively for personal and noncommercial use with proper acknowledgment of ADB. Users are restricted from reselling, redistributing, or creating derivative works for commercial purposes without the express, written consent of ADB.
Note:In this publication, “$” refers to US dollars.
6 ADB Avenue, Mandaluyong City1550 Metro Manila, PhilippinesTel +63 2 632 4444Fax +63 2 636 2444www.adb.org
For orders, please contact: Public Information CenterFax +63 2 636 [email protected]
Printed on recycled paper

iii
List of Tables, Figures, and Boxes iv
Acknowledgment vi
About the Author vii
Abbreviations viii
Introduction 1
Nature and Dimensions of Urban Poverty 3
Moving beyond the Income-Consumption Poverty: Inequalities, Shelter, Services, and Livelihoods 11
Who Are the Urban Poor—Women, Children, Youth, Minority Groups? 20
Poverty and City Size 24
Exploring the Link among Urbanization, Income (GDP), and Urban Poverty 26
Public Policy Responses to Urban Poverty: Selected Asian Economies 32
Asia’s Urban Poverty and What it May Mean for the People’s Republic of China and ADB 50
Annex Tables 55
Bibliography 75
Contents

iv
List of Tables, Figures, and Boxes
Tables1 Tracking Poverty: Asia and the Developing World 42 Asia: Subregional Shares of the Poor 43 Proportions of the Poor, Rural and Urban 74 Numbers of the Poor, Rural and Urban 75 Is Asia Entering into the “Urbanization of Poverty” Trap? 76 The $2.15/day Urban Poverty Estimate 87 Urban Poverty Assessment—National Level Poverty Lines 108 Rural and Urban Poverty Gap Ratios and Gini Indices: People’s Republic of China, India,
and Indonesia 129 Informal Settlements Population in Asia 13
10 Economic Impact of Poor Sanitation 1611 Working Poverty: World and Asian Regions, 2002 and 2012 1812 Urbanization, Gross Domestic Product, and Urban Poverty: A Synoptic View 2813 Urbanization and Urban Poverty 2914 Gross Domestic Product and Urban Poverty 3015 People’s Republic of China’s Urban Poverty Line, Size of Poor Population, and Absolute
Rate of Poverty, 1998–2007 3316 Population in Informal settlements in the People’s Republic of China 3517 Headcount Rates of Povertya, 1991–1992 to 2010 3618 Number and Percentage of the Poor, India 3819 Urban Poverty in Pakistan 41
20 Poverty Estimates in Cambodia, 2009 4221 Poverty Rates and the Poverty Gap, Viet Nam 4722 Country-Specific Interventions for Urban Poverty Reduction 51
Figures1 Poverty–Population Trends 52 City-Level Gini Coefficients: Asian Cities 133 Per Capita Income and Urbanization Levels Across Asian Countries, 2011 274 Urbanization and Urban Poverty: Selected Asian Countries 305 Gross Domestic Product and Urban Poverty: Selected Asian Countries 316 People’s Republic of China’s Urban Transition 347 Bangladesh’s Urban Transition 378 India’s Urban Transition 389 Pakistan’s Urban Transition 40

v
List of Tables, Figures, and Boxes
10 Cambodia’s Urban–Rural Population Growth Trends 43 11 Indonesia’s Urban Transition 44 12 Philippines’s Urban Transition 46 13 Viet Nam’s Urban Transition 48
Boxes 1 Measuring Poverty 3 2 Urbanization of Global Poverty 6 3 National Urban Poverty Lines 9 4 What is an Informal Settlement? 14 5 Definition of Improved and Unimproved Sanitation and Water Supply 15 6 Economic impacts of inadequate sanitation in India by categories, 2006 17 7 Economic Importance of Sanitation 17 8 Rights of the Child 22 9 The Global Rise of Youth Unemployment 23 10 Private Sector’s Housing Involvement in Manila’s Informal Settlement Communities 47
Appendix Tables 1 Aggregate Poverty: Regional Aggregations 1990, 2008, and 2010 55 2 Aggregate Poverty: Regional Aggregations 56 3 Urban and rural poverty measures using a poverty line of $1.08/day: Regions and the World 56 4 Proportion of Population below the Overall, Rural and Urban Poverty Line: Asian Economies 57 5 Absolute Number of Poor: Overall, Rural and Urban 59 6 Rural and Urban Poverty Gap Ratios and Gini Indices: People’s Republic of China, India,
and Indonesia 60 7 Slum population Some Asian countries: 1990, 1995, 2000, 2005, 2007, 2009 60 8 Distribution of households by type of residence: Some Asian countries: 2000–2005 61 9 Progress on Sanitation and Drinking Water: Urban Asia: Economy Estimates, 2000–2010 62 10 Education and Health Attainment Levels: Asian Economies, 2010 64 11 Government Expenditures on Education and Health: Asian Economies, 2011 66 12 Social Protection and Labor Rating and Government Expenditure on Social Security
and Welfare: Asian Economies 68 13 Status of Employment: World and Asian Regions, 2002 and 2012 70 14 Population by Age Groups: Asia and Asian regions, 2000 and 2010 70 15 Youth (15–24) Unemployment Rate: World and Asian Regions, 2002 and 2012 71 16 Urbanization and Per Capita Gross Domestic Product: Asian Economies, 2011 71 17 Sanitation–Country Results 73 18 Water–Country Results 74

vi
Acknowledgment
This paper was prepared by Om Prakash Mathur, distinguished professor of urban economics, National Institute of Urban Affairs, New Delhi for the International Policy Workshop on Urban Poverty and Inclusive Cities in Asia, organized by ADB and held on 24–25 June 2013 at Suqian, People’s Republic of China, and financed by a regional technical assistance project on Promoting Partnership for South–South Cooperation.
The author wishes to thank ADB staff Armin Bauer, Jörn Brömmelhörster, and Florian Steinberg for their guidance and comments.
The author wishes to thank also Dibyendu Samanta for his assistance in the preparation of this paper and Usha Mathur for word processing the script.

vii
About the Author
Om Prakash Mathur is a distinguished professor of urban economics at the National Institute of Urban Affairs, New Delhi, India. He held the Infrastructure Development Finance Company chair in urban economics and finance at the National Institute of Public Finance and Policy, New Delhi for over 15 years. He served from 1978 to 1984 as senior economic planner at the United Nations Centre for Regional Development, Nagoya, Japan; and from 1975 to 1978 as a United Nations senior regional planning adviser and project manager with the Government of Iran. Professor Mathur holds a master’s degree in economics from the Delhi School of Economics and has done graduate work at the Massachusetts Institute of Technology, Cambridge; and Harvard University, Cambridge.
Professor Mathur is a member of the Prime Minister’s National Review Committee on the Jawaharlal Nehru National Urban Renewal Mission (JNNURM). He is also a member of the advisory committee of the ADB-GTZ Programme on City Development Initiative for Asia (CDIA) and of the advisory committee of the World Bank’s Global City Indicators Facility (GCIF).
The author can be reached at [email protected].

viii
Abbreviations
CBN – cost of basic needsGDP – gross domestic productGHG – greenhouse gasGNI – gross national incomeHUDCC – Housing and Urban Development Coordinating Council(Philippines)ILO – International Labour OrganizationJNNURM – Jawaharlal Nehru National Urban Renewal Mission (India)Lao PDR – Lao People’s Democratic RepublicMLSS – Minimum Living Standard SupportNGO – nongovernment organizationNISUS – National Informal Settlers Slum Upgrading Strategy (Philippines)NSPS – National Social Protection Strategy (Cambodia)PAC – Programa de Aceleração do Crescimento, also called Growth Acceleration ProgramPNPM – Program Nasional Pemberdayaan Masyarakat (National Programme for Community
Empowerment, Indonesia)PNPM-Urban – Community Life Improvement Programme for the Urban PoorPPP – purchasing power parityPRC – People’s Republic of ChinaSOE – state-owned enterpriseSSA – Sub-Saharan AfricaUPAP – Urban Poverty Alleviation ProgrammeUPDF – Urban Poor Development Fund (Cambodia)UPPR – Urban Partnership for Poverty Reduction

One in seven people worldwide live in poverty in urban areas, and most of them live in the global South—in overcrowded informal settlements that lack adequate water, sanitation, security, health care and schools. People there endure poor living and working conditions, low incomes and inadequate diets, which all add up to large health burdens or premature deaths. On top of these problems, the urban poor have little voice and few means to influence the policies and pressures that work against their interests.
Governments and aid agencies often fail to understand and provide for the urban poor because of the way they define and measure poverty, using systems based on the $1 per day poverty line. This greatly understates the scale and depth of urban poverty—set a poverty line too low and poverty seems to disappear. Such simplistic measures also take no account of the full dimensions of what poverty actually means to people who live it.
Urban Poverty in the Global SouthMitlin and Satterthwaite (2013)


1
1Introduction
Developing Asia has achieved spectacular progress in reducing poverty. Between 1990 and 2010, Asia lifted 786 million people out of poverty, bringing down the headcount ratio to 20.8% from a high of 55.2%. In 2010, Asia’s share of the poor in the world’s (developing countries) total poor stood at 62.4%, roughly equal to its share in population, yet still an impressive performance since 1990 when Asia accounted for 81.0% of the world’s poor.
Despite this spectacular performance, poverty remains a formidable challenge for Asia. According to the World Bank, 758 million people in Asia are still below the $1.25 poverty line. Indeed, based on numbers of the poor and their share, global poverty is often viewed as a predominantly Asian phenomenon. Sub-Saharan Africa’s (SSA) share of the world’s poor is 34% while the other two regions—Latin America–Caribbean and Middle East—North Africa—account for less than 4% of the world’s total income-consumption poor.
Of far greater and growing concern is the phenomenon of urban poverty in Asia, which is pervasive, severe, and largely unacknowledged. The World Bank’s evidence shows that while 75% of the developing world’s poor still live in rural areas, the share of the poor living in urban areas is rising, and in a number of countries, it is rising more rapidly than the population as a whole. During 1990–2008 for which a disaggregated rural–urban poverty numbers are available, the urban share of the Asia’s poor has risen from 15.7% to 21.9%, with the urban share of the population having risen from 38% to 43% over the same period. Moreover, while poverty incidence has declined across rural and urban areas in Asia, the rates of decline are far slower for urban poverty than for rural poverty. Of the aggregate numbers of those lifted out of poverty, nearly 90% of them are rural poor, attesting to what is often perceived to be a trend—that the processes of urbanization are said to be impacting rural poverty more than urban poverty. In several Asian countries, the numbers of the urban poor have risen over the 1990–2008 period, lending strength to the proposition that as Asian economies become more urbanized, they may face increasing urban poverty with some urban scholars labeling it as “urbanization of poverty.”
Unlike rural poverty, urban poverty is complex and multidimensional—extending beyond the deficiency of income or consumption, where its many dimensions relate to the vulnerability of the poor on account of their inadequate access to land and housing, physical infrastructure and services, economic and livelihood sources, health and education facilities, social security networks, and voice and empowerment. In most of developing Asia, urbanization has been accompanied by slums and shelter deprivation, informality, worsening of the living conditions, and increasing risks due to climate change and exclusionary urban forms. According to the UN-HABITAT, Asia has 60% of the world’s total slum population, and many more live in slum-like conditions in areas that are officially designated as nonslums. Working poverty and informality are high in Asian cities and towns. Recent years have witnessed, almost universally, increasing urban inequalities and stagnating consumption shares of lower-percentile households, with Hong Kong, China registering one of the highest Gini-coefficients observed in any other part of the developing and developed world.

2
Urban Poverty in Asia
Urbanization is a positive factor in growth and poverty reduction. Country experiences are generally consistent with the view that a rising share of the population living in urban areas plays a positive role in overall poverty reduction, by providing new opportunities to those migrating out of the rural areas and escaping poverty in the process. At the same time, most Asian economies are struggling with complex urban problems, associated with different forms of poverty, deprivation, vulnerability, and risks. The People’s Republic of China (PRC), which has pursued a positive policy on urbanization and is now the world’s largest nation of over 600 million urban dwellers, and which has been in the forefront of poverty reduction, is confronted with the emergence of a new class of urban poor linked to the decline of the state-owned sector, to the changes in the welfare provision, and to rural to urban migration thus creating a class composed of millions of working urban poor, and a large population estimated at about 180 million living in slums and slum-like conditions (UN-HABITAT 2012a).
This paper on Urban Poverty in Asia looks at the different dimensions of poverty in Asia, both income and nonincome, its two main regions, including a brief account of who and what class of people are affected most by poverty and deprivation. This paper analyzes the effect of recent urbanization and gross domestic product (GDP) growth trends—which distinguish Asia from other regions—on poverty. It also simultaneously explores other factors that may have affected poverty levels in Asia, delves into the key features of urban poverty in selected Asian countries, and looks at public policy responses and initiatives that Asian countries have taken to address issues on access of the urban poor to services, livelihood, shelter, and social security systems. The paper concludes that Asia is in the midst of urban poverty and deprivation challenges that are evolving with the processes of growth and urbanization—the PRC being a case in point. The welfare of the millions of urban poor will depend on how Asia, where many of its cities represent the new global frontier, and the world prepare for the inevitable growth of urbanization, and how this phenomenon of urbanization is managed and taken forward.
3
2Nature and Dimensions of Urban Poverty
An extraordinarily large amount of literature exists on what poverty is, what measures it, and what distinguishes the poor from the nonpoor. These questions continue to be contentious, but there is a broad-based acceptance of the view that poverty reflects the inability of an individual to satisfy certain basic minimum needs. This inability is expressed in terms of a level of income or expenditure considered necessary to satisfy those minimum needs; those who are not able to attain that level of income or expenditure are counted as poor and others being nonpoor.
Most countries lay down levels of income or expenditure thresholds for poverty lines, with a few making adjustments for cost of living differences between rural and urban areas. This paper draws on the following five sources of poverty data: (i) the World Bank’s PovcalNet database, which provides regionally aggregated numbers of the poor,1
using 2005 purchasing power parity (PPP) and a $1.25/day poverty line—this database runs from 1981 to 2010; (ii) the World Bank’s PovcalNet database, which provides regionally aggregated numbers of the poor separately for rural and urban areas, on a poverty line of $1.08/day using 1993 PPP; (iii) the World Bank’s and the International Monetary Fund’s (IMF) Global Monitoring Report (2013), which gives the proportions of the rural and urban poor, on a poverty line of $1.25/day2 using PPP 2005; (iv) the World Bank PovcalNet database, which provides the proportion of the urban poor at $2.15 poverty line, using 2005 PPP for the PRC, India, and Indonesia; and (iv) the national-level estimates of urban poverty from ADB’s Framework of Inclusive Growth Indicators (ADB 2012b).
1 Regions for which the World Bank PovcalNet gives the poverty numbers include East Asia and the Pacific (Cambodia, the PRC, Indonesia, Lao People’s Democratic Republic (Lao PDR), Mongolia, the Philippines, Thailand, and Viet Nam), Europe and Central Asia, Latin America and the Caribbean, Middle East and North Africa, South Asia (Bangladesh, India, Nepal, Pakistan, and Sri Lanka), and Sub-Saharan Africa. This paper assumes these regions to be the developing world.
2 See the World Bank and International Monetary Fund (2013), advanced edition.
Box 1�Measuring Poverty
Using monetary income or expenditure to identify and measure poverty has a long tradition, owing to Seebohm Rowntree’s classic study of poverty in the English city of York in 1899. Rowntree’s method was to conduct a survey covering nearly every working-class family in York to collect information on earnings and expenditures. He then defined poverty as a level of total earnings insufficient to obtain the minimum necessities for the maintenance of “merely physical efficiency,” including food, rent, and other items. He calculated that for a family of five, the minimum weekly expenditure to maintain physical efficiency was 21 shillings, 8 pence; he proposed other amounts for families of different sizes and composition. This method of estimating poverty has become the workhorse of quantitative and qualitative poverty analysis and public discourses.
Source: The World Bank (2001b). pp. 16–17.

4
Urban Poverty in Asia
Income–Consumption Poverty
The developing world has witnessed a dramatic decline in the levels of poverty over the decades 1990–2010. Nearly 693 million people have been lifted out of poverty and the proportions of the poor have dipped to 20.6%; the only developing region to register an increase in the numbers during this period is Sub-Saharan Africa (SSA) where the numbers of the poor rose from 289.7 million to 413.7 million, although the headcount ratio dipped by 8 percentage points.
Over the same decades, Asia registered an extraordinarily large decline both in the numbers of the poor and the levels of poverty. The numbers came down by half, from 1,543 million to 758 million persons and the level from 55.2% to 20.8%. Led by the PRC, East Asia and the Pacific reduced its poverty incidence by 43.8 percentage points, lifting 676 million people out of poverty—unprecedented by any yardstick; South Asia’s progress on poverty was moderate, having reduced its poverty incidence by 22.8 percentage points and lifting 110 million people out of poverty. It is important to note that poverty levels in East Asia and the Pacific in the initial year were higher than in South Asia (Table 2).
Even with such a massive decline in the numbers and proportions of the poor, poverty continues to be a formidable challenge for Asia. Of the 1.2 billion world’s poor, Asia accounts for 62.2% of them, comparable with its share in total population. Within Asia, South Asia, with a population share of 45%, comprises 67% of Asia’s poor. East Asia, on the other hand, fueled by the PRC’s extraordinary growth, has a consistently high income growth observed in several Southeast Asian countries, reduced its poverty rate to 33% in combination with the population share of 55%. In 1990, East Asia–Pacific and South Asia had maintained roughly the same population–poverty ratio.
Table 1: Tracking Poverty: Asia and the Developing World
Region 1990 1993 1996 2002 2005 2008 2010
Headcount ratio (%)
Asia 55.2 51.1 41.3 34.8 26.9 23.9 20.8
Developing World 43.1 41.0 34.8 30.8 25.1 22.7 20.6
Numbers of the poor (million)
Asia 1,543 1,502 1,270 1,136 930 855 758
Developing World 1,908 1,912 1,704 1,639 1,389 1,302 1,215
Notes:
1. 1999 data on poverty are excluded on account of inadequate survey coverage for South Asia.2. Numbers for Asia comprise East Asia and Pacific and South Asia.Source: World Bank’s PovcalNet Regional Aggregation using 2005 PPP and $1.25/day poverty line.
Table 2: Asia: Subregional Shares of the Poor
Years
East Asia and the Pacific South Asia
Headcount ratio (%) Numbers (million) Headcount ratio (%) Numbers (million)
1990 56.2 926 53.8 617
2010 12.5 251 31.0 507
Source: World Bank PovcalNet.

5
Nature and Dimensions of Urban Poverty
Urban Poverty Trends: The Asian Evidence
As the world becomes increasingly urban, poverty will assume an urban character.3 Most urban analysts underscore the link between urbanization and poverty with a simple explanation: the developing world is becoming urban and the weight of the world’s poverty, historically borne by the rural areas, is shifting to cities and towns. Several analysts point out that the corollary of the shift in the distribution of the world’s population toward urban areas is that poverty is increasingly located in cities and towns. “With urbanization concentrated in the Global South, urban poverty is rapidly growing and in some countries becoming more significant than rural poverty” (Tacoli 2012). Making use of the World Bank’s PovcalNet database that provide rural–urban composition of the poor—using $1.08/day poverty line at 1993 PPP from 1993 to 2002—Ravallion, Chen, and Sangraula (2007) conclude that while poverty continues to be a predominantly rural phenomenon, there are clear trends toward poverty shifting to the urban areas. Box 2 presents the highlights of their analysis.
3 The rising share of the poor living in urban areas has been viewed in different ways. To some, this has been seen as a positive force in economic development as economic activity shifts out of agriculture to more remunerative activities, while to others, this has been viewed in a less positive light, a bearer of new poverty problems. See Martin Ravallion et al. (2007).
Figure 1: Poverty–Population Trends
No. of Poor - Asia
No. of Total Poor - Development World
Population - Asia
Population - Development World
7000
6000
5000
4000
Popu
lati
on (i
n M
illio
n)
1981
1984
1987
1990
1993
1996
1999
2002
2005
2008
2010
3000
2000
1000
0
Sources: Table 1 and UNDESA (2012).

6
Urban Poverty in Asia
Box 2�Urbanization of Global Poverty
In their seminal paper, New Evidence on the Urbanization of Global Poverty, Ravallion, Chen, and Sangraula (2007) provide estimates of the urban–rural breakdown of poverty for the developing world, drawing on over 200 household surveys for about 90 countries, and using the World Bank’s Poverty Assessments for guidance on the urban–rural cost-of-living differences. Their findings are that (i) poverty is becoming more urban—the urban share of the total population over the 1993–2002 period rose at about one-half of a percentage point per year; (ii) the ratio of urban poverty to total poverty incidence has risen with urbanization during 1993–2002; (iii) the poor have urbanized faster than the population as a whole, reflecting a lower-than-average pace of urban poverty reduction; and (iv) during 1993–2002, while 50 million people were added to the count of $1-a-day poor in urban areas, the aggregate count of the poor was by about 100 million, owing to a decline of 150 million in the number of the rural poor. The Asian evidence, given in Ravallion’s (2013) paper fall in line with these conclusions.
Share of the Urban Poor in Asia: $1.08/day Poverty Line at 1993 Purchasing Power Parity
Year Headcount Ratio (%) Urban Poor (million) Total Poor (million) (%) Rural–Urban Ratio1993 16.8 142.2 934.4 15.2 1:0.182002 13.2 150.6 775.4 19.4 1:0.24
Ravallion et al. (2007) also measured poverty, using a poverty line of $2.15/day at 1993 purchasing power parity (PPP) prices. At this poverty line in 2002, Asia had 417 million urban poor that was roughly 56% of the world’s (developing countries) total urban poor.
Urban Poor in Asia Using $2.15/day Poverty Line at 1993 Purchasing Power Parity
Year Headcount Ratio (%) Urban Poor (million)1993 64.0 437.22002 55.9 416.3
Source: Ravallion et al. (2007).
The recent data on rural–urban distribution of poverty are contained in the World Bank–IMF’s Global Monitoring Report (2013), using the $1.25/day poverty line at 2005 PPP. This set of data is presented in Tables 3 and 4, and discussed in the following.
(i) The developing world has made significant progress in reducing rural poverty. Between 1990 and 2008, rural poor numbers dipped by 582 million and the headcount ratio from 52% to 29%. The numbers of the urban poor remained largely unchanged, declining by just 27 million; the rate of decline in headcount ratio—close to 9% over this period—however, is not insignificant given that urban population in Asia doubled during this period. Asian countries were able to absorb much of the increase in urban population without letting them slip into poverty.
(ii) Asia holds 189 million urban poor, constituting 69% of the world’s (developing world) total urban poor. In 1990, the percentage of the urban poor to the world’s total urban poor was 87%, indicating improved performance of Asia in urban poverty reduction in combination with rural poverty.
(iii) Poverty incidence in Asia—rural and urban—has consistently declined between 1990 and 2008, with Asia’s rate of poverty decline being faster than that in the developing world. What is to be noted in the Asian context is that while rural poverty declined at roughly 2.5 percentage points annually, urban

7
Nature and Dimensions of Urban Poverty
poverty declined at about 1.5 percentage points on an annual basis. Translated into numbers, 525 million rural poor were lifted out of poverty during 1990–2008 while the number of urban poor lifted out of urban poverty was only 70 million.
(iv) The 1990–2008 period registered, firstly, an increasing share of the urban poor in Asia’s total poor, and secondly, a perceptible shift in the ratio of the rural to urban poor. The ratio that was 1:0.22 in 1990 rose to 1:0.30 in 2008.
(v) The performance of the two subregions of Asia is at sharp variance in terms of poverty reduction and in the spheres of urbanization and GDP growth. The disaggregated position of poverty shows that (i) South Asia accounts for 80% of the Asia’s urban poor; (ii) South Asia’s share of the urban poor has risen phenomenally over the 1990–2008 period; and (iii) the numbers of the urban poor have risen in South Asia amidst a fall, albeit small, in the numbers of the rural poor. It is this evidence that has often driven urban analysts to suggest that consumption poverty in Asia is largely, if not wholly, a South Asian phenomenon, that South Asia may be entering into the “urbanization of poverty” trap, and that the growth story of South Asia has not trickled down to its cities and towns (Mathur 2012). Thus, how South Asia addresses this challenge would determine the pace of poverty reduction, both in Asia and globally. Asia is seen to have made significant progress in urban poverty reduction but it continues to be confronted with considerable challenges, both for its large population size relative to other regions and by the impending urbanization, with Asia still to reach the tripping point.
Table 3: Proportions of the Poor, Rural and Urban (%)
Region
1990 1996 2002 2008
Rural Urban Rural Urban Rural Urban Rural Urban
East Asia and the Pacific 67.5 24.4 45.9 13.0 39.2 6.9 20.4 4.3
South Asia 50.5 40.1 46.1 35.2 45.1 35.2 38.0 20.7
Developing Asia 60.1 30.0 44.6 21.2 42.0 17.0 29.0 13.7
Developing World 52.5 20.5 43.0 17.0 39.5 15.1 29.4 11.6
Source: Authors’ estimates as given in the Global Monitoring Report (WB and IMF 2013), p. 9.
Table 4: Numbers of the Poor, Rural and Urban (million)
Region
1990 2008
Rural Urban Rural Urban
East Asia and the Pacific 734 137 227 37
South Asia 426 122 408 152
Developing Asia 1,160 259 635 189
Developing World 1,471 298 889 271
Source: Author’s estimates, based on the proportions of the poor as given in the Global Monitoring Report (WB and IMF 2013).
Table 5: Is Asia Entering into the “Urbanization of Poverty” Trap?
Year Share of the Urban Poor Rural–Urban Ratio of the Poor
1990 18.3 1:0.22
1996 16.8 1:0.20
2002 17.2 1:0.21
2008 22.9 1:0.30
Source: The World Bank–IMF (2013) Global Monitoring Report.

8
Urban Poverty in Asia
The $2.15 poverty line
Several scholars have taken the position that for countries that are entering the middle-income or lower-middle income groups, a higher urban poverty line of $2.15/day is a better measure than the $1.25/day line, which at best captures extreme poverty. The World Bank PovcalNet gives the $2.15/day urban poverty estimates for three Asian countries—the PRC, India, and Indonesia. These estimates are given in Table 6. Urban poverty in the PRC, measured at $2.15/day, which accounted for over 55% of its urban population in 1993, dipped to just about 5% in 2010, while India and Indonesia continued to have one-third to one-half of their urban populations below the $2.15/day poverty line, presenting a major challenge for further growth and development.
National-Level Urban Poverty Lines
Determining poverty lines is a complex undertaking. Most countries use the monetary value of a minimum food basket to determine the poverty line; a few countries make adjustments to such a poverty line by allowing for a minimum nonfood constituent of expenditure, and a few countries allow for cost-of-living adjustments to differentiate between rural and urban poverty lines. As Ravallion (1998) notes, “of all the data that goes into measuring poverty, setting the nonfood component of the poverty line is probably the most contentious.” Mitlin (2004) notes that most of the national poverty lines make little allowance for nonfood needs, consequently, poverty lines are set too low.
Box 3 presents the urban poverty lines for selected Asian countries, a perusal of which shows huge differences in how urban poverty lines are defined across Asian countries. ADB’s Framework of Inclusive Growth Indicators (2012b) provides urban poverty estimates on (i) the numbers of the urban poor using national-level poverty line for two time periods (Mitlin and Satterthwaite 2013), (ii) the share of the urban poor in the total for two time periods that provides an assessment of the changes in the shares, and (iii) the proportions of population below the national-level poverty line4 for the latest year using country definitions.
Similar to the World Bank’s PovcalNet data, the national-level poverty lines show that income-consumption poverty is mainly a rural phenomenon and based on the numbers or proportions, urban poverty does not show itself as a major issue or challenge. However, as Table 7 shows, the national-level estimates indicate a high proportion of the urban poor in Mongolia (30.6%) and Afghanistan (29.0%) with several Asian countries showing clear trends toward rising urban poverty expressed both in the shares of the urban poor, and in some cases, in the numbers of the urban poor. Bangladesh, Indonesia, Malaysia, and Sri Lanka fall into this category. Afghanistan (2005–2008), Nepal (1996–2011), and Lao People’s Democratic Republic (Lao PDR) have witnessed an increase both in the shares and in the numbers of the urban poor.
4 For details, see Annex Tables.
Table 6: The $2.15/day Urban Poverty Estimate
Headcount (%) Poverty Gap
Years 1993 2010 1993 2010
People’s Republic of China 55.5 5.4 17.3 ���1.18
India 78.2 34.1 64.7 25.68
Indonesia 81.4 50.6 37.9 17.72
Source: World Bank PovcalNet 2012.

9
Nature and Dimensions of Urban Poverty
Irrespective of the poverty lines—internationally used poverty lines or country-specific—there are signals and trends toward a geographical relocation of poverty from the rural to the urban areas. Rural poverty decline has occurred uniformly in all regions and countries, which is not the case in urban poverty. Many studies indicate that the benefits of urban transformation and the new challenges that Asian cities may be confronted with—including trends toward rising poverty, informalization, and shelter deprivations—are yet to receive close attention that these deserve. The enormity of the impacts expected from urban growth has not yet sunk in. Even less recognized is the fact that the future of developing world cities depends to a large extent on decisions that are taken now with respect to the organization of upcoming city growth. Moreover, given that Asia’s urbanization is still evolving and there is a large untapped urbanization potential, poverty in its cities and towns is most likely to accelerate (Martine et al. 2008). The fundamental challenge is to make use of the untapped urbanization potential in ways that its benefits reach both the urban poor and the nonpoor.
Box 3�National Urban Poverty Lines
People’s Republic of China
No urban poverty line but providing assistance to urban poor under the urban Dibao program, cities set poverty line or benefit line by costing 20 items of goods and services needed for basic subsistence, which varies from a low of CNY936 in county-level towns to a high of CNY3,828 in Beijing (2000).
India Urban poverty line is set at the money value of 2,100 calories and some expenditure on a wider set of deprivations that include clothing, education, medical, and others.
Bangladesh The Bangladesh Bureau of Statistics uses the Cost of Basic Needs (CBN) method as the standard for estimating the incidence of poverty. In this method, two poverty lines are estimated: lower and upper. The Lower Poverty Line commensurate with 1,805 calories per person per day and as the estimated poverty line, it determines the extent of extreme poverty. The Upper Poverty Line commensurate with 2,122 calories per person per day and is estimated by adding together the food and nonfood poverty lines; it also determines the extent of moderate poverty.
Pakistan The Planning Commission of Pakistan has set the official urban poverty line for Pakistan at an adult equivalent intake of 2,350 calories per adult, equivalent to PRe748.6 per capita, per month. The government does not differentiate between urban and rural poverty.
Indonesia Indonesia has a common calorie norm for both urban and rural areas, set at an intake of 2,100 calories.
Cambodia Cambodia has a common calorie norm for both urban and rural areas, set at an intake of 2,100 calories. It has two poverty lines: (i) food poverty line with no allowance for nonfood needs, and (ii) an overall poverty line with some allowance for nonfood needs. Overall poverty line as a proportion of the food poverty line is 1.42 times for Phnom Penh and 1.32 for other urban areas.
Philippines The Philippines has a single threshold across its rural and urban areas set at 2,000 calories per person per day (with the additional 80% of protein recommended daily allowance of FAO or an equivalent of 50 milligrams) plus a minimal basket for nonfood spending.
Viet Nam Viet Nam has a common calorie norm for both urban and rural areas, set at an intake of 2,100 calories.
FAO = Food and Agriculture Organization of the United Nations.
Sources: Wu et al. (2010); Planning Commission of India; Bangladesh Bureau of Statistics; Planning Commission of Pakistan; Satterthwaite (2004); Handbook on Poverty and Inequality, World Bank (2009).

10
Urban Poverty in Asia
Table 7: Urban Poverty Assessment—National Level Poverty Lines
Countries
Numbers of the Urban Poor (million) % Share of the Urban PoorHeadcount (%)to tn to tn
Afghanistan 1.3 1.8 14.3 17.3 29.0
Mongolia 0.5 0.6 62.5 60.0 30.6
Pakistan 10.0 7.2 - - 13.1
Bangladesh 8.9 8.8 15.2 18.9 21.3
India 80.7 79.2 18.5 21.7 20.9
Nepal 0.5 0.8 5.7 10.5 15.5
Sri Lanka 0.5 0.2 10.6 11.1 5.3
Cambodia 0.4 0.3 9.7 7.5 11.8
Indonesia 9.6 11.0 27.4 36.8 9.2
Lao PDR 0.2 0.4 10.5 23.5 17.4
Malaysia 0.4 0.3 28.6 30.0 1.7
Thailand 3.4 0.7 17.7 12.7 3.0
Viet Nam 4.1 0.9 9.6 7.3 3.3
Fiji 0.1 0.1 33.3 33.3 18.6
Lao PDR = Lao People’s Democratic Republic.
Sources: ADB (2012b); UN Millennium database 2012; World Bank Development Indicator database, 2012.

11
3Moving beyond the Income-Consumption Poverty: Inequalities,
Shelter, Services, and Livelihoods
Urban poverty is multidimensional; its dimensions relate to the various forms of deprivations, disadvantage, and risks and are manifested in the lack of access of the poor in cities and towns to basic services, such as water and sanitation, shelter, and livelihood, and as is becoming increasingly evident, to health, education, social security, and empowerment and voice. There are several aspects of urban poverty that makes it complex and different. First, urban poverty is mainly a monetary phenomenon, hence, the poor stand exposed to the behavior of the economic system and to internal and external shocks. The 2008 economic crisis is said to have pushed over 100 million people below the poverty line (Baker 2008). Second, cities represent the extremes of wealth and poverty, the larger the gap and inequalities in incomes, the more difficult it is to reduce poverty. Increasing urban inequalities have raised tensions and led to protests and riots in the different parts of the world. Third, cities are a complex mix of formal and informal activities. The informal employment constitutes 40%–60% of urban employment in Asian economies, adding to the risks that it entails. Finally, cities have become increasingly open to various kinds of disasters, climate change risks, and pollution where the urban poor stand exposed at a much greater degree. All these facets make poverty in Asian cities far more pervasive and severe. This section looks at evidence on some of these aspects.
Urban Inequalities
“If economic growth was the only factor that mattered for poverty reduction, we should have witnessed greater poverty reduction” (Kapoor 2013). There is growing evidence worldwide that while growth has made important impacts on poverty levels, the benefits of growth have not been shared equitably. Joseph Stiglitz (2012), for instance, notes rising inequalities to be the principal factor for recent protests, increasing discontent, and tensions adding that “widely unequal societies do not function efficiently and their economies are neither stable nor sustainable in the long run.” Miles Corak has examined the connection between income inequality and social mobility and established that as income inequalities grow, the opportunities for upward social progression are reduced. Alan Krueger (2012) calls this connection as “the Great Gatsby curve.” Scholars who have been studying the relationship between growth and poverty reduction observed that poverty is a function not just of mean income but equally of income distribution—the relationship between growth and poverty is mediated by inequality. Literature suggests that the level of inequality determines the share of the poor in the growth process; in countries with high inequality, the poor tend to have a lower share of the gains from growth. A growth process where all levels of income grow at the same pace results in higher inequalities, and consequently, the rate of poverty reduction tends to be lower. According to the UN-HABITAT 2012a, poverty reduction is faster in countries where growth is combined with declining inequalities.
The Gini coefficient is a conventional measure for assessing inequalities. The publication Inequality in Asia (ADB 2007) indicates that inequalities have risen in a number of Asian countries, suggesting that poverty reduction

12
Urban Poverty in Asia
would have been higher if inequalities had been less pronounced. According to the UN-HABITAT (2012a), while Asia and the Pacific has lower levels of inequality in comparison with Latin America and Africa, inequalities in Asia are on the rise. In Asia’s three largest countries—the PRC, India, and Indonesia—inequalities have risen in both rural and urban areas. In India, as the Table 8 shows, the poverty gap has declined marginally but urban inequality has risen. In Indonesia, the poverty gap has declined but inequalities have risen. In the PRC’s urban areas, the poverty gap has been eliminated but inequalities have risen, indicating what has generally been known—economic growth in the PRC has benefited the better-off more than the other segments of the society. The rise in urban equalities in the PRC is marginally higher than that observed in India and Indonesia.
According to the UN-HABITAT (2012a), the problem of inequalities is equally pronounced at the level of cities in Asia, demonstrating a conspicuous lack of attention to intra-city inequalities. As Figure 2 shows, Chiang Mai (Thailand); Hong Kong, China; and Ho Chi Minh (Viet Nam) have high Gini coefficients among a sample of 31 Asian cities. Cities such as Beijing, Jakarta, Shanghai, and others are reported to have low Gini coefficients. If the international alert line set at 4.0 is taken as a benchmark, then at least 10 Asian cities are at a high risk. Recent data released by the Beijing’s National Bureau of Statistics show a Gini coefficient of 0.474 for Beijing (2012); the same source notes that the PRC has had a Gini coefficient value of above 0.4, peaking in 2008 at 0.491. Since then, it has been consistently declining.5
Informal Settlements and Shelter Deprivation
Informal settlements are the most visible manifestation of poverty in Asia as it is in other developing regions. It is in cities where one observes wealth and poverty in close proximity, rich and well-serviced neighborhoods located next to dense inner city or peri-urban informal settlements, lacking even the most basic services and living conditions. These shelter deprivations depict significant polarization in the distribution of city wealth and resources, and deeper poverty for these informal dwellers. They have uncertain titles and tenures that impede investment to improve the level and quality of services. They are considered a gray zone where occupants have limited legal claims and rights over land or housing they occupy. Indeed, title or tenure for informal dwellers is one of the most
5 See http://www.ibtimes.com/china-releases-new-data-suggesting-income-inequality-has-lessened-1028862# and http://en.wikipedia.org/wiki/rural_urban_income_inequality_in_china
Table 8: Rural and Urban Poverty Gap Ratios and Gini Indices: People’s Republic of China, India, and Indonesia
Headcount ratio (%) Poverty Gap (%) Gini Coefficient (%)
Rural Urban Rural Urban Rural Urban
People’s Republic of China 1994 80.61 12.55 35.71 2.64 0.338 0.292
2005 26.11 1.71 6.46 0.45 0.359 0.348
2008 22.27 0.89 5.48 0.28 0.394 0.352
India 1993–1994 52.46 40.77 14.33 11.39 0.286 0.343
2004–2005 43.83 36.16 10.66 10.16 0.305 0.376
2009–2010 34.28 28.93 7.53 7.39 0.300 0.393
Indonesia 1993 58.14 47.01 16.36 14.32 0.260 0.353
2005 24.01 18.67 5.03 4.06 0.295 0.399
2011 14.97 17.40 2.13 3.22 0.340 0.422
Source: World Bank PovcalNet database, accessed on 15 April 2013.

13
Moving beyond the Income
Figure 2: City-Level Gini Coefficients: Asian Cities
Chi
angm
aiH
ong
Kon
g, C
hina
Ho
Chi
Min
hSh
enzh
enBa
ngko
kC
olom
bo C
ityD
avao
City
Zam
boan
gaK
uala
Lum
pur
Man
ilaH
a N
oiBa
kuK
uchi
ngC
ebu
City
Phno
m P
enh
Wuh
anSh
engy
anT
bilis
iJo
hor B
ahru
Ipoh
Ula
anba
atar
Dus
hanb
eK
huln
aSh
angh
aiYe
reva
nD
haka
Chi
ttag
ong
Ash
gaba
tTa
shke
ntJa
kart
aBe
ijing
0.700.58
0.53 0.53 0.49 0.480.460.44 0.42 0.41 0.400.39 0.380.38 0.38 0.37 0.370.37 0.37 0.37 0.370.37 0.36 0.350.32 0.31 0.31 0.29 0.290.28 0.270.22
0.600.500.400.300.200.100.00
Source: Global Urban Indicators Database, 2008, adapted from UN-HABITAT (2010a).
Table 9: Informal Settlements Population in Asia
Subregion
No. of population in informal settlements (million)
% of urban population living in informal settlements
1990 2000 2010 2012 1990 2000 2010 2012
Eastern Asia 154.2 191.6 197.5 206.5 43.7 37.4 28.2 28.2
Southern Asia 181.7 194.4 190.6 200.5 57.2 45.8 35.0 35.0
Southeastern Asia 68.9 78.2 76.5 79.9 49.5 39.6 31.0 31.0
Western Asia 17.8 22.0 34.1 35.7 22.5 20.6 24.6 24.6
Oceania 0.4 0.5 0.6 0.6 24.1 24.1 24.1 24.1
Asia and the Pacific 422.9 486.6 499.4 523.2 39.4 33.5 28.6 28.6
Developing world 650.4 759.9 820.0 862.6 46.2 39.4 32.6 32.7
Source: UN-HABITAT (2012a).
debated and challenging issues that confront Asian countries and the one that holds the key to improving and upgrading informal settlements and to reducing urban poverty.
The UN-HABITAT maintains a Global Urban Indicators Database (2012a) that includes the numbers and proportion of population living as informal dwellers. UN-HABITAT’s statistics show that of the 862 million people living in informal settlements worldwide, over 60% of them live in Asia (including West Asia). Within Asia, 24% is in East Asia and 23% in South Asia. The proportion of urban population living in informal settlements is 28.6% for Asia. Moreover, informal settlements’ population has risen across Asia over the period 1990–2012. Informal dwellers in East Asia increased by 34% during this period, while in South Asia and Southeast Asia, their numbers rose by 10.3% and 16.0%, respectively (Table 9).
The Global Urban Indicators Database (UN-HABITAT 2012a) also provides estimates of informal settlements’ population for a few Asian countries in its annex. The annex table comprising these estimates shows that there has been a decline in the proportion of informal settlements population compared with urban population across

14
Urban Poverty in Asia
Asian countries. In its Millennium Development Goals Report 2010, the United Nations (UN) find it a “…cause for optimism. The fact that more than 200 million slum dwellers have gained access to either improved water, sanitation or durable roads and less crowded housing shows that countries and municipal governments have made serious attempts to improve slum conditions, thereby enhancing the prospects of millions of people to escape poverty, disease and poverty” (UN 2010). With the exception of India and Indonesia, which have experienced a dip in informal settlements’ population, the number of informal dwellers has risen in other Asian countries, including Bangladesh, the PRC, Pakistan, and Viet Nam. The same UN report adds that in absolute terms, the number of informal dwellers in the developing world is actually growing, and will continue to rise in the near future. Significantly, the PRC, which has shown an extraordinary progress in reducing consumption poverty, accounts for one-fifth of the world’s population for informal dwellers. It has seen an addition of 48.9 million people to this population category over the past 2 decades, a fallout—as claimed by many—of the massive migration to cities without being accompanied by a reform of the hukou system, which deters migrants from settling down in cities. According to Tom Miller (2013), of the approximately 700 million people living in the cities of the PRC, roughly 250 million are migrant workers who are treated as “second-class citizens. These people either live in slums, in workers’ dormitories, or are pushed to the margins that are hidden from view.”
The concentration of population with shelter deprivations, as defined by the UN-HABITAT, represents an important aspect of poverty in Asian cities. Such deprivations are unacceptably high in Bangladesh where 70% of households live under severe deprivations; and in Cambodia, Lao PDR, and Nepal where significant proportions of households stand deprived of services and tenure. In addition, deprivations are not only a feature of informal settlements, in many ways, deprivations are also high in nonslum households in many Asian countries.
Concern for informal settlement improvement and upgrading has been highlighted in recent years, on account that this is partly one of the goals of the Millennium Development Goals (MDGs). Several countries have reached the MDG goals. At the same time, scholars such as Marife Ballesteros (2011) underscore the point that poverty in informal settlements cannot simply be addressed by traditional poverty programs. The existence and growth of these settlements are not a natural consequence of urban growth that will disappear over time with improvements in income. Their formation and growth are not only caused by rapid urbanization or income poverty but by factors such as regulatory framework for urban planning, delivery of land for settlements, and government spending on infrastructure (Ballesteros 2011).
Box 4�What is an Informal Settlement?
Informal settlements have several images and definitions. In order to bring in cross-country comparability and to shed the notion that these comprise just substandard structures, the UN-HABITAT applies five measurable indicators for defining an informal settlement’s shelter deprivations.
A slum household consists of one or a group of individuals living under the same roof in an urban area, lacking one or more of the following five amenities (i) durable housing—a permanent structure providing protection from extreme climate conditions, (ii) sufficient living area—no more than three people sharing a room, (iii) access to improved water—water that is sufficient and affordable and can be obtained without extreme effort, (iv) access to improved sanitation, and (v) secure tenure—de facto or de jure tenure status and protection against forced eviction. On account of the nonavailability of information on tenure status, use of made of the four indicators for defining slum households and the proportion of slum population to urban population.
Source: UN-HABITAT 2012a.

15
Moving beyond the Income
Urban Service Deficits and Deprivations
Deprivation of basic services, such as water and sanitation, is a global phenomenon. According to the data compiled by the WHO and UNICEF (2013), in 2010, 783 million people around the world used “unimproved sources” to meet their drinking water needs and 2.5 billion people depended on “unimproved sanitation facilities” or defecated in the open. Asia has a high degree of “urban service deprivation.” On average, only 68% of Asia’s urban population has access to piped water supply on premises. Drinking water supply is especially poor in Afghanistan where 16% of urban households have access to improved water supply on premises, while the percentages for Bangladesh is 20% and 19% for the Republic of the Union of Myanmar. Large proportions of households continue to depend on unimproved sources of water supply in Asian cities and towns—15% of households in Bangladesh, 13% in Cambodia, 23% in Lao PDR—examples of the extent to which urban populations remain exposed to water-related risks.
Settlements of the urban poor often lack access to water and sanitation infrastructure. These communities are off-the-grid or network supplies, relying for water on private, small-scale distributors. The result is that most urban informal dwellers pay several times more than high-income households, not just in absolute terms but also as a share of the household expenditure. According to Kariuki and Schwartz (2005), a global study conducted in 47 different countries and 93 locations, this pattern holds across countries; in fact, it shows that average water prices are 1.5–12 times higher for the poor households and those households outside the network compared to the networked households. In the Philippines, as Ballesteros (2011) reports, “the deficit infrastructure shows slum dwellers paying more for basic services such as clean water and electricity than residents living in adjacent fully serviced neighborhoods. In Metro Manila and Cebu City, residents of nonserviced neighborhoods pay 9–13 times more for the delivery of clean water than those households in serviced areas.”
Sanitation services in Asian cities are grossly inadequate and in several countries, poor. Large proportions of urban households, such as Nepal (36%), Mongolia (31%), Bangladesh (26%), and the PRC (24%) use shared and
Box 5�Definition of Improved and Unimproved Sanitation and Water Supply
Services Improved Unimproved
Sanitation Flush or pour-flush to » Piped sewer system » Septic tank » Pit latrine
Ventilated, improved pit latrinePit latrine with slabComposting toilet
Flush or pour-flush to elsewherePit latrine without slab or open pitBucketHanging toilet or hanging latrinesNo facilities, or bush, or field
Water supply Piped water into dwelling plot, or yardPublic tap and/or standpipeTube well and/or boreholeProtected dug wellProtected springRainwater collection
Unprotected dug wellUnprotected springCart with small tank and/or drumTanker truckBottled waterSurface water (river, dam, lake, pond, stream, canal, irrigation channels)
Source: World Health Organization (2012).

16
Urban Poverty in Asia
community latrines. Of the urban population, 15% in Asia had seen no improvement in the sanitation services over the decades. Worse still, 72.7 million people in urban Asia use open spaces for defecation, India (51.5 million people) and Indonesia (14.9 million people) being the worst affected, with people defecating in open spaces (Annex Table 9).
The World Bank’s Water and Sanitation Programme have conducted quantitative and qualitative assessments of the impact and economic costs associated with inadequate sanitation and hygiene—impacts accruing from sanitation and disease incidence, water pollution affecting the productivity of water resources, and the like. According to these studies, in countries such as Cambodia, India, Indonesia, Lao PDR, the Philippines, and Viet Nam, poor sanitation cause at least 180 million disease episodes and 100,000 premature deaths annually, and the economic costs of inadequate sanitation could range anywhere from 1.3% (Viet Nam) to 7.2% (Cambodia) of the countries’ GDP (Table 10).
The WHO has taken a “benefit view” of the water and sanitation services, stating that water and sanitation services reduce the health risks of the target population and contribute to their productivity. It estimates that the global economic return on water expenditure is $2.00 per dollar invested, and for sanitation it is estimated at $5.5 per dollar invested. The benefit–cost ratios of water and sanitation services for selected Asian countries suggest that there exist strong economic arguments to expand these services.
Informal Employment, Working Poor, Access to Decent Livelihood
Working poverty6 is typically high among the Asia’s urban poor, with majority of the working poor being in the informal sector working under highly vulnerable conditions. The International Labour Organization’s (ILO) key Indicators of the Labour Market statistics presented in Table 11 show that (i) close to 70% of the world’s working poor, measured at $2/day and approximately 62% of them, measured at $1.25/day are concentrated in Asia; (ii) the share of the working poor in Asia’s total employment at $1.25/day and $2/day is higher when compared with the world’s average; and (iii) the numbers of the working poor are abysmally high in South Asia where 24% of the working population is under extreme poverty, and alarmingly, 61.3% of the working population under moderate poverty.
6 The working poor are defined as individuals who are employed but who fall below an accepted poverty line. This definition is based on poverty data (international poverty line at $1.25/day or $2/day), but it is important to note that by combining labor market characteristics with poverty data, working poverty estimates give a clear picture of the relationship between poverty and employment (ILO 2012).
Table 10: Economic Impact of Poor Sanitation
Country Economic Impacts of Poor Sanitation
India The impact of inadequate sanitation is $53.8 billion, equivalent to 6.4% of the GDP (2006).
Cambodia Poor sanitation costs $448 million per year, equivalent to 7.2% of GDP (2005).
Indonesia In 2006, the country lost an estimated $6.3 billion due to poor sanitation and hygiene, a sum equivalent to 2.3% of GDP (2005).
Lao PDR An estimated $193 million per year is lost due to poor sanitation and hygiene, equal to 5.6% of GDP (2006).
Philippines Poor sanitation in the Philippines led to economic costs of $1.4 billion, or 1.5% of GDP (2005).
Viet Nam Economic losses from poor sanitation are equal to 1.3% ($780 million) of GDP (2005).
Lao PDR = Lao People’s Democratic Republic.
Source: Reports taken from www.wsp.org

17
Moving beyond the Income
Box 7�Economic Importance of Sanitation
The considerable socioeconomic importance of sanitation, along with the key links improved sanitation has with other development goals such as poverty and hunger reduction, gender equality, child labor, access to safe drinking water, and the quality of life of slum dwellers, demonstrates that sanitation should receive far greater attention from governments and other development partners interested in equitable and sustainable socioeconomic development.
Source: World Bank (2010b).
According to the Asian Employment Forum (2007), approximately 908 million of Asia’s workers—52% of the region’s total workforce—live on $2/day, with 308 million of these living in extreme poverty on less than $1/day. Although the numbers of the working poor have dipped, the still large numbers of the working poor indicate that millions of workers in Asia have not been able to obtain tangible benefits from its favorable economic performance. In many countries, recent growth has been driven by a few dynamic sectors, such as high value-added services and export industries rather than by favorable economy-wide patterns. Labor markets have been sluggish in East Asia with employment expanding by 0.5% in 2012 or an estimated number of 4.5 million people. In South Asia, robust economic growth has been associated with an improvement in labor productivity rather than job creation—often referred to as “jobless growth.” Moreover, the forecast is that about 800 million will not earn enough to lift themselves above the $2/day poverty line. The $2/day poverty line in East Asia is projected to be 19%, 39% in Southeast Asia, and 71% in South Asia.
HH = household.
Source: Adapted from WHO (2012).
$29,052 million (Rs. 1,317 billion)
$4,787 million (Rs. 217 billion)
$4,677 million (Rs. 212 billion)
$2,471 million (Rs. 112 billion)
$132 million (Rs. 6 billion)
$397 million (Rs. 18 billion)
$1,235 million (Rs. 56 billion)
$10,544 million (Rs. 478 billion)
$66 million (Rs. 3 billion)
$132 million (Rs. 6 billion)
$110 million (Rs. 5 billion)
$154 million (Rs. 7 billion)International tourist illness
Lost tourism earnings
Workplace access
School access
HH access
Cost of fetching water
Piped water
Bottled water consumption
HH treatment, drinking water
Health care
Productivity loss
Premature morality
Hea
lth
Wat
erA
cces
s tim
eTo
uris
m
Box 6�Economic impacts of inadequate sanitation in India by categories, 2006

18
Urban Poverty in Asia
Table 11: Working Poverty: World and Asian Regions, 2002 and 2012
Region World East AsiaSoutheast Asia and the Pacific South Asia Asia
Year 2002 2012 2002 2012 2002 2012 2002 2012 2002 2012
Number of working poor at the $1.25/day level (million) 663.5 383.8 204.4 46.3 66.5 35.4 232.3 155.9 503.2 237.7
Number of working poor at the $2/day level (million) 1173.1 853.7 372.9 113.2 136.3 98.3 417.0 391.2 926.2 602.7
Share of working poor at $1.25/day in total employment (%) 24.6 12.3 26.9 5.6 26.7 11.7 42.9 24.4 32.2 13.9
Share of working poor at $2/day in total employment (%) 43.5 27.3 49.1 13.6 54.6 32.5 77.1 61.3 60.3 35.8
Source: Key Indicators of the Labour Market, ILO database, various years.
The urban poor do not have access to what the ILO calls decent work; most urban poor who work in the informal sector are characterized by working poverty. The term informal sector where most of the poor work has multiple connotations and images—it is said to be heterogeneous, vast, gray, and consisting of underground activities. The one feature that binds the informal sector workers is their exclusion from social security, trade union, productive services typically available to large enterprises, and from the GDP estimation and other statistical enquiries and surveys. The ILO looks at the informal sector in terms of deficits, which refers to poor quality, and unproductive and unremunerative jobs that are neither recognized nor protected by law and characterized by the absence of rights at work, inadequate social protection, and lack of representation and voice. The proliferation of the informal sector is said to be a product of (i) the long drawn-out procedures for permits and licenses, (ii) excessive government controls, and (iii) the inefficiency and petty corruption involved in doing business.
Urban scholars indicate a close link among urbanization (rural to urban migration), the informal sector, and poverty. According to the ILO, in the process of urbanization, the growth of the informal sector is almost inevitable because the informal economy is a primary job generator. As Smolka (2003) stated, “contrary to popular beliefs, informality is expensive and therefore is not the best or even an advantageous alternative to combating poverty, but it is usually the only one available to the urban poor.” In the majority of developing countries, most of the new jobs are created by microenterprises, own account workers, and domestic services. The urban informal sector absorbs the urban labor force; there is a link between working in the informal sector and poverty. This stems from the fact that the informal economy workers earn far less than those in the formal economy—these workers include street vendors, waste pickers, informal transport providers, construction works, and the like.
Social Poverty: Lack of Access to Education, Health and Social Security Systems
Social poverty is very high in Asia, especially in South Asia. There is a general lack of access to health, education, and social security systems in developing Asia. Social deprivations are greater among the urban poor, though there is no supporting data. Asia has an average school life expectancy of 11.4 years as against an average of 16.5 years in North America and Western Europe. The school life expectancy in developing Asia varies from a high of 17.2 years in the Republic of Korea (KOR) to as low as 7.3 years in Pakistan. Between 1999 (or the nearest year) and 2010 (or the latest year), school life expectancy increased in almost all economies in Asia; despite the increases, school life

19
Moving beyond the Income
expectancy in Asia is below the 1999 levels of Asia’s developed economies of Australia, Japan, and New Zealand, where it ranges from 15 to 20 years.
Child mortality rates in urban Asia in 2010 ranged from 3 per 1,000 live births in Samoa to 78 in Pakistan. Very high urban child mortality rates were also observed in Bangladesh. On average, urban Asia has an under-5 mortality rate of 41 as against 7 in North America and Western Europe.
Climate Change and Environmental Hazards
More than half of the world’s population now lives in urban areas, and the trend of urbanization is likely to continue, with Asian cities at the center of urban growth. Cities are important entities in the climate change arena, both as contributors to greenhouse gas emissions and as centers of activity for reducing emissions. Cities located on coasts, rivers, or river deltas are exposed to a range of projected climate change impacts, including coastal erosion, saltwater intrusion, and flooding from sea-level rise; flooding or drought from altered precipitation regimes and storm events; heat waves; and increasing temperatures associated with the urban heat island effect. As cities concentrate people and systems, they are more sensitive to the impacts of climate change. The interrelated nature of the systems that keep cities running—including power systems, communications, transport, water supply, and sanitation systems—mean that a disruption or poor performance in one system may have impacts on the other connected systems. Disruptions to these systems have a greater impact on poor communities in cities, affecting both their health and livelihood. The factors behind climate change add to cities’ vulnerabilities to disease, failures in food and water security, loss of livelihoods, more natural disasters, and more degradation of ecosystems.
Asian cities are seriously exposed to the likely impacts of climate change. From a topographical point of view, most of the larger cities in the tropical and subtropical climate zones are low-lying and prone to severe flooding and storm damage. An estimated 54% of Asia’s urban population lives in low-lying coastal zones (UN-HABITAT 2010a). Particularly vulnerable are cities spread across deltas and low coastal plains, such as Bangkok, Dhaka, Ho Chi Minh, Jakarta, Kolkata, Manila, Mumbai, and Shanghai, much of which would be inundated by even a small rise in sea levels. Island states, such as Maldives and Tuvalu, are particularly exposed. Bangladesh is projected to lose 17.5% of its land area if the sea level rises by one meter.
In the last decade (2000–2010), a number of disasters occurred with major impacts on the Asian cities—the largest was the South Asian tsunami and cyclone Nargis. In 2011, Asia was hit by natural disasters (44%), followed by the Americas (28%), Africa (19.3%), Europe (5.4%), and Oceania (3.3%). This regional distribution of disaster occurrence is comparable to the profile observed from 2001 to 2010. In 2011, Asia accounted for 86.3% of worldwide reported disaster victims and suffered the most damages.
It is usually the urban poor who are the worst hit in case of natural disasters. The State of Asian Cities note that “climate factors exacerbate urban poverty in cities, affecting water supply and sewerage systems, with direct effects on the low income households in environmentally fragile areas” (UN-HABITAT 2010a). At the national and city levels in most Asian nations, there is an increasing recognition of the importance of climate change. While many of these policies appear to be gaining some traction, there is still a perceived lack of engagement with the urban poor who may be affected by these policies (ICLEI and UNDP 2012), which affects how well these will be received and implemented.

20
4 Who Are the Urban Poor—Women, Children, Youth, Minority Groups?
Who are the urban poor? Does poverty in cities and towns affect people of different ages and sex differently? Is poverty a characteristic of a specific religion, caste, or ethnic group? These questions have often been raised, but while a number of propositions have been advanced by institutions and experts on trends—such as feminization of poverty, child labor and abuse, and youth at risk—hard evidence to measure the extent of their disadvantages is not available. As Masika et al. (1997) observed “Consideration of urban poverty often neglects differentials between men and women in terms of their access to income, resources, and services. A gender equality perspective draws attention to the need for gender-sensitive indicators of poverty because men and women experience and respond to poverty in different ways. Access to income and assets, housing, transport and basic services is influenced by gender-based constraints and opportunities.” Likewise, urban poor policies assign a low priority to the poor in specific age groups or those belonging to specific castes or religions.
This section presents in brief the disadvantages suffered by the poor in the different ages, sex, and ethnic groups. Across urban societies, these groups are disproportionately affected by disadvantages that tend to make their mobility out of poverty harder, access to existing opportunities limited, and the risks involved in accessing them greater.
Feminization of Poverty
The perception is growing around the globe that there is increasingly “feminization of poverty.” If poverty is to be seen as a denial of human rights, it should be recognized that the women among the poor suffer doubly from the denial of their human rights—first, on account of gender inequality, and second, on account of poverty. Their capacity to lift themselves out of poverty is circumscribed by cultural, legal, and labor-market constraints on their social and occupational mobility. Women are particularly vulnerable to risks associated with urban poverty. Lack of housing and security of tenure in informal settlements impoverish single mothers and their children and increase women’s vulnerability to evictions and exploitation in shared tenures or by landlords. Lack of access to infrastructure and services mean that women and girls are preoccupied with household chores that deprive them of education, income-generating activities, and leisure. Unsafe water and lack of solid waste and wastewater management result in illnesses requiring care that limit women’s economic activities and drain family income. Inadequate transport services restrict women’s opportunities for employment and access to markets and put them at risk of sexual harassment in overcrowded buses and trains. Poorly lit streets, lack of employment, and insecure informal sector wages render women and girls vulnerable to exploitation, diseases like HIV/AIDS, and resultant reproductive health problems (Tacoli 2012). Also, inadequate access to safe, hygienic, and private sanitation facilities is a source of shame, physical discomfort, and insecurity for millions of women around the world (ADB 2013a).
The gender inequities in the distribution of productive resources and access to economic opportunity crystallize the inequities of income and control over income. Although female labor force participation has increased with

21
Who are the Urban Poor?
urbanization, poor women are mostly employed in family enterprises or as piecemeal workers, street vendors, or domestic helpers near their homes, with low wages and no job protection. Limited access to skills training restrict women’s access to job opportunities outside their homes. A report by the United Nations Economic and Social Commission for Asia and the Pacific (UNESCAP, 2007) found that restricting job opportunities for women is costing Asia between $42 billion and $46 billion a year.
The Global Gender Gap Report 2012 (World Economic Forum, 2012) that ranks countries on their ability to close the gender gap in four key areas—access to health care, access to education, political participation, and economic equality—finds that Asia ranks fifth out of the six regional blocks that were considered, being just ahead of Middle East and North Africa who, on average, were able to close out 66% of the gender gap. On the health and survival subindex, Asia occupies the last place. The PRC is the fourth-lowest ranking country on the health and survival subindex, the result of a disproportionate sex ratio at birth. India is the lowest ranked of the BRICS economies featured in the index; it performs above average on the political empowerment of women but lags behind in the other three categories. The persistent health, education, and economic participation gaps are found to be detrimental to India’s growth.
Urban Children
One is used to thinking of urban children as being better off than rural children in every way—better fed, better educated, with better access to health care, and a better chance of succeeding in life. For many children, this is true. But for growing numbers, the so called “urban advantage” is a myth (Bartlett 2011).
Between 30% and 60% of urban dwellers in developing Asia live without the secure tenure that can protect them from eviction. Although this does not necessarily mean they will be evicted, people are, in fact, evicted every year in cities around the world, even in such democratic countries as India. This can create terrible upheaval and distress for children. Many children who are in school can end up dropping out. Even just the threat of eviction can mean chronic anxiety and an unwillingness to make invest in housing and neighborhood that can provide a better environment for children and help a family over time to work its way out of poverty.
Toilets, ventilation, drainage, waste collection, and open spaces are critical in the context of cities and towns. There are implications of overcrowding in such areas and a lack of provision to prevent diarrheal disease, water and food-borne illnesses, respiratory illness, incidence of worms, skin and eye conditions, and malnutrition, and the burdens are highest among young children. Urban children are heavily exposed to toxic elements and pollutants, living in areas contaminated by industrial wastes, or close to heavy traffic. There is also the rapidly growing problem of road traffic injuries, with urban child pedestrians facing the highest risk. This is especially the case in poor settlements without sidewalks or safe crossing lights.
Children in poor households work in order to survive. Around the world, an estimated 215 million boys and girls, 5–17 years old, are counted as child labor, 115 million of them in hazardous work. Children work as rag pickers or shoe shiners, serve at tea stalls, sell cigarettes on the street, or work in homes or factories. Many of those engaged in child labor experience its worst forms—including forced and bonded work, illicit activities, armed combat, and domestic labor. Empirical evidence suggests that at least 25%–45% of household incomes among urban poor households are earned by the children. Since a large proportion of the poor households’ income is spent on food, children’s work and income are crucial to the survival of their families. Because they are largely invisible, these forms of child labor are the most difficult to tackle. Child domestic labor is predominantly an urban phenomenon; estimates indicate that tens of millions of children live or work on the streets of the world’s towns and cities—and the number is rising with global population growth, migration, and increasing urbanization (UNICEF 2012).

22
Urban Poverty in Asia
Urban Youth
Asia’s population is young. An increase in the proportion of young people (age group 15–24) in the population is commonly cited as a “youth bulge” or a “demographic dividend.” In Japan, the youth bulge occurred during the 1960s; in Singapore and Hong Kong, China, the phenomenon started during the 1970s and peaked by 1980. In contrast, countries like Bangladesh, India, Nepal, and Pakistan are now beginning to experience such a dividend and the number of young people may not peak before 2040. In some countries in Southeast Asia, as in most of East Asia, the period of rapid expansion in the youth population is already over. Countries in Asia have benefited from the youth bulge—approximately one-third of East Asia’s GDP increase is attributed to this phenomenon (East-West Center 2006). The extent to which Asian economies will continue to benefit from this demographic trend depends on how they develop and harness the potential of the younger population.
Asia is home to over 45% of the world’s youth, numbering about 754 million young people, of which 330 million are in the workforce and 34 million are unemployed. The proportion of the youth population (15–24 years old) to the total population of Asia has remained stagnant at 18% over the period 2000–2010. Many in this age group drop out of school and look for livelihood opportunities to earn for themselves and their families, but with limited education and limited skill sets. They are, thus, led to work in the urban informal sector, in highly vulnerable conditions. According to the ILO (2012a), the youth unemployment rate in Asia is 10.8%, as against a world average of 12.6%. In 2012, Asia had 56.2% of the total youth labor force and 45.8% of the total unemployed youth in the world. The economic slowdown has taken a toll on East Asian youth, the unemployment rate among young job seekers edged upward to 9.5% in 2012, an increase of 0.3 percentage points from 2011, with joblessness among young men (11.2%) being higher compared with young women (7.6%) in East Asia and the Pacific. The youth unemployment rate for South Asia is 9.6%, over two times higher than the overall unemployment rate. Moreover, the youth in South Asia is far more vulnerable to unemployment because young people lack the right skills, work experience, and job search experience that are adding to the overall demand-side deficits.
Integrating the unemployed youth into local economies and preventing the isolation of the youth is vital for urban Asia. Impoverished youth are vulnerable to street gangs and institutions of organized crime. Ethnic or communal conflict can also be exacerbated by the presence of youth marginalization. The strategic intervention called for is creation of job opportunities that match the skills of the local youth population with the evolving market conditions.
Box 8�Rights of the Child
Children living in urban settings have the full range of civil, political, social, cultural, and economic rights recognized by the Convention on the Rights of the Child and other international instruments. These rights include survival; development to the fullest; protection from abuse, exploitation, and discrimination; and participation in family, culture, and social life.
Children’s rights are not realized equally. Over one-third of children in urban areas go unregistered at birth. This is a violation of Article 7 of the Convention on the Rights of the Child.
Those children whose needs are greatest also face the greatest violation of their rights. The hardships children endure in urban areas include hunger and ill health, substandard housing, and insufficient education and protection.
The State of the World’s Children, 2012.
Executive summary. UNICEF (2012).

23
Who are the Urban Poor?
It is important that young urban people are not excluded from political participation. It is argued that when young people are given opportunities to participate they often engage with, contest, or change the social relations of the communities in which they live. Only then could sustainable development be fostered in rapidly urbanizing Asia (UN-HABITAT 2012d).
Minority Groups
There are several vulnerable minority groups in Asian countries and these vulnerabilities are defined by religion, caste, creed, language, and others. These groups include the “hill tribes” in Thailand, “ethnic minorities” in Viet Nam, “minority nationalities” in the PRC, “scheduled tribes” and “scheduled castes” in India, and “cultural communities” in the Philippines. The incidence of urban poverty is high among these minority groups, much more than the majority population. In India, compared with the majority population, the Dalits, scheduled castes, and scheduled tribes occupy smaller homes and consume fewer urban services. For example, the Dalits occupy on average 19.8% less floor area, compared with the majority of the population. This is also the case with public services, such as access to motorable roads. A 2008–2009 household survey reveals that Dalits have an average monthly consumption expenditure of Rs4,438 ($84) while other minority communities spend about Rs4,678 ($88); the majority population spend Rs5,480 ($104). The Dalits are also highly concentrated in informal settlements (23%), while only 11% of the majority population live in such areas. Housing poverty is not only caused by a gap in socioeconomic conditions but also due to social exclusion. In Viet Nam, the incidence of poverty among ethnic minorities, mostly indigenous peoples, is higher than the majority population. In the PRC, the average life expectancy in Yunnan Province, which is dominated by indigenous peoples, is 5 years less than for the PRC as a whole. In Bangladesh, more than 50% of a total of 1.2 million people belonging to various tribes live in the hill tracts, and their poverty levels are much higher than in the mainland.
Box 9�The Global Rise of Youth Unemployment
The International Labour Organization (ILO) reports that 75 million young people globally are looking for a job. The World Bank surveys suggest that 262 million young people in emerging markets are economically inactive. Depending on how you measure them, the number of young people without a job is nearly as large as the population of America (311 million).
Two factors play a big part. First, the long slowdown in the West has reduced demand for labor, and it is easier to put off hiring young people than it is to fire older workers. Second, in emerging economies, population growth is fastest in countries with dysfunctional labor markets, such as India and Egypt. The result is an “arc of unemployment,” from southern Europe through North Africa and the Middle East to South Asia, where the rich world’s recession meets the poor world’s youthquake.
Youth unemployment is often at its worst in countries with rigid labor markets. Cartelized industries, high taxes on hiring, strict rules about firing, high minimum wages—all these help condemn young people to the street corner. Many countries in the arc of youth unemployment has high minimum wages and heavy taxes on labor. India has around 200 laws on work and play.
Deregulating labor markets is, thus, central to tackling youth unemployment.
Source: The Economist, April 27–May 3, 2013.

24
5 Poverty and City Size
Urban poverty in Asia is largely concentrated in small and medium towns. Ferré et al. (2010) conclude from a study of eight developing countries, which include Thailand and Sri Lanka, that there is an inverse relationship between poverty and city size. Poverty is both more widespread and deeper in small and medium towns than in large or very large cities. This basic pattern is generally robust to the choice of the poverty line. Moreover, the greater incidence and severity of consumption poverty in smaller towns are compounded by similarly higher deprivation levels like access to basic infrastructure services, such as electricity, heating gas, sewerage, and solid waste disposal. They conclude that wherever pattern holds, any strategy for urban poverty reduction that places greater focus on, or allocates more resources to, metropolitan areas, suffers from a “metropolitan bias” analogous to the erstwhile “urban bias” (Ferré et al. 2010).
In India, higher incidence of poverty in small and medium-sized towns is observed and documented in several studies. The India Urban Poverty Report (Ministry of Housing and Urban Poverty Alleviation 2009) points to a comparatively high incidence of poverty in India’s small towns, relative to metro cities. It also argues that this is the consequence of a variety of factors that include a preferential treatment to large towns. The report emphasizes that small towns have fewer human and technical resources at their disposal and, consequently, their capabilities for administration, planning, and implementation are exceedingly weak. The World Bank also finds that in India, while poverty incidence in large metropolitan areas (million plus cities) was 14.7%, for the other small and medium towns (nonmetropolitan areas), it was 30.0% in 2004–2005.
In Cambodia, Phnom Penh has lower poverty rates than other urban regions and in rural areas of Cambodia (The World Bank 2006). In Viet Nam, poverty levels are found to decrease with city size. While only 1.9% of the population in the largest cities is poor, the poverty rate in the smallest cities is 11.2%. Poverty depth and poverty severity are also found to decrease with city size. The urban poor are overwhelmingly concentrated in small cities and towns; small and extra-small cities account for 43% of the urban population but comprise over 70% of the urban poor. Conversely, 32% of Viet Nam’s urban population lives in Hanoi and Ho Chi Minh City, but only 11% of the urban poor live in these two cities (The World Bank 2012b). In Thailand, the share of the urban poor is 17%, of which 76% resides in extra-small towns (WB and IMF 2013). Evidences from Bangladesh and Pakistan also reveal poverty being higher in small cities and towns (38%) than in the metropolitan areas (26%) (Deichmann et al. 2009). The same trends are observed throughout developing Asia.7
The issue of small and intermediate-sized towns has been on the international agenda for several decades (Mathur 1982) with a group of scholars arguing that “the inhabitants of most small towns have been bypassed by economic gains achieved by less developed countries” (Hauser and Gardner 1980). Despite the perceived gains from small
7 Note should be made of the fact that in estimating the poverty incidence across cities of different sizes, the same poverty line is applied. When differences in price levels and cost of living for different classes of cities are factored in to obtain different poverty lines across classes based on size, the results and trends will be different.

25
Poverty and City Size
towns in terms of their being able to offer rural areas accessibility to higher level of urban services, provide higher level of urban services, provide linkages between rural and urban areas, and promote national spatial integration via a more dispersed pattern of development, small cities have a disproportionate low share of national investment in infrastructure and services. The data presented above suggesting that poverty lines are higher in small towns relative to large cities underline the need to review their roles and place in national development.

26
6 Exploring the Link among Urbanization, Income (GDP), and Urban Poverty
What causes poverty and what helps to reduce poverty are complex questions to address. This paper does not aim at any comprehensive examination of these questions; what it does is to look at, with the help of very limited data available, the relationship, firstly, between urbanization and urban poverty where urban analysts have argued that the relationship between urbanization and poverty is complex, often misunderstood, and has meant the perpetuation of inappropriate policies, suggesting that urbanization matters for poverty reduction via the channels of agglomeration and scale economies, thus concluding that the relationship between urbanization and poverty is negative—countries with low levels of urbanization are found to have significantly high poverty rates than countries with high levels of urbanization. Such propositions mainly refer to aggregate poverty without making any distinction between rural and urban poverty. This section examines the link between urbanization and urban poverty, albeit with very limited data. Secondly, this section explores the link between GDP and poverty where the common belief is that income and income growth are not only important but constitute a necessary condition for poverty reduction, and that income or income growth may not be sufficient for poverty reduction. Other factors such as the distribution of income among different sections of population, institutions, and governance may be important factors in impacting poverty. Analysts, such as Francois Bourguignon (2002), point out that “there is no doubt that faster economic growth is associated with faster poverty reduction. But what is the corresponding elasticity? If it is reasonably high, then poverty reduction strategies [that are] almost exclusively relying on economic growth are probably justified. If it is low, ambitious poverty reduction strategies might have to combine both economic growth and some kind of redistribution” (Bourguignon 2002). As this paper will show, most countries consider gross domestic product (GDP) growth route insufficient for poverty reduction and supplement the same with specific interventions in spheres that they consider relevant for alleviating poverty.
Urbanization is one of the most pervasive transformations taking place worldwide. It has meant a wholesale redistribution of population between rural and urban areas to a point where over 53% of the world’s population now live in the urban areas as compared to 29% in 1950. Several regions and 140 out of the 233 countries for which the United Nations (UN) compiles urban population numbers have crossed the tipping point and the UN predicts urbanization level to reach 67.2% globally and 64% for the developing world by 2050. Asia is at the threshold of a major urban transformation. Although its level is still moderate, averaging at 45%–46% compared to over 78% in Latin America, it is catching up, with the UN predicting it to reach the 50% threshold by 2020 A.D. Within Asia, East Asia is nearly 56%–57%, Southeast Asia 45%–46%, and South Asia just reaching 34% or so. If global urbanization in the first half of the 20th century took place predominantly in Europe, population size has made Asia the continent with the most urban population in the world.
Urbanization and economic growth are mutually reinforcing. Urbanization trends are closely linked with concentration of economic activities, production, and productivity. In both developed and developing nations, urban growth has been high, explained for by the effects of agglomeration economies. Virtually no country has graduated to a high-income status without urbanization. Asia’s evidence confirms this assessment with a positive

27
Exploring the Link among Urbanization, Income (GDP), and Urban Poverty
urbanization–economic growth linkage, high urbanization levels coinciding with high per capita incomes and vice-versa (Figure 3). As the figure shows, the explanatory factor is moderately high at 0.572 indicating at the same time, that agglomeration economies are not fully tapped and Asia has vast, unexplored opportunities.
In the context of the strong urbanization–GDP nexus and the various propositions that point to possible links with poverty, this section presents (i) a synoptic view of the changes that have taken place in urban poverty ratios, together with changes in urbanization and GDP levels; (ii) regressions between urbanization and urban poverty; and (iii) regressions between GDP and urban poverty. The period covered is 1990–2010.8
Table 12 presents two main observations:
At 51.0% level of urbanization and a per capita gross national income (GNI) of $8,185, urban poverty levels in East Asia are 4.3%; at 32.2% level of urbanization and a per capita GNI of $3,366, one-fifth of South Asia is below the $1.25/day poverty line. East Asia includes the PRC, which has made a phenomenal progress in reducing consumption poverty.
8 There is no attempt to establish causalities. The regressions are used to generally assess the directions of the linkages.
Figure 3: Per Capita Income and Urbanization Levels Across Asian Countries, 2011
Hong Kong, China Singapore
AustraliaNew ZealandRepublic of Korea
Brunei Darussalam
y = 17.481n (x) - 106.0R2 = 0.572
MalaysiaKiribati
100.0
90.0
80.0
70.0
60.0
50.0
40.0
30.0
20.0
10.0
0.00 10,000 20,000
Per capita GDP at PPP (international dollars)
30,000 40,000 50,000 60,000 70,000
PhilippinesMongolia
PakistanArmenia
GeorgiaUzbekistan
IndonesiaAzerbaijan
Kazakhstan
MaldivesThailandBhutan
Lao PDRViet Nam
Timor-LesteTajikistanBangladeshVanuatuAfghanistanCambodiaSamoa
NepalPapua New Guinea
Sri LankaSolomon Islands
Tonga
Kyrgyz Republic
Micronesia
India
People’s Republic of China
Urb
aniz
atio
n le
vel (
per c
ent)
Fiji
Japan
Taipei,China
GDP = gross domestic product, PPP = purchasing power parity.
Data sources: UNDESA (2012); ADB (2012a).

28
Urban Poverty in Asia
Table 12: Urbanization, Gross Domestic Product, and Urban Poverty: A Synoptic View
Indicator Results
Urbanization level, 2010 (%)
East Asia and the PacificSouth Asia
51.632.2
Urban population, annual exponential growth, 1990–2010 (%)
East AsiaSouth Asia
3.12.8
GDP, per capita GNI, 2011
East Asia and the PacificSouth Asia
$8,185$3,366
GDP, annual growth, 1990–2011 (%)
East Asia and the PacificSouth Asia
7.54.5
Urban poverty headcount, 2008 (%)
East Asia and the PacificSouth Asia
4.320.7
Urban poverty annual average change, 1990–2008 (%)
East Asia and the PacificSouth Asia
–4.06+1.36
GDP = gross domestic product, GNI = gross national income.
Sources:
1. World Urbanization Prospects (UN 2012). East Asia and the Pacific include Southeast Asia as defined in this UN publication.
2. The State of the World Children (UNICEF 2012) for GDP and GNI.
3. Urban Poverty, Tables 3 and 4 of this paper. Absolute numbers of the urban poor are used for working out the annual rate of change.
With an average annual growth rate of 3.1% in urban population and a 7.5% annual growth rate in GDP, East Asia was able to reduce urban poverty at an annual rate of about 4.0% over the past 2 decades. In South Asia, urban poverty increased at an annual rate of 1.4%, with GDP growth rate of 4.5% and urban population growth of 2.8%.
Regressing Urbanization with Urban Poverty Levels
Two sets of data are used for working out the regressions between urbanization and urban poverty: (i) level of urbanization, 2011 drawn from the World Urbanization Prospects (UN 2012), and (ii) national-level urban poverty estimates (Table 7 in this publication) for 14 Asian countries.
Regressions (Figure 4) between the level of urbanization and urban poverty classifies countries into the following three categories: those that have (i) low level of urbanization and low level of urban poverty, (ii) low level of urbanization and high level of urban poverty, and (iii) high level of urbanization and low level of urban poverty. The presence of these groups results in a R2 equal to zero.

29
Exploring the Link among Urbanization, Income (GDP), and Urban Poverty
Regressing GDP Per Capita with Urban Poverty Levels
Table 14 presents (i) the national-level estimates of urban poverty; and (ii) the per capita GNI at 2005 PPP, corresponding to the same years as the numbers of the urban poor. The data refer to 14 Asian countries.
Regression show that
(i) income has an important impact on urban poverty levels;
(ii) middle- and high-income-level countries (over $4,500) have relatively low levels of urban poverty and these countries comprise Bhutan (1.7%), Malaysia (1.7%); Sri Lanka (5.3%), and Indonesia (9.2%);
(iii) low- and lower-middle-income countries have relatively high level of urban poverty and this group includes Afghanistan, Bangladesh, and India; and
(iv) middle-income countries are associated with high levels of urban poverty and low-income countries with low levels of urban poverty.
Table 13: Urbanization and Urban Poverty
Urbanization, 2011 level (%) Urban Poverty Headcount (%)
Afghanistan 23.5 29.0
Pakistan 36.2 13.1
Mongolia 68.5 30.6
Bangladesh 28.4 21.3
Bhutan 35.6 1.7
India 31.3 20.9
Nepal 17.0 15.5
Sri Lanka 15.1 5.3
Cambodia 20.0 11.8
Indonesia 50.7 9.2
Lao PDR 34.3 17.4
Malaysia 72.8 1.7
Thailand 34.1 3.0
Viet Nam 31.0 3.2
Lao PDR = Lao People’s Democratic Republic.
Sources: UNDESA (2012) and Table 7 of this publication.

30
Urban Poverty in Asia
Figure 4: Urbanization and Urban Poverty: Selected Asian Countries
y = –0.061n (x) + 13.35R2 = 0.000
Malaysia
35.0
30.0
25.0
20.0
15.0
10.0
5.0
0.0__ 10.0 20.0 30.0 40.0 50.0 60.0 70.0 80.0
Urb
an P
over
ty H
CR
(per
cen
t) Mongolia
Indonesia
Lao PDR
Viet Nam
Bangladesh
Afghanistan
Cambodia
Nepal
Sri Lanka
India
Urbanization levels (per cent)
Pakistan
ThailandBhutan
Sources: UNDESA (2012) and Table 7 of this publication.
Table 14: Gross Domestic Product and Urban Poverty
CountryPer Capita GDP at PPP (current international $)
Urban Poverty Headcount Ratio
Afghanistan 1,280 29.0
Pakistan 2,753 13.1
Mongolia 4,788 30.6
Bangladesh 1,906 21.3
Bhutan 5,787 1.7
India 3,783 20.9
Nepal 1,439 15.5
Sri Lanka 5,620 5.3
Cambodia 2,328 11.8
Indonesia 4,682 9.2
Lao PDR 2,424 17.4
Malaysia 16,034 1.7
Thailand 9,573 3.0
Viet Nam 3,435 3.3
Lao PDR = Lao People’s Democratic Republic.
Sources: ADB (2012b) and Table 7 of this publication.
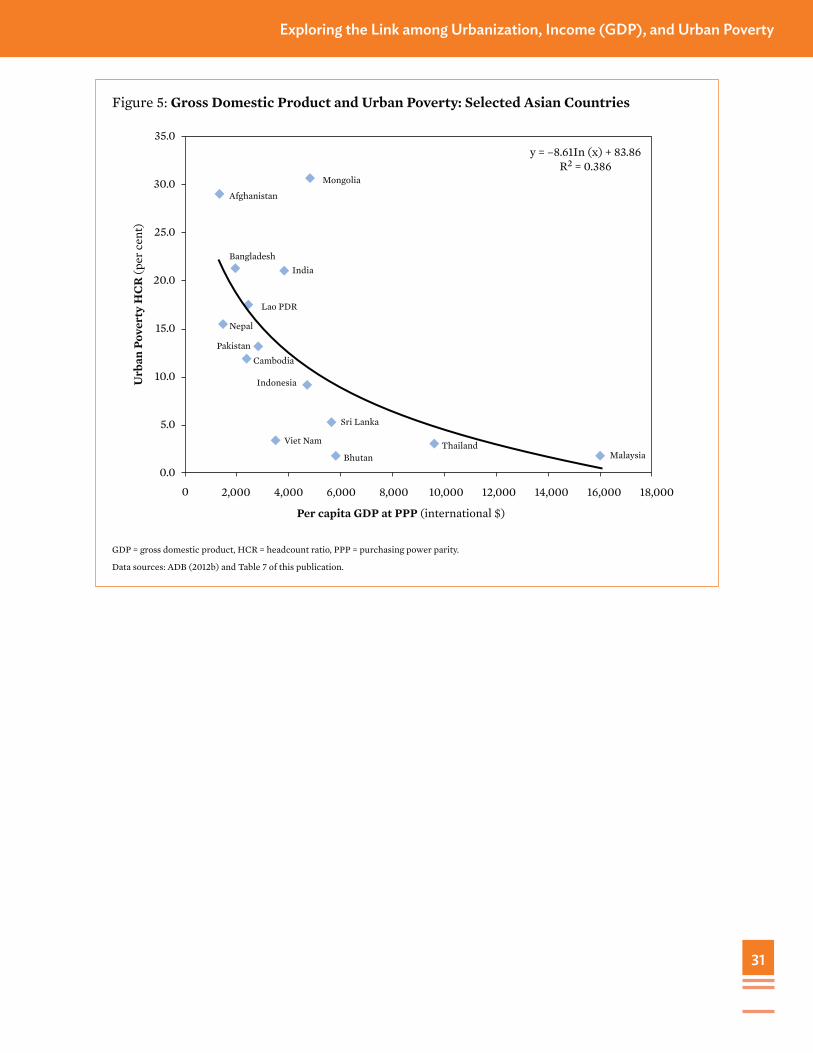
31
Exploring the Link among Urbanization, Income (GDP), and Urban Poverty
Figure 5: Gross Domestic Product and Urban Poverty: Selected Asian Countries
y = –8.61In (x) + 83.86R2 = 0.386
Malaysia
35.0
30.0
25.0
20.0
15.0
10.0
5.0
0.00 2,000 4,000 6,000 8,000 10,000 12,000 14,000 16,000 18,000
Per capita GDP at PPP (international $)
Mongolia
Pakistan
Indonesia
ThailandBhutan
Lao PDR
Viet Nam
Bangladesh
Afghanistan
Cambodia
Nepal
Sri Lanka
India
Urb
an P
over
ty H
CR
(per
cen
t)
GDP = gross domestic product, HCR = headcount ratio, PPP = purchasing power parity.
Data sources: ADB (2012b) and Table 7 of this publication.

32
7 Public Policy Responses to Urban Poverty: Selected Asian Economies
The subject of public policy has been variously dealt with and interpreted in literature, with inadequate empirical work on the nature and extent of relationship among policies, policy instruments, and poverty. The global literature on this subject divides policy instruments into two classes: (i) indirect instruments—those which use resources to accelerate growth and thereby impact on the incomes and, hence, the living standards of the poor; and (ii) direct instruments—those that rely on public provision of shelter, services, and livelihoods. The primary distinction between these two classes is that the former is keyed to generating incomes and, hence, consumption, while the latter is keyed to providing consumption that involves redistribution of resources among different groups. The emergence of direct instruments, as the literature suggests, owes itself partly to the failure of the macroeconomic processes to reach out to the poor via the widely known trickle-down effect, and partly to reinforce the macro processes. Other scholars have discussed public policies for poverty alleviation via (i) growth and (ii) redistribution with targeting,9 and yet, others have introduced a distinction between short-term policies involving income transfers, and long-term policies that focus on increasing the productivity of the poor through improved health, education, and infrastructure, and an institutional environment that encourages investment and promotes growth. Scholars have also designed poverty reduction policies and approaches in terms of technocratic and institutional responses. The former approach emphasizes targeting and explores programs that try to direct limited resources to people with the greatest need. The latter approach argues that the poor lack political power and that administrative incompetence and corruption hinder service delivery. Poverty reduction, in their view, requires developing institutions and improved governance and sensitive political structures. Many scholars have sought to explain within the scope of such discussions how poverty and immiseration are produced, focusing attention on the relationships among economic development, urbanization, social change, and the exercise of political power as it impinges on the plight of the poor (Bhagwati 1988). Still others have attempted to trace within the public policy framework connections and linkages among exchange rates, monetary policies, interest rates, and poverty (The World Bank 2001b). A debate begun in recent years argued on why decentralization may be good for the poor and why it may hurt the poor (Braun and Grote 2000).
This sections looks at the key interventions that Asian economies have made to reduce the impact of urban poverty. The sample of Asian economies covers countries from East Asia, Southeast Asia, and South Asia.
9 The approach to directly reaching the poor via programs targeted at them came into being in the 1960s in the rural context where the problems of poverty were severe. In urban areas, the identification process of the poor and consequently, targeting, has always been a difficult proposition. The practices of separating the poor from the nonpoor are ambiguous, relying on income assessment in some cases and the place of residence in others. Both practices have serious flaws since the income criterion carries with it the usual risk entailed in its estimation, and informal settlements are also places of residence not only of the poor but also of the nonpoor.

33
Public Policy Responses to Urban Poverty
People’s Republic of China
The PRC is the world’s largest urban nation with a population of over 650 million in its cities and towns. Within a short span of 3 decades—1980–2010—the proportion of urban population has risen from 19%—significantly lower than that of India (23.1%) and lower than most Southeast countries—to close to 50%, with urban population tripling during this period. What is extraordinary is that notwithstanding this increase in urban population, the headcount ratio of urban poverty has declined to less than 1% and the numbers of the poor have stabilized at 22 million–23 million. Urban PRC has a low absolute rate of urban poverty (Table 15). The World Bank suggests that the absolute rate of urban poverty has been continuing to decline since 1980 and at $2.15/day poverty line; it was 5.4% in 2010. Fulong Wu et al. (2010) consider the population of absolute poor in cities to be sizeable, even without considering migrants. The numbers of the absolute poor reached 22.7 million in 2007 (poverty line of CNY2,184/capita/year). This figure is measured according to the system of Minimum Living Standard Support (MLSS), known as dibao, literally translated as “minimum security.” Wu et al. (2010) estimate that in 2008, there were 22.6 million MLSS recipients, within 10.8 million households.
Until the early 1990s, the cities of the PRC effectively controlled urban poverty rates, despite having a low living standard. The Chinese system rested on a “low income and comprehensive welfare” model, which assumed that the government is responsible for providing comprehensive welfare. An entitlement to work was viewed as the basic right of all urban citizens and the state sector provided medical care, pensions, housing, and others. In this system, the poor were those who had no stable income, no working capacity, or relatives or supporters; these poor households were known as the “Three No’s” (sanwu). Since the mid-1990s, the reforms of the economic system has led to growth, accumulation of wealth, and rising income and opportunity differences. A sizeable social group of poor households has been formed. The government has recognized this group in various specific terms comprising low income groups, weak social and economic groups, and urban poor residents.
To capture the diversity of the phenomenon of poverty, the Ministry of Civil Affairs has categorized the urban poor as (i) those who fall in Three No’s group; (ii) the poor unemployed, i.e., households whose family members claim unemployment benefits and whose per capita household incomes are lower than the local poverty line; (iii) poor employees—laid off workers whose incomes are less than the local poverty line; (iv) residents in economic hardship; and (v) poor students of universities and colleges unable to pay tuition and living costs. Among these groups, the first is equivalent to the traditional urban poor, and others as the new urban poor. According to Yan Hao (2001),
Table 15: People’s Republic of China’s Urban Poverty Line, Size of Poor Population, and Absolute Rate of Poverty, 1998–2007
Year Poverty Line (yuan/capita/year) Size of Poor Population (million) Absolute Rate of Poverty (%)
1998 2,310 14.8 3.9
1999 2,382 13.4 3.5
2000 1,875 10.5 2.3
2001 2,232 11.7 2.6
2002 2,232 20.6 4.1
2003 22.5 4.3
2004 1,824 22.1 4.1
2005 1,872 22.3 4.0
2006 2,040 22.4 3.9
2007 2,184 22.7 3.8
Source: Wu et al. (2010).

34
Urban Poverty in Asia
urban poverty in the PRC is largely a by-product of economic restructuring, where over two-thirds of the urban poor are unemployed and laid-off workers, and those who suffer from wage cuts. Others have also offered the same explanation, to quote Wu et al. (2010): “[People’s Republic of] China was used to minimum social stratification, in particular in the cities, where full employment formed the basic right of social security. The massive scale of urban poverty since the mid-1990s is quite different from the kinds of living hardships experienced in the former regime, caused mainly by physical disabilities. The [PRC] is, therefore, facing what can be referred to as a new urban poverty.” The same authors underscored that they aimed to highlight that urban poverty is an emerging and complex phenomenon, which is driven by three processes—decline of the state-owned economy, changing welfare provision, and urbanization and rural to urban migration.
A unique characteristic of the PRC’s urban poverty, amidst negligible consumption poverty, is the large number of people who live in informal settlements and in similar conditions. According to the UN-HABITAT (2012a), the PRC has 180.6 million people living in informal settlements, which has risen consistently since 1990, and today, it is the largest number for any nation globally. Although access to water supply in urban PRC is high (95%), a substantial proportion of urban households share sanitation facilities.
A number of studies have been undertaken of the rural–urban migrants who mainly constitute the informal households. According to Gagnon et al. (2009), rural migrants are found to be discriminated in terms of the sector in which they work, with the vast majority of them working in the informal sector, which lacks adequate social protection. According to an official site, the rate of immigrating population living below the poverty line is very high, mostly around 15%–20%, which is about 50% higher than the permanent residents.10 Frijters et. al (2011) also noted that migrants in the PRC received nearly 50% lower hourly wages than their urban counterparts. According to Shin (2013), Chinese cities have increasingly become sites of discontent and polarization, as the rising affluence
10 See http://www.china.org.in.cn/english/china/47310.htm
Figure 6: People’s Republic of China’s Urban Transition
1950
1960
1970
1980
1990
2000
2010
2030
2020
2040
2050
0.0
0.2
0.4
0.6
0.8
1.0
1.2
Rural Population Urban PopulationYears
Popu
lati
on in
Mill
ions
Data source: United Nations (2012).
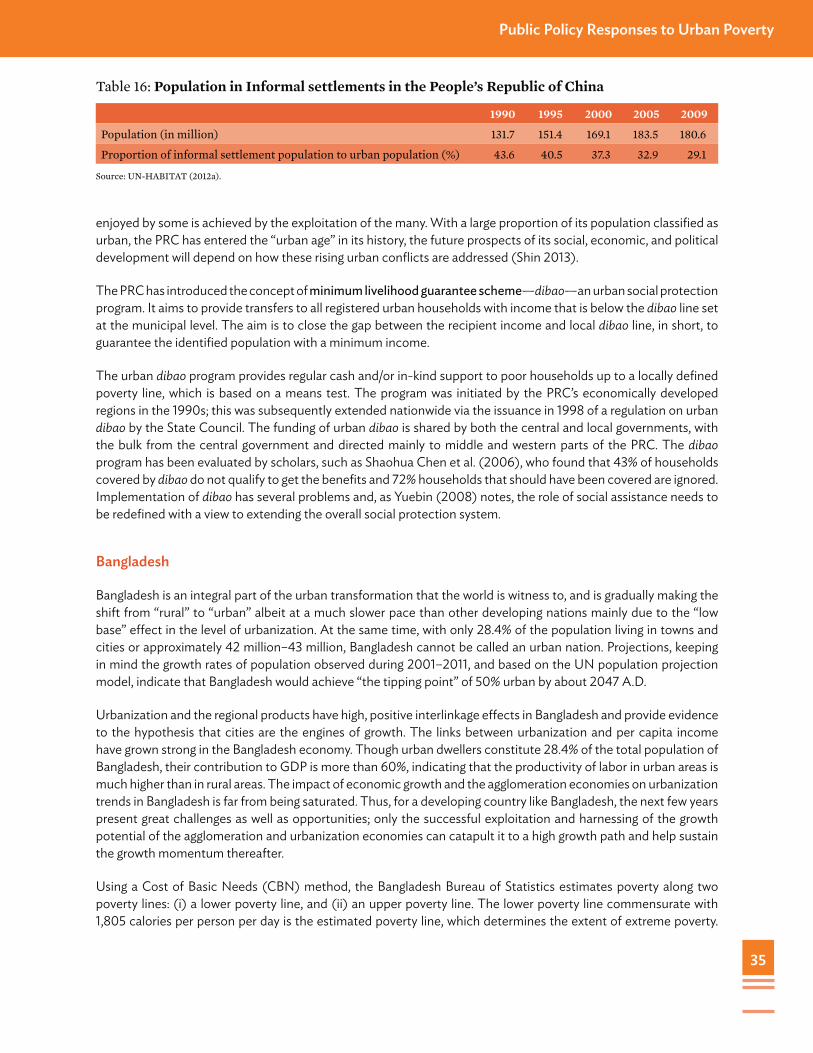
35
Public Policy Responses to Urban Poverty
enjoyed by some is achieved by the exploitation of the many. With a large proportion of its population classified as urban, the PRC has entered the “urban age” in its history, the future prospects of its social, economic, and political development will depend on how these rising urban conflicts are addressed (Shin 2013).
The PRC has introduced the concept of minimum livelihood guarantee scheme—dibao—an urban social protection program. It aims to provide transfers to all registered urban households with income that is below the dibao line set at the municipal level. The aim is to close the gap between the recipient income and local dibao line, in short, to guarantee the identified population with a minimum income.
The urban dibao program provides regular cash and/or in-kind support to poor households up to a locally defined poverty line, which is based on a means test. The program was initiated by the PRC’s economically developed regions in the 1990s; this was subsequently extended nationwide via the issuance in 1998 of a regulation on urban dibao by the State Council. The funding of urban dibao is shared by both the central and local governments, with the bulk from the central government and directed mainly to middle and western parts of the PRC. The dibao program has been evaluated by scholars, such as Shaohua Chen et al. (2006), who found that 43% of households covered by dibao do not qualify to get the benefits and 72% households that should have been covered are ignored. Implementation of dibao has several problems and, as Yuebin (2008) notes, the role of social assistance needs to be redefined with a view to extending the overall social protection system.
Bangladesh
Bangladesh is an integral part of the urban transformation that the world is witness to, and is gradually making the shift from “rural” to “urban” albeit at a much slower pace than other developing nations mainly due to the “low base” effect in the level of urbanization. At the same time, with only 28.4% of the population living in towns and cities or approximately 42 million–43 million, Bangladesh cannot be called an urban nation. Projections, keeping in mind the growth rates of population observed during 2001–2011, and based on the UN population projection model, indicate that Bangladesh would achieve “the tipping point” of 50% urban by about 2047 A.D.
Urbanization and the regional products have high, positive interlinkage effects in Bangladesh and provide evidence to the hypothesis that cities are the engines of growth. The links between urbanization and per capita income have grown strong in the Bangladesh economy. Though urban dwellers constitute 28.4% of the total population of Bangladesh, their contribution to GDP is more than 60%, indicating that the productivity of labor in urban areas is much higher than in rural areas. The impact of economic growth and the agglomeration economies on urbanization trends in Bangladesh is far from being saturated. Thus, for a developing country like Bangladesh, the next few years present great challenges as well as opportunities; only the successful exploitation and harnessing of the growth potential of the agglomeration and urbanization economies can catapult it to a high growth path and help sustain the growth momentum thereafter.
Using a Cost of Basic Needs (CBN) method, the Bangladesh Bureau of Statistics estimates poverty along two poverty lines: (i) a lower poverty line, and (ii) an upper poverty line. The lower poverty line commensurate with 1,805 calories per person per day is the estimated poverty line, which determines the extent of extreme poverty.
Table 16: Population in Informal settlements in the People’s Republic of China
1990 1995 2000 2005 2009
Population (in million) 131.7 151.4 169.1 183.5 180.6
Proportion of informal settlement population to urban population (%) 43.6 40.5 37.3 32.9 29.1
Source: UN-HABITAT (2012a).

36
Urban Poverty in Asia
The extreme poor households are defined as those households whose total expenditures on food and nonfood combined are equal to or less than the food poverty line. The upper poverty line, commensurate with 2,122 calories per person per day, is estimated by adding together the food and nonfood poverty lines, and this determines the extent of moderate poverty. The moderate poor households are those whose total expenditures are equal to or less than the upper poverty line. If the focus is only on the incidence of moderate poverty in the 20-year period 1991–2010, Bangladesh has seen a very significant reduction in the incidence poverty. It has declined from a high of 56.7% in 1991 to 31.5% in 2010, showing a decline of 25.2 percentage points.
Bangladesh has a wide spectrum of social safety net programs the composition of which is a mix of conditional and unconditional cash and food programs, subsidies, and targeted funds. Public safety net programs are focused on rural areas, with little coverage of the urban poor. However, during the recent rise in food prices, the government has set up subsidized rice distribution outlets, including in urban centers. Self-targeting methods are used to screen out the nonpoor households through a combination of rationing, queuing, and providing coarse rice.
Bangladesh has an urban partnership for poverty reduction (UPPR)—which is aimed at improving the livelihoods and living conditions of 3 million poor and extremely poor people, especially women and children, living in 30 urban areas throughout Bangladesh. This partnership works to improve the security of land tenure, access to community infrastructure for a healthy living environment, and access to essential services such as health facilities and finance for improved housing and entrepreneurship. The UPPR’s components include the following:
(i) Local capacity building for town-level coordination committees to support the development of local poverty reduction strategies, including a focus on achieving the Millennium Development Goals (MDGs). The UPPR builds the capacity of local leaders to understand the causes of urban poverty and learn poverty reduction strategies.
(ii) Assistance to communities threatened with eviction and those living in danger zones, such as river banks or near polluted areas and those living in areas where infrastructure improvements are not allowed. The UPPR helps to find negotiated solutions to security of tenure problems.
(iii) Improvement of housing and access to affordable health facilities.
Another program that is being implemented in Bangladesh is the second phase of the ADB-assisted Urban Governance and Infrastructure Improvement Project (UGIIP), 2009–2014. The goal of the UGIIP-2 is to promote human development and good governance in secondary towns and support them in leading a sound and balanced urban development. In support of this goal, the UGIIP-2 has the following two objectives: (i) to develop and improve urban infrastructure facilities for expanding economic opportunities and reducing vulnerabilities to environmental
Table 17: Headcount Rates of Povertya, 1991–1992 to 2010
Upper Poverty Line (2,122 calories) Lower Poverty Line (1,805 calories)
National Rural Urban National Rural Urban
1991–1992 56.7 58.8 42.8 41.1 43.8 24.0
1995–1996 50.1 54.5 27.8 35.2 39.5 13.7
2000 48.9 52.3 35.2 34.3 37.9 20.0
2005 40.0 43.8 28.4 25.1 28.6 14.6
2010 31.5 35.2 21.3 17.6 21.1 7.7a CBN method.
Source: Household Income and Expenditure Surveys.

37
Public Policy Responses to Urban Poverty
degradation, poverty, and national hazards; and (ii) to enhance accountability in municipal government and strengthen the urban municipalities for delivering services. In addition to urban infrastructure improvement, the UGIIP-2 has an urban governance component, which aims at integrating urban poor and citizen awareness and participation to the implementation of the project. The UGIIP is said to have had broader influence, for example, in shaping the local government (Pourashava) Act of 2009, which mandates the engagement of citizens in decision-making processes.
India
Over the past 3 decades, India has made noticeable progress in accelerating economic growth and reducing poverty. Per capita gross domestic product (GDP) at 2004–2005 prices has risen 2.5 times over a 20-year period, at annual rates of 4.2% during 1990–2000 and 7.8% during 2000–2010. The incidence of poverty as measured by the headcount ratio has declined from 45.3% during 1993–1994 to 21.9% during 2011–2012. Aiming at inclusive growth, India’s Twelfth Five-Year Plan (2007–2012) has fixed an ambitious target for reducing consumption poverty, via income growth; employment expansion; higher levels of investment in health, education, water, and sanitation; and directly targeted poverty-reduction programs.
While this record is impressive, poverty in urban areas continues to be a matter of heightened concern for India’s development policy and strategy. For one thing, despite a large increase in the urban share of the GDP—from 41% during 1980–1981 to 52% during 2004–2005, currently estimated at about 60%—the pace of urban poverty reduction has been far slower than that of rural poverty. This trend has fuelled fears that poverty in India, as in many other developing countries, may have begun to urbanize itself, and as urbanization picks up speed, poverty in cities and towns may worsen, and impact negatively on the country’s growth and other development goals and objectives. Even at the current level of urbanization, which is moderate by most comparisons (31% as of 2011), and an equally moderate rate of urban population
Figure 7: Bangladesh’s Urban Transition
1950
1960
1970
1980
1990
2000
2010
2030
2020
2040
2050
0.0
0.0
0.0
0.1
0.1
0.1
0.1
Popu
lati
on in
Mill
ions
Rural Population Urban PopulationYears
Source: UN (2012).

38
Urban Poverty in Asia
growth (2.74%), urban deprivation levels are high, with cities and towns unable to provide basic shelter and associated infrastructure services to a large percentage of urban population.
Besides the deficit in consumption expenditure, urban poverty in India is equally represented by a large number of people who live in squatter areas or informal settlements. These informal settlements are the physical manifestation of poverty in cities and towns, and reflect what analysts call a dimension of social exclusion. On these measures, cities and towns in India present a disconcerting picture. In 2011, 66 million persons lived in informal settlements, representing 17% of the country’s total urban population.11 These settlements lack water and sanitation, have high
11 These are the latest figures produced by the Census of India and may be at variance with the figures put out by the UN-Habitat. The Census of India defines a slum (informal settlement) as a compact area of at least 300 people or 60–70 households, living in poorly built congested tenements, in unhygienic environment usually with inadequate infrastructure, and lacking in proper sanitary and drinking water facilities.
Table 18: Number and Percentage of the Poor, India
Year
Number and Percentage of the Poor Poverty Ratio (%)
Rural Urban Total Rural Urban Total
1993–1994 328.6 74.5 403.7 50.10 31.80 45.30
2004–2005 326.3 80.8 407.1 41.80 25.70 37.20
2011–2012 216.5 52.8 269.3 25.70 13.70 21.90
Annual decline: 1993–1994 to 2004–2005 (percentage points per annum) 0.75 0.55 0.74
Annual decline: 2004–2005 to 2009–2010 (percentage points per annum) 2.30 1.70 2.20
Source: Planning Commission of India.
Figure 8: India’s Urban Transition
1950
1960
1970
1980
1990
2000
2010
2030
2020
2040
2050
0.0
0.2
0.1
0.3
0.4
0.5
0.6
0.7
0.8
0.9
1.0
Popu
latio
n in
Mill
ions
Rural Population Urban PopulationYears
Source: UNDESA (2012).

39
Public Policy Responses to Urban Poverty
incidence of vector-borne diseases, and are vulnerable as they have no back-up savings, food stocks, or social support systems. Only one-fifth of the working force in informal settlements have “regular wage employment,” the others being either self-employed or casually employed.
India is, thus, faced with multiple challenges—first, of bridging the consumption gap so as to eliminate consumption poverty among the 76 million urban poor; second, of ensuring that those who are on the borderline do not slip into poverty; third, of making cities and towns “slum-free” by working on those institutional and other barriers that inhibit the extension of services to these informal settlements, that keep them at subsubsistence levels, and prevent them from accessing credit, skills, and training.
Policy and program interventions aimed at directly reaching the urban poor have evolved in India as a result of a broad-based appreciation and understanding of the problems of urban poverty and the realization that income growth by itself may not be sufficient to alleviate urban poverty and may need redistributional inputs, including direct transfers. In the 1950s and 1960s, government policies considered the expansion of housing stock as a viable response to the problem of “slums.” Slums, as the First Five-Year Plan (1951–1956) noted, were “a disgrace to the country” and took the position that “from the national point of view it was better to pay for the cost of clearing slums than to continue to pay the mounting cost of slums and suffer their destructive effects upon human lives and property indefinitely” (Planning Commission of India 2011). Currently, the basic thrust is on growth, which is considered essential for reducing the numbers of the urban poor and for sustaining poverty reduction, but for growth to benefit the poor, it needs to be accompanied by more rapid employment expansion; greater investment in health, education, water and sanitation, and child nutrition; and directly targeted poverty-reduction programs.
The post-1991 era is marked by one of the most extraordinary shifts that have come about in India in the approach and thinking about cities and urbanization and the institutional and financial frameworks that should be in place for addressing issues of widespread urban poverty and other related urban issues, such as the provision of shelter, services, infrastructure, governance, accountability, and participation. The shift in approach and thinking stems, at least in part, from (i) the need to realign urban sector policies and programs to the emerging macroeconomic context of the post-1991 period, and (ii) the growing importance of the role of cities and urban centers in the domestic economy as reflected in their contribution to the country’s GDP and urban productivity. Both of these factors have led to a series of important initiatives and interventions comprising the (i) Constitution (seventy-fourth) Amendment Act on Municipalities, (ii) capital market financing of municipal infrastructure, (iii) Urban Reform Incentive Fund (URIF), (iv) the Jawaharlal Nehru National Urban Renewal Mission (JNNURM), and (v) Rajiv Awas Yojana.
The JNNURM is a reform-linked grant facility for cities and towns to meet the contemporary challenges of maintaining and accelerating the GDP growth rate, on the one hand, and increasing access of the urban poor to shelter and basic services such as water and sanitation, on the other, thereby making cities “inclusive.” The mission is unique in that it combines a grants-in-aid component with urban sector reforms, the purpose of which is similar to that of the economic reforms in the 1990s, that is, to (i) eliminate those legal and statutory provisions that have constrained the functioning of the land and housing markets, (ii) do away with the pricing regime that impedes the flow of investment into urban infrastructure, (iii) undertake tax reforms so as to bring about fiscal viability among municipalities, (iv) safeguard the interests of the urban poor households by ring-fencing municipal expenditures meant for them, and (v) bring in accountability by putting in place disclosure and accountability laws, and the like. The JNNURM requires that basic services, including security of tenure, be provided to the urban poor and that the budgets for basic services to the urban poor be earmarked.
As a complement to the JNNURM, the government has introduced a new initiative called the Rajiv Awas Yojna, which envisages a “Slum-Free India,” in which every citizen has access to basic civic and social services and decent

40
Urban Poverty in Asia
shelter. It aims to achieve this vision by encouraging states to tackle the problem of informal settlements in a definitive manner, by a multipronged approach that focuses on
(i) bringing all informal settlements within the formal system and enabling them to avail of the same level of basic amenities as the rest of the city,
(ii) redressing the failures of the formal system that led to the creation of slums, and
(iii) tackling the shortages of urban land and housing that keep shelter out of reach of the urban poor and force them to resort to extralegal solution in a bid to retain their sources of livelihood and employment.
Pakistan
Like many other developing countries, Pakistan has experienced a rapid pace of urbanization. Its level of urbanization has increased from 17% in 1951 to 36% in 2010 and its annual average growth rate is 3.1% (1990–2010), which is higher when compared with South Asia’s figure of 2.7% during the same period. The Government of Pakistan defines “national poverty line on the basis of 2,350 calories per adult equivalent per day at PRs748.57 per capita per month at the prices of 2000-[20]01 and minimum nonfood requirements”. The government does not differentiate between urban and rural poverty and has the same poverty line for both areas.
The process of urbanization has had a dual impact on the development process of Pakistan’s economy. It has encouraged the workers to switch from low productive sector (e.g., agriculture) to high productive sectors (e.g., services and manufacturing). Subsequently, it generated formidable problems for residents by depriving them of access to essential basic needs. It can also be observed, in the case of Pakistan, that the poor try to urbanize faster as compared to the whole population and this urbanization process leads toward the emergence of urban poverty. Urban poverty is distinct from rural poverty in terms of incidence, economic, demographic, and political aspects.
Figure 9: Pakistan’s Urban Transition
1950
1960
1970
1980
1990
2000
2010
2030
2020
2040
2050
0.0
0.0
0.0
0.1
0.1
0.1
0.1
0.1
0.2
0.2
Popu
lati
on in
Mill
ions
Rural Population Urban PopulationYears
Source: UNDESA (2012).
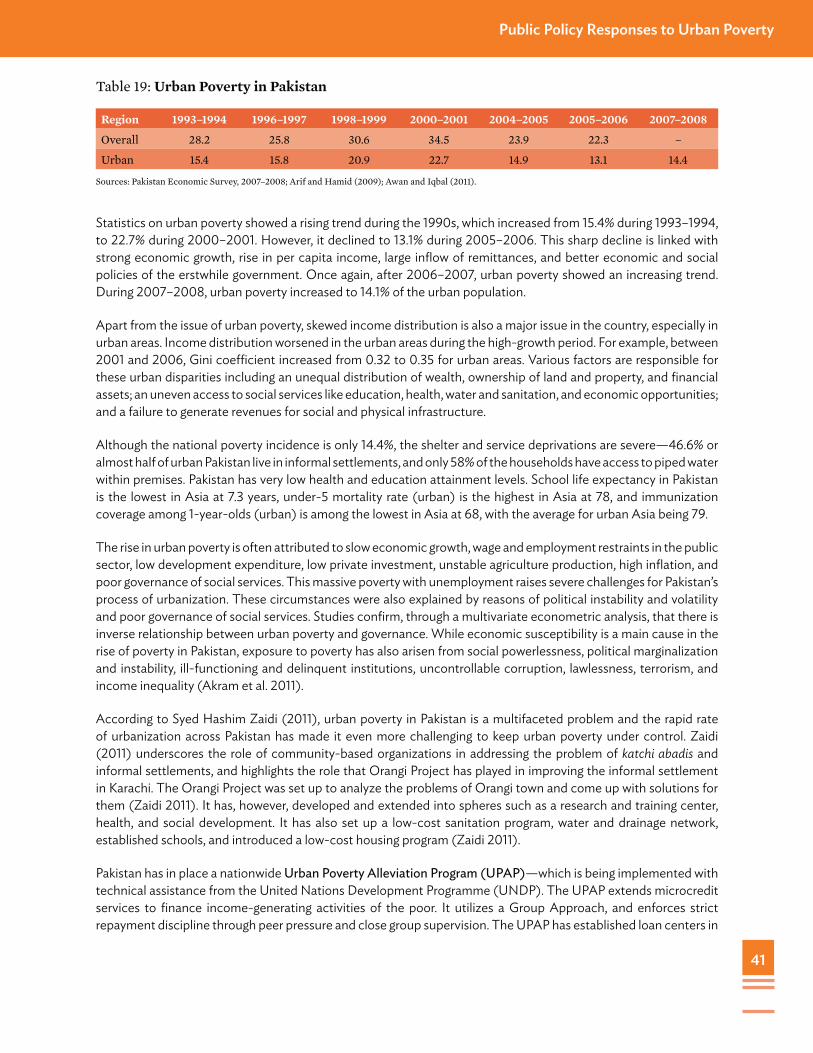
41
Public Policy Responses to Urban Poverty
Statistics on urban poverty showed a rising trend during the 1990s, which increased from 15.4% during 1993–1994, to 22.7% during 2000–2001. However, it declined to 13.1% during 2005–2006. This sharp decline is linked with strong economic growth, rise in per capita income, large inflow of remittances, and better economic and social policies of the erstwhile government. Once again, after 2006–2007, urban poverty showed an increasing trend. During 2007–2008, urban poverty increased to 14.1% of the urban population.
Apart from the issue of urban poverty, skewed income distribution is also a major issue in the country, especially in urban areas. Income distribution worsened in the urban areas during the high-growth period. For example, between 2001 and 2006, Gini coefficient increased from 0.32 to 0.35 for urban areas. Various factors are responsible for these urban disparities including an unequal distribution of wealth, ownership of land and property, and financial assets; an uneven access to social services like education, health, water and sanitation, and economic opportunities; and a failure to generate revenues for social and physical infrastructure.
Although the national poverty incidence is only 14.4%, the shelter and service deprivations are severe—46.6% or almost half of urban Pakistan live in informal settlements, and only 58% of the households have access to piped water within premises. Pakistan has very low health and education attainment levels. School life expectancy in Pakistan is the lowest in Asia at 7.3 years, under-5 mortality rate (urban) is the highest in Asia at 78, and immunization coverage among 1-year-olds (urban) is among the lowest in Asia at 68, with the average for urban Asia being 79.
The rise in urban poverty is often attributed to slow economic growth, wage and employment restraints in the public sector, low development expenditure, low private investment, unstable agriculture production, high inflation, and poor governance of social services. This massive poverty with unemployment raises severe challenges for Pakistan’s process of urbanization. These circumstances were also explained by reasons of political instability and volatility and poor governance of social services. Studies confirm, through a multivariate econometric analysis, that there is inverse relationship between urban poverty and governance. While economic susceptibility is a main cause in the rise of poverty in Pakistan, exposure to poverty has also arisen from social powerlessness, political marginalization and instability, ill-functioning and delinquent institutions, uncontrollable corruption, lawlessness, terrorism, and income inequality (Akram et al. 2011).
According to Syed Hashim Zaidi (2011), urban poverty in Pakistan is a multifaceted problem and the rapid rate of urbanization across Pakistan has made it even more challenging to keep urban poverty under control. Zaidi (2011) underscores the role of community-based organizations in addressing the problem of katchi abadis and informal settlements, and highlights the role that Orangi Project has played in improving the informal settlement in Karachi. The Orangi Project was set up to analyze the problems of Orangi town and come up with solutions for them (Zaidi 2011). It has, however, developed and extended into spheres such as a research and training center, health, and social development. It has also set up a low-cost sanitation program, water and drainage network, established schools, and introduced a low-cost housing program (Zaidi 2011).
Pakistan has in place a nationwide Urban Poverty Alleviation Program (UPAP)—which is being implemented with technical assistance from the United Nations Development Programme (UNDP). The UPAP extends microcredit services to finance income-generating activities of the poor. It utilizes a Group Approach, and enforces strict repayment discipline through peer pressure and close group supervision. The UPAP has established loan centers in
Table 19: Urban Poverty in Pakistan
Region 1993–1994 1996–1997 1998–1999 2000–2001 2004–2005 2005–2006 2007–2008
Overall 28.2 25.8 30.6 34.5 23.9 22.3 –
Urban 15.4 15.8 20.9 22.7 14.9 13.1 14.4
Sources: Pakistan Economic Survey, 2007–2008; Arif and Hamid (2009); Awan and Iqbal (2011).
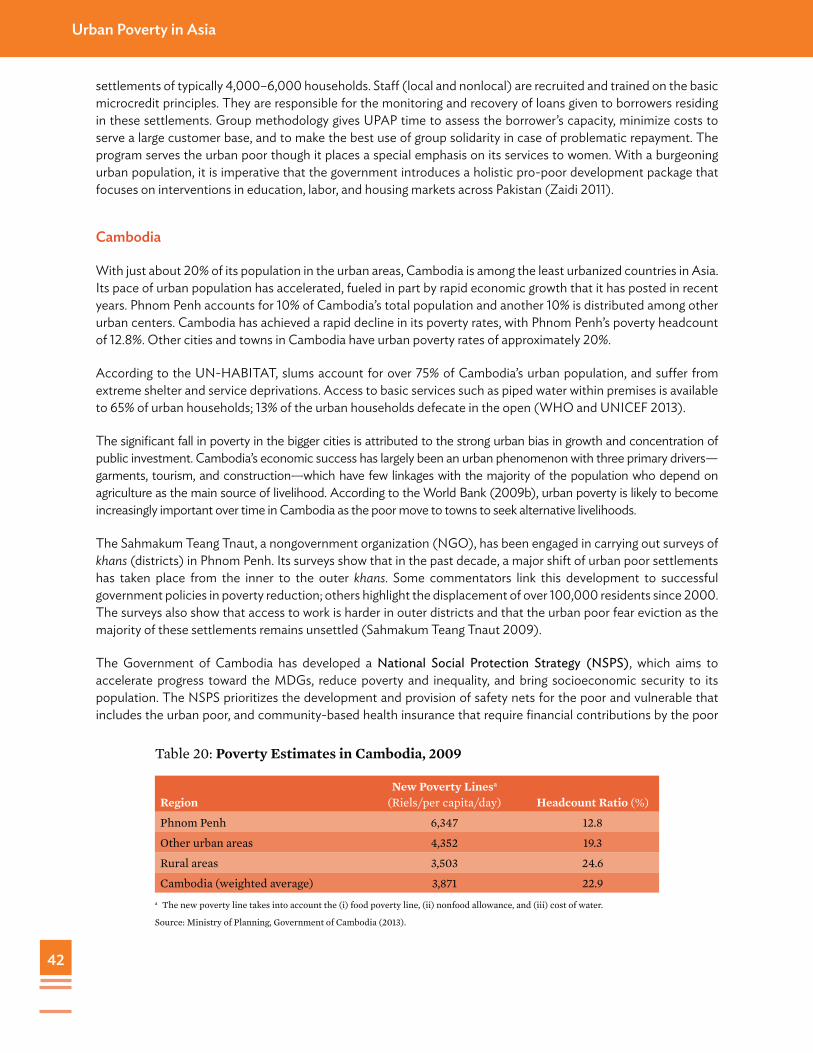
42
Urban Poverty in Asia
settlements of typically 4,000–6,000 households. Staff (local and nonlocal) are recruited and trained on the basic microcredit principles. They are responsible for the monitoring and recovery of loans given to borrowers residing in these settlements. Group methodology gives UPAP time to assess the borrower’s capacity, minimize costs to serve a large customer base, and to make the best use of group solidarity in case of problematic repayment. The program serves the urban poor though it places a special emphasis on its services to women. With a burgeoning urban population, it is imperative that the government introduces a holistic pro-poor development package that focuses on interventions in education, labor, and housing markets across Pakistan (Zaidi 2011).
Cambodia
With just about 20% of its population in the urban areas, Cambodia is among the least urbanized countries in Asia. Its pace of urban population has accelerated, fueled in part by rapid economic growth that it has posted in recent years. Phnom Penh accounts for 10% of Cambodia’s total population and another 10% is distributed among other urban centers. Cambodia has achieved a rapid decline in its poverty rates, with Phnom Penh’s poverty headcount of 12.8%. Other cities and towns in Cambodia have urban poverty rates of approximately 20%.
According to the UN-HABITAT, slums account for over 75% of Cambodia’s urban population, and suffer from extreme shelter and service deprivations. Access to basic services such as piped water within premises is available to 65% of urban households; 13% of the urban households defecate in the open (WHO and UNICEF 2013).
The significant fall in poverty in the bigger cities is attributed to the strong urban bias in growth and concentration of public investment. Cambodia’s economic success has largely been an urban phenomenon with three primary drivers—garments, tourism, and construction—which have few linkages with the majority of the population who depend on agriculture as the main source of livelihood. According to the World Bank (2009b), urban poverty is likely to become increasingly important over time in Cambodia as the poor move to towns to seek alternative livelihoods.
The Sahmakum Teang Tnaut, a nongovernment organization (NGO), has been engaged in carrying out surveys of khans (districts) in Phnom Penh. Its surveys show that in the past decade, a major shift of urban poor settlements has taken place from the inner to the outer khans. Some commentators link this development to successful government policies in poverty reduction; others highlight the displacement of over 100,000 residents since 2000. The surveys also show that access to work is harder in outer districts and that the urban poor fear eviction as the majority of these settlements remains unsettled (Sahmakum Teang Tnaut 2009).
The Government of Cambodia has developed a National Social Protection Strategy (NSPS), which aims to accelerate progress toward the MDGs, reduce poverty and inequality, and bring socioeconomic security to its population. The NSPS prioritizes the development and provision of safety nets for the poor and vulnerable that includes the urban poor, and community-based health insurance that require financial contributions by the poor
Table 20: Poverty Estimates in Cambodia, 2009
RegionNew Poverty Linesa
(Riels/per capita/day) Headcount Ratio (%)
Phnom Penh 6,347 12.8
Other urban areas 4,352 19.3
Rural areas 3,503 24.6
Cambodia (weighted average) 3,871 22.9a The new poverty line takes into account the (i) food poverty line, (ii) nonfood allowance, and (iii) cost of water.
Source: Ministry of Planning, Government of Cambodia (2013).

43
Public Policy Responses to Urban Poverty
as a part of social protection. Given the many sources of vulnerability faced by the country’s poor, safety nets are a key component in the development of social protection.
Cambodia has also established an Urban Poor Development Fund (UPDF) under a memorandum of understanding between local communities and the Asian Coalition of Housing Rights. The UPDF aims to create a revolving fund that provides soft loans to poor communities, which are extended on condition that borrowing communities have well-established savings groups. These loans are provided only when communities have at least 10% of the loan or grant amount in their collective savings. However, implementation of the NSPS is weak and there is at present no urban poverty targeting system.
Indonesia
Indonesia is one of the rapidly urbanizing countries in Asia. According to the World Urbanization Prospects (UNDESA 2012), Indonesia had close to 50% of its population (approximately 120 million) in its urban areas in 2010. Economic growth has been strong in the country and has helped Indonesia reduce poverty substantially over the decades, with urban poverty headcount ratio having registered a decline from 11.4% in 2004 to 10.7% in 2012 (ADB 2013b). The urban poor are concentrated in the two heavily concentrated provinces of Java and Sumatra, their shares being 67.6% and 20.4%, respectively. Subgroups among the urban poor that are particularity vulnerable include recent migrants, child labor, street children, and those living in informal settlements (Baker 2012). The gap between the poor and nonpoor, according to national-level statistics, has widened. The Gini coefficient has risen to 0.35 in 2009 from about 0.31 in 1999. Regional disparities persist and eastern Indonesia lags behind other parts of the country, notably Java.
Informal settlements account for 12.12% of Indonesia’s urban population (2009). Service deprivations in urban Indonesia are severe—with 42.5% of urban population having access to piped water within premises, and sanitation coverage of 72.8% of urban population. Its social indicators are keeping pace with the averages for urban Asia.
Figure 10: Cambodia’s Urban–Rural Population Growth Trends
1950
1960
1970
1980
1990
2000
2010
2030
2020
2040
2050
0.0
0.0
0.0
0.1
0.1
0.1
0.1
0.1
Popu
lati
on in
Mill
ions
Rural Population Urban PopulationYears
Source: UNDESA (2012).

44
Urban Poverty in Asia
Indonesia has a wide range of social assistance program targeted at the poor households, the most important of these being the National Program for Community Empowerment (PNPM), which provides an umbrella framework for all community-driven development programs. The PNPM approach is to leverage local knowledge for identifying obstacles to development while building capacity for coordinated action. Within this framework, the government introduced in 2008 a program called the Community Life Improvement Program for the Urban Poor (PNPM-Urban), which is an upgrading program that combines top–down approach with the local conditions.
The overall development goal of PNPM-Urban is to improve living conditions within an environment of improved local governance. This is achieved through three main components—community empowerment, local government support and service provision, and local capacity building. The PNPM-Urban approach relies on volunteer, community-based organizations with elected leaders called BKM. The BKM formulates a community development plan to guide activities, with a small team for project administration and subproject implementation. BKM receives funding in three tranches every year for activities designed to meet the goals of community development plans. The program is a core part of the country’s poverty reduction strategy as well as national urban strategy.
A World Bank (2012a) evaluation study of the pilot program of PNPM-Urban notes that the program is an effective approach for community participation and for addressing basic infrastructure at the community level. Independent assessments of infrastructure quality have shown it to be high, and community organizations are perceived to be working well. The evaluation also identified a number of areas where the program could be improved to further enhance efficiency and impact. These areas include efforts to (i) strengthen project activities for social and economic needs, which may have a greater impact on individual and household welfare, (ii) ensure the participation of women and the poorest people in communities, (iii) more systematic program alignment with the local government’s budgeting processes, and (iv) further capacity building of facilitators. It also noted that the PNPM-Urban could be used as a platform to improve the targeting of social programs within poor communities.
Figure 11: Indonesia’s Urban Transition
1950
1960
1970
1980
1990
2000
2010
2030
2020
2040
2050
0.0
0.1
0.1
0.2
0.2
0.3
Popu
lati
on in
Mill
ions
Rural Population Urban PopulationYears
Source: UNDESA (2012).

45
Public Policy Responses to Urban Poverty
To address the issues of rapid urbanization, the Government of Indonesia has launched the Cities without Slums Program, which is incorporated in the Long-Term Development Plan, 2005–2008. The policy aims at alleviating the condition of informal settlements in cities by 2025. The government has also issued Law No. 1/2011 on Housing and Settlement Areas, which specifies the roles and responsibilities of central and local governments in providing housing and settlements.
The Philippines
The UN’s World Urbanization Prospects (UNDESA 2012), places the urban population of the Philippines at 45.3 million (2010) and its proportion to total population as 48.6% in 2010. It has been urbanizing at a moderate pace. Compared to other Southeast nations, its economic performance has been historically on the lower side. During 1990–2011, its per capita GDP grew at an average annual rate of 1.9%, which is a rate that is comparable to Indonesia (2.7%), Thailand (2.8%), and Viet Nam (6.0%). The Philippines has received investment grade from rating agencies and a process of reforms has been initiated by the present administration.
However, over the last decade, the Philippines achieved high and sustainable economic growth of around 5%–7%. Nevertheless, this good economic performance was not translated into jobs and poverty reduction. Poverty in the Philippines remained flat since 2006 and came down only by 1% between 2006 and 2012 to 27.9% as of 2012. The poverty line is P7,821/month for a family of 5, similar to the $1.25/day per capita international poverty line.
The 2012 figures for poverty incidence in Metropolitan Manila is about 12%. However, according to ADB, “a very large segment of the urban population is just above the poverty line and extremely vulnerable to slipping back into poverty” (ADB 2012e). According to the Housing and Urban Development Coordinating Council (HUDCC), urban households with limited or no access to basic services, security of tenure, and affordable housing have reached 3.6 million. Informal settlements are a growing problem in larger urban areas, with households residing in dangerous locations like railroad tracks and riverbanks. Less than 50% of the urban population have access to piped water or individual household connection. The Government of the Philippines is in the midst of introducing a major resettlement program for informal settlers who live in high-risk zones along the waterways.
Inequalities in the form of shelter deprivation and disparities in living standards and access to basic services and/or infrastructure are evident in most urban areas. These shelter inequalities depict significant polarization in the distribution of wealth and resources of cities, which have deepened poverty for those living in informal settlements. According to the UN-HABITAT, 40.9% or 18.3 million of the urban population of the Philippines live in informal settlements. Manila alone is home to over 4 million informal dwellers or 37% of the city’s population. Not all households in these settlements, however, are income poor. Only 32% of the informal dwellers (or less than a million people) are poor, based on national poverty lines. In most cities, but most pronounced in Manila, informal settlement communities and other smaller settlements with no security of tenure and inadequate access to basic services coexist with exclusive, fully serviced, and gated communities (Ballesteros 2010). Giving the provision of services for water supply and sanitation in Metro Manila to private concessionaires had brought in a huge increase in the service coverage—in the Eastern zone, the coverage is close to 100%, and that includes the poor households.
In the National Capital Region (Manila) and highly urbanized areas, the magnitude of housing need—backlog housing and new households—is staggering. Predictably, the greatest need for housing is in Manila, with a housing deficit of almost half a million units, followed by Southern Tagalog. The HUDCC estimated that by 2010, about 3.7 million housing units will be needed in the country. The worsening situation in the social housing sector is evident in Manila where about 43% of its more than 10 million inhabitants live in communities with substandard housing. The Philippines has involved the private sector strategically in the creation of affordable housing.
The government has put in a National Informal Settlers Slum Upgrading Strategy (NISUS), which was intended to guide the national government and local government units in preparing and implementing effective policies

46
Urban Poverty in Asia
and programs on upgrading the informal settlements. It aims to (i) provide analytical reference and support the key thrusts of the government to develop “sustainable communities” and complement the “National Government Resettlement Policy,” provide inputs in updating the National Urban Development and Housing Framework, and in preparing the Local Shelter Plans; (ii) align and feed into the preparation and implementation of the Philippine Development Plan, 2010–2016; and (iii) promote awareness, involvement, ownership, accountability, and partnerships among the stakeholders in the upgrading initiatives. The NISUS will serve as a reference in developing the resettlement policy as it is expected to define the parameters for the resettlement of communities. It will pursue further and expand the work of the interagency TWG on Informal Settlements.
The NISUS is expected to contribute to improved local governance and local economic development. In many major cities, informal settlement communities constitute a large part of the population. The strategy will help local government units to identify policy and program options for informal settlement upgrading that should be integrated into the local planning documents, such as the Comprehensive Land Use Plans, Comprehensive Development Plans, and Local Shelter Plans. The resulting investments (e.g., housing, related infrastructure, and social service for upgraded communities) will lead to creating job opportunities, real estate development, and intensified housing finance and development activities in these cities, thus contributing to local economic development.
Viet Nam
Viet Nam is one of those developing countries that have moved rapidly in terms of growth over the 1990–2010 period, posting an average annual growth rate of 6% in per capita GDP, rising from 20% to 30% in terms of urbanization level, and in terms of achieving progress in poverty alleviation. Viet Nam opened its economy in 1986, with a renovation program named Doi Moi to transform a centrally planned economy (CPE) into a market economy. As a result of the doi moi, the country has attained important economic outcomes. Viet Nam has an annual average economic growth of 6% in the 1990s and the 2000s. In the early 1990s, nearly 58% of Viet Nam’s population was below the poverty line ($1/day income), making Viet Nam one of the poorest countries, globally. Forward 20 years,
Figure 12: Philippines’s Urban Transition
1950
1960
1970
1980
1990
2000
2010
2030
2020
2040
2050
0.0
0.0
0.0
0.1
0.1
0.1
0.1
Rural Population Urban PopulationYears
Popu
lati
on in
Mill
ions
Source: UNDESA (2012).

47
Public Policy Responses to Urban Poverty
Box 10� Private Sector’s Housing Involvement in Manila’s Informal Settlement Communities
The National Urban Development and Housing Framework, 2009–2016 finds the urban housing problem to be serious (Philippine Development Plan, 2011–2016). The magnitude of housing need is estimated to reach 5.8 million housing units in 2016. Over the years, Manila has been unable to cope with its rapid population growth, making it one of the most densely populated megacities in the world. In Manila, the total backlog has been projected to reach 496,928 housing units. The housing problem is evident in the proliferation of slum areas and informal settlements. In Manila, there are 581,059 informal settlers.
The government realized that it could not meet the growing housing needs and came up with an innovative strategy that would involve the private sector and nongovernment organizations in housing provision. On its own, the government has allocated less than 1% of the total government expenditures for the housing sector in recent years, which makes Philippine public spending on housing one of the lowest in Asia. To rapidly address the housing problem, particularly the proliferation of informal settlements, the government has formulated a National Slum Upgrading Strategy that sets the targets for upgrading programs. The Philippines has decisively shifted from a state-led to a market-led form of housing provision with the enactment of the Urban Development and Housing Act of 1992. The new policy seeks to enable market actors to address urban housing needs through incentives and penalties. The Housing and Urban Development Coordinating Council, a government agency, is addressing the housing problem through innovative policies and programs, which are worthy of replication.
In addition, city governments engage the private sector in building low-cost housing on inclusive business models, where on-site resettlement and titling of land and houses for the poor is being financed through cross-subsidies from freed up land in which the developer is also investing in commercial building and housing for higher-income groups.
Source: Philippine Development Plan, 2011–2016.
Table 21: Poverty Rates and the Poverty Gap, Viet Nam (%)
1993 1998 2002
Poverty rate 58.1 37.4 28.9
Urban 25.1 9.2 6.6
Rural 66.4 45.5 35.6
Kinh and Chinese 53.9 31.1 23.1
Ethnic minorities 86.4 75.2 69.3
Poverty gap 18.5 9.5 6.9
Urban 6.4 1.7 1.3
Rural 21.5 11.8 8.7
Kinh and Chinese 16.0 7.1 4.7
Ethnic minorities 34.7 24.2 22.8
Source: The World Bank (2008).
Viet Nam was recognized by the world’s donor community as a success story, with overall poverty declining to 15% and urban poverty at 3.3%.

48
Urban Poverty in Asia
According to the Vietnam Household Living Standards Survey of 2008 (VHLSS-08), 14.5% of the country’s population is below the poverty line; the poverty rate is only 2.4% in Hanoi and 0.3% in Ho Chi Minh City. These figures have, however, been revised upward to 13.9% for Ho Chi Minch City and 1.6% for Hanoi. Hanoi uses a poverty line that is half as high, and by this measure, the poverty rate in Hanoi is 1.6% in 2009 (UNDP 2010). The most vulnerable category among the urban poor was the migrants without legal registration.
Although Viet Nam’s GDP is growing and income levels among the poor are rising, these have not necessarily translated into improved access to services and affordable housing for the urban poor. Almost 35.2% or 9.2 million of the urban population are said to be living in informal settlements, according to the UN-HABITAT definition. Only 59% of Viet Nam’s urban population has access to piped water supply. The health indicators in urban Viet Nam are higher than the average for urban Asia, but school life expectancy is 11.7 years, as against 12.4 years for urban Asia.
Viet Nam is an example that stands out for its success in growth and urban poverty reduction through proactive public interventions. This is attributed to trade liberalization, export promotion in labor-intensive manufacturing, and substantial investment in infrastructure and education and to investments targeted at regions with high numbers of poor people and high growth potential. The aim was to promote urban centers where capital and skills are more plentiful and to redistribute returns through public transfers to rural areas. The growth and poverty impact of this strategy has proven to be very successful. The public policy response of the Government of Viet Nam to urban poverty also includes strengthening social protection through area-based programs, social assistance, labor market policies, and social security schemes and programs.
Brazil
Brazil is moving forward toward diminishing inequality with a development agenda of economic growth, income distribution, and social inclusion. Despite the important achievements in economic and social development, the cities of Brazil still face critical challenges. Currently, 194 million people live in cities, which is 84.4% of the country’s
Figure 13: Viet Nam’s Urban Transition
1950
1960
1970
1980
1990
2000
2010
2030
2020
2040
2050
0.00
0.01
0.02
0.06
0.05
0.04
0.03
0.07
Rural Population Urban PopulationYears
Popu
lati
on in
Mill
ions
Source: UNDESA (2012).

49
Public Policy Responses to Urban Poverty
population. While the pace of urban growth has decreased, the favelas (informal settlements of Brazil) have grown faster than the cities in every decade since the 1950s. The term favela best describes the precarious and low-income housing settings in Brazil. In the 1980s and 1990s, the population in favelas increased by 7.6% and 4.2%, respectively, while the annual urban population growth rates were just 1.9% and 1.6%. Between 2000 and 2010, the population in favelas increased from 6.5 million to 11.4 million. Also, over the decades, favelas increased not only in numbers and size but also became socially, spatially, and economically heterogeneous. While varying in size, density, or risk exposure, these settings commonly have informal patterns of land occupation, limited access to services, and precarious living conditions. Social indicators suggest significant gaps in development.
In order to bring in a propoor housing and urban development strategy, the federal government launched a growth acceleration program called PAC in 2007. The goal was to increase investment in infrastructure and provide tax incentives for faster and more robust economic growth. One of the PAC subprograms is the PAC-Slum Upgrading (PAC-SU), which was designed to tackle the critical reality in Brazilian cities—providing infrastructure and improving the living conditions in favelas, particularly the largest ones. At the national level, three priority areas of intervention were identified within the PAC: transport, energy, and social–urban infrastructure. The Ministry of Cites and the National Housing Secretariat define the parameters for upgrading interventions in favelas, including the strategy for program implementation, and the instructions for project selection and execution. Municipal governments are the main decision makers at the local level. They are responsible for setting the criteria for public investments, selecting the areas to be upgraded, elaborating proposals, and executing projects. Beneficiaries and community-based organizations (CBOs) are expected to define a local agenda of priorities and take part in the consultation processes on project design and execution. PAC-SU mobilizes resources for slum upgrading. The bulk of funds comes from the Federal Budget. Additionally, local and state governments add counterpart funding to the slum upgrading interventions. The contribution is defined as a ratio of the total investment, varying from 5% to 10%, and can take the form of financial (cash) or physical resources (assets, land or services). The PAC-SU is essentially infrastructure programs designed to tackle the multifaceted deprivation in favelas. Its integrated approach includes four main components, as follows:
(i) Construction projects—infrastructure provision, accessibility, refurbishment or new housing provision.
(ii) Land regularization and tenure security—regularization of the settlement area in accordance with urban zoning and environmental legislation, tenure security for households benefited by the program.
(iii) Social support programs—participation and involvement of beneficiaries in the decision-making process, capacity building, awareness-raising, and alternatives for income generation.
(iv) Environmental projects—improvement of sanitation systems, recovery of degraded and hazardous areas, and environmental education.
The recent consolidation of programs to upgrade favelas in Brazil has been made possible by strong institutional foundations at national and subnational levels, coupled with political will and a robust momentum of the economy, which has supported public investments. The PAC-SU has achieved positive results in improving access to services, infrastructure, and housing in favelas. But the program faces challenges in combining the benefits in the built environment with social development and environmental sustainability. The continued growth of favelas and the remaining shortages in social services (as brought out by the National Census of 2010) suggest that there is much work to be done. Issues that will define the future of PAC-SU include how the program will interact with the long-term and strategic vision of national policies and how it will contribute to promote more inclusive urban and housing development in Brazil, including provision of tenurial security to the dwellers of favelas (Lonardoni 2013).
The above description is, at best, a brief sketch of the country’s positions and perspectives on issues of urban poverty. These, however, indicate the heterogeneity of the poverty issues and the diverse ways in which Asian countries have attempted to respond to urban poverty.

50
8 Asia’s Urban Poverty and What it May Mean for the People’s Republic of China and ADB
Asia’s Urban Poverty Load
Between 1990 and 2010, the Millennium Development Goal (MDG) target of halving global poverty (i.e., the proportion of people whose income was less than $1/day) was achieved 5 years ahead of schedule. Asia made significant contributions to this goal by lifting 758 million out of poverty; globally, the numbers of the poor who were taken out of poverty were 693 million, the lower global number being the effect of an increase in the numbers of the poor in Sub-Saharan Africa (SSA). Indeed, if the numbers are used as the principal yardstick for poverty reduction, then global poverty reduction between 1990 and 2010 was largely an Asian story. On urban poverty front, Asia also lifted 70 million people out of poverty, from a total of 93 million of the world’s urban poor.
At the same time, Asia presents to the global community a set of urban poverty challenges that are unprecedented in scale and complexity, as follows:
(i) Asia accounts for 70% of the world’s (developing countries) total urban poor. The proportion of the urban poor in Asia is higher when compared with the average for the developing world.
(ii) Asia accounts for over 60% of the developing countries total informal settlements’ population. This same population accounts for 28.6% of Asia’s total urban population. The UN-HABITAT (2010a) has registered high levels of shelter deprivation within these informal settlements in a large number of Asian cities and towns. In its report on Millennium Development Goals (MDGs), the United Nations (2010) noted that the number of informal dwellers in the developing world is actually growing, and will continue to rise in the near future. The progress made on reducing their number has not been sufficient to offset the growth of informal settlements in the developing world. Evidence from Asia is in line with the global trends.
(iii) Asia accounts for close to 70% of the world’s working poor, measured at $2/day and approximately 62% of them measured at $1.25/day. The working poor do not have access to what the International Labor Organization (ILO) calls decent jobs and work in the informal sector under highly unstable and vulnerable conditions. The recent deterioration of the labor market worldwide and in Asia has caused stagnation in formal employment. Those engaged in vulnerable employment are not typically bound by formal work arrangements.
(iv) Notwithstanding higher level of access to water and sanitation services in urban areas, Asia still has huge deficits and, according to the World Health Organization (WHO), will need to invest $38.5 billion in these services to be able to attain the MDG goals of water and sanitation;
(v) Asia is faced with a class of “new urban poor,” an outcome of the restructuring of the economies in the post-1990 period, reduced state sector relating to welfare provision, rural–urban migration, and a general meltdown in global financial and trade transactions. As Asian cities and towns are exposed internationally as indeed they are, they face far greater shocks that emanate from outside their country borders.

51
Asia’s Urban Poverty and What it May Mean for the PRC and ADB
(vi) Consumption poverty is particularly high in the relatively small and medium-sized towns; these towns have weak linkages with their rural hinterlands. Large cities, on the other hand, have higher proportions of population in informal settlements with unfavorable living conditions.
(vii) Asia’s burden of urban poverty is shared unequally among peoples of different ages and sexes. Although robust data on how these burdens are shared are thin, there is anecdotal and location-specific information that suggest that poor women, poor children, and poor youth are exposed to poverty in a bigger measure.
(viii) Economic growth is important for urban poverty reduction. According to the 14 Asian countries data, a 1% increase in per capita gross domestic product (GDP) has produced 0.25% reduction in urban poverty. While the urbanization–GDP nexus is positive, it is vastly untapped to yield its full potential.
(ix) Most Asian countries complement the GDP route to poverty reduction with programs directly targeted at the urban poor (Table 22).
(x) India and the PRC hold the key to urban poverty reduction in Asia and globally. They account for a greater part of Asia’s urban poverty, with India accounting for about one-third of the world’s (developing countries) urban poor, 13% of informal settlements’ population, and over 40% of the working poor. The PRC accounts for 22% of the world’s informal dwellers, and this consists of a class of new urban poor the numbers of which are not available but are estimated to be significant. This is an important aspect of emerging poverty in Asian cities and towns, where poverty is a function not only of the domestic factors and policies, but determined by factors that are external to the country borders. Any progress in global poverty and poverty in Asia is crucially dependent on how India manages its growth and urbanization policies, and how the PRC manages to integrate its informal dwellers with the cities’ population and address growing inequalities. The February 2012 notification of the PRC government gives small and medium-sized cities the right to grant hukoa to their residents, excluding 164 largest cities in the PRC from this notification.12 The other crucial determinant of the progress of global poverty and poverty in Asia is the speed with which Asian economies are able to put social security systems to safeguard the poor from shocks that are external to their borders.
12 According to the Investment Strategy of [the People’s Republic of] China dated 27 February 2012, the State Council has set new parameters for hukou reforms under which all small cities can now grant urban hukou to residents who have a steady job and a steady dwelling place, and under which medium-sized cities can grant hukou to those with 3 years minimum of employment history and a steady dwelling place. See Merril Lynch. 2012. [People’s Republic of] China: A Strategist’s Diary. 27 February.
Table 22: Country-Specific Interventions for Urban Poverty Reduction
PRC Dibao
Bangladesh Urban Partnership for Poverty Reduction (UPPR)
India Jawaharlal Nehru National Urban Renewal Mission (JNNURM)
Rajiv Awas Yojna (RAY)
Pakistan Urban Poverty Alleviation Programme (UPAP)
Cambodia National Social Security Strategy
National Poor Development Fund (NPDF)
Indonesia National Programme for Community Empowerment (PNPM)
Community Life Improvement Programme for the Urban Poor (PNPM-Urban)
Philippines Development of Poor User Communities
Viet Nam Doi Moi
PRC = People’s Republic of China.

52
Urban Poverty in Asia
Directions for the People’s Republic of China’s urban poverty
It must be acknowledged that the PRC’s urbanization has taken place under conditions that are vastly different from those observed in most Asian countries. It is a product of the long-practiced “one child policy” and hukou system, which restricts mobility and residency in places other than those of registration. Moreover, the post-1980 urbanization in the PRC has passed through an interesting phase of the development of small to mid-sized urban centers using the concept of Li Tu Bu Li Ziang—“leave the soil but not the village.” It was part of the government’s land use policy, aimed at reducing low-efficiency land-use patterns by merging dispersed residential clusters into one town or small city. The 1980–2000 period also saw an increase in the number of cities via the upgrading of rapidly growing towns to city status, leading to the identification of urbanization as one of the overarching policies in its Tenth Five-Year Plan 2000–2005. The biggest policy change was that the government perceived urbanization as a key ally in economic development efforts. The bias against large cities has weakened as it became evident that while small cities were effective in absorbing local surplus labor, they lacked agglomeration and economies of scale. It was accompanied by a partial relaxation of the hukou system. Since then, urbanization has played a dominant role in guiding the PRC’s development and has been closely linked to the country’s increasing application of government policy.
The PRC’s urban poverty is best exemplified in the following two areas: (i) informal dwellers of over 180 million people (i.e., those who live with reduced scale of rights, benefits, and services); and (ii) a class of new urban poor displaced by the forces of globalization, by a fall in the demand for exports, reduction in state benefits, and rural-to-urban migration. A publication of the Organization for Economic Co-operation and Development (OECD) indicates that large-scale urban development and urban economic restructuring has resulted in relocation of residents and increasing unemployment and poverty in Chinese cities. The most distinctive group is the rural-to-urban migrants, since a comprehensive system of welfare (e.g., unemployment insurance, pension, medical care, and public housing) for new migrants from rural areas is not available for them. Besides, there is little social assistance and public infrastructure for these migrants. Another major urban poverty group is perhaps the laid-off workers from state-owned enterprises (SOEs).
If these are the manifestations of urban poverty in the PRC, the policy responses would seem to center around (i) developing a mechanism of integrating informal settlements within cities and mainstreaming of urban development—with several countries currently aiming at having cities free of informal dwellers by assigning these residents with some form of tenurial security to enable them to improve and upgrade their habitat with basic services; (ii) organizing informal dwellers into small communities to empower them and make the transition cost-effective and efficient; and (iii) strengthening the social protection measures. An ADB publication points out that the social protection index of the PRC is lower than that of the average for East Asian economies. It also points out that the unweighed social protection index for labor market programs for the PRC is 0.048 compared to 0.078 for the East Asian economies. It would appear necessary to examine ways that would allow this index to be strengthened (ADB 2013c).
In 2008, Armin Bauer et al. (2008) produced a paper on the implications of the World Bank’s new poverty data for ADB. They pointed out that while poverty reduction continued to be ADB’s overarching goal, its knowledge work was less focused on achieving direct poverty reduction. This paper indicated that poverty reduction was in no way a finished business, and referred to the need to introduce, among other things, “spatial dimensions into the poverty discussion [that] go beyond rural–urban divide.” The authors added that “broader investment in slum development (mostly related to housing, slum upgrading, and urban planning, rather than confined mainly to drinking water and sanitation, would be more useful” (Armin Bauer et al. 2008). The analysis that this paper presented underlines the need for ADB to bring in a direct focus on urban poverty for three principal reasons, as follows:

53
Asia’s Urban Poverty and What it May Mean for the PRC and ADB
(i) Trends toward increasing poverty in urban areas—while the numbers in this respect are not yet robust, the fact that the shares of the urban poor in the Asia’s total poor, that the numbers of the urban poor have risen in several Asian countries, and that the rate of decline in urban poverty has been lower than that in rural poverty—underscore the importance and urgency of a direct focus on urban poverty.
(ii) Urban poverty is not just consumption poverty, it has dimensions that relate to three important forms of deficits—shelter deficit, as shown in the large number of households living as informal dwellers in slum-like condition, livelihood deficits, as shown in the burgeoning informal sector and rising proportion of the working poor, and service deficits directly affecting the productivity and quality of life of the urban poor. Explicit recognition of the multi-dimensionality of urban poverty will be an important step for ADB to design its directions more suitably.
(iii) Trend toward increasing informality in the urban labor market across Asian countries. While these trends are evident, the explanation underlying the trends is not, presenting to ADB a fresh agenda of exploring how rising informality—said to be suboptimal—coheres with rising GDP growth.
There are other implications for ADB. The first relates to the urban poverty data sets, which this paper shows ends with 2008, for which the Global Monitoring Report provides the proportions of the rural and urban poor at 2005 purchasing power parity (PPP). The 2008 poverty data, however, cannot be assumed to be representative of the year 2013, especially in the light of dramatic events that have marked the post-2008 period. As Asia becomes increasingly urban and exposed to global cycles, it becomes even more compelling to have urban–rural distribution of the poor across regions and across major countries, at least those countries that have populations in excess of 100 million, for a realistic assessment of its nature, size, and dimensions.
Second, the period 2008–2013 has witnessed globally a crises of unprecedented proportions and globalization has come under serious questioning and scrutiny. Many Asian countries have experienced its impact on GDP growth and on the volumes of trade and financial transactions. The 2008 estimates of urban poverty do not capture the effect of the crises. Judy Baker (2008), in her Impacts of Financial, Food and Fuel Crises on the Urban Poor, observed: “The urban poor are particularly vulnerable in times of crises due to their heavy reliance on the cash economy, job losses and wage reductions in urban-based industries and no agricultural production to fall back on.” According to Baker (2008), the impacts on poverty from the food and fuel crises have been significant. “The rise in food prices between 2007 and early 2008 was estimated to have increased the share of the population in East Asia, the Middle East, and South Asia living in extreme poverty by at least 1%. The impact on the urban poor was particularly acute, increasing the incidence of urban poverty by more than 1.5 percentage points in East Asia, the Middle East, South Asia and Sub-Saharan Africa.” Her analysis shows that with the financial crisis, growth is slowing and exports from the developing to developed countries are declining. In places such as Dhaka (Bangladesh), where many of the garment workers already fall below the poverty line, job losses or reduction in wages could result in higher levels of extreme poverty. In the PRC, reduced foreign demand for Chinese goods has caused closure and job losses in cities. “Companies have closed along the eastern coastal belt, with more failures expected over the coming months, leaving Beijing increasingly concerned about the implications for social salability”. It is important for ADB to undertake an assessment of the impact of the financial crises on the urban poor in Asian economies, particularly those that have substantial trade and financial transactions.
Third, most countries have in place specific interventions to reduce urban poverty. Reviews of these interventions indicate that the primary purpose of these interventions is alleviation of poverty by bridging the gap or the deficit in income-consumption, shelter, livelihood, or services. Examples of countries designing preventive strategies are few—even in informal settlement prevention where global research links proliferation of such settlements to the nonfunctioning of urban land markets. Few countries have taken explicit policy decisions to reform urban land markets. It is important for ADB to bring in its lending operations some key elements for introducing reforms in spheres such as the urban land and urban labor markets.

54
Urban Poverty in Asia
End of Poverty in 2030 (or 2025 AD)
The attainment of the MDG goal of halving poverty 5 years ahead of schedule has triggered a global debate on what the The Economist (2013) calls an obvious question—“If extreme poverty could be halved in the past 2 decades, why should the other half not be got rid of in the next two? If 21% was possible in 2010, why not 1% in 2030?”13 This question has intensified the poverty debate and is a subject of discussion in various quarters. In a paper by Chandy et al. (2013), they observed that “between 1990 and 2010, the share of the population of the developing world living in extreme poverty was cut in half.” This fulfilled the first and foremost Millennium Development Goal (MDG) 5 years ahead of schedule. Moreover, it would appear to bring the end of extreme poverty within reach. If the same rate of global progress is sustained, extreme poverty will be eliminated in 2030. In other words, if it took 20 years to lift half the world’s poor above the poverty line, a further 20 years should take care of the other half. This has rightfully got people excited. In the words of the Irish singer Bono, “The zero zone—is just around the corner (Chandy et al. 2013).” Chandy and the others would then ask: what are reasonable expectations for how poverty will unfold over the coming years? How feasible is it for extreme poverty to be eliminated by 2030? And what factors will determine progress toward this goal? Martin Ravallion (2013) has also asked the same question in his paper, “How long will it take to lift one billion people out of poverty?” Ravallion (2013) develops explicit scenarios for future growth and distributional change, informed by knowledge of recent past performance against poverty and current expectations about growth prospects across the developing world. Chandy et al. (2013) and others derive a range of plausible poverty outcomes based on alternative scenarios for how mean consumption per person and the distribution of consumption in each country might evolve in the next 2 decades.
Significantly, such discussions and forecasts ignore urban poverty and the emerging evidence that poverty may be shifting to cities and towns. Lifting the urban poor out of poverty has thus far been of secondary importance. Scholars link this to the unpreparedness of countries to manage the phenomenon of urbanization of which urban poverty is an integral part, hence, calling for a major engagement of ADB with the expanding phenomenon of urbanization.
13 See The Economist (2013). This issue further notes that “In April at a press conference during the spring meeting of the international financial institutions in Washington D.C., the President of the World Bank Jim Yong Kim scrawled the figure “2030” on a sheet of paper, held it up and announced, “That is it. This is the global target to end poverty.”

55
Annex Tables
Table 1: Aggregate Poverty: Regional Aggregations 1990, 2008, and 2010 (using 2005 PPP and $1.25/day poverty line)
East Asia and Pacific
(EAP)South Asia
(SAS) Asia
Eastern Europe and
Central Asia (ECA)
Latin America
and Caribbean
(LAC)
Middle East and
North Africa (MNA)
Sub-Sahara Africa (SSA)
Developing World
1990
Headcount ratio (%) 56.2 53.8 55.2 1.9 12.2 5.8 56.5 43.1
Number of poor (in million) 926.4 617.3 1,543.7 8.6 53.4 13.0 289.7 1,908.4
Share of the poor population in the developing world (%) 48.5 32.3 80.9 0.5 2.8 0.7 15.2 100.0
Share of the population in the developing world (%) 37.8 26.3 64.1 9.0 10.0 5.2 11.8 100.0
2008
Headcount ratio (%) 14.3 36.0 24.3 0.5 6.5 2.7 49.2 22.7
Number of poor (in million) 284.4 570.7 855.1 2.2 36.9 8.6 399.3 1,301.9
Share of the poor population in the developing world (%) 21.8 43.8 65.7 0.2 2.8 0.7 30.7 100.0
Share of the population in the developing world (%) 34.4 28.2 62.6 7.1 10.1 5.7 14.4 100.0
2010
Headcount ratio (%) 12.5 31.0 20.8 0.7 5.5 2.4 48.5 20.6
Number of poor (in million) 250.9 506.8 757.7 3.2 32.3 8.0 413.7 1,215.0
Share of the poor population in the developing world (%) 20.7 41.7 62.4 0.3 2.7 0.7 34.1 100.0
Share of the population in the developing world (%) 34.6 28.1 62.6 7.0 10.0 5.7 14.7 100.0
Note: Asia is the sum of East Asia & Pacific (EAP) and South Asia (SAS) regions as defined by the World Bank.
Source: Calculations based on World Bank PovcalNet database, accessed on 9 May 2013.

56
Annex Tables
Table 2: Aggregate Poverty: Regional Aggregations (using $1.25/day poverty line)
Regions
Head count rates below $1.25 a day Number of Poor (in million)Decline/ Increase
1990–2008 (in million)2008 1990 2008 1990
Rural Urban Rural Urban Rural Urban Rural Urban Rural Urban
East Asia and Pacific 20.4 4.3 67.5 24.4 215.5 37.7 778.0 110.3 562.4 72.5
South Asia 38.0 29.7 50.5 40.1 422.7 140.8 434.4 114.9 11.8 –25.9
Asia 29.4 13.2 60.2 30.5 638.2 178.6 1,212.4 225.1 574.2 46.6
Europe and Central Asia 1.2 0.2 2.2 0.9 1.7 0.5 3.2 2.2 1.5 1.7
Latin America and the Caribbean 13.2 3.1 21.0 7.4 16.4 13.8 27.1 22.8 10.7 9.0
Middle East and North Africa 4.1 0.8 9.1 1.9 5.5 1.5 9.9 2.2 4.4 0.7
Sub-Saharan Africa 47.1 33.6 55.0 41.5 247.8 96.1 203.2 59.3 –44.7 –36.8
Developing World 29.4 11.6 52.5 20.5 910.9 293.0 1,452.1 318.0 541.2 25.0
Note: Asia is the sum of East Asia & Pacific (EAP) and South Asia (SAS) regions as defined by the World Bank.
Source: Calculations based on the Global Monitoring Report 2013, and World Bank Indicators database for population figures.
Table 3: Urban and rural poverty measures using a poverty line of $1.08/day (in 1993 PPP): Regions and the World
Regions
Number of poor (millions) Headcount index (%) Urban share of the poor (%)
Urban share of the Population (%)Urban Rural Total Urban Rural Total
1993
East Asia and Pacific (EAP) 28.4 407.2 435.6 5.5 35.5 26.2 6.5 31.1
PRC (included in EAP) 11.0 331.4 342.4 3.3 39.1 29.1 3.2 29.8
Eastern Europe and Central Asia (ECA) 6.1 6.4 12.5 2.1 3.7 2.7 49.0 63.1
Latin America and Caribbean (LAC) 26.1 28.6 54.6 7.8 22.4 11.9 47.7 72.3
Middle East and North Africa (MNA) 0.8 4.3 5.1 0.6 3.8 2.1 15.3 52.8
South Asia (SAS) 113.8 385.0 498.8 37.4 43.7 42.1 22.8 25.7
India (included in SAS) 100.5 326.2 426.7 42.7 49.1 47.5 23.6 26.2
Sub-Saharan Africa (SSA) 66.4 206.7 273.2 40.2 53.1 49.2 24.3 29.8
World 241.5 1,038.1 1,279.6 13.8 36.6 28.0 18.9 38.1
Less the PRC 230.6 706.7 937.3 16.3 35.6 27.6 24.6 41.6
2002
East Asia & Pacific (EAP) 15.8 217.8 233.6 2.2 19.8 13.0 6.6 38.8
continued on next page
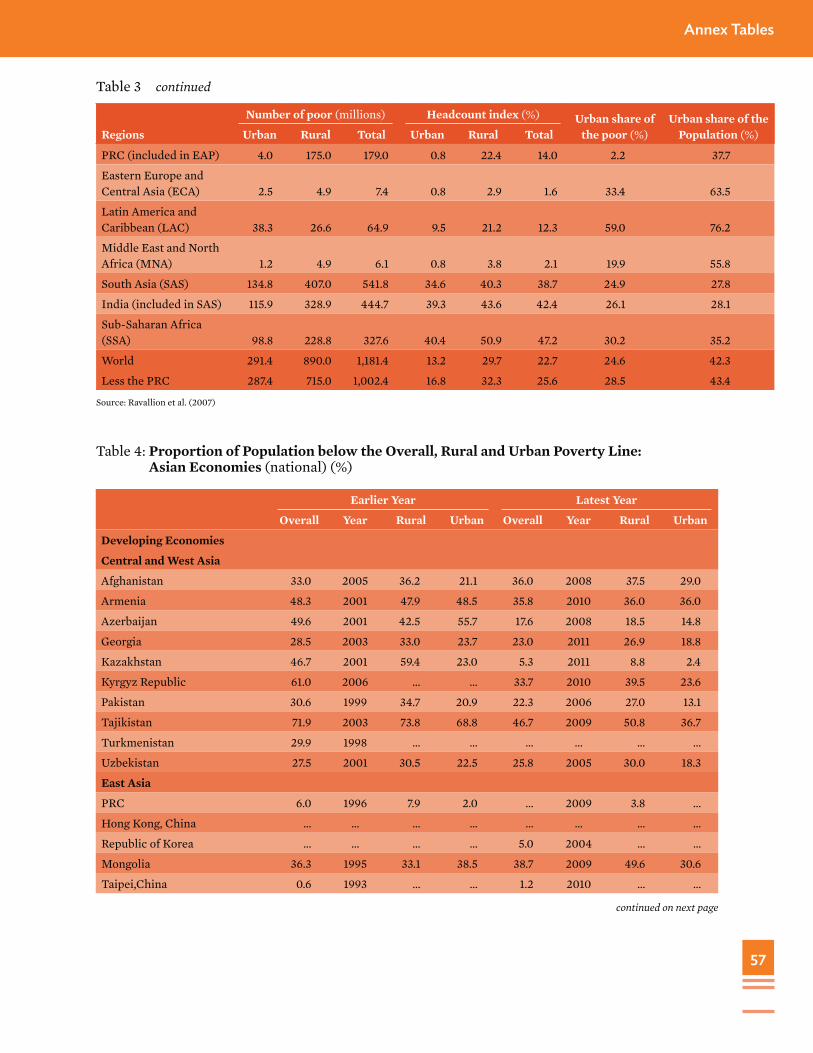
57
Annex Tables
Regions
Number of poor (millions) Headcount index (%) Urban share of the poor (%)
Urban share of the Population (%)Urban Rural Total Urban Rural Total
PRC (included in EAP) 4.0 175.0 179.0 0.8 22.4 14.0 2.2 37.7
Eastern Europe and Central Asia (ECA) 2.5 4.9 7.4 0.8 2.9 1.6 33.4 63.5
Latin America and Caribbean (LAC) 38.3 26.6 64.9 9.5 21.2 12.3 59.0 76.2
Middle East and North Africa (MNA) 1.2 4.9 6.1 0.8 3.8 2.1 19.9 55.8
South Asia (SAS) 134.8 407.0 541.8 34.6 40.3 38.7 24.9 27.8
India (included in SAS) 115.9 328.9 444.7 39.3 43.6 42.4 26.1 28.1
Sub-Saharan Africa (SSA) 98.8 228.8 327.6 40.4 50.9 47.2 30.2 35.2
World 291.4 890.0 1,181.4 13.2 29.7 22.7 24.6 42.3
Less the PRC 287.4 715.0 1,002.4 16.8 32.3 25.6 28.5 43.4
Source: Ravallion et al. (2007)
Table 4: Proportion of Population below the Overall, Rural and Urban Poverty Line: Asian Economies (national) (%)
Earlier Year Latest Year
Overall Year Rural Urban Overall Year Rural Urban
Developing Economies
Central and West Asia
Afghanistan 33.0 2005 36.2 21.1 36.0 2008 37.5 29.0
Armenia 48.3 2001 47.9 48.5 35.8 2010 36.0 36.0
Azerbaijan 49.6 2001 42.5 55.7 17.6 2008 18.5 14.8
Georgia 28.5 2003 33.0 23.7 23.0 2011 26.9 18.8
Kazakhstan 46.7 2001 59.4 23.0 5.3 2011 8.8 2.4
Kyrgyz Republic 61.0 2006 … … 33.7 2010 39.5 23.6
Pakistan 30.6 1999 34.7 20.9 22.3 2006 27.0 13.1
Tajikistan 71.9 2003 73.8 68.8 46.7 2009 50.8 36.7
Turkmenistan 29.9 1998 … … … … … …
Uzbekistan 27.5 2001 30.5 22.5 25.8 2005 30.0 18.3
East Asia
PRC 6.0 1996 7.9 2.0 … 2009 3.8 …
Hong Kong, China … … … … … … … …
Republic of Korea … … … … 5.0 2004 … …
Mongolia 36.3 1995 33.1 38.5 38.7 2009 49.6 30.6
Taipei,China 0.6 1993 … … 1.2 2010 … …
continued on next page
Table 3�continued

58
Annex Tables
Earlier Year Latest Year
Overall Year Rural Urban Overall Year Rural Urban
South Asia
Bangladesh 56.6 1992 58.7 42.7 31.5 2010 35.2 21.3
Bhutan 31.7 2003 38.3 4.2 23.2 2007 30.9 1.7
India 45.3 1994 50.1 31.8 29.8 2010 33.8 20.9
Maldives … … … … 15.0 2010 … …
Nepal 41.8 1996 43.3 21.6 25.2 2011 27.4 15.5
Sri Lanka 26.1 1991 29.5 16.3 8.9 2010 9.4 5.3
Southeast Asia
Brunei Darussalam … … … … … … … …
Cambodia 37.7 1997 40.1 21.1 30.1 2007 34.5 11.8
Indonesia 17.6 1996 19.8 13.6 12.5 2011 15.7 9.2
Lao PDR 45.0 1992 48.7 33.1 27.6 2008 31.7 17.4
Malaysia 5.7 2004 11.9 2.5 3.8 2009 8.4 1.7
Myanmar … … … … 25.6 2010 29.2 15.7
Philippines 32.1 1994 45.4 18.6 26.5 2009 … …
Singapore … … … … … … … …
Thailand 33.7 1990 39.2 20.5 7.8 2010 10.4 3.0
Viet Nam 58.1 1993 66.4 25.1 14.5 2008 18.7 3.3
The Pacific
Cook Islands … … … … 28.4 2006 … …
Fiji 35.0 2003 40.0 28.0 31.0 2009 43.3 18.6
Kiribati … … … … 21.8 2006 … …
Marshall Islands … … … … 52.7 2002 … …
Micronesia 27.9 1998 … … 31.4 2005 … …
Nauru … … … … 25.1 2006 … …
Palau … … … … 24.9 2006 … …
Papua New Guinea 30.0 1990 … … 28.0 2009 … …
Samoa 22.9 2002 … … 26.9 2008 … …
Solomon Islands … … … … 22.7 2006 … …
Timor-Leste 39.7 2001 … … 41.1 2009 … …
Tonga 16.2 2001 … … 22.5 2009 … …
Tuvalu 23.2 1994 … … 26.3 2010 … …
Vanuatu 13.0 2006 … … 12.7 2010 … …
Developed Economies
Australia … … … … … … … …
Japan … … … … … … … …
New Zealand … … … … … … … …
PRC = People’s Republic of China, Lao PDR = Lao People’s Democratic Republic, Myanmar = Republic of the Union of Myanmar.
Source: Framework of Inclusive Growth Indicators 2012, ADB; UN Millennium Database 2012; and World Development Indicators database 2012
Table 4�continued

59
Annex Tables
Table 5: Absolute Number of Poor: Overall, Rural and Urban (in million)
Earlier Year Latest YearDifference
(latest minus earlier)
Year Overall Rural Urban Year Overall Rural Urban Overall Rural Urban
Central and West Asia
Afghanistan 2005 9.1 7.8 1.3 2008 10.1 8.3 1.8 1.0 0.5 0.6
Armenia 2001 1.5 0.5 1.0 2010 1.1 0.4 0.7 –0.4 –0.1 –0.3
Azerbaijan 2001 4.0 1.7 2.3 2008 1.5 0.8 0.7 –2.5 –0.9 –1.6
Georgia 2003 1.3 0.7 0.6 2011 1.0 0.6 0.4 –0.3 –0.1 –0.1
Kazakhstan 2001 5.9 3.9 1.9 2011 0.9 0.7 0.2 –5.0 –3.3 –1.7
Pakistan 1999 43.5 33.5 10.0 2006 35.2 28.1 7.2 –8.3 –5.5 –2.8
Tajikistan 2003 4.7 3.5 1.2 2009 3.2 2.6 0.7 –1.4 –0.9 –0.5
Uzbekistan 2001 6.8 4.7 2.1 2005 6.7 4.9 1.7 –0.1 0.2 –0.3
East Asia
Mongolia 1995 0.8 0.3 0.5 2009 1.0 0.4 0.6 0.2 0.1 0.1
South Asia
Bangladesh 1992 58.4 49.5 8.9 2010 46.6 37.7 8.8 –11.9 –11.8 –0.1
Bhutan 2003 0.2 0.2 0.0 2007 0.1 0.1 0.0 0.0 0.0 0.0
India 1994 435.3 354.6 80.7 2010 365.1 285.9 79.2 –70.2 –68.7 –1.5
Nepal 1996 8.8 8.3 0.5 2011 7.6 6.8 0.8 –1.2 –1.5 0.3
Sri Lanka 1991 4.7 4.2 0.5 2010 1.8 1.7 0.2 –2.9 –2.6 –0.3
Southeast Asia
Cambodia 1997 4.1 3.7 0.4 2007 4.0 3.7 0.3 –0.1 0.0 –0.1
Indonesia 1996 35.1 25.4 9.6 2011 29.9 18.9 11.0 –5.2 –6.6 1.4
Lao PDR 1992 1.9 1.7 0.2 2008 1.7 1.3 0.4 –0.3 –0.4 0.1
Malaysia 2004 1.4 1.0 0.4 2009 1.0 0.7 0.3 –0.4 –0.3 –0.1
Thailand 1990 19.2 15.8 3.4 2010 5.5 4.8 0.7 –13.8 –11.0 –2.7
Viet Nam 1993 42.4 38.2 4.1 2008 12.3 11.4 0.9 –30.0 –26.8 –3.2
The Pacific
Fiji 2003 0.3 0.2 0.1 2009 0.3 0.2 0.1 0.0 0.0 0.0
Total 689.5 559.7 129.7 536.6 419.9 116.7 –152.9 –139.8 –13.1
Lao PDR = Lao People’s Democratic Republic.
Sources: Calculations were based on data from the Framework of Inclusive Growth Indicators (ADB 2012b), UN Millennium Database 2012, and World Development Indicators database 2012, with population estimated from the World Urbanization Prospects: The 2011 Revision (UN 2012).

60
Annex Tables
Table 6: Rural and Urban Poverty Gap Ratios and Gini Indices: People’s Republic of China, India, and Indonesia
Country
Headcount ratio (%) Poverty Gap (%) Gini coefficient (%)
Rural Urban Rural Urban Rural Urban
People’s Republic of China 1994 80.61 12.55 35.71 2.64 0.338 0.292
2005 26.11 1.71 6.46 0.45 0.359 0.348
2008 22.27 0.89 5.48 0.28 0.394 0.352
India 1993–94 52.46 40.77 14.33 11.39 0.286 0.343
2004–05 43.83 36.16 10.66 10.16 0.305 0.376
2009–10 34.28 28.93 7.53 7.39 0.300 0.393
Indonesia 1993 58.14 47.01 16.36 14.32 0.260 0.353
2005 24.01 18.67 5.03 4.06 0.295 0.399
2011 14.97 17.40 2.13 3.22 0.340 0.422
Source: World Bank PovcalNet database, accessed on 5 April 2013.
Table 7: Slum population (absolute numbers and proportions): Some Asian countries: 1990, 1995, 2000, 2005, 2007, 2009
Country
Proportion of urban population living in slums (%) Slum Population at mid-year (million)
1990 1995 2000 2005 2007 2009 1990 1995 2000 2005 2007 2009
Bangladesh 87.3 84.7 77.8 70.8 66.2 61.6 20.0 23.5 25.8 27.8 27.8 27.5
Cambodia -- -- -- 78.9 -- -- -- -- -- 2.1 -- --
PRC 43.6 40.5 37.3 32.9 31.0 29.1 131.7 151.4 169.1 183.5 182.9 180.6
India 54.9 48.2 41.5 34.8 32.1 29.4 121.0 122.2 119.7 112.9 109.1 104.7
Indonesia 50.8 42.6 34.4 26.3 23.0 23.0 27.6 29.0 29.7 24.8 22.5 23.3
Lao PDR -- -- -- 79.3 -- -- -- -- -- 1.3 -- --
Mongolia 68.5 66.7 64.9 57.9 57.9 -- 0.9 0.9 0.9 0.9 0.9 --
Myanmar -- -- -- 45.6 -- -- -- -- -- 6.7 -- --
Nepal 70.6 67.3 64.0 60.7 59.4 58.1 1.2 1.6 2.1 2.6 2.9 3.1
Pakistan 51.0 49.8 48.7 47.5 47.0 46.6 18.1 20.7 23.9 27.2 28.5 30.0
Philippines 54.3 50.8 47.2 43.7 42.3 40.9 16.5 17.2 17.6 18.0 18.1 18.3
Thailand -- -- -- 26.0 26.5 27.0 -- -- -- 5.5 5.8 6.1
Viet Nam 60.5 54.6 48.8 41.3 38.3 35.2 8.1 8.9 9.4 9.5 9.4 9.2
Lao PDR = Lao People’s Democratic Republic, Myanmar = Republic of the Union of Myanmar.
Source: UN-HABITAT (2012a)

61
Annex Tables
Table 8: Distribution of households by type of residence: Some Asian countries: 2000–2005
Country Type of household
Area with 25% or less slum households
Area with 26%–50% slum
households
Area with 51%–75% slum
households
Area with 75% or more slum
households
Bangladesh Nonslum household 31.5 23.8 28.2 16.4
Bangladesh Slum household 0.7 2.8 7.3 89.2
India Nonslum household 14.9 54.4 28.1 2.6
India Slum household 3.3 36.8 43.3 16.5
Indonesia Nonslum household 38.6 36.0 19.7 5.6
Indonesia Slum household 6.3 19.7 33.1 40.8
Nepal Nonslum household 62.0 14.6 14.2 9.2
Nepal Slum household 7.0 8.9 17.5 66.7
Pakistan Nonslum household 15.3 19.5 46.7 18.5
Pakistan Slum household 5.1 5.8 36.7 52.4
Philippines Nonslum household 63.1 30.5 5.6 0.7
Philippines Slum household 24.9 40.7 22.0 12.4
Viet Nam Nonslum household 52.2 35.5 9.3 3.0
Viet Nam Slum household 17.0 23.9 18.9 40.1
Armenia Nonslum household 73.5 11.7 9.1 5.7
Armenia Slum household 9.8 11.4 25.6 53.3
Kazakhstan Nonslum household 43.9 30.3 18.4 7.4
Kazakhstan Slum household 5.0 14.5 24.4 56.1
The Kyrgyzs Republic Nonslum household 68.9 14.0 10.5 6.7
The Kyrgyzs Republic Slum household 4.6 2.9 7.4 85.1
Uzbekistan Nonslum household 42.8 23.7 19.8 13.8
Uzbekistan Slum household 1.5 2.8 6.2 89.5
Source: UN-HABITAT, Global Urban Indicators Database (2012a).
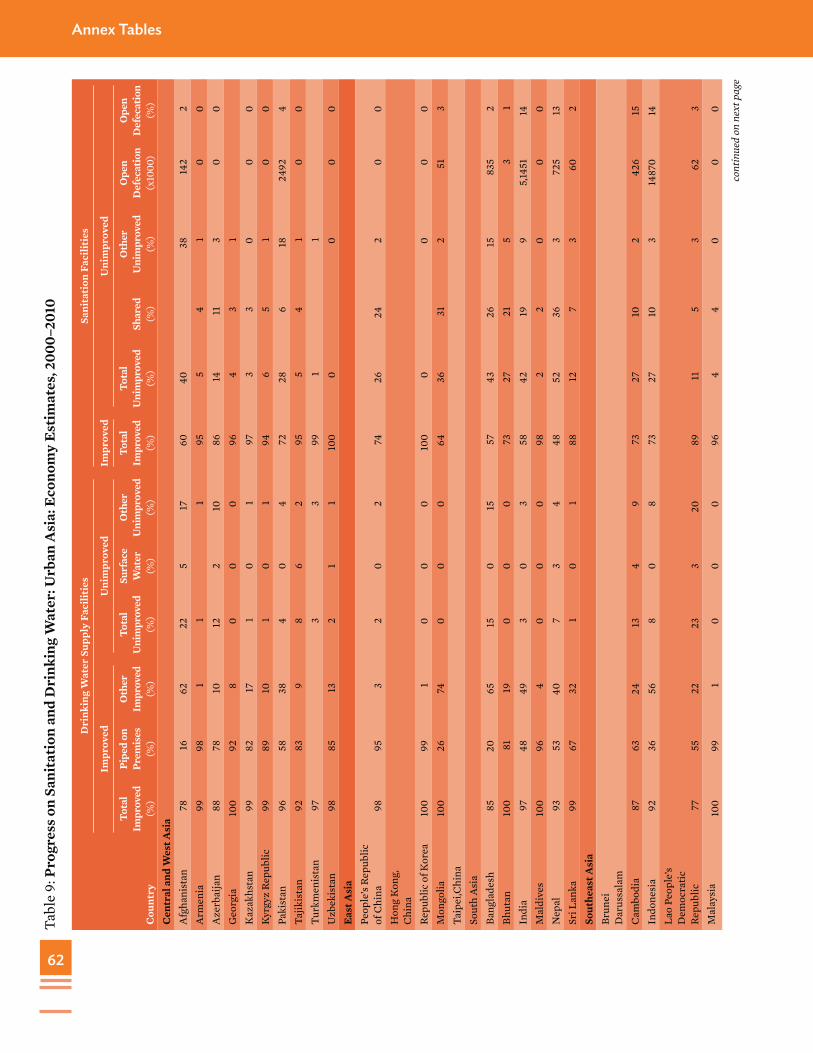
62
Annex TablesTa
ble
9: P
rogr
ess o
n Sa
nita
tion
and
Dri
nkin
g W
ater
: Urb
an A
sia:
Eco
nom
y E
stim
ates
, 200
0–20
10
Cou
ntry
Dri
nkin
g W
ater
Sup
ply
Faci
litie
sSa
nita
tion
Fac
iliti
es
Impr
oved
Uni
mpr
oved
Impr
oved
Uni
mpr
oved
Tota
l Im
prov
ed
(%)
Pipe
d on
Pr
emis
es
(%)
Oth
er
Impr
oved
(%
)
Tota
l U
nim
prov
ed
(%)
Surf
ace
Wat
er
(%)
Oth
er
Uni
mpr
oved
(%
)
Tota
l Im
prov
ed
(%)
Tota
l U
nim
prov
ed
(%)
Shar
ed
(%)
Oth
er
Uni
mpr
oved
(%
)
Ope
n D
efec
atio
n (x
1000
)
Ope
n D
efec
atio
n (%
)C
entr
al a
nd W
est A
sia
Afg
hani
stan
7816
6222
517
6040
3814
22
Arm
enia
9998
11
195
54
10
0A
zerb
aija
n88
7810
122
1086
1411
30
0G
eorg
ia10
092
80
00
964
31
Kaz
akhs
tan
9982
171
01
973
30
00
Kyr
gyz
Repu
blic
9989
101
01
946
51
00
Paki
stan
9658
384
04
7228
618
2492
4Ta
jikis
tan
9283
98
62
955
41
00
Turk
men
ista
n97
33
991
1U
zbek
ista
n98
8513
21
110
00
00
0E
ast A
sia
Peop
le’s
Repu
blic
of
Chi
na98
953
20
274
2624
20
0H
ong
Kon
g,
Chi
naRe
publ
ic o
f Kor
ea10
099
10
00
100
00
00
Mon
golia
100
2674
00
064
3631
251
3Ta
ipei
,Chi
naSo
uth
Asi
aBa
ngla
desh
8520
6515
015
5743
2615
835
2Bh
utan
100
8119
00
073
2721
53
1In
dia
9748
493
03
5842
199
5,14
5114
Mal
dive
s10
096
40
00
982
20
00
Nep
al93
5340
73
448
5236
372
513
Sri L
anka
9967
321
01
8812
73
602
Sout
heas
t Asi
aBr
unei
D
arus
sala
mC
ambo
dia
8763
2413
49
7327
102
426
15In
done
sia
9236
568
08
7327
103
1487
014
Lao
Peop
le’s
Dem
ocra
tic
Repu
blic
7755
2223
320
8911
53
623
Mal
aysi
a10
099
10
00
964
40
00
cont
inue
d on
nex
t pag
e
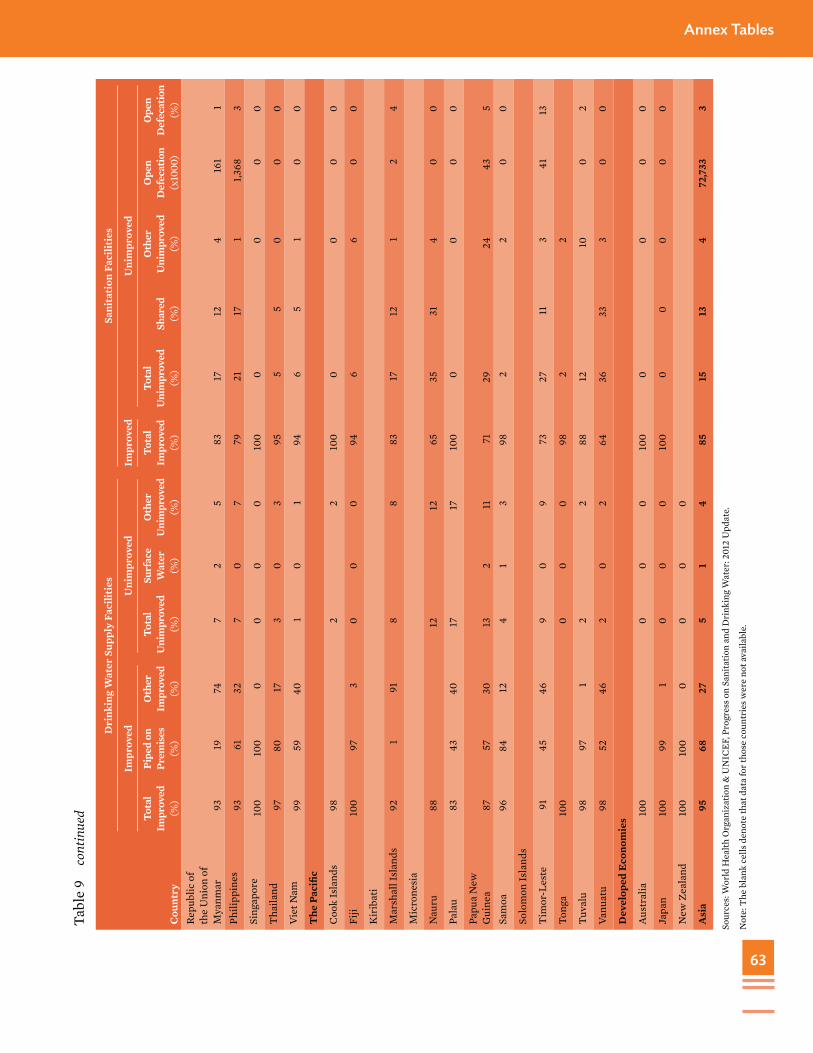
63
Annex Tables
Cou
ntry
Dri
nkin
g W
ater
Sup
ply
Faci
litie
sSa
nita
tion
Fac
iliti
es
Impr
oved
Uni
mpr
oved
Impr
oved
Uni
mpr
oved
Tota
l Im
prov
ed
(%)
Pipe
d on
Pr
emis
es
(%)
Oth
er
Impr
oved
(%
)
Tota
l U
nim
prov
ed
(%)
Surf
ace
Wat
er
(%)
Oth
er
Uni
mpr
oved
(%
)
Tota
l Im
prov
ed
(%)
Tota
l U
nim
prov
ed
(%)
Shar
ed
(%)
Oth
er
Uni
mpr
oved
(%
)
Ope
n D
efec
atio
n (x
1000
)
Ope
n D
efec
atio
n (%
)Re
publ
ic o
f th
e U
nion
of
Mya
nmar
9319
747
25
8317
124
161
1Ph
ilipp
ines
9361
327
07
7921
171
1,368
3Si
ngap
ore
100
100
00
00
100
00
00
Tha
iland
9780
173
03
955
50
00
Viet
Nam
9959
401
01
946
51
00
The
Pac
ific
Coo
k Is
land
s98
22
100
00
00
Fiji
100
973
00
094
66
00
Kir
ibat
i
Mar
shal
l Isl
ands
921
918
883
1712
12
4
Mic
rone
sia
Nau
ru88
1212
6535
314
00
Pala
u83
4340
1717
100
00
00
Papu
a N
ew
Gui
nea
8757
3013
211
7129
2443
5Sa
moa
9684
124
13
982
20
0
Solo
mon
Isla
nds
Tim
or-L
este
9145
469
09
7327
113
4113
Tong
a10
00
00
982
2
Tuva
lu98
971
22
8812
100
2
Vanu
atu
9852
462
02
6436
333
00
Dev
elop
ed E
cono
mie
s
Aust
ralia
100
00
010
00
00
0
Japa
n10
099
10
00
100
00
00
0
New
Zea
land
100
100
00
00
Asi
a95
6827
51
485
1513
472
,733
3
Sour
ces:
Wor
ld H
ealth
Org
aniz
atio
n &
UN
ICEF
, Pro
gres
s on
Sani
tatio
n an
d D
rink
ing
Wat
er: 2
012
Upd
ate.
Not
e: T
he b
lank
cel
ls d
enot
e th
at d
ata
for t
hose
cou
ntri
es w
ere
not a
vaila
ble.
Tabl
e 9�
cont
inue
d

64
Annex Tables
Table 10: Education and Health Attainment Levels: Asian Economies, 2010
Country
School Life Expectancy (years)
(national)
Under-5 Mortality Rate (per 1,000 live births)
(Urban)
Immunization Coverage among 1-Year-Olds (%)
(Urban)
Developing Asia 11.0 ... ...
Central and West Asia 8.7 ... ...
Afghanistan 8.1 ... ...
Armenia 12.2 26 70
Azerbaijan 11.7 51 38
Georgia 12.8 24 64
Kazakhstan 15.3 30 98
Kyrgyz Republic 12.6 35 64
Pakistan 7.3 78 68
Tajikistan 11.5 70 87
Turkmenistan ... 73 ...
Uzbekistan 11.6 51 88
East Asia 11.9
PRC 11.7 ... ...
Hong Kong, China 15.5 ... ...
Republic of Korea 17.2 ... ...
Mongolia 14.3 31 91
Taipei,China … ... ...
South Asia 10.6
Bangladesh ... 62 92
Bhutan 12.4 ... ...
India 10.4 60 69
Maldives 12.5 23 98
Nepal 8.9 47 93
Sri Lanka ... ... ...
Southeast Asia 12.2
Brunei Darussalam 15.0 ... ...
Cambodia 10.5 29 90
Indonesia 12.9 38 75
Lao People’s Democratic Republic 10.1 ... 56
Malaysia 12.6 ... ...
Republic of the Union of Myanmar 9.4 ... ...
Philippines 11.7 28 88
Singapore ... ... ...
continued on next page

65
Annex Tables
Country
School Life Expectancy (years)
(national)
Under-5 Mortality Rate (per 1,000 live births)
(Urban)
Immunization Coverage among 1-Year-Olds (%)
(Urban)
Thailand 12.3 ... 93
Viet Nam 11.9 16 95
The Pacific …
Cook Islands 12.5 ... ...
Fiji 13.9 ... ...
Kiribati 12.0 ... ...
Marshall Islands 11.7 ... ...
Micronesia ... ... ...
Nauru 9.3 ... ...
Palau ... ... ...
Papua New Guinea ... ... ...
Samoa 13.0 3 ...
Solomon Islands 9.3 ... ...
Timor-Leste 11.7 59 71
Tonga 13.7 ... ...
Tuvalu 10.8 ... ...
Vanuatu 10.6 27 69
Developed Economies 16.3
Australia 19.6 ... ...
Japan 15.3 ... ...
New Zealand 19.7 ... ...
Asia (average) 12.4 41 79
North America and Western Europe (average) 16.5 7 96
Sources: Millennium Indicators Database Online (UNSD); Global Health Observatory Data Repository (WHO); The State of the World’s Children Report, 2012 (UNICEF); Institute for Statistics Data Centre (UNESCO).
Table 10�continued

66
Annex Tables
Table 11: Government Expenditures on Education and Health: Asian Economies, 2011
Government Expenditure on Education (percentage of total expenditure) 2011
Government Expenditure on Health (percentage of total expenditure) 2011
Developing Asia 14.9 5.0
Central and West Asia … …
Afghanistan … …
Armenia 11.4 6.7
Azerbaijan 8.2 3.2
Georgia 8.8 5.4
Kazakhstan … …
Kyrgyz Republic 21.3 10.4
Pakistan … …
Tajikistan 16.7 6.5
Turkmenistan … …
Uzbekistan … …
East Asia … …
PRC 14.0 5.3
Hong Kong, China 17.6 11.6
Republic of Korea 15.1 1.0
Mongolia 13.3 6.9
Taipei,China 13.1 1.4
South Asia … …
Bangladesh 11.4 5.6
Bhutan 17.9 6.9
India 16.5 4.0
Maldives 14.6 3.1
Nepal 17.9 7.2
Sri Lanka 8.6 6.3
Southeast Asia … …
Brunei Darussalam 18.3 8.3
Cambodia 13.7 12.2
Indonesia … …
Lao People’s Democratic Republic … …
Malaysia 21.6 7.5
Republic of the Union of Myanmar … …
Philippines 16.5 2.3
Singapore 21.0 8.1
Thailand 19.4 9.9
Viet Nam … …
continued on next page

67
Annex Tables
Government Expenditure on Education (percentage of total expenditure) 2011
Government Expenditure on Health (percentage of total expenditure) 2011
The Pacific … …
Cook Islands 13.4 11.2
Fiji 27.7 15.1
Kiribati 18.6 16.3
Marshall Islands … …
Micronesia … …
Nauru … …
Palau … …
Papua New Guinea 10.0 5.7
Samoa 19.8 17.9
Solomon Islands … …
Timor-Leste 6.2 3.6
Tonga … …
Tuvalu … …
Vanuatu 26.1 10.8
Developed Economies 9.0 18.5
Australia 9.5 15.8
Japan 8.7 19.0
New Zealand 18.1 19.5
Asia (average) 15.3 8.9
North America and Western Europe (average) 23.3 9.5
Source: ADB (2012b).
Table 11�continued

68
Annex Tables
Table 12: Social Protection and Labor Rating and Government Expenditure on Social Security and Welfare: Asian Economies
CountrySocial Protection and Labor
Rating 2011
Government Expenditure on Social Security and Welfare (% of total expenditure)
2000 2011
Developing Asia … 9.4 9.4
Central and West Asia … … …
Afghanistan 2.5 … …
Armenia 5.0 9.8 35.7
Azerbaijan … 18.2 9.7
Georgia 4.5 26.3 20.8
Kazakhstan … … …
Kyrgyz Republic 4.5 10.1 15.6
Pakistan 3.5 … …
Tajikistan 3.5 12.3 12.8
Turkmenistan … … …
Uzbekistan 4.0 … …
East Asia … … …
PRC … 4.7 10.2
Hong Kong, China … 10.1 11.2
Republic of Korea … 15.2 22.2
Mongolia 4.0 17.7 36.2
Taipei,China … 25.3 23.4
South Asia … … …
Bangladesh 4.0 1.3 2.1
Bhutan 4.0 4.7 4.9
India … 4.2 5.6
Maldives 3.5 2.8 7.7
Nepal 4.0 5.4 3.2
Sri Lanka 3.5 10.8 8.7
Southeast Asia … … …
Brunei Darussalam … 3.6 4.8
Cambodia 3.5 2.4 5.2
Indonesia … … …
Lao People’s Democratic Republic 3.5 … …
Malaysia … 3.7 3.6
Republic of the Union of Myanmar … … …
Philippines … 3.9 5.7
Singapore … 3.5 7.7
continued on next page

69
Annex Tables
CountrySocial Protection and Labor
Rating 2011
Government Expenditure on Social Security and Welfare (% of total expenditure)
2000 2011
Thailand … 5.6 6.8
Viet Nam 4.5 … …
The Pacific … … …
Cook Islands … … …
Fiji … 0.4 0.5
Kiribati 3.0 1.7 3.1
Marshall Islands 3.0 … …
Micronesia 2.0 … …
Nauru 3.5 … …
Palau 4.0 … …
Papua New Guinea 3.0 1.7 1.5
Samoa 3.5 4.5 4.3
Solomon Islands 2.5 … …
Timor-Leste 3.0 8.5 9.1
Tonga 2.5 4.6 …
Tuvalu 2.5 … …
Vanuatu 3.0 0.2 0.2
Developed Economies … … …
Australia … 36.6 33.0
Japan … 36.8 47.1
New Zealand … 39.4 36.1
Asia (average) 3.5 10.5 12.9
North America and Western Europe (average) 5.7 18.9 22.2
Source: ADB (2012b).
Table 12�continued

70
Annex Tables
Table 13: Status of Employment: World and Asian Regions, 2002 and 2012
Region World
Developed Economies and
European Union East AsiaSoutheast Asia and the Pacific South Asia Asia
Year 2002 2012 2002 2012 2002 2012 2002 2012 2002 2012 2002 2012
Total employment (million) 2,696 3,127 446 469 759 830 250 302 541 639 1,550 1,771
Wage and salaried workers (employees) (million) 1,210 1,512 380 405 316 409 81 111 99 140 496 660
Wage and salaried workers (employees) (%) 44.9 48.4 85.2 86.3 41.6 49.3 32.4 36.6 18.3 22.0 30.8 36.0
Persons in vulnerable employment (‘000) 1,417 1,539 48 47 429 406 162 185 435 491 1,027 1,081
Share of vulnerable employment in total employment (%) 52.6 49.2 10.8 10.1 56.5 48.9 65.1 61.1 80.4 76.9 67.3 62.3
Source: ILO (2012a).
Table 14: Population by Age Groups: Asia and Asian regions, 2000 and 2010
Age Group 0–15 15–24 15–64 64+
Asia 2000 1,138.8 669.8 2,364.6 247.3
2010 1,079.8 754.0 2,805.4 326.3
Eastern Asia 2000 364.3 228.6 1,012.9 137.5
2010 296.7 253.2 1,127.6 178.1
South–Central Asia 2000 542.4 301.2 909.4 71.6
2010 548.0 347.5 1131.7 97.1
Southern Asia 2000 523.1 290.5 876.1 68.4
2010 530.4 334.4 1,091.6 93.6
South-Eastern Asia 2000 166.1 103.4 332.6 28.4
2010 161.9 109.7 398.3 38.3
Western Asia 2000 66.0 36.6 109.7 9.7
2010 73.2 43.7 147.9 12.8
Source: Calculations based on World Population Prospects, the 2010 Revision.

71
Annex Tables
Table 15: Youth (15–24) Unemployment Rate: World and Asian Regions, 2002 and 2012
Region World
Developed Economies & European
Union East Asia
South-East Asia & the
Pacific South Asia Asia
Year 2002 2012 2002 2012 2002 2012 2002 2012 2002 2012 2002 2012
Youth labor force (million) 584 587 66 59 140 139 60 58 138 133 337 330
Youth unemployed (million) 76 74 10 11 13 13 10 8 13 13 36 34
Youth unemployment rate (%) 13.0 12.6 14.6 17.9 9.2 9.5 16.3 13.0 9.5 9.8 11.7 10.8
Source: ILO (2012a).
Table 16: Urbanization and Per Capita Gross Domestic Product: Asian Economies, 2011
Percentage UrbanPer Capita GDP at PPP
(current international dollars)
Central and West Asia
Afghanistan 22.2 1,280
Armenia 64.0 5,470
Azerbaijan 52.9 10,130
Georgia 53.1 5,523
Kazakhstan 54.7 13,204
Kyrgyz Republic 34.0 2,432
Pakistan 65.3 2,753
Tajikistan 26.5 2,118
Turkmenistan 48.7 ...
Uzbekistan 51.4 3,499
East Asia
PRC 51.3 8,422
Hong Kong, China 100.0 49,913
Republic of Korea 82.9 30,205
Mongolia 66.2 4,788
Taipei,China 59.5 37,884
South Asia
Bangladesh 25.4 1,906
Bhutan 35.6 5,787
India 31.2 3,783
continued on next page

72
Annex Tables
Percentage UrbanPer Capita GDP at PPP
(current international dollars)
Maldives 40.5 8,793
Nepal 17.0 1,439
Sri Lanka 15.1 5,620
Southeast Asia
Brunei Darussalam 75.7 49,757
Cambodia 21.0 2,328
Indonesia 49.8 4,682
Lao People’s Democratic Republic 33.2 2,424
Malaysia 71.0 16,034
Republic of the Union of Myanmar 30.8 ...
Philippines 66.4 4,170
Singapore 100.0 61,103
Thailand 36.1 9,573
Viet Nam 31.7 3,435
The Pacific
Cook Islands 52.9 ...
Fiji 48.5 4,876
Kiribati 71.8 2,224
Marshall Islands 70.0 ...
Micronesia 22.3 3,749
Nauru 100.0 ...
Palau 77.0 ...
Papua New Guinea 12.5 2,627
Samoa 19.9 4,670
Solomon Islands 20.5 2,640
Timor-Leste 28.0 7,275
Tonga 23.4 4,890
Tuvalu 50.6 ...
Vanuatu 24.4 4,558
Developed Economies
Australia 89.1 39,749
Japan 66.8 34,262
New Zealand 86.8 30,110
Source: ADB (2012a).
Table 16�continued

73
Annex Tables
Table 17: Sanitation–Country Results
Country
Coverage (2010) Population to Cover Total financial capital costs (million $ 2010) Benefit-cost
ratio
Rural Urban MDG Universal
% % ‘000 people MDG Universal
PRC 50 75 134,689 4,32,132 20,861 46,286 7.92
Mongolia 29 64 712 816 48 53 4.51
Republic of Korea 100 100 0 1,089 0 171 23.32
Afghanistan 30 60 8,545 14,801 748 1,498 2.91
Bangladesh 55 57 26,693 57,168 1,944 3,279 2.17
Bhutan 29 73 279 170 8 16 5.91
India 23 58 336,915 5,50,150 24,713 38,729 5.11
Iran (Islamic Rep.) 100 100 0 4,922 943 1,658 9.21
Maldives 97 98 0 30 0 6 9.08
Nepal 27 48 8,470 14,831 667 1,329 1.74
Pakistan 34 72 36,619 80,071 4,595 8,859 3.59
Sri Lanka 93 8 150 2,190 19 187 6.36
Cambodia 20 73 3,929 7,599 715 1,218 1.73
Indonesia 39 73 30,861 80,206 2,333 4,682 6.88
Lao PDR 50 89 0 2,977 55 362 2.19
Malaysia 95 96 0 3,415 0 694 6.38
Republic of the Union of Myanmar 73 83 0 13,763 0 755 1.13
Philippines 69 79 5,485 25,440 256 1,919 5.73
Singapore 0 100 0 222 0 83 31.22
Thailand 96 95 379 4,377 85 655 4.12
Timor-Leste 37 73 256 491 10 35 2.00
Viet Nam 68 94 0 26,434 0 1,993 2.57
MDG = Millennium Development Goals, Lao PDR = Lao People’s Democratic Republic, PRC = People’s Republic of China.
Source: WHO (2012).
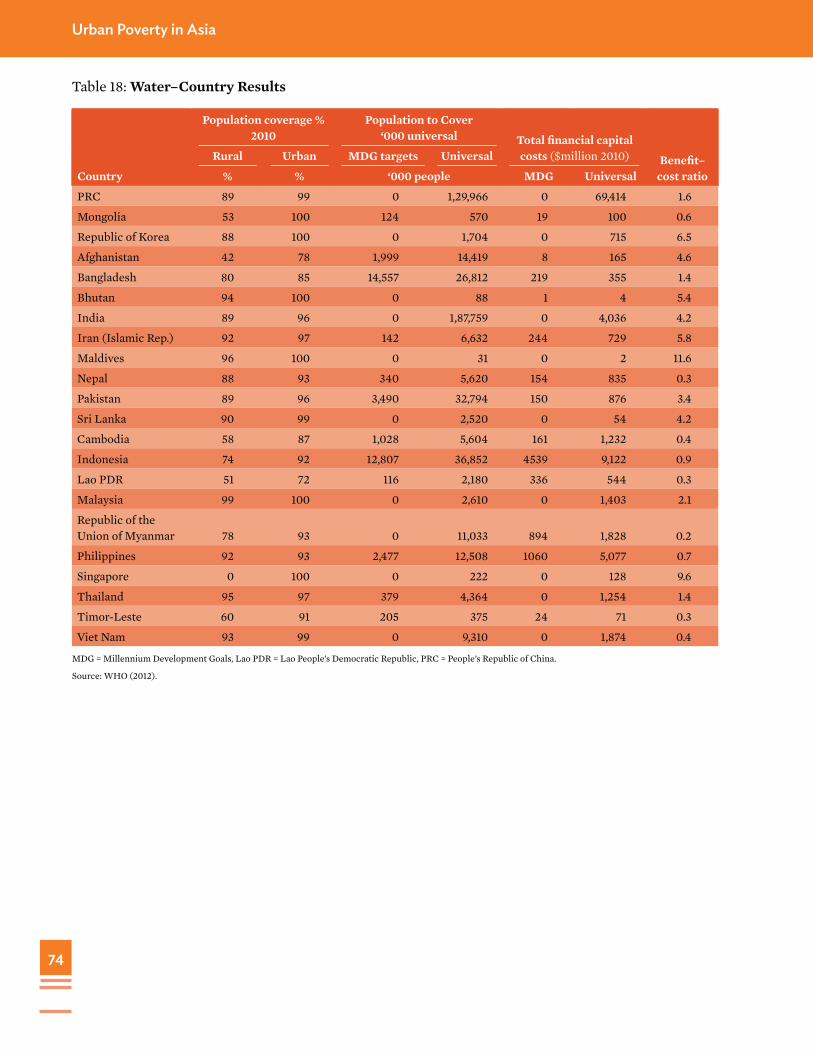
74
Urban Poverty in Asia
Table 18: Water–Country Results
Country
Population coverage % 2010
Population to Cover ‘000 universal Total financial capital
costs ($million 2010) Benefit–cost ratio
Rural Urban MDG targets Universal
% % ‘000 people MDG Universal
PRC 89 99 0 1,29,966 0 69,414 1.6
Mongolia 53 100 124 570 19 100 0.6
Republic of Korea 88 100 0 1,704 0 715 6.5
Afghanistan 42 78 1,999 14,419 8 165 4.6
Bangladesh 80 85 14,557 26,812 219 355 1.4
Bhutan 94 100 0 88 1 4 5.4
India 89 96 0 1,87,759 0 4,036 4.2
Iran (Islamic Rep.) 92 97 142 6,632 244 729 5.8
Maldives 96 100 0 31 0 2 11.6
Nepal 88 93 340 5,620 154 835 0.3
Pakistan 89 96 3,490 32,794 150 876 3.4
Sri Lanka 90 99 0 2,520 0 54 4.2
Cambodia 58 87 1,028 5,604 161 1,232 0.4
Indonesia 74 92 12,807 36,852 4539 9,122 0.9
Lao PDR 51 72 116 2,180 336 544 0.3
Malaysia 99 100 0 2,610 0 1,403 2.1
Republic of the Union of Myanmar 78 93 0 11,033 894 1,828 0.2
Philippines 92 93 2,477 12,508 1060 5,077 0.7
Singapore 0 100 0 222 0 128 9.6
Thailand 95 97 379 4,364 0 1,254 1.4
Timor-Leste 60 91 205 375 24 71 0.3
Viet Nam 93 99 0 9,310 0 1,874 0.4
MDG = Millennium Development Goals, Lao PDR = Lao People’s Democratic Republic, PRC = People’s Republic of China.
Source: WHO (2012).

75
Bibliography
Action Aid and Oxfam. 2012. Urban Poverty Reduction in Vietnam: New Challenges, New Approaches.
Ahmad, Sohail. 2012. Housing Inequality Amongst Disadvantaged Communities in India, United Nations University Working Paper. Tokyo.
Akram, Zainab, Sajida Wajid, Tahir Mahmood, and Shoaib Sarwar. 2011. Impact of Poor Governance and Income Inequality of Poverty in Pakistan. Far East Journal of Psychology and Business. 4 (3).
Arif, G. M. and Hamid, S. 2009. Urbanization, City Growth and Quality of Life in Pakistan. European Journal of Social Science. 10 (2).
Arif, G. M. and Shujaat Farooq. 2012. Poverty Reduction in Pakistan: Learning from the Experience of [the People’s Republic of] China. Pakistan Institute of Development Economics (PIDE) Monograph Series. Islamabad.
Arimah, Ben. 2010. The Face of Urban Poverty: Explaining the Prevalence of Slums in Developing Countries. UNU-WIDER Working Paper 2010/30. United Nations University and the World Institute for Development Economics Research. Helsinki.
Asian Development Bank (ADB). 2006. Pakistan Poverty Assessment Update. Background Paper Series. Manila.
_____ . 2007. Inequality in Asia: Key Indicators 2007. Special chapter. Manila.
_____ . 2008a. Social Protection Index for Committed Poverty Reduction, Manila, Philippines. Manila.
_____ . 2008b. Pakistan Poverty Assessment Update. Background Paper Series. Manila.
_____ . 2008c. Urban Poverty in India. New Delhi.
_____ . 2009. Poverty in the Philippines: Causes, Constraints, and Opportunities. Manila.
_____ . 2010a. Access to Justice for the Urban Poor: Toward Inclusive Cities. Manila.
_____ . 2010b. Poverty and Sustainable Development in Asia: Impacts and Responses to the Global Economic Crisis. Manila.
_____ . 2012a. Key Indicators for Asia and the Pacific. Manila.
_____ . 2012b. Key Indicators for Asia and the Pacific: Framework of Inclusive Growth Indicators. Special Supplement. Manila.
_____ . 2012c. Infrastructure for Supporting Inclusive Growth and Poverty Reduction in Asia. Manila.
_____ . 2012d. Global Crisis, Remittances, and Poverty in Asia. Manila.
_____ . 2012e. Philippines: Urban Sector Assessment, Strategy, and Road Map. Manila.

76
Bibliography
_____ . 2013a. Gender and Urban Poverty in South Asia: Proceedings Report of the 2012 Subregional Workshop. Manila.
_____ . 2013b. Urban Sector Assessment, Strategy, and Roadmap: Indonesia. Manila.
_____ . 2013c. The Social Protection Index: Assessing Results for Asia and the Pacific. Manila.
Asian Employment Forum. 2007. Visions for Asia’s Decent Work Decade: Sustainable Growth and Jobs to 2015. Beijing: International Labor Organization (ILO).
Au, C. C. and J. V. Henderson. 2006. How Migration Restrictions Limit Agglomeration and Productivity in [the People’s Republic of] China. Journal of Development Economics. 80 (2).
Awan, Masood Sarwar and Nasir Iqbal. 2010. Determinants of Urban Poverty: The Case of Medium-Sized City in Pakistan. Pakistan Institute of Development Economics Working Paper No. 60. Islamabad.
Baharoglu, Deniz and Christine Kessides. 2002. Urban Poverty. In A Sourcebook for Poverty Reduction Strategies. Vol. 2. Washington, DC: The World Bank.
Baker, Judy and Nina Schuler. 2004. Analyzing Urban Poverty: A Summary of Methods and Approaches. World Bank Policy Research Working Paper No. 3399. Washington, DC: The World Bank.
Baker, Judy and Iwona Reichardt. 2007. A Review of Urban Development Issues in Poverty Reduction Strategies. The World Bank Group Urban Papers, UP-3. Washington, DC: The World Bank.
Baker, Judy. 2008. Impacts of Financial, Food and Fuel Crises on the Urban Poor. Washington, DC: The World Bank.
_____ . 2009. Urban Poverty: A Global View. The World Bank Group Urban Papers, UP-5. Washington, DC: The World Bank.
_____ . 2012. Indonesia: Urban Poverty Analysis—2012 Progress Report. World Bank Progress Report. Washington, DC: The World Bank.
Ballesteros, Marife M. 2010. Linking Poverty and the Environment: Evidence from Slums in Philippine Cities. Makati City: Philippine Institute for Development Studies.
_____ . 2011. Why Slum Poverty Matters. Policy Notes. Makati City: Philippine Institute for Development Studies.
Bapat, Meera. 2009. Poverty Lines and Lives of the Poor: Underestimation of Urban Poverty—The Case of India. Poverty Reduction in Urban Areas Series, Working Paper No.20. London: Human Settlements Programme, International Institute for Environment and Development (IIED).
Bartlett, Sheridan. 2011. Children in Urban Poverty: Can They Get More than Small Change? UNICEF Child Policy Insights. New York.
Bauer, Armin, Rana Hasan, Rhoda Magsombol, and Guanghua Wan. 2008. The World Bank’s New Poverty Data: Implications for the Asian Development Bank. Manila: Asian Development Bank.
Beall, Jo and Sean Fox. 2006. Urban Poverty and Development in the 21st Century: Towards An Inclusive and Sustainable World. Oxfam GB Research Report. London.
Bell, Martin and Salut Muhidin. 2009. Cross-National Comparisons of Internal Migration. Human Development Research Paper No. 2009/30. New York: United Nations Development Programme.
Berger, N. Glick, F. P. Perez-Arce, L. Rabinovich, and J. Yoong. 2011. Process Evaluation of the Program Nasional Pemberdayaan Masyarakat (PNPM)—Urban. Santa Monica: Rand Corporation.
Besley, T. and L. Cord. 2007. Delivering on the Promise of Pro-Poor Growth, Insights and Lessons from Country Experiences. Washington, DC: The World Bank.
Bhagwati, Jagdish. 1988. Poverty and Public Policy. World Development. 16 (5). pp. 539–555.

77
Bibliography
Black, Richard, Larissa Jones, Maria Cristina Pantiru, Rachel Sabates-Wheeler, Ronald Skeldon, and Zana Vathi. 2007. Understanding Migration as a Driver of Poverty Reduction in Europe and Central Asia. Working Paper No. C9. Development Research Centre on Migration, Globalisation and Poverty, University of Sussex, Brighton.
Boonyabancha, Somsook and Diana Mitlin. 2012. Urban Poverty Reduction: Learning by Doing in Asia. Environment and Urbanization. 24 (403).
Bourguignon, Francois. 2002. “The Growth Elasticity of Poverty Reduction: Explaining Heterogeneity across Countries and Time Periods.” Paper presented at the Conference on World Poverty: A Challenge for the Private Sector. Amsterdam Institute for International Development, Amsterdam.
Braun, Joachim von. 2007. “Rural-Urban Linkages for Growth, Employment, and Poverty Reduction.” Paper presented at the Ethiopian Economic Association, Fifth International Conference on the Ethiopian Economy, June 7–9 at the United Nations Conference Centre, Addis Ababa.
Braun, Joachim von and Ulrike Grote. 2000. “Does Decentralization Serve the Poor?” Centre for Development Research, University of Bonn, Germany.
Bravo, Jorge. 2008. “An Overview of Urbanization, Internal Migration, Population Distribution and Development in the World.” Presentation at the Expert Group Meeting on Urbanization, Internal Migration, Population Distribution and Development, New York, 21–23 January.
Brockerhoff, Martin. 1999. Urban Growth in Developing Countries: A Review of Projections and Predictions. Population Council Working Paper No. 131.
Business and Professionals Federation of Hong Kong. 2009. Poor Housing Conditions in Hong Kong, [China]—The Extent, Distribution and the People Affected. Hong Kong, [China].
Cameron, Stuart. 2012. Education, Urban Poverty and Migration: Evidence from Bangladesh and Vietnam. Working Paper 2012–15. Florence: UNICEF Office of Research.
Cardenas, Kenneth. 2011. “Globalization, Housing Markets, and the Transformation of a South City: The Case of 21st Century Manila.” Paper presented at the International RC21 Conference, Amsterdam on 7–9 July.
Centre for Research on the Epidemiology of Disasters (CRED). 2012. Annual Disaster Statistical Review 2011: The Numbers and Trends. Brussels.
Chan, Kam Wing. 2012. Migration and Development in [the People’s Republic of] China: Trends, Geography and Current Issues. Migration and Development. (1) 2.
Chandrasekhar S. 2005. “Growth of Slums, Availability of Infrastructure and Demographic Outcomes in Slums: Evidence from India.” Paper presented at the conference on “Urbanization in Developing Countries” at the Population Association of America Annual Meeting, Philadelphia, US.
Chandrasekhar, S. and Abhiroop Mukhopadhyay. 2007. Multidimensions of Urban Poverty: Evidence from India. Working Paper No. WP-2007-008. Indira Gandhi Institute of Development Research, Mumbai.
_____ . 2008. Multiple Dimension of Urban Well-Being: Evidence from India. Poverty, Gender, and Youth Working Paper No. 11. Population Council, New York.
_____ . 2009. Poverty in Indian Cities during the Reforms Era. Discussion Paper in Economics No. 09-07. Indian Statistical Institute, Delhi.
Chandrasekhar, C. P. and Jayati Ghosh. 2013. Urban Poverty is Both Underestimated and Inadequately Addressed by Public Policy in India. MacroScan. February 4.
Chandy, Laurence, Natasha Ledlie, and Veronika Penciakova. 2013. The Final Countdown: Prospects for Ending Extreme Poverty by 2030. Washington, DC: The Brookings Institution.

78
Bibliography
Chaudhry, Imran Sharif, Shahnawaz Malik, and Asma Imran. 2006. Urban Poverty and Governance: The Case of Multan City. The Pakistan Development Review. 45 (4).
Chen, Shaohua, Martin Ravallion, and Youjuan Wang. 2006. Di Bao: A Guaranteed Minimum Income in [the People’s Republic of] China’s Cities? World Bank Policy Research Working Paper No. 3805. Washington, DC.
Chen, Shaohua and Martin Ravallion. 2007. Absolute Poverty Measures for the Developing World, 1981–2004. World Bank Development Research Group Working Paper. Washington, DC.
_____ . 2008a. [The People’s Republic of] China is Poorer than We Thought, But No Less Successful in the Fight against Poverty. World Bank Policy Research Working Paper No. 4703. Washington, DC.
_____ . 2008b. The Developing World is Poorer than We Thought, But No Less Successful in the Fight against Poverty. World Bank Policy Research Working Paper No. 4621. Washington, DC.
_____ . 2012. More Relatively-Poor People in a Less Absolutely-Poor World. World Bank Policy Research Working Paper No. 6114. Washington, DC.
Cheng, T. J. 2003. “[The People’s Republic of] China’s Hukou System in the 1990s & Beyond.” Presentation at the International Conference, City University of New York, College of Staten Island.
China Science Centre of International Eurasian Academy of Sciences, China Association of Mayors, and UN-HABITAT. 2010. The State of [the People’s Republic of] China’s Cities 2010/2011: Better City, Better Life. Beijing: Foreign Languages Press.
Christiaensen, Luc and Yasuyuki Todo. 2009. “Poverty Reduction during the Rural–Urban Transformation—The Role of the Missing Middle.” Paper prepared for presentation at the International Association of Agricultural Economists Conference, Beijing, [People’s Republic of] China, 16–22 August 2009.
Cities Alliance. 2008. Slum Upgrading Up Close: Experiences of Six Cities. Washington, DC.
Climate Adaptation Working Group. 2009. Shaping Climate-Resilient Development: A Framework for Decision-Making.
Cuong, Nguyen Viet, Vu Hoang Linh, and Nguyen Thang. 2010. Urban Poverty in Vietnam: Determinants and Policy Implications. MPRA Paper No. 40767. Munich.
Dahiya, Bharat. 2012. Cities in Asia, 2012: Demographics, Economics, Poverty, Environment and Governance. Cities 29.
Dávila, Julio D. 2002. Urban Poverty Reduction Experiences in Cali, Colombia: Lessons from the Work of Local Nonprofit Organizations. IIED Working Paper 4 on Poverty Reduction in Urban Areas. London.
De Brauw, A. D., S. D. Rozelle, and J. E. Taylor. 2001. Migration and Incomes in Rural [People’s Republic of] China: A New Economics of Migration Perspective. Association of Pacific Rim Universities Working Paper. Singapore.
Department for International Development (DFID). 2002. Ending Child Poverty. London.
Deichmann Uive, Forhad Shilpi, and Renos Vakis. 2009. Urban Proximity, Agricultural Potential and Rural Non-Farm Employment: Evidence from Bangladesh. World Development. 37 (3).
Deshingkar, Priya. 2006. Internal Migration, Poverty and Development in Asia. Institute of Development Studies and Overseas Development Institute Working Paper.
Dessus, Sébastien, Santiago Herrera, and Rafael de Hoyos. 2008. The Impact of Food Inflation on Urban Poverty and Its Monetary Cost: Some Back-of-the-Envelope Calculations. World Bank Policy Research Working Paper No. 4666. Washington, DC.

79
Bibliography
Dubey, Amaresh, Shubhashis Gangopadhyay, and Wilima Wadhwa. 2001. Occupational Structure and Incidence of Poverty in Indian Towns of Different Sizes. Review of Development Economics. (5).
East-West Center. 2006. Asia’s Changing Youth Population. http://www.eastwestcenter.org/fileadmin/stored/misc/FuturePop06Youth.pdf
_____ . 2010. Asia’s Ageing Population. Monograph. Honolulu.
Fan, S. 2003. Agricultural Research and Urban Poverty in India. Quarterly Journal of International Agriculture. 42 (1).
Fan, S. and C. Chan-Kang. 2005. Road Development, Economic Growth, and Poverty Reduction in [the People’s Republic of] China. Research report. International Food Policy Research Institute (IFPRI), Washington, DC.
Fan, S., C. Fang, and X. Zhang. 2003. Agricultural Research and Urban Poverty: The Case of [the People’s Republic of] China. World Development. 31 (4).
Fan, Shenggen, Connie Chan-Kang, and Anit Mukherjee. 2005. Rural and Urban Dynamics and Poverty: Evidence from [the People’s Republic of] China and India. Food Consumption and Nutrition Division Discussion Paper No. 196. International Food Policy Research Institute (IFPRI), Washington, DC.
Ferré, Céline, Francisco H. G. Ferreira, and Peter Lanjouw. 2010. Is There a Metropolitan Bias? The Inverse Relationship between Poverty and City Size in Selected Developing Countries. World Bank Policy Research Working Paper No. 5508. Washington, DC.
Foggin, Peter. 2008. Urban Poverty and Urban Slums in [the People’s Republic of] China. Lausanne World Pulse blog.
Frijters Paul, Xin Meng, and Budy Resosudarmo. 2011. The Effects of Institutions on Migrant Wages in [the People’s Republic of] China and Indonesia. In Jane Golley and Ligang Song, eds. Rising [People’s Republic of] China: Global Challenges and Opportunities. Canberra: Australian National University Press.
Fujita, M., T. Mori, J. V. Henderson, and Y. Kanemoto. 2004. Spatial Distribution of Economic Activities in Japan and [the People’s Republic of] China. In Handbook of Regional and Urban Economics.
Gagnon, Jason Theodora Xenogiani and Chunbing Xing. 2009. Are All Migrants Really Worse Off in Urban Labour Markets? New Empirical Evidence from [the People’s Republic of] China. Working Paper No. 278. Paris: Organisation for Economic Co-operation and Development (OECD).
Ghani, Ejaj. 2012. Urbanization in Pakistan: Challenges and Options. Pakistan Institute of Development Economics (PIDE) Working Paper. Islamabad.
Government of Indonesia. 2012. “Country Report: Upgrading of Slum and Informal Settlements.” Presentation at the 4th Asia-Pacific Ministerial Conference on Housing and Urban Development, Amman, Jordan, 10–12 December.
Government of Pakistan. 2011. Task Force Report on Urban Development. Planning Commission, Islamabad, Pakistan.
Grant, Ursula. 2010. Spatial Inequality and Urban Poverty Traps. Overseas Development Institute Working Paper No. 326. London.
Ha, Seong-Kyu. 2004. Housing Poverty and the Role of Urban Governance in Korea. Environment and Urbanization. 16 (1).
Haddad, Lawrence. 2013. Poverty is Urbanizing and Needs Different Thinking on Development. Poverty Matters blog.
Haider, M. and M. Badami. 2010. Urbanization and Local Governance Challenges in Pakistan. Environment and Urbanization Asia. 1 (1).

80
Bibliography
Harriss, John. 2005. Political Participation, Representation, and the Urban Poor: Findings from Research in Delhi. Economic and Political Weekly. March 12.
Hao, Yan. 2009. Poverty and Exclusion in Urban [the People’s Republic of] China. Social Science Research Centre Berlin (WZB) Discussion Paper.
_____ . 2001. “Urban Poverty in [the People’s Republic of] China: An Emerging Challenge to an Economy in Transition.” A paper presented at the 24th IUSSP General Population Conference, Brazil.
Hasan, Rana, Maria Rhoda Magsombol, and J. Salcedo Cain. 2009. Poverty Impact of the Economic Slowdown in Developing Asia: Some Scenarios. ADB Economics Working Paper Series No. 153. Manila.
Hassan, Gazi Mainul. 2008. Public Expenditure, Employment and Poverty in Bangladesh: An Empirical Analysis. Centre for Policy Dialogue Occassional Paper. Dhaka.
Hauser, Philip M. and Robert W. Gardner. 1980. Urban Future: Trends and Prospects. In International Conference on Population and the Urban Future. Rome.
Heller, Peter S. 2006. Is Asia Prepared for an Aging Population? IMF Working Paper No. WP/06/272. Washington, DC.
Himanshu. 2008. Urban Poverty in India by Size-Class of Towns: Level, Trends and Characteristics. Centre de Sciences Humaines Working Paper.
Hong, Z. H. 2005. The Poverty of Social Rights and Dilemmas of Urban Poverty in [the People’s Republic of] China. Journal of Contemporary China. 14 (45).
Hooke Gus, Caroline Brassard, Peter Warr, Barry Shaw, and Adam Fforde. 1999. Agriculture in Times of Crisis: Impacts in South East Asia of the Economic Crisis. An AusAID report. Canberra: Australian Agency for International Development.
Hoontrakul, Pongsak and Reena Marwah. 2008. “Urban Poverty and Governance: Bangkok Case.” Presentation at the Association of Asia Scholars (AAS) Conference at India International Centre, New Delhi on 9 January 9.
Horn, Zoe Elena. 2009. No Cushion to Fall Back On: The Global Economic Crisis and Informal Workers. Inclusive Cities Project Synthesis Report. Women in Informal Employment: Globalizing and Organizing (WIEGO), <<Place?>>
Hussain, Athar. 2003. Urban Poverty in [the People’s Republic of] China: Measurement, Patterns and Policies. ILO Working Paper. International Labour Organization, Geneva.
International Council for Local Environmental Initiatives (ICLEI) and United Nations Development Programme (UNDP). 2012. Climate Change and Vulnerability of People in Cities of Asia. Asia-Pacific Human Development Report Background Papers Series 2012/06. New York.
Indrakesuma, Taufik and Johannes Loh. 2012. Urban Poor’s ‘Everyday Struggle’ in Vietnam. The Diplomat. http://thediplomat.com/2012/10/23/hanoi-urban-poors-everyday-struggle/
International Fund for Agricultural Development (IFAD). 2010. Rural Poverty Report 2011: New Realities, New Challenges: New Opportunities for Tomorrow’s Generation. Rome.
International Labour Organization. 2012a. Key Indicators of the Labour Market. Geneva.
_____. 2012b. Global Employment Trends for Youth, 2012. Geneva.
_____ . 2013a. Global Employment Trends, 2013: Recovering from a Second Jobs Dip. Geneva.
_____ . 2013b. Global Wage Report 2012/13: Wages and Equitable Growth. Geneva.

81
Bibliography
International Monetary Fund (IMF). 2010. Pakistan: Poverty Reduction Strategy Paper. IMF Country Report No. 10/183. Washington, DC.
International Organization for Migration (IOM). 2005. Migration, Development and Poverty Reduction in Asia. Geneva.
Islam, Nazrul. 2006. Bangladesh’ in Urbanization and Sustainability. In Brian Roberts and Trevor Kanaley, eds. Asia: Case Studies of Good Practice. Manila: ADB.
Ivanic, Maros, Will Martin, and Hassan Zaman. 2011. Estimating the Short-Run Poverty Impacts of the 2010–11 Surge in Food Prices. World Bank Policy Research Working Paper No. 5633. Washington, DC.
Joe, William, Priyajit Samaiyar, and U. S. Mishra. 2009. Migration and Urban Poverty in India: Some Preliminary Observations. Working Paper No. 414. Centre for Development Studies, India.
Kakwani, Nanak and Nicholas Prescott. 1999. Impact of Economic Crisis on Poverty and Inequality in Korea.
Kanbur, Ravi and Juzhong Zhuang. 2013. “Urbanization and Inequality in Asia.” Paper presented at the Asian Development Review Workshop 2012 held at ADB, Manila.
Kapoor, Radhicka. 2013. Inequality Matters. Economic and Political Weekly. XLVIII (2, January 12). Mumbai.
Kariuki, Mukami and Jordan Schwartz. 2005. Small-Scale Private Service Providers of Water and Electricity Supply: A Review of Incidence, Structure, Pricing and Operating Characteristics. World Bank Policy Research Paper No. 3727. Washington, DC.
Khan, Haider. 2008. Challenges for Sustainable Development: Rapid Urbanization, Poverty and Capabilities in Bangladesh. Munich Personal RePEc Archive Paper No. 9290.
Krueger, Alan. 2012. “Rise and Consequences of Income Inequality.” Speech delivered at the Center for American Progress, 12 January.
Kundu, Amitabh and Niranjan Sarangi. 2005. Issue of Urban Exclusion. Economic and Political Weekly. 13 August.
Kwon, Huck-ju and Ilcheong Yi. 2008. “Economic Development and Poverty Reduction in Korea: Governing Multifunctional Institutions.” Paper presented at the RC 19 annual conference on “The Future of Social Citizenship: Politics, Citizenship and Outcome,” organized by the Institute for Future Studies and the Swedish Institute for Social Research, Stockholm University, 4–6 September.
Laquian, Aprodicio A. 2004. “Who are the Poor and How are They Being Served in Asian Cities?” Paper presented at the “Forum on Urban Infrastructure and Public Service Delivery for the Urban Poor, Regional Focus: Asia,” sponsored by the Woodrow Wilson International Centre for Scholars and the National Institute of Urban Affairs, India Habitat Centre, New Delhi, 24–25 June.
Le, Minh Son. 2012. “Determinants of Urban Poverty in Vietnam: A Micro Analysis of Households in Ho Chi Minh City and Hanoi.” Paper presented at the World Business Research Conference on 4–6 October, Bangkok.
Liang, Zai. 2012. “Recent Migration Trends in [the People’s Republic of] China: Geographic and Demographic Aspects and Development Implications.” Presentation at the UN Expert Group Meeting on New Trends in Migration: Demographic Aspects held in New York on 3 December.
Linn, Johannes F. 2010. Urban Poverty in Developing Countries: A Scoping Study for Future Research. Wolfensohn Centre for Development Working Paper No. 21. Brookings Institution, Washington, DC.
Lonardoni, Fernanda. 2013. The PAC-Slum Upgrading Program Brazil Case Study, Successful Approaches to National Slum Upgrading and Prevention Policies and Programs—Experiences in 15 Countries Series. A joint work program of the World Bank Institute (WBI), Cities Alliance (CA), United Nations Human Settlements

82
Bibliography
Program (UN-HABITAT), Deutsche Gesellschaft für Internationale Zusammenarbeit (GIZ), and Inter-American Development Bank (IDB).
Lynch, Merril. 2012. [People’s Republic of] China: A Strategist’s Diary—27 February 2012.
LSE Cities. 2011. Hong Kong, [China]’s Housing Shame, Cities, Health and Well-Being Articles. Hong Kong, China.
Magalhães, Fernanda and Francisco di Villarosa, eds. 2012. Slum Upgrading: Lessons Learned from Brazil. Washington, DC: Inter-American Development Bank.
Mahadevia, Darshini. 2010. “Tenure Security and Urban Social Protection Links—India.” Paper presented at the Conference on Social Protection as Development Policy in Asia: The Long-Term Perspective, held at CEPT University, Ahmadabad on 27–29 October.
Mander, Harsh. 2009. “The State and the Urban Poor in India.” Presentation at the Workshop Aon Shelter Security and Social Protection for the Urban Poor and the Migrants in Asia, held in Ahmadabad, India on 11–13 February 2009.
Martine, George. 2008. “Preparing for Sustainable Urban Growth in Developing Areas.” Paper presented at the United Nations Expert Group Meeting on Population Distribution, Urbanization, Internal Migration and Development, Population Division, Department of Economic and Social Affairs, United Nations Secretariat, New York, 21–23 January.
Martine George, Gordon McGranahon, Mark Montgomery, and Rogelio Fernandes-Castilla. 2008. The New Global Frontier: Urbanization, Poverty and Environment in the 21st Century. London: Earthscan.
Masika, Rachel, Arjan de Haan, and Sally Baden. 1997. Urbanisation and Urban Poverty: A Gender Analysis. Brighton: Institute of Development Studies, University of Sussex.
Mathur, Om Prakash, ed. 1982. Small Cities and National Development. Nagoya, Japan: United Nations Centre for Regional Development.
_____ . 2009. National Urban Poverty Reduction Strategy, 2010–2020 A.D.: Slum-Free Cities: A New Deal for the Urban Poor. New Delhi: National Institute of Public Finance and Policy.
_____ . 2012. Urban Challenges in South Asia. In United Nations ESCAP Cities of Opportunity: Partnerships for an Inclusive and Sustainable Future. Bangkok: UN ESCAP.
Merril Lynch. 2012. [People’s Republic of] China: A Strategist’s Diary. 27 February.
Miller, Tom. 2013. [People’s Republic of] China’s Urban Billion: The Story Behind the Biggest Migration in Human History. London: Zed Books.
Ministry of Cities and Cities Alliance. 2010. Integrated Slum Upgrading Actions Brazil.
Ministry of Housing and Urban Poverty Alleviation. 2009. India: Urban Poverty Report 2009. New Delhi: Oxford University Press, India.
Ministry of Planning, Government of Cambodia. 2013. Poverty in Cambodia—A New Approach. Phnom Penh.
Mitlin, Diana. 2004. Understanding Urban Poverty: What the Poverty Reduction Strategy Papers Tell Us. Human Settlements Working Paper Series, Poverty Reduction in Urban Areas No. 13. London: International Institute for Environment and Development (IIED).
Mitlin, Diana and David Satterthwaite. 2013. Urban Poverty in the Global South. London and New York: Routledge.
Moghadam, Valentine M. 2005. The ‘Feminization of Poverty’ and Women’s Human Rights. UNESCO Social and Human Sciences Discussion Paper. Paris: Gender Equality and Development Section, Division of Human Rights.

83
Bibliography
Monkkonen, Paavo and Xiaohu Zhang. 2011. Socioeconomic Segregation in Hong Kong, [China]: Spatial and Ordinal Measures in a High-Density and Highly Unequal City. Institute of Urban and Regional Development Working Paper No. 2011-03. University of California, Berkeley.
Montgomery, Jessica L. 2012. The Inheritance of Inequality: Hukou and Related Barriers to Compulsory Education for [the People’s Republic of] China’s Migrant Children. Pacific Rim Law & Policy Journal. 21 (3).
Montgomery, Mark R. 2009. Urban Poverty and Health in Developing Countries. Population Bulletin. 64 (2).
Moser, Caroline and David Satterthwaite. 2008. Towards Pro-Poor Adaptation to Climate Change in the Urban Centres of Low- and Middle-Income Countries. IIED Climate Change and Cities Discussion Paper No. 3. International Institute for Environment and Development.
Moser, Caroline and Dennis Rodgers. 2012. Understanding the Tipping Point of Urban Conflict: Violence, Cities and Poverty Reduction in the Developing World. Working Paper No. 7. Manchester University.
Muggah, Robert. 2012. Researching the Urban Dilemma: Urbanization, Poverty and Violence. International Development Research Centre (IDRC) Report. Ottawa, Canada.
National Economic and Development Authority. 2011. Philippine Development Plan, 2011–2016. Pasig City.
Oxfam and ActionAid. 2010. Participatory Monitoring of Urban Poverty in Vietnam, Third Round Synthesis Report–2010.
Park, Albert and Dewen Wang. 2010a. Migration and Urban Poverty and Inequality in [the People’s Republic of] China. Discussion Paper Series No. 4877. Institute for the Study of Labour, Bonn, Germany.
_____ . 2010b. Migration and Urban Poverty and Inequality in [the People’s Republic of] China. IZA Discussion Paper No. 4877. For schungs institut zur Zukunft der Arbeit (Institute for the Study of Labour), Bonn, Germany.
Perlman, Janice. 2006. The Metamorphosis of Marginality: Four Generations in the Favelas of Rio de Janeiro. Annals of the American Academy of Political and Social Science. Vol. 606.
Planning Commission of Bangladesh. 2011. Sixth Five-Year Plan: FY2011–FY2015: Accelerating Growth and Reducing Poverty. Ministry of Planning, Government of the People’s Republic of Bangladesh.
Planning Commission of India. 2011. Report of the Working Group on Urban Poverty, Slums, and Service Delivery System. New Delhi.
Poon, Benson Fu Kit. 2009. Spatial Inequality of Urban Poverty in Hong Kong, [China]. Dissertation submitted to the Department of Urban Planning and Design, The University of Hong Kong.
Porio, Emma. 2009. Urban Transition, Poverty, and Development in the Philippines. Ateneo de Manila University Working Paper. Manila.
Ravallion, Martin. 1998. Poverty Line in Theory and Practice. Working Paper No. 133. The World Bank, Washington, DC.
_____ . 2001. Poverty Lines: Economic Foundations of Current Practices. Unpublished manuscript. The World Bank, Washington, DC.
_____ . 2004. Pro-Poor Growth: A Primer. World Bank Policy Research Working Paper No. 3242. The World Bank, Washington, DC.
_____ . 2005. Evaluating Anti-Poverty Programs. World Bank Policy Research Working Paper No. 3625. The World Bank, Washington, DC.
_____ . 2009. A Comparative Perspective on Poverty Reduction in Brazil, [the People’s Republic of] China, and India. World Bank Policy Research Working Paper No. 5080. The World Bank, Washington, DC.
_____ . 2013. How long will it take to lift one billion people out of poverty? World Bank Policy Research Working Paper No. 6325. The World Bank, Washington, DC.

84
Bibliography
Ravallion, Martin, Shaohua Chen, and Prem Sangraula. 2007. New Evidence on the Urbanization of Global Poverty. World Bank Policy Research Working Paper No. 4199. The World Bank, Washington, DC.
Rees, W. and M. Wackernagel. 1994. Ecological Footprints and Appropriated Carrying Capacity: Measuring the Natural Capacity Requirements of the Human Economy. In A. Jansson, M. Hammer, C. Folke, and R. Costanza, eds. Investing in Natural Capital. Washington, DC: Island Press.
Reyes, Celia M. 2001. Poverty Profile of the Philippines. PIDS Discussion Paper No. 2000-40. Philippine Institute for Development Studies, Makati City, Philippines.
Riskin, Carl and Qin Gao. 2009. The Changing Nature of Urban Poverty in [the People’s Republic of] China. Initiative for Policy Dialogue Working Paper Series. Columbia University.
Romeshun, Kulasabanathan and Geetha Mayadunne. 2011. Appropriateness of the Sri Lanka Poverty Line for Measuring Urban Poverty: The Case of Colombo. Human Settlements Working Paper Series. International Institute for Environment and Development (IIED), London.
Said, Farah, Tareena Musaddiq, and Mahreen Mahmud. 2011. Macro-Level Determinants of Poverty: Investigation through Poverty Mapping of Districts of Pakistan. The Pakistan Development Review. 50 (4).
Sahmakum Teang Tnaut. 2009. The 8 Khan Survey. Phnom Penh.
Satterthwaite, David. 2002. Reducing Urban Poverty: Some Lessons from Experience. IIED Working Paper. International Institute for Environment and Development, London.
_____ . 2004. The Under-Estimation of Urban Poverty in Low- and Middle-Income Nations. IIED Working Paper No.14. International Institute for Environment and Development, London.
Satterthwaite, David and Cecilia Tacoli. 2003. The Urban Part of Rural Development: The Role of Small and Intermediate Urban Centres in Rural and Regional Development and Poverty Reduction. Rural–Urban Working Paper No. 9. International Institute for Environment and Development, London.
Satterthwaite, David, Saleemul Huq, Mark Pelling, Hannah Reid, and Patricia Lankao-Romero. 2007. Adapting to Climate Change in Urban Areas: The Possibilities and Constraints in Low- and Middle-Income Nations. IIED Working Paper No., International Institute for Environment and Development, London.
Seetanah, B., S. Rammesur, and S. Rojid. 2009. Does Infrastructure Alleviate Poverty in Developing Countries? International Journal of Applied Econometrics and Quantitative Studies. 6 (2).
Sheng, Y. 2002. Poverty Alleviation through Rural–Urban Linkages: Policy Implications. Bangkok: Economic and Social Commission for Asia and the Pacific.
Shin, Hyun Bang. 2013. Development and Dissent in [the People’s Republic of] China’s “Urban Age.’’ Cities in Conflict Series.
Siddiqui, Tasneem. 2012. Impact of Migration on Poverty and Development. Working Paper No. 2, Migrating Out of Poverty. Research Programme Consortium, University of Sussex, Brighton.
Smolka, Martin O. 2003. Informality, Urban Poverty and Land Market Prices. Landlines. 15 (1). January.
Solinger, Dorothy J. 2004. “The Creation of a New Underclass in [the People’s Republic of] China and Its Implications.” Paper prepared for POSRI International Forum on [the People’s Republic of] China’s Development: Key Challenges for [the People’s Republic of] China’s Sustained Growth held in Seoul, Republic of Korea on 10–11 November 2004.
Sugden, Craig. 2012. Is Growth in Asia and the Pacific Inclusive? ADB Economics Working Paper Series No. 317. Manila.
Stiglitz, Joseph. 2012. The Price of Inequality. London: Allen Lane and Penguin.

85
Bibliography
Tacoli, Cecilia. 1998. Bridging the Divide: Rural–Urban Interactions and Livelihood Strategies. Gatekeepers Series No. 77. International Institute for Environment and Development, London.
_____ . 2011. Links between Rural and Urban Development in Africa and Asia. In Population Distribution, Urbanization, Internal Migration and Development: An International Perspective. New York: United Nations Department of Economic and Social Affairs (UNDESA).
_____ . 2012. Urbanization, Gender and Urban Poverty: Paid Work and Unpaid Care Work in the City. In Urbanization and Emerging Population Issues Working Paper 7. London: International Institute for Environment and Development (IIED) and United Nations Population Fund (UNFPA).
Tambunan, Tulus. 2007. Urban Poverty and Agricultural Development in Indonesia: What is the Relation? A Study Using Quantitative and Qualitative Methods of Analysis. Working Paper Series No.15. Centre for Industry and SME Studies, University of Trisakti, Jakarta.
Thang, Nguyen, Le Dang Trung, Vu Hoang Dat, and Nguyen Thu Phuong. 2006. Poverty, Poverty Reduction and Poverty Dynamics in Vietnam. Background paper for the Chronic Poverty Report, 2008–2009.
The Hong Kong Council of Social Service. 2004. Growing Seriousness in Poverty and Income Disparity.
The Economist. Towards the end of poverty. 2013. 1–7 June.
United Nations Children’s Fund (UNICEF). 2011. Child Poverty in East Asia and the Pacific: Deprivations and Disparities; A Study of Seven Countries. Bangkok: UNICEF East Asia and Pacific.
_____ . 2013. Children in An Urban World: The State of the World’s Children, 2012. New York.
UNICEF and World Health Organization (WHO). 2012. Progress on Drinking Water and Sanitation: 2012 Update. WHO/UNICEF Joint Monitoring Programme for Water Supply and Sanitation. Geneva.
United Nations Economic and Social Council. 2005. Policy Dialogue: Decentralization for Poverty Reduction. Bangkok.
United Nations. 2005a. Rural–Urban Linkages for Poverty Reduction: A Review of Selected Approaches from Asia and the Pacific. New York.
_____ . 2005b. Thailand: Common Country Assessment. United Nations Country Team in Thailand, Office of the UN Resident Coordinator, Bangkok.
_____ . 2009. State of the World’s Indigenous Peoples. New York.
_____ . 2010. The Millennium Development Goals Report, 2010. New York.
United Nations Department of Economic and Social Affairs (UNDESA). 2008. An Overview of Urbanization, Internal Migration, Population Distribution and Development in the World. Monograph.
_____ . 2009a. Regional Trends, Issues and Practices in Urban Poverty Reduction: Social Protection in Asian Cities. New York.
_____ . 2009b. Urban Safety and Poverty in Asia and the Pacific: Key Findings from Subregional Studies on South Asia, South-East Asia and the Pacific. Nairobi, Kenya.
_____ . 2012. World Urbanization Prospects: The 2011 Revision. New York.
United Nations Development Programme (UNDP). 2005. A Home in the City. UN Millennium Project, Task Force on Improving the Lives of Slum Dwellers Report. New York.
_____ . 2006. A SWOT Analysis of the Cambodian Economy. Phnom Penh.
_____ . 2009a. India: Urban Poverty Report 2009. New Delhi.

86
Bibliography
_____ . 2009b. Addressing Urban Poverty: Relevance of Conditional Cash Transfers. Proceedings of the conference jointly organized by the United Nations Development Programme, India Country Office, and International Policy Centre for Inclusive Growth, Brazil, held at New Delhi, India, 10–11 December.
_____ . 2010. Urban Poverty Assessment in Hanoi and Ho Chi Minh City. Hanoi.
United Nations Economic and Social Commission for Asia and the Pacific (UNESCAP). 2003. Critical Analysis of Urban Policies and their Impact on Urban Poverty Eradication: A Review of Tools, Techniques and Practices. New York.
_____ . 2007. Economic and Social Survey of Asia and the Pacific 2007: Surging Ahead in Uncertain Times. Bangkok, Thailand.
_____ . 2011. Statistical Yearbook for Asia and the Pacific, 2011. Bangkok, Thailand.
United Nations Human Rights Council. 2012. Study on the Promotion of Human Rights of the Urban Poor: Strategies and Best Practices. Geneva.
United Nations Human Settlements Programme (UN-HABITAT). 2003. The Challenge of Slums: Global Report on Human Settlements, 2003. Earthscan: Nairobi, Kenya.
_____ . 2005. Financing Urban Shelter: Global Report on Human Settlements, 2005. Nairobi, Kenya: Earthscan.
_____ . 2006. Slum Trends in Asia. Monograph. Asia-Pacific Ministerial Conference on Housing and Human Settlements held on 13–16 December, New Delhi, India.
_____ . 2007. State of the World’s Cities 2008/2009—Harmonious Cities. Nairobi, Kenya: Earthscan.
_____ . 2008. State of the World’s Cities 2010/2011: Bridging the Urban Divide. Nairobi, Kenya: Earthscan.
_____ . 2009. Planning Sustainable Cities: Global Report on Human Settlements 2009. Nairobi, Kenya: Earthscan.
_____ . 2010a. The State of Asian Cities 2010/11. Fukuoka: Regional Office for Asia and the Pacific.
_____ . 2010b. State of the Urban Youth 2010/11: Leveling the Playing Field: Inequality of Youth Opportunity. Earthscan: Nairobi, Kenya.
_____ . 2011a. Cities and Climate Change: Global Report on Human Settlements, 2011. Nairobi, Kenya: Earthscan.
_____ . 2011b. Affordable Land and Housing in Asia. Nairobi, Kenya.
_____ . 2012a. Global Urban Indicators Database.
_____ . 2012b. State of the World’s Cities 2012/2013: Prosperity of Cities. Nairobi, Kenya: Earthscan.
_____ . 2012c. Sustainable Urbanization in Asia: A Sourcebook for Local Governments. Nairobi, Kenya.
_____. 2012d. Young People’s Participation and Sustainable Development in an Urbanizing World. A working paper. Nairobi, Kenya.
United Nations Millennium Project. 2005. A Home in the City: Task Force on Improving the Lives of Slum Dwellers. London: Earthscan.
United Nations Population Fund (UNFPA). 2010. The Case for Investing in Young People as a Part of the National Poverty Reduction Strategy. New York.
_____ . 2011. Population Distribution, Urbanization, Internal Migration and Development: An International Perspective. New York.
UNFPA, New York, and HelpAge International, London. 2012. Ageing in the Twenty-First Century: A Celebration and a Challenge.
Vietnam Academy of Social Sciences. 2011. Poverty Reduction in Vietnam: Achievements and Challenges. Hanoi.

87
Bibliography
Viloria-Williams, J. 2007. Urban Community Upgrading. World Bank Institute Working Paper. The World Bank, Washington, DC.
Wan, Guanghua and Iva Sebastian. 2011. Poverty in Asia and the Pacific: An Update. ADB Economics Working Paper Series No. 267. Manila.
Wan, Guanghua and Ruth Francisco. 2009a. Why is Access to Basic Services Not Inclusive? A Synthesis with a Special Focus on Developing Asia. ADB Sustainable Development Working Paper Series No. 6. Manila.
_____ . 2009b. How Is the Global Recession Impacting on Poverty and Social Spending? An Ex Ante Assessment Methodology with Applications to Developing Asia. ADB Sustainable Development Working Paper Series No. 8. Manila.
Wandschneider, T. 2004. “Small Rural Towns and Local Economic Development: Evidence from Two Poor States in India.” Paper prepared for the International Conference on Local Development held in Washington, DC. on 16–18 June.
World Health Organization (WHO). 2012. Global Costs and Benefits of Drinking-Water Supply and Sanitation Interventions to Reach the MDG Target and Universal Coverage. Geneva.
WHO/UNICEF. 2013. Estimates on the Use of Water Sources and Sanitation Facilities. Cambodia.
Winchester, Lucy and Racquel Szalachman. 2009. “The Urban Poor’s Vulnerability to the Impacts of Climate Change in Latin America and the Caribbean: A Policy Agenda.” Paper presented at the Fifth Urban Research Symposium 2009 held in Marseille, France in June.
Wong, Aline. 2011. “Public Housing, Urban Development and Reduction of Urban Poverty: The Case of Singapore.” A presentation at the 2011 Global Poverty Reduction and Development Forum held in Beijing in 17 October.
Woodrow Wilson International Centre for Scholars. 2007. Global Urban Poverty: Setting the Agenda. Comparative Urban Studies Project. Washington, DC.
_____ . 2011. Reducing Urban Poverty: A New Generation of Ideas. Lauren E. Herzer, ed. Comparative Urban Studies Project. Washington, DC.
World Economic Forum. 2012. The Global Gender Gap Report 2012. Geneva.
World Bank, The. 1991. Urban Policy and Economic Development: An Agenda for the 1990s. World Bank Policy Paper. Washington, DC.
_____ . 2001a. Thailand Social Monitor: Poverty and Public Policy. Human Development Sector Unit, East Asia and Pacific Region. Bangkok.
_____ . 2001b. World Development Report. Washington, DC.
_____ . 2003. Urban Poverty in East Asia: A Review of Indonesia, the Philippines, and Vietnam Working Paper No. 11. Urban Sector Development Unit, East Asia Infrastructure Department.
_____ . 2006. Cambodia: Halving Poverty by 2015? Poverty Assessment 2006. Poverty Reduction and Economic Management Sector Unit, East Asia and Pacific Region. Washington D.C.
_____ . 2007a. Bangladesh: Strategy for Sustained Growth. Bangladesh Development Series Paper No. 18. Dhaka.
_____ . 2007b, Cambodia: Sharing Growth, Equity and Development. Phnom Penh.
_____ . 2007c. Dhaka: Improving Living Conditions for the Urban Poor. Bangladesh Development Series Paper No. 17. The World Bank Office, Dhaka.
_____ . 2008. Vietnam Development Report, 2004. Report No. 27130-VN. Hanoi.

88
Bibliography
_____ . 2009a. [The People’s Republic of] China: From Poor Areas to Poor People: [The People’s Republic of] China’s Evolving Poverty Reduction Agenda: An Assessment of Poverty and Inequality in [the People’s Republic of] China. Poverty Reduction and Economic Management Department, East Asia and Pacific Region. Washington, DC.
_____ . 2009b. Poverty Profiles and Trends in Cambodia, 2007. Washington, DC.
_____ . 2009c. PNPM Urban—Additional Financing Project Paper. Washington, DC.
_____ . 2009d. Systems of Cities: Integrating National and Local Policies: Connecting Institutions and Infrastructure. The World Bank Urban and Local Government Strategy Series. Washington, DC.
_____ . 2010a. PNPM III—Project Action Document. Washington, DC.
_____ . 2010b. Systems of Cities: Harnessing Urbanization for Growth and Poverty Alleviation. Washington, DC.: The World Bank Urban and Local Government Strategy.
_____ . 2011. Perspectives on Poverty in India: Stylized Facts from Survey Data. Washington, DC.
_____ . 2012a. Indonesia: Evaluation of the Urban CDD Program—Program Nasional Pemberdayaan Masyarakat (PNPM-Urban). Policy Note. Washington, DC.
_____ . 2012b. 2012 Vietnam Poverty Assessment: Well Begun, Not Yet Done: Vietnam’s Remarkable Progress on Poverty Reduction and the Emerging Challenges. Hanoi: The World Bank in Viet Nam.
_____ . 2012c. Poverty Targeting in an Urban Setting: Indonesia’s Evolution. World Bank Office Jakarta.
_____ . 2012d. Indonesia: Urban Poverty and Program Review. Policy Note. Jakarta: World Bank Office.
World Bank and International Monetary Fund (WB and IMF). 2013. Global Monitoring Report. Rural-Urban Dynamics and the Millennium Development Goals. Advanced edition. Washington, DC.
Wu, Fulong, Chris Webster, Shenjing He, Yuting Liu et al. 2010. Urban Poverty in [the People’s Republic of] China. Cheltenham, UK: Edward Elgar Publishing House.
Yan, Fei. 2008. The Rising Urban Poverty and Political Resentment in a Transitional [the People’s Republic of] China: The Experience of Shanghai. Journal of Politics and Law. 1 (1).
Yang, Lu. 2012. Urban Di Bao Program: Targeting and its Effect. Chinese Academy of Social Sciences (CASS) Working Paper. Institute of Population and Labour Economics, CASS.
Yuebin, Xu. 2008. Social Assistance in [the People’s Republic of] China: The Minimum Living Standards Guarantee Scheme. Institute of Social Development and Public Policy Working Paper. Beijing University.
Yuen, Belinda. 2007. Squatters No More: Singapore Social Housing. Global Urban Development Magazine. 3 (1).
Zaidi, Syed Hashim. 2011. Urban Poverty in Pakistan. University of Texas.
Zezza, Alberto and Luca Tasciotti. 2010. Urban Agriculture, Poverty, and Food Security: Empirical Evidence from a Sample of Developing Countries. Food Policy. 35 (4).

Urban Poverty in Asia
This report provides an overview of important urban poverty questions. What defines urban poverty and how is urban poverty being measured? What other factors beyond consumption poverty need to be tackled? Who are the urban poor? What relations exist between urban poverty and city size? What linkages exist between urbanization, income, and urban poverty? What policy responses to urban poverty are implemented in selected Asian countries? The report served as a background study for the International Policy Workshop on Urban Poverty and Inclusive Cities in Asia, organized by the Asian Development Bank and the International Poverty Reduction Center held from 24–25 June 2013 in Suqian, Jiangsu Province, the People’s Republic of China.
About the Asian Development Bank
ADB’s vision is an Asia and Pacific region free of poverty. Its mission is to help its developing member countries reduce poverty and improve the quality of life of their people. Despite the region’s many successes, it remains home to approximately two-thirds of the world’s poor: 1.6 billion people who live on less than $2 a day, with 733 million struggling on less than $1.25 a day. ADB is committed to reducing poverty through inclusive economic growth, environmentally sustainable growth, and regional integration.
Based in Manila, ADB is owned by 67 members, including 48 from the region. Its main instruments for helping its developing member countries are policy dialogue, loans, equity investments, guarantees, grants, and technical assistance.
ASIAN DEVELOPMENT BANK6 ADB Avenue, Mandaluyong City1550 Metro Manila, Philippineswww.adb.org