urban moisture, clouds, and precipitation. variation of saturation vapor pressure (mb) with...
TRANSCRIPT

Variation of saturation vapor pressure (mb) with temperature (C). The curve is nearly a pure exponential. At temperatures below 0C saturation values over supercooled water are greater than over ice.
Measurements of water vaporVapor pressure is the pressure exerted by water vapor moleculesSaturated vapor pressure is maximum pressure of water vapor at that temperatureDew point is the temperature the air must be cooled to reach saturationRelative humidity is ratio of water vapor in air to maximum the air can hold at that temperature. RH is usually highest when daily temp-erature is lowest.Specific humidity is the mass of waterVapor in the air per unit mass of air.Mixing ratio is the mass of water vapor in The air to the mass of dry air containing the Water vapor.
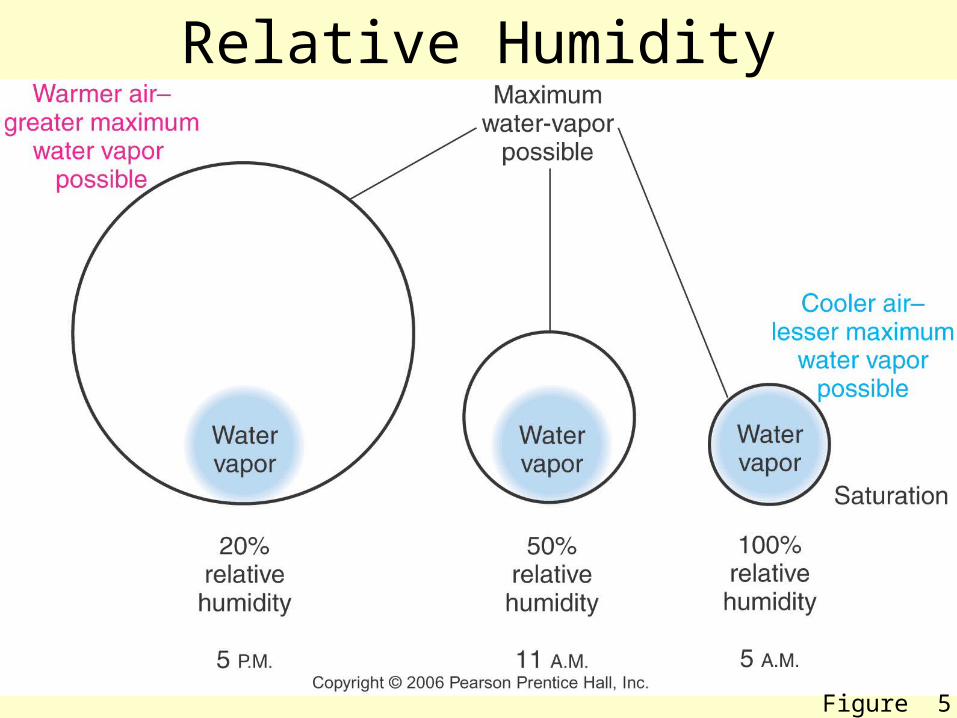
Relative Humidity
Figure 5.7

Humidity Patterns
Figure 5.10

Maximum Specific Humidity
Figure 5.12
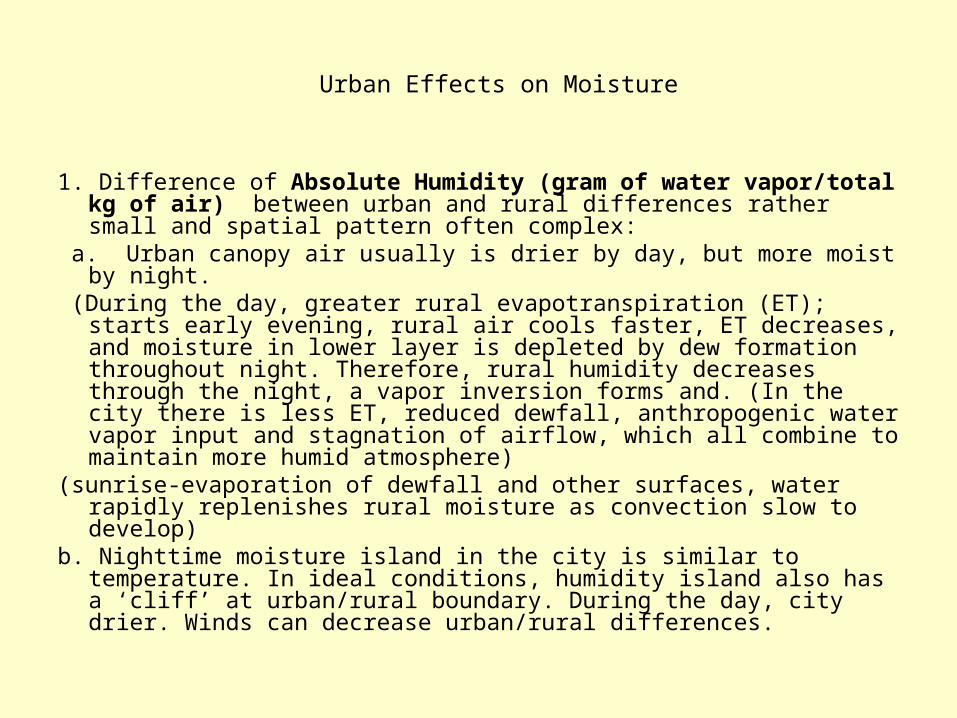
1. Difference of Absolute Humidity (gram of water vapor/total kg of air) between urban and rural differences rather small and spatial pattern often complex:
a. Urban canopy air usually is drier by day, but more moist by night. (During the day, greater rural evapotranspiration (ET); starts early
evening, rural air cools faster, ET decreases, and moisture in lower layer is depleted by dew formation throughout night. Therefore, rural humidity decreases through the night, a vapor inversion forms and. (In the city there is less ET, reduced dewfall, anthropogenic water vapor input and stagnation of airflow, which all combine to maintain more humid atmosphere)
(sunrise-evaporation of dewfall and other surfaces, water rapidly replenishes rural moisture as convection slow to develop)
b. Nighttime moisture island in the city is similar to temperature. In ideal conditions, humidity island also has a ‘cliff’ at urban/rural boundary. During the day, city drier. Winds can decrease urban/rural differences.
Urban Effects on Moisture

2. In cold climate regions, city in winter has more humidity during day. (Rural source of vapor, ET, is eliminated and vegetation dormant, but city’s anthropogenic releases from combustion, especially space heating, provide significant vapor input).
3. Relative humidity (RH=total water vapor/holding capacity at the given air temp). City’s annual mean is 6% less, winter is 2% less, summer is 8% less than rural. RH is a function of temperature (the holding capacity increases with air temperature; due to heat islands, RH is smaller).

4. Fog. City is more foggy (on average winter has 100% more and summer has 30% more fog in cities).
a. Problem of definition, based on visibility to measure fog, which is always less in cities and makes no distinction between pollution or water droplets.
b. Dense fog, visibility less than 400 m, often less in cities than suburbs or rural areas. Improvement may be due to both heat island and abundance of condensation nuclei in city. (Increased number of nuclei results in greater competition for vapor and larger number of small droplets, which don’t produce dense fog)
c. However, at high latitudes, urbanization leads to ice fogs. (Release of vapor in -30°C or less causes fog of ice crystals as saturation vapor pressure very low. Combustion of fuel for heating, industry, aircraft and especially cars, mainly responsible)
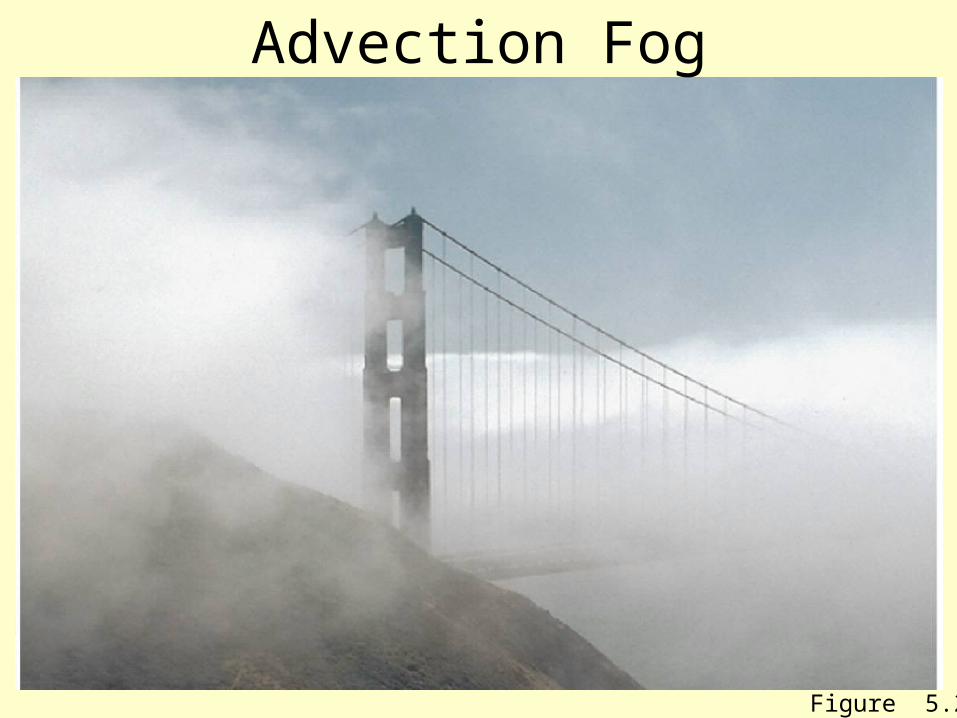
Advection Fog
Figure 5.20

Evaporation Fog
Figure 5.21

Radiation Fog
Figure 5.23

London Killer Fog, 1952, killed over 4000 Londoners
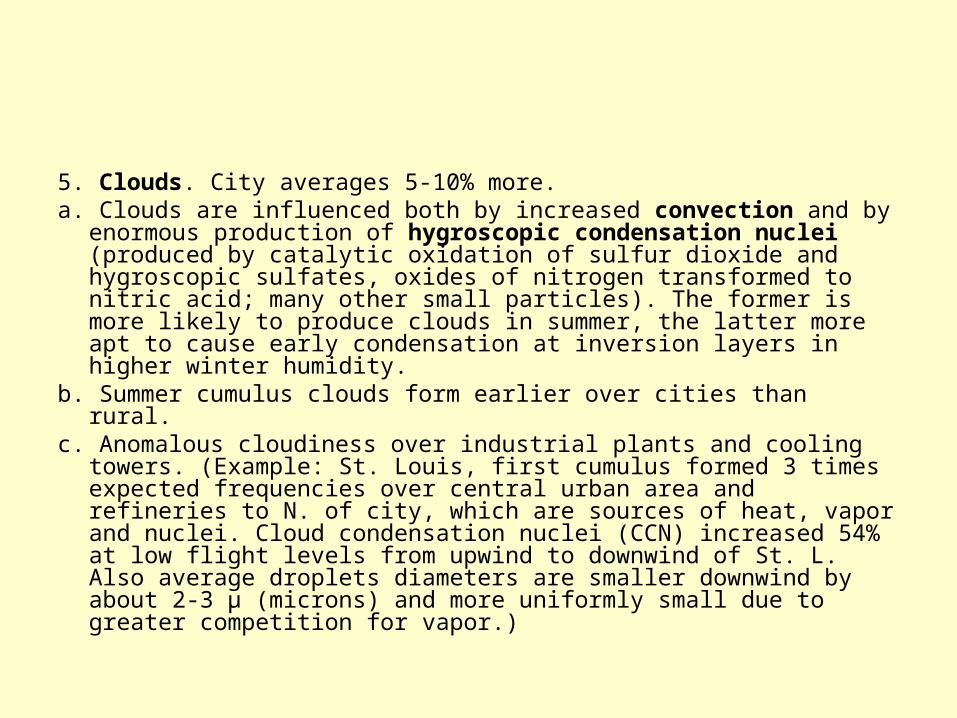
5. Clouds. City averages 5-10% more.a. Clouds are influenced both by increased convection and by
enormous production of hygroscopic condensation nuclei (produced by catalytic oxidation of sulfur dioxide and hygroscopic sulfates, oxides of nitrogen transformed to nitric acid; many other small particles). The former is more likely to produce clouds in summer, the latter more apt to cause early condensation at inversion layers in higher winter humidity.
b. Summer cumulus clouds form earlier over cities than rural.c. Anomalous cloudiness over industrial plants and cooling towers.
(Example: St. Louis, first cumulus formed 3 times expected frequencies over central urban area and refineries to N. of city, which are sources of heat, vapor and nuclei. Cloud condensation nuclei (CCN) increased 54% at low flight levels from upwind to downwind of St. L. Also average droplets diameters are smaller downwind by about 2-3 μ (microns) and more uniformly small due to greater competition for vapor.)

6. Precipitation is the most puzzling of urban meteorological variables. It is complicated by topography and water bodies, which stabilizes air masses in summer, but furnish moisture in winter.
Table 8.7 (handout) urban-rural differences of annual precipitation reported in the literature (urban climate)

Precipitation-continue
a. There is much evidence for increased precipitation in urban areas over rural areas (downwind).b. On average, cities are 5-10% more in precipitation amounts; days with 0.2”+ have 10% more in cities.c. 3 main contributing factors for modification and augmentation of precipitation:i. heat island causes rising motion over cities.ii. obstacle effect-aerodynamic roughness of cities impedes progress of weather systems. Slower movement leads to increased precipitation than when moving fast.iii. pollution-CCN can promote or inhibit precipitation. For ice nuclei, particles might initiate precipitation process in super-cooled clouds. Some evidence shows that pollution effect is secondary to aerodynamic and thermodynamic impacts.

d. Network approach. Setting up large network of instruments show upwind vs. downwind differences. Need to make sure there are no upwind controls, such as other urban, topography, and water effects.
• Ex.1 St. Louis upwind-downwind differences 23%, statistically significant.
• Ex.2 Tel-Aviv, Israel. With 3 decades of record, shows 5-17% increased rain downwind.
• Ex.3 Turin, Italy. Between 1952 and 1969, city grew 700,000 to 1.2 million and cars from 70,000 to 390,000. Summer shower events increased in frequency in the city, but also decreased in volume/shower. In winter, there was also influence from the air of Milan, an industrial city. There was a decrease in both volumes and frequency of precipitation in Turin. But adjacent rural zone had a relative increase in events ascribed to nucleation by industrial aerosols.
• Ex.4 In W. Europe, colder season showed increased days with drizzle in industrial cities.

e. Refineries produce sulfates and nitrates. Nitrates are suspected of being more active nuclei, being larger and more hygroscopic than sulfates. Their presence leads to a wide range of cloud drop sizes, which are better for rain. Sulfates are small particles and more apt to stabilize clouds-possibly more fog. This shows that the nature of aerosols are important, not just their numbers.
f. Weekdays vs. weekends. Paris showed 24% decrease on weekends. 22 E. US cities also noted weekly cycle, but only in winter, with weekends 8% less. Rainfall pattern followed pollution levels. Recently, some cities showed more pollution and rainfall on week days.
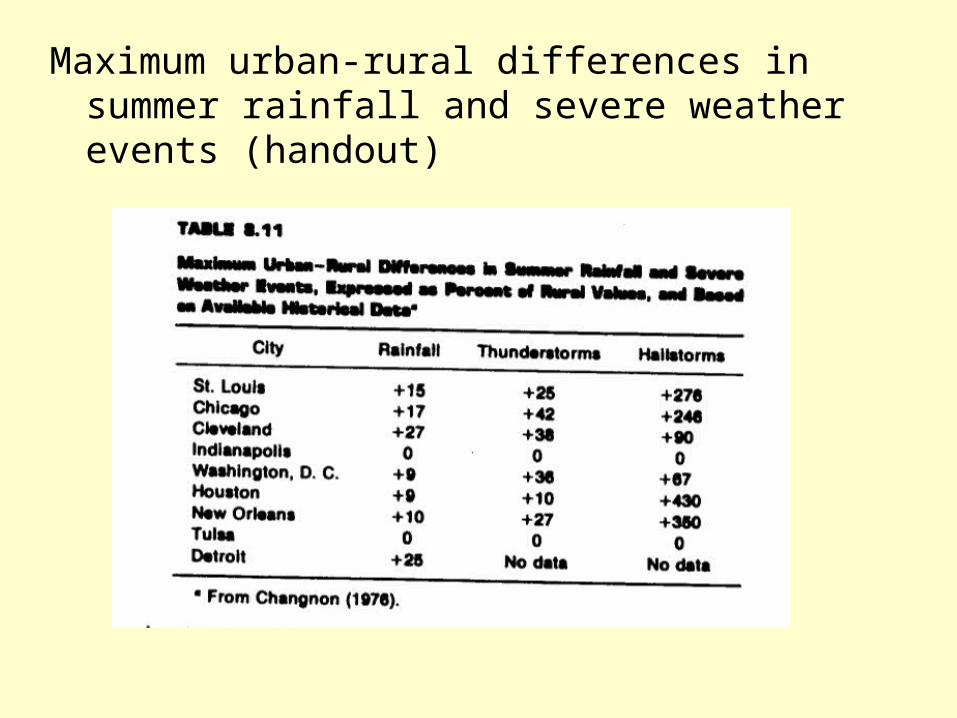
Maximum urban-rural differences in summer rainfall and severe weather events (handout)
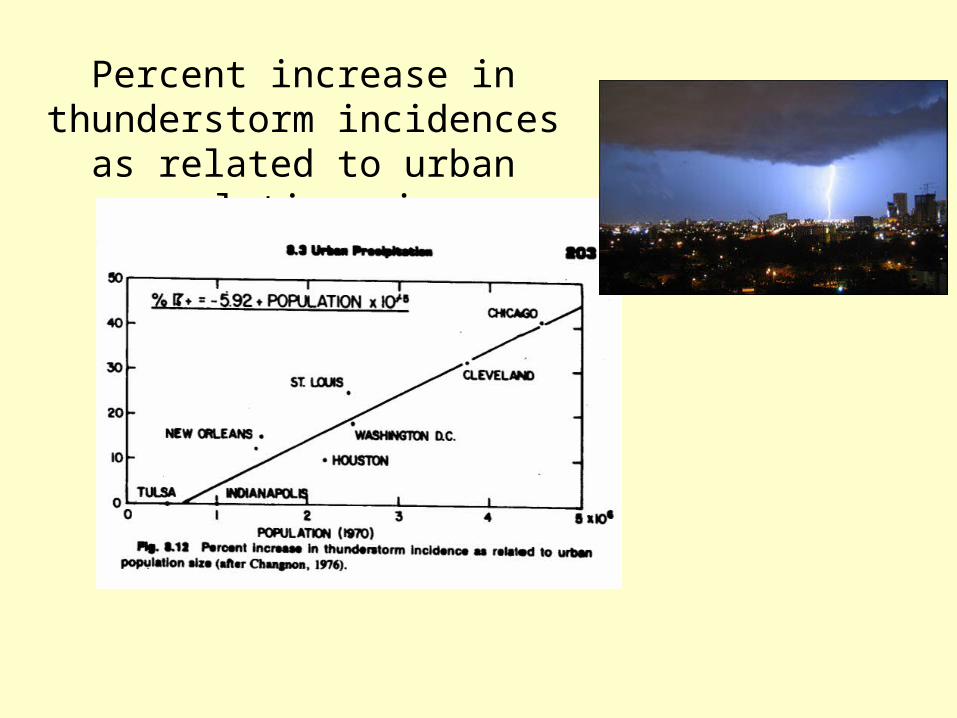
Percent increase in thunderstorm incidences as
related to urban population size

g. Slow-moving storms show heavier rains over urban areas. Several cases of floods in cities while rural
surroundings had considerably less.

Examples: 1. Cloudburst over Berlin on 6/27/64 with little vertical motion, a cumulonimbus developed over the city leading in 30 minutes to electrical discharges, rain and hail. In 2-hrs, 81 mm fell while to the SE and NE almost no rain observed. 2. In Nov., 2004, a storm cloud stalled over central L.A. dumping over 5” rain, lightning and several inches of hail, while very little rain fell elsewhere in the urban area.
h. Both summer rain amounts and thunderstorm frequencies seem to be larger just downwind from cities, but not all over city. (In Berlin, Germany, average thunderstorm days number 32 in a SW suburb, only 20 in the inner city and 28 to the NE. Summer maximum rainfall in SW approaching zone for storms has 200 mm, inner city 160 mm, with 190 to NE suburb. No explanation was made for avoidance of inner city by thunderstorms.)
i. Fujita noted curious avoidance of central Chicago and central Tokyo by tornadoes. Horseshoe area located over Chicago appears tornado-free during past 20 yrs. Also there’s a horseshoe-shaped tornado-free area around Tokyo. The opinion of Fujita is that heat island so uniform that significant vorticity (spin) mainly generated at interface with cooler country air. Also the urban friction assumed to decrease tornado intensity.
j. Changnon showed there is an increase in thunderstorms and hail for cities over rural areas and that the increase is proportional to the population size of the city.
(Ex. Laporte, Ind. Anomaly concerned a 100-200% increase in thunderstorms and hail over a small town 35 miles SE of the Chicago-Gary, Ind. Industrial source).
k. Snow. There is less snow in cities (heat island) as more falls as rain (in Lund, Sweden, snow depth decreased from 8cm in rural area to 3cm in urban center). But another effect is in cold climate, anthropogenic nuclei (cola-fired power plant produce ice nuclei, some of which are already effective at -5C, can cause snow fall related to the plume) induce more winter snows.
The water budget is a way of keeping track of all inputs and outputs to the total water available to a city. The equation,
• P = E + R + ΔS,
where P is precipitation, E is evaporation, R is runoff and ΔS is change in ground storage, represent the components of the water budget.

Understanding Water BalancesUnderstanding Water Balances
Root zone
Water table
EvapotranspirationRainfall
Stormwater runoff
Infiltration
Natural water cycleNatural water cycle Urban Water CycleUrban Water Cycle
Root zone
Water table
EvapotranspirationRainfall
Stormwater runoff
Infiltration
Garden watering
Wastewater discharge
Water Supply

Inputs to urban system is greater than rural, since
(1) precipitation is augmented, and
(2) importation of water from outside for municipal use. (rural may have irrigation).
Evaporation and sub-surface storage are less in cities due to removal of vegetation and replacement by impervious surfaces.
Urban runoff is greater than rural. Partly this is due to sewage systems, the rest due to waterproofing surfaces and artificial routing, eg storm sewers.

Urban Flooding
Figure 11.29
Water budget calculation based on Thornthwaite and Mather’s method
Potential evapotranspiration (PE): water loss from a large homogeneous,vegetation-covered area (albedo of 22 to 25%) that never suffers from a lack of water.
(It is primary a function of climatic conditions (energy from the sun) and is not a function of type of vegetation, type of soil, soil moisture content or land management practices).
• If we know air temperature and latitude of the location, we can find PE from tables designed by Thornthwaite and Mather (they follow each other seasonally)

• We can calculate AE based on PE, P and soil moisture condition.
Actual evapotranspiration (AE): depend on all factors in addition to the climatic factors.
Whenever precipitation exceeds the climatic demand for water, the soil moisture storage will increase, a water surplus may develop, and the groundwater table may rise.

• If P is greater than PE, AE=PE, water storage increases (to p-PE). If water storage becomes larger than capacity (150mm for example), the amount of runoff is p-PE-change in storage (storage of water in soil of next month - current month)
• If P is smaller than PE, AE=p+change in storage. Deficit=PE-AE.
• If P equals PE, AE=PE, no storage change, no runoff

