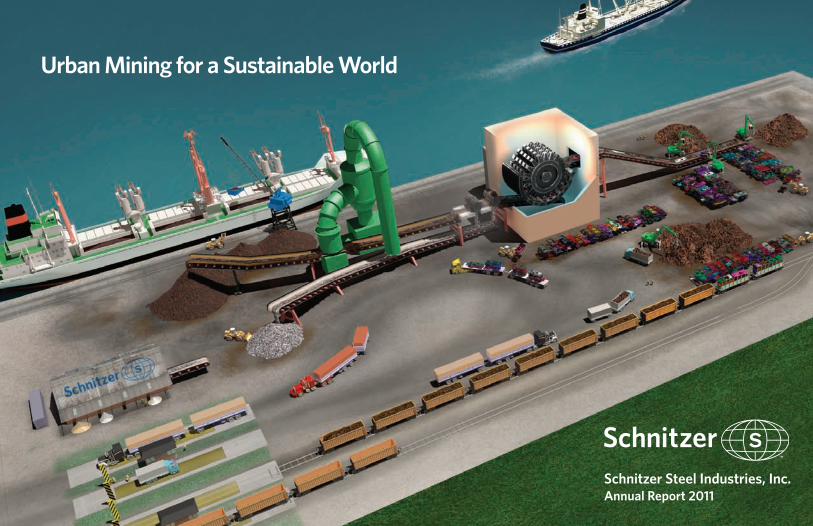
urban mining for a sustainable world - schnitzer steel industries
TRANSCRIPT
Annual Report 2011Schnitzer Steel Industries, Inc.
Urban Mining for a Sustainable World

Financial HighlightsFor The Year Ended August 31, 2011 2010 2009 2008 2007
Performance (in millions)Revenues $ 3,459 $ 2,301 $ 1,787 $ 3,517 $ 2,462 Operating income (loss) 186 126 (51) 403 212 Income (loss) from continuing operations 124 85 (27) 255 134 Net income (loss) attributable to SSI 118 67 (32) 249 131 Operating cash flow 140 89 288 142 179 Acquisitions, capital expenditures and share repurchases(1) 409 122 182 176 236
Balance Sheet Data (in millions)Cash and cash equivalents 49 30 41 15 13 Total assets 1,890 1,343 1,268 1,555 1,151 Total debt(2) 404 100 112 184 144 Total equity 1,101 980 923 983 770
Common Stock DataIncome (loss) per share from continuing operations attributable to SSI
Basic $ 4.28 $ 2.90 $ (0.99) $ 8.81 $ 4.34 Diluted $ 4.24 $ 2.86 $ (0.99) $ 8.63 $ 4.29
Dividends declared per common share $ 0.068 $ 0.068 $ 0.068 $ 0.068 $ 0.068 Weighted average common shares (in millions)
Basic 27.6 27.8 28.2 28.3 30.0 Diluted 28.0 28.1 28.2 28.9 30.4
Other Year-End DataMRB facilities 56 43 44 39 34APB stores 50 45 39 38 35SMB facilities 2 2 2 2 2Total employees 4,090 3,237 3,323 3,669 3,499
(1) Amount represents the sum of the applicable line items within the Company’s Consolidated Statements of Cash Flows reported on Form 10-K for each respective year. (2) Amount represents the sum of (i) Short-term borrowings and capital lease obligations, current and (ii) Long-term debt and capital lease obligations, net of current maturities, from the Company’s
Consolidated Balance Sheets reported on Form 10-K for each respective year.
Annual Report 2011 Schnitzer Steel Industries, Inc. | 1
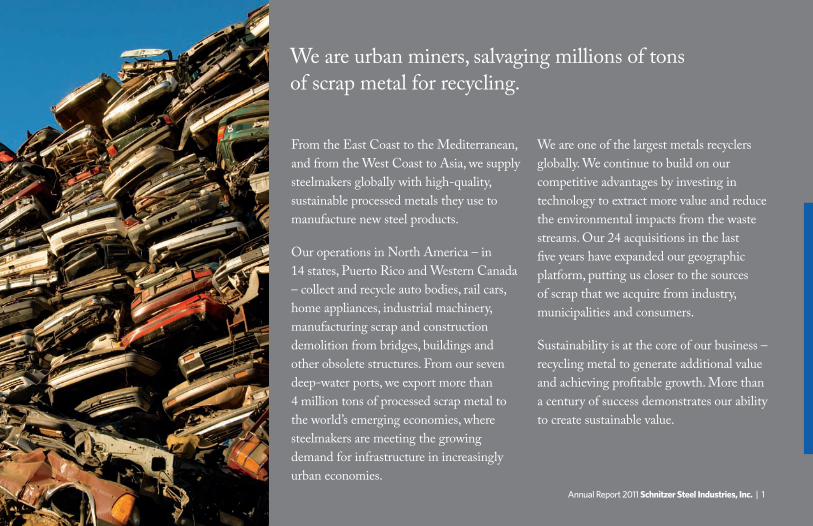
We are urban miners, salvaging millions of tons of scrap metal for recycling.
From the East Coast to the Mediterranean, and from the West Coast to Asia, we supply steelmakers globally with high-quality, sustainable processed metals they use to manufacture new steel products.
Our operations in North America – in 14 states, Puerto Rico and Western Canada – collect and recycle auto bodies, rail cars, home appliances, industrial machinery, manufacturing scrap and construction demolition from bridges, buildings and other obsolete structures. From our seven deep-water ports, we export more than 4 million tons of processed scrap metal to the world’s emerging economies, where steelmakers are meeting the growing demand for infrastructure in increasingly urban economies.
We are one of the largest metals recyclers globally. We continue to build on our competitive advantages by investing in technology to extract more value and reduce the environmental impacts from the waste streams. Our 24 acquisitions in the last five years have expanded our geographic platform, putting us closer to the sources of scrap that we acquire from industry, municipalities and consumers.
Sustainability is at the core of our business – recycling metal to generate additional value and achieving profitable growth. More than a century of success demonstrates our ability to create sustainable value.
Annual Report 2011 Schnitzer Steel Industries, Inc. | 1

Annual Report 2011 Schnitzer Steel Industries, Inc. | 32 | Schnitzer Steel Industries, Inc. Annual Report 2011
In fiscal 2011, we delivered nearly 50% growth in revenues, operating income and EPS. Our strong performance reflected a healthy combination of higher market demand, organic market-share expansion and the contributions from our acquisitions and investments in processes and technology. Our ability to drive growth straight to the bottom line demonstrates our disciplined approach to operational performance and investment returns. And our ability to consistently generate robust operating cash flow enables us to make further investments.
We achieved record sales volumes in fiscal 2011, selling 5.3 million tons of ferrous scrap and 569 million pounds of nonferrous scrap, an increase of 26% and 19%, respectively, over fiscal 2010. Our fiscal 2011 revenues of $3.46 billion increased 50% compared with fiscal 2010. We successfully executed on our growth
Dear Shareholders:In fiscal 2011, we achieved significant growth in every key metric.
Dear Shareholders:Tamara L. Lundgren
President and CEO

Annual Report 2011 Schnitzer Steel Industries, Inc. | 32 | Schnitzer Steel Industries, Inc. Annual Report 2011
strategy while simultaneously improving on the efficiency of our operations – resulting in a 48% year-over-year increase in our operating income and diluted earnings per share of $4.24.
Fiscal 2011 was a transformational year for our Company. We closed 10 acquisitions in seven states and added a new geographic location in Western Canada. These additional operations will strengthen our market position by enabling us to acquire scrap more efficiently across our operations. During the fiscal year, we also invested $105 million in capital expenditures to improve our processes – for example, our investments in our separation and extraction technologies are enabling us to extract more nonferrous metals from the materials we process, adding to our volumes and profits and reducing the waste we send to landfills. Our acquisitions and our capital expenditures provide us with a foundation for further growth.
$2,4
62
$3,5
17
$1,7
87 $2,3
01
$3,4
59
07 08 09 10 11
Revenues
Fiscal 2011 was a transformational year for our Company. We closed 10 acquisitions in seven states and added a new geographic location in Western Canada.

Annual Report 2011 Schnitzer Steel Industries, Inc. | 54 | Schnitzer Steel Industries, Inc. Annual Report 2011
In our Metals Recycling Business (MRB), revenues increased by 55%, driven by record sales volumes of both ferrous and nonferrous metals and organic growth in excess of 20%. We shipped our products to 19 countries, including China, Egypt, Malaysia, Taiwan and Turkey. With our continued focus on operational efficiencies, operating income in MRB grew by 39%.
In our Auto Parts Business (APB), revenues increased by 33% and operating income increased by 25%, despite a weak domestic economy. Our acquisition of five stores contributed meaningfully to APB’s growth, and we intend to continue expanding our APB platform.
In our Steel Manufacturing Business (SMB), we achieved operating income of $3 million, reflecting higher volumes, higher prices and the benefits of our past investments in operating efficiencies. These improvements in operating efficiencies and product diversification strongly position SMB to benefit when the domestic economy recovers.
In fiscal 2011, we invested $398 million in acquisitions and capital expenditures, giving us access to new sources of scrap and making our operations more efficient, more sustainable and more competitive.
Operating Cash Flow
$179
$14
2
$288
$89
$14
0
07 08 09 10 11
Income (Loss) from Continuing Operations
$134
$255
($27
)
$85
$124
07 08 09 10 11

Annual Report 2011 Schnitzer Steel Industries, Inc. | 54 | Schnitzer Steel Industries, Inc. Annual Report 2011
Strong performance and disciplined focus enabled us to generate healthy operating cash flow in fiscal 2011 of $140 million. We used this to fund our program of value-creating acquisitions while continuing to maintain a strong balance sheet.
Our financial and operational results reflect the hard work and commitment to excellence of Schnitzer’s 4,090 employees. Their dedication to teamwork and collaboration not only drove our financial results, but also contributed to our safety results: 42% of our sites went without an injury of any kind, and more than 72% reported no lost-time incidents in fiscal 2011. Operational excellence begins and ends with a culture of “safety first,” and our results indicate that our employees have done a tremendous job of working smart and working safely.
As we look forward, our strategy for growth remains clear: to align ourselves with the supply and demand dynamics of the global scrap and steel industries using our seven deep-water ports, and to continue to build upon our relationships with both sources and consumers of scrap to meet global demand wherever it is greatest.
Sincerely,
Tamara L. Lundgren President and Chief Executive Officer
Net Debt/Total Capital
14.5
%
14.7
%
24.4
%
7.1%
6.7%
XX
.X%
07 08 09 10 11
Income (Loss) per Sharefrom Continuing Operations Attributable to SSI (Diluted)
$4.2
9
$8.6
3
($0
.99)
$2.8
6 $4.2
4
07 08 09 10 11

6 | Schnitzer Steel Industries, Inc. Annual Report 2011
Schnitzer Steel Industries has achieved another year of success, building on our strengths and delivering on our commitment to profitability. Our philosophy of sustainability runs throughout our operations, to the culture of our people and to our Board of Directors. It is with certain regret, therefore, that we recognize changes in our leadership and governance with the departure of two longstanding Board members whose terms will end at our 2012 annual meeting in January.
Both Robert S. Ball and Jean S. Reynolds have been members of the Board since the Company went public in 1993. During their tenure, the Company has changed and grown dramatically. Robb Ball’s in-depth knowledge of corporate law and governance was instrumental in our transition from a private, family-owned company to a public corporation. He has provided unique guidance throughout his 18-year tenure on our Board. We wish him the best in his pursuit of long-postponed personal interests and his continued community leadership roles. As a part of the Schnitzer family, Jean Reynolds brought a rich appreciation for the history of the business along with a spirited support of its strategic growth. We will miss her and we wish her well in her future endeavors and community involvement.
On behalf of the Board and the entire Company, we thank Robb and Jean for their insight and dedication. We will continue to benefit from their contributions for years to come.
Sincerely,
Dear Shareholders:
John D. Carter Chairman of the Board
John D. CarterChairman
Annual Report 2011 Schnitzer Steel Industries, Inc. | 7

6 | Schnitzer Steel Industries, Inc. Annual Report 2011
Schnitzer Steel gathers scrap metal through its network of more than 100 facilities, then processes and ships it from one of seven major processing centers located at deep-water ports.
Annual Report 2011 Schnitzer Steel Industries, Inc. | 7

8 | Schnitzer Steel Industries, Inc. Annual Report 2011
Growth in revenues, operating income and EPS nearly
50%Record volumes reflect strong and steady demand
Fiscal 2011 Accomplishments
2011 Scrap Company of the Year American Metal Market’s award for industry excellence
Ferrous volumes:
5.3 million tons
Nonferrous volumes:
569 million pounds
Technology investments enable us to extract more value from scrap
acquisitions enhance sources of scrap and operating income per ton
10
Annual Report 2011 Schnitzer Steel Industries, Inc. | 9

8 | Schnitzer Steel Industries, Inc. Annual Report 2011
countries
Exported to
More than
Acquired two new businesses in Western Canada and expanded U.S. operations on both coasts
Car purchases up
7%, driving higher parts, scrap and core sales
19million in operating cash flow supports disciplined, strategic growth
revenues from export sales
$140
82%admissions to our Auto Parts Business
5 million
Annual Report 2011 Schnitzer Steel Industries, Inc. | 9

Brazil
China
Egypt
Greece
India
Indonesia
Italy
Japan
Malaysia
Mexico
South Korea
Spain
Taiwan
Thailand
Turkey
Export destinations
Annual Report 2011 Schnitzer Steel Industries, Inc. | 1110 | Schnitzer Steel Industries, Inc. Annual Report 2011

Consumption of steel in emerging economies is expected to be significantly higher in 2012 than in 2008 and to continue outpacing demand for steel in the developed world.
In developing economies, steel is a key building block for infrastructure – roads, buildings and industrial manufacturing – that emerging markets must create as their economies grow and their populations become more urban and affluent. In our export markets, infrastructure development represents a long-term commitment of resources. Infrastructure projects meet long-term needs that endure beyond the near-term business cycles. In many cases, multi-year spending programs guide the building of new infrastructure such as roads, railways and buildings. The demand for new infrastructure – and, thus, the demand for our exports of scrap metal – reflects GDP growth as well as fixed asset investment, industrial production and consumer activity. In many of the emerging economies – such as China, India and South Korea –
consumer spending has been growing at rates of 5% to 10% since 2005, and the long-term investments in fixed assets, as a percentage of GDP, has been growing at rates in excess of 25%.
In addition to the demand for our products that is driven by infrastructure development in the emerging markets, another major contributor to the demand for our scrap metal has been the increasing steel production by steel mills that use electric arc furnace (EAF) processes. Most of our customers employ EAF processes. Compared with blast furnace mills that primarily use iron ore to make steel, EAF mills make steel more efficiently with scrap metal, using less energy and water and generating up to 85% less greenhouse gas. By recycling scrap metal, they also avoid the
Annual Report 2011 Schnitzer Steel Industries, Inc. | 1110 | Schnitzer Steel Industries, Inc. Annual Report 2011

12 | Schnitzer Steel Industries, Inc. Annual Report 2011
environmental impacts of mining virgin ore and coal by mining urban waste streams that otherwise would be bound for landfills. Beyond EAF mills, as the steelmaking process continues to evolve, many blast furnace mills are focusing on ways to incorporate increasing amounts of scrap metal in their mix of raw materials, in order to capture some of these same environmental and energy-saving benefits.
In fiscal 2011, we processed and shipped our scrap metal to customers in 19 countries. The world’s largest seaborne scrap market – and a significant destination for our exports – continued to be Turkey. Today, after years of significant growth, Turkey’s EAF mills account for one-fifth of global scrap exports. Other major customers were located in China, South Korea, Thailand, Egypt, Malaysia and Indonesia. In the U.S., our largest buyer of scrap metal continued to be our steel mill in McMinnville, Oregon, but we also shipped to other mills primarily in the southeastern U.S.
As the export market for recycled metal has increased in recent years, we have not only maintained our position, but have steadily increased our market share. During 2009, we accounted for approximately 14% of U.S. exports of ferrous metals and in calendar year 2010, we increased our share to 21%.
Annual Report 2011 Schnitzer Steel Industries, Inc. | 13

12 | Schnitzer Steel Industries, Inc. Annual Report 2011
Turkey has been the fastest-growing steel producer outside of the Asia-Pacific region. After doubling its production over the last decade, Turkey became 10th among the world’s steelmakers. Turkey is a key export destination for Schnitzer.
Annual Report 2011 Schnitzer Steel Industries, Inc. | 13
Located at the crossroads of the Black and Mediterranean seas, Turkey sits astride the routes that connect the world’s scrap markets with some of the fastest-growing markets for finished steel. In fiscal 2011, Turkey continued to be a leading export market for Schnitzer. Turkish steelmakers supplied a domestic market that grew on a per capita basis by more than 25% between 2005 and 2010 – and they exported more than $750 million of steel to each of the United Arab Emirates, Iraq, Saudi Arabia and Europe in 2010.
Steel from Turkish mills was used in the al Burj building in Dubai – the world’s tallest building; the Heathrow Airport terminal extension; the Turkey-Greece natural gas pipeline; the Israel natural gas pipeline; and the Baku-Tbilisi-Ceyhan crude oil pipeline.
Turkey relies on recycled metals to supply three-quarters of its steel production at its 24 mills that use the electric arc furnace (EAF) process. Combined, these mills make Turkey the largest importer of ferrous scrap in the world: in 2010 the Turkish steel industry imported 19.2 million tons of scrap – worth approximately $7.1 billion.

Annual Report 2011 Schnitzer Steel Industries, Inc. | 15
We’re making acquisitions and investments to accelerate growth and develop new sources of scrap to supply increasing global demand.
We buy scrap metal in the U.S. – typically end-of-life vehicles, white goods, construction and demolition materials, and industrial discards – from manufacturers, municipalities and waste handlers and from thousands of entrepreneurs who gather scrap across America’s urban landscape. One of our largest suppliers is our Auto Parts Business, which buys and processes end-of-life vehicles – often referred to as junk cars. Scrap is created when consumers replace end-of-life vehicles or old appliances, when property owners demolish and replace a building, and from manufacturing activity. The supply of scrap is affected by GDP growth and the strength of the consumer economy and is only marginally affected
by changes in scrap prices. In light of the slower U.S. economy, one of our key strategies has been to take steps to get closer to the sources of scrap metal in North America.
Since 2005, we have increased our capacity to gather scrap metal by successfully acquiring and integrating 24 operations. In 2011, we acquired 10 operations that enlarged our geographic footprint on both coasts of the U.S., including a new platform for MRB in Western Canada. Acquisition of new facilities extends our access to more sources of scrap metal; it also further enhances our profitability with higher operating efficiencies and lower transaction costs.
14 | Schnitzer Steel Industries, Inc. Annual Report 2011
Annual Report 2011 Schnitzer Steel Industries, Inc. | 15
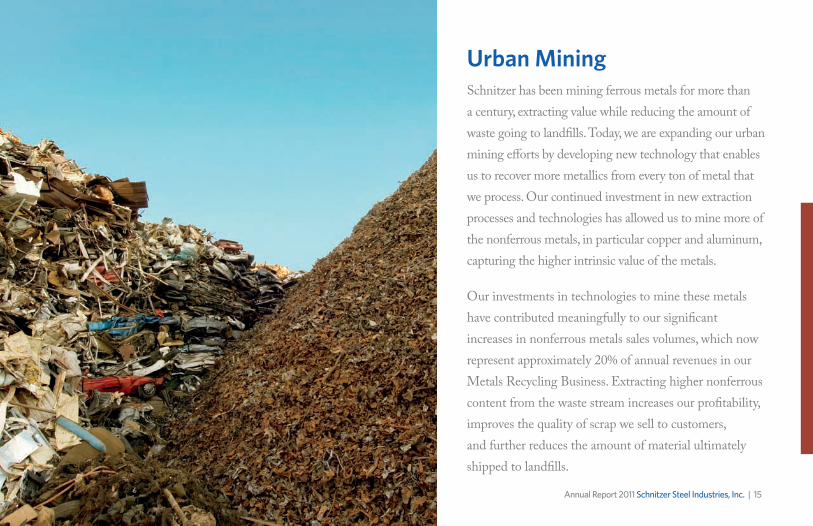
Urban MiningSchnitzer has been mining ferrous metals for more than a century, extracting value while reducing the amount of waste going to landfills. Today, we are expanding our urban mining efforts by developing new technology that enables us to recover more metallics from every ton of metal that we process. Our continued investment in new extraction processes and technologies has allowed us to mine more of the nonferrous metals, in particular copper and aluminum, capturing the higher intrinsic value of the metals.
Our investments in technologies to mine these metals have contributed meaningfully to our significant increases in nonferrous metals sales volumes, which now represent approximately 20% of annual revenues in our Metals Recycling Business. Extracting higher nonferrous content from the waste stream increases our profitability, improves the quality of scrap we sell to customers, and further reduces the amount of material ultimately shipped to landfills.
14 | Schnitzer Steel Industries, Inc. Annual Report 2011

Annual Report 2011 Schnitzer Steel Industries, Inc. | 1716 | Schnitzer Steel Industries, Inc. Annual Report 2011
We gather scrap across North America and export it to customers globally.
APB
MRB
SMB
Corporate
Schnitzer is a global leader in urban mining. Since 2005, we have grown from a U.S. West Coast-based recycler that mostly exported to a few Asian countries to a North American metals recycler with over 100 locations. Our integrated operations now reach deep into America’s interior to access scrap metal, and include seven deep-water ports on both U.S. coasts and customers in more than two dozen countries.

Annual Report 2011 Schnitzer Steel Industries, Inc. | 1716 | Schnitzer Steel Industries, Inc. Annual Report 2011
Our supply chain for scrap extends from our facilities throughout the U.S. and Western Canada. Our supply chain is linked to efficient transportation routes for trucks, railroad or barge connections, which allow us to move scrap metal to our processing and export facilities that are located at our deep-water ports. Our operations have created significant jobs in the U.S., contributing to our nation’s domestic manufacturing base and improving our nation’s environmental footprint while delivering the benefits of recycling globally.
We maintain relationships with hundreds of suppliers of scrap across America’s urban landscape – and with customers in steelmaking centers around the world – enabling us to match our inventories and pricing to the shifting market trends. We have the flexibility to ship our scrap metal from North America to the global markets where the demand is strongest at any point in time.
18 | Schnitzer Steel Industries, Inc. Annual Report 2011
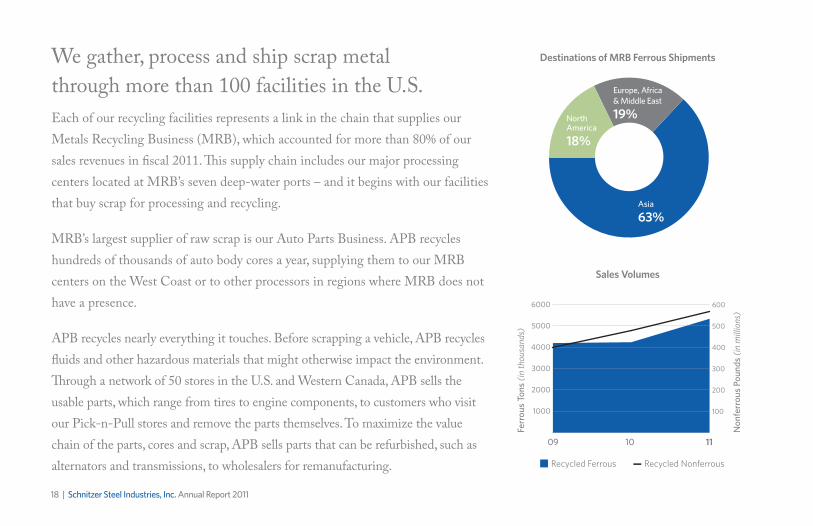
We gather, process and ship scrap metal through more than 100 facilities in the U.S.
Destinations of MRB Ferrous Shipments
Sales Volumes
Each of our recycling facilities represents a link in the chain that supplies our Metals Recycling Business (MRB), which accounted for more than 80% of our sales revenues in fiscal 2011. This supply chain includes our major processing centers located at MRB’s seven deep-water ports – and it begins with our facilities that buy scrap for processing and recycling.
MRB’s largest supplier of raw scrap is our Auto Parts Business. APB recycles hundreds of thousands of auto body cores a year, supplying them to our MRB centers on the West Coast or to other processors in regions where MRB does not have a presence.
APB recycles nearly everything it touches. Before scrapping a vehicle, APB recycles fluids and other hazardous materials that might otherwise impact the environment. Through a network of 50 stores in the U.S. and Western Canada, APB sells the usable parts, which range from tires to engine components, to customers who visit our Pick-n-Pull stores and remove the parts themselves. To maximize the value chain of the parts, cores and scrap, APB sells parts that can be refurbished, such as alternators and transmissions, to wholesalers for remanufacturing.
100
200
300
400
500
600
1000
2000
3000
4000
5000
6000
09 1110
Ferr
ous
Tons
(in
thou
sand
s)
Recycled Ferrous Recycled Nonferrous
Non
ferr
ous
Poun
ds (
in m
illio
ns)
Asia
63%
Europe, Africa & Middle East
19%North America
18%
Annual Report 2011 Schnitzer Steel Industries, Inc. | 19

18 | Schnitzer Steel Industries, Inc. Annual Report 2011
MRB Operating Income/Ferrous Tons Sold
$21
$21$2
4
$38
$31
$45
$19
$34
$28 OI/ton2010
$31 OI/ton2011
Q1 Q2 Q3 Q4 Q1 Q2 Q3 Q4
Annual Report 2011 Schnitzer Steel Industries, Inc. | 19
Annual Report 2011 Schnitzer Steel Industries, Inc. | 21
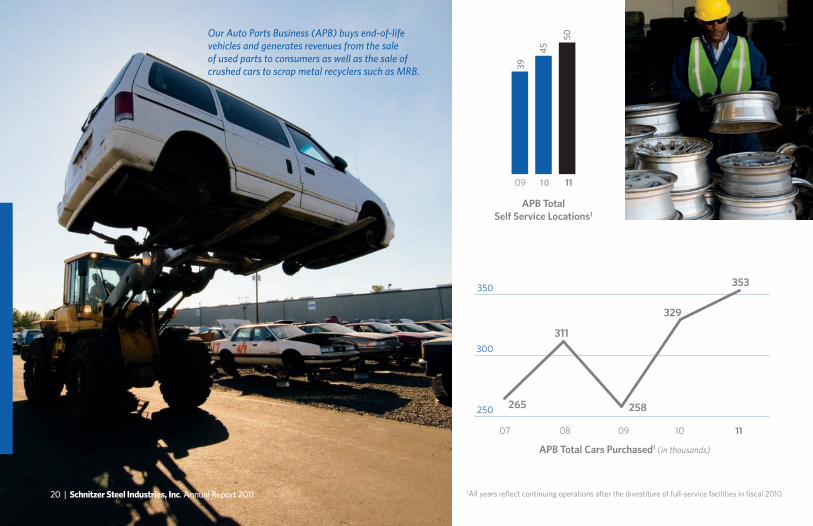
Our Auto Parts Business (APB) buys end-of-life vehicles and generates revenues from the sale of used parts to consumers as well as the sale of crushed cars to scrap metal recyclers such as MRB.
APB Total Cars Purchased1 (in thousands)
APB TotalSelf Service Locations1
39
45
50
09 10 11
1All years reflect continuing operations after the divestiture of full-service facilities in fiscal 2010.
250
300
350
07 08 09 10 11
353
329
258265
311
20 | Schnitzer Steel Industries, Inc. Annual Report 2011

Annual Report 2011 Schnitzer Steel Industries, Inc. | 21
Our Auto Parts Business has grown both organically and through acquisitions, with year-over-year revenue growth of more than 30% in fiscal 2011.
09 10 11
46%
58%
56%
Rolling Mill Utilization
A key strategy for Schnitzer Steel is to get closer to the sources of scrap. APB has grown its volumes of vehicles purchased, both through organic programs and acquisitions. It also continues to drive more traffic to its stores through marketing programs and better service for both professional and do-it-yourself mechanics. APB’s results reflect the contributions of five new locations acquired in fiscal 2011, including stores in the Seattle region that supply our MRB facility in nearby Tacoma.
MRB sells its high-quality processed scrap to steel mills worldwide, including our own Steel Manufacturing Business (SMB) in McMinnville, Oregon.
SMB recycles scrap into rebar, wire rod, merchant bar and other specialty products for customers in the Western U.S. and Canada.
Due to the current weak environment, SMB’s utilization has ranged from 50% to 60%, well below its annual production capacity of 800,000 tons. However, SMB has successfully implemented continuous improvement programs and enhanced product diversification, enabling SMB to achieve positive earnings and cash flow during the downturn and strongly positioning the mill to benefit when West Coast demand recovers.
20 | Schnitzer Steel Industries, Inc. Annual Report 2011

Annual Report 2011 Schnitzer Steel Industries, Inc. | 23
Boston
Hawaii
Oakland
Portland
Puerto Rico
Rhode Island
Tacoma
MRB shipping ports
22 | Schnitzer Steel Industries, Inc. Annual Report 2011

Annual Report 2011 Schnitzer Steel Industries, Inc. | 23
Our Processes...Mega-shreddersThrough our deep-water ports and supply network, which is in close proximity to railroad routes, waterways and major highways, we are geographically aligned with the supply and demand dynamics of our market. However, our strategic advantages do not stop there. We are focused on continuous improvement at every step in the process of our high-volume, low-cost operations. We make investments annually in our mega-shredders to maximize our processing efficiency as well as increasing the amount of material we extract from the waste stream. These shredders, delivering up to 9,000 horsepower, enable us to shred an auto body in less than a minute while downstream sorting systems automate the separation of ferrous and nonferrous material. As a result, we are producing scrap that more precisely meets our customers’ requirements for size, shape and purity while sending less residual material to the landfill.
We also have been investing in new technology to extract more nonferrous metals from our scrap flows, and we are buying more discrete nonferrous scrap through our expanded sales and collection sites. This enabled us to grow sales of nonferrous metals by 19% in fiscal 2011, helped us increase our operating margin per ton of scrap, and allowed us to deliver a more consistent grade of scrap to our customers.
MRB shipping ports
22 | Schnitzer Steel Industries, Inc. Annual Report 2011

24 | Schnitzer Steel Industries, Inc. Annual Report 2011
We continue to invest in people, processes and technologies to make our business more efficient and sustainable.
We are already processing significant volumes of scrap for recycling, thanks to our extensive network of scrap gathering and processing facilities and our high-throughput yards. But we are aiming to do it better by investing in every step of our business: from gathering, to separating and processing the raw metals and, finally, to selling processed metals worldwide.
Our modern storm water recycling systems illustrate these investments. We installed networks of drains and catch-basins to capture and cleanse the water in our processing yards. This reduces the potential for storm water to contaminate oceans and rivers. In certain instances, we harvest the storm water to cool our equipment and dampen dust. These systems not only reduce our use of water, but they also reduce our environmental footprint, making our recycling
operations more sustainable – even on the sensitive urban shorelines where we load ships for export.
This follows the pattern we set with our many other initiatives to drive our business forward. These have included continuous improvement programs that engage all of our people in the process of making our operations more efficient and effective; strategic efforts to improve our sourcing of raw materials; initiatives to maximize our yields by introducing, for example, new technologies to extract more nonferrous metals from our streams of scrap; and efforts to systematically apply the visibility we have into global selling prices to our processes for buying scrap in domestic markets.
As we leverage our existing competitive advantages and build new advantages, we benefit our customers, our shareholders, our communities and the environment.
Annual Report 2011 Schnitzer Steel Industries, Inc. | 25

24 | Schnitzer Steel Industries, Inc. Annual Report 2011 Annual Report 2011 Schnitzer Steel Industries, Inc. | 25

Annual Report 2011 Schnitzer Steel Industries, Inc. | 2726 | Schnitzer Steel Industries, Inc. Annual Report 2011
Condensed Consolidated Statements of Operations(in thousands, except per share amounts, unaudited)
2011 2010 2009 Revenues $ 3,459,194 $ 2,301,240 $ 1,787,230 Cost of goods sold 3,072,165 2,019,764 1,681,942 Selling, general and administrative 205,025 158,805 163,410 Environmental matters 662 (91) (5,809) Income from joint ventures (4,622) (3,135) (1,189) Operating income (loss) 185,964 125,897 (51,124) Other Income (Expense):Interest income 384 459 1,179 Interest expense (8,436) (2,343) (3,342) Other income, net 2,893 1,320 6,223Total other (expense) income (5,159) (564) 4,060 Income from continuing operations before income taxes 180,805 125,333 (47,064) Income tax (expense) benefit (57,168) (40,825) 19,915 Income from continuing operations 123,637 84,508 (27,149) Loss from discontinued operations, net of tax (101) (13,832) (4,214) Net income (loss) 123,536 70,676 (31,363) Net income attributable to non-controlling interests (5,181) (3,926) (866) Net income (loss) attributable to SSI $ 118,355 $ 66,750 $ (32,229) Basic:Income (loss) per share from continuing operations attributable to SSI $ 4.28 $ 2.90 $ (0.99) Loss per share from discontinued operations — (0.50) (0.15) Net income (loss) per share attributable to SSI $ 4.28 $ 2.40 $ (1.14) Diluted:Income (loss) per share from continuing operations attributable to SSI $ 4.24 $ 2.86 $ (0.99) Loss per share from discontinued operations (0.01) (0.49) (0.15) Net income (loss) per share attributable to SSI $ 4.23 $ 2.37 $ (1.14) Weighted Average Number of Common Shares:Basic 27,649 27,832 28,159 Diluted 27,959 28,147 28,159 Dividends declared per common share $ 0.068 $ 0.068 $ 0.068

Annual Report 2011 Schnitzer Steel Industries, Inc. | 2726 | Schnitzer Steel Industries, Inc. Annual Report 2011
Condensed Consolidated Balance Sheets(in thousands, except per share amounts, unaudited)
2011 2010 2009 Revenues $ 3,459,194 $ 2,301,240 $ 1,787,230 Cost of goods sold 3,072,165 2,019,764 1,681,942 Selling, general and administrative 205,025 158,805 163,410 Environmental matters 662 (91) (5,809) Income from joint ventures (4,622) (3,135) (1,189) Operating income (loss) 185,964 125,897 (51,124) Other Income (Expense):Interest income 384 459 1,179 Interest expense (8,436) (2,343) (3,342) Other income, net 2,893 1,320 6,223Total other (expense) income (5,159) (564) 4,060 Income from continuing operations before income taxes 180,805 125,333 (47,064) Income tax (expense) benefit (57,168) (40,825) 19,915 Income from continuing operations 123,637 84,508 (27,149) Loss from discontinued operations, net of tax (101) (13,832) (4,214) Net income (loss) 123,536 70,676 (31,363) Net income attributable to non-controlling interests (5,181) (3,926) (866) Net income (loss) attributable to SSI $ 118,355 $ 66,750 $ (32,229) Basic:Income (loss) per share from continuing operations attributable to SSI $ 4.28 $ 2.90 $ (0.99) Loss per share from discontinued operations — (0.50) (0.15) Net income (loss) per share attributable to SSI $ 4.28 $ 2.40 $ (1.14) Diluted:Income (loss) per share from continuing operations attributable to SSI $ 4.24 $ 2.86 $ (0.99) Loss per share from discontinued operations (0.01) (0.49) (0.15) Net income (loss) per share attributable to SSI $ 4.23 $ 2.37 $ (1.14) Weighted Average Number of Common Shares:Basic 27,649 27,832 28,159 Diluted 27,959 28,147 28,159 Dividends declared per common share $ 0.068 $ 0.068 $ 0.068
(in thousands, unaudited)
August 31, 2011 August 31, 2010 August 31, 2009
ASSETS
Current Assets:
Cash and cash equivalents $ 49,462 $ 30,342 $ 41,026
Accounts receivable, net 229,975 126,156 117,666
Inventories, net 335,120 268,103 184,455
Other current assets 39,442 36,193 67,867
Total current assets 653,999 460,794 411,014
Property, plant and equipment, net 555,284 460,810 447,228
Goodwill and other assets 680,886 421,814 409,991
Total assets $ 1,890,169 $ 1,343,418 $ 1,268,233
LIABILITIES And EquITY
Current Liabilities:
Short-term borrowings and capital lease obligations, current $ 643 $ 1,189 $ 1,317
Other current liabilities 232,670 158,924 138,812
Total current liabilities 233,313 160,113 140,129
Long-term debt and capital lease obligations, net of current maturities 403,287 99,240 110,414
Other long-term liabilities 133,280 104,433 94,940
Redeemable non-controlling interest 19,053 — —
Equity:
Total Schnitzer Steel Industries, Inc. ("SSI") Shareholders' equity 1,094,712 975,326 919,367
Non-controlling interests 6,524 4,306 3,383
Total equity 1,101,236 979,632 922,750
Total liabilities and equity $ 1,890,169 $ 1,343,418 $ 1,268,233

Annual Report 2011 Schnitzer Steel Industries, Inc. | 2928 | Schnitzer Steel Industries, Inc. Annual Report 2011
(in thousands, unaudited)
2011 2010 2009
Cash Flows From Operating Activities:
Net income (loss) $ 123,536 $ 70,676 $ (31,363)
Adjustments to Reconcile Net Income (Loss) to Cash Provided by Operating Activities:
Depreciation and amortization 74,866 63,418 60,681
Inventory write-down — 368 51,968
Other adjustments to reconcile net income (loss) 31,859 29,976 24,537
Change in assets and liabilities, net of effects of acquisitions (89,798) (74,948) 181,756
Net cash provided by operating activities 140,463 89,490 287,579
Cash Flows From Investing Activities:
Capital expenditures (104,964) (64,324) (59,044)
Acquisitions, net of cash acquired (293,880) (40,944) (93,053)
Proceeds from sale of business and other assets 530 41,319 3,497
Other (1,587) (340) (1,876)
Net cash used in investing activities (399,901) (64,289) (150,476)
Cash Flows From Financing Activities:
Borrowings from (repayment of) debt 302,856 (11,342) (75,829)
Repurchase of Class A common stock (10,303) (17,147) (29,896)
Other (12,602) (7,209) (5,167)
Net cash provided by (used in) financing activities 279,951 (35,698) (110,892)
Effect of exchange rate changes on cash (1,393) (187) (224)
Net increase (decrease) in cash and cash equivalents 19,120 (10,684) 25,987
Cash and cash equivalents at beginning of year 30,342 41,026 15,039
Cash and cash equivalents at end of year $ 49,462 $ 30,342 $ 41,026
Condensed Consolidated Statements of Cash Flows

Annual Report 2011 Schnitzer Steel Industries, Inc. | 2928 | Schnitzer Steel Industries, Inc. Annual Report 2011
(in thousands, unaudited)
2011 2010 2009
Cash Flows From Operating Activities:
Net income (loss) $ 123,536 $ 70,676 $ (31,363)
Adjustments to Reconcile Net Income (Loss) to Cash Provided by Operating Activities:
Depreciation and amortization 74,866 63,418 60,681
Inventory write-down — 368 51,968
Other adjustments to reconcile net income (loss) 31,859 29,976 24,537
Change in assets and liabilities, net of effects of acquisitions (89,798) (74,948) 181,756
Net cash provided by operating activities 140,463 89,490 287,579
Cash Flows From Investing Activities:
Capital expenditures (104,964) (64,324) (59,044)
Acquisitions, net of cash acquired (293,880) (40,944) (93,053)
Proceeds from sale of business and other assets 530 41,319 3,497
Other (1,587) (340) (1,876)
Net cash used in investing activities (399,901) (64,289) (150,476)
Cash Flows From Financing Activities:
Borrowings from (repayment of) debt 302,856 (11,342) (75,829)
Repurchase of Class A common stock (10,303) (17,147) (29,896)
Other (12,602) (7,209) (5,167)
Net cash provided by (used in) financing activities 279,951 (35,698) (110,892)
Effect of exchange rate changes on cash (1,393) (187) (224)
Net increase (decrease) in cash and cash equivalents 19,120 (10,684) 25,987
Cash and cash equivalents at beginning of year 30,342 41,026 15,039
Cash and cash equivalents at end of year $ 49,462 $ 30,342 $ 41,026
(unaudited)
1q11 2q11 3q11 4q11
FIScAL YEAR 2011 1Q10 2Q10 3Q10 4Q10
FISCAl YEAR 2010
Metals Recycling Business
Ferrous Selling Prices ($/LT)(1)
Steel Manufacturing Business $ 350 $ 408 $ 442 $ 435 $ 412 $ 292 $ 300 $ 386 $ 359 $ 339
Other domestic 315 399 422 410 389 252 292 356 324 311
Exports 359 424 443 449 421 280 298 382 343 330
Average $ 353 $ 419 $ 440 $ 443 $ 416 $ 277 $ 297 $ 378 $ 342 $ 328
Ferrous Sales Volume (LT)SMB 90,537 95,774 122,238 95,351 403,900 122,171 80,728 139,404 115,869 458,172
Domestic 161,301 144,250 199,818 183,502 688,871 134,595 160,424 197,226 158,487 650,732
Export 979,063 860,005 1,142,156 1,254,708 4,235,932 499,899 933,123 838,766 849,863 3,121,651
Total processed 1,230,901 1,100,029 1,464,212 1,533,561 5,328,703 756,665 1,174,275 1,175,396 1,124,219 4,230,555
Nonferrous Average Price ($/LB)(1) $ 0.94 $ 1.04 $ 1.12 $ 1.08 $ 1.06 $ 0.73 $ 0.80 $ 0.94 $ 0.84 $ 0.83
Nonferrous Sales Volume (LB, in 000s) 111,495 121,498 144,505 191,062 568,560 110,247 104,892 124,283 139,063 478,485
Steel Manufacturing Business
Sales Prices ($/NT)(1) (2)
Average $ 634 $ 687 $ 734 $ 721 $ 697 $ 520 $ 556 $ 635 $ 618 $ 587
Sales Volume (NT)(2)
Rebar 63,668 51,569 45,494 61,411 222,142 55,875 42,588 52,792 66,047 217,302
Coiled products 26,917 40,947 67,020 57,553 192,437 38,051 47,660 70,738 44,233 200,682
Merchant bar and other 7,071 6,322 5,811 5,290 24,494 6,249 6,147 7,840 5,296 25,532
Total 97,656 98,838 118,325 124,254 439,073 100,175 96,395 131,370 115,576 443,516
Auto Parts BusinessNumber of self-service locations at end of quarter 45 50 50 50 50 43 45 45 45 45
Car purchase volumes (in 000s) 82 81 93 97 353 88 70 86 85 329
(1) Price information is shown after a reduction for the cost of freight incurred to deliver the product to the customer.(2) Excludes billet sales.
Selected Quarterly Operating Statistics

Annual Report 2011 Schnitzer Steel Industries, Inc. | 3130 | Schnitzer Steel Industries, Inc. Annual Report 2011
Board of Directors
From left to right:
Kenneth M. NovackFormer Chairman, Schnitzer Steel Industries, Inc.
Robert S. BallRetired Senior Counsel, Ball Janik LLP
Wayland R. HicksFormer Vice Chairman, United Rentals, Inc.
Jean S. ReynoldsFormer Marketing Consultant
John D. CarterChairman of the Board, Schnitzer Steel Industries, Inc.
Tamara L. LundgrenPresident and Chief Executive Officer, Schnitzer Steel Industries, Inc.
William A. FurmanPresident and Chief Executive Officer, The Greenbrier Companies
William D. LarssonFormer Senior Vice President and Chief Financial Officer, Precision Castparts Corp.
Judith A. JohansenPresident, Marylhurst University
Scott LewisFounder and Principal, Brightworks
David J. AndersonFormer Executive Director and Co-Vice Chairman, Sauer-Danfoss, Inc.

Annual Report 2011 Schnitzer Steel Industries, Inc. | 3130 | Schnitzer Steel Industries, Inc. Annual Report 2011

32 | Schnitzer Steel Industries, Inc. Annual Report 2011
Corporate Information
ExEcuTIvE OFFIcERS
Tamara L. LundgrenPresident and Chief Executive Officer
Richard D. PeachSenior Vice President and Chief Financial Officer
Richard C. JosephsonSenior Vice President, General Counsel and Secretary
Gary A. SchnitzerExecutive Vice President, Business Development
Jeffrey DyckSenior Vice President and President, Steel Manufacturing Business
Donald W. HamakerSenior Vice President and President, Metals Recycling Business
Thomas D. Klauer, Jr.Senior Vice President and President, Auto Parts Business
George P. NutwellSenior Vice President and Chief of Operations
Jeff P. PoeschlVice President, Corporate Controller and Principal Accounting Officer
PuBLIc InFORMATIOn
Financial analysts, stockbrokers, interested investors and others seeking additional information about the Company may contact:
Alexandra M. DeignanVice President, Investor Relations
Schnitzer Steel Industries, Inc.(646) 278 9711 (tel) (503) 471 4722 (fax) [email protected] www.schnitzersteel.com
TRAnSFER AgEnT And REgISTRAR
The transfer agent and registrar for Schnitzer Steel Industries, Inc. Class A common stock is:
Wells Fargo Bank, NA161 N. Concord Exchange South St. Paul, MN 55075-1139 (800) 468 9716

32 | Schnitzer Steel Industries, Inc. Annual Report 2011
AnnuAL MEETIng
The Annual Meeting of Shareholders will be held:
January 25, 2012, at 8:00 am PST
Multnomah Athletic Club1849 SW Salmon Street Portland, OR 97205
dIvIdEnd PAYMEnT
Dividends on the Company’s common stock in fiscal year 2012 are expected to be paid during the months of March, June, August and December.
IndEPEndEnT REgISTEREd PuBLIc AccOunTAnTS
PwCPortland, OR 97201
FORwARd-LOOkIng STATEMEnTS
The information contained in this Annual Report should be read in conjunction with the ”Forward-Looking Statements,” “Risk Factors” and the “Management’s Discussion and Analysis” sections in our most recent Annual Report on Form 10-K and Quarterly Report on Form 10-Q.
cORPORATE HEAdquARTERS
Schnitzer Steel Industries, Inc.3200 NW Yeon Avenue Portland, OR 97210 (503) 224 9900
STOck TRAdIng SYMBOL
Schnitzer Steel’s common stock is traded on the NASDAQ Stock Market, Inc. under the symbol SCHN.
Design: Eisenman Associates

Schnitzer Steel Industries, Inc. P.O. Box 10047 Portland, OR 97296-0047 schnitzersteel.com