urban life evidence - st. michael's hospital · equitable access to health care services,...
TRANSCRIPT

St. Michael’s Hospital30 Bond StreetToronto, Ontario M5B 1W8416-360-4000www.stmichaelshospital.com
Measuring Equity of Care in Hospital Settings:From Concepts to Indicators
REpORT TO THE HOSpITal COllaBORaTIvE On MaRgInalIzEd pOpulaTIOnS (TOROnTO CEnTRal lOCal HEalTH InTEgRaTIOn nETWORk)
Prepared by the Centre for Research on Inner City Health (CRICH). CRICH is part of the Keenan Research Centre in the Li Ka Shing Knowledge Institute of St. Michael’s Hospital.
May 2009
patient care
health careurban life
partnership
indicators
evidenceperformance
inclusion
qualitydiversity
culture
SMH_MEASURINGEQUITY_COVER.indd 1 5/18/09 8:58:03 PM

The Hospital Collaborative on Marginalized Populations in the Toronto Central Local Health Integration Network
is a voluntary community of practice. The Collaborative was established by Chief Executive Officers of Toronto
area hospitals to share best practices and to work in partnership to reduce health inequities for vulnerable and
marginalized populations.
The Centre for Research on Inner City Health (CRICH) at St. Michael’s Hospital is Canada’s only hospital-based
research organization focused on the health consequences of urban life and social inequality. CRICH is supported
by the Ontario Ministry of Health and long-Term Care to conduct research to help ensure that Ontarians have
equitable access to health care services, regardless of who they are, where they live, or what they own. CRICH is
affiliated with the university of Toronto and is part of the keenan Research Centre in the li ka Shing knowledge
Institute of St. Michael’s Hospital.
Acknowledgements
guidance on the development of this project was generously provided by: arlene Bierman (li ka Shing knowledge
Institute of St. Michael’s Hospital), Rick Edwards (St. Joseph’s Health Centre), linda gardner (Women’s College
Hospital), Bob gardner (Wellesley Institute), gary lee (St. Michael’s Hospital), Jim O’neill (St. Michael’s Hospital),
Rosalie Steinberg (Mount Sinai Hospital), and anna van der Meulen (Centre for Research on Inner City Health, St.
Michael’s Hospital).
This project was funded in part by a grant from the Canadian Institutes of Health Research (CIHR) and was
conducted as part of the CIHR Strategic Training Initiative in Health Research, “Transdisciplinary approaches
to the Health of Marginalized populations”.
SMH_MEASURINGEQUITY_COVER.indd 2 5/18/09 8:58:03 PM

Measuring Equity of Care in Hospital Settings: From Concepts to Indicators | 1
TA B L E O F CO N T E N TS
EXECUTIVE SUMMARY ........................................................................ 2KEY MESSAGES .................................................................................... 4InTRodUCTIon ................................................................................... 5ConTEXT .............................................................................................. 6METHodS ............................................................................................ 7HoSpITAl EqUITY IndICAToR 1 ..................................................... 10HoSpITAl EqUITY IndICAToR 2 ..................................................... 12HoSpITAl EqUITY IndICAToR 3 ..................................................... 14HoSpITAl EqUITY IndICAToR 4 ..................................................... 16
This Centre for Research on Inner City Health report was prepared by:Gilbert Gallaher, Bn, MpHC, dr pH
Sophie Kim, BA
Maritt Kirst, phd
Aisha lofters, Md, CCFp
Kelly Murphy, MEd
patricia o’Campo, phd
Carlos quiñonez, dMd, phd
nicole Schaefer-Mcdaniel, phd
Ketan Shankardass, phd
In partnership with:The Hospital Collaborative on Marginalized populations in the Toronto Central local Health Integration network
May 2009
Available to download at: www.crich.ca
HoSpITAl EqUITY IndICAToR 5 ..................................................... 18HoSpITAl EqUITY IndICAToR 6 ..................................................... 20HoSpITAl EqUITY IndICAToR 7 ..................................................... 22HoSpITAl EqUITY IndICAToR 8 ..................................................... 24HoSpITAl EqUITY IndICAToR 9 ..................................................... 26HoSpITAl EqUITY IndICAToR 10 ................................................... 28ConClUdInG REMARKS .................................................................. 30AppEndIX (AddITIonAl RESoURCES And CASE STUdIES) ....... 34 REFEREnCE lIST ................................................................................ 35
MEASuRINg EquITy OF CARE IN HOSpITAL SETTINgS:
FROM CONCEpTS TO INdICATORS

E X EC u T I V E S u M M A Ry
The province of ontario has identified the need to address inequities in health care (Rachlis, 2007). In 2009, the Toronto Central local Health Integration network (TC-lHIn) required hospitals to begin reporting on equity initiatives. despite increasing interest, measuring equity in hospitals is a relatively new practice in Canada. Knowledge of indicators best suited for assessing equity in hospitals, including how best to measure and take action relative to these indicators, is only just developing.
The Centre for Research on Inner City Health (CRICH) at St. Michael’s Hospital partnered with the Hospital Collaborative on Marginalized populations in the TC-lHIn to complete a review of scholarly and grey literature concerning existing approaches for measuring equity of care in the hospital setting.
This report frames equity as a crucial component of health care quality in the hospital, with the understanding that inequitable care may lead to “potentially avoidable differences in health ... between groups of people who are more and less advantaged socially” and that “these differences systematically place socially disadvantaged groups at further disadvantage in health” (Braveman, 2006, p. 180).
This report focuses specifically on indicators related to equity of care provided by hospitals. We also looked at hospital equity indicators that are directly relevant to TC-lHIn priority populations (i.e., the elderly, people with mental illness and addictions, and people with diabetes mellitus). Indicator selection was guided by the following criteria: Evidence of previous use, Endorsement, Feasibility, Adaptability, Applicability to equity, and Transferability. 251 academic and 111 grey publications were reviewed in light of these criteria and priorities. Ten indicators emerged as appropriate for Toronto hospitals to utilize as they begin systematically to measure and monitor equity of care within their walls. of these ten, seven constitute general indicators for measuring equity of hospital care and three are indicators pertinent to TC-lHIn priority populations. The general indicators are grouped into two broad themes – Cultural Competency and quality of Care. Importantly, all but one of the indicators (i.e. cultural concordance between patient and staff) require stratification by sociodemographic data to become equity indicators.
Reducing health inequities will require multi-stakeholder commitments extending far beyond hospitals. nevertheless, by measuring, monitoring, and reporting on their own equity performance, Toronto hospitals can set a precedent in Canada, and play an important leadership role in advancing equitable health care and equitable outcomes for patients.
The report recommends the following ten indicators to measure and monitor equity in hospitals:
Cultural concordance between patients and staff This indicator examines cultural competency from a comprehensive perspective, including the structure and delivery of health care in hospitals.
Accessibility of language services This indicator measures language services performance for culturally diverse patient populations.
Patient satisfaction This indicator monitors patients’ perceptions of hospital care. Comparing patient satisfaction across sociodemographic populations can inform whether perceived quality of care is equitable across diverse groups.
CuLTuRALCOMpETENCy
quALITyOF CARE
2 | Measuring Equity of Care in Hospital Settings: From Concepts to Indicators
Perforated appendix rate This indicator provides insight into the equitable distribution of accessible emergency treatment within the hospital. Appendiceal rupture is a relatively common condition that is considered preventable with appropriate and timely care.
Minimally invasive cholecystectomy rate This indicator measures differences in access to state-of-the-art care, and may be adapted for use with other procedures that are more relevant to a hospital’s priorities.
Use of analgesics for pain management This indicator can help hospitals examine equity with respect to responsiveness of care, vis-à-vis pain management, which is widely recognized as an important predictor of patient satisfaction.
Rate of death within 30 days of hospital admission for acute myocardial infarction (AMI) 30-day AMI mortality rates are often used as an indicator of quality of care because AMI is a common condition with established and effective treatment guidelines. In contrast to other indicators in this category, this indicator measures the effectiveness of care both during admission and after patients leave the hospital.
Length of physical restraint use among patients with mental illness physical restraint use is recognized as an indicator of the quality of hospital-based in-patient psychiatric services, and recent provincial legislation has increased restrictions on the use of restraints in ontario. While not all hospitals may offer in-patient psychiatric services, restraints are used in the emergency department and on medical, surgical, and rehabilitation wards.
Pressure ulcer rate among elderly patients pressure ulcers are a common and costly condition with a much greater prevalence in elderly populations. Since pressure ulcers are avoidable by following care guidelines, this measure is sensitive to quality of care.
Lower extremity amputations among patients with diabetes Since the need for amputation is thought to reflect poor health in diabetics, monitoring the rate of lower extremity amputation is considered a measure of quality improvement that is relevant to disparities in the primary care setting. Although this report focuses on indicators where action occurs at the hospital level, diabetes is generally accepted as a primary care-sensitive condition.
pEOpLE wITH MENTAL I LLNESS
ELdERLy
pEOpLE wITH dIABETES MELLITuS
Measuring Equity of Care in Hospital Settings: From Concepts to Indicators | 3
4 | Measuring Equity of Care in Hospital Settings: From Concepts to Indicators
K Ey M ESSAg ES
1. EquITy MEASuREMENT IS AN IMpORTANT COMpONENT OF HOSpITAL pERFORMANCE MEASuREMENT ANd THE quALITy IMpROVEMENT CyCLE.
Measuring an inequality in a hospital setting will not by itself lead to changes in practice or outcomes. Yet an orientation toward performance and outcomes measurement is an important step in promoting organizational change. Collecting and examining equity data as part of the quality improvement cycle will allow opportunities to motivate action.
2. SELECTION OF EquITy INdICATORS MuST BE STRATEgICALLy dRIVEN.
decisions about “what to measure” should be driven by evidence and by strategic priorities. This is true for both the equity indicators themselves as well as the sociodemographic variables used for stratification. The literature supports collection of data about patient language, socioeconomic status, and race and ethnicity.
3. EquITy MEASuREMENT IN TORONTO HOSpITALS IS pOSSIBLE NOw.
Stratification of equity indicators in Toronto hospitals is possible now by linking to existing area-level data and available individual-level data. Multi-institutional partnerships can support these data linkage processes.
4. OpTIMAL EVIdENCE wILL BE gENERATEd wHEN HOSpITALS COLLECT pATIENT-LEVEL SOCIOdEMOgRApHIC dATA.
The ideal approach to measuring equity of care is to link patient-level health data to patient-level sociodemographic data. new data collection and data management systems will be needed to fully assess equity of care in hospital settings.
I N T R O d u C T I O N
Inequities in health care among different language, racial/ethnic, and socioeconomic groups have been linked to increased medical errors, prolonged length of stay, avoidable hospitalizations and readmissions, as well as over- and under-utilization of procedures (Alexander et al., 1999; Ash and Brandt, 2006; Carbone et al., 2003; Cohen et al., 2005; divi et al., 2007; Hux et al. 2003; Jiang et al., 2005; Rathore et al., 2003).
Understanding and measuring equity in the health care setting is a rising priority for health care systems. Significant interest has been placed on the need for health care settings to become environments that support an equitable distribution of health services and outcomes. In ontario, the Ministry of Health and long-Term Care has identified the need to address inequities in health care (Rachlis, 2007), and in 2009, the Toronto Central local Health Integration network (TC-lHIn) required hospitals for the first time to report on equity initiatives.
despite increasing interest and evidence that inequities affect health outcomes, measuring equity in hospitals is a relatively new practice in Canada. Knowledge of the health indicators that matter most for equity in hospitals, and how to best measure and take action relative to these indicators, is only just developing.
The Centre for Research on Inner City Health (CRICH) partnered with the TC-lHIn Hospital Collaborative on Marginalized populations to complete a review of scholarly and grey literature concerning existing approaches for measuring and operationalizing equity of care in the hospital setting.
This report presents the findings of our review. First, we provide background information on equity and its relationship to the hospital setting. We then review our methods, describing how the literature was collected and analyzed. This is followed by a presentation of results describing a set of indicators, both for general use and for
current TC-lHIn priority populations. These indicators were chosen based on criteria that will be discussed in detail below, and represent a starting point for Toronto hospitals to begin measuring equity. We conclude by providing recommendations for the identification and monitoring of health inequalities in hospitals within the TC-lHIn.
Ultimately, while measuring an inequality in itself does not lead to change, it is a crucial step in informing change. This study builds on the history and cumulative experience of work conducted on the development and use of hospital-based indicators. It also brings a systematic approach to the selection of equity indicators that may best fit the current needs and priorities of hospitals within the TC-lHIn, and that may be utilized immediately.
Ultimately, while measuring an inequality in itself does not lead to change, it is a crucial step in informing change.
Measuring Equity of Care in Hospital Settings: From Concepts to Indicators | 5

CO N T E X T
In order to provide context for this report, we need to develop an understanding of the term “equity” in relation to health care. This report frames equity as a crucial component of care in the hospital setting, with the understanding that inequitable care may lead to “potentially avoidable differences in health … between groups of people who are more and less advantaged socially” and that “these differences systematically place socially disadvantaged groups at further disadvantage in health” (Braveman, 2006, p. 180). In other words, health inequities are inequalities or differences in health that are unjust.
This report also positions equity as a component of hospital performance and quality. Accrediting agencies and performance assessment bodies in various jurisdictions are currently taking steps to include equity as a dimension of hospital quality of care. For example, in the United States, the Institute of Medicine includes equity in its definition of high-quality care (Committee on Understanding and Eliminating Racial and Ethnic disparities in Health Care, 2002), and the Agency for Healthcare Research and quality now releases a pair of quality and equity reports together each year (Agency for Healthcare Research and quality, 2009). Additionally, the World Health organization’s analysis of health systems included equity of care as a significant factor in ranking health system performance (World Health organization, 2008).
This report also emphasizes indicators related to cultural competency, as they have been deemed a critical component of high quality health care for culturally diverse settings such as Toronto (Committee on Understanding and Eliminating Racial and Ethnic disparities in Health Care, 2002).
Finally, health care systems can be understood as encompassing multiple interacting domains. Inequalities that arise in hospitals may actually reflect challenges in other health care settings. For example, diabetes is ideally treated within the primary care system but when barriers to such treatment exist, diabetic patients may be required to consult hospital emergency departments for urgent care. Consequently, using the number of emergency department admissions for diabetic coma as an equity indicator, for example, would not exclusively speak to issues within a hospital’s jurisdiction. This report focuses on indicators that point to equity of core issues arising within the hospital setting itself.
Accrediting agencies and performance assessment bodies in various jurisdictions are currently taking steps to include equity as a dimension of hospital quality of care.
6 | Measuring Equity of Care in Hospital Settings: From Concepts to Indicators

M ET H O d S
Using the keywords “access”, “equity”, “hospital or health care”, and “measurement”, we conducted a database search for scholarly publications in the social and medical sciences. All English publications from 1980 onwards in the following databases were considered: Medline, Cochrane databases, Cumulative Index to nursing & Allied Health literature, psycInFo, EMBASE, and Scholars’ portal.
A grey literature search was also conducted via the Internet (e.g. by using popular search engines such as Google), posting requests for information on pertinent listservs (e.g. Social determinants of Health), and searching websites
of health care-related think tanks such as the Robert Wood Johnson Foundation, the Commonwealth Fund, and the Institute of Medicine. We sought additional unpublished and published reports and other archival material from personal files, from colleagues, and by contacting members of the TC-lHIn Hospital Collaborative.
The scholarly literature search yielded 4,262 publications and the grey literature search resulted in 219 documents (i.e. reports, presentations, policy briefs, websites, etc.). The titles and abstracts for all of these citations were then screened for relevance. We retained citations that were relevant to hospitals and contained an explicit or implicit measure related to equity of care in hospitals. This resulted in 251 academic and 111 grey publications. Full text documents were read and indicators were extracted that were related to equity and to the current TC-lHIn priority populations: the elderly, people with mental illness and addictions, and people with diabetes mellitus. This resulted in an initial list of 706 indicators, including duplicates that were reported in multiple publications.
Inequities measurable in hospitals may actually be an outcome of inequitable care delivered in other areas of the health care system. As illustrated in Figure 1, we sought indicators that could point to equity issues arising within the hospital setting itself. We followed an iterative process to condense and categorize these indicators into thematic areas (e.g. priority population, quality or performance focus, structure or process focus).
Further guiding our process were six criteria, modified from the indicator selection criteria used by the Project for an Ontario Women’s Health Evidence-Based Report Card (POWER).1 These criteria are listed in Table 1. Specifically, we chose indicators that had been previously used in hospitals and/or in Canada, had been endorsed by an expert panel such as the national quality Forum, could be collected from existing hospital data sources in Toronto, could be adapted to different populations, and/or were supported by evidence related to equity. We also emphasized indicators that were broadly applicable across hospitals in the TC-lHIn.
Through this process, we identified ten indicators that are appropriate for Toronto hospitals to utilize as they begin systematically to measure and monitor equity of care within their walls. We recommend these indicators as a “good first step” for the TC-lHIn Hospital Collaborative.
Full text documents were read and indicators were extracted that were related to equity and to the current TC-LHIN priority populations.
1www.powerstudy.ca
Measuring Equity of Care in Hospital Settings: From Concepts to Indicators | 7

Grouped similar concepts and indicators
ARTICLES• 251 academic• 111 grey
Table 1. Criteria for Indicator Selection
Figure 1. Visual Illustration of the Literature Search Process
CRITERION dEFINITION
Evidence of previous use • Has this indicator been previously used? • In a hospital or group of hospitals? • In Canada? In ontario?
Endorsement • Has this indicator been endorsed by an expert panel or a health quality agency?
Feasibility • Can this indicator be based on data that are already collected by hospitals? • Can an existing tool be used to assist hospitals in collecting relevant data?
Adaptability • Can the indicator be adapted to other health conditions and target populations?
Applicability to equity • Is there evidence that this may be an equity-sensitive indicator in the hospital setting?
Transferability • Can the indicator be applied across most hospitals in the TC-lHIn? • Can the indicator be applied across current priority populations?
Screened title and abstract
ARTICLES• 4,262 academic• 219 grey
SEARCH STRATEgy• Academic and grey literature • English, 1980s onward• Keywords: “access”, “equity”, “hospital”, “health care”, “measurement”
limited to measures with some relevance to equity within hospitals & priority populations
541 indicators
Indicator selection by principal jurisdiction and priority population
706 indicators (including duplicates)
• Evidence of previous use• Endorsement• Feasibility• Adaptability• Applicability to equity• Transferability
10 indicators “Good first step” indicator for TC-lHIn
8 | Measuring Equity of Care in Hospital Settings: From Concepts to Indicators

p R O p O S E d I N d I C ATO R S
This report identifies ten “good first step” equity indicators for Toronto hospitals (Table 2). These indicators are grouped into three themes: Cultural Competency, quality of Care, and indicators pertinent for TC-lHIn priority populations. Importantly, all but one of the indicators (i.e. Cultural concordance between patients and staff)require stratification by sociodemographic data to become equity indicators.
Table 2. Summary Table of Indicators for Measuring Equity of Care in Hospitals
CATEgORy INdICATOR
Cultural Competency Cultural concordance between patients and staff
Accessibility of language services
quality of Care patient satisfaction
perforated appendix rate
Minimally invasive cholecystectomy rate
Use of analgesics for pain management
Rate of death within 30 days of hospital admission for acute myocardial infarction (AMI)
TC-lHIn people with Mental Illness: length of physical restraint use among patients priority populations with mental illness
Elderly: pressure ulcer rate among elderly patients
people with diabetes Mellitus: lower extremity amputations among patients with diabetes
Measuring Equity of Care in Hospital Settings: From Concepts to Indicators | 9

H O S p I TA L Eq u I T y I N d I C ATO R 1
C u LT u R A L CO N CO R dA N C E B ET w E E N pAT I E N TS A N d STA F F
Cultural Competency
patients and hospital staff (e.g. clinicians, administrators) can bring unique points of view to health care interactions, based on their experiences, culture, and communities. If hospitals that serve diverse populations do not consider cultural competency and concordance when structuring and delivering care, resulting services may be culturally insensitive or unsafe.
Cultural competency among hospital staff may reduce barriers to safe and appropriate care because hospital personnel will have a better understanding of the diverse needs of their patients and greater capacity to meet these needs. For instance, Andrulis (2003) noted that cultural concordance between patients and staff has been proven to result in increased patient satisfaction and effectiveness of communication. Gardam et al. (2008) also found that cultural concordance had a significant impact on quality of care. This study showed that when foreign-born patients with tuberculosis spoke a different language than their treating physician, their risk for death within one year increased by more than two-fold.
what to use: The diversity and Cultural proficiency Assessment Tool for leaders (American Hospital Association, 2004) consists of a checklist to assess the cultural representation of a hospital in relation to the community it serves, the provision of patient care, and its workforce and organizational leadership. This specific tool is unique in that it examines cultural competency from a comprehensive perspective, including the structure and delivery of health care in hospitals. This tool also can be applied to all types of hospitals.
Sample questions: • Are the individuals who represent your hospital in the community reflective of the diversity of the community and your organization?• Has a team from your hospital met with community leaders to gauge their perceptions of the hospital and seek their advice on how you can better serve them, both in patient care and community outreach?• Have you made diversity awareness and sensitivity training available to your employees?
data Sources: Hospitals need to conduct a staff census and collect patient sociodemographic data.
American College of Healthcare Executives (US)American Hospital Association (US)Institute for diversity in Health Management (US)national Association of Health Services Executives (US)national Center for Healthcare leadership (US)
CATEgORy
RELEVANCE TO EquITy
wHy wE RECOMMENd THIS INdICATOR
HOw TO MEASuRE THIS INdICATOR
INdICATOR dEVELOpEd OR ENdORSEd By
10 | Measuring Equity of Care in Hospital Settings: From Concepts to Indicators

Aventura Hospital and Medical Center, Florida (US)Generation plus northern Manhattan network, new York (US)Hurley Medical Center, Michigan (US)Henry Ford Health System, Michigan (US)Massachusetts General Hospital, Massachusetts (US)northwestern Memorial Hospital, Illinois (US)West los Angeles Medical Center, California (US)
American Hospital Association (AHA). (2004). Diversity and Cultural Proficiency Assessment Tool for Leaders. Washington, dC: AHA.
Andrulis, d. (2003). ‘Reducing racial and ethnic disparities in disease management to improve health outcomes.’ Disease Management and Health Outcomes. 11, 789-800.
dreachslin J. & Agho A. (2001). ‘domains and core competencies for effective evidence-based practice in diversity leadership.’ Journal of Health Administration Education. 19, 131-47.
Gardam, M., Verma, G., Campbell, A., Wang, J., & Khan, K. (2008). ‘Impact of the patient-provider relationship on the survival of foreign born outpatients with tuberculosis.’ Journal of Immigrant and Minority Health. doI:10.1007/s10903-008-9221-8.
Wilson-Stronks, A., lee, K., Cordero, C., Kopp, A., & Galvez, E. (2008). One Size Does Not Fit All: Meeting The Health Care Needs of Diverse Populations. oakbrook Terrace, Il: The Joint Commission.
INSTITuTIONS THAT HAVE uSEd THIS INdICATOR
SuppORTINg REFERENCES
Measuring Equity of Care in Hospital Settings: From Concepts to Indicators | 11

H O S p I TA L E q u I T y I N d I C AT O R 2
AC C E S S I B I L I T y O F L A N g u Ag E S E R V I C E S
Cultural Competency
patients from diverse cultural backgrounds need to be able to express their health care needs effectively and efficiently in order to receive safe and high-quality health care. Hospitals that provide interpretation services and who monitor the availability and efficiency of those services are in a position to provide quality care equitably to linguistically diverse patients.
Much of the literature referring to cultural competency specifically discusses the importance of language services. For example, Goldman et al. (2006) found that in a Toronto pediatric hospital’s emergency department, length of stay was significantly longer for children of non-English speaking parents. The authors recommended improved translation services as a way of addressing this issue. Another Toronto study showed that patient-physician language discordance doubled one-year mortality among foreign-born patients with tuberculosis (Gardam et al., 2008). In the United States, Flores et al. (1998) found that one in 12 parents of latino children in an inner-city health care setting reported that if they spoke little or no English and the medical staff did not speak Spanish, adverse consequences such as poor medical care, misdiagnosis, and inappropriate prescriptions were more likely to occur. Finally, in a survey of self-reported experiences of individuals with limited English proficiency, Andrulis et al. (2002) found that patients unable to obtain access to an interpreter in a hospital were significantly more likely to not understand their medications (27%) compared with patients who had an interpreter provided or whose provider spoke their language (2%).
what to use: The Speaking Together: national language Services network Measures (Robert Wood Johnson Foundation, 2007) assess screening of patients for preferred language, receipt of language services from qualified language service providers, patient wait time for interpreters, time spent interpreting, and interpreter delay time. This comprehensive tool for monitoring language services assesses both service availability and efficiency. It has been used by multiple hospitals across the United States and is of relevance to patients of all language groups in all hospitals.
data Sources: data may be collected by hospitals themselves, through interpreter services and/or by patient discharge survey. Changes in the availability and efficiency of language services can be monitored over time to examine overall performance. Availability and efficiency can also be compared between patient sub-populations in order to examine whether improvement in services for certain groups is needed. Such stratification will require linkage to patient sociodemographic data.
CATEgORy
RELEVANCE TO EquITy
wHy wE RECOMMENd THIS INdICATOR
HOw TO MEASuRE THIS INdICATOR
12 | Measuring Equity of Care in Hospital Settings: From Concepts to Indicators
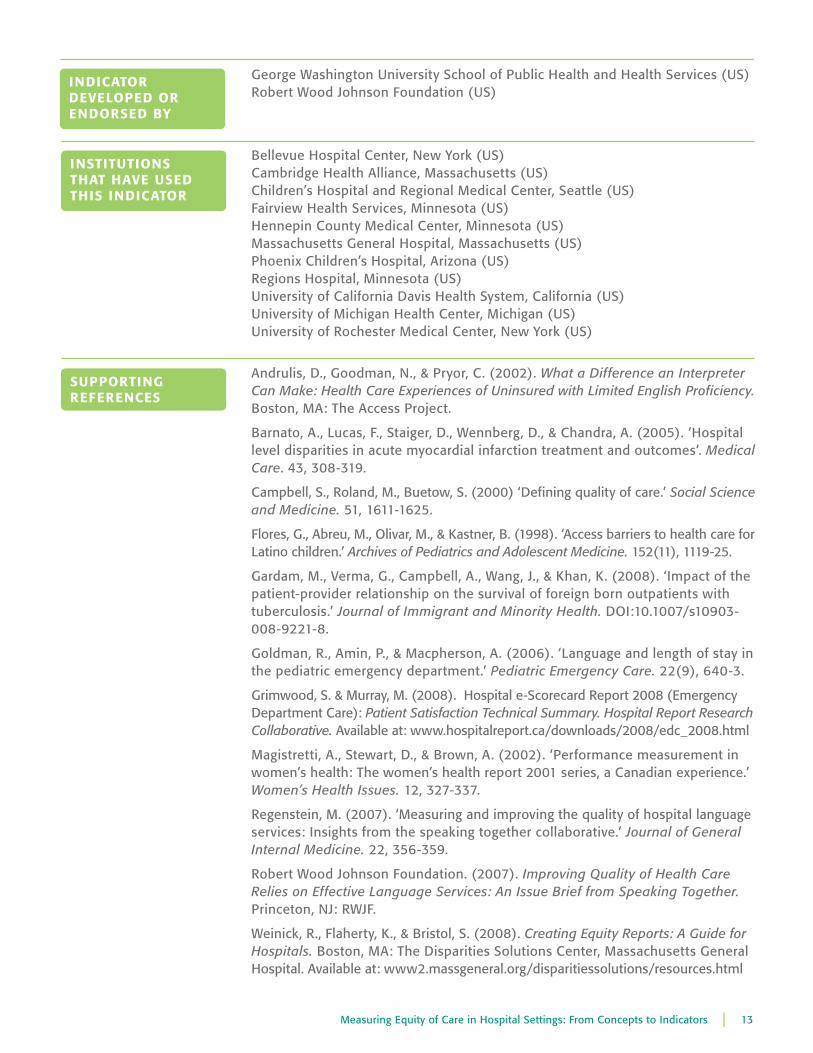
INdICATOR dEVELOpEd OR ENdORSEd By
George Washington University School of public Health and Health Services (US)Robert Wood Johnson Foundation (US)
Bellevue Hospital Center, new York (US)Cambridge Health Alliance, Massachusetts (US)Children’s Hospital and Regional Medical Center, Seattle (US)Fairview Health Services, Minnesota (US)Hennepin County Medical Center, Minnesota (US) Massachusetts General Hospital, Massachusetts (US) phoenix Children’s Hospital, Arizona (US) Regions Hospital, Minnesota (US)University of California davis Health System, California (US)University of Michigan Health Center, Michigan (US)University of Rochester Medical Center, new York (US)
Andrulis, d., Goodman, n., & pryor, C. (2002). What a Difference an Interpreter Can Make: Health Care Experiences of Uninsured with Limited English Proficiency. Boston, MA: The Access project.
Barnato, A., lucas, F., Staiger, d., Wennberg, d., & Chandra, A. (2005). ‘Hospital level disparities in acute myocardial infarction treatment and outcomes’. Medical Care. 43, 308-319.
Campbell, S., Roland, M., Buetow, S. (2000) ‘defining quality of care.’ Social Science and Medicine. 51, 1611-1625.
Flores, G., Abreu, M., olivar, M., & Kastner, B. (1998). ‘Access barriers to health care for latino children.’ Archives of Pediatrics and Adolescent Medicine. 152(11), 1119-25.
Gardam, M., Verma, G., Campbell, A., Wang, J., & Khan, K. (2008). ‘Impact of the patient-provider relationship on the survival of foreign born outpatients with tuberculosis.’ Journal of Immigrant and Minority Health. doI:10.1007/s10903-008-9221-8.
Goldman, R., Amin, p., & Macpherson, A. (2006). ‘language and length of stay in the pediatric emergency department.’ Pediatric Emergency Care. 22(9), 640-3.
Grimwood, S. & Murray, M. (2008). Hospital e-Scorecard Report 2008 (Emergency department Care): Patient Satisfaction Technical Summary. Hospital Report Research Collaborative. Available at: www.hospitalreport.ca/downloads/2008/edc_2008.html
Magistretti, A., Stewart, d., & Brown, A. (2002). ‘performance measurement in women’s health: The women’s health report 2001 series, a Canadian experience.’ Women’s Health Issues. 12, 327-337.
Regenstein, M. (2007). ‘Measuring and improving the quality of hospital language services: Insights from the speaking together collaborative.’ Journal of General Internal Medicine. 22, 356-359.
Robert Wood Johnson Foundation. (2007). Improving Quality of Health Care Relies on Effective Language Services: An Issue Brief from Speaking Together. princeton, nJ: RWJF.
Weinick, R., Flaherty, K., & Bristol, S. (2008). Creating Equity Reports: A Guide for Hospitals. Boston, MA: The disparities Solutions Center, Massachusetts General Hospital. Available at: www2.massgeneral.org/disparitiessolutions/resources.html
INSTITuTIONS THAT HAVE uSEd THIS INdICATOR
SuppORTINg REFERENCES
Measuring Equity of Care in Hospital Settings: From Concepts to Indicators | 13

H O S p I TA L E q u I T y I N d I C AT O R 3
pAT I E N T S AT I S FAC T I O N
quality of Care
patient satisfaction surveys monitor patients’ perceptions of received hospital care. Comparing patient satisfaction across sociodemographic populations can inform whether perceived quality of care is equitable between diverse groups. Further, knowledge gained from patient satisfaction surveys can set a direction for quality improvement in hospitals for outcomes that are important to diverse patient populations.
In a U.S. study, Ayanian et al. (2005) found inequities in patient satisfaction by race, with African-Americans and Asian/pacific Islanders reporting more problems in accessing and coordinating care as well as receiving health information than their White counterparts. Similarly, results from a national patient satisfaction survey conducted by the Healthcare Commission (United Kingdom) in 2008 revealed differences between minority groups and their White British counterparts. Minority groups were less likely to report positive experiences, especially relating to access to care and receipt of healthcare information. Knowledge gained from patient satisfaction surveys can inform quality improvement across all types of hospitals for issues that are important to patients that have implications for equity.
what to use: “Measuring the patient’s Experience” is a Canadian survey developed by the national Research Corporation (nRC picker Canada) that assesses patient satisfaction with provision of care in ontario along 14 dimensions, including: overall impressions, communication, consideration, responsiveness, overall satisfaction, coordination of care and access, physical comfort, respect for patient preferences and courtesy, information and education, continuity and transition, family involvement, emotional support, physician care, and nursing care. This survey is already widely used by ontario hospitals.
Sample questions: • When you had important questions to ask a doctor, did you get answers you could understand?
• did someone on the hospital staff explain the purpose of the medicines you were to take at home in a way you could understand?
• Was it easy for you to find someone on the hospital staff to talk to about your concerns?
data Sources: The Canadian Institutes for Health Information (CIHI) maintains the data from nRC picker Canada patient discharge surveys and hospitals could request this information for their own institution.
To assess inequities, patient satisfaction results should be stratified by sociodemographic attributes of interest. This will require linkage to additional data because the nRC picker Canada survey provides limited sociodemographic information (gender and education are the only variables collected).
CATEgORy
RELEVANCE TO EquITy
wHy wE RECOMMENd THIS INdICATOR
HOw TO MEASuRE THIS INdICATOR
14 | Measuring Equity of Care in Hospital Settings: From Concepts to Indicators

nRC picker Canada (Canada)disparities Solutions Center at Massachusetts General Hospital, Massachusetts (US)2
national quality Forum (US)3 ontario Hospital Report Research Collaborative (Canada)4
Agency for Healthcare Research and quality. (2008). National Healthcare Disparities Report. Rockville, Md: US department of Health and Human Services.
Ayanian, J., Zaslavsky, A., Guadagnoli, E., Fuchs, C., Yost, K., Creech, C., Cress, R., o’Connor, l., West, d., & Wright, W. (2005). ‘patients’ perceptions of quality of care for colorectal cancer by race, ethnicity, and language.’ Journal of Clinical Oncology. 23, 6576-6586.
Brownell, M., Roos, n., & Roos, l. (2001). ‘Monitoring health reform: A report card approach.’ Social Science and Medicine. 52, 657-670.
Campbell, S., Roland, M., Buetow, S. (2000). ‘defining quality of care.’ Social Science and Medicine. 51, 1611-1625.
Grimwood, S. & Murray, M. (2008). Hospital e-Scorecard Report 2008 (Emergency department Care): patient Satisfaction Technical Summary. Hospital Report Research Collaborative. Available at: www.hospitalreport.ca/downloads/2008/edc_2008.html
Healthcare Commission. (2008). Report on Self Reported Experience of Patients from Black and Minority Ethnic Groups. london, UK: UK department of Health.
national quality Forum. (2008). National Voluntary Consensus Standards for Ambulatory Care – Measuring Healthcare Disparities. A Consensus Report. Washington, dC: national quality Forum.
Weinick, R., Flaherty, K., & Bristol, S. (2008). Creating Equity Reports: A Guide for Hospitals. Boston, MA: The disparities Solutions Center, Massachusetts General Hospital. Available at: www2.massgeneral.org/disparitiessolutions/resources
Zhang, C., & Murray, M. (2008). Hospital e-Scorecard Report 2008 (Acute Care): Patient Satisfaction Technical Summary. Hospital Report Research Collaborative. Available at: www.hospitalreport.ca/downloads/2008/acute_2008.html
INdICATOR dEVELOpEd OR ENdORSEd By
INSTITuTIONS THAT HAVE uSEd THIS INdICATOR
SuppORTINg REFERENCES
2The US version of the NRC Picker survey has been endorsed by the Disparities Solutions Centre - MGH3The National Quality Forum has used the US version of the NRC Picker survey4The Ontario Hospital Report is based on data collected through the Measuring the Patient’s Experience (NRC Picker Canada), which is administered to patients across Ontario hospitals
Measuring Equity of Care in Hospital Settings: From Concepts to Indicators | 15

H O S p I TA L E q u I T y I N d I C AT O R 4
p E R F O R AT E d A p p E N d I X R AT E
quality of Care
For people with appendicitis, lack of timely care in the emergency department can result in appendiceal rupture. Comparing perforated appendix rates across sociodemographic populations can provide insight into the equitable distribution of accessible emergency treatment within the hospital.
Since patients with appendicitis are likely to present to the nearest emergency department, this indicator will be relevant to all hospitals that provide emergency care. Appendiceal rupture is a common condition, occurring among 35.5% of patients with acute appendicitis in ontario (Al-omran et al., 2003). Bratu et al. (2008) have demonstrated that children from lower socioeconomic urban areas have increased appendiceal rupture rates in a Canadian setting. Also, Tsay et al. (2007) found that the presence of schizophrenia was associated with a 2.8 times higher risk of having a ruptured appendix after controlling for a range of demographic and hospital characteristics. These findings suggest that this measure may be relevant across various population groups, including those with mental illness.
what to use: percentage of patients with appendiceal rupture among all patients hospitalized for acute appendicitis, stratified by sociodemographic attribute of interest.
data Sources: CIHI maintains a discharge Abstract database (dAd) consisting of all hospitalizations for ontario’s acute care hospitals. The main elements of dAd include limited patient demographics (i.e. gender, birth date and postal code), diagnoses, and procedures that occurred during the hospital stay. Similarly, CIHI maintains the national Ambulatory Care Reporting System (nACRS), a system that holds information on patient visits to emergency departments. Hospitals could either use their own medical records, or rely on dAd and/or nACRS to determine who has been diagnosed with appendicitis, and which patients went on to have appendiceal rupture.
To assess inequities, perforated appendix rates should be stratified by sociodemographic attributes of interest. This will require linkage to additional data.
national quality Forum (US)
CATEgORy
RELEVANCE TO EquITy
wHy wE RECOMMENd THIS INdICATOR
HOw TO MEASuRE THIS INdICATOR
INSTITuTIONS THAT HAVE uSEd THIS INdICATOR
16 | Measuring Equity of Care in Hospital Settings: From Concepts to Indicators

Agency for Healthcare Research and quality. (2006). Prevention Quality Indicators Download. AHRq quality Indicators. Available at: qualityindicators.ahrq.gov/pqi_download
Al-omran, M., Mamdani, M., & Mcleod, R. (2003). ‘Epidemiologic features of acute appendicitis in ontario, Canada’. Canadian Journal of Surgery. 46(4), 263-267.
Bratu, I., Martens, p., leslie, W., dik, n., Chateau, d., & Katz, A. (2008). ‘pediatric appendicitis rupture rate: disparities despite universal health care.’ Journal of Pediatric Surgery. 43(11), 1964-9.
national quality Forum. (2008). National Voluntary Consensus Standards for Ambulatory Care – Measuring Healthcare Disparities. A Consensus Report. Washington, dC: national quality Forum.
Tsay, J., lee, C., Hsu, Y., Wang, p., Bai, Y., Chou, Y., & Huang, n. (2007). ‘disparities in appendicitis rupture rate among mentally ill patients.’ BMC Public Health. 7, 331.
SuppORTINg REFERENCES
Measuring Equity of Care in Hospital Settings: From Concepts to Indicators | 17
H O S p I TA L E q u I T y I N d I C AT O R 5
M I N I M A L Ly I N VA S I V E C H O L E C y S T E C T O M y R AT E
quality of Care
For many conditions, minimally invasive surgery (MIS) is considered better quality of care compared to conventional open surgery, due to improved preservation of the immune system, faster recovery, less postoperative pain, and improved aesthetic results. For example, minimally invasive cholecystectomy is the preferred method for removal of the gall bladder, compared with the open method. When compared across sociodemographic populations, this indicator can demonstrate whether optimal standards of care are being equitably delivered.
Studies have shown inequalities in the provision of MIS by ethnicity and gender. For example, Ricciardi et al. (2008) found that African Americans were consistently less likely to be treated with MIS for appendectomies, gastric bypass, and fundoplication compared with patients of other races, despite adjustment for potential confounders. Similarly, parviz et al. (2003) found inequalities in rates of MIS for early stage breast cancer. However, we specifically recommend cholecystectomy as it is a relatively common procedure that is not gender-specific. Further, there is recent evidence of inequalities in the ontario setting. An annual report on acute care quality in ontario hospitals found that, at a system level, men have a substantially higher rate of the open method of cholecystectomy than women (7.2% vs. 3.8%) (CIHI, 2006).
what to use: The percentage of cholecystectomies performed “open” versus laparoscopically, stratified by sociodemographic attribute of interest.
data Sources: Hospitals could either use their own medical records, or rely on CIHI’s discharge Abstract database (dAd) and/or the national Ambulatory Care Reporting System (nACRS) to determine which patients were admitted for cholecystectomies and which method of surgery was used.
To assess inequities, minimally invasive cholecystectomy rates should be stratified by sociodemographic attributes of interest. This stratification will require linkage to additional data.
ontario Hospital Report Research Collaborative (Canada)
CATEgORy
RELEVANCE TO EquITy
wHy wE RECOMMENd THIS INdICATOR
HOw TO MEASuRE THIS INdICATOR
INSTITuTIONS THAT HAVE uSEd THIS INdICATOR
18 | Measuring Equity of Care in Hospital Settings: From Concepts to Indicators

Canadian Institute for Health Information (CIHI). (2006). Hospital Report 2006 (Acute Care). Hospital Report Research Collaborative. Available at: www.hospitalreport.ca/downloads/2006/acute_2006.html
parviz, M., Cassel, J., Kaplan, B., Karp, S., neifeld, J., penberthy, l., & Bear, H. (2003). ‘Breast conservation therapy rates are no different in medically indigent versus insured patients with early stage breast cancer.’ Journal of Surgical Oncology. 84, 57–62.
Ricciardi, R., Selker, H., Baxter, n., Marcello, p., Roberts, p., & Virnig, B. (2008). ‘disparate use of minimally invasive surgery in benign surgical conditions.’ Surgical Endoscopy. 22 (9), 1977-1986.
SuppORTINg REFERENCES
Measuring Equity of Care in Hospital Settings: From Concepts to Indicators | 19

H O S p I TA L E q u I T y I N d I C AT O R 6
u S E O F A N A Lg E S I C S F O R pA I N M A N Ag E M E N T
quality of Care
pain management is a key indicator of the responsiveness and overall quality of acute care and is used as a dimension of patient satisfaction in the Hospital Report Research Collaborative’s annual report on ontario hospitals (Grimwood, 2008; Zhang, 2008). Comparison of analgesic use across sociodemographic populations can help hospitals examine whether the treatment for pain is equitable among diverse groups.
Several studies have demonstrated differences in the medical management of pain among racial and ethnic groups. For example, quazi et al. (2008) documented that both Hispanics and African Americans are under-treated for pain in the hospital setting, and that Whites are more likely to receive opiates for the treatment of headaches in the emergency department. Although a patient’s subjective assessment of pain management can be examined by the nRC picker patient satisfaction survey (see Hospital Equity Indicator 3), further focusing on pain treatment with analgesics may help clarify whether inequities in pain management are actually related to differential provision of care.
Because decisions related to the prescribing of medication can be complex, this indicator examines two conditions requiring pain management (i.e. headaches and long bone fracture), as well as two classes of analgesic medication (i.e. all analgesics and opiates specifically) to better understand why inequities may exist. Headaches are examined because they rely on a subjective diagnosis and therefore pain management is more dependent on physician judgment. on the other hand, this indicator also includes long-bone fracture since this is a more objective diagnosis and thus pain management is more likely to be regimented by treatment guidelines. While this measure examines the use of any analgesic, there is also a focus on the use of opiates, which are more effective pain relievers but have a high potential for abuse. Therefore, opiates may be more likely to be withheld where diagnosis is based on physician judgment and assumptions (e.g. assuming a particular patient is fabricating a condition such as headache to obtain drugs), which may also lead to inequities in pain management.
CATEgORy
RELEVANCE TO EquITy
wHy wE RECOMMENd THIS INdICATOR
20 | Measuring Equity of Care in Hospital Settings: From Concepts to Indicators

what to use: The percentage of patients admitted to the emergency department for the complaints of headache and long bone fracture that are treated either with any analgesic or opiates specifically in the emergency department, stratified by sociodemographic attribute of interest.
data Sources: Hospitals could either use their own medical records, or rely on the national Ambulatory Care Reporting System (nACRS) to determine a patient’s diagnosis in the emergency department. Medication use in the emergency department could be determined from medical records.
To assess inequities, use of analgesics for pain management should be stratified by sociodemographic attributes of interest. This stratification will require linkage to additional data.
Bernabei R., Gambassi G., lapane K., landi F., Gatsonis C., dunlop R., lipsitz l., Steel K., Mor V. (1998). ‘Management of pain in elderly patients with cancer.’ Journal of the American Medical Association. 279(23):1877-82.
Grimwood, S. & Murray, M. (2008). Hospital e-Scorecard Report 2008 (Emergency department Care): patient Satisfaction Technical Summary. Hospital Report Research Collaborative. Available at: www.hospitalreport.ca/downloads/2008/edc_2008.html
ng, B., dimsdale, J., Rollnik, J., Shapiro, H. (1996). ‘The effect of ethnicity on prescriptions for patient-controlled analgesia for post-operative pain.’ Pain. 66(1):9-12.
quazi, S., Eberhart, M., Jocoby, J., & Heller, M. (2008). ‘Are racial disparities in Ed analgesia improving? Evidence from a national data base.’ The American Journal of Emergency Medicine. 26, 462-464.
Todd K., deaton C., d’Adamo A., Goe l. (2000). ‘Ethnicity and analgesic practice.’ Annals of Emergency Medicine. 35(1),11-6.
Todd, K., lee, T., Hoffman, J. (1994). ‘The effect of ethnicity on physician estimates of pain severity in patients with isolated extremity trauma.’ Journal of the American Medical Association. 271(12):925-8.
Todd, K., Samaroo, n., Hoffman, J. (1993). ‘Ethnicity as a risk factor for inadequate emergency department analgesia.’ Journal of the American Medical Association. 269(12):1537-9.
Zhang, C., & Murray, M. (2008). Hospital e-Scorecard Report 2008 (Acute Care): patient Satisfaction Technical Summary. Hospital Report Research Collaborative. Available at: www.hospitalreport.ca/downloads/2008/acute_2008.html
HOw TO MEASuRE THIS INdICATOR
SuppORTINg REFERENCES
Measuring Equity of Care in Hospital Settings: From Concepts to Indicators | 21

H O S p I TA L E q u I T y I N d I C AT O R 7
R AT E O F d E AT H w I T H I N 3 0 dAy S O F H O S p I TA L A d M I S S I O N F O R AC u T E M yO C A R d I A L I N FA R C T I O N ( A M I )
quality of Care
30-day AMI mortality rates are often used as an indicator of quality of care because AMI is a common condition with established and effective treatment guidelines, including counseling to improve long-term survival. When compared across sociodemographic populations, this indicator can demonstrate inequities in the effectiveness of both emergency care at the time of admission as well as care related to patient discharge and follow-up (e.g. medication adherence, diet counseling).
After controlling for factors including age, sex, and severity of disease, Alter et al. (1999) found that for every $10,000 increase in the median neighbourhood income level in ontario, there is a 10% reduction in one-year mortality after AMI. This result indicates that patients of higher socioeconomic status have a better chance of survival following AMI. 30-day AMI mortality rates have been endorsed as a measure of equity by the disparities Solution Center in the United States.
what to use: The risk-adjusted mortality rate within 30 days of admission among all patients initially admitted for AMI, stratified by sociodemographic attributes of interest.
data Sources: Hospitals could either use their own medical records, or rely on discharge Abstract database (dAd) and/or the national Ambulatory Care Reporting System (nACRS) to determine which patients had been diagnosed with an AMI. The ontario Ministry of Health’s Registered persons database (RpdB) contains basic information on anyone who has ever received an ontario health card, including date of death where applicable, and could therefore be used to track mortality at a provincial level for these patients. Tracking mortality at the provincial level is important since many patients may not die in-hospital or in the hospital where they were treated for AMI.
To assess inequities, 30-day AMI mortality rates should be stratified by sociodemographic attributes of interest. This stratification will require linkage to additional data. This indicator can be further refined in order to account for differences in patients’ mortality risk unrelated to hospital care, including age, gender, cardiac severity (e.g. congestive heart failure, shock, arrhythmias), and comorbidity status (e.g. diabetes mellitus, stroke, acute and chronic renal disease, malignancy). See Tu et al. (2001) for details.
CATEgORy
RELEVANCE TO EquITy
wHy wE RECOMMENd THIS INdICATOR
HOw TO MEASuRE THIS INdICATOR
22 | Measuring Equity of Care in Hospital Settings: From Concepts to Indicators

disparities Solutions Center at Massachusetts General Hospital, Massachusetts (US)
Alter, d., naylor, C., Austin, p., Tu, J. (1999). ‘Effects of socioeconomic status on access to invasive cardiac procedures and on mortality after acute myocardial infarction.’ New England Journal of Medicine. 341, 1359–1367.
Barnato, A., lucas, F., Staiger, d., Wennberg, d., & Chandra, A. (2005). ‘Hospital level disparities in acute myocardial infarction treatment and outcomes.’ Medical Care. 43, 308-319.
Campbell, S., Roland, M., Buetow, S. (2000). ‘defining quality of care.’ Social Science and Medicine. 51, 1611-1625.
Magistretti, A., Stewart, d., & Brown, A. (2002). ‘performance measurement in women’s health: The women’s health report 2001 series, a Canadian experience’. Women’s Health Issues. 12, 327-337.
Tu, J., Austin, p., Walld, R., Roos, l., Agras, J., & Mcdonald, K. (2001). ‘development and validation of the ontario acute myocardial infarction mortality prediction rules.’ Journal of the American College of Cardiology. 37(4), 992-7.
Weinick, R., Flaherty, K., & Bristol, S. (2008). Creating Equity Reports: A Guide for Hospitals. Boston, MA: The disparities Solutions Center, Massachusetts General Hospital. Available at: www2.massgeneral.org/disparitiessolutions/resources.html
INdICATOR dEVELOpEd OR ENdORSEd By
SuppORTINg REFERENCES
Measuring Equity of Care in Hospital Settings: From Concepts to Indicators | 23

H O S p I TA L E q u I T y I N d I C AT O R 8
L E N g T H O F p H y S I C A L R E S T R A I N T u S E A M O N g pAT I E N T S w I T H M E N TA L I L L N E S S
TC-lHIn priority - people with Mental Illness
people experiencing mental illness often present to hospital emergency departments. The use of physical restraints can be problematic for patients, and their use has been regulated and identified as a potential indicator for quality of institutional care. Even so, physical restraints are sometimes necessary in hospital settings for patients deemed a threat to themselves or to others. Examining the appropriate use of physical restraint across sociodemographic populations may indicate whether patients with mental illness from diverse backgrounds are treated with equal care.
physical restraint use is a significant aspect of care for patients with mental illness. Inappropriate use of physical restraints has been associated with poorer patient safety, including increased mortality, as well as physical and mental morbidities (Edwards et al., 2006). A 1999 report by CIHI found that one third of patients in complex continuing care in ontario were restrained on a daily basis, which was followed by provincial legislation increasing restrictions on the use of restraints in ontario (patient Restraints Minimization Act, Government of ontario, 2001). As a result, hospitals have organizational policies to monitor the use of physical restraints. Measuring the number of hours of physical restraint use has been endorsed as part of a set of seven core measures of the quality of hospital-based in-patient psychiatric services by the Joint Commission, the national Association of psychiatric Health Systems (nApHS), the national Association of State Mental Health program directors (nASMHpd) and the nASMHpd Research Institute, Inc. (nRI). This indicator can be applied either in the emergency department or in-patient settings.
what to use: The total hours of physical restraint use for patients with a mental illness, stratified by sociodemographic attribute of interest.
data Sources: Hospitals could use their own medical records, or rely on the national Ambulatory Care Reporting System (nACRS) to determine who has come to the emergency department with a psychiatric diagnosis. The amount of time spent in physical restraints could be determined from patients’ medical records (e.g. patient workload reports).
To assess inequities, hours of physical restraint use should be stratified by sociodemographic attributes of interest. This stratification will require linkage to additional data.
CATEgORy
RELEVANCE TO EquITy
wHy wE RECOMMENd THIS INdICATOR
HOw TO MEASuRE THIS INdICATOR
24 | Measuring Equity of Care in Hospital Settings: From Concepts to Indicators
The Joint Commission (US)national Association of psychiatric Health Systems (US)
national Association of State Mental Health program directors & Research Institute, Inc. (US)
Edwards, n., danseco, E., Heslin, K., ploeg, J., Santos, J., Stansfield, M., & davies, B. (2006). ‘development and testing of tools to assess physical restraint use.’ Worldviews on Evidence-Based Nursing. 3 (2), 73-85
Joint Commission. Specifications Manual for National Hospital Inpatient Quality Measures: Hospital-Based Inpatient Psychiatric Services Core Measure Set. Version 2.0. oakbrook Terrace (Il): Joint Commission, 2008 Jun.
organisation for Economic Co-operation and development. (2002). Measuring Up: Improving Health System Performance in OECD Countries. paris: oECd.
Teare, G., Hirdes, J., Ziraldo, M., proctor, W., & nenadovic, M. (2000) Provincial Status Report: The Quality of Caring, Ontario, April 1998–1999. Toronto, on: Canadian Institute of Health Information.
INdICATOR dEVELOpEd OR ENdORSEd By
SuppORTINg REFERENCES
Measuring Equity of Care in Hospital Settings: From Concepts to Indicators | 25
H O S p I TA L E q u I T y I N d I C AT O R 9
p R E S S u R E u LC E R R AT E A M O N g E L d E R Ly pAT I E N T S
TC-lHIn priority - Elderly
pressure ulcers are a common and costly condition with a much greater prevalence in elderly populations. If care guidelines are followed, pressure ulcers can be prevented. When stratified by patient socioeconomic attributes, this indicator can demonstrate whether optimal standards of care are being equitably delivered across diverse groups of elderly patients.
pressure ulcers are an easily avoidable condition if care guidelines are followed. Even so, nationwide, pressure ulcer prevalence in acute care settings has been estimated at 25.1% (Woodbury & Houghton, 2004). The ontario Health quality Council recently adopted this outcome as an indicator of quality for the ontario health care system, and the Agency for Health Care Research and quality uses this indicator as a measure of patient safety. Geographic variation in the prevalence of pressure ulcers has also been found across hospitals and units in ontario that provide complex continuing care (Teare et al., 2000). This geographic difference may partly reflect inequities in care for patients from different sociodemographic backgrounds (e.g. race and ethnicity, income, immigration status).
what to use: The rate of in-hospital pressure ulcers per 1,000 discharges among elderly patients, stratified by sociodemographic attribute of interest. data should exclude patients who are particularly susceptible to pressure ulcers, patients who have a length of stay of four days or less, and patients where pressure ulcer is the primary diagnosis, to better screen out cases that may be present on admission.
data Sources: Hospitals could either use their own medical records, or rely on discharge Abstract database (dAd) and/or the national Ambulatory Care Reporting System (nACRS) to determine which elderly patients have been newly diagnosed with a pressure ulcer after surgery.
To assess inequities, pressure ulcer rates should be stratified by sociodemographic attributes of interest. This stratification will require linkage to additional data.
Agency for Health Care Research and quality (US)
ontario Health quality Council (Canada)
CATEgORy
RELEVANCE TO EquITy
wHy wE RECOMMENd THIS INdICATOR
HOw TO MEASuRE THIS INdICATOR
INdICATOR dEVELOpEd OR ENdORSEd By
INSTITuTIONS THAT HAVE uSEd THIS INdICATOR
26 | Measuring Equity of Care in Hospital Settings: From Concepts to Indicators

Agency for Healthcare Research and quality. (2009). Decubitus ulcer: rate per 1,000 discharges. Agency for Healthcare Research and quality (AHRq) patient Safety Indicators. Available at: www.qualitymeasures.ahrq.gov/summary/summary.aspx?ss=1&doc_id=12716
lyder, C. (2003). ‘pressure ulcer prevention and management.’ Journal of the American Medical Association. 289, 223-226.
lyder, C., preston, J., Grady, J., Scinto, J., Allman, R., Bergstrom, n., & Rodeheaver, G. (2001). ‘quality of care for hospitalized medicare patients at risk for pressure ulcers.’ Archives of Internal Medicine. 161, 1549-1554.
organisation for Economic Co-operation and development. (2002). Measuring Up: Improving Health System Performance in OECD Countries. paris: oECd.
Woodbury, G., Houghton, p. (2004). ‘prevalence of pressure ulcers in Canadian healthcare settings.’ Ostomy-Wound Management. 50(10), 22-38.
ontario Health quality Council. (2009). Supporting QI [webpage]. Available at: www.ohqc.ca/en/supporting_qi.php?text=y
SuppORTINg REFERENCES
Measuring Equity of Care in Hospital Settings: From Concepts to Indicators | 27

H O S p I TA L E q u I T y I N d I C AT O R 10
LOwER EX TREMIT y AMpuTAT IONS AMONg pAT IENTS w ITH dIABETES
TC-lHIn priority - people with diabetes Mellitus
When diabetes is not adequately treated over the course of the disease, lower extremity amputations may be necessary. When stratified by patient sociodemographic attributes, this indicator can demonstrate whether effective diabetes management is equitably distributed among patient subgroups.
Studies suggest that diabetics from lower income neighbourhoods in ontario undergo lower extremity amputations more frequently than those from higher income neighbourhoods (Hux et al., 2003) , suggesting a lack of effective diabetes management for these patients. 30% of ontarians undergoing lower extremity amputation die within the following year (Hux et al., 2003); therefore amputation is an important outcome to examine for patients with diabetes. While diabetes is generally accepted as a primary care-sensitive condition, hospitals are in a position to efficiently monitor inequities in primary care that result in late-stage complications. one example of this is lower extremity amputation, which occurs 20 times more often in persons with diabetes than persons without diabetes (five-year total amputation rate of 156 per 100,000 adults in ontario vs. 8.1 per 100,000) (Hux et al., 2003). In this way, hospitals can take the lead on facilitating cross-sectoral collaboration to identify patient sub-populations that do not have adequate access to care for diabetes throughout the health care system. Monitoring the rate of lower extremity amputation has been endorsed by the national quality Forum as a measure of quality improvement that is relevant to inequities in the primary care setting. It has also been employed by the Institute of Clinical Evaluative Sciences and the Agency for Healthcare Research and quality in research on inequalities related to diabetes.
what to use: The percentage of all patients admitted for lower extremity amputation among patients with diabetes, stratified by sociodemographic attribute of interest.
data Sources: Hospitals could either use their own medical records, or rely on the national Ambulatory Care Reporting System (nACRS) and/or discharge Abstract database (dAd) to determine which patients have been admitted to hospital with both a diagnosis of diabetes and for a lower extremity amputation.
To assess inequities, lower extremity amputation rates should be stratified by sociodemographic attributes of interest. This stratification will require linkage to additional data.
CATEgORy
RELEVANCE TO EquITy
wHy wE RECOMMENd THIS INdICATOR
HOw TO MEASuRE THIS INdICATOR
28 | Measuring Equity of Care in Hospital Settings: From Concepts to Indicators
INSTITuTIONS THAT HAVE uSEd THIS INdICATOR
national quality Forum (US)
Institute for Clinical Evaluative Sciences (Canada)Agency for Healthcare Research and quality (US)
Agency for Healthcare Research and quality. (2008). National Healthcare Disparities Report. Rockville, Md: US department of Health and Human Services.
Ayanian, J. (2008). ‘determinants of racial and ethnic disparities in surgical care.’ World Journal of Surgery. 32, 509–515.
Hux, J., Jacka, R., Fung, K., & Rothwell, d. (2003). Diabetes and Peripheral Vascular Disease: In Hux, J., Booth, G., Slaughter, p., & laupacis, A. (eds). diabetes in ontario: An ICES practice Atlas: 6.129-6.150. Toronto, on: Institute for Clinical Evaluative Sciences.
national quality Forum. (2008). National Voluntary Consensus Standards for Ambulatory Care – Measuring Healthcare Disparities. A Consensus Report. Washington, dC: national quality Forum.
SuppORTINg REFERENCES
INdICATOR dEVELOpEd OR ENdORSEd By
Measuring Equity of Care in Hospital Settings: From Concepts to Indicators | 29

CO N C Lu d I N g R E M A R KS
With many social and economic factors contributing to inequities in health care, reducing inequity is ultimately a multifaceted effort that encompasses more than just the hospital. While establishing measurement is an important step, and one necessary for assessing the achievement of equity in a hospital setting, accomplishing lasting change will require cooperation at the lHIn and the provincial level and arguably across a variety of societal sectors. nevertheless, by measuring, monitoring, and reporting on their own equity performance, Toronto hospitals can set a precedent in Canada, and play an important leadership role in advancing equitable health care and equitable outcomes for patients. Through this report, we have identified four key issues regarding equity measurement that will require attention.
K Ey M ESSAg ES
1. Equity measurement is an important component of hospital and performance measurement and the quality improvement cycle.
2. Selection of equity indicators must be strategically driven.
3. Equity measurement in Toronto hospitals is possible now.
4. optimal evidence will be generated when hospitals collect patient-level sociodemographic data.
INTEgRATINg EquITy INTO pERFORMANCE MEASuREMENT: A NEw dIMENSION OF quALITy
Equity measurement is an important component of hospital performance measurement and the quality improvement cycle. While measuring an inequality in a hospital setting will not by itself lead to changes in practice or outcomes, an orientation toward performance and outcomes measurement is an important step in promoting organizational change. Figure 2 depicts the role that measurement can play in a hospital’s equity and quality improvement cycle.
problem identification via measurement
Measurement of the magnitude of
the problem
Implementation of solutions
Evaluation of solution and its effects
on the problem
Continued measurement
Figure 2. Quality Improvement Cycle for Achieving Equity in the Hospital
30 | Measuring Equity of Care in Hospital Settings: From Concepts to Indicators
After collecting and examining equity data as part of the quality improvement cycle, challenges may be revealed that provide an opportunity to motivate new improvement activities (see example in Box 1). Ultimately, presenting strong data describing existing inequities is an important component for motivating action.
uSINg MEASuREMENT TO IMpROVE HOSpITAL EquITy An exemplary case in which indicators have been used to decrease inequities in care is provided by the ten hospitals that participated in the Expecting Success: Excellence in Cardiac Care program piloted by the Robert Wood Johnson Foundation to improve cardiovascular care for African Americans and latinos. on a monthly basis, hospitals reported on 23 care performance measures stratified by patient primary language, race, and ethnicity. These included the eight core measures of care for heart attacks or acute myocardial infarction (AMI), and four core measures for heart failure that the United States Centers for Medicare and Medicaid Services collects and publicly reports.
In the first year of the program – while a significant amount of data on race, ethnicity and language preferences of patients were being generated – the hospitals focused on developing interventions and putting systems in place to ensure that all heart patients would consistently receive the full set of recommended care for their condition. Comparing data on the core measures before and after interventions helped hospitals gauge how effective their interventions were and gave them the momentum to continue their work as planned, or adapt the intervention to be more effective. In the pilot study, the ten hospitals were given the freedom to design their own interventions to meet the needs of their patient populations. For example, one hospital adopted universal patient discharge instructions to ensure adult cardiac patients received all necessary discharge instructions to meet core cardiac-specific measures mandated by the Joint Commission and Centers for Medicare and Medicaid Services (CMS). This resulted in an increase of adherence to acute myocardial infarction-specific and heart failure-specific discharge instructions by 21% and 29%, respectively, in the first nine months of use.
After only two years, the all-hospital median heart failure Measure of Ideal Care, an indicator that a patient received all the recommended standards of heart failure care eligible to receive in the hospital, had a significant increase from 41% to 78% (www.rwjf.org/files/research/expectingsuccessfinalreport.pdf).
Box 1.
Hospitals should also consider developing criteria to determine when an inequality is large enough to be cause for action. A statistically significant difference in the quality of care between two groups of patients may not necessarily be clinically significant or meaningful – or represent a cause for action. For instance, Harvard pilgrim Health Care, a new England-based health insurer, decided that while they would track all inequalities in care, they would only take action on differences of seven percentage points or more. See the Appendix for additional resources concerning these and other issues.
SELECTION OF EquITy INdICATORS MuST BE STRATEgICALLy dRIVEN
This report proposes ten indicators for measuring equity of care within TC-lHIn hospitals. We recommend these indicators as a “good first step” for the TC-lHIn Hospital Collaborative because they are supported by evidence of health disparities in the literature and because they meet specific criteria as outlined above. However, other hospital performance indicators have also been identified in the literature as useful for examining equity of care (see Appendix). These may be of equal or greater interest to some hospitals, depending on organizational priorities for service delivery and/or priority populations. Ultimately, decisions about “what to measure” should be evidence-based and also guided by strategic priorities and values articulated by patients, providers, and the public. Selection of relevant hospital services to be monitored (e.g. rate of perforated appendix or rate of analgesics use) and selection of appropriate patient
Measuring Equity of Care in Hospital Settings: From Concepts to Indicators | 31
demographic variables to be monitored (e.g. income level or immigration status or gender) should depend upon hospital and health system strategic priorities and may be more successfully integrated into performance management when the issues monitored are aligned with these priorities.
Equity indicators should be updated or replaced when priorities shift and/or new evidence becomes available. For example, we suggest comparing the rate of cholecystectomy performed open versus laproscopically across sociodemographic groups as an indicator of whether there are inequities in access to minimally-invasive surgery at a hospital, but comparing the rate of mastectomy versus less-invasive breast conservation therapy for patients with
early-stage breast cancer may be more relevant for hospitals that identify a concern with equity in women’s health.
To illuminate potential differences in the quality of care received by different patient subgroups, hospital performance indicators must be stratified by patient sociodemographic information. A number of different sociodemographic attributes may be pertinent to a hospital’s strategic aims for delivering care to marginalized populations (e.g. sexual orientation, insured status, etc.). The literature supports stratification by: patients’ preferred language; socioeconomic status (e.g. household income, level of education, immigration status, number of dependents, etc.); and race and ethnicity, in addition to attributes that are already normally collected by Toronto hospitals (i.e. age, gender, postal code). It is important to consider these sociodemographic variables in conjunction with one another, as stratifying by only one or two is unlikely to provide a comprehensive picture of the dimensions of inequitable care. likewise,
collecting data on multiple sociodemographic variables can assist hospitals in developing appropriate inter-ventions to improve access and quality of care for specific patient subgroups.
please refer to the Appendix for resources that are helpful for operationalizing the collection of language, socioeconomic status, race, and ethnicity data (e.g. the Canadian Community Health Survey).
EquITy MEASuREMENT IS pOSSIBLE NOw: MOVINg FORwARd wITH EquITy dATA COLLECTION
The individual-level sociodemographic variables that are normally collected in Toronto hospitals (i.e. age and gender) are insufficient for presenting a clear picture as to whether hospital services are being delivered equitably. As indicated above, a broader array of patient sociodemographic variables are required to assess equity of care in hospital settings. At present, however, few hospitals are equipped to collect such data. In spite of this limitation, a reasonable approach to equity measurement in Toronto hospitals is possible now, using existing individual-level and area-level data available from other sources (e.g. the Census). For example, patients’ neighbour-hood-level income could be utilized for stratification of our proposed indicators.
Research supports neighbourhood-level income as a reasonable proxy for individual income (Krieger et al., 2001). The method of using existing data to initiate the process of equity measurement has been supported by the UK’s national Health Service (Carr-Hill and Chalmers-dixon, 2005; lakhani et al., 2005a; lakhani et al., 2005b), and by hospitals that have led efforts in equity reporting in the United States,
such as Massachusetts General Hospital (Weinick et al., 2008).
Stratifying hospital performance indicators using area-level data may be difficult for hospitals to undertake on their own; however this process can be facilitated through institutional partnerships. Area-level data and limited individual-level data, such as age and gender, are available through institutions that provide analysis on health care services in Canada. For example, the Institute for Clinical Evaluative Sciences (ICES) is a non-profit institution
Equity indicators should be updated or replaced when priorities shift and/or new evidence becomes available.
The process of stratifying quality indicators with existing sociodemographic data can be facilitated through institutional partnerships.
32 | Measuring Equity of Care in Hospital Settings: From Concepts to Indicators
in ontario with the ability to anonymously link population-based health information on an individual patient basis, using unique identifiers that protect the privacy and confidentiality of health information. ICES houses a wide range of databases containing relevant health and sociodemographic information that can be linked to hospital data for equity purposes.
While use of existing sociodemographic data is a good starting point for equity measurement, there are limitations to this approach. The majority of the sociodemographic data currently available at institutions such as ICES is derived from the Census, and therefore only allows for examination of a patient’s neighbourhood-level characteristics. These characteristics may not always be consistent with those of the individual patient. Collection of individual-level data provides the most robust approach to examining equity issues.
OpTIMAL EVIdENCE wILL BE gENERATEd wHEN HOSpITALS COLLECT pATIENT-LEVEL SOCIOdEMOgRApHIC dATA
The ideal approach to measuring equity of care in hospital settings is to link individual-level health and utilization data to individual-level sociodemographic information. new data collection and management systems in hospitals will be needed to fully assess equity performance and to enable institutions to tailor data collection processes to meet specific needs. In initiating the process of collecting individual-level data, as recommended by Weinick et al. (2008), hospitals should conduct an initial assessment of equity data collection efforts to determine:
• What data are collected;• How and when the data are collected;• Who collects the data;• Where in the hospital the data are collected;• How and where the data are stored;• What data quality assurance plans are in place; and • What data collection implementation issues have been identified.
The Health Research and Educational Trust5 toolkit contains an assessment tool that may be helpful for this process.
As patients and community groups may have concerns about the disclosure of personal information, it will be important to communicate effectively about the equity objectives of the data collection initiative, and to explain how personal information will be used.
Research in other jurisdictions has demonstrated public support for equity-oriented collection of individual-level sociodemographic data, and has also shown that staff training and institutional commitment can be effective in addressing patient concerns. In a study conducted in Chicago, nearly 97% of patients agreed with the statement “it is important for hospitals and clinics to conduct studies to make sure all patients get the same high-quality care regardless of their race or background” (Baker et al., 2005). In a telephone survey conducted in Calgary, Alberta, 84.8% of respondents said that they felt comfortable recording their ethnicity in hospital charts – a consistent finding across different ethnic groups (quan et al., 2006).
5www.hretdisparities.org/index.php
Measuring Equity of Care in Hospital Settings: From Concepts to Indicators | 33

A p p E N d I X : A d d I T I O N A L R E S O u R C E S
O T H E R E N d O R S E d E q u I T y I N d I C AT O R S : S O u R C E S
The Agency for Healthcare Research and quality • quality Indicators (www.qualityindicators.ahrq.gov) • national Healthcare quality Report and national Healthcare disparities Report (www.ahrq.gov/qual/measurix.htm) • Consumer Assessment of Healthcare providers and Systems (CAHpS®) surveys (www.cahps.ahrq.gov)
Hospital quality Alliance • www.hospitalqualityalliance.org/hospitalqualityalliance/index.html
The Joint Commission • www.jointcommission.org
Statistics Canada • Canadian Community Health Survey (www.statcan.gc.ca/concepts/health-sante/index-eng.htm)
National Committee for quality Assurance • HEdIS (www.ncqa.org/tabid/59/ddefault.aspx)
National quality Forum • www.qualityforum.org • nqF-Endorsed Standards for Acute Care Hospital performance (www.qualityforum.org/projects/ongoing/hosp-priorities2007/)
u S E F u L T O O L K I T S
National Committee for quality Assurance and Eli Lilly •Multicultural Health Care: A quality Improvement Guide (www.ncqa.org/tabid/676/default.aspx)
Health Research and Educational Trust •HRET disparities Toolkit (www.hretdisparities.org/index.php)
The Robert wood Johnson Foundation •Expecting Success Toolkit (www.rwjf.org/pr/product.jsp?id=28433#content)
C A S E S T u d I E S
In-depth case studies of efforts taken up by hospitals to address inequalities and achieve equity can be found in Improving Quality and Achieving Equity: A Guide for Hospital Leaders put together by the MGH Institute for Health policy.
(www2.massgeneral.org/disparitiessolutions/casestudies.html)
34 | Measuring Equity of Care in Hospital Settings: From Concepts to Indicators
Measuring Equity of Care in Hospital Settings: From Concepts to Indicators | 35
Agency for Healthcare Research and quality. (2009). Measuring Healthcare quality. Available at: www.ahrq.gov/qual/measurix.htm
Agency for Healthcare Research and quality. (2008). National Healthcare Disparities Report. Rockville, Md: US department of Health and Human Services.
Agency for Healthcare Research and quality. (2006). Prevention Quality Indicators Download. AHRq quality Indicators. Available at: qualityindicators.ahrq.gov/pqi_download.htm
Alexander, M., Grumbach, K., Remy, l., Rowell, R., & Massie, B. (1999). ‘Congestive heart failure hospitalizations and survival in California: patterns according to race/ethnicity.’ American Heart Journal. 137(5), 919-927.
Alter, d., naylor, C., Austin, p., Tu, J. (1999). ‘Effects of socioeconomic status on access to invasive cardiac procedures and on mortality after acute myocardial infarction.’ New England Journal of Medicine. 341, 1359–1367.
Al-omran, M., Mamdani, M., & Mcleod, R. (2003). ‘Epidemiologic features of acute appendicitis in ontario, Canada’. Canadian Journal of Surgery. 46(4), 263-267.
American Hospital Association (AHA). (2004). Diversity and Cultural Proficiency Assessment Tool for Leaders. Washington, dC: AHA
Andrulis, d., Goodman, n., & pryor, C. (2002). What a Difference an Interpreter Can Make: Health Care Experiences of Uninsured with Limited English Proficiency. Boston, MA: The Access project.
Andrulis, d. (2003). ‘Reducing racial and ethnic disparities in disease management to improve health outcomes.’ Disease Management and Health Outcomes. 11, 789-800.
Ash, M., & Brandt, S. (2006). ‘disparities in asthma hospitalization in Massachusetts.’ American Journal of Public Health. 96(2), 358-362.
Ayanian, J. (2008). ‘determinants of racial and ethnic disparities in surgical care.’ World Journal of Surgery. 32, 509–515.
Ayanian, J., Zaslavsky, A., Guadagnoli, E., Fuchs, C., Yost, K., Creech, C., Cress, R., o’Connor, l., West, d., & Wright, W. (2005) ‘patients’ perceptions of quality of care for colorectal cancer by race, ethnicity, and language.’ Journal of Clinical Oncology. 23, 6576-6586.
Baker, d., Cameron, K., Feinglass, J., Georgas, p., Foster, S., pierce, d., Thompson, J., & Hasnain-Wynia, R. (2005). ‘patients’ attitudes toward health care providers collecting information about their race and ethnicity.’ Journal of General Internal Medicine. 20(10), 895-900.
Bao,Y., Fox, S., and Escarce, J. (2007). ‘Socioeconomic and racial/ethnic differences in the discussion of cancer screening: “between-” versus “within-” physician differences.’ Health Services Research. 42(3, pt 1): 950-970.
Barnato, A., lucas, F., Staiger, d., Wennberg, d., & Chandra, A. (2005). ‘Hospital level disparities in acute myocardial infarction treatment and outcomes.’ Medical Care. 43, 308-319.
Bernabei R., Gambassi G., lapane K., landi F., Gatsonis C., dunlop R., lipsitz l., Steel K., Mor V. (1998). ‘Management of pain in elderly patients with cancer.’ Journal of the American Medical Association. 279(23):1877-82.
R E F E R E N C E L I S T

Bierman, A.S. & Clark, J.p. (2007). ‘performance measurement and equity.’ British Medical Journal. 334, 1333-4.
Bratu, I., Martens, p., leslie, W., dik, n., Chateau, d., & Katz, A. (2008). ‘pediatric appendicitis rupture rate: disparities despite universal health care.’ Journal of Pediatric Surgery. 43(11), 1964-9.
Braveman p. (2006). ‘Health disparities and Health Equity: Concepts and Measurement.’ Annual Review Public Health. 27, 167-194.
Brownell, M., Roos, n., & Roos, l. (2001). ‘Monitoring health reform: A report card approach.’ Social Science and Medicine. 52, 657-670.
Browning, K., Ferketich, A., Salsberry, p., & Wewers, M. (2008). ‘Socioeconomic disparity in provider-delivered assistance to quit smoking.’ Nicotine & Tobacco Research. 10(1), 55-61.
Campbell, S., Roland, M., Buetow, S. (2000) ‘defining quality of care.’ Social Science and Medicine. 51, 1611-1625.
Canadian Institute for Health Information (CIHI). (2006). Hospital Report 2006 (Acute Care). Hospital Report Research Collaborative. Available at: www.hospitalreport.ca/downloads/2006/acute_2006.html
Canadian Institute for Health Information (CIHI). (2008). Health Indicators 2008. Available at: secure.cihi.ca/cihiweb/disppage.jsp?cw_page=indicators_e
Carbone, E., Gorrie, J., & oliver, R. (2003). ‘Without proper language interpretation, sight is lost in oregon and a $350 000 verdict is reached.’ Healthcare Risk Management, Legal Review & Commentary [May].
Carr-Hill, R., Chalmers-dixon, p. (2005). The Public Health Observatory Handbook of Health Inequalities Measurement. oxford, UK: South East public Health observatory, national Health Service.
Cohen, A., Rivara, F., Marcuse, E., Mcphillips, H., & davis, R. (2005). ‘Are language barriers associated with serious medical events in hospitalized pediatric patients?’ Pediatrics. 116(3), 575-579.
Committee on Understanding and Eliminating Racial and Ethnic disparities in Health Care, Institute of Medicine. (2002). Unequal Treatment: Confronting Racial and Ethnic Disparities in Health Care. Washington, d.C.: The national Academies press.
divi, C., Koss, R., Schmaltz, S., & loeb, J. (2007). ‘language proficiency and adverse events in US hospitals: A pilot study.’ International Journal of Quality Health Care. 19(2),60-67.
dreachslin J. & Agho A. (2001) ‘domains and core competencies for effective evidence-based practice in diversity leadership.’ Journal of Health Administration Education. 19,131-47.
Edwards, n., danseco, E., Heslin, K., ploeg, J., Santos, J., Stansfield, M., & davies, B. (2006). ‘development and testing of tools to assess physical restraint use.’ Worldviews on Evidence-Based Nursing. 3 (2), 73-85
Escarce, J. (2007). Racial and Ethnic Disparities in Access to and Quality of Health Care. Research Synthesis Report no. 12. The Robert Wood Johnson Foundation. Available at: www.rwjf.org/pr/synthesis/reports_and_briefs/pdf/no12_researchreport.pdf
Fiscella, K., Franks, p., Gold, M., & Clancy, C. (2000). ‘Inequality in quality: Addressing socioeconomic, racial, and ethnic disparities in health care.’ Journal of the American Medical Association. 283(19), 2579–84.
36 | Measuring Equity of Care in Hospital Settings: From Concepts to Indicators

Measuring Equity of Care in Hospital Settings: From Concepts to Indicators | 37
Flores, G., Abreu, M., olivar, M., & Kastner, B. (1998). ‘Access barriers to health care for latino children.’ Archives of Pediatrics and Adolescent Medicine. 152(11), 1119-25.
Gardam, M., Verma, G., Campbell, A., Wang, J., & Khan, K. (2008). ‘Impact of the patient-provider relationship on the survival of foreign born outpatients with tuberculosis.’ Journal of Immigrant and Minority Health. doI:10.1007/s10903-008-9221-8
Goldman, R., Amin, p., & Macpherson, A. (2006). ‘language and length of stay in the pediatric emergency department.’ Pediatric Emergency Care. 22(9), 640-3.
Government of ontario (2001). patient Restraints Minimization Act, 2001, S.o. 2001, c. 16. Retrieved April 30, 2009, from: www.e-laws.gov.on.ca
Green, A., Carney, d., pallin, d., ngo, l., Raymond, K., Iezzoni, l., & Banaji, M. (2007). ‘Implicit bias among physicians and its prediction of thrombolysis decisions for black and white patients.’ Journal of General Internal Medicine. 22(9), 1231-8.
Grimwood, S. & Murray, M. (2008). Hospital e-Scorecard Report 2008 (Emergency department Care): patient Satisfaction Technical Summary. Hospital Report Research Collaborative. Available at: www.hospitalreport.ca/downloads/2008/edc_2008.html
Healthcare Commission. (2008). Report on Self Reported Experience of Patients from Black and Minority Ethnic Groups. london, UK: UK department of Health.
Hux, J., Booth, G., Slaughter, p., & laupacis, A. (2003). Diabetes in Ontario. Toronto, on: Institute for Clinical Evaluative Sciences.
Jiang, H., Andrews, R., Stryer, d., & Friedman, B. (2005). ‘Racial/ethnic disparities in potentially preventable readmissions: The case of diabetes.’ American Journal of Public Health. 95(9),1561-1567.
Joint Commission. Specifications Manual for National Hospital Inpatient Quality Measures: Hospital-Based Inpatient Psychiatric Services Core Measure Set. Version 2.0. oakbrook Terrace (Il): Joint Commission, 2008 June.
Krieger, n., Zierler, S., Hogan, J.W., Waterman, p., Chen, J., lemieux, K. & Gjelsvik, A. (2001). ‘Geocoding and measurement of neighborhood socioeconomic position: A US perspective.’ In Kawachi, I. & Berkman l.F. (eds.), Neighborhoods and Health, (pp.147-178). oxford, UK: oxford University press.
lakhani, A., Coles, J., Eayres, d., Spence, C., and Ratchet, B. (2005a). Creative use of existing clinical and health outcomes data to assess nHS performance in England: part 1 — performance indicators closely linked to clinical care. British Medical Journal. 330: 1426-1431.
lakhani, A., Coles, J., Eayres, d., Spence, C., and Sanderson, C. (2005b). Creative use of existing clinical and health outcomes data to assess nHS performance in England: part 2 — more challenging aspects of monitoring. British Medical Journal. 330: 1486-1492.
loreti, M., Tse, J., Murray, M.A. (2007). Hospital Report 2007: Acute Care. Patient Satisfaction Technical Summary. Toronto: Hospital Report Research Collaborative.
lyder, C. (2003). ‘pressure ulcer prevention and management.’ Journal of the American Medical Association. 289, 223-226.

lyder, C., preston, J., Grady, J., Scinto, J., Allman, R., Bergstrom, n., & Rodeheaver, G. (2001). ‘quality of care for hospitalized medicare patients at risk for pressure ulcers.’ Archives of Internal Medicine. 161, 1549-1554.
Magistretti, A., Stewart, d., & Brown, A. (2002). ‘performance measurement in women’s health: The women’s health report 2001 series, a Canadian experience. Women’s Health Issues. 12, 327-337.
national quality Forum. (2008). National Voluntary Consensus Standards for Ambulatory Care – Measuring Healthcare Disparities. A Consensus Report. Washington, dC: national quality Forum.
ng, B., dimsdale, J., Rollnik, J., Shapiro, H. (1996). ‘The effect of ethnicity on prescriptions for patient-controlled analgesia for post-operative pain.’ Pain. 66 (1): 9-12.
ontario Health quality Council. (2009). Supporting QI [webpage]. Available at: www.ohqc.ca/en/supporting_qi.php?text=y.
organisation for Economic Co-operation and development (oECd). (2002). Measuring Up: Improving Health System Performance in OECD Countries. paris: oECd.
parviz, M., Cassel, J., Kaplan, B., Karp, S., neifeld, J., penberthy, l., & Bear, H. (2003). ‘Breast conservation therapy rates are no different in medically indigent versus insured patients with early stage breast cancer.’ Journal of Surgical Oncology. 84, 57–62.
quan, H., Wong, A., Johnson, d., & Ghali, W. (2006). ‘The public endorses collection of ethnicity information in hospital: Implications for routine data capture in Canadian health systems.’ Healthcare Policy. 1(3), 55-64.
quazi, S., Eberhart, M., Jocoby, J., & Heller, M. (2008). ‘Are racial disparities in Ed analgesia improving? Evidence from a national data base.’ The American Journal of Emergency Medicine. 26, 462-464.
Rachlis, M. (2007). ‘delivering Equity: Community-Based Models for Access and Integration in ontario’s Health System.’ Toronto, on: Wellesley Institute.
Rathore, S., Foody, J., Wang, Y., Smith, G., Herrin, J., Masoudi, F., Wolfe, p., Havranek, E., ordin, d., & Krumholz, H. (2003). ‘Race, quality of care, and outcomes of elderly patients hospitalized with heart failure.’ Journal of American Medical Association. 289(19), 2517-2524.
Regenstein, M. (2007). ‘Measuring and improving the quality of hospital language services: Insights from the speaking together collaborative.’ Journal of General Internal Medicine. 22, 356-359.
Ricciardi, R., Selker, H., Baxter, n., Marcello, p., Roberts, p., & Virnig, B. (2008). ‘disparate use of minimally invasive surgery in benign surgical conditions.’ Surgical Endoscopy. 22(9), 1977-1986.
Robert Wood Johnson Foundation. (2007). Improving Quality of Health Care Relies on Effective Language Services: An Issue Brief from Speaking Together. princeton, nJ: RWJF.
Schyve, p. (2007). ‘language differences as a barrier to quality and safety in health care: The joint commission perspective.’ Journal of General Internal Medicine. 22 (Suppl 2), 360-361.
Teare, G., Hirdes, J., Ziraldo, M., proctor, W., & nenadovic, M. (2000). Provincial Status Report: The Quality of Caring. ontario, April 1998–1999. Toronto, on: Canadian Institute of Health Information.
38 | Measuring Equity of Care in Hospital Settings: From Concepts to Indicators

Measuring Equity of Care in Hospital Settings: From Concepts to Indicators | 39
Todd K., deaton C., d’Adamo A., Goe l. (2000). ‘Ethnicity and analgesic practice.’ Annals of Emergency Medicine. 35(1), 11-6.
Todd, K., lee, T., Hoffman, J. (1994). ‘The effect of ethnicity on physician estimates of pain severity in patients with isolated extremity trauma.’ Journal of the American Medical Association. 271(12): 925-8.
Todd, K., Samaroo, n., Hoffman, J. (1993). ‘Ethnicity as a risk factor for inadequate emergency department analgesia.’ Journal of the American Medical Association. 269(12): 1537-9.
Tsay, J., lee, C., Hsu, Y., Wang, p., Bai, Y., Chou, Y., & Huang, n. (2007). ‘disparities in appendicitis rupture rate among mentally ill patients.’ BMC Public Health. 7, 331.
Tu, J., Austin, p., Walld, R., Roos, l., Agras, J., & Mcdonald, K. (2001). ‘development and validation of the ontario acute myocardial infarction mortality prediction rules.’ Journal of the American College of Cardiology. 37(4), 992-7.
Weinick, R., Byron, S., & Bierman, A. (2005). ’Who can’t pay for health care?’ Journal of General Internal Medicine. 20(6), 504-509.
Weinick, R., Flaherty, K., & Bristol, S. (2008). Creating Equity Reports: A Guide for Hospitals. Boston, MA: The disparities Solutions Center, Massachusetts General Hospital. Available at: www2.massgeneral.org/disparitiessolutions/resources.html
Weinick, R., Zuvekas, S., & Cohen, J. (2000). ‘Racial and ethnic differences in access to and use of health care services, 1977 to 1996.’ Medical Care Research and Review. 57 (Suppl 1), 36-54.
Wilson-Stronks, A., lee, K., Cordero, C., Kopp, A., & Galvez, E. (2008). One Size Does Not Fit All: Meeting The Health Care Needs of Diverse Populations. oakbrook Terrace, Il: The Joint Commission.
Woodbury, G., Houghton, p. (2004). ‘prevalence of pressure ulcers in Canadian healthcare settings.’ Ostomy-Wound Management. 50(10), 22-38.
World Health organization. (2008). ‘The world health report 2008 : primary health care now more than ever.’ Geneva, Switzerland: World Health organization.
Zhang, C., & Murray, M. (2008). Hospital e-Scorecard Report 2008 (Acute Care): Patient Satisfaction Technical Summary. Hospital Report Research Collaborative. Available at: www.hospitalreport.ca/downloads/2008/acute_2008.html

St. Michael’s Hospital30 Bond StreetToronto, Ontario M5B 1W8416-360-4000www.stmichaelshospital.com
Measuring Equity of Care in Hospital Settings:From Concepts to Indicators
REpORT TO THE HOSpITal COllaBORaTIvE On MaRgInalIzEd pOpulaTIOnS (TOROnTO CEnTRal lOCal HEalTH InTEgRaTIOn nETWORk)
Prepared by the Centre for Research on Inner City Health (CRICH). CRICH is part of the Keenan Research Centre in the Li Ka Shing Knowledge Institute of St. Michael’s Hospital.
May 2009
patient care
health careurban life
partnership
indicators
evidenceperformance
inclusion
qualitydiversity
culture
SMH_MEASURINGEQUITY_COVER.indd 1 5/18/09 8:58:03 PM