urban heat implications from parking, roads, and cars: a
TRANSCRIPT

Full Terms & Conditions of access and use can be found athttps://www.tandfonline.com/action/journalInformation?journalCode=tsri20
Sustainable and Resilient Infrastructure
ISSN: (Print) (Online) Journal homepage: https://www.tandfonline.com/loi/tsri20
Urban Heat Implications from Parking, Roads, andCars: a Case Study of Metro Phoenix
Christopher G. Hoehne , Mikhail V. Chester , David J. Sailor & David A. King
To cite this article: Christopher G. Hoehne , Mikhail V. Chester , David J. Sailor & David A. King(2020): Urban Heat Implications from Parking, Roads, and Cars: a Case Study of Metro Phoenix,Sustainable and Resilient Infrastructure, DOI: 10.1080/23789689.2020.1773013
To link to this article: https://doi.org/10.1080/23789689.2020.1773013
View supplementary material
Published online: 06 Jul 2020.
Submit your article to this journal
Article views: 61
View related articles
View Crossmark data

Urban Heat Implications from Parking, Roads, and Cars: a Case Study of Metro PhoenixChristopher G. Hoehne a, Mikhail V. Chester a, David J. Sailor b and David A. King b
aCivil, Environmental, and Sustainable Engineering, Arizona State University, Tempe, Arizona, USA; bSchool of Geographical Sciences and Urban Planning, Arizona State University, Tempe, Arizona, USA
ABSTRACTTo understand the transportation sector’s role on influencing and mitigating heat in cities, this research quantifies added heat from pavement infrastructure and vehicle travel in the hot and automobile dependent metropolitan Phoenix, Arizona. Construction of a one-dimensional heat transfer model for local weather conditions and pavement design is combined with vehicle travel densities to simulate spatiotemporal sensible heat flux magnitudes. In metro Phoenix, sensible heat from pavements and vehicles is comprised of 67% from roadways, 29% from parking, and 3.9% vehicles. Concrete and asphalt pavement emit 15% and 37% more sensible heat compared to the bare ground, respectively. Added sensible heat from pavement peaks during summer after-noons when heat emissions relative to the ground are 26% and 46% greater for concrete and asphalt. Results indicate pavement infrastructure contributes significantly to Phoenix’s urban heat balance, and areas surrounding busy vehicle corridors may be undesirable for outdoor activities during summer rush hours.
ARTICLE HISTORY Received 28 October 2019 Accepted 15 May 2020
KEYWORDS Heat; pavement; transportation; parking; Phoenix
1. Introduction
As global urbanization and climate change persists, cities are becoming gradually warmer. One consequence of urbanization is Urban Heat Island (UHI), a phenomenon where urban areas are warmer than rural areas. Increasing urban heat from UHI and climate change threatens urban vitality and prosperity by poten-tially reducing productivity and economic development (Graff Zivin & Neidell, 2014; Kjellstrom et al., 2009), increasing demand for energy (Burillo et al., 2019; Miller et al., 2008; Reyna & Chester, 2017), increasing urban infrastructure vulnerability (Bondank et al., 2018; Gasser et al., 2019; Markolf et al., 2017; Schaeffer et al., 2012), dissuading outdoor activity and travel (Karner et al., 2015; Obradovich & Fowler, 2017; Stamatakis et al., 2013), and causing increased heat-related injury or death (CDC, 2012; Eisenman et al., 2016; Gasparrini et al., 2015; Kovats & Hajat, 2008). Given the breadth of externalities, there is a great desire to fully understand and mitigate urban heat.
The transportation system is naturally embedded in the issue of urban heat through infrastructure design and transportation planning choices. UHI is caused by anthropogenic infrastructure and activity, and previous research has established heating from vehicles and pave-ments as significant. Impervious and engineered materials
of an urban surface (such as asphalt and concrete) have a greater ability to absorb and store heat compared to the Earth’s natural terrain due to different intensive proper-ties. Increased coverage of built infrastructure and decreased vegetation in urban areas also reduce the poten-tial for evaporative cooling. Asaeda et al. (1996) found asphalt pavement can contribute significant amounts of heat relative to bare ground; afternoon heat absorption from asphalt pavement within 30 m of the ground accounted for four times the daily averaged total anthro-pogenic heat across the Tokyo metropolitan area. Wasted heat from buildings, vehicles, and human metabolism also contributes to urban warming. While it is well established that internal combustion engine waste significant amounts of energy as heat (Rajoo et al., 2014; Reddy et al., 2015), the influence of urban vehicle travel on the urban energy balance has been less rigorously studied compared to other heat sources. This is due in part due to poor quality transportation sector heat emissions (Smith et al., 2009). Hart and Sailor (2009) found up to 2°C warmer air masses above urban roads during the weekday compared to the weekend in Portland, Oregon, indicating that increased weekday vehicle travel may be the primary cause. Sailor and Lu (2004) found that heat-ing from vehicles dominated the summer anthropogenic
CONTACT Christopher G. Hoehne [email protected] data for this article can be accessed here.
SUSTAINABLE AND RESILIENT INFRASTRUCTURE https://doi.org/10.1080/23789689.2020.1773013
© 2020 Informa UK Limited, trading as Taylor & Francis Group

heating in six US cities, accounting for 47% to 62% of the total.
Heat transfer models have been used frequently for many purposes, and have proven a viable tool to estimate surface temperatures and surface heat transfer in materi-als including pavements. Even before the wide availabil-ity of computer programing, heat transfer models were constructed and validated to assess pavement thermal performance (Dempsey & Thompson, 1970). With an increased interest in UHI in the late twentieth century (Arnfield, 2003; Oke, 1982), more research emerged that focused on explicitly modeling paved surfaces to under-stand their influence on UHI; Asaeda et al. (1996) were the first to model and assess the effects of paved surfaces on the near-surface urban climate. One-dimensional heat transfer models using finite difference solving schemes are among the most popular due to straight- forward implementation and ability to achieve reason-able predictions of pavement surface temperatures (Gui et al., 2007; Hall et al., 2012; Hermansson, 2004; Wang & Roesler, 2012). Despite the common use of heat transfer modeling in the study of pavements, results of such analyses have generally not been used to assess the effects of paved infrastructure on UHI. Instead, the urban sur-face’s influence on UHI is more commonly assessed by relating UHI intensities to spatial variability in land use and albedo (Carnielo & Zinzi, 2013; Dai et al., 2018; Golden & Kaloush, 2006; Hart & Sailor, 2009; Minjun Kim et al., 2017; Sun et al., 2018; Wicki et al., 2018).
Numerous studies have quantified heat fluxes from pavements and vehicles independently within their scope (Allen et al., 2011; Arnfield & Grimmond, 1998; Golden & Kaloush, 2006; Ichinose et al., 1999; Smith et al., 2009); however, only one study has quantified both simulta-neously. Fujimoto et al. (2015) investigated the influence of vehicle travel on the heat balance surrounding an urban intersection in Fukui, Japan. The authors found that vehicle-related heat fluxes accounted for 3% to 12% of the total winter heat balance depending on traffic density and time of day. As a result of increased vehicle travel, they predicted increased pavement surface tem-peratures of 1.5°C to 4°C compared to measured pave-ment surface temperature increases of 3.5°C.
Urban automobile travel is pervasive and often dom-inatesmode share and land use in cities (Kenworthy & Laube, 1999). Pavement infrastructure can make up 30% to 66% of the urban land cover (Akbari et al., 1999, 2003), and parking infrastructure alone may account for as much as 10% to 14% of incorporated urban land in Los Angeles and Phoenix, respectively (Chester et al., 2015; Hoehne et al., 2019). To help understand how city planning and the transportation sector can influence urban heat, this research aims to quantify contributions
to urban heat from vehicle travel and pavement infra-structure. We focus this study on the Phoenix metropo-litan region for three primary reasons: first, Phoenix has a very auto-centric urban design with high automobile dependence and supporting infrastructure; second, Phoenix may suffer significant consequences of urban heat due to urban heat island, climate change, and rapid urban growth (Clark et al., 2019); and third, the arid climate in Phoenix makes it desirable for modeling sensible heat transfer. This study aims to answer two research questions: (1) What aspects of urban pavements are most or least influential to sensible heat flux magni-tudes? and (2) How do pavement infrastructure and vehicle travel contribute to the urban heat balance?
2. Methodology
Two approaches are used to quantify spatial and temporal urban heat flux magnitudes from pavements and vehicles in metropolitan Phoenix, Arizona. First, a one- dimensional (1D) model based on fundamental heat transfer is developed to approximate diurnal sensible heat fluxes from various types of pavements. The model is validated by comparing simulated material surface tem-peratures to remotely sensed land surface temperatures at various sites in metro Phoenix that are dominantly bare ground or covered by pavement. Additional pavement designs are then simulated to represent the various regio-nal urban roadway and parking pavement designs. Next, regional vehicle travel data for a typical day are combined with internal combustion engine (ICE) vehicle efficiency estimates from literature to estimate rates of wasted heat during vehicle travel. Heat from vehicle travel and pave-ments is then estimated at 250 m2 resolution across the Phoenix metropolitan area to allow comparison to pre-vious estimates of anthropogenic heating in cities.
2.1. One-dimensional Heat Transfer Model Overview
Following extensive previous research on modeling fun-damental heat transfer, a 1D model is developed that predicts temperatures and sensible heat flux of a delineated material according to its thermophysical properties and surrounding environmental conditions. Only sensible heat transfer is considered as it is the dominant term affecting warming in arid climates such as Phoenix. The 1D transient heat conduction model ignores lateral heat transfer since the horizontal dimensions of paving are two orders of magnitude lar-ger than the depth. The model balances surface energy transfer from convection, incoming solar radiation, and outgoing infrared radiation as well subsurface energy
2 C. G. HOEHNE ET AL.

transfer via conduction (Figure 1). Simulated materials are idealized as a series of stacked nodes starting at the surface at continuing downward to a defined depth. Heat transfer is first balanced between the nodes at an initial condition, then solved by stepping forward in time using an explicit finite difference scheme. While many similar 1D models have been implemented and validated in literature, this methodology most closely replicates the implementation and some assumptions of Gui et al. (2007) because it was also implemented and validated for conditions in Phoenix, Arizona.
To simulate heat transfer of a pavement or bare ground, a number of input variables are utilized. Uniform or composite materials may be simulated, and for each unique layer of material, various material properties are required: albedo (surface layer only), emissivity (surface layer only), layer thickness, thermal conductivity, and volumetric heat capacity. Other para-meters that must be defined include sky view factor (SVF), characteristic length of the surface, initial start-ing temperature profile, nodal spacing, and time step length. The model is forced using hourly or sub-hourly measured solar radiation, air temperature, humidity, and wind velocity data.
Temperature and sensible heat transfer is estimated by transient energy balance of surface convection, incoming surface solar radiation, outgoing surface infrared radiation, and subsurface conduction. The gen-eralized equation for net heat transfer (in W m−2) at the surface is defined as
qnet ¼ �qsw;in þ qsw;ref þ qconv � qlw;in þ qlw;out (1)
where qsw;in is incoming shortwave (solar) radiation, qsw;ref is reflected shortwave radiation, qconv is convec-tion, qlw;in is incoming longwave radiation, and qlw;outis outgoing longwave (infrared) radiation. Outgoing long-wave radiation is assumed to obey the Stefan-Boltzmann law such that a surface emits longwave radiation as a black body. Therefore, net longwave radiation at the surface is defined as
qlw;net ¼ qlw;out � qlw;in ¼ εσ T4s � T4
sky
� �(2)
where ε is emissivity of the surface, σ is the Stefan- Boltzmann constant, Ts is the surface temperature, and Tsky is the sky temperature. To approximate longwave radiation between pavements and their surroundings, previous 1D models have assumed surrounding condi-tions form a hypothetical sky temperature such that
Tsky ¼ T1 0:004Tdew þ 0:8ð Þ0:25 (3)
where T1 is the atmospheric dry-bulb temperature and Tdew is the dew point temperature (Chiasson et al., 2000; Gui et al., 2007; Hall et al., 2012). Convective heat transfer at the surface is defined as
qconv ¼ h1 Ts � T1ð Þ (4)
where h1 is the convective heat coefficient of air. Assuming laminar flow over a flat plate, Çengel (2002) defines the convective heat coefficient as
h1 ¼ 0:664k1Pr0:31 v�0:5
1 L�0:5U0:51 (5)
where k1, Pr1, and v1 are the thermal conductivity, Prandtl number, and kinematic viscosity of air,
Figure 1. One-dimensional Heat Transfer Diagram for a Typical Pavement. The boundary condition at the bottom of the subgrade layer is assumed to be a constant temperature; a sufficient depth is chosen such that it is reasonable to assume there are no temperature fluctuations with respect to time (in this case, 1.5 m).
SUSTAINABLE AND RESILIENT INFRASTRUCTURE 3

respectively; L is the characteristic length of pavement assumed to be the ratio of the pavement length in the direction of wind to the perimeter; and U1 is the hor-izontal wind velocity. Net shortwave radiation at the surface is defined as
qsw;net ¼ qsw;inΨsky 1 � αð Þ (6)
where qsw;in is the incoming shortwave (solar) radiation, the sky view factor (SVF), and α is the albedo of the surface. The generalized equation for subsurface sensi-ble heat transfer (conduction) is defined as
@T@t
¼kρc
@2T@x2 (7)
where T is temperature, t is time, k is thermal diffusivity, ρ is density, c is specific heat capacity, and x is depth. Where multiple layers of differing materials are present (as is common in pavements), boundary conditions are also implemented. Due to a lack of information, it is assumed that thermal contact resistance between layers is zero. While this assumption will affect subsurface pavement temperatures, a similar pervious model did not find significant impacts on near-surface tempera-tures with zero thermal contact resistance between layers (Gui et al., 2007). As a result, the upper and lower interface temperatures can be assumed to be equal, and are idealized as a single node. Therefore, the boundary condition at the interface must obey
kb�1Tb�1 � Tb
Δxb;b�1¼ kbþ1
Tb � Tbþ1
Δxb;bþ1(8)
where subscriptb refers to the node at the boundary and b � 1 and b þ 1 refer to the conditions at nodes imme-diately above and below the boundary node.
To ensure feasible results from the explicit finite difference scheme, all calculations are required to satisfy the Courant-Friedrichs-Lewy (CFL) condition for stabi-lity (Gui et al., 2007; Heath, 2002). In order to satisfy the CFL stability condition, sufficiently small time and nodal spacing are required. To achieve stable solutions such that simulation times are reasonable, a nodal spa-cing of 10 mm and time step spacing of 30 seconds are chosen. Therefore, linear interpolation between weather observations is required to achieve matching temporal frequency.
To ensure initial conditions begin at an equilibrium, the initial conditions are iteratively simulated until con-vergence occurs between the initial (t0) and first time step (t1). The tolerance for convergence is defined such that each nodal temperature at t1 is within 0.1 K of its t0temperature for the first 100 iterations of the initial
conditions, after which the tolerance for convergence is relaxed to 1.0 K.
This outlined heat transfer model is implemented using R statistical software, and documentation for application in this analysis is maintained in a GitHub repository (Hoehne, 2019).
2.2. Selected Pavement Designs and Model Validation for Phoenix Sites
Validation is performed by comparing various modeled pavements and bare ground surface temperatures to remotely sensed land surface temperatures from the Advanced Spaceborne Thermal Emission and Reflection Radiometer (ASTER) onboard the Terra satellite (NASA, 2019). ASTER On Demand Surface Kinetic Temperature measurements are generated from five thermal infrared bands and are atmospheri-cally corrected (USGS, 2018). Validation sites are selected across the Phoenix metro region such that the materials of interest uniformly and completely cover a 90 m2 ASTER raster pixel. Major roadways in Phoenix do not reach 90 m in width, and as a result, the sites selected are asphalt or concrete parking lots and airport tarmacs. Figure 2 displays a sample of the selected sites highlighted on an ASTER surface tempera-ture image. For a detailed list of the selected sites used in validation, see Appendix S.1.
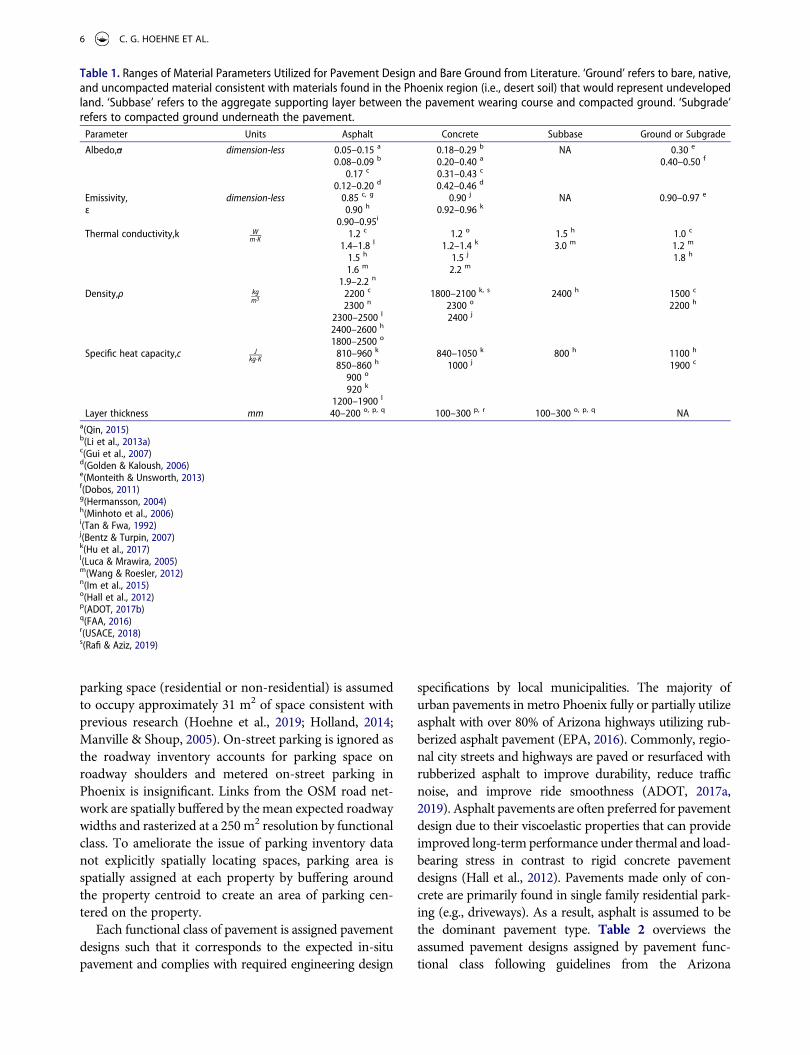
A variety of pavement designs are categorized into three classes and developed by referencing relevant lit-erature and pavement engineering design recommenda-tions or requirements. A summary of the range of material parameters for various pavements and bare ground is displayed in Table 1. Pavement designs are classified in one of three pavement classes: (1) asphalt pavement (primarily hot-mixed asphalt) which utilizes a bitumen binder with aggregate; (2) concrete pavement (primarily Portland cement concrete) which utilizes a cement binder with aggregate; and (3) composite asphalt-concrete pavements that combine distinct bitu-men-bound and cement-bound layers in a single pave-ment design such as whitetopping overlaid on an asphalt pavement or rubberized asphalt overlaid on Portland cement concrete (PCC). Whitetopping is a common method where a thin PCC layer is overlaid on top of an existing asphalt pavement. Whitetopping has become increasingly popular for existing pavement rehabilitation and to increase the surface layer albedo for potential cooling benefits. Lastly, a fourth material class emulating desert soil is created to serve as a reference for undeveloped natural land that would be found in an arid region such as Phoenix.
4 C. G. HOEHNE ET AL.

Various pavement designs and bare ground composi-tions are simulated to emulate the expected materials observed at each site. Simulation time periods are chosen by identifying ASTER observation dates that have less than 10% cloud cover, no precipitation, and all data passing quality control checks. ASTER observation dates occurring during the day and night as well as occurring across all four seasons are selected to ensure a variety of dry weather conditions. Historical weather data for the same periods as the ASTER observation dates are retrieved for all stations across the entire metro Phoenix region from the MesoWest weather data net-work (University of Utah, 2019). All weather stations with consistent weather observations for each simulation date are chosen. Consistent weather observations are defined as (1) having an average of at least one weather observation per hour for all relevant variables during the desired dates (solar radiation, air temperature, humidity, and wind speed); (2) having no gaps in observations for greater than 2 hours for all relevant variables; (3) no rainfall during analysis period; and (4) 95% of intra- station observations fall within two standard deviations of the intra-hour mean across all relevant variables and all stations in the region. Each validation site is assumed to have a SVF of 0.947, the mean of the Phoenix metro area (Middel et al., 2018). Pavement and bare ground compositions are then simulated for a period of 3 days such that the final day corresponds to a desired ASTER measurement using the hourly mean weather variables from all selected stations with specified material design parameters emulating the validation site materials.
2.3. Estimating Pavement and Vehicle Heat at a City-wide Scale
Profiles of pavement and vehicle heat transfer are applied to regional pavement and traffic flow data to approximate spatial and diurnal heat flux magnitudes across the Phoenix metropolitan region. A pavement infrastructure inventory for metro Phoenix is developed by combining OpenStreetMap (OSM) roadway data (OpenStreetMap contributors, 2019) and Phoenix parking inventory data from Hoehne et al. (2019). Average annual daily traffic estimates are obtained from Maricopa County origin- destination travel demand data simulated in MATSim travel modeling software. Simulation outputs for pavement designs by roadway and parking functional classes are combined with waste heat flux estimates from vehicle travel and linked to the roadway and parking inventory data. Spatial and temporal mean daily and hourly sensible heat fluxes for a typical clear spring or fall day are esti-mated at a 250 m2 spatial resolution for all of metro Phoenix.
Utilizing Phoenix parking inventory data at the indi-vidual property (parcel) level from Hoehne et al. (2019) and OSM roadway network data, fractional pavement area is estimated across the region. Fractional areas of pavements are estimated by different functional classes corresponding to expected variations in functional design. Roadway pavements are split into four major classes: highway, major arterial, minor arterial, and local roads. Parking pavements are split into two major classes: residential parking, and non-residential parking. Each
Figure 2. ASTER Nighttime Land Surface Temperature across Phoenix Metro on March 22nd, 2014 with Selected Validation Sites Highlighted. Satellite imagery of four validation sites are shown where the inner box is the 90 m2 pixel location of the ASTER cell.
SUSTAINABLE AND RESILIENT INFRASTRUCTURE 5
parking space (residential or non-residential) is assumed to occupy approximately 31 m2 of space consistent with previous research (Hoehne et al., 2019; Holland, 2014; Manville & Shoup, 2005). On-street parking is ignored as the roadway inventory accounts for parking space on roadway shoulders and metered on-street parking in Phoenix is insignificant. Links from the OSM road net-work are spatially buffered by the mean expected roadway widths and rasterized at a 250 m2 resolution by functional class. To ameliorate the issue of parking inventory data not explicitly spatially locating spaces, parking area is spatially assigned at each property by buffering around the property centroid to create an area of parking cen-tered on the property.
Each functional class of pavement is assigned pavement designs such that it corresponds to the expected in-situ pavement and complies with required engineering design
specifications by local municipalities. The majority of urban pavements in metro Phoenix fully or partially utilize asphalt with over 80% of Arizona highways utilizing rub-berized asphalt pavement (EPA, 2016). Commonly, regio-nal city streets and highways are paved or resurfaced with rubberized asphalt to improve durability, reduce traffic noise, and improve ride smoothness (ADOT, 2017a, 2019). Asphalt pavements are often preferred for pavement design due to their viscoelastic properties that can provide improved long-term performance under thermal and load- bearing stress in contrast to rigid concrete pavement designs (Hall et al., 2012). Pavements made only of con-crete are primarily found in single family residential park-ing (e.g., driveways). As a result, asphalt is assumed to be the dominant pavement type. Table 2 overviews the assumed pavement designs assigned by pavement func-tional class following guidelines from the Arizona
Table 1. Ranges of Material Parameters Utilized for Pavement Design and Bare Ground from Literature. ‘Ground’ refers to bare, native, and uncompacted material consistent with materials found in the Phoenix region (i.e., desert soil) that would represent undeveloped land. ‘Subbase’ refers to the aggregate supporting layer between the pavement wearing course and compacted ground. ‘Subgrade’ refers to compacted ground underneath the pavement.
Parameter Units Asphalt Concrete Subbase Ground or Subgrade
Albedo,~α dimension-less 0.05–0.15 a
0.08–0.09 b
0.17 c
0.12–0.20 d
0.18–0.29 b
0.20–0.40 a
0.31–0.43 c
0.42–0.46 d
NA 0.30 e
0.40–0.50 f
Emissivity, ε
dimension-less 0.85 c, g
0.90 h
0.90–0.95i
0.90 j
0.92–0.96 kNA 0.90–0.97 e
Thermal conductivity,k Wm�K
1.2 c
1.4–1.8 l
1.5 h
1.6 m
1.9–2.2 n
1.2 o
1.2–1.4 k
1.5 j
2.2 m
1.5 h
3.0 m1.0 c
1.2 m
1.8 h
Density,ρ kgm3
2200 c
2300 n
2300–2500 l
2400–2600 h
1800–2500 o
1800–2100 k, s
2300 o
2400 j
2400 h 1500 c
2200 h
Specific heat capacity,c Jkg�K
810–960 k
850–860 h
900 o
920 k
1200–1900 l
840–1050 k
1000 j800 h 1100 h
1900 c
Layer thickness mm 40–200 o, p, q 100–300 p, r 100–300 o, p, q NAa(Qin, 2015) b(Li et al., 2013a) c(Gui et al., 2007) d(Golden & Kaloush, 2006) e(Monteith & Unsworth, 2013) f(Dobos, 2011) g(Hermansson, 2004) h(Minhoto et al., 2006) i(Tan & Fwa, 1992) j(Bentz & Turpin, 2007) k(Hu et al., 2017) l(Luca & Mrawira, 2005) m(Wang & Roesler, 2012) n(Im et al., 2015) o(Hall et al., 2012) p(ADOT, 2017b) q(FAA, 2016) r(USACE, 2018) s(Rafi & Aziz, 2019)
6 C. G. HOEHNE ET AL.

Department of Transportation (ADOT, 2017b) and typical pavement designs from literature in Table 1.
The selected pavement designs to estimate roadway and parking heat fluxes are simulated using the same specifications as the validation phase with two alterations: (1) measured solar radiation is replaced with estimated solar radiation using the ‘insol’ R package (Corripio, 2019) with inputs of local latitude, observed relative humidity, observed air temperature, Julian day, time of day, and an ozone thickness of 2.75 mm; and (2) all pavement designs for all dates are simulated under 1.0 SVF and 0.1 SVF to capture shaded and unshaded pave-ment scenarios. Estimated insolation is used to represent a clear day and avoid impacts of sporadic cloud cover. For full details on all parameters simulated, see Appendix S.1.
As pavements in the region are typically not comple-tely visible to the sky, the heat transfer of partially shaded pavements is incorporated by utilizing SVF data along the Phoenix roadway network from Middel et al. (2018) to calibrate heat transfer from pavements under direct solar radiation exposure versus pavements under shade. Moise and Aynsley (1999) found that incoming daylight shaded-to-unshaded radiation had a median ratio of 0.09 for horizontal shading and 0.11 for vertical shading. Therefore, we assume pavement in the shade receives 0.10 of estimated unshaded incoming radiation. This is implemented in modelling such that any areas where partial shade is present (SVF < 1.0), the portion of shaded pavement is treated as though it has 0.10 SVF and the unshaded portion has 1.0 SVF. For example, a neighborhood with 0.80 SVF would have 80% of pave-ment modeled as unshaded (SVF = 1.0), and 20% of the pavement that is shaded is modeled with a SVF of 0.10. All pavements (parking and roadway) are are assigned a measured SVF along the roadway in the 250 m2 cell with exceptions for extremely high cases of parking. Properties that require large amounts of parking are increasingly likely to be underground or inside a parking structure.
Therefore, for properties requiring greater than 100 spaces, we assume a conservative approach where park-ing area visible to the sky follows a non-linear decay under such that properties at 100 spaces have an unad-justed parking SVF of 1.0 which decays to a mean SVF of 0.325 at 100,000 spaces. While these assumptions for high densities of parking are difficult to validate given the lack of research and data on parking and SVFs, these are edge cases; only 497 properties of the 1.55 million in the urbanized area have greater than 1,000 parking spaces. However, if left unadjusted, numerous adjacent 250 m2
are otherwise found to be entirely covered by parking pavement. For details on the specific parking SVF decay functions assumed, see Appendix S.2.
Metropolitan-wide vehicle travel data are combined with vehicle efficiencies to estimate vehicle waste heat during operation from energy consumption by OSM roadway link. The partial amount of consumed energy wasted as heat is uniformly attributed to the traversed roadway link. Vehicle travel data are obtained from a MATSim regional travel demand model that utilizes travel and population data provided by the Maricopa County Association of Governments. This obtained data represents all personal light duty vehicle trips across the regional OSM road network for a typical spring or fall day. This travel data excludes heavy duty vehicle travel such as freight and public transit, and due to a lack of similar high fidelity data, heavy vehicle traffic on links is not considered. A typical passenger vehicle may lose 60–64% of energy to heat during city driving and 56–60% of energy to heat during highway driving (DOE, 2019). Other academic literature cites ranges of 30% to 80% of fuel energy wasted as heat during vehicle operation (Hsiao et al., 2010; Shiho Kim et al., 2011; Orr et al., 2016; Rajoo et al., 2014; Yang & Stabler, 2009). Given the most commonly cited factor is ‘nearly two thirds,’ this analysis assumes a static mean of 65% of fuel energy lost as heat to the surrounding environment
Table 2. Assumptions for Pavement Design and Vehicle Travel Applied to the Phoenix Metropolitan Area. Vehicle energy released per kilometer is estimated from urban city and highway driving efficiencies from Davis and Boundy (2019) using a mean of 31.7 MJ per liter of gasoline or gasoline-equivalent fuel.
Generalized functional class description
Assumed mean pavement thickness
Assumed two-way road width or parking space area
Assumed coverage of asphalt vs. concrete pavement
Assumed energy released from traversed vehicles
Highway or freeway 280 mm 43 m 95% Asphalt 5% Concrete
356 Wh/km (40 MPGe)
Major or minor arterial road
210 mm 28 m 90% Asphalt 10% Concrete
561 Wh/km (25 MPGe)
Major or minor collector road
170 mm 18 m 90% Asphalt 10% Concrete
718 Wh/km (20 MPGe)
Minor collector or local road
140 mm 11 m 90% Asphalt 10% Concrete
718 Wh/km (20 MPGe)
Commercial parking 140 mm 31 m2 85% Asphalt 15% Concrete
NA
Residential Parking 140 mm 31 m2 10% Asphalt 90% Concrete
NA
SUSTAINABLE AND RESILIENT INFRASTRUCTURE 7

for all vehicles during travel. For this analysis, we focus on the heat lost during driving (65%) as a lower bound for vehicle heat emissions. When factoring in friction (e.g., braking, drag), it should be noted that as much as 93–97% of fuel energy is likely converted to heat with the remainder being stored in unburned hydrocarbons due to inefficient fuel combustion (Baglione et al., 2007; Wallington et al., 2006). Total energy consumed by vehi-cles for each link is calculated by multiplying total vehicle kilometers traveled (VKT) by the assumed traversed vehicle efficiency. As vehicle driving efficiencies depend on vehicle characteristics and driving patterns, different efficiencies are assigned by roadway functional class. Recent studies indicate light duty vehicle efficiencies can range widely (Davis & Boundy, 2019). In 2017, the estimated real-world fuel economy for US light duty vehicles was 10.6 km/L (24.9 mi/gal) (EPA, 2017). Vehicles are assumed to have the highest efficiency on highways and lowest efficiency on local roads. For details on the applied vehicle efficiencies, see Table 2. Vehicles dominantly emit waste heat as thermal radiation from the engine and brakes, and convection from the exhaust; impacts from tire friction and convective heat transfer from vehicle motion have been found to be insignificant, accounting for 1% or less of total balance near the road surface (Fujimoto et al., 2015). As a result, we consider only sensible heat emitted via exhaust and the engine.
3. Results
3.1. Evaluating Factors Influencing the Thermal Performance of Pavements
Across all seasons in Phoenix, asphalt and concrete pave-ments have greater diurnal outgoing sensible heat fluxes relative to the natural bare ground. The increase of out-going sensible heat flux from pavements relative to the bare ground is defined as the added sensible heat from pave-ments. Asphalt surfaced pavements have mean daily added sensible heat fluxes of 70 W m–2 relative to the bare ground (37% increase), and concrete-surfaced pavements have mean daily sensible heat fluxes of 33 for W m–2relative to the bare ground (15% increase). Figure 3 displays the summer and winter mean diurnal outgoing sensible heat fluxes for simulated asphalt pavements, concrete pave-ments, and bare ground (desert soil). The largest added sensible heat flux magnitudes from pavements occur in summer around 3 pm when asphalt surfaced pavements contribute 143 W m–2(46%) more than the natural ground, and concrete-surfaced pavements contribute 80 W m–2
(26%) more than the natural ground. During summer nights, added sensible heat from pavements is still signifi-cant with magnitudes of 44 W m–2 from asphalt surfaced
pavements and 18 W m–2 from concrete-surfaced pave-ments. During the winter, added sensible heat flux magni-tudes decline with daytime magnitudes of 110 W m–2 for asphalt surfaced pavements and 66 W m–2 for concrete- surfaced pavements. Nighttime winter added sensible heat flux magnitudes are 27 W m–2 asphalt-surfaced pavements and 10 W m–2 concrete-surfaced pavements.
A pavement’s daytime maximum outgoing sensible heat flux is most influenced by its albedo, while its nighttime minimum outgoing sensible heat flux is most influenced by its emissivity. An increase in albedo of 0.01 resulted in a decrease of maximum afternoon outgoing sensible heat fluxes by 5.5 W m–2 (95% confidence interval: 4.7 to 6.2 W m–2; R2 = 0.96; p < 0.001). A decrease in emissivity of 0.01 resulted in a decrease of minimum nighttime outgoing sensible heat fluxes by 1.4 W m–2 (95% confidence interval: 0.73 to 2.0 W m–2; R2 = 0.69; p < 0.001). Albedo more strongly impacts maximum (daytime) sensible heat fluxes because albedo impacts the fraction of incoming solar radiation which occurs only during sunlight hours.
In addition to albedo and emissivity, altering a pavement’s thermal inertia properties has noticeable impacts on the diurnal sensible heat flux magnitudes. Thermal inertia describes the slowness of material to approach thermal equilibrium (e.g., high thermal inertia materials are slower to reach thermal equilibrium) and is equivalent to the square-root of the product of the thermal conductivity (k), density (ρ), and specific heat capacity (c) with SI units of J m−2 K−1 s−1/2. An increase in a pavement surface layer thermal inertia by 100 J m−2 K−1 s−1/2 resulted in a decrease of maximum afternoon outgoingsensible heat fluxes 8.6 W m–2 (95% confidence interval: 1.1 to 16 W m–2; R2 = 0.57; p = 0.031) and an increase in minimum nighttime outgoing sensible heat fluxes by 1.7 W m–2 (95% confidence interval: 1.1 to 2.3 W m–2; R2 = 0.88; p < 0.001). Thermal conductivity was the most influential thermal inertia factor influencing minimum and maximum sensible heat fluxes, while specific heat capacity was the least impactful. With the exception of subsurface thermal conductivity, subsurface layer thermal inertia properties were insignificant in influencing the diurnal outgoing sensible heat fluxes at the surface.
To further explore the impact thermal inertia properties have on sensible heat flux magnitudes, the highest and lowest literature values of thermal conductivity, density, and specific heat capacity (Table 1) are compared with all other parameters constant to test a material’s dirurnal sen-sible heat flux sensitivity to its thermal inertia properties. Figure 4 displays diurnal outgoing heat fluxes from four different types of pavements with variations only to the thermal inertia properties. Overall, high thermal inertia pavements reduced the mean daily outgoing sensible heat flux across all seasons by 23 W m–2 compared to low
8 C. G. HOEHNE ET AL.

thermal inertia pavements (asphalt only: 28 W m–2; asphalt overlays on PCC: 26 W m–2; concrete only: 21 W m–2; and white-topped asphalt 19 W m–2). Low thermal inertia pavements increased maximum daytime outgoing sensible heat fluxes by 86 to 134 W m–2 relative to high thermal inertia pavements. During nighttime, low thermal inertia pavements decrease the minimum outgoing sensible heat fluxes by 15 to 23 W m–2 relative to high thermal inertia pavements. High thermal inertia pavements were found to have delayed maximum sensible heat flux magnitudes by up to 45 minutes for asphalt surfaced pavements and up to 60 minutes for concrete-surfaced pavements. Only the thermal inertia properties of a pavement’s surface layer were found to significantly affect a pavement’s thermal response. It should be noted that these results reflect a shorter timescale of these pavements’ thermal behavior, and over longer periods with fluctuating weather, a pavement’s thermal performance may differ.
3.2. Spatiotemporal Heat Fluxes from Pavements and Vehicles in Phoenix
Spatiotemporal heat fluxes from pavements and vehicles are assessed for a typical (seasonal) day at a resolution of 250 m2 for areas with at least 1% coverage of pavement. We find a mean daily added sensible heat flux from
pavement infrastructure and vehicle travel of 13 W m–2
across metro Phoenix for; roadway pavement contributes 8.5 W m–2, parking pavement contributes 3.6 W m–2, and vehicles contribute 0.49 W m–2. For areas with 10% or greater coverage of pavement infrastructure, the total mean daily heat flux rises to 19 W m–2. In more dense regions with high pavement coverage and vehicle travel, heat fluxes from vehicles and pavements may reach as high as 73 W m–2.
Pavement infrastructure typically dominates contribu-tions to the urban heat balance relative to waste heat from vehicle travel both spatially and temporally in metro Phoenix. This is true even given that ignoring vehicle braking heat losses might result in an underestimation of vehicle heat losses by up to 30%. Figure 5 displays the spatial variation in mean daily added sensible heat fluxes from roadways and pavements in metro Phoenix. Figure 6 displays the temporal variation in mean daily sensible heat fluxes from roadways and vehicles in metro Phoenix. Total heat from pavements and vehicles is comprised of 67% from roadway pavements, 29% from parking pave-ments, and 3.9% from light duty vehicles. However, dur-ing peak daytime travel periods, total heat from vehicles makes up 30% in the morning rush hour (8 am) and 18% in the evening rush hour (5 pm). These results agree with Fujimoto et al. (2015) which found vehicle heat fluxes
Figure 3. Mean Diurnal Outgoing Sensible Heat Flux for Simulated Asphalt Pavements, Concrete Pavements, and Bare Ground (Desert Soil) during Summer and Winter Periods. Outgoing sensible heat flux is defined as outgoing convection plus outgoing infrared radiation. All pavements are assumed as completely unshaded. For these simulations, asphalt surfaces had a mean albedo of 0.15, concrete surfaces had a mean albedo of 0.30, and the bare ground had a mean albedo of 0.40.
SUSTAINABLE AND RESILIENT INFRASTRUCTURE 9

accounted for 3–12% of total heat flux across a road sur-face with constant traffic.
Sensible heat flux magnitudes from vehicles can reach as high as 132 W m–2 over the highest traf-ficked highways during rush hour, making up 74% of the pavement-vehicle heat balance. However, the mean daily heat flux magnitudes from vehicles across all highway and arterial roads is much lower at 22 W m–2 and 17 W m–2, respectively. Across low-trafficked collector and local roads, vehicles contribute a daily average of 2.7 W m–2
and 0.64 W m–2 respectively while the pavement contributed a mean of 66 W m–2 (relative to unpaved natural ground). This indicates that areas surrounding major arterials and highways with high vehicle traffic are the only areas that would see measurable impacts to local climate as a result of vehicle use.
3.3. Pavement Heat Transfer Model ValidationAcross all validation simulations, modeled surface tem-peratures of various pavement designs were compared to the measured ASTER satellite land surface tempera-tures at the validation sites. Root Mean Square Error (RMSE) across all sites and pavements was 5.2°C and Mean Absolute Error (MAE) was 4.4°C. Figure 7 shows the modeled versus observed surface temperatures by season and time of day. Seasonality had little effect on errors with spring and summer having slightly higher MAE of 4.3°C and 4.8°C than winter and fall MAE of 4.2°C and 4.0°C. Daytime predicted surface tempera-tures had an MAE of 4.6°C versus 4.1°C for night-time predictions. The most accurate concrete surfaced pave-ment design was a 200 mm thick PCC pavement with low albedo (2.7°C MAE), and a 140 mm asphalt pave-ment (3.1°C MAE). Asphalt pavements typically had higher predicted surface temperatures than the ASTER
Figure 4. Comparison of Outgoing Sensible Heat Fluxes for High and Low Thermal Inertia Properties across Four Simulated Pavement Types. The first layer (L1) and second layer (L2) thermal inertias (TI) are displayed for each simulated case in J m−2 K−1 s−1/2. All nonthermal inertia parameters were held constant. Composite pavement design in (b) and (d) are identical to pavements (a) and (b) respectively with only the additional asphalt and concrete overlay. All pavements are assumed as completely unshaded.
10 C. G. HOEHNE ET AL.

Figure 5. Mean daily added sensible heat flux from roadway pavements, parking pavements, and vehicles in metropolitan Phoenix, AZ (urbanized Maricopa County) at a 250 m2 resolution. Only light duty vehicle travel is included. Cells with less than 1.0 W m–2 are ignored.
Figure 6. Mean Diurnal Sensible Heat Flux over Roadways from Pavements and Vehicles. Heat fluxes are averaged across the roadway area only. Pavement heat fluxes are for an unshaded pavement. Vehicle travel before 4:30am is not present in the travel data and therefore vehicle heat fluxes before this time are not estimated and shown as zero.
SUSTAINABLE AND RESILIENT INFRASTRUCTURE 11

observed surface temperatures (Figure 7a). There are a number of reasons that may cause this discrepancy, but the most likely factor is differing in-situ albedos because albedo is the strongest single parameter to pre-dict pavement surface temperature. While sites selected are nearly covered by a uniform material, small amounts of non-asphalt materials may alter the average ASTER pixel albedo and thermal properties, causing less absorbed and retained heat over time. For example, one site of an asphalt parking lot had a small amount of concrete, vegetation, and white stripping paint.
3.4. Sensitivity and UncertaintyGiven limitations of the imposed methodology, predic-tion errors observed in validation are most likely attrib-uted to: (a) omission of latent heat fluxes; (b) differing in-situ pavement design and soil compositions than assumed; (c) limitations of the available weather data in explaining the site microclimate; and pixel obstruc-tions such as from shade, cars (on parking lots), or other objects that would influence the land surface tempera-tures detected by ASTER. While omitting latent heat flux transfer in simulating the surface heat balance of
pavements is common especially in arid climates (Gui et al., 2007; Hermansson, 2004), the heat balance of soils may be more impacted by latent heat transfer. Days with precipitation were ignored to minimize the potential impact of latent heat transfer at validation sites. In arid climates like Phoenix, dry soils typically have latent heat fluxes well below an order of magnitude than sensible heat (Albertson et al., 1995), but may peak as high as 50 W m–2 at the surface during morning hours (Heusinkveld et al., 2004). A previous study found dou-bling or halving the latent heat flux in a dry soil caused +0.4 and – 1.4 C or less change to the maximum soil surface temperatures (Nobel & Geller, 1987). Given these findings, it is expected that ignoring latent heat transfer in bare soils may have marginal impacts on estimations of total added heat from pavements but would not significantly alter the trends of added sensible heat presented in the results.
A number of other factors of urban vehicle travel and pavement infrastructure design may influence the sen-sitivity and uncertainty of sensible heat flux magnitudes such as roadway design widths, vehicle driving efficien-cies, asphalt versus concrete pavement coverage, and the intensive properties of a pavement. The sensitivity and
Figure 7. Modeled Versus Observed Surface Temperatures for Four Material Classes by Season and Time of Day. Note that not all sites had ASTER observations for every simulation date.
12 C. G. HOEHNE ET AL.

uncertainty of the results are evaluated by simulating high and low estimates for many of these factors. Assuming smaller roadway widths, increased vehicle efficiencies, increased use of concrete pavements relative to asphalt, and smaller heat flux magnitudes from pave-ments relative to the ground, mean daily added sensible heat flux of from pavement and anthropogenic heat from vehicles could decrease from 13 W m–2 to 6.1 W m–2 across metro Phoenix. Conversely, mean daily added sensible heat flux from pavement infrastructure and anthropogenic heat from vehicle travel could increase to 19 W m–2 across the urban area with the opposite of aforementioned assumptions (e.g., wider roads, increased vehicle waste heat during travel, etc.). In both of the extreme cases, contributions from vehi-cles are marginal across the whole urbanized area, accounting for 0.38 to 0.60 W m–2. Roadway pavement heat contributions have a total sensitivity of 3.2 to 13.7 W m–2, and parking pavements a sensitivity of 2.5 to 4.8 W m–2.
4. Discussion
Previous estimates of anthropogenic heating from build-ings, vehicles, and metabolism are similar in magnitude to this analysis of only pavement and vehicle heating in metro Phoenix. Anthropogenic heat fluxes in cities (excluding pavements) commonly range from 2 to 60 W m–2 during the summer to 4 to 210 W m–2 in the winter, with buildings contributing the highest propor-tions, followed by contributions from vehicles and mar-ginal contributions from metabolic activity (Allen et al., 2011; Sailor & Lu, 2004; Taha, 1997). Allen et al. (2011) found mean urban anthropogenic heat fluxes from build-ings, vehicles, and metabolic processes to be 20 W m–2
across London and 60 W m–2 across Tokyo. Smith et al. (2009) quantified heat fluxes in greater Manchester, UK from buildings, traffic, and metabolism at the same spatial resolution of this study (250 m2) and found mean heat emission of 6.12 W m–2, reaching as high as 23 W m–2 in city center areas. In greater Manchester (1,960 people per km2), buildings accounted for approximately 3.67 W m–2 and vehicles accounted for 1.96 W m–2
while in greater Phoenix (1,210 people per km2), pave-ment contributions alone accounted for 12.1 W m–2 but a smaller amount from vehicles of 0.49 W m–2. Given that higher anthropogenic heating typically occurs in the win-ter due to increased building energy use, relative contri-butions from pavement infrastructure may be much more significant in the summer. Sailor and Lu (2004) estimated peak summer anthropogenic heat fluxes of 30–60 W m–2 in Chicago, San Francisco, and Philadelphia, but the less dense Atlanta and Salt Lake
City had peaks less than 15 W m–2. This study finds heat fluxes from pavements in Phoenix relative to the native ground reach as high as 70 W m–2 at 250 m2
resolution and 143 W m–2 directly over the pavement during summer afternoons. This indicates pavement infrastructure may make up a significant portion of urban heat fluxes, especially during summers and in more sprawled urban areas. However, more research is needed that compares pavements to other anthropogenic sources for the same region, scale, and time period.
Many studies quantify urban anthropogenic heat from buildings, vehicles, and metabolic processes, but none considers the added heat from pavement infra-structure within their scope. As a result, no research has quantified heat flux from pavements simultaneously with other anthropogenic heat sources. This may be because pavements do not waste heat through mechan-ical or metabolic processes, but heat from pavement infrastructure is undoubtedly a consequence of urban anthropogenic activity. While these outcomes for metro Phoenix may not be generalizable due to its climate, natural geology, and auto-centric urban design, pave-ment infrastructure contributes significantly to urban heating. Future research that aims to holistically quan-tify urban heat flux magnitudes should include esti-mates of added heating from pavement infrastructure and other unnatural surface materials in combination with typical anthropogenic sources. This is important at the city-wide and microclimate scale. Fully understand-ing the opportunities for related heat mitigation strate-gies (e.g., the impact of shading or changing SVF) may require including pavements in the local heat balance through microclimate, fluid, and coupling modeling approaches (Krayenhoff & Voogt, 2010; Wang et al., 2016). The approach presented herein should be adap-table for use in other urban domains and allow for future estimates of heat fluxes in cities to include added heat from pavement infrastructure.
Planning for urban density over urban sprawl may reduce urban heat contributions from the transporta-tion sector, but it is unclear if it would provide a net benefit to mitigating urban heat. Auto-centric urban design inhibits urban density and can lead to high coverage of pavement infrastructure supporting auto-mobile dependence. In metro Phoenix, total roadway pavement coverage is dominated by low-trafficked local and collector roads, often in residential neighborhoods, contributing to 56% of the total mean daily heat balance from all pavements and vehicles despite accounting for only 22% of the total daily VKT. An analysis of Atlanta found lower density residential developments contri-bute more radiant heat energy than higher density developments to surface heat island (Stone & Rodgers,
SUSTAINABLE AND RESILIENT INFRASTRUCTURE 13

2001). While parking pavements contribute a smaller fraction to the heat balance than roads, it is still signifi-cant and dominantly from paved parking lots. This sprawled urban design may be problematic for cities concerned with issues of urban heat and climate change; more sprawled urban metros have a higher prevalence and increased rate of extreme heat events after control-ling for climate and population growth (Stone et al., 2010). Increasing urban density could reduce automo-bile VKT and pavement infrastructure needs due to closer destinations, mixed-use planning, and more effective public transit, thus reducing the transportation sectors' influence on anthropogenic and pavement- added urban heat. Additionally, densification contri-butes to increased prevalence of urban canyons which improve human thermal comfort (Andreou & Axarli, 2012; Johansson, 2006; Middel et al., 2014). However, an issue still exists: cities with higher population densities consistently have higher estimates of total urban anthro-pogenic heat (Allen et al., 2011; Sailor & Lu, 2004). Yet these analyses exclude pavement infrastructure heat fluxes, so the implications of increased urban density on urban heat are unclear. As urban areas grow and tackle issues associated with urban heat and climate change, moving towards auto independence has path-ways to reducing urban heat, but more research and strategic planning are necessary to ensure desirable outcomes.
For a typical day across metro Phoenix, pavements contribute nearly 25 times as much heat to the urban heat balance compared to vehicles, but in some cases such as during rush hour in a densely traveled corridor, vehicles can contribute nearly three times as much as pavements to the local heat balance. When vehicle travel density is at its peak during rush hour, heat flux magni-tudes can reach 132 W m–2 directly over the roadway, while pavement can reach 143 W m–2. This indicates that during warmer months in hot climates, areas sur-rounding high-trafficked roads may be increasingly undesirable for outdoor travel or activities due to high amounts of added sensible heat from pavements and anthropogenic heating from dense vehicle travel. As a result, urban planning strategies to improve a community’s net thermal comfort during hot periods (especially late afternoons during the summer) should be cognizant of these issues and should consider target-ing active transportation developments away from cor-ridors with high pavement coverage and vehicle traffic.
Many strategies to mitigate urban heat through pave-ment design focus heavily on altering pavement albedo (Li et al., 2013b; Santamouris et al., 2012), but this study indicates there may be potential to mitigate the severity of urban heat by increasing the thermal inertia of
pavement infrastructure. While increasing pavement albedo can significantly reduce the total heat stored and emitted, it also comes at the sacrifice of increasing the incident reflected solar radiation. As a result, high albedo pavements may compromise the thermal com-fort of nearby pedestrians (Erell et al., 2014; Li et al., 2016), and may increase mean radiant temperatures experienced by 7.8°C (Taleghani et al., 2016). To avoid this drawback but still improve the thermal environ-ment through pavement design, increasing pavement thermal inertia may be a viable alternative. The feasi-bility of increasing pavement thermal inertia has rarely been discussed, but Yun et al. (2014) found using sur-rogate aggregates practical for reducing concrete ther-mal conductivities in building applications and noted that aggregate size does not appear to affect thermal behaviors. Increasing a pavement’s thermal inertia will slow its ability to warm and reach thermal equilibrium, resulting in an average decrease in daytime heat fluxes but an average increase in nighttime heat fluxes. During periods of extended heating or cooling, high thermal inertia pavements will more slowly warm up or cool off. As a result, the primary benefit of altering thermal inertia in pavements is likely reducing the extreme magnitudes of outgoing heat by offsetting the release of energy to nighttime or generally cooler periods. For example, this behavior could be beneficial in reducing the local heat severity during heat waves by increasing the pavement energy storage capacity and delaying heat emissions until less severe periods. Overall, the potential for high thermal inertia properties in pavements should be more deeply explored to flatten diurnal urban heat fluxes and potentially mitigate impacts of increasingly severe weather under climate change.
Planning strategies to reduce urban heat contributions from pavements could include increasing pavement shading, reducing surface parking lots through parking reform, or considering road diets. Previous research has established significant amounts of surface parking cover-age in many cities (Chester et al., 2015; Hoehne et al., 2019), and reforming parking standards can have many benefits (Shoup, 2017). The contribution of parking pave-ment to urban heat is not insignificant, and cities, espe-cially in sprawling hot climates like Phoenix, may consider this another argument for reforming parking standards and redesigning urban space to deemphasize pavement coverage. Other options such as requiring shade structures in parking lots or planting trees around travel corridors may also promote cooler urban environ-ments. However, as pavements elevate surrounding soil temperatures, vaporation is accelerated, and nearby trees consequently need more water than usual. This is espe-cially problematic for hot climates since this trend
14 C. G. HOEHNE ET AL.

worsens as temperatures rise, and Phoenix is already constrained on water use. Another common suggestion is to cover parking lots with solar panels for shade in addition to their primary purpose of capturing solar energy. However, a study of solar installations over asphalt parking lots in Phoenix actually found they may warm the local environment (Pham et al., 2019). This leads to pavement whitetopping and solar panel shading being more context-specific solutions to alleviating pave-ment-related heat, while reducing urban pavement cover-age is likely a more ubiquitous strategy.
4.1. Limitations
Some limitations of this analysis exist as a consequence of the analysis region, selected methodologies, and available data. Only sensible heat fluxes are estimated for clear and dry conditions in metro Phoenix. Some aspects of heat transfer between vehicles and pavements are not consid-ered. Vehicles traversing or parked over pavement will provide transient shading, blocking marginal amounts of incoming solar radiation during the daytime. Some wasted heat from vehicles may also affect the surface temperature of the pavement through friction and downward heat flux from the bottom of the vehicle. Vehicles traveling over a roadway will also induce convection at the roadway sur-face by generating airflow from their motion. Additionally, the impact of vehicles shading the roadways is not consid-ered. We suspect these heat transfer mechanisms between roads and vehicles to be marginal; previous research has established that friction warming and convective cooling from vehicle motion to be insignificant to the overall pave-ment surface temperature fluctuations (Fujimoto et al., 2015). While this analysis assesses vehicle heat generated during vehicle operation, some vehicle heat will also be emitted shortly after vehicle operation which is not con-sidered. This additional amount of wasted heat from travel will primarily at controlled intersections and parking des-tinations, creating additional heat surrounding highly paved areas (e.g., shopping centers). In addition to weather, some pavement heat transfer model inputs differ by time of day (albedo, SVF) affecting diurnal heat flux magnitudes. Waste heat from heavy vehicle traffic (e.g., freight, transit vehicles) is not assessed, likely leading to under estimation magnitude of heat fluxes on and near highways. Limited availability of travel data and established vehicle waste modeling methods made it difficult to assess how changing traffic patterns could spatiotemporally affect heating. When considering city driving and increased prevalence of braking, it is likely that more than 97% of fuel energy is converted to heat into calipers, tires, and the road surface through friction. Therefore, heat emissions from vehicle travel presented in this study are likely a conservative
estimate. Despite this, vehicle heat emissions are often significantly overshadowed by the added sensible heat from pavements. More accurate vehicle drive cycle model-ing paired with microtraffic simulations could be valuable to improve the accuracy of estimating vehicle’s contribu-tions to heat flux magnitudes at local scales.
5. Conclusion
An analysis was conducted to quantify contributions to urban heat from vehicle travel and pavement infrastructure in metropolitan Phoenix, Arizona to help understand how city planning and the transportation sector can influence urban heat. Pavement infrastructure typically dominates contributions to the urban heat balance relative to waste heat from vehicle travel both spatially and temporally in metro Phoenix. Relative to the natural ground, pavement infrastructure contributes the most to the Phoenix urban heat balance during summer afternoons. Vehicles may contribute significant amounts of heat but only in high travel corridors during rush hours. Urban densification could mitigate urban heat contributions from the transpor-tation sector by promoting less auto-dependent infrastruc-ture, mixed use, and higher density transit. To promote pedestrian thermal comfort, active transportation plans could separate active transit corridors from high- trafficked roadways and incorporate targets to reduce nearby pavement coverage and traffic density. Altering pavement design to achieve high thermal inertia properties in pavements should be more deeply explored as a method to mitigate impacts of increasingly severe daytime heat in urban areas. Future research should consider quantifying added heat from pavement infrastructure in addition to anthropogenic heating for a more holistic understanding of urban heat flux magnitudes.
Acknowledgments
Funding for the research was made possible by a Dwight David Eisenhower Transportation Fellowship (#693JJ31845020) and the following National Science Foundation awards: A Simulation Platform to Enhance Infrastructure and Community Resilience to Extreme Heat Events (#1635490); and Urban Resilience to Extremes Sustainability Research Network (#1444755).
Disclosure statement
The authors declare no competing interests.
Funding
This work was supported by the Federal Highway Administration [693JJ31845020]; National Science Foundation [1444755]; National Science Foundation [1635490].
SUSTAINABLE AND RESILIENT INFRASTRUCTURE 15

Notes on contributors
Christopher G. Hoehne, Ph.D is a research scientist focused on understanding the energy and socioeconomic impacts of urban transportation systems to embolden pathways towards sustainable, equitable, and productive mobility.
Mikhail V. Chester, Ph.D. is Director of the Metis Center for Infrastructure and Sustainable Engineering at ASU and focuses on preparing infrastructure and their institutions for the challenges of the coming century.
David J. Sailor, Ph.D. is a Professor in Geographical Sciences and Urban Planning and Director of the Urban Climate Research Center at ASU who researches the intersection of climate with the built environment.
David A. King, Ph.D. is an Assistant Professor in Geographical Sciences and Urban Planning at ASU who focuses on intersections between transportation, land use, and economics.
ORCID
Christopher G. Hoehne http://orcid.org/0000-0002-9904- 2256Mikhail V. Chester http://orcid.org/0000-0002-9354-2102David J. Sailor http://orcid.org/0000-0003-1720-8214David A. King http://orcid.org/0000-0002-8401-6514
References
ADOT, (Arizona Department of Transportation). (2017a). ADOT’s use of rubberized asphalt gives new life to recycled tires. Retrieved from March 26, 2019 https://www.azdot. gov/mobile/media/news/2017/05/11/adot-s-use-of- rubberized-asphalt-gives-new-life-to-recycled-tires
ADOT, (Arizona Department of Transportation). (2017b). Pavement Design Manual. Retrieved from https://apps. azdot.gov/files/materials-manuals/Preliminary- Engineering-Design/PavementDesignManual.pdf
ADOT, (Arizona Department of Transportation). (2019). Quiet Pavement Program. Retrieved from https://www. azdot.gov/business/environmental-planning/programs/ quiet-pavement-program
Akbari, H., Rose, L. S., & Taha, H. (1999). Characterizing the fabric of the urban environment: A case study of Sacramento, California. Lawrence Berkeley National Laboratory. Berkeley, CA. doi:10.2172/764362
Akbari, H., Shea Rose, L., & Taha, H. (2003). Analyzing the land cover of an urban environment using high-resolution orthophotos. Landscape and Urban Planning, 63(1), 1–14. doi:10.1016/S0169-2046(02)00165-2
Albertson, J. D., Parlange, M. B., Katul, G. G., Chu, C. R., Stricker, H., & Tyler, S. (1995). Sensible Heat Flux From Arid Regions: A Simple FluxVariance Method. Water Resources Research, 31(4), 969–973. doi:10.1029/ 94WR02978
Allen, L., Lindberg, F., & Grimmond, C. S. B. (2011). Global to city scale urban anthropogenic heat flux: Model and variability. International Journal of Climatology, 31(13), 1990–2005. doi:10.1002/joc.2210
Andreou, E., & Axarli, K. (2012). Investigation of urban can-yon microclimate in traditional and contemporary envir-onment. Experimental investigation and parametric analysis. Renewable Energy, 43, 354–363. doi:10.1016/j. renene.2011.11.038
Arnfield, A. J. (2003). Two decades of urban climate research: A review of turbulence, exchanges of energy and water, and the urban heat island. International Journal of Climatology, 23(1), 1–26. doi:10.1002/joc.859
Arnfield, A. J., & Grimmond, C. S. B. (1998). An urban canyon energy budget model and its application to urban storage heat flux modeling. Energy and Buildings, 27(1), 61–68. doi:10.1016/S0378-7788(97)00026-1
Asaeda, T., Ca, V. T., & Wake, A. (1996). Heat storage of pavement and its effect on the lower atmosphere. Atmospheric Environment, 30(3), 413–427. doi:10.1016/ 1352-2310(94)00140-5
Baglione, M., Duty, M., & Pannone, G. (2007). April). Vehicle System Energy Analysis Methodology and Tool for Determining Vehicle Subsystem Energy Supply and Demand. doi:10.4271/2007-01-0398
Bentz, D. P., & Turpin, R. (2007). Potential applications of phase change materials in concrete technology. Cement and Concrete Composites, 29(7), 527–532. doi:10.1016/j. cemconcomp.2007.04.007
Bondank, E. N., Chester, M. V., & Ruddell, B. L. (2018). Water Distribution System Failure Risks with Increasing Temperatures [Research-article]. Environmental Science & Technology, 52(17), 9605–9614. doi:10.1021/acs.est.7b01591
Burillo, D., Chester, M. V., Pincetl, S., Fournier, E. D., & Reyna, J. (2019). Forecasting peak electricity demand for Los Angeles considering higher air temperatures due to climate change. Applied Energy, 23(6), 1–9. (November2018). doi:10.1016/j.apenergy.2018.11.039
Carnielo, E., & Zinzi, M. (2013). Optical and thermal char-acterisation of cool asphalts to mitigate urban temperatures and building cooling demand. Building and Environment, 60, 56–65. doi:10.1016/j.buildenv.2012.11.004
CDC, (Centers for Disease Control and Prevention). (2012). Number of Heat-Related Deaths, by Sex, United States, 1999–2010. National Vital Statistics System, 61(36), 729.
Çengel, Y. (2002). Heat Transfer: A Practical Approach (2nd ed.). New York: Mcgraw-Hill.
Chester, M., Fraser, A., Matute, J., Flower, C., & Pendyala, R. (2015). Parking Infrastructure: A Constraint on or Opportunity for Urban Redevelopment? A Study of Los Angeles County Parking Supply and Growth. Journal of the American Planning Association, 81(4), 268–286. doi:10.1080/01944363.2015.1092879
Chiasson, A. D., Spitler, J. D., Rees, S. J., & Smith, M. D. (2000). A Model for Simulating the Performance of a Pavement Heating System as a Supplemental Heat Rejecter with Closed-Loop Ground-Source Heat Pump Systems. Journal of Solar Energy Engineering, 122(4), 183. doi:10.1115/1.1330725
Clark, S. S., Chester, M. V., Seager, T. P., & Eisenberg, D. A. (2019). The vulnerability of interde-pendent urban infrastructure systems to climate change: Could Phoenix experience a Katrina of extreme heat? Sustainable and Resilient Infrastructure, 4(1), 21–35. doi:10.1080/23789689.2018.1448668
Corripio, J. G. (2019). Insol: Solar Radiation. Retrieved from https://meteoexploration.com/R/insol/index.html
16 C. G. HOEHNE ET AL.

Dai, Z., Guldmann, J. M., & Hu, Y. (2018). Spatial regression models of park and land-use impacts on the urban heat island in central Beijing. Science of the Total Environment, 626, 1136–1147. doi:10.1016/j.scitotenv.2018.01.165
Davis, S. C., & Boundy, R. G. (2019). Transportation Energy Data Book: Edition 37. Retrieved from http://cta.ornl.gov/data
Dempsey, B. J., & Thompson, M. R. (1970). A Heat Transfer Model for Evaluating Frost Action and Temperature-Related Effects in Multilayered Pavement Systems. Highway Research Record, (342) Retrieved from https://trid.trb.org/view/102331
Dobos, E. (2011). Encyclopedia of Soil Science, 2nd. doi:10.1081/E-ESS
DOE, (U.S. Department of Energy). (2019). Where the Energy Goes: Gasoline Vehicles. Retrieved from March 28, 2019 https://www.fueleconomy.gov/feg/atv.shtml
Eisenman, D. P., Wilhalme, H., Tseng, C., Chester, M., English, P., Pincetl, S., . . . Dhaliwal, S. K. (2016). Heat Death Associations with the built environment, social vulnerability and their interactions with rising temperature. Health & Place, 41, 89–99. doi:10.1016/j.healthplace.2016.08.007
EPA, (Environmental Protection Agency). (2016). Scrap Tires. Retrieved from March 26, 2019https://archive.epa.gov/epa waste/conserve/materials/tires/web/html/live.html
EPA, (Environmental Protection Agency). (2017). Automotive Trends Report 2018. EPA-420-R-19-002. Retrieved from https://www.epa.gov/automotive-trends /download-data-automotive-trends-report
Erell, E., Pearlmutter, D., Boneh, D., & Kutiel, P. B. (2014). Effect of high-albedo materials on pedestrian heat stress in urban street canyons. Urban Climate, 10(P2), 367–386. doi:10.1016/j.uclim.2013.10.005
FAA, (Federal Aviation Administration). (2016). Airport Pavement Design and Evaluation. U.S. Department of Transportation, Washington D.C. doi:org/150/5320-6F
Fujimoto, A., Saida, A., Fukuhara, T., & Futagami, T. (2015). Heat Transfer Analysis on Road Surface. Retrieved from https:// www.researchgate.net/publication/268351732%0AHEAT
Gasparrini, A., Guo, Y., Hashizume, M., Lavigne, E., Zanobetti, A., Schwartz, J., . . . Armstrong, B. (2015). Mortality risk attributable to high and low ambient tempera-ture: A multicountry observational study. The Lancet, 386 (9991), 369–375. doi:10.1016/S0140-6736(14)62114-0
Gasser, P., Lustenberger, P., Cinelli, M., Kim, W., Spada, M., Burgherr, P., . . . Sun, T. Y. (2019). A review on resilience assessment of energy systems. Sustainable and Resilient Infrastructure, 00(00), 1–27. doi:10.1080/23789689.2019.1610600
Golden, J. S., & Kaloush, K. E. (2006). Mesoscale and micro-scale evaluation of surface pavement impacts on the urban heat island effects. International Journal of Pavement Engineering, 7(1), 37–52. doi:10.1080/10298430500505325
Graff Zivin, J., & Neidell, M. (2014). Temperature and the Allocation of Time: Implications for Climate Change. Journal of Labor Economics, 32(1), 1–26. doi:10.1086/671766
Gui, J., Phelan, P. E., Kaloush, K. E., & Golden, J. S. (2007). Impact of Pavement Thermophysical Properties on Surface Temperatures. Journal of Materials in Civil Engineering, 19(8), 683–690. doi:10.1061/(ASCE)0899- 1561(2007)19:8(683)
Hall, M. R., Dehdezi, P. K., Dawson, A. R., Grenfell, J., & Isola, R. (2012). Influence of the Thermophysical Properties
of Pavement Materials on the Evolution of Temperature Depth Profiles in Different Climatic Regions. Journal of Materials in Civil Engineering, 24(1), 32–47. doi:10.1061/ (ASCE)MT.1943-5533.0000357
Hart, M. A., & Sailor, D. J. (2009). Quantifying the influence of land-use and surface characteristics on spatial variability in the urban heat island. Theoretical and Applied Climatology, 95(3–4), 397–406. doi:10.1007/s00704-008-0017-5
Heath, M. T. (2002). Scientific computing: An introductory survey (2nd ed.). Boston, MA: McGraw-Hill.
Hermansson, Å. (2004). Mathematical model for paved surface summer and winter temperature: Comparison of calculated and measured temperatures. Cold Regions Science and Technology, 40(1–2), 1–17. doi:10.1016/j. coldregions.2004.03.001
Heusinkveld, B. G., Jacobs, A. F. G., Holtslag, A. A. M., & Berkowicz, S. M. (2004). Surface energy balance closure in an arid region: Role of soil heat flux. Agricultural and Forest Meteorology, 122(1–2), 21–37. doi:10.1016/j. agrformet.2003.09.005
Hoehne, C. G. (2019). Heat Transfer Modeling for Phoenix Urban Transportation-Heat Analysis. Retrieved from https://github.com/cghoehne/transport-uhi-phx
Hoehne, C. G., Chester, M. V., Fraser, A. M., & King, D. A. (2019). Valley of the sun-drenched parking space: The growth, extent, and implications of parking infrastructure in Phoenix. Cities, 89, 186–198. doi:10.1016/j.cities.2019.02.007
Holland, R. (2014). Estimating the Number of Parking Spaces Per Acre. Center for Profitable Agriculture, Institute of Agriculture, University of Tennessee website: https://ag. tennessee.edu/cpa/InformationSheets/CPA222.pdf
Hsiao, Y. Y., Chang, W. C., & Chen, S. L. (2010). A mathematic model of thermoelectric module with appli-cations on waste heat recovery from automobile engine. Energy, 35(3), 1447–1454. doi:10.1016/j.energy.2009.11.030
Hu, L., Li, Y., Zou, X., Du, S., Liu, Z., & Huang, H. (2017). Temperature Characteristics of Porous Portland Cement Concrete during the Hot Summer Session. Advances in Materials Science and Engineering. doi:10.1155/2017/2058034
Ichinose, T., Shimodozono, K., & Hanaki, K. (1999). Impact of anthropogenic heat on urban climate in Tokyo. Atmospheric Environment, 33(24–25), 3897–3909. doi:10.1016/S1352- 2310(99)00132-6
Im, J. S., Dessouky, S., Bai, B. C., Vo, H. V., & Park, D.-W. (2015). Thermal Properties of Asphalt Mixtures Modified with Conductive Fillers. Journal of Nanomaterials, (2015, 1–6. doi:10.1155/2015/926809
Johansson, E. (2006). Influence of urban geometry on outdoor thermal comfort in a hot dry climate: A study in Fez, Morocco. Building and Environment, 41(10), 1326–1338. doi:10.1016/j.buildenv.2005.05.022
Karner, A., Hondula, D. M., & Vanos, J. K. (2015). Heat exposure during non-motorized travel: Implications for transportation policy under climate change. Journal of Transport & Health, 2 (4), 451–459. doi:10.1016/j.jth.2015.10.001
Kenworthy, J. R., & Laube, F. B. (1999). Patterns of automo-bile dependence in cities: An international overview of key physical and economic dimensions with some implications for urban policy. Transportation Research Part A: Policy and Practice, 33(7–8), 691–723. doi:10.1016/S0965- 8564(99)00006-3
SUSTAINABLE AND RESILIENT INFRASTRUCTURE 17

Kim, M., Lee, K., & Cho, G. H. (2017). Temporal and spatial variability of urban heat island by geographical location: A case study of Ulsan, Korea. Building and Environment, 126(August), 471–482. doi:10.1016/j.buildenv.2017.10.023
Kim, S., Park, S., Kim, S., & Rhi, S.-H. (2011). A Thermoelectric Generator Using Engine Coolant for Light-Duty Internal Combustion Engine-Powered Vehicles. Journal of Electronic Materials, 40(5), 812–816. doi:10.1007/s11664- 011-1580-6
Kjellstrom, T., Holmer, I., & Lemke, B. (2009). Workplace heat stress, health and productivity – An increasing challenge for low and middle-income countries during climate change. Global Health Action, 2(1), 2047. doi:10.3402/gha.v2i0.2047
Kovats, R. S., & Hajat, S. (2008). Heat Stress and Public Health: A Critical Review. Annual Review of Public Health, 29(1), 41–55. doi:10.1146/annurev.publhealth.29.020907.090843
Krayenhoff, E. S., & Voogt, J. A. (2010). Impacts of urban albedo increase on local air temperature at daily-annual time scales: Model results and synthesis of previous work. Journal of Applied Meteorology and Climatology, 49(8), 1634–1648. doi:10.1175/2010JAMC2356.1
Li, H., Harvey, J., & Kendall, A. (2013a). Field measurement of albedo for different land cover materials and effects on thermal performance. Building and Environment, 59, 536–546. doi:10.1016/j.buildenv.2012.10.014
Li, H., Harvey, J. T., Holland, T. J., & Kayhanian, M. (2013b). The use of reflective and permeable pavements as a potential practice for heat island mitigation and storm-water management. Environmental Research Letters, 8(1), 015023. doi:10.1088/1748-9326/8/1/015023
Li, H., He, Y., & Harvey, J. (2016). Human Thermal Comfort: Modeling the Impact of Different Cool Pavement Strategies. Transportation Research Record: Journal of the Transportation Research Board, 2575(1), 92–102. doi:10.3141/2575-10
Luca, J., & Mrawira, D. (2005). New Measurement of Thermal Properties of Superpave Asphalt Concrete. Journal of Materials in Civil Engineering, 17(1), 72–79. doi:10.1061/ (ASCE)0899-1561(2005)17:1(72)
Manville, M., & Shoup, D. (2005). Parking, People, and Cities. Journal of Urban Planning and Development, 131(4), 233–245. doi:10.1061/(ASCE)0733-9488(2005)131:4(233)
Markolf, S. A., Hoehne, C. G., Fraser, A., & Chester, M. (2017). Maintaining reliability of transportation systems and interconnected infrastructure under climate change. International Conference on Sustainable Infrastructure 2017: Methodology - Proceedings of the International Conference on Sustainable Infrastructure 2017, New York, NY. 10.1061/9780784481196.020
Middel, A., Häb, K., Brazel, A. J., Martin, C. A., & Guhathakurta, S. (2014). Impact of urban form and design on mid-afternoon microclimate in Phoenix Local Climate Zones. Landscape and Urban Planning, 122, 16–28. doi:10.1016/j.landurbplan.2013.11.004
Middel, A., Lukasczyk, J., Maciejewski, R., Demuzere, M., & Roth, M. (2018). Sky View Factor footprints for urban climate modeling. Urban Climate, 25(April), 120–134. doi:10.1016/j.uclim.2018.05.004
Miller, N. L., Hayhoe, K., Jin, J., & Auffhammer, M. (2008). Climate, Extreme Heat, and Electricity Demand in California. Journal of Applied Meteorology and Climatology, 47(6), 1834–1844. doi:10.1175/2007JAMC1480.1
Minhoto, M. J. C., Pais, J. C., & Pereira, P. A. (2006). Asphalt Pavement Temperature Prediction. Asphalt Rubber 2006: Proceedings, Los Angeles, CA, 193–207. 10.1061/9780784413005.029
Moise, A. F., & Aynsley, R. (1999). Ambient ultraviolet radiation levels in public shade settings. International Journal of Biometeorology, 43(3), 128–138. doi:10.1007/ s004840050128
Monteith, J. L., & Unsworth, M. H. (2013). Principles of Environmental Physics: Plants, animals, and the atmosphere (4th ed.). Amsterdam: Academic Press.
NASA, (National Aeronautics and Space Administration). (2019). ASTER. Retrieved from March 14, 2019 https:// terra.nasa.gov/about/terra-instruments/aster
Nobel, P. S., & Geller, G. N. (1987). Temperature Modelling of Wet and Dry Desert Soils. The Journal of Ecology, 75(1), 247. doi:10.2307/2260549
Obradovich, N., & Fowler, J. H. (2017). Climate change may alter human physical activity patterns. Nature Human Behaviour, 1(April), 0097. doi:10.1038/s41562-017-0097
Oke, T. R. (1982). The energetic basis of the urban heat island. Quarterly Journal of the Royal Meteorological Society, 108 (455), 1–24. doi:10.1002/qj.49710845502
OpenStreetMap contributors. (2019). Planet dump Retrieved from https://www.openstreetmap.org/
Orr, B., Akbarzadeh, A., Mochizuki, M., & Singh, R. (2016). A review of car waste heat recovery systems utilising thermoelectric generators and heat pipes. Applied Thermal Engineering, 101, 490–495. doi:10.1016/j. applthermaleng.2015.10.081
Pham, J. V., Baniassadi, A., Brown, K. E., Heusinger, J., & Sailor, D. J. (2019). Comparing photovoltaic and reflective shade surfaces in the urban environment: Effects on surface sensible heat flux and pedestrian thermal comfort. Urban Climate, 29, 100500. doi:10.1016/j.uclim.2019.100500
Qin, Y. (2015). Urban canyon albedo and its implication on the use of reflective cool pavements. Energy and Buildings, 96, 86–94. doi:10.1016/j.enbuild.2015.03.005
Rafi, M. M., & Aziz, T. (2019). Experimental testing of fly ash containing recycled aggregate concrete exposed to high temperatures. Sustainable and Resilient Infrastructure, 00 (00), 1–16. doi:10.1080/23789689.2019.1681820
Rajoo, S., Romagnoli, A., Martinez-Botas, R., Pesiridis, A., Copeland, C., & Bin Mamat, A. M. I. (2014). Automotive exhaust power and waste heat recovery technologies. Automotive Exhaust Emissions and Energy Recovery (pp. 265–281). Hauppauge, NY: NOVA Science Publishers. doi:10.13140/2.1.4809.0565
Reddy, G. N., Venkatesan, V., & Maniyar, U. (2015). Estimation of harvestable energy from vehicle waste heat. 2015 International Conference on Renewable Energy Research and Applications (ICRERA), Palermo, 618–625. https://doi.10.1109/ICRERA.2015.7418487
Reyna, J. L., & Chester, M. V. (2017). Energy efficiency to reduce residential electricity and natural gas use under climate change. Nature Communications, 8(1), 14916. doi:10.1038/ncomms14916
Sailor, D. J., & Lu, L. (2004). A top–down methodology for developing diurnal and seasonal anthropogenic heating profiles for urban areas. Atmospheric Environment, 38(17), 2737–2748. doi:10.1016/j.atmosenv.2004.01.034
18 C. G. HOEHNE ET AL.

Santamouris, M., Gaitani, N., Spanou, A., Saliari, M., Giannopoulou, K., Vasilakopoulou, K., & Kardomateas, T. (2012). Using cool paving materials to improve microcli-mate of urban areas – Design realization and results of the flisvos project. Building and Environment, 53, 128–136. doi:10.1016/j.buildenv.2012.01.022
Schaeffer, R., Salem, A., Frossard, A., Lucena De, P., Soares, B., Cesar, M., . . . Sadeck, M. (2012). Energy sector vulnerability to climate change: A review. Energy, 38(1), 1–12. doi:10.1016/j.energy.2011.11.056
Shoup, D. (2017). The high cost of free parking: Updated edition. New York, NY: Routledge.
Smith, C., Lindley, S., & Levermore, G. (2009). Estimating spatial and temporal patterns of urban anthropogenic heat fluxes for UK cities: The case of Manchester. Theoretical and Applied Climatology, 98(1–2), 19–35. doi:10.1007/s00704-008-0086-5
Stamatakis, E., Nnoaham, K., Foster, C., & Scarborough, P. (2013). The influence of global heating on discretionary physical activity: An important and overlooked conse-quence of climate change. Journal of Physical Activity & Health, 10(6), 765–768. 10.1123/jpah.10.6.765
Stone, B., Hess, J. J., & Frumkin, H. (2010). Urban form and extreme heat events: Are sprawling cities more vulnerable to climate change than compact cities? Environmental Health Perspectives, 118(10), 1425–1428. doi:10.1289/ehp.0901879
Stone, B., & Rodgers, M. O. (2001). Urban Form and Thermal Efficiency: How the Design of Cities Influences the Urban Heat Island Effect. Journal of the American Planning Association, 67(2), 186–198. doi:10.1080/01944360108976228
Sun, R., Xie, W., & Chen, L. (2018). A landscape connectivity model to quantify contributions of heat sources and sinks in urban regions. Landscape and Urban Planning, 178, (September2017) 43–50. 10.1016/j.landurbplan.2018.05.015
Taha, H. (1997). Urban climates and heat islands: Albedo, evapotranspiration, and anthropogenic heat. Energy and Buildings, 25(2), 99–103. doi:10.1016/S0378-7788(96) 00999-1
Taleghani, M., Sailor, D., & Ban-Weiss, G. A. (2016). Micrometeorological simulations to predict the impacts of
heat mitigation strategies on pedestrian thermal comfort in a Los Angeles neighborhood. Environmental Research Letters, 11(2), 2. doi:10.1088/1748-9326/11/2/024003
Tan, S. A., & Fwa, T. F. (1992). Influence of pavement materi-als on the thermal environment of outdoor spaces. Building and Environment, 27(3), 289–295. doi:10.1016/0360- 1323(92)90030-S
University of Utah. (2019). MesoWest Data. Retrieved from March 14, 2019 https://mesowest.utah.edu/
USACE, (United States Army Corps of Engineers). (2018). Unified Facilities Criteria. Washington D.C: U.S. Department of the Army. doi:org/UFC3-201-01
USGS, (United States Geological Survey). (2018). On Demand Surface Kinetic Temperature. Washington D.C: U.S. Department of the Interior. doi:10.5067/ASTER/ AST_08.003
Wallington, T. J., Kaiser, E. W., & Farrell, J. T. (2006). Automotive fuels and internal combustion engines: A chemical perspective. Chemical Society Reviews, 35(4), 335. doi:10.1039/b410469m
Wang, D., & Roesler, J. R. (2012). One-Dimensional Rigid Pavement Temperature Prediction Using Laplace Transformation. Journal of Transportation Engineering, 138(9), 1171–1177. doi:10.1061/(ASCE) TE.1943-5436.000041
Wang, Y., Berardi, U., & Akbari, H. (2016). Comparing the effects of urban heat island mitigation strategies for Toronto, Canada. Energy and Buildings, 114, 2–19. doi:10.1016/j.enbuild.2015.06.046
Wicki, A., Parlow, E., & Feigenwinter, C. (2018). Evaluation and Modeling of Urban Heat Island Intensity in Basel, Switzerland. Climate, 6(3), 55. doi:10.3390/cli6030055
Yang, J., & Stabler, F. R. (2009). Automotive Applications of Thermoelectric Materials. Journal of Electronic Materials, 38(7), 1245–1251. doi:10.1007/s11664-009-0680-z
Yun, T. S., Jeong, Y. J., & Youm, K.-S. (2014). Effect of Surrogate Aggregates on the Thermal Conductivity of Concrete at Ambient and Elevated Temperatures. The Scientific World Journal, (2014, 1–9. doi:10.1155/2014/ 939632
SUSTAINABLE AND RESILIENT INFRASTRUCTURE 19