urban and real estate economics - eltinga
TRANSCRIPT

Urban and real estate economicsUrban and real estate economicsSponsored by a Grant TÁMOP-4.1.2-08/2/A/KMR-2009-0041
Course Material Developed by Department of Economics,
Faculty of Social Sciences, Eötvös Loránd University Budapest (ELTE)
Department of Economics, Eötvös Loránd University Budapest
Institute of Economics, Hungarian Academy of Sciences
Balassi Kiadó, Budapest

ELTE Faculty of Social Sciences, Department of Economics
Urban and real estate economicsUrban and real estate economics
Author: Áron HorváthAuthor: Áron Horváth
Supervised by Áron Horváth
June 2011

Urban and real estate economicsUrban and real estate economics
Week 8The macroeconomics of the real estate
market Imarket I
The 4-quadrant modelThe 4-quadrant model
Áron Horváth
ContentsContents
1. Aggregate variables describing the real 1. Aggregate variables describing the real estate market
2. The 4-quadrant model2. The 4-quadrant model
The macroeconomics of the real
estate marketSo far:So far:• What does the value of certain real
estates depend on?estates depend on?Now: • How do the real estate prices evolve in • How do the real estate prices evolve in
general?• It can also be seen as if we studied the • It can also be seen as if we studied the
constant in the hedonic regression.This approach gets more attention before This approach gets more attention before
and after the crisis than previously.
1. Aggregate variables 1. Aggregate variables
describing the real estate describing the real estate
marketmarket
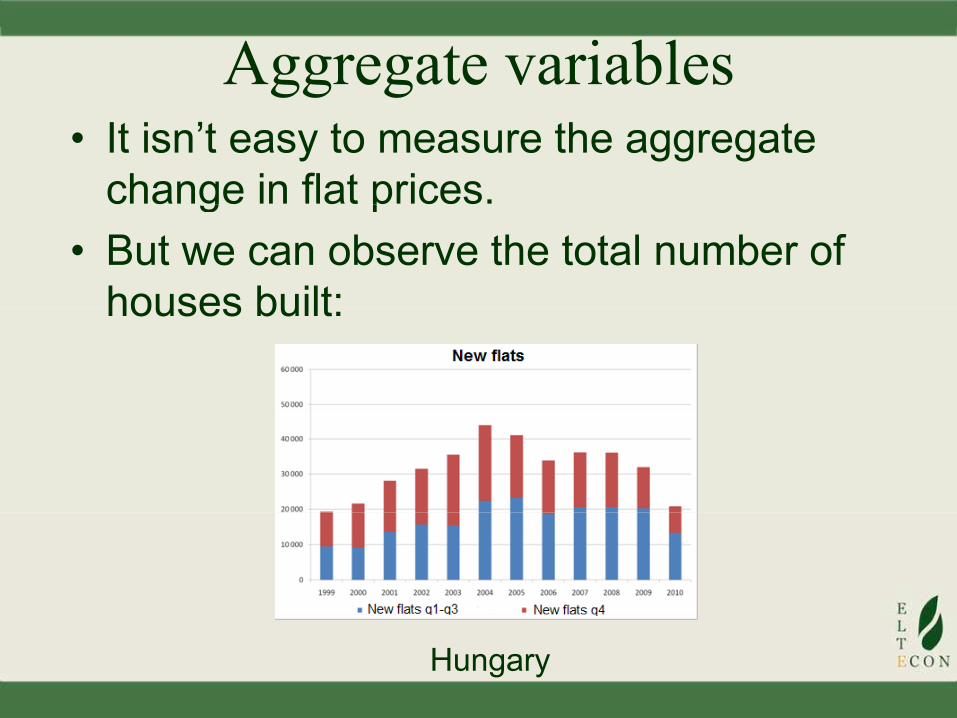
Aggregate variables• It isn’t easy to measure the aggregate change in flat prices.change in flat prices.
• But we can observe the total number of houses built:houses built:
Hungary
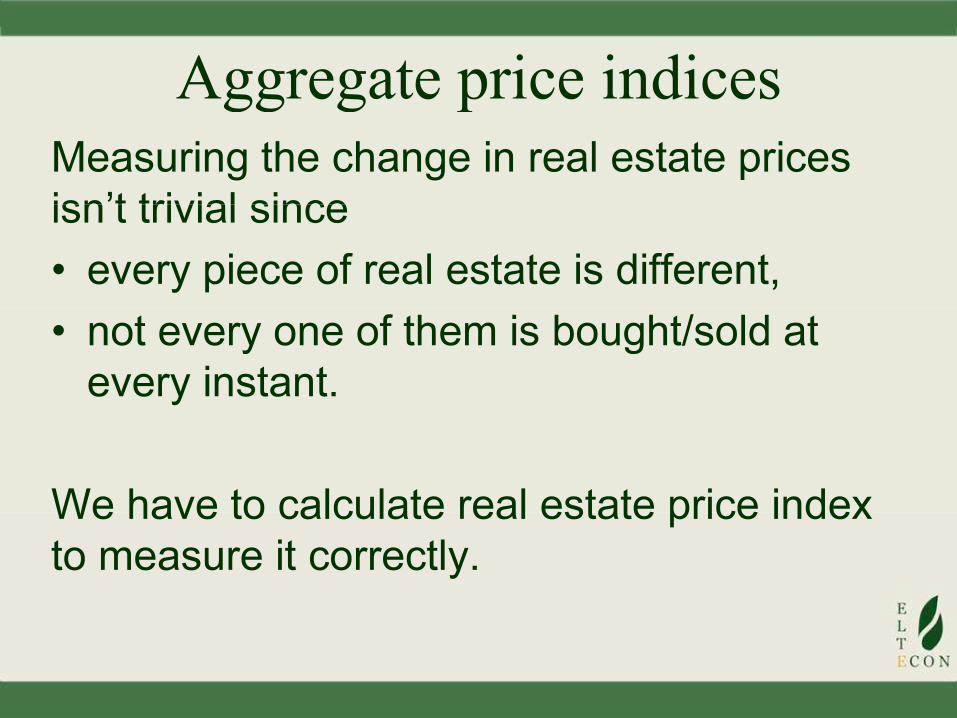
Aggregate price indicesAggregate price indices
Measuring the change in real estate prices isn’t trivial sinceisn’t trivial since
• every piece of real estate is different,
• not every one of them is bought/sold at • not every one of them is bought/sold at every instant.
We have to calculate real estate price index We have to calculate real estate price index to measure it correctly.
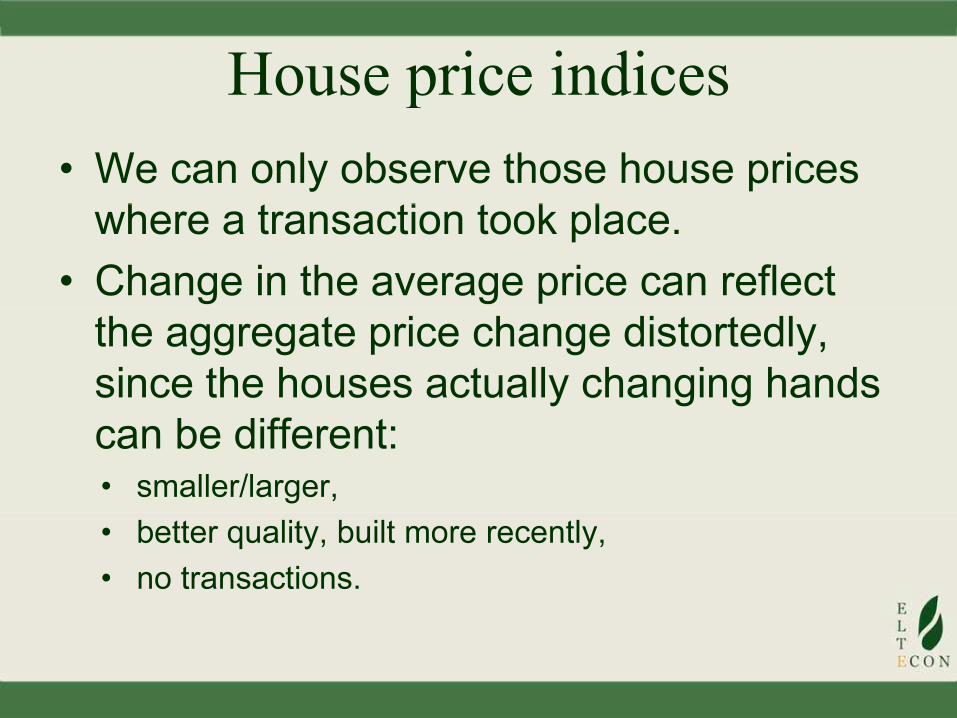
House price indicesHouse price indices
• We can only observe those house prices where a transaction took place.where a transaction took place.
• Change in the average price can reflect the aggregate price change distortedly, since the houses actually changing hands can be different:can be different:• smaller/larger,
• better quality, built more recently,
• no transactions.
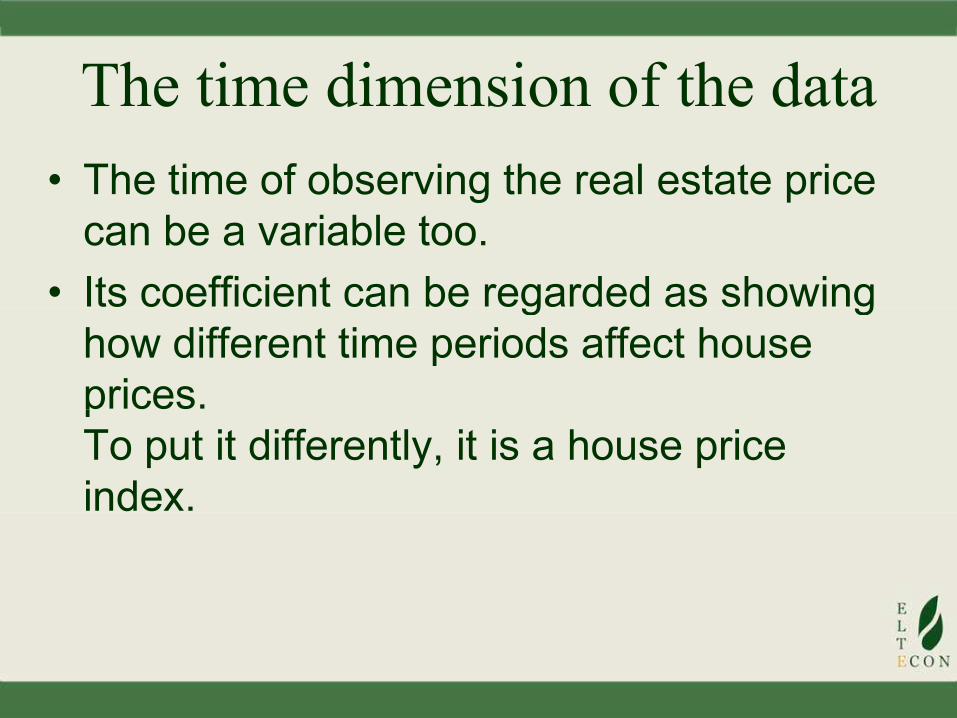
The time dimension of the dataThe time dimension of the data
• The time of observing the real estate price can be a variable too.
• Its coefficient can be regarded as showing • Its coefficient can be regarded as showing how different time periods affect house prices.prices.To put it differently, it is a house price index.index.
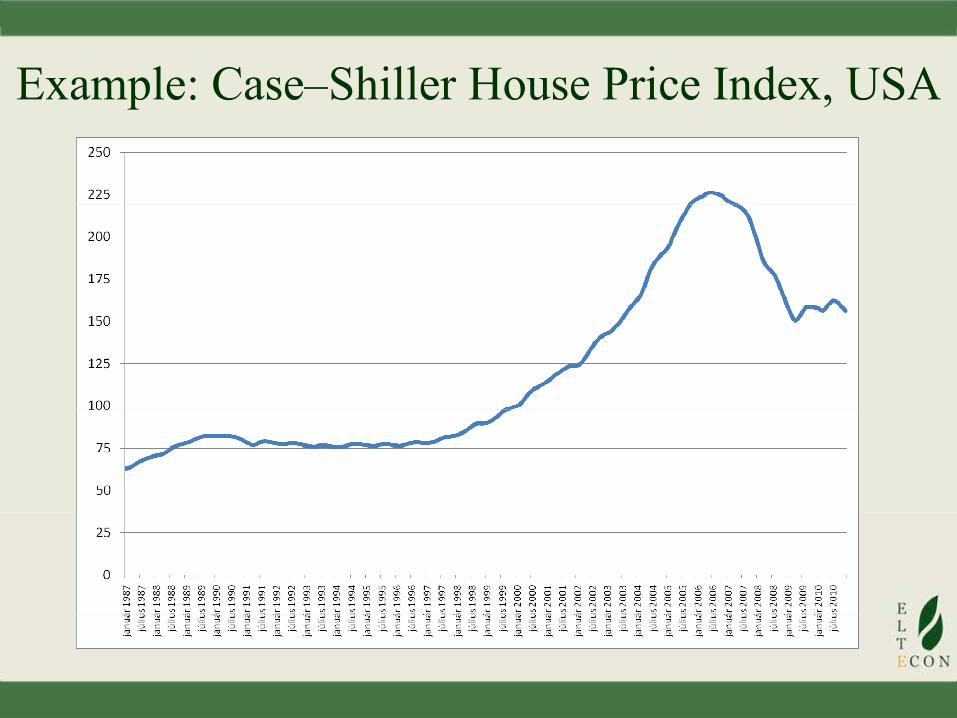
Example: Case–Shiller House Price Index, USAExample: Case–Shiller House Price Index, USA
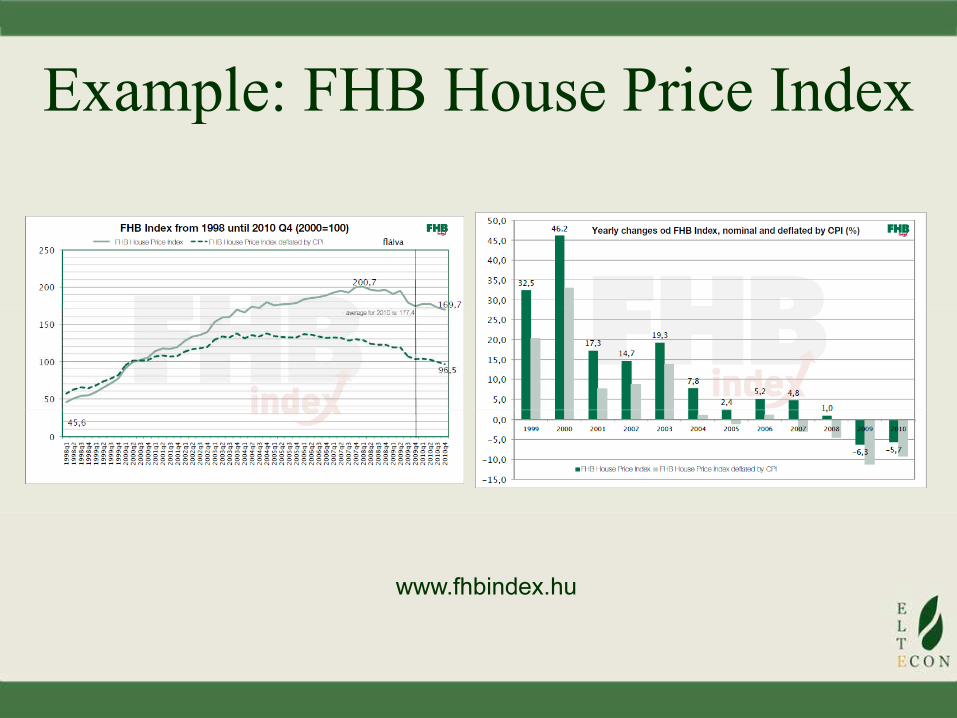
Example: FHB House Price IndexExample: FHB House Price Index
www.fhbindex.hu
2. The 4-quadrant model2. The 4-quadrant model
How do economists think?How do economists think?• Let’s simplify reality. Otherwise it’s so complex, it would be totally unknowable.complex, it would be totally unknowable.
• We ignore a couple of (in fact, a lot of) things. Sadly, the only alternative is to give up hope completely.
• There are signs that this approach is useful.useful.
• Putting relations in an undoubtedly coherent framework: modelling.coherent framework: modelling.
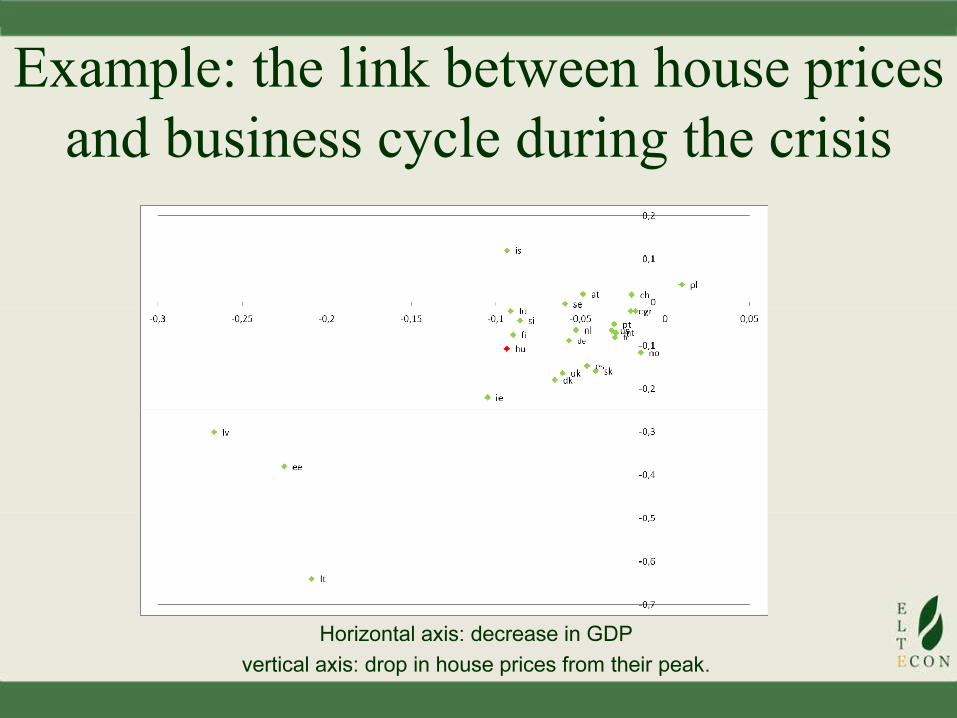
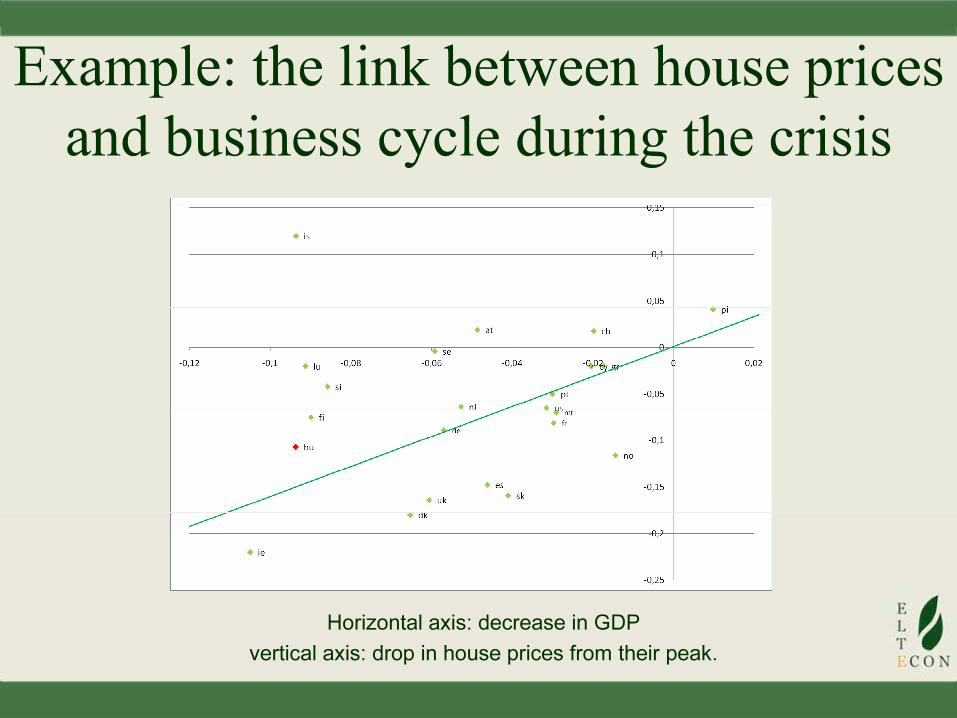
Example: the link between house prices
and business cycle during the crisis
Horizontal axis: decrease in GDP
vertical axis: drop in house prices from their peak.
Example: the link between house prices
and business cycle during the crisis
Horizontal axis: decrease in GDPHorizontal axis: decrease in GDP
vertical axis: drop in house prices from their peak.
Some typical concepts of the real estate
marketmarket• We often use this way of reasoning when • We often use this way of reasoning when thinking about real estate markets.
• The usual ”trick”: separating the market for • The usual ”trick”: separating the market for housing (renting office space…) and for houses (offices...)houses (offices...)• the market for housing
• the market for houses being built.• the market for houses being built.
Housing marketHousing market• Most important factors shaping demand: demography, income and financial demography, income and financial conditions.
• The most important factor shaping supply • The most important factor shaping supply is the house stock. Its supply is inelastic in the short run.the short run.
• The price is the actual rent paid (even implicitly, as for houes).implicitly, as for houes).
• The supply is the total area of used • The supply is the total area of used houses (or offices rented).
Market for new housesMarket for new houses
• Demand for houses is defined by the maximum (asking) price of houses.maximum (asking) price of houses.
• Supply is shaped by the total stock of • Supply is shaped by the total stock of available building plots and construction costs.
• Price: selling price of houses.
• Quantity: quantity of newly built houses.• Quantity: quantity of newly built houses.
Connecting the two marketsConnecting the two markets
• Housing price and demand for houses can be • Housing price and demand for houses can be
connected through a hypothetical investment:
the price and and the present value of the rents
should be the same.should be the same.
• Building and housing stock is connected by a
simple rule: new buildings are added to the non-simple rule: new buildings are added to the non-
amortized part of the existing housing stock.
• Explained, endogenous variable: rent price, • Explained, endogenous variable: rent price,
house price, quantity of newly built houses and
housing stock.housing stock.
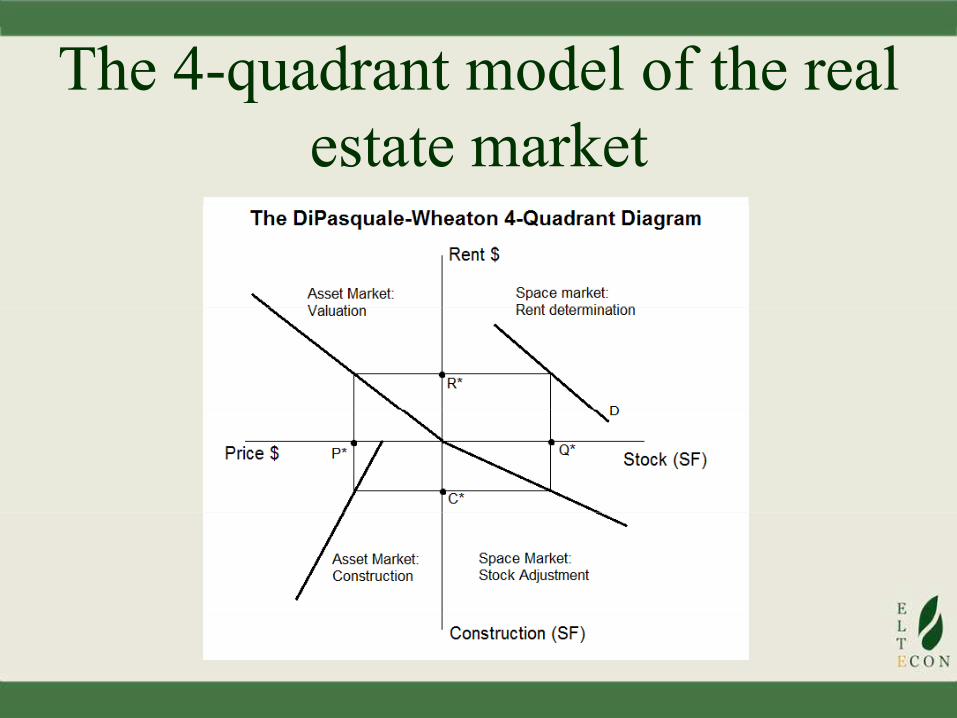
The 4-quadrant model of the realThe 4-quadrant model of the real
estate market
The 4-quadrant model of the real
estate market• How to specify the relation between the • How to specify the relation between the rents and prices?Present value calculations tells it might as well be linear.Present value calculations tells it might as well be linear.
• What assumption can be seen in the construction quadrant?construction quadrant?Construction has a fixed cost, under a certain price no
construction takes place.construction takes place.
Applying the modelApplying the model
• Let’s think through the effects of the • Let’s think through the effects of the ”outside”, exogenous factors.
• We get a story showing how (some of) the • We get a story showing how (some of) the most important channels work.
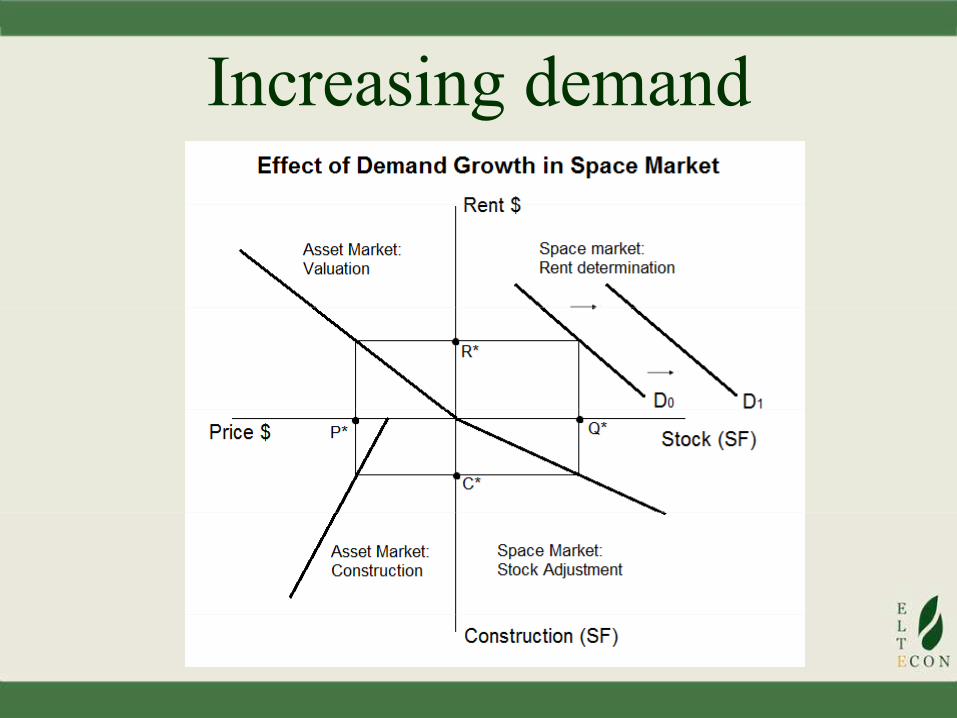
Increasing demandIncreasing demand
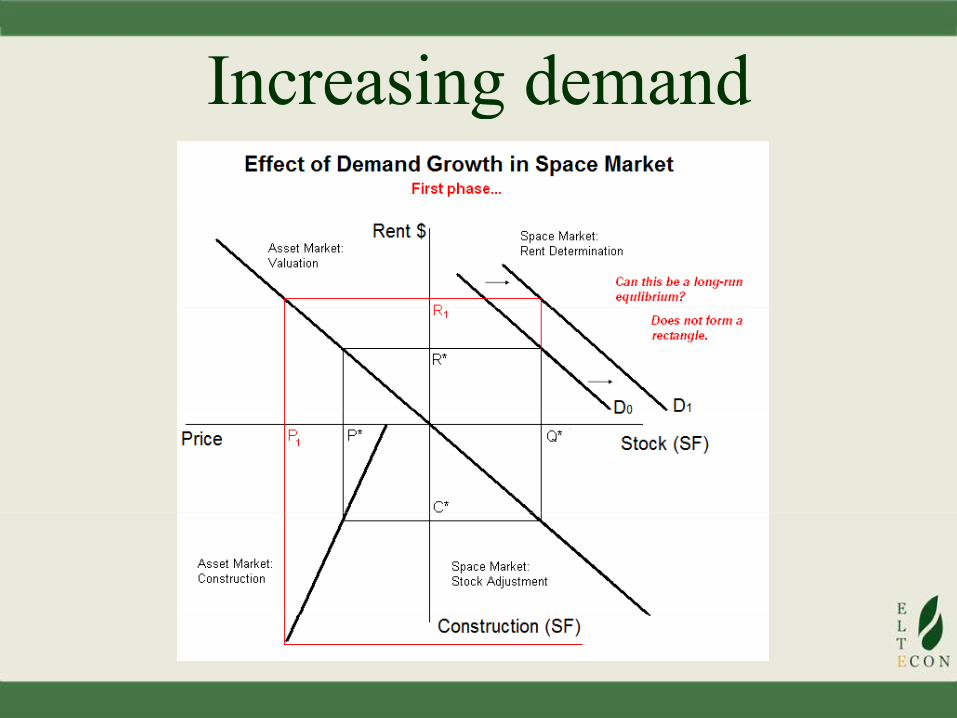
Increasing demandIncreasing demand
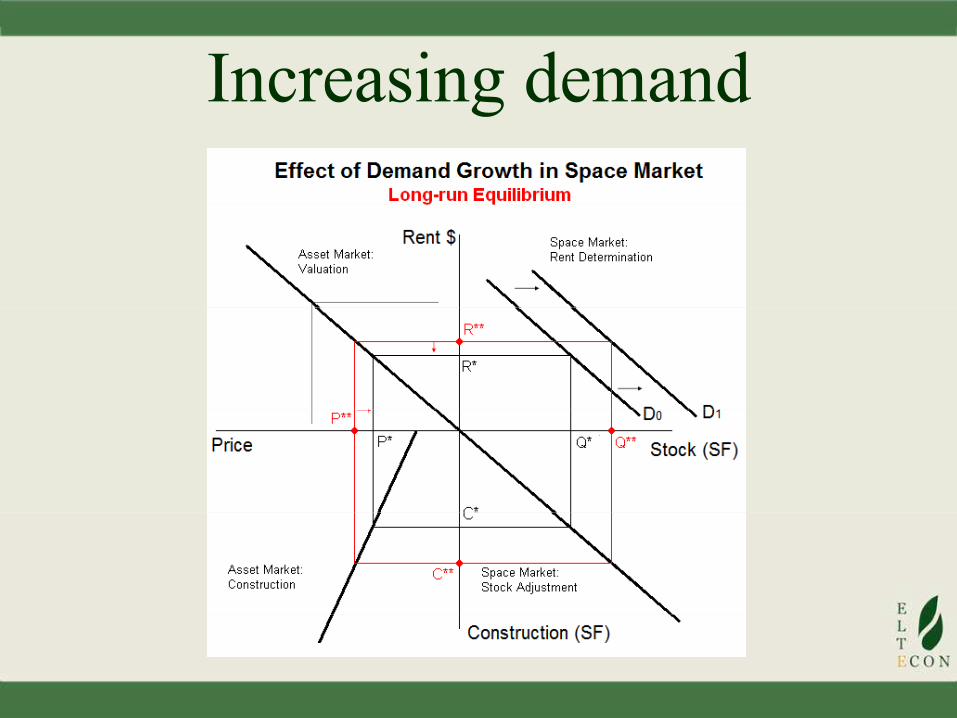
Increasing demandIncreasing demand
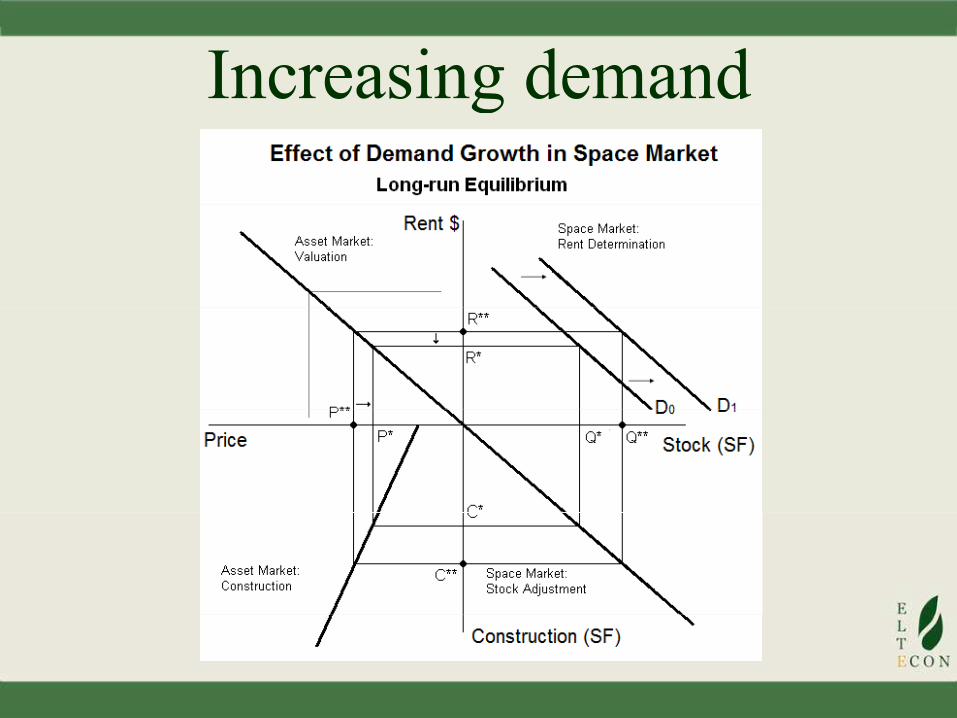
Increasing demandIncreasing demand
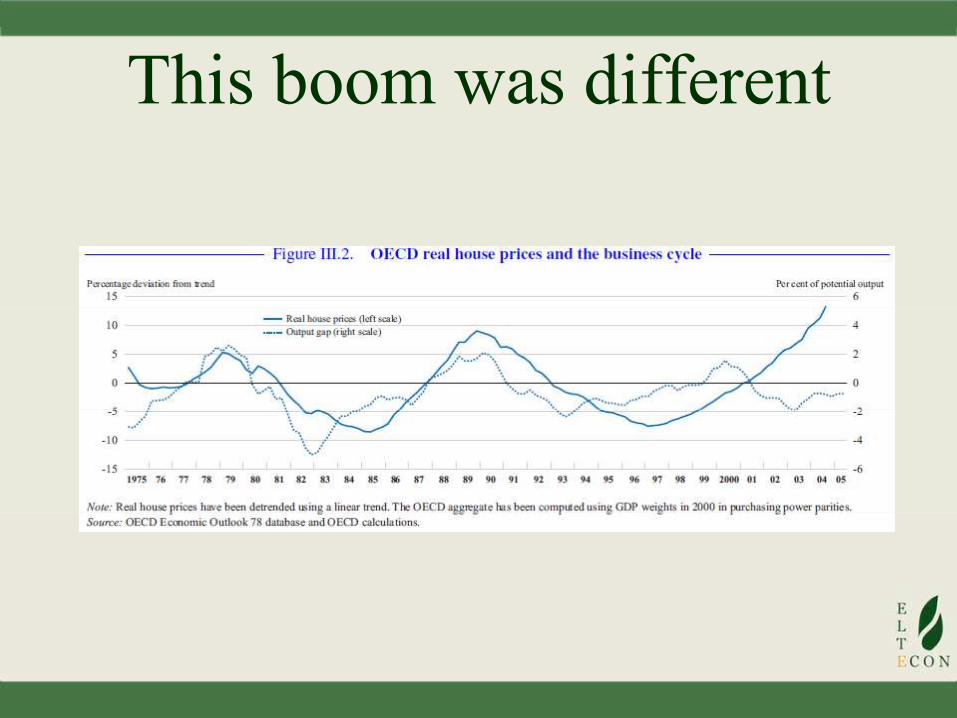
This boom was differentThis boom was different
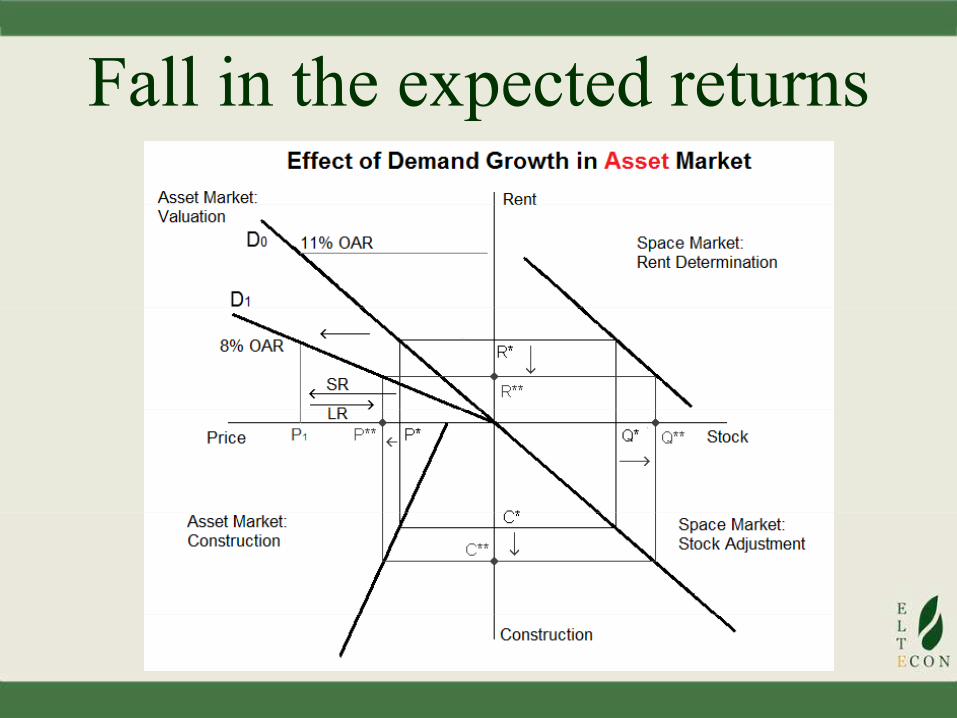
Fall in the expected returnsFall in the expected returns
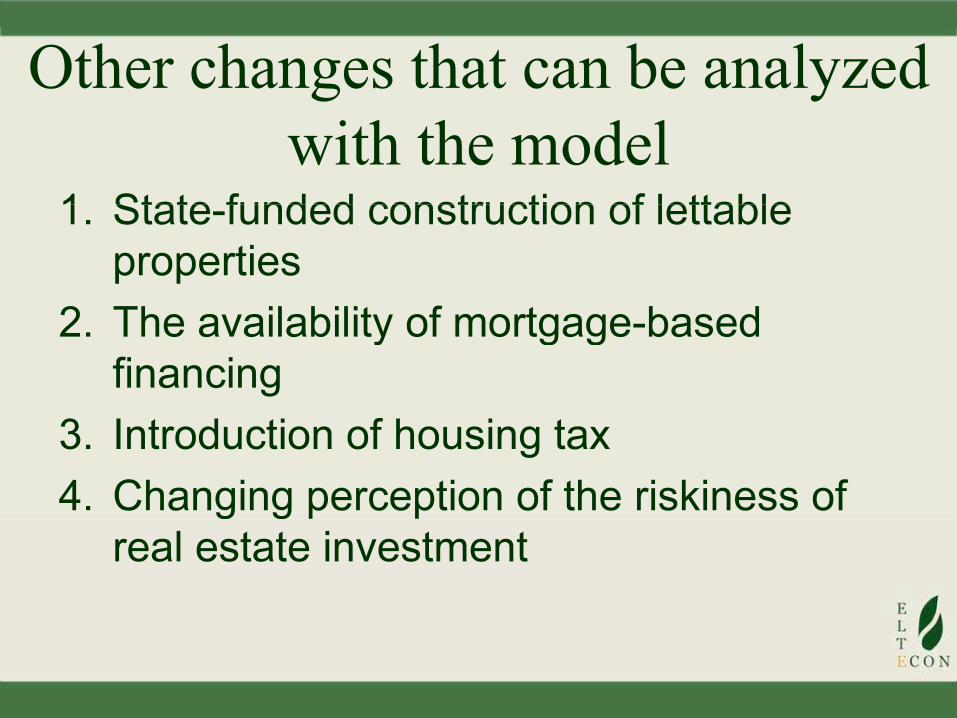
Other changes that can be analyzed
with the model1. State-funded construction of lettable 1. State-funded construction of lettable
properties
2. The availability of mortgage-based 2. The availability of mortgage-based financing
3. Introduction of housing tax
4. Changing perception of the riskiness of 4. Changing perception of the riskiness of real estate investment
How to parametrize the model?How to parametrize the model?The quantity of new housing is available:
”A yearly number of 40 000 newly-built houses are ”A yearly number of 40 000 newly-built houses are
required to continuously renew the very much
amortized Hungarian housing stock”. (Source:
New Széchenyi Plan, Programme for Home New Széchenyi Plan, Programme for Home
Creation)
Expected returns on investments are estimated Expected returns on investments are estimated
and published by real estate agencies.
Income elasticity and the reaction mechanism of
developers can be assessed by experts.

CurriculumCurriculum
• Denise DiPasquale–William C. Wheaton • Denise DiPasquale–William C. Wheaton [1996]: Urban Economics and Real Estate
Markets. Chapter 1.Markets. Chapter 1.
Further readingsFurther readings
• Nathalie Girouard–Mike Kennedy–Paul • Nathalie Girouard–Mike Kennedy–Paul van den Noord – Christophe André [2006]: Recent House Price Developments: The Recent House Price Developments: The
Role of Fundamentals, OECD, Economics Department, Working Paper No. 475Department, Working Paper No. 475