uranium mobility during in situ redox manipulation of the ...into solution when the redox barrier is...
TRANSCRIPT
PNNL-12048UC-2000
Uranium Mobility During In Situ Redox Manipulation ofthe 100 Areas of the Hanford Site
J. E. SzecsodyK. J. CantrellK. M. Krupka C. T. ReschM. D. WilliamsJ. S. Fruchter
November 1998
Prepared forthe U.S. Department of Energy under Contract DE-AC06-76RLO 1830
Pacific Northwest National LaboratoryRichland, Washington 99352

DISCLAIMER This report was prepared as an account of work sponsored by an agency of the United States Government. Neither the United States Government nor any agency thereof, nor Battelle Memorial Institute, nor any of their employees, makes any warranty, express or implied, or assumes any legal liability or responsibility for the accuracy, completeness, or usefulness of any information, apparatus, product, or process disclosed, or represents that its use would not infringe privately owned rights. Reference herein to any specific commercial product, process, or service by trade name, trademark, manufacturer, or otherwise does not necessarily constitute or imply its endorsement, recommendation, or favoring by the United States Government or any agency thereof, or Battelle Memorial Institute. The views and opinions of authors expressed herein do not necessarily state or reflect those of the United States Government or any agency thereof. PACIFIC NORTHWEST NATIONAL LABORATORY operated by BATTELLE for the UNITED STATES DEPARTMENT OF ENERGY under Contract DE-AC06-76RLO 1830 Printed in the United States of America Available to DOE and DOE contractors from the Office of Scientific and Technical Information, P.O. Box 62, Oak Ridge, TN 37831; prices available from (615) 576-8401. Available to the public from the National Technical Information Service, U.S. Department of Commerce, 5285 Port Royal Rd., Springfield, VA 22161
This document was printed on recycled paper. (9/97)

Summary
A series of laboratory experiments and computer simulations was conducted to assess theextent of uranium remobilization that is likely to occur at the end of the life cycle of an in situsediment reduction process. The process is being tested for subsurface remediation of chromate-and chlorinated solvent-contaminated sediments at the Hanford Site in southeastern Washington.Uranium species that occur naturally in the +6 valence state [U(VI)] at 10 ppb in groundwater atHanford will accumulate as U(IV) through the reduction and subsequent precipitation conditions ofthe permeable barrier created by in situ redox manipulation. The precipitated uranium will beremobilized when the reductive capacity of the barrier is exhausted and the sediment is oxidized bythe groundwater containing dissolved oxygen and other oxidants such as chromate. AlthoughU(IV) accumulates from years or decades of reduction/precipitation within the reduced zone, U(VI)concentrations in solution are only somewhat elevated during aquifer oxidation because oxidationand dissolution reactions that release U(IV) precipitate to solution are slow. The release rate ofuranium into solution was found to be controlled mainly by the oxidation/dissolution rate of theU(IV) precipitate (half-life 200 hours) and partially by the fast oxidation of adsorbed Fe(II) (half-life 5 hours) and the slow oxidation of Fe(II)CO3 (half-life 120 hours) in the reduced sediment.Simulations of uranium transport that incorporated these and other reactions under site-relevantconditions indicated that 35 ppb U(VI) is the maximum concentration likely to result frommobilization of the precipitated U(IV) species. Experiments also indicated that increasing thecontact time between the U(IV) precipitates and the reduced sediment, which is likely to occur inthe field, results in a slower U(IV) oxidation rate, which, in turn, would lower the maximumconcentration of mobilized U(VI). A six-month-long column experiment confirmed that uraniumaccumulated in reduced sediment was released slowly into solution with U(VI) concentrations atonly slightly greater than influent U(VI) concentrations. This experiment also demonstrated thatdissolved chromate, another oxidant likely to be present in some field systems, did not increase therelease rate of uranium into solution.
iii

iv

Acknowledgments
This work was prepared with the support of the following contributors:
DOE Headquarters Office of Science and TechnologyGrover Chamberlain
Focus Area/Program Subsurface Contaminant Focus Area James Wright
Operations Office Richland Operations OfficeScience and Technology Programs DivisionDeborah E. Trader, Technical Program Officer
Contractor Pacific Northwest National LaboratoryEnvironmental Science and Technology EnvironmentalTechnology DivisionRod K. Quinn, Manager
v

vi

Contents
Summary . . . . . . . . . . . . . . . . . . . . . . . . . . . . . . . . . . . . . . . . . . . . . . . . . . . . . . . . . iii
Acknowledgments . . . . . . . . . . . . . . . . . . . . . . . . . . . . . . . . . . . . . . . . . . . . . . . . . . v
1.0 Introduction . . . . . . . . . . . . . . . . . . . . . . . . . . . . . . . . . . . . . . . . . . . . . . . . . . . 1
2.0 Uranium Mobility Concepts . . . . . . . . . . . . . . . . . . . . . . . . . . . . . . . . . . . . . . . . . 32.1 Uranium Speciation and Transport in Oxic Aquifer Conditions . . . . . . . . . . . . . . 32.2 Uranium Speciation and Transport in Reducing Aquifer Conditions . . . . . . . . . 52.3 Barrier Oxidation and Uranium Remobilization . . . . . . . . . . . . . . . . . . . . . . . . . 62.4 Reaction and Reactive Transport Modeling . . . . . . . . . . . . . . . . . . . . . . . . . . . . 8
3.0 Uranium Transport in Natural (oxic) Aquifer Conditions . . . . . . . . . . . . . . . . . . . . . . 93.1 Batch Adsorption Experiments . . . . . . . . . . . . . . . . . . . . . . . . . . . . . . . . . . . . 93.2 Results . . . . . . . . . . . . . . . . . . . . . . . . . . . . . . . . . . . . . . . . . . . . . . . . . . . 10
4.0 Uranium Immobilization in Reducing Aquifer Conditions . . . . . . . . . . . . . . . . . . . . . 134.1 Batch and Column Experimental Methods . . . . . . . . . . . . . . . . . . . . . . . . . . . . 134.3 Uranium Immobilization by Reduced Sediment . . . . . . . . . . . . . . . . . . . . . . . . 15
5.0 Uranium Remobilization During Aquifer Oxidation . . . . . . . . . . . . . . . . . . . . . . . . . 175.1 Batch and Column Experimental Methods . . . . . . . . . . . . . . . . . . . . . . . . . . . . 175.2 Sediment Oxidation Studies . . . . . . . . . . . . . . . . . . . . . . . . . . . . . . . . . . . . . . 175.3 Uranium Mobilization Experiments . . . . . . . . . . . . . . . . . . . . . . . . . . . . . . . . . 205.4 Uranium Transport Simulations . . . . . . . . . . . . . . . . . . . . . . . . . . . . . . . . . . . 22
6.0 Uranium Remobilization in the Presence of Chromate . . . . . . . . . . . . . . . . . . . . . . . . 256.1 Experimental Methods . . . . . . . . . . . . . . . . . . . . . . . . . . . . . . . . . . . . . . . . . 256.2 Results . . . . . . . . . . . . . . . . . . . . . . . . . . . . . . . . . . . . . . . . . . . . . . . . . . . 25
7. 0 Conclusions . . . . . . . . . . . . . . . . . . . . . . . . . . . . . . . . . . . . . . . . . . . . . . . . . . . 27
8. 0 References . . . . . . . . . . . . . . . . . . . . . . . . . . . . . . . . . . . . . . . . . . . . . . . . . . . . 29
Appendix: Uranium Analysis . . . . . . . . . . . . . . . . . . . . . . . . . . . . . . . . . . . . . . . . . A.1
vii
Figures
1 Conceptual Diagram Showing Influence of a Redox Barrier as a Function of Time . . . . 2
2 Uranium Mobility under Natural Conditions . . . . . . . . . . . . . . . . . . . . . . . . . . . . . . 10
3 Processes Controlling Uranium Immobilization in Reduced Aquifer Conditions . . . . . . 14
4 Rate of Removal of U(VI)-Carbonate Species at 10 and 100 ppb in Contact with Dithionite-Reduced Sediment . . . . . . . . . . . . . . . . . . . . . . . . . . . . . . . . . . . . 16
5 Oxidation of Dithionite-Reduced Sediment by Dissolved Oxygen in Water in Three 1-D Column Experiments with Differing Velocities . . . . . . . . . . . . . . . . . . . 19
6 Uranium Release into Solution as Hanford Sediment Is Oxidized. . . . . . . . . . . . . . . . 21
7 Simulated Uranium Mobility under Field Conditions as the Redox Barrier Is Oxidized . . . . . . . . . . . . . . . . . . . . . . . . . . . . . . . . . . . . . . . . . . . . . . . . . . . . . 23
8 Column Experiment Results of Remobilization of U(VI) and Cr(VI) Species . . . . . . . 26
viii
1.0 Introduction
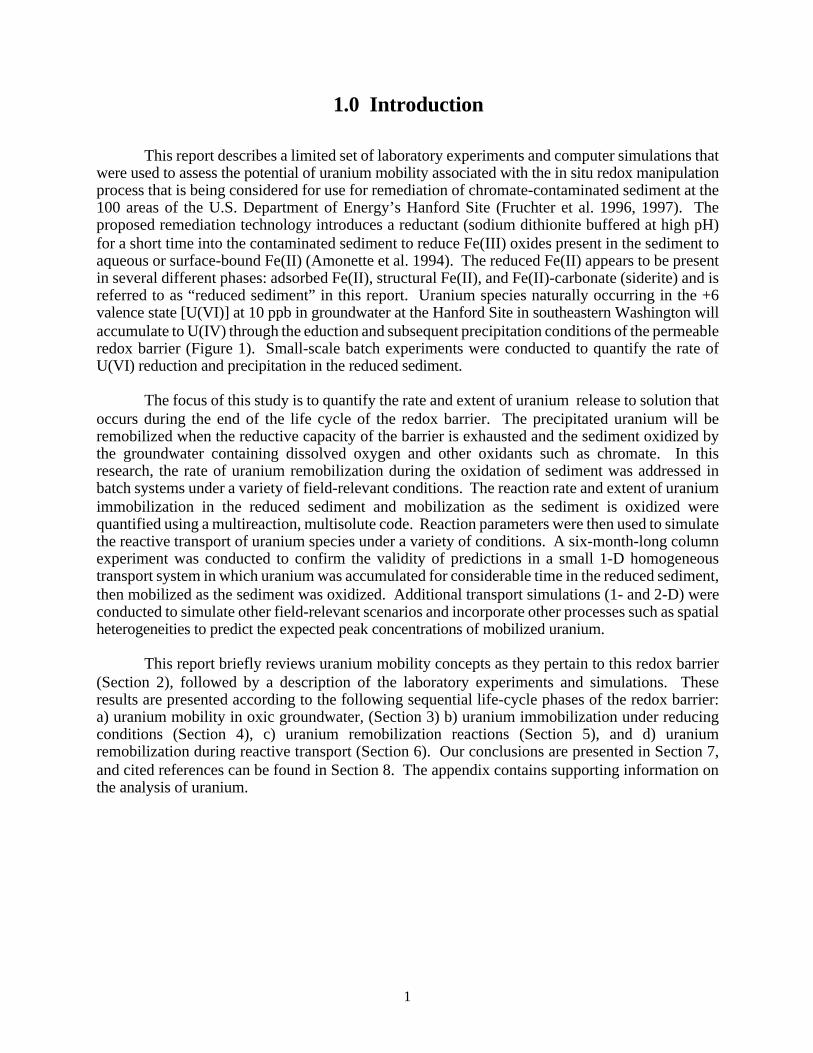
This report describes a limited set of laboratory experiments and computer simulations thatwere used to assess the potential of uranium mobility associated with the in situ redox manipulationprocess that is being considered for use for remediation of chromate-contaminated sediment at the100 areas of the U.S. Department of Energy’s Hanford Site (Fruchter et al. 1996, 1997). Theproposed remediation technology introduces a reductant (sodium dithionite buffered at high pH)for a short time into the contaminated sediment to reduce Fe(III) oxides present in the sediment toaqueous or surface-bound Fe(II) (Amonette et al. 1994). The reduced Fe(II) appears to be presentin several different phases: adsorbed Fe(II), structural Fe(II), and Fe(II)-carbonate (siderite) and isreferred to as “reduced sediment” in this report. Uranium species naturally occurring in the +6valence state [U(VI)] at 10 ppb in groundwater at the Hanford Site in southeastern Washington willaccumulate to U(IV) through the eduction and subsequent precipitation conditions of the permeableredox barrier (Figure 1). Small-scale batch experiments were conducted to quantify the rate ofU(VI) reduction and precipitation in the reduced sediment.
The focus of this study is to quantify the rate and extent of uranium release to solution thatoccurs during the end of the life cycle of the redox barrier. The precipitated uranium will beremobilized when the reductive capacity of the barrier is exhausted and the sediment oxidized bythe groundwater containing dissolved oxygen and other oxidants such as chromate. In thisresearch, the rate of uranium remobilization during the oxidation of sediment was addressed inbatch systems under a variety of field-relevant conditions. The reaction rate and extent of uraniumimmobilization in the reduced sediment and mobilization as the sediment is oxidized werequantified using a multireaction, multisolute code. Reaction parameters were then used to simulatethe reactive transport of uranium species under a variety of conditions. A six-month-long columnexperiment was conducted to confirm the validity of predictions in a small 1-D homogeneoustransport system in which uranium was accumulated for considerable time in the reduced sediment,then mobilized as the sediment was oxidized. Additional transport simulations (1- and 2-D) wereconducted to simulate other field-relevant scenarios and incorporate other processes such as spatialheterogeneities to predict the expected peak concentrations of mobilized uranium.
This report briefly reviews uranium mobility concepts as they pertain to this redox barrier(Section 2), followed by a description of the laboratory experiments and simulations. Theseresults are presented according to the following sequential life-cycle phases of the redox barrier:a) uranium mobility in oxic groundwater, (Section 3) b) uranium immobilization under reducingconditions (Section 4), c) uranium remobilization reactions (Section 5), and d) uraniumremobilization during reactive transport (Section 6). Our conclusions are presented in Section 7,and cited references can be found in Section 8. The appendix contains supporting information onthe analysis of uranium.
1

10.
1.0
1000.
time (years)0 0.1 20 25
100.
100.
10.
1.0
0.1
fast mobilization rate
U(VI) aq
O2
[mg/
L]8.2
0.0
natural aquifer redox barrier(20 yrs, 100 pv) after barrier reoxidationa)
b)
c)
U (
aq)
[µg/
L]
surf
ace
U [
µg/g
]
U(VI) adsorbedU(IV) precipitates
slow mobilization rate
fast mobilization rate
slow mobilization rate
U(IV) aq
Figure 1. Conceptual Diagram Showing the Influence of a Redox Barrier as a Function of Timeon a) the redox conditions of groundwater (dissolved oxygen shown), b) the concen-tration of aqueous uranium species, and c) the concentration of surface uraniumspecies that result from adsorption or precipitation
2

2.0 Uranium Mobility Concepts
Naturally occurring uranium is present in the 100 H area of the Hanford Site at a concentra-tion of about 9.5 ± 4.4 ppb (parts per billion or µg L-1) as measured in seven wells in 1996–97 inthe unconfined aquifer (pH 7.7, near oxygen-saturated conditions) (Fruchter et al. 1996). The con-centrations of dissolved uranium at this pH under oxidizing conditions are controlled by theaqueous speciation of U(VI) and adsorption of U(VI) species onto sediments. The transport ofuranium species through aquifer sediments varies considerably with geochemical conditions suchas pH and oxidation/reduction (redox). Under the reduced conditions (oxidation-reductionpotential [Eh] <0.0 V) present in the redox barrier, the dissolved U(VI) species are reduced to theless-soluble U(IV), and precipitate. However, these accumulated U(IV) solids will be remobilizedinto solution when the redox barrier is oxidized at the end of its life cycle. The mass of accumu-lated uranium and the rate at which the redox barrier and U(IV) precipitate oxidize control theresulting peak concentration of dissolved uranium.
2.1 Uranium Speciation and Transport in Oxic Aquifer Conditions
We know a lot about the speciation of uranium in the +3, +4, +5, and +6 oxidation statesin aqueous environments (Langmuir 1978; Wanner and Forest 1992). Dissolved U(III) easilyoxidizes to U(IV) under most redox conditions found in nature. The U(V) aqueous species(UO2+) readily disproportionates to U(IV) and U(VI); consequently, U(IV) and U(VI) are the mostcommon oxidation states of uranium in nature. Uranium is generally found in the +6 oxidationstate in oxidizing environments and in the +4 oxidation state in reducing environments.
Dissolved U(VI) readily hydrolyzes to form several aqueous complexes. In carbonate-freesystems, important species include UO22+, UO2(OH)20(aq), UO2(OH)3-, (UO2)3(OH)5+, and(UO2)2(OH)22+ (Wanner and Forest 1992). The concentrations of these species and their distribu-tion relative to other U(VI) species is a function of pH and the total concentration of dissolvedU(VI). A large number of other important U(VI) species exist in more chemically complex aque-ous systems; for example, in the unconfined aquifer of the Hanford 100 areas, at pH 7.7 inpredominately carbonate-containing water and oxidizing conditions, major species present arecarbonate anions [60% UO2(CO3)34-, 30% UO2(CO3)22-, 10% (UO2)3(OH)5+](Langmuir 1978).This speciation changes with pH and Eh (redox condition), but the conditions remain relativelyconstant in the natural aquifer. In this report, this distribution of species is referred to as “U(VI)aqueous species.” Organic complexes are also generally important to aqueous uranium speciation,but the unconfined aquifer of the Hanford Site contains very little natural organic matter.
Given the concentration of uranium that is naturally present in the Hanford 100-Areasediments, adsorption of U(VI) to specific mineral phases of the sediments is the primary controlon uranium mobility at pH 7.7 under oxidizing conditions. At higher concentrations, the solubilityof U(VI)-containing minerals could control the maximum concentrations of dissolved uranium inthe sediments. Uranium minerals that can form in oxic conditions and control the concentration ofdissolved uranium include carnotite [(K2(UO2)2(VO4)2], schoepite (UO3·2H2O), rutherfordine(UO2CO3), tyuyamunite [Ca(UO2)2(VO4)2], autunite [Ca(UO2)2(PO4)2], potassium autunite[K2(UO2)2(PO4)2], and uranophane [Ca(UO2)2(SiO3OH)2] (Frondel 1958; Langmuir 1978).
3
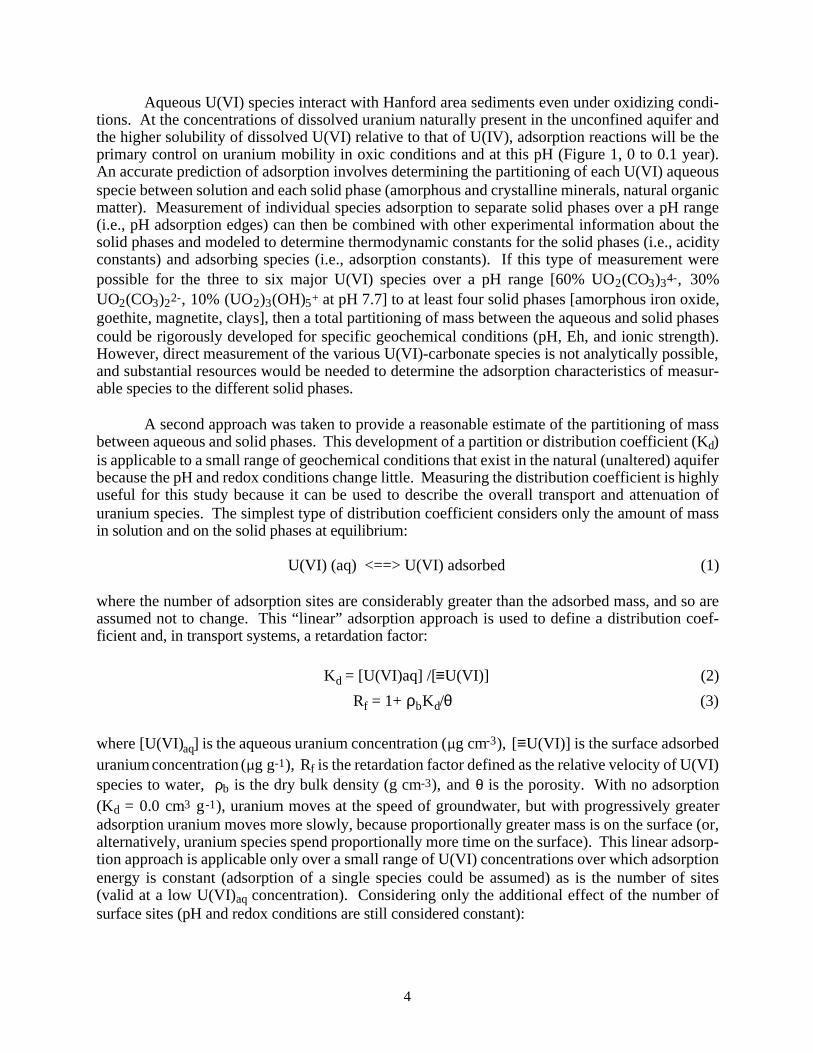
Aqueous U(VI) species interact with Hanford area sediments even under oxidizing condi-tions. At the concentrations of dissolved uranium naturally present in the unconfined aquifer andthe higher solubility of dissolved U(VI) relative to that of U(IV), adsorption reactions will be theprimary control on uranium mobility in oxic conditions and at this pH (Figure 1, 0 to 0.1 year).An accurate prediction of adsorption involves determining the partitioning of each U(VI) aqueousspecie between solution and each solid phase (amorphous and crystalline minerals, natural organicmatter). Measurement of individual species adsorption to separate solid phases over a pH range(i.e., pH adsorption edges) can then be combined with other experimental information about thesolid phases and modeled to determine thermodynamic constants for the solid phases (i.e., acidityconstants) and adsorbing species (i.e., adsorption constants). If this type of measurement werepossible for the three to six major U(VI) species over a pH range [60% UO2(CO3)34-, 30%UO2(CO3)22-, 10% (UO2)3(OH)5+ at pH 7.7] to at least four solid phases [amorphous iron oxide,goethite, magnetite, clays], then a total partitioning of mass between the aqueous and solid phasescould be rigorously developed for specific geochemical conditions (pH, Eh, and ionic strength).However, direct measurement of the various U(VI)-carbonate species is not analytically possible,and substantial resources would be needed to determine the adsorption characteristics of measur-able species to the different solid phases.
A second approach was taken to provide a reasonable estimate of the partitioning of massbetween aqueous and solid phases. This development of a partition or distribution coefficient (Kd)is applicable to a small range of geochemical conditions that exist in the natural (unaltered) aquiferbecause the pH and redox conditions change little. Measuring the distribution coefficient is highlyuseful for this study because it can be used to describe the overall transport and attenuation ofuranium species. The simplest type of distribution coefficient considers only the amount of massin solution and on the solid phases at equilibrium:
U(VI) (aq) <==> U(VI) adsorbed (1)
where the number of adsorption sites are considerably greater than the adsorbed mass, and so areassumed not to change. This “linear” adsorption approach is used to define a distribution coef-ficient and, in transport systems, a retardation factor:
Kd = [U(VI)aq] /[≡U(VI)] (2)
Rf = 1+ ρbKd/θ (3)
where [U(VI)aq] is the aqueous uranium concentration (µg cm-3), [≡U(VI)] is the surface adsorbeduranium concentration (µg g-1), Rf is the retardation factor defined as the relative velocity of U(VI)species to water, ρb is the dry bulk density (g cm-3), and θ is the porosity. With no adsorption(Kd = 0.0 cm3 g-1), uranium moves at the speed of groundwater, but with progressively greateradsorption uranium moves more slowly, because proportionally greater mass is on the surface (or,alternatively, uranium species spend proportionally more time on the surface). This linear adsorp-tion approach is applicable only over a small range of U(VI) concentrations over which adsorptionenergy is constant (adsorption of a single species could be assumed) as is the number of sites(valid at a low U(VI)aq concentration). Considering only the additional effect of the number ofsurface sites (pH and redox conditions are still considered constant):
4

U(VI) (aq) + ≡ <==> ≡U(VI) (4)
where ≡ is a surface site that can be used to define Langmuir adsorption:
[≡U(VI)] = MKL[U(VI)aq] / [1 + KL[U(VI)aq]] (5)
where M is the total number of surface sites (or site concentration, µmol/g), and KL is theLangmuir affinity parameter (cm3/µmol). This Langmuir model assumes a single type ofadsorption site, which may be valid for a natural sediment if a single phase dominates theadsorption. At very small concentrations, adsorption is linear and MKL ≈ Kd, whereas at highconcentration, adsorption decrease is eventually limited by the total number of sites. At thesehigher concentrations, Kd is a function of the aqueous uranium concentration:
Kd’ = [≡U(VI)] / [U(VI)aq] = MKL[U(VI)aq] / [1 + KL[U(VI)aq]] /[U(VI)aq] (6)
With this concentration-dependent Kd’, the retardation factor can still be defined (3) to determinethe relative velocity of uranium through the aquifer.
Whereas a pure adsorbent has a single type of adsorption site with constant affinity andtypically is fit well with a Langmuir isotherm, natural sediments can contain several mineral phasesthat adsorb the solute of interest. The sum of adsorption to these different phases (i.e., addition ofseveral Langmuir isotherms from each mineral phase) provides an overall adsorption isotherm forthe sediment. If mineral phases that have less surface area have higher affinities, the resultingoverall isotherm will have a slope less than 1.0 at low concentration. In the absence of determiningthe U(VI) adsorption isotherms of each mineral phase in the sediment, an empirical isotherm(Langmuir-Freundlich) can be used to fit isotherm data with nonlinear slopes at low concentration:
Kd’’ = [≡U(VI)] / [U(VI)aq] = M[KLFU(VI)aq]b / [1 + [KLFU(VI)aq]b] /[U(VI)aq] (7)
The deviation of the slope (from 1.0) at low concentration provides an indication of the influenceof multiple adsorption sites that have differing affinities. For U(VI) species adsorption, a non-linear slope may also be caused by the presence of multiple U(VI) species that are adsorbing.Reactive transport of uranium species defined by this concentration-dependent isotherm is alsodefined by the retardation factor (3).
2.2 Uranium Speciation and Transport in Reducing AquiferConditions
Under the reducing conditions (Eh < 0.0 V) in the dithionite-reduced sediment, the dis-solved U(VI) species normally present in oxic water (shown conceptually in Figure 1 at 0 to 0.1year) are reduced to the less soluble +4 valence state resulting in precipitation of sparingly solubleU(IV) species or mixed U(IV)/U(VI) solids. The total concentration of dissolved U(IV) species inreducing groundwater is quite low because of the low solubility of U(IV) solid phases (Bruno etal. 1988, 1991). The aqueous speciation of dissolved U(IV) at pH >3 is dominated by hydrolyticspecies such as U(OH)3+ and U(OH)40(aq). U(IV) complexes with chloride, fluoride, phosphate,
5

and sulfate are unimportant above pH 3, but a recent study indicates that U(IV)-carbonatecomplexes might be significant at higher concentrations of dissolved carbonate (Rai et al. 1990).
Reduction of U(VI) to U(IV) usually results in the precipitation of U(IV) (e.g., uraninite,compositions ranging from UO2 to UO2.25) or mixed U(IV)/U(VI) solids (e.g., U4O9). In thisreport, these U(IV) solids are referred to as U(IV) precipitates. Other important U(IV) mineralsfound in nature include coffinite (USiO4) and ningyoite (CaU(PO4)2.2H2O) (Langmuir 1978;Frondel 1958). Thus, as groundwater containing U(VI) aqueous species is transported throughthe permeable reduced zone, there will be an accumulation of U(IV) precipitates (Figure 1, 0.1 to20 years). The processes that define this accumulation are 1) the combined rate of U(VI) reductionand U(IV) precipitation and 2) the capacity of the reduced iron [Fe(II)] barrier.
The immobilization of the aqueous uranium species as it contacts the redox barrier hasconceptual similarities to the formation of uranium roll-front deposits in sandstone rocks, and someinsight is gained from those studies. These ore bodies occur when U(VI) carried by oxicgroundwater contacts a zone containing a naturally occurring reductant such as natural organicmatter and H2S(g) (Adler 1974; Maynard 1983). The U(VI) is reduced to U(V) at this interfaceand U(IV)-containing minerals that form as precipitates include uraninite and coffinite.
2.3 Barrier Oxidation and Uranium Remobilization
The accumulated U(IV) precipitate will be remobilized into solution when the reduced ironbarrier is oxidized (Figure 1, after 20 years). The rate at which this mass of U(IV) is remobilizedcontrols the resulting concentration of dissolved U(VI) species, which may or may not result in aninitial concentration peak (Figure 1b). Several processes affect this rate, including 1) the U(IV)precipitate oxidation rate, 2) the Fe(II) oxidation rate, 3) U(IV) precipitate-sediment aging,4) U(VI) solubility limits, and 5) sediment chemical and physical heterogeneities. Quantitativedetermination of the rates or effects of these processes is needed to accurately predict the uraniumconcentration that can result as the reduced iron barrier is oxidized. If the combination of theseprocesses results in fast uranium solubilization, the dissolved U(VI) concentrations can peak at avalue higher than the natural 9.5 ppb. Alternatively, if these processes result in slow uraniumsolubilization, then the U(VI) concentration will increase slowly to natural levels (Figure 1b).
The oxidation of the adsorbed and structural Fe(II) in the sediments of the permeable redoxbarrier occurs naturally by the inflow of dissolved oxygen through the barrier, but it can be oxi-dized by contaminants that may be present, such as chromate, as well. As described below, theoxidation rate of the reduced iron barrier is controlled by a combination of several chemicaloxidation reactions and possibly physical (diffusion) limitations in accessing sites. Using dis-solved oxygen as an oxidant can occur via two electron sequences:
O2 + 2H+ + 2e- <==> H2O2 (8)H2O2 + 2H+ + 2e- <==> H2O (9)
so 4 moles of electrons are available per mole of O2 consumed. The second reaction (9) is muchslower than the first, although with many transition metals such as Fe(II) the reaction kinetics canbe described with a single first-order reaction (Stumm and Morgan 1981). Oxidation of structuraland adsorbed Fe(II) by several mechanisms, including
6

Fe3+ + e- <==> Fe2+ (10)Fe(OH)3(s) + 3H+ + e- <==> Fe2+ + 3H2O (11)
Fe(OH)3(s) + 2H+ HCO3- + e- <==> FeCO3(s) + 3H2O (12)
generally indicates that 1 mole of electrons is consumed per mole of Fe(II) oxidized. Experimentalevidence indicates that the oxygenation of Fe(II) in solutions (pH >5) is generally found to be firstorder with respect to Fe(II) and O2 concentration and second order with respect to OH-. There-fore, approximately 4 moles of Fe(II) are oxidized per mole of O2 consumed (reactions 8–10), andthe rate increases one-hundred-fold for a unit increase in pH. At oxygen-saturated conditions(8.2 ppm O2), 1.02 mmol L-1 Fe(II) is consumed.
Chromate present as a contaminant in groundwater will also oxidize Fe(II)
HCrO4- + 7H+ + 3e- <==> Cr3+ + 4H2O (13)
with 1 mole of electrons consumed per mole of chromate reduced. The reduction of one mole ofchromate oxidizes one mole of Fe(II) [reactions 10 and 13], or 41 mg L-1 chromate is needed tooxidize the equivalent mass of Fe(II) as water saturated with dissolved oxygen [1.02 mmol L-1
Fe(II)]. Chromate is considered a much stronger oxidizer than dissolved oxygen, so even atconcentrations less than 41 mg L-1 it may influence the iron oxidation rate.
Similar geochemical reactions that are important for mobilization of U(VI) during thereduced iron barrier oxidation also occur during alkaline in situ leach mining of uranium deposits,although the chemistries of oxidizing solutions are significantly different. Most current uraniumrecovery operations use various alkaline leaching techniques including ammonia carbonate-bicarbonate solutions and an oxidant (IAEA 1980, 1993). For in situ mining, oxygen is not consid-ered effective for oxidation of UO2 at practical rates under ambient pressure and temperature. TheU(VI)-carbonate species formed are similar to those described in the natural carbonate waters inthis report, but the concentrations used in the mining operations are considerably higher. Also, thecarbonate leaching operations typically involve elevated pressure and temperature to increase thedissolution. Thus, based on these comparisons and the results from the experiments and computermodeling simulations described in this report, we propose that the peak uranium concentrationsresulting from the “natural” oxidation of the redox barrier will be significantly lower than whatwould be obtained if in situ uranium mining techniques were used on the same sediments.
The oxidation rate of the redox barrier is controlled by the rate at which dissolved oxygenin water flowing through the sediment oxidizes the different forms of Fe(II), so it is a combinationof several chemical oxidation rates and possibly physical (i.e., diffusion) limitations in accessingsites. The U(IV) precipitates on sediments slowly recrystallize over time so are likely to be morerecalcitrant over decades of precipitate contact with the reduced sediments. Processes such as intra-particle diffusion, coprecipitation, and overgrowth of other precipitates or oxides also reduce theability of the sediment to release uranium into solution quickly under the eventual oxic conditions.Such processes have been reported for uranium precipitates on sediments (Payne et al. 1994).Even under optimal conditions for U(IV) oxidation, the total concentration of uranium will also belimited by the aqueous solubility limit under the specific geochemical conditions. As the sedimentis slowly oxidized (i.e., the Eh increases from -0.6 V to +0.4 V), the uranium solubility slowlyincreases. The combination of physical heterogeneities (i.e., higher permeability zones) and
7

chemical heterogeneities [zones of differing Fe(II) mass and speciation] will result in portions ofthe reduced barrier being oxidized before other portions. This will result in the release of uraniumto solution over a longer period of time than with a completely homogeneous sediment.
2.4 Reaction and Reactive Transport Modeling
In this study, numerical modeling was used to simulate both batch and column systemswith one or multiple reactions. Differential forward and reverse mass flux equations of the speciesfor the reactions considered in each case (Szecsody et al. 1994, 1998b) were solved numericallywith the fourth-order Runge-Kutta method in batch and a stiff reaction solver method during trans-port (Hindmarsh 1983). The accuracy of the batch reaction model and submodel of the transportcode RAFT (Chilakapati 1995) was tested by comparing it with analytical solutions of a singlefirst-order reaction, a mixed first-second-order reaction, and two reactions (series and parallel).
The chemical reaction submodel was readily incorporated into the transport code with anoperator splitting technique to solve the reactive contributions from advection and dispersionseparately. Three-dimensional advective transport was solved by a modified method of character-istics in which incompressible flow was obtained by the characteristic-conservative method and theconcentrations were obtained by the characteristic-mixed method (Arbogast et al. 1992). Thecombined method is a direct numerical approximation of the Reynolds transport theorem in thatfluid packets are followed along volume-preserving streamlines and the dispersive, reactivecontributions are computed. The code has been tested extensively and the convergence of thenumerical methods established (Chilakapati et al. 1998). The accuracy of the multireaction reactivetransport system in this study was compared with an analytical solution of transport with a singlekinetic reaction (Parker and van Genuchten 1984) and a numerical code transport with multiplekinetic/equilibrium reactions (Salvage et al. 1995; Yeh et al. 1998).
8
3.0 Uranium Transport in Natural (oxic) Aquifer Conditions
3.1 Batch Adsorption Experiments
Dissolved U(VI) species interact with Hanford Area sediments even under oxidizing condi-tions. At the concentrations of dissolved uranium naturally present in the unconfined aquifer at theHanford 100 H Area (~10 ppb), uranium adsorption to sediments was investigated. Oxygen-saturated conditions were used as a high Eh endpoint, although the conditions in the aquifer varyfrom 3 to 8 mg/L. Two batch experiments were considered to develop a general estimate of thepartitioning of U(VI) species between the aqueous phase and various mineral surfaces of thesediment. These experiments consisted of mixing 0.01 to 3.0 g of Hanford 100 H sediment with 5to 20 mL of synthetic groundwater containing 10 to 1000 ppb uranium for 48 hours, then ana-lyzing the uranium remaining in solution. The sediment was from well H5-8 at 44 to 45 ft, and the<4.7-mm fraction was used in the experiments. The synthetic groundwater consists of deionizedwater and salts to create a solution of the major ions found in the unconfined aquifer (15 mg/LNaCl, 8.2 mg/L KCl, 67 mg/L CaSO4, 13 mg/L MgCO3, 150 mg/L CaCO3, and 15.3 mg/LH2SiO3), and the pH was adjusted to 7.7–8.6.
The adsorption isotherm experiment considers adsorption over a range of uranium concen-trations with the pH and Eh fixed. As described in Section 2.1, a linear correlation between themass adsorbed and in solution indicates a large number of adsorption sites, and the partitioning canbe modeled as a single species adsorbing to a single type of site. Decreasing adsorption at higherconcentrations would indicate a limited number of sites. A nonlinear slope at low concentrationsindicates more than one major type of adsorption affinity (i.e., several mineral phases and/orseveral aqueous species). The pH edge experiment consists of measuring adsorption at differentpH values while keeping the Eh and uranium concentration fixed. This type of experiment can beused to determine whether the multiple U(VI)-carbonate solution species present are reacting asanions. Buffers to maintain pH were not used in any of these uranium experiments due to complex-ation with uranium. Instead, the pH was carefully checked and adjusted over several hours ordays using HCl or NaOH.
Analysis of both surface and solution species confirmed that aqueous species and surfacespecies oxidation state. One filtered liquid sample (no additional treatment) was used to measureU(VI) species in solution (Brina and Miller 1992, 1993, Appendix), and a second filtered liquidsample was treated with 0.03% peroxide to oxidize any U(IV) to U(VI). The difference betweenthe total solution uranium in this liquid sample [U(VI)aq + U(IV)aq] and the previous [U(VI) aq] insolution gave U(IV)aq. The sediment containing any adsorbed or reduced/precipitated uraniumspecies was washed and treated with 2 mol L-1 HNO3 to mobilize uranium species (which shouldnot oxidize uranium). Analysis of this sample provided U(VI)surface (i.e., [U(VI)aq + U(VI)surface]- [U(VI)aq]). A second sample of this solubilized surface uranium was then treated with 0.03%peroxide to oxidize any surface U(IV) to U(VI) to quantify U(IV)surface (i.e., [U(VI)surface +U(IV)surface + U(VI)aq + U(IV)aq] - [U(VI)aq + U(IV)aq] - [U(VI)surface]).
9

3.2 Results
The adsorption of 10 ppb U(VI) species (Figure 2a) shows typical anion-like behavior withhigher adsorption at lower pH; this is consistent with the dominant aqueous species [UO2(CO3)34-
and UO2(CO3)22-] identified previously for dissolved U(VI) at these pH and oxidizing conditionsand with the experimental results of Waite et al. (1994). In that study, adsorption of U(VI) toferrihydrite, a microcrystalline hydrous iron oxide, was measured over a wide pH range, andsurface complexation modeling was used to determine the composition and charge of the adsorbingU(VI) species. In contrast to the anionic adsorption observed in this study at pH 8.3, the dominantaqueous species of dissolved U(VI) are positively charged (Langmuir 1978) charged at low pH,
a)
0.0
0.1
1.0
10.0
100.0
10-3 10-2 10-1 100 101
S (µ g
g-1)
C (µg cm-3 or ppm)
Langmuir
Langmuir-Freundlich
b)
0.0
50.0
100.0
150.0
200.0
6 6.5 7 7.5 8 8.5 9
Kd
(cm
3
/g)
pH
pH 7.7 naturalground water
Figure 2. Uranium Mobility Under Natural (oxic) Conditions with 100 H Area Sediment Shown by: a) adsorption of U(VI) species at different pH, b) adsorption at different U(VI) species concentration
10
and cationic adsorption increases with increasing pH. This adsorption behavior has been observedon ferrihydrite (Waite et al. 1994) and smectite clay (Turner et al. 1996). Thus, uranium adsorp-tion behavior over a wide pH range incorporates cationic species behavior at low pH (adsorptionincreasing above pH 4 to nearly 100% at pH 7) and anionic behavior at high pH (adsorptiondecreasing to 0% above pH 9). Geochemical surface complexation modeling was used to identifythe U(VI) species that are adsorbing to the single mineral surfaces present in those studies.
Because the natural sediment used in this study contains several reactive iron phases, theU(VI)-carbonate species are likely adsorbed to several mineral surfaces present in the 100 Hsediment. Previous mineralogical experiments (Amonette et al. 1994; Fruchter et al. 1996) haveidentified specific iron-oxide phases (amorphous and crystalline iron oxides) and clays that areinvolved in the iron reduction and oxidation reactions discussed. These highly reactive phases arepresent in low concentrations in a matrix of mainly nonreactive quartz, feldspar, and basaltminerals. It was beyond the scope of this study to determine which mineral phases were primarilyresponsible for the uranium adsorption in oxic systems. Solution and surface speciation analysisfor these oxic samples indicated that all solution and surface species were U(VI), so adsorption(not reduction/precipitation) was assumed responsible for removal of U(VI) species from solution.
The uranium adsorption to the a single 100 H sediment in this study was significantlygreater than average adsorption observed in other studies in a range of Hanford sediments. For thesediment used in this study (well H5-8 at 44 to 45 ft,<4.7 mm), a Kd = 28 cm3/g was estimated(Figure 2a) at the groundwater pH of 7.7. In contrast, average uranium adsorption in shallowHanford sediments was 0.6 cm3/g in natural oxic water at low ionic strength (whole sediment)(Kaplan and Serne 1995). This average is based upon an earlier batch study in which U(VI)adsorption was 2.4 ± 0.6 cm3/g (< 2 mm) (Serne et al. 1993) and an earlier column study in whichU(VI) adsorption was 0.08 to 2.81 cm3/g.(a) Although the average U(VI) adsorption was signifi-cantly lower than observed, one shallow sediment had greater adsorption (Kd = 79 ± 26 cm3/g)(Serne et al. 1993) than observed in this study, which may have been caused by high clay contentin this sediment. These results illustrate the importance of characterization of the spatial variabilityof adsorption to accurately predict the far-field migration of a U(VI) plume.
A second batch experiment was conducted at other U(VI) concentrations (10–1000 ppb)(Figure 2b) to determine whether adsorption differs at high concentration. A linear adsorptionisotherm (2) can fit the low concentration data but fails to approach the observations at 1 ppm,indicating the importance of site limitations. These data were fit with a Langmuir adsorptionisotherm (5) that assumes adsorption of a single species to a single type of adsorption site. Theadsorption affinity was relatively well defined (0.35 cm3 µg-1), but the adsorption maximum waspoorly defined (80 µg g-1). A second fit using a Langmuir-Freundlich adsorption isotherm (7)provided a better fit to the data with a slightly nonlinear slope at low concentration (slope = 0.74),which indicates heterogeneous adsorption with differing average adsorption affinity at differingconcentrations. The Langmuir-Freundlich isotherm had a well defined average affinity of 5.0 cm3
µg-1 and poorly defined adsorption maxima of 13 µg g-1 . This isotherm data indicate that if a largemass of U(VI) were released from the reduced sediment as it was oxidized, the uranium would beattenuated considerably and high concentration peak(s) would be reduced.
(a) Lindenmeier CW, RJ Serne, JC Conca, and AT Owen. 1994. Column Studies of U(VI)Transport in Hanford Sediments. Unpublished data collected at Pacific Northwest NationalLaboratory, Richland, Washington.
11

12

4.0 Uranium Immobilization in Reducing Aquifer Conditions
As dissolved U(VI) species in oxic or partially oxic groundwater encounters the permeableredox barrier containing reactive adsorbed Fe(II) and surface Fe(II) species, dissolved oxygen isstripped out of solution, and the dissolved uranium is reduced and precipitates as U(IV) species, aspreviously discussed. In this section, processes that affect the quantity and rate of uraniumimmobilization are assessed, including the iron redox reactions and the reduction/precipitation rateof uranium in the reduced sediment.
4.1 Batch and Column Experimental Methods
A series of batch and column experiments was conducted to determine the mass and rate ofreduction of iron in sediment by the reduction solution (sodium dithionite pH buffered to 11.0).Other batch experiments were then conducted using the reduced sediment to determine the removalrate of uranium species from solution in these reducing conditions. Batch sediment reductionexperiments consisted of a series of septa-top vials in which 6.0 g of sediment was mixed with10 mL of dithionite solution for a specified time (minutes to tens of hours), then the solution wasfiltered and analyzed for dithionite remaining in solution. The dithionite solution contained0.06 mol L-1 sodium dithionite (also called sodium hydrosulfite, Na2S2O4), 0.24 mol L-1 K2CO3,and 0.024 mol L-1 KHCO3. These batch experiments were conducted inside an anaerobic chamberto prevent the dithionite from reacting with oxygen. The dithionite concentration was measured byUV absorption at 315 nm. Two reactions were studied, reduction of iron in the sediment, whichhas a half-life of ~5 hours, and a disproportionation reaction with a half-life of 27 hours. Based onthe rate of these reactions, batch reduction experiments were completed within 60 hours.
Sediment reduction studies were also conducted in 1-D columns. These experimentsconsisted of injecting the dithionite solution at a steady rate into a sediment column and measuringthe concentration of dithionite over time in the effluent (details in Szecsody et al. 1998a) for 48 to120 hours. The flux rate was chosen to achieve specific residence times of the dithionite solutionin the column (2 to 14 hours) relative to the reaction rates. The dithionite concentration in theeffluent was measured once per hour using an automated fluid system and data logging equipment.
The rate of U(VI) species removal from solution was studied in batch experiments in which2 g of sediment was initially fully reduced in batch vials as described above. The reduced sedimentand dithionite solution was then centrifuged (5000 rcf, 15 minutes), supernatant removed, anoxygen-free synthetic groundwater solution (described in section 3.1) added, and sediment resus-pended. This soil washing procedure was repeated three times to remove nearly all the dithionitesolution. The reduced and washed sediment was then mixed with 10 mL of U(VI)-carbonatesolution. These vials sacrificed and uranium remaining in solution and on surfaces was analyzed attimes ranging from minutes to 100 hours. Given that the uranium analyzer used in these studies(Brina and Miller 1993, Appendix) measures U(VI) species in solution, a series of chemicaltreatments was used to measure U(VI) and U(IV) in solution and on the sediment surface, asdescribed in Section 3.1.
13

4.2 Sediment Reduction Studies
A study of the reduction and oxidation of iron in natural sediments by dithionite (Szecsodyet al. 1998a) provided mechanism information that was needed to explain uranium remobilizationduring oxidation. The reduction of surface iron by sodium dithionite in batch systems (Figure 3a)has shown that a third-order reaction for the reduction of iron is needed to describe the data:
S2O4-2 + 2�≡ Fe3+ <==> 2 �≡ Fe2+ + SO3
-2 + 2H+ (14)
in comparison to a first-order approximation of this reaction with the assumption that ≡Fe3+
remains constant and can be considered constant:
b)
0.020
0.025
0.030
0.035
0.040
0.045
0.050
0 2 4 6 8 10
Dit
hion
ite
(mol
/L)
time (h)
0.0
0.2
0.4
0.6
0.8
1.0
0 4 8 12 16 20 24
0 1 2 3 4 5
0
0.01
0.02
0.03
0.04
0.05
FeII
/Feto
tal
time (h)
pore volumes
dith
ioni
te (m
ol/L
)
dithionite data
model
fraction reduced iron
third-order model
first-order model
a)
Figure 3. Processes Controlling Uranium Immobilization in Reduced Aquifer Conditions: a) rate of U(VI) reduction and precipitation in contact with dithionite reduced sediment (batch experiments and simulation), b) rate of iron reduction in sedi-ment shown by 1-D column experiment with sodium dithionite injection and slow approach to equilibrium
14
S2O4-2 <==> 2 �≡ Fe2+ + SO3
-2 (15)
Reaction (15) is reasonably valid for injections in which the iron is in far excess of the dithionite.A second reaction is also needed for this system that describes the disproportionation of dithionitein contact with sediment:
2S2O4-2 + H2O <==> S2O3-2 + 2HSO3- (16)
Reduction of Hanford sediment was matched with reactions (14) and (16), indicating theimportance of the limited number of reducible iron sites in describing the reaction rate. The rate ofreduction of sediment had a half-life of ~5 hours.
Reduction of iron in sediment during transport is shown by a 1-D column experiment(Figure 3b) in which the initial fast breakthrough of dithionite is followed by a slow approach toequilibrium. Reactions (14) and (16) were needed to fit these data (i.e., a simpler approach;reactions 15 and 16 could not fit the data). In addition to the two chemical reactions, a slow physi-cal approach to equilibrium was needed. In a column experiment of the breakthrough of dissolvedoxygen in a nonreduced sediment (not shown), the slow approach to equilibrium (relative to atracer) indicated that a fraction of the sites were slower to be accessed. Based on this result, adiffusion step was added for a fraction of the iron sites
S2O4-2 + 2�≡�≡ Fe3+ <==> 2 �≡�≡ Fe2+ + SO3
-2 + 2H+ (17)
where the total number of oxidized or reduced iron sites is the sum of sites in reactions 14 and 17.
4.3 Uranium Immobilization by Reduced Sediment
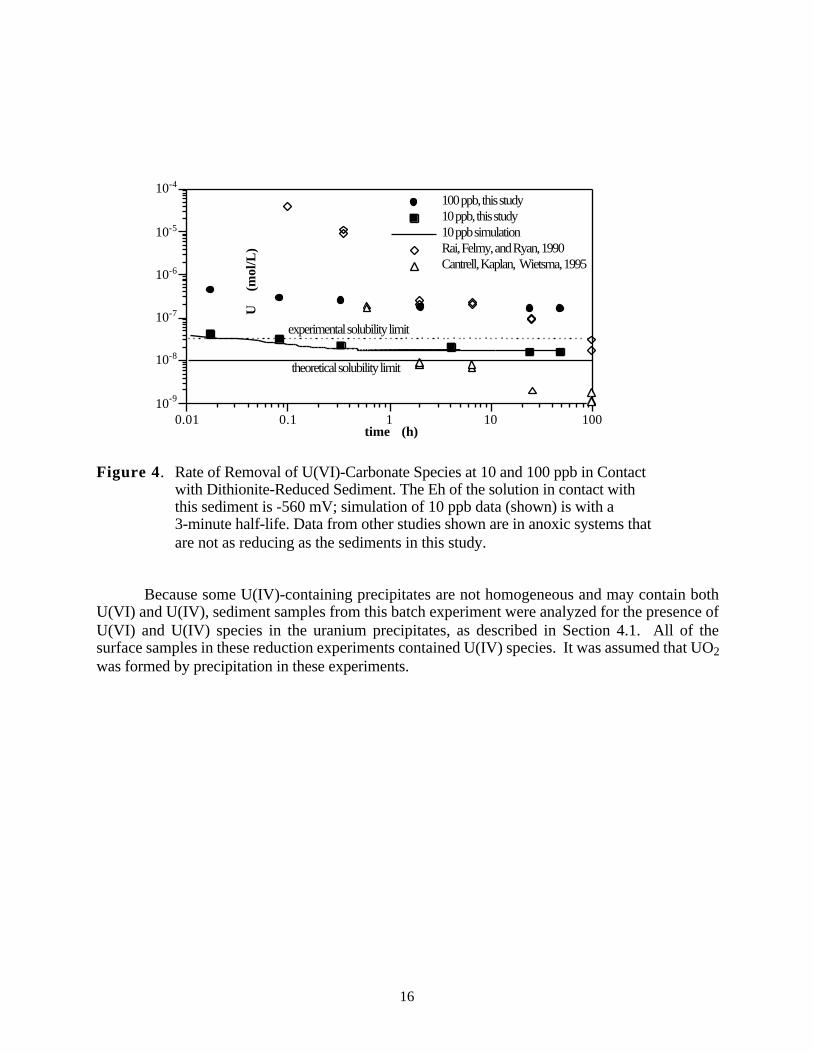
The removal of U(VI)-carbonate species added to reduced sediment was mainly byprecipitation, so it was not dependent on the type of reduced iron species present on the sedimentsurfaces. Batch time-course experiments were conducted at two initial U(VI) concentrations (10and 100 ppb) (Figure 4), both of which decreased in concentration to the solubility limit in anoxicsystems. These results are in good agreement with the solubility results of others (Rai et al. 1990;Cantrell et al. 1995). The solid line (Figure 4) represents the solubility limit of amorphousUO2.xH2O under reducing conditions in contact with metallic iron or EuCl2 as a reductant (Rai etal. 1990). The dashed line represents the maximum extent of the scatter of their solubility values.In a different study of metallic iron particles as potential permeable barrier material (Cantrell et al.1995), similar immobilization of uranium was also observed (also plotted in Figure 4), indicatingthat the solubility limit was controlling the aqueous uranium and that there was little influence ofthe specific type of reduced surface sites.
The rate of removal of U(VI)-carbonate species (Figure 4) was within minutes, and thereaction used considered the uranium removal from solution as a precipitation reaction:
UO2(CO3)34- <==> UO2 (18)
This first-order reaction was fit to the 10 ppb uranium data with a half-life of three minutes.
15
10-9
10-8
10-7
10-6
10-5
10-4
0.01 0.1 1 10 100
100 ppb, this study10 ppb, this study10 ppb simulationRai, Felmy, and Ryan, 1990Cantrell, Kaplan, Wietsma, 1995
U
(mol
/L)
time (h)
theoretical solubility limit
experimental solubility limit
Figure 4. Rate of Removal of U(VI)-Carbonate Species at 10 and 100 ppb in Contact with Dithionite-Reduced Sediment. The Eh of the solution in contact withthis sediment is -560 mV; simulation of 10 ppb data (shown) is with a 3-minute half-life. Data from other studies shown are in anoxic systems that are not as reducing as the sediments in this study.
Because some U(IV)-containing precipitates are not homogeneous and may contain bothU(VI) and U(IV), sediment samples from this batch experiment were analyzed for the presence ofU(VI) and U(IV) species in the uranium precipitates, as described in Section 4.1. All of thesurface samples in these reduction experiments contained U(IV) species. It was assumed that UO2 was formed by precipitation in these experiments.
16
5.0 Uranium Remobilization During Aquifer Oxidation
The U(IV) precipitate that forms on the reduced sediment will remobilize into solutionwhen the reductive capacity of the permeable barrier is exhausted and the reduced iron in theaquifer sediment is oxidized by dissolved oxygen in the groundwater. The rate of uraniumremobilization depends on several reactions or processes, including the oxidation rate of thereduced Fe(II) barrier, the oxidation rate of U(IV) species, and aging of the U(IV) precipitate-sediment assemblage. Experiments to quantify these processes and transport modeling to simulatethe predicted uranium movement under field conditions are described in this section.
5.1 Batch and Column Experimental Methods
The rate at which the dithionite-reduced sediment was oxidized was studied in 1-Dcolumns. These experiments consisted of injecting oxygen-saturated (8.2 mg L-1 or 256 µmol L-1)synthetic groundwater (Section 3.1) at a steady rate into a reduced sediment column and measuringthe concentration of dissolved oxygen over time in the effluent (details in Szecsody et al. 1998a)for 100 to 3200 hours. The flux rate was chosen to achieve specific residence times of thedissolved oxygen in the column relative to the oxidation rate(s) of the sediment.
The rate of U(IV)-species release into solution was studied in batch experiments in which2 g of uranium precipitate on reduced sediment was initially prepared as described in Section 4.1and the oxidation experiments conducted immediately. These batch oxidation studies were con-ducted for the following initial conditions: a) 10 ppb U(VI) initially in solution at pH 8.6,b) 10 ppb U(VI) initially in solution at pH 8.2, and c) 100 ppb U(VI) initially in solution atpH 8.2. Each experiment consisted of six to eight separate sealed vials in which oxidation isinitiated by opening each tube in an oxygen-rich environment. There was enough excess oxygenin the headspace of each vial to fully oxidize the sediment. Vials were not kept open to preventlosses from evaporation, which would have complicated the results. Vials were then rotary-mixedand sacrificed at specific times ranging from 1 to 800 hours and analyzed for solution U(VI) andU(IV) species, as described in Section 4.1.
Long contact times of uranium precipitates with sediment can lead to slower uraniumrelease rates when the sediment is oxidized (Payne et al. 1994). The aging effect was examined byconducting additional batch experiments in which there were 170 and 1000-hour contact times ofthe uranium precipitate and reduced sediment before the oxidation experiments were conducted.With these relatively short time scales, there is likely little iron oxide recrystallization comparedwith what occurs in field systems with decades of contact time, but these experiments provided anindication of the importance of this aging process.
5.2 Sediment Oxidation Studies
The release of reduced uranium into solution will begin when the reduced sediment-watersystem is oxidized such that the Eh is greater than 0.0 V (Garrels and Christ 1965). Although theuranium release is caused by the dissolution of the uraninite, the rate of this release is controlledpartially by the oxidation rate of the reduced iron, because it mainly controls the redox conditions.
17
In most field systems of interest, the main oxidant for reduced iron is dissolved oxygen in water,and the rate of iron oxidation at pH 8 (see Section 2.3) has been reported as seconds for pure ironoxides (Buerge and Hug 1997). However, for the natural sediments of this study, which containmultiple iron oxide phases, the sediment oxidation rate is considerably slower and the mechanismlikely more complex than a single reaction.
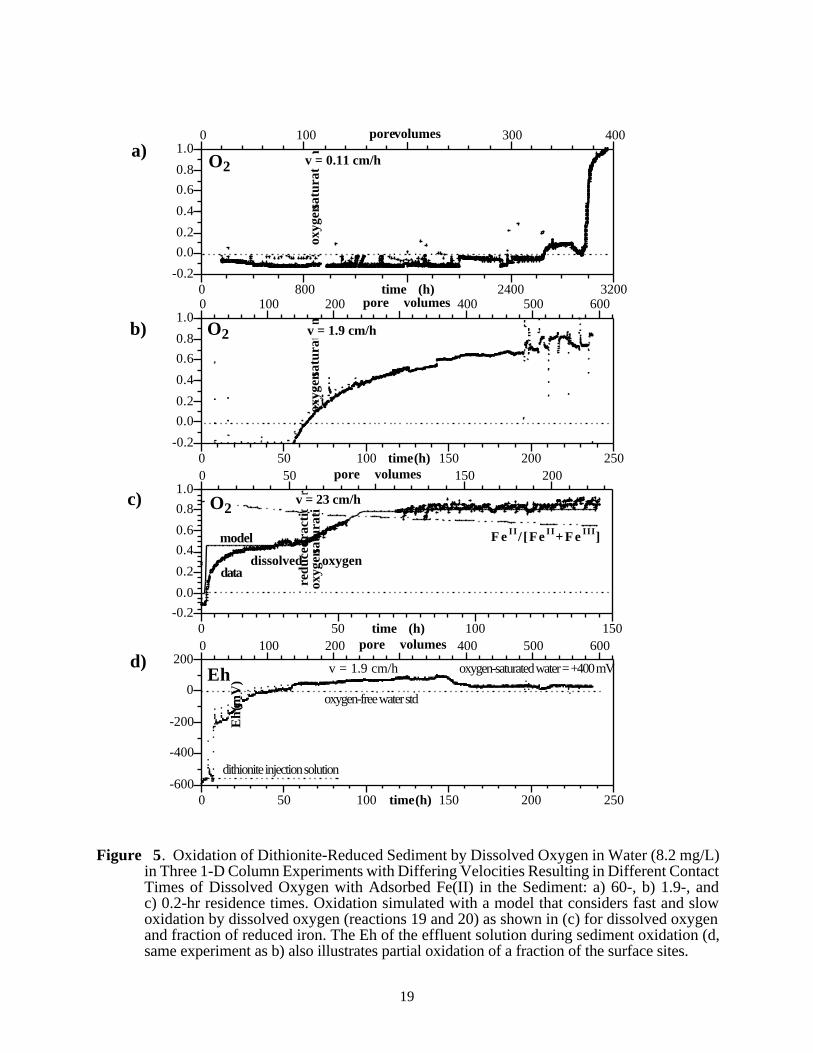
A study of the reduction and oxidation mechanisms of the sediments (Szecsody et al.1998a) showed that a large fraction of the sediment is oxidized within an hour, but hundreds ofhours are needed to fully oxidize the sediment. This concept is illustrated by three oxidationcolumn experiments at differing pore water velocities (Figure 5a–c) in which the slowest velocity(Figure 5a) shows dissolved oxygen remaining low for 370 pore volumes, after which oxygensaturation is quickly achieved. This equilibrium breakthrough curve shape is caused by theoxidation reaction rate being considerably faster than the residence time in the column (60 hours),therefore, dissolved oxygen had time to fully react with reduced iron. At a velocity at whichdissolved oxygen only partially reacts with reduced iron (Figure 5b, residence time 1.9 hours),dissolved oxygen breakthrough rises after 100 pore volumes, then slowly approaches oxygensaturation. At a higher velocity (Figure 5c, residence time 0.2 hours), partial oxygen breakthroughoccurs almost immediately, followed by the slow approach to oxygen saturation over hundreds ofpore volumes. A rough approximation of the sediment oxidation rate half-life is 0.25 hour, basedon the dissolved oxygen plateau in Figure 5c (10–60 pore volumes).
The oxidation of reduced iron in the natural sediment appears to be more complex than asingle oxidation reaction and is likely controlled by both chemical and physical processes. Areactive transport model was used to simulate the oxidation of the sediment with a single reaction:
4≡Fe2+ + O2 + 4H+ <=> 4�≡ Fe3+ + H2O (19)
which is the stoichiometric addition of reactions 5 through 7. This single reaction could not fit thedissolved oxygen breakthrough data shown in Figure 5c, which contains multiple slope changes.However, with the addition of a second type of reduced iron
4≡≡Fe2+ + O2 + 4H+ <=> 4�≡≡ Fe3+ + H2O (20)
that dynamic breakthrough curve shape can generally be fit using both reactions 19 and 20 (lineshown in Figure 5c). This simulation had 20% of the reduced iron is modeled with reaction 20with a considerably slower rate. The breakthrough curve shape is not well fit initially (0 to 20 porevolumes), and a more complex approach for reaction 19 is needed. Breakthrough curve tailing in acolumn experiment of purely dissolved oxygen in a nonreduced sediment (not shown) for 5 - 6pore volumes indicates diffusional limitations accessing a fraction of the pore volume. Thisphysical tailing for dissolved oxygen could explain the tailing observed for dissolved oxygen forthe fast oxidation reaction (Figure 5c, 10 - 40 pore volumes). Measurement of the column effluentEh (Figure 5d, same experiment as Figure 5b) also provides an indication of the complexity of theoxidation of the sediment.
Iron extractions conducted on unreduced and reduced sediments indicate that there is morethan one type of reduced iron present on the surface (Szecsody et al. 1998a). The total iron (II+III)oxides and carbonates of a sediment sample tested was 0.14% of the sediment by weight. Of theseiron phases, ~85% were Fe(III) oxides, 2.4% was Fe(II)CO3, and 9% other Fe(II) species.
18
-0.2
0.0
0.2
0.4
0.6
0.8
1.0
0 800 1600 2400 3200
0 100 200 300 400
time (h)
oxyg
en sa
tura
tion
pore volumes
v = 0.11 cm/h
-0.2
0.0
0.2
0.4
0.6
0.8
1.0
0 50 100 150 200 250
0 100 200 300 400 500 600
time (h)
pore volumesox
ygen
satu
rati
onv = 1.9 cm/h
-0.2
0.0
0.2
0.4
0.6
0.8
1.0
0 50 100 150
0 50 100 150 200
oxyg
en sa
tura
tion
time (h)
pore volumes
redu
ced fr
acti
on or
F e II/ [Fe II+ F e III]
dissolved oxygendata
model
v = 23 cm/h
a)
b)
c)
O2
O2
O2
d)
-600
-400
-200
0
200
0 50 100 150 200 250
0 100 200 300 400 500 600
Eh
(mV
)
time (h)
pore volumes
oxygen-free water std
dithionite injection solution
oxygen-saturated water = +400 mVv = 1.9 cm/hEh
Figure 5. Oxidation of Dithionite-Reduced Sediment by Dissolved Oxygen in Water (8.2 mg/L)in Three 1-D Column Experiments with Differing Velocities Resulting in Different ContactTimes of Dissolved Oxygen with Adsorbed Fe(II) in the Sediment: a) 60-, b) 1.9-, andc) 0.2-hr residence times. Oxidation simulated with a model that considers fast and slowoxidation by dissolved oxygen (reactions 19 and 20) as shown in (c) for dissolved oxygenand fraction of reduced iron. The Eh of the effluent solution during sediment oxidation (d,same experiment as b) also illustrates partial oxidation of a fraction of the surface sites.
19

Dithionite treatment resulted in the sediment containing 80% ion exchangeable F(II) (i.e., adsorbedto the surface) and 9% Fe(II)CO3. Subsequent oxidation of the sediment by dissolved oxygenresulted in oxidation of all the ion-exchangeable Fe(II) and half of the Fe(II)CO3. Thus quicklyoxidizing sites may represent adsorbed Fe(II) and slowly oxidizing sites may represent Fe(II)CO3,which is considerably slower to oxidize by dissolved oxygen. In addition, a small percentage ofthe reduction capacity (< 4%) of the sediment is due to Mn(II).
5.3 Uranium Mobilization Experiments
U(IV) oxidation (i.e., remobilization) experiments were conducted under a range of geo-chemical conditions likely to be encountered in the field. Batch experiments were conducted with a24-hour contact time of the U(IV) precipitate and reduced sediment, pH 8.2 to 8.5, and 10 to100 ppb initial U(VI) concentration (Figure 6a). The experiments at 10 ppb initial U(VI) speciesconcentration and pH 8.2 and 8.6 showed that the oxidation rate had a 100–300-hour half-life.Uranium mining literature supports the conclusion that U(IV) oxidation rates are slow in high-pHcarbonate systems (Pearson and Wadsworth 1958). The experiment with 100 ppb U(VI) initiallyshowed a slower oxidation rate.
The oxidation of uraninite by dissolution was modeled as requiring dissolved oxygen inorder to create the condition that the Eh needed to be greater than 0.0 V for uraninite oxidation tooccur:
UO2 + O2 <=> UO2(CO3)34- (21)
This reaction proceeded very slowly at first, and most of the dissolved oxygen was used upby the reduced iron (reactions 19 and 20). After most iron sites were oxidized and some dissolvedoxygen was in solution, uranium oxidation proceeded. Thus the general shape of the uraniumrelease was small from 0.5 to 10 hours with the major release at 50 to 300 hours. The uraniumsimulation provided a relatively good fit to the pH 8.2 data (line shown, Figure 6a) with a half-lifeof 200 hours for this second-order reaction. At 100 ppb initial U(VI) concentration, the rate wasslower (450-hour half-life). Given that the U(IV) precipitates will be in contact with sediment fordecades, slower oxidation rates are expected because precipitates are slowly incorporated intometal-oxide structures. This formation of stronger uranium surface bonds over time has beenreported for U(IV) species (Payne et al. 1994) and was the subject of a second series of oxidationexperiments in which the U(IV) reduced sediment contact time was varied from 24 hours to 170hours to 1000 hours before oxidation (Figure 6b). Although there was no difference between the24 and 170-hour experiments, the 1000-hour data indicated a slower oxidation rate.
The combined rate of Fe(II) and U(IV) species oxidation result in an observed U(IV)release rate to solution that is slower than the U(IV) oxidation rate alone. A simulation wasconducted of the two-reaction Fe(II) oxidation rate (80% [reaction 16] with a half-life of six hours,20% [reaction 17] with a 120-hour half-life) coupled with the U(IV) oxidation rate (200-hour half-life) (Figure 6c) . These results show that uranium release to solution slows at later times as therelease rate becomes limited by the slowly oxidizing Fe(II) sites. Given these slow release rates,uranium concentrations are not expected to reach high levels upon barrier oxidation.
20

a)
b)
0.0
0.2
0.4
0.6
0.8
1.0
1 10 100 1000
frac
tion
U
in
so
luti
on
time (h)
contact timebefore oxidation: 24 h
170 h1000 h
0.0
0.2
0.4
0.6
0.8
1.0
1 10 100 1000
frac
tion
U
in
so
luti
on
time (h)
>FeI I sites(fast and slow) fast and slow >FeII sites
U(VI) species assuming:only fast >FeII sites
c)
frac
tion
>F
eII o
r U
in s
olut
ion
0.0
0.2
0.4
0.6
0.8
1.0
1 10 100 1000
frac
tion
U
in
so
luti
on
time (h)
10 ppb, pH 8.6 datasimulation
10 ppbpH 8.2
100 ppb,pH 8.2
≡≡≡
Figure 6. Uranium Release into Solution as Hanford Sediment Is Oxidized. Uranium release shown for differing initial U(VI) concentrations and pH (a) and different uraninite-
reduced sediment contact time before oxidation (b). The uranium data were modeled assuming two different types of iron sites (slow and fast oxidizing), which influencedthe uranium release rate (c).
21
5.4 Uranium Transport Simulations
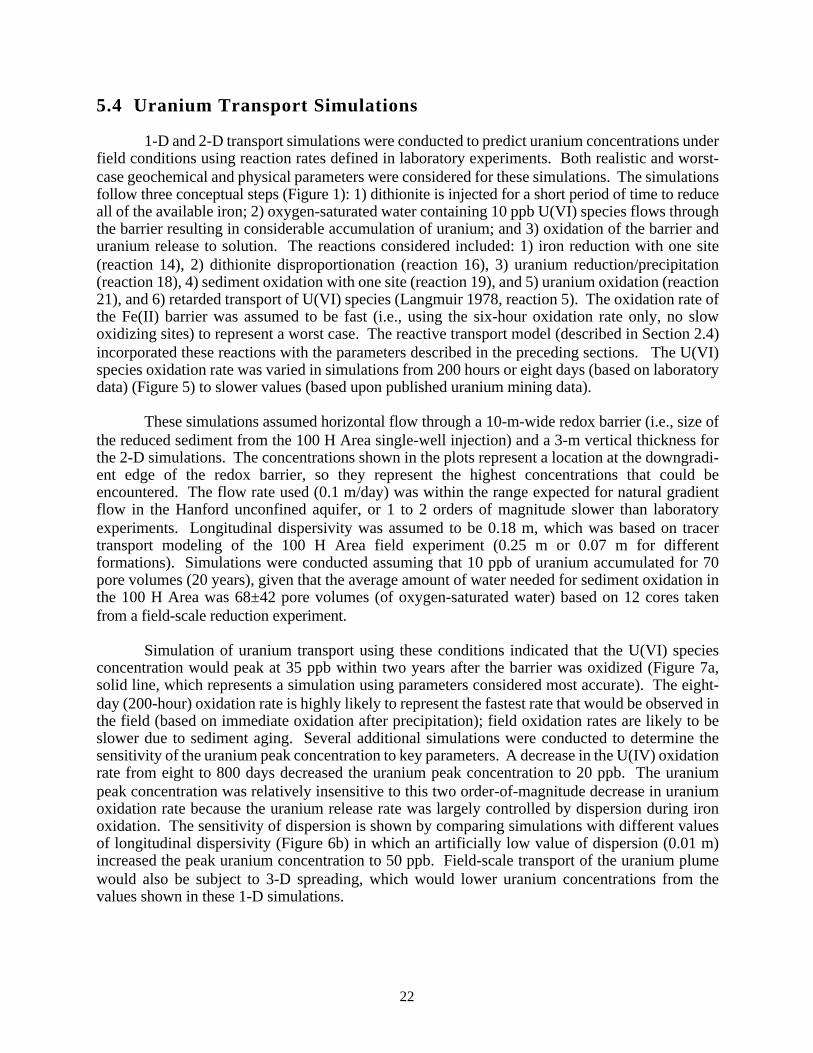
1-D and 2-D transport simulations were conducted to predict uranium concentrations underfield conditions using reaction rates defined in laboratory experiments. Both realistic and worst-case geochemical and physical parameters were considered for these simulations. The simulationsfollow three conceptual steps (Figure 1): 1) dithionite is injected for a short period of time to reduceall of the available iron; 2) oxygen-saturated water containing 10 ppb U(VI) species flows throughthe barrier resulting in considerable accumulation of uranium; and 3) oxidation of the barrier anduranium release to solution. The reactions considered included: 1) iron reduction with one site(reaction 14), 2) dithionite disproportionation (reaction 16), 3) uranium reduction/precipitation(reaction 18), 4) sediment oxidation with one site (reaction 19), and 5) uranium oxidation (reaction21), and 6) retarded transport of U(VI) species (Langmuir 1978, reaction 5). The oxidation rate ofthe Fe(II) barrier was assumed to be fast (i.e., using the six-hour oxidation rate only, no slowoxidizing sites) to represent a worst case. The reactive transport model (described in Section 2.4)incorporated these reactions with the parameters described in the preceding sections. The U(VI)species oxidation rate was varied in simulations from 200 hours or eight days (based on laboratorydata) (Figure 5) to slower values (based upon published uranium mining data).
These simulations assumed horizontal flow through a 10-m-wide redox barrier (i.e., size ofthe reduced sediment from the 100 H Area single-well injection) and a 3-m vertical thickness forthe 2-D simulations. The concentrations shown in the plots represent a location at the downgradi-ent edge of the redox barrier, so they represent the highest concentrations that could beencountered. The flow rate used (0.1 m/day) was within the range expected for natural gradientflow in the Hanford unconfined aquifer, or 1 to 2 orders of magnitude slower than laboratoryexperiments. Longitudinal dispersivity was assumed to be 0.18 m, which was based on tracertransport modeling of the 100 H Area field experiment (0.25 m or 0.07 m for differentformations). Simulations were conducted assuming that 10 ppb of uranium accumulated for 70pore volumes (20 years), given that the average amount of water needed for sediment oxidation inthe 100 H Area was 68±42 pore volumes (of oxygen-saturated water) based on 12 cores takenfrom a field-scale reduction experiment.
Simulation of uranium transport using these conditions indicated that the U(VI) speciesconcentration would peak at 35 ppb within two years after the barrier was oxidized (Figure 7a,solid line, which represents a simulation using parameters considered most accurate). The eight-day (200-hour) oxidation rate is highly likely to represent the fastest rate that would be observed inthe field (based on immediate oxidation after precipitation); field oxidation rates are likely to beslower due to sediment aging. Several additional simulations were conducted to determine thesensitivity of the uranium peak concentration to key parameters. A decrease in the U(IV) oxidationrate from eight to 800 days decreased the uranium peak concentration to 20 ppb. The uraniumpeak concentration was relatively insensitive to this two order-of-magnitude decrease in uraniumoxidation rate because the uranium release rate was largely controlled by dispersion during ironoxidation. The sensitivity of dispersion is shown by comparing simulations with different valuesof longitudinal dispersivity (Figure 6b) in which an artificially low value of dispersion (0.01 m)increased the peak uranium concentration to 50 ppb. Field-scale transport of the uranium plumewould also be subject to 3-D spreading, which would lower uranium concentrations from thevalues shown in these 1-D simulations.
22

a)
b)
0
10
20
30
4070 80 90 100 110
0
0.2
0.4
0.6
0.8
1
U(V
I)
spec
ies
(ppb
)
pore volumes
oxygen
U(IV) oxidation rate8 days (192 h)80 days800 days
frac
tion
oxyg
en sa
tura
tion
v = 0.42 cm/h = 0.1 m/day
0
10
20
30
40
50
20 25 30 35
U
(ppb
)
time (years)
αL = 0.01 m
simulations with:oxidation rate, t
1/2 = 200 h
αL = 0.18 m
Figure 7. Simulated Uranium Mobility under Field Conditions as the Redox Barrier Is Oxidized with a) different U(IV) oxidation rates, and b) different values for longitudinal dispersivity. Assumptions for these 1-D simulations includedhorizontal flow at 0.1 m/day across a 10-m wide reduced iron barrier that isoxidized in 20 years (70 pore volumes).
23
6.0 Uranium Remobilization in the Presence of Chromate
6.1 Experimental Methods
Placing the redox barrier in the 100 D area of the Hanford Site is expected to preventchromate present in the shallow aquifer from reaching the Columbia River. Chromium is a redox-sensitive contaminant that will be immobilized, like uranium, at the redox barrier as a result ofprecipitation reactions when Cr(VI) is reduced to the less soluble Cr(III) (reaction 13). Althoughthe reduction of chromate oxidizes Fe(II), because most chromate contamination is <5 ppm,dissolved oxygen is mainly responsible for oxidizing the Fe(II). Chromate would need to bepresent at a concentration of 41 mg/L to be as able to oxidize the redox barrier as dissolved oxygenis. Therefore, while chromate oxidation of the reduced sediment and the subsequent effect onuranium transport was not considered likely, because chromate is a stronger oxidant than dissolvedoxygen, it may have some impact on the barrier oxidation rate even if present at a lowconcentration. Chromate transport behavior was also studied because of the relative difference inmobility compared with uranium species. Cr(III) is not readily oxidized to Cr(VI) when the redoxbarrier is ultimately oxidized. To test this difference in behavior, a long-term column experimentwas conducted in which both U(VI) and Cr(VI) were injected through reduced sediment and theremobilization behavior monitored once the sediment was oxidized.
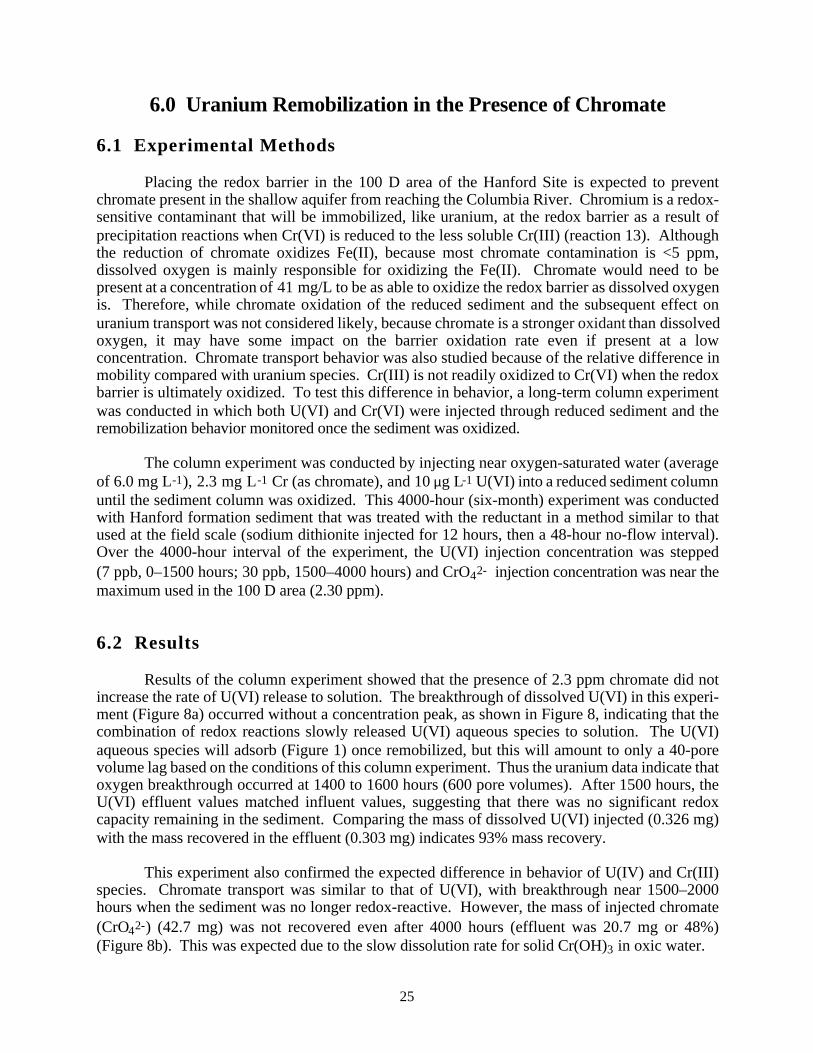
The column experiment was conducted by injecting near oxygen-saturated water (averageof 6.0 mg L-1), 2.3 mg L-1 Cr (as chromate), and 10 µg L-1 U(VI) into a reduced sediment columnuntil the sediment column was oxidized. This 4000-hour (six-month) experiment was conductedwith Hanford formation sediment that was treated with the reductant in a method similar to thatused at the field scale (sodium dithionite injected for 12 hours, then a 48-hour no-flow interval).Over the 4000-hour interval of the experiment, the U(VI) injection concentration was stepped(7 ppb, 0–1500 hours; 30 ppb, 1500–4000 hours) and CrO42- injection concentration was near themaximum used in the 100 D area (2.30 ppm).
6.2 Results
Results of the column experiment showed that the presence of 2.3 ppm chromate did notincrease the rate of U(VI) release to solution. The breakthrough of dissolved U(VI) in this experi-ment (Figure 8a) occurred without a concentration peak, as shown in Figure 8, indicating that thecombination of redox reactions slowly released U(VI) aqueous species to solution. The U(VI)aqueous species will adsorb (Figure 1) once remobilized, but this will amount to only a 40-porevolume lag based on the conditions of this column experiment. Thus the uranium data indicate thatoxygen breakthrough occurred at 1400 to 1600 hours (600 pore volumes). After 1500 hours, theU(VI) effluent values matched influent values, suggesting that there was no significant redoxcapacity remaining in the sediment. Comparing the mass of dissolved U(VI) injected (0.326 mg)with the mass recovered in the effluent (0.303 mg) indicates 93% mass recovery.
This experiment also confirmed the expected difference in behavior of U(IV) and Cr(III)species. Chromate transport was similar to that of U(VI), with breakthrough near 1500–2000hours when the sediment was no longer redox-reactive. However, the mass of injected chromate(CrO42-) (42.7 mg) was not recovered even after 4000 hours (effluent was 20.7 mg or 48%)(Figure 8b). This was expected due to the slow dissolution rate for solid Cr(OH)3 in oxic water.
25
0
10
20
30
400 400 800 1200 1600
U(V
I) sp
ecie
s (pp
b)
pore volumes
U(VI) species influent
U(VI) species effluent
0.0
1.0
2.0
3.0
0 1000 2000 3000 4000
Cr(
VI)
spec
ies (
ppm
)
time (h)
Cr(VI) species influent
v = 4.6 cm/hHanford Fm. sedimentCr(VI) species effluent
a)
b)
Figure 8. Column Experiment Results of Remobilization of U(VI) Species (a) and Cr(VI)Species (b) During Transport in, as Sediment Is Oxidized by Dissolved Oxygen
26

7. 0 Conclusions
The purpose of this study was to assess uranium mobility issues during the life cycle of anin situ redox manipulation process that is being implemented for remediation of chromate-contaminated sediment at the 100 Areas of the Hanford Site (Fruchter et al. 1996). Processes thatcontrolled the mobility of uranium during reduction and oxidation of the Hanford sediment werestudied in static (batch) and dynamic (1-D column) laboratory experiments and coupled chemical/physical processes simulated with a multireaction transport model. These studies were conductedto determine uranium mobility in 1) natural oxic groundwater systems, 2) a reducing environmentcreated by the chemical reductant (sodium dithionite), and 3 ) an oxic environment created whenthe reduced sediment is oxidized by dissolved oxygen.
Experiments defining uranium transport in the natural oxic sediment indicated that if a largerelease of uranium occurred from a reduced zone, its movement would be retarded and spread outdue to adsorption. An adsorption isotherm showed that the adsorption maximum was about threeorders of magnitude greater than the naturally occurring U(VI) concentration (10 ppb). The adsorp-tion of U(VI) species was nonlinear over a wide concentration range, indicating more than one typeof adsorption site and/or adsorbing species. This result is consistent with the fact that 1) multipleU(VI) species are present [60% UO2(CO3)34-, 30% UO2(CO3)22-, 10% (UO2)3(OH)5+] thatshowed anionic adsorption behavior, and 2) the sediment contains multiple iron oxide phases thatserve as adsorption sites. The importance of characterization of the spatial variability of adsorptionto predict far-field U(VI) migration is shown by other studies that report U(VI) adsorption valuesthree times more to 10 times less than values in this study (the average is significantly less) (Serneet al. 1993).(a)
When oxic groundwater containing U(VI) species flows through a reduced sediment zone,uranium species are reduced and precipitate as U(IV) species (presumed to be uraninite, UO2)within minutes. The reduction rate (half-life three minutes) was experimentally determined in batchsystems with 10 and 100 ppb U(VI) species initially in solution. The final concentration was nearthe solubility limit for uranium in reducing environments at pH 8. Although literature indicatessome mixed U(IV, VI) precipitates can occur, our analysis indicated only U(IV) species. This maybe caused partially by the highly reducing environment considered in this study (Eh ~-0.5 V),which was also investigated experimentally. When the sediment is treated chemically withdithionite buffered at high pH, amorphous and some crystalline iron oxides are dissolved/reduced,forming mainly adsorbed Fe(II) and some Fe(II)CO3. In addition, a small fraction (<4%) of thereduction capacity of the sediment is due to Mn(II).
The amount of uranium accumulation in the reduced sediment zone depends on the mass ofreduced iron as well as the mechanisms that eventually oxidize the zone. The mass of dithionite-reduced iron ranges from 0.05 to 0.4% for the Hanford sediments tested. Oxidation of this sedi-ment occurs by 1) advection of dissolved oxygen in groundwater; 2) advection of other oxidants,such as chromate, in groundwater; and 3) diffusion of oxygen in the vadose zone for sediments
aLindenmeier CW, RJ Serne, JC Conca, and AT Owen. 1994. ColumnStudies of U(VI) Transport in Hanford Sediments. Unpublished datacollected at Pacific Northwest National Laboratory, Richland, Washington.
27

near the water table. Dissolved oxygen in water is considered the main oxidant in this studybecause chromate would need to be present in very large (>120 ppm) concentrations to be as effec-tive. The vertical extent of oxidation by diffusion is only a few feet even after decades. Uraniumaccumulation would vary with the spatial variability of the reduced iron content. A field-scaleestimate of the 10-ppb U(VI) accumulation is ~70 pore volumes over 20 years based on corestaken from a 100 H field reduction test in 1995 that showed 68±42 pore volumes of oxygen-saturated water were needed for oxidation. Based on relatively high estimates of groundwater flowrates in the 100 D and H areas, it was estimated that this reduced zone would last approximately 20years. There is a wide variability in the amount of iron in sediments, as shown by a long-termcolumn experiment in which 800 pore volumes of oxygen-saturated water were needed forsediment oxidation. Uranium release simulations in this study were based on the amount ofuranium accumulation in 68 pore volumes of water over a 20-year period.
Although U(IV) precipitates on surfaces, geochemical processes release uranium slowly tosolution once the redox barrier is oxidized. The release of uranium back into solution is controlledby 1) the U(IV) oxidation rate, 2) the sediment oxidation rate, and c) the dispersion of the uraniumplume in the aquifer. The fastest rate of U(IV) oxidation observed in experiments had a 200-hourhalf-life, and coupled reactions likely to occur would decrease the uranium release rate. Long-timecontact of U(IV) precipitates with sediment (i.e., aging) was also shown experimentally to result inslower U(IV) oxidation rates to a 450-hour half-life after a 1000–hour uraninite-sediment contacttime. A likely aging mechanism is slow incorporation of precipitates into metal-oxide structures(Payne et al. 1994). The mechanism of oxidation of the reduced iron in the sediment is morecomplex than can be described with a single sediment oxidation reaction. The dissolved oxygenbreakthrough curve shape can be modeled with a minimum of two reactions, in which one type ofsurface iron (80%) is oxidized quickly (~ 5-hour half-life) and a second type is oxidized slowly(~120-hour half-life). The necessity of two different surface Fe(II) sites to model sedimentoxidation is consistent with measurement of two main reduced Fe(II) species by iron extractiontechniques. Sediment extractions showed the natural sediment containing ~85% Fe(III) phaseswas altered to 80% ion exchangeable F(II) (i.e., adsorbed to the surface) and 9% Fe(II)CO3 by thedithionite treatment process. Subsequent oxidation of the sediment by dissolved oxygen resultedin oxidation of all of the ion exchangeable Fe(II) and half of the Fe(II)CO3. Other experimentalevidence indicates that diffusional processes also have a minor effect on dissolved oxygenbreakthrough curve shape, so sediment oxidation is likely controlled by multiple chemical andphysical mechanisms.
Transport simulations were conducted to predict uranium concentrations under field condi-tions using the chemical reaction rates defined in laboratory experiments. Assumptions includedhorizontal flow through a 10-m-wide redox barrier, a 3-m vertical thickness, and a natural gradientflow rate (0.1 m/day). A simulation of uranium transport using the most realistic parameters indi-cated that the U(VI) species concentration would peak at 35 ppb within two years after the barrierwas oxidized. Although field oxidation rates are likely to be slower due to sediment aging,simulations decreasing the U(IV) oxidation rate by two orders of magnitude only had a minoreffect on the peak uranium concentration (20 ppb) because of the influence of the slow iron oxida-tion. Field-scale transport of the uranium plume would also be subject to longitudinal and lateralplume dispersion, which would lower uranium concentrations, as shown by simulations in whichthe longitudinal dispersivity was altered. Finally, a six-month-long column experiment with largeuranium accumulations confirmed that uranium was slowly released into solution with U(VI)concentrations elevated only slightly above injected concentration. This experiment also demon-strated that another oxidant likely to be present in some field systems, chromate, did not result in a
28

fast release rate of uranium into solution.
29

8.0 References
Adler HH. 1974. “Concepts of Uranium-Ore Formation in Reducing Environments inSandstones and Other Sediments.” Formation of Uranium Ore Deposits. Proceedings SeriesIAEA-SM-183/43, International Atomic Energy Agency, Vienna.
Amonette JE, JE Szecsody, HT Schaef, JC Templeton, YA Gorby, and JS Fruchter. 1994.“Abiotic Reduction of Aquifer Materials by Dithionite: A Promising In Situ RemediationTechnology.” In Situ Remediation: Scientific Basis for Current and Future Technologies.Thirty-Third Hanford Symposium on Health and the Environment. November 7-11, 1994, Pasco,Washington, GW Gee and NR Wing, eds. Battelle Press, Columbus, Ohio.
Arbogast T, A Chilakapati, and MF Wheeler. 1992. Numerical Methods in Water Resources, TFRussell, RE Ewing, CA Brebbia, WG Gray, and GF Pinder, eds. Computational MechanicsPublications, Southampton, UK, pp. 77-84.
Brina R and AG Miller. 1992. “Direct Detection of Trace Levels of Uranium by Laser-InducedKinetic Phosphorimetry.” Analytical Chemistry, 64 (13):1413-1418.
Brina R and AG Miller. 1993. “Determination of Uranium and Lanthanides in Real-WorldSamples by Kinetic Phosphorescence Analysis.” Spectroscopy, 8:1-14.
Bruno J, I Casas, and I Puigdomenech. 1988. “The Kinetics of Dissolution of UO2(s) UnderReducing Conditions.” Radiochimica Acta, 11:44-45.
Bruno J, I Casas, and I Puigdomenech. 1991. “The Kinetics of Dissolution of UO2 UnderReducing Conditions and the Influence of an Oxidized Surface Layer (UO2+x): Application of aContinuous Flow-Through Reactor.” Geochimica et Cosmochimica Acta, 55:647-658.
Buerge IJ and SJ Hug. 1997. “Kinetics and pH Dependence of Chromium(VI) Reduction byIron(II).” Environ. Sci. Technol., 31(5):1426-1432.
Cantrell KJ, DI Kaplan, and TW Wietsma. 1995. “Zero-Valent Iron for the In Situ Remediationof Selected Metals in Groundwater.” Journal of Hazardous Materials, 42:201-212.
Chemchek Instrument, Inc. 1995. Operations Manual: Kinetic Phosphorescence AnalyzerKPA–11. Chemchek Instrument, Inc., Richland, Washington.
Chilakapati A. 1995. RAFT: A simulator for reactive flow and transport of groundwatercontaminants. PNL-10636, Pacific Northwest Laboratory, Richland, Washington.
Chilakapati A, T Ginn, and J Szecsody. 1998. “An analysis of complex reaction networks ingroundwater modeling.”Water Resour. Res., 34(7):1767-1780.
Frondel C. 1958. Systematic Mineralogy of Uranium and Thorium. Bulletin 1064, U.S.Geological Survey, Washington, D.C.
30
Fruchter JS, JE Amonette, CR Cole, YA Gorby, MD Humphrey, JD Istok, FA Spane,JE Szecsody, SS Teel, VR Vermeul, MD Williams, and SB Yabusaki. 1996. In Situ RedoxManipulation Field Injection Test Report - Hanford 100-H Area. PNNL-11372, Pacific NorthwestNational Laboratory, Richland, Washington.
Fruchter JS, MD Williams, VR Vermeul, CR Cole, and SS Teel. 1997. Treatability Test Plan forIn Situ Redox Manipulation in the 100-HR-3 Operable Unit-D Area. Pacific Northwest NationalLaboratory, Richland, Washington.
Garrels RM and CL Christ. 1965. Solutions, Minerals, and Equilibria. Freeman, Cooper, andCompany, San Francisco, p. 450.
Hindmarsh AC. 1983. “A Systemized Collection of ODE Solvers.” Scientific Computing,RS Stepleman, ed. North-Holland, Amsterdam, pp. 55-64.
IAEA (International Atomic Energy Agency). 1980. Significance of Mineralogy in theDevelopment of Flowsheets for Processing Uranium Ores. Technical Reports Series No.196,International Atomic Energy Agency, Vienna.
IAEA (International Atomic Energy Agency). 1993. Uranium Extraction Technology. TechnicalReports Series No.359, International Atomic Energy Agency, Vienna.
Kaplan DI and RJ Serne. 1995. Distribution Coefficient Values Describing Iodine, Neptunium,Selenium, Technetium, and Uranium Sorption to Hanford Sediments. PNL-10379, PacificNorthwest Laboratory, Richland, Washington.
Langmuir DL. 1978. “Uranium Solution-Mineral Equilibria at Low Temperatures withApplications to Sedimentary Ore Deposits.” Geochimica et Cosmochimica Acta, 42:547-569.
Maynard JB. 1983. Geochemistry of Sedimentary Ore Deposits. Springer-Verlag, New York.
Parker J and MT van Genuchten. 1984. Determining Transport Parameters from Laboratory andField Tracer Experiments. Virginia Agricultural Experiment Station Bulletin 84-3, p. 94.
Payne TE, JA Davis, and TD Waite. 1994. “Uranium retention by weathered schists - the role ofiron minerals.” Radiochim. Acta , 55/56, 301-307.
Pearson RL and ME Wadsworth. 1958. “A Kinetic Study of the Dissolution of UO2 in CarbonateSolution.” Transactions of the Metallurgical Society of AIME, Vol. 212, p. 294-300.
Rai D, AR Felmy, and JL Ryan. 1990. “Uranium(IV) Hydrolysis Constants and SolubilityProduct of UO2.xH2O (am).” Inorganic Chemistry, 29:260-264.
Salvage KM, GT Yeh, JE Szecsody, and JM Zachara. 1995. “Simulation of CoII/IIIEDTATransport at Variable pH Using Two Reactive Transport Numerical Codes.” EOS, 76: 221,American Geophysical Union, Annual Fall Meeting.
31
Serne RJ, JL Conca, VL LeGore, KJ Cantrell, CW Lindenmeier, JA Campbell, JE Amonette, andMI Wood. 1993. Solid-Waste Leach Characteristics and Contaminant-Sediment Interactions.Volume 1: Batch Leach and Adsorption Tests and Sediment Characterization. PNL-8889 Vol 1,Pacific Northwest Laboratory, Richland, Washington.
Stumm W and J Morgan. 1981. Aquatic Chemistry. J. Wiley and Sons, New York.
Szecsody JE, MD Williams, DE Fedele, and JS Fruchter. 1998a. “Use of Dithionite Injection forIn Situ Iron Reduction of Sediment for Subsurface Remediation: Chemical Mechanisms Duringthe Redox Cycle.” Environ. Sci. Tech., in preparation.
Szecsody JE, JM Zachara, A Chilakapati, PM Jardine, and AS Ferrency. 1998b. “Importance ofFlow and Particle-Scale Heterogeneity on Co(II/III)EDTA Reactive Transport.” J. Hydrol., inpress.
Szecsody JE, JM Zachara, and PL Bruckhart. 1994. “Adsorption-Dissolution ReactionsAffecting the Distribution and Stability of Co(II)EDTA in Iron Oxide-Coated Sand.” Environ. Sci.Technol., 28: 1706-1716.
Turner GD, JM Zachara, JP McKinley, and SC Smith. 1996. “Surface-Charge Properties andUO+ Adsorption of a Subsurface Smectite.” Geochimica Cosmochimica Acta, 60:3399-3414.
Waite TD, JA Davis, TE Payne, GA Waychunas, and N Xu. 1994. "Uranium(VI) Adsorption toFerrihydrite: Application of a Surface Complexation Model." Geochimica Cosmochimica Acta,58:5465-5478.
Wanner H and I Forest (eds.). 1992. Chemical Thermodynamics Series, Volume 1: ChemicalThermodynamics of Uranium. North-Holland, Elsevier Science Publishing Company Inc., NewYork.
Yeh G, G Iskra, JM Zachara, and JE Szecsody. 1998. “Development and Verifications of aMixed Chemical Kinetic and Equilibrium Model.” Advances in Environmental Research,2(1):24-56.
32

Appendix
Uranium Analysis

Appendix
Uranium Analysis
Uranium concentrations [UO22+ , U(VI)] were determined using a kinetic phosphorescenceanalysis (KPA) technique (Brina and Miller 1992, 1993). This technique of measuring the phos-phorescence of a uranium complex is accurate to sub-part per billion (µg/L) concentrations. A0.5-mW pulsed-nitrogen pumped Stilbene-420 dye laser was employed to excite the sample; a425–nm excitation filter is used between sample cuvette and photomultiplier/photon counter #1. Auranium-based reference solution was used with 100 µg/L U in 0.01 N nitric acid/Uraplex inreference cuvette. A 515 emission filter is used between reference cuvette and photomultiplier/photon counter #2. Excitation of sample is set to 1000 laser pulses of 3 nanosecond duration, with20 pulses/sec. Luminescence measurements were taken at fixed time intervals (time gates) after theexcitation. For uranium, a time-gate duration of 13 microseconds (µs) was selected. The lifetimeis the time required for the intensity to fall to 1/e of its original value. A uranium complexant,Uraplex (Chemchek Instruments, Inc. 1995), is mixed with the sample (1:1) to increase thelifetime of the phosphorescence decay prior to excitation.
The first-order kinetic decay equation (A.1) describes the principle of kineticphosphorescence analysis:
ln [Xt] = ln [X0] - (kp + kq)t (A.1)
where Xt, X0 = the population of excited ions at time t (or t = 0), kp = the rate constant forphosphorescence decay, kq= the rate constant for nonradiative processes, and t = time inmicroseconds. The intensity (number of photons) of the phosphorescence signal (I) isproportional to the concentration of the emitting ions, thus
ln [It] = ln [Io] - (kp + kq)t (A.2)
which indicates that the number of detected photons at a given time is directly proportional to the
concentration of the excited ions. If a plot of ln [It] versus t is generated, the lifetime τ can becalculated from the slope (τ = -1/slope), while the intercept gives ln [Io], where Io is theluminescence intensity at the onset of the decay (t = 0). Io is directly proportional to theconcentration of the phosphorus and is independent of quenching effects.
The uranium analyzer (KPA) was calibrated between 0.1 and 150 µg/L uranium fromdilutions made from Uranium Standard Reference Material 3164 lot 791402, National Institute ofStandards & Technology (NIST), Dept. of Commerce, USA. A 5 µg/L standard dilution wasmade in 0.1 mol L-1 nitric acid. Further dilutions between 0.1 and 150 µg/L U were made indeionized water. Aqueous samples from batch and column experiments were filtered with a0.1–micron Millex -VV filter unit inside an anaerobic chamber. Filtrates were sealed in 5-mLFalcon polystyrene tubes with Parafilm before being transferred to KPA on the laboratory benchtop. The KPA is equipped with a sample changer and a syringe injector for automated injections.Typical instrument error for U analysis, including autodiluting errors, is ±3%.