upward - pearson airport
TRANSCRIPT
ONWARD
UPW
ARD
GTAA ANNUAL REPORT 2014
GTAA AN
NU
AL REPORT 2014
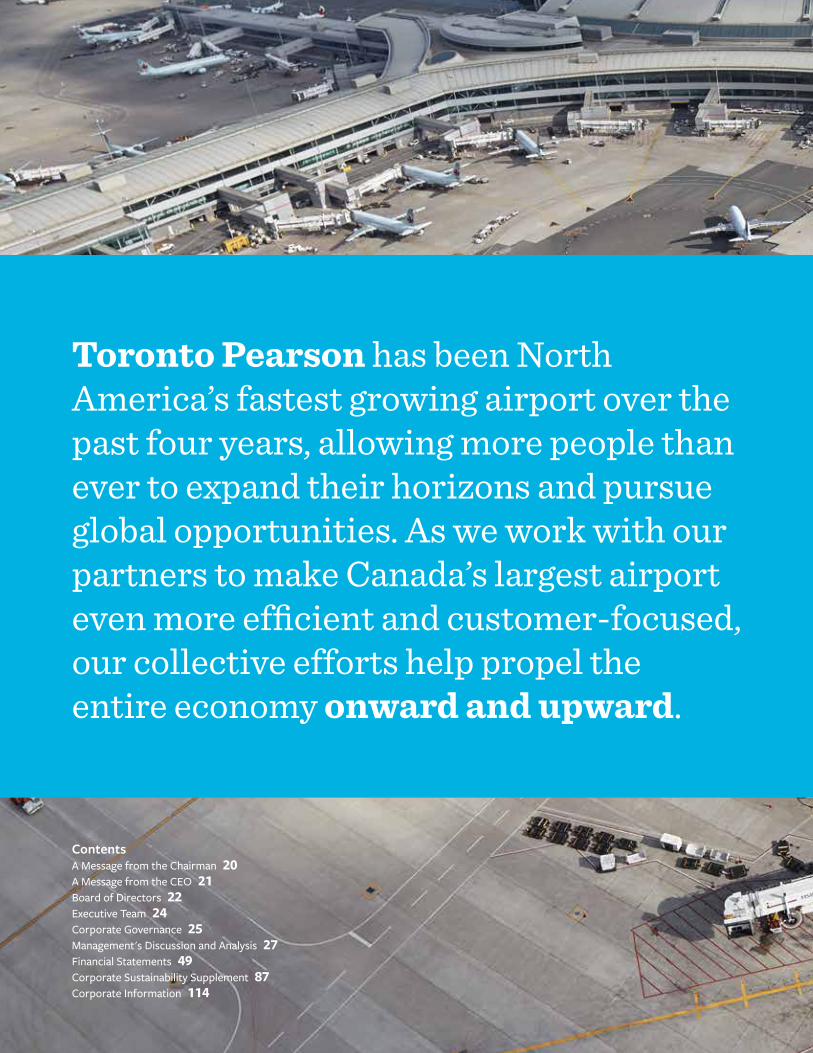
Toronto Pearson has been North America’s fastest growing airport over the past four years, allowing more people than ever to expand their horizons and pursue global opportunities. As we work with our partners to make Canada’s largest airport even more efficient and customer-focused, our collective efforts help propel the entire economy onward and upward.
ContentsA Message from the Chairman 20A Message from the CEO 21Board of Directors 22Executive Team 24Corporate Governance 25Management's Discussion and Analysis 27Financial Statements 49Corporate Sustainability Supplement 87Corporate Information 114
INTERNATIONAL
33%
UNITED STATES
27%
CANADA
40%
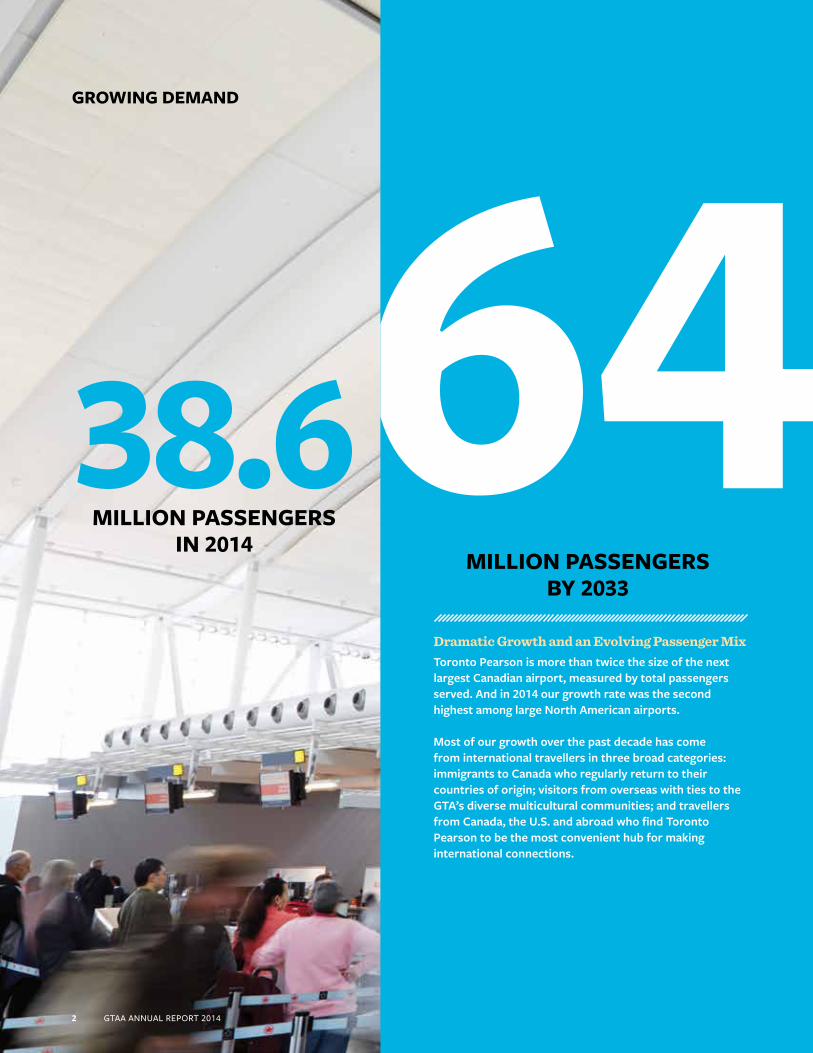
38.6MILLION PASSENGERS
IN 2014
2 GTAA ANNUAL REPORT 2014
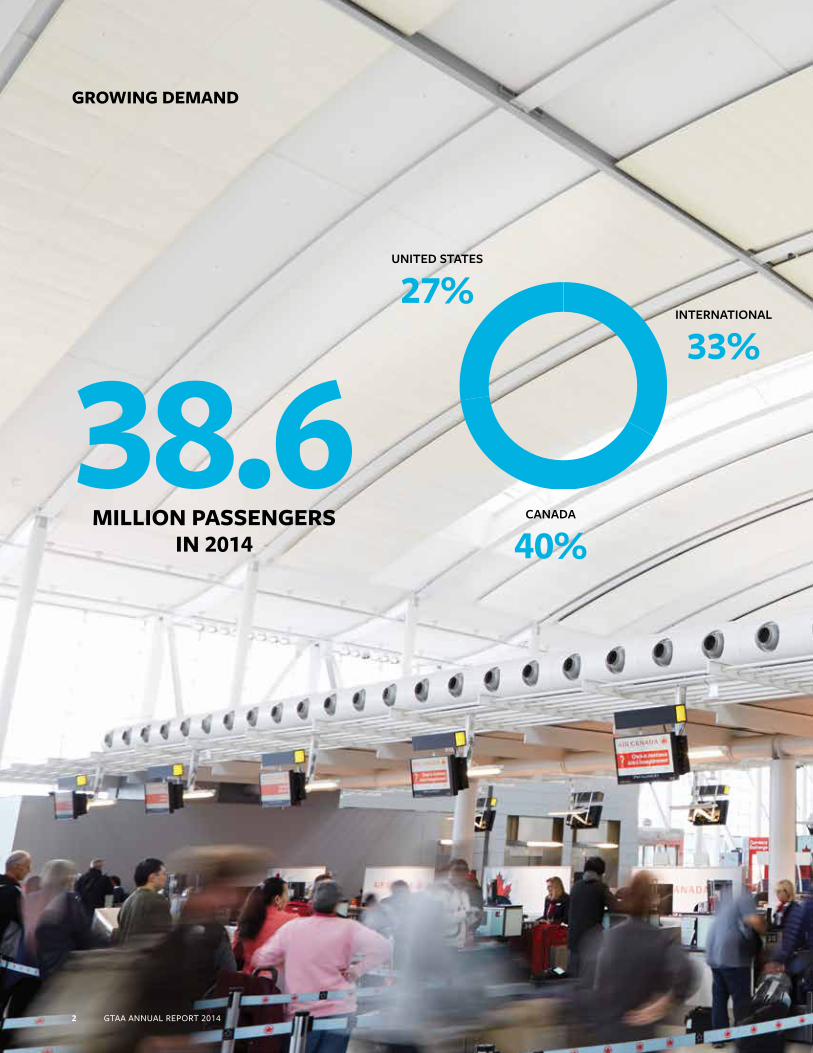
GROWING DEMAND

UNITED STATES
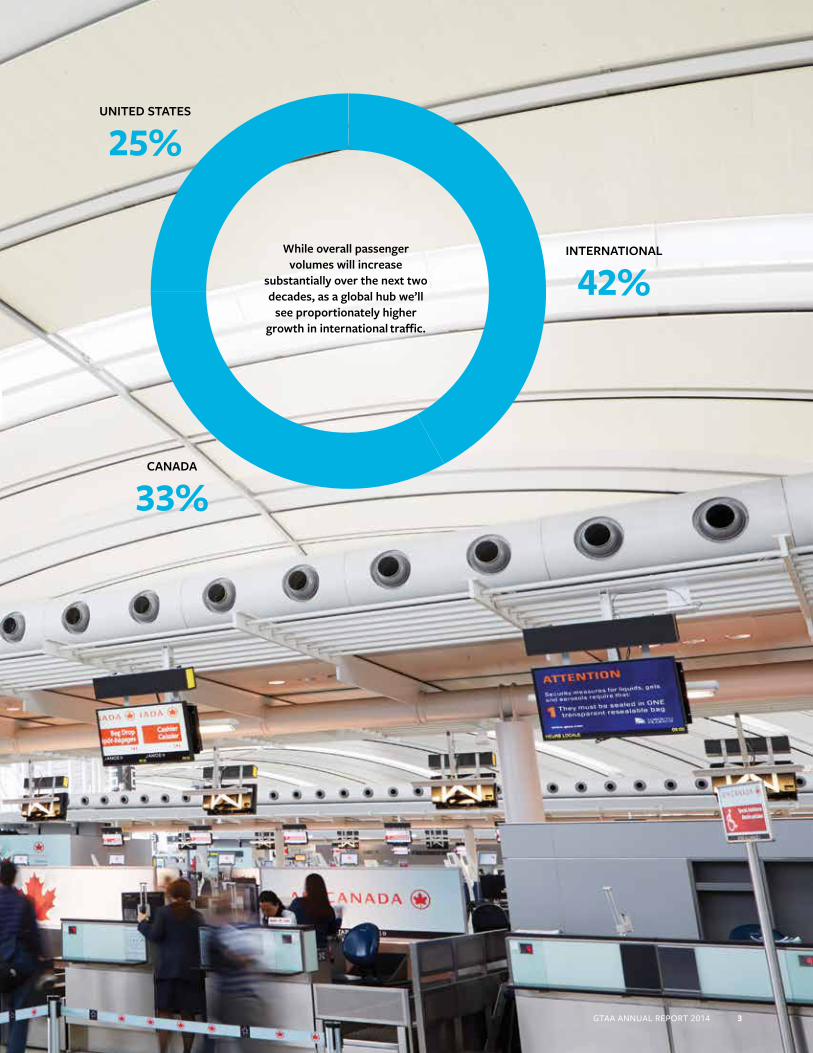
25%
CANADA
33%
INTERNATIONAL
42%While overall passenger
volumes will increase substantially over the next two decades, as a global hub we’ll
see proportionately higher growth in international traffic.
As a premier global hub, Toronto Pearson must keep pace with rising demand – not only from nearby communities and all of Canada, but from a growing number of international passengers as well. In responding to this need for connectivity, we help to drive regional economic growth.
Passenger traffic grew by 6.8 per cent in 2014. An additional 2.5 million travellers took advantage of the easy, flexible access we provide as a gateway airport to North America and the world.
International traffic increased by 7.5 per cent. With a compound annual growth rate of 5 per cent since 2007, Toronto Pearson is the continent’s second-busiest airport for international travel.
Service on 60 routes was further expanded. Our airline partners added more flights around the globe, while the average aircraft was larger and had a higher percentage of people on board.
GTAA ANNUAL REPORT 2014 3
INTERNATIONAL
33%
UNITED STATES
27%
CANADA
40%
38.6MILLION PASSENGERS
IN 2014
GROWING DEMAND
Dramatic Growth and an Evolving Passenger MixToronto Pearson is more than twice the size of the next largest Canadian airport, measured by total passengers served. And in 2014 our growth rate was the second highest among large North American airports.
Most of our growth over the past decade has come from international travellers in three broad categories: immigrants to Canada who regularly return to their countries of origin; visitors from overseas with ties to the GTA’s diverse multicultural communities; and travellers from Canada, the U.S. and abroad who find Toronto Pearson to be the most convenient hub for making international connections.
MILLION PASSENGERS BY 2033
2 GTAA ANNUAL REPORT 2014
UNITED STATES
25%
CANADA
33%
INTERNATIONAL
42%While overall passenger
volumes will increase substantially over the next two decades, as a global hub we’ll
see proportionately higher growth in international traffic.
GTAA ANNUAL REPORT 2014 3
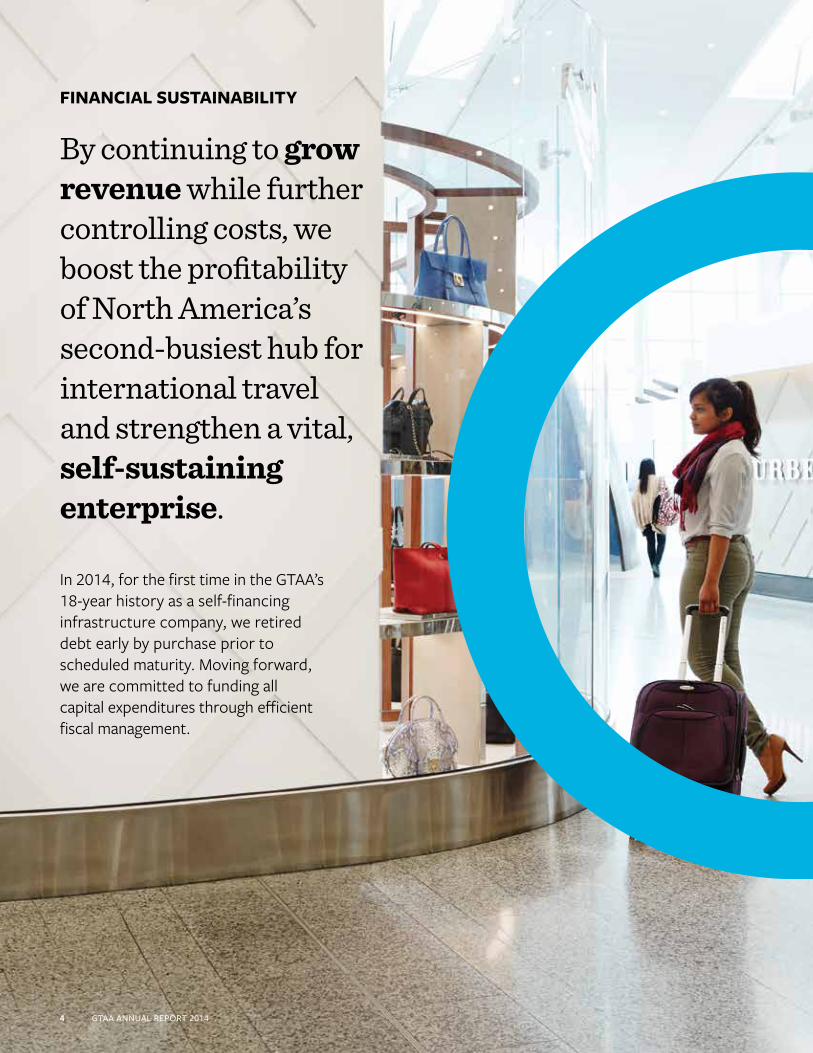
In 2014, for the first time in the GTAA’s 18-year history as a self-financing infrastructure company, we retired debt early by purchase prior to scheduled maturity. Moving forward, we are committed to funding all capital expenditures through efficient fiscal management.
By continuing to grow revenue while further controlling costs, we boost the profitability of North America’s second-busiest hub for international travel and strengthen a vital, self-sustaining enterprise.
4 GTAA ANNUAL REPORT 2014
FINANCIAL SUSTAINABILITY
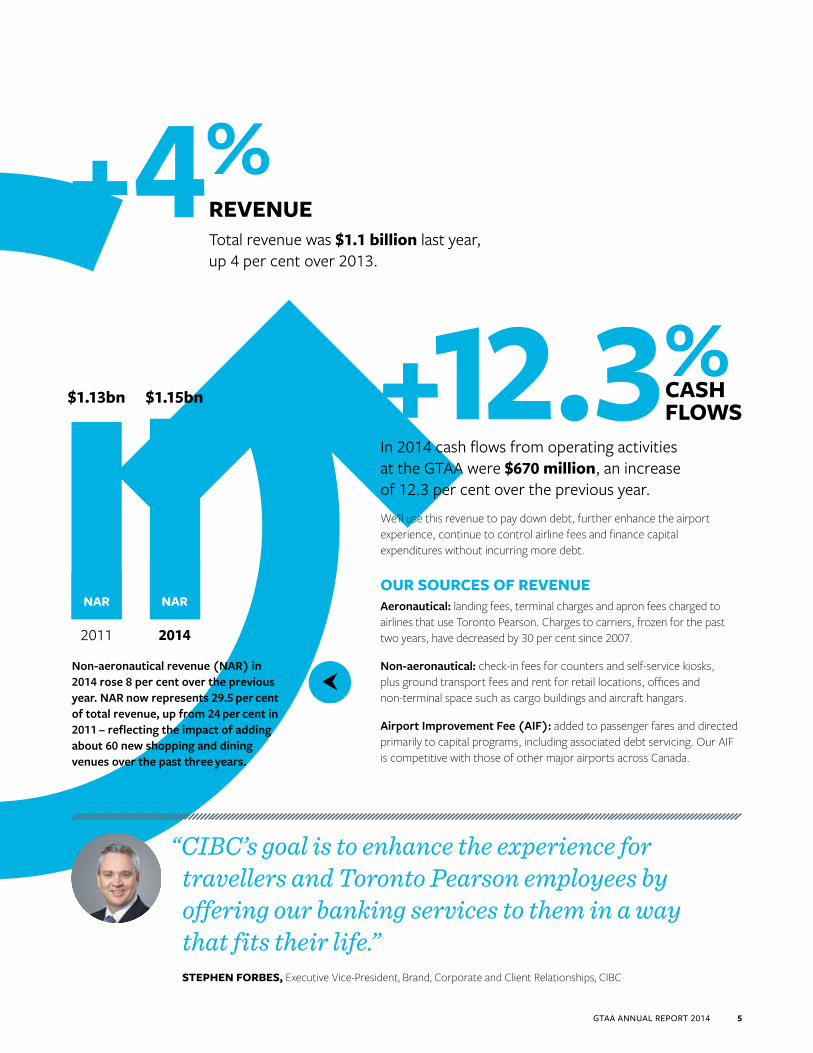
Total revenue was $1.1 billion last year, up 4 per cent over 2013.
4%+
“CIBC’s goal is to enhance the experience for travellers and Toronto Pearson employees by offering our banking services to them in a way that fits their life.”STEPHEN FORBES, Executive Vice-President, Brand, Corporate and Client Relationships, CIBC
+12.3%In 2014 cash flows from operating activities at the GTAA were $670 million, an increase of 12.3 per cent over the previous year.
We’ll use this revenue to pay down debt, further enhance the airport experience, continue to control airline fees and finance capital expenditures without incurring more debt.
OUR SOURCES OF REVENUEAeronautical: landing fees, terminal charges and apron fees charged to airlines that use Toronto Pearson. Charges to carriers, frozen for the past two years, have decreased by 30 per cent since 2007.
Non-aeronautical: check-in fees for counters and self-service kiosks, plus ground transport fees and rent for retail locations, offices and non-terminal space such as cargo buildings and aircraft hangars.
Airport Improvement Fee (AIF): added to passenger fares and directed primarily to capital programs, including associated debt servicing. Our AIF is competitive with those of other major airports across Canada.
Non-aeronautical revenue (NAR) in 2014 rose 8 per cent over the previous year. NAR now represents 29.5 per cent of total revenue, up from 24 per cent in 2011 – reflecting the impact of adding about 60 new shopping and dining venues over the past three years.
$1.15bn CASH FLOWS
REVENUE
NAR NAR
20142011
$1.13bn
GTAA ANNUAL REPORT 2014 5
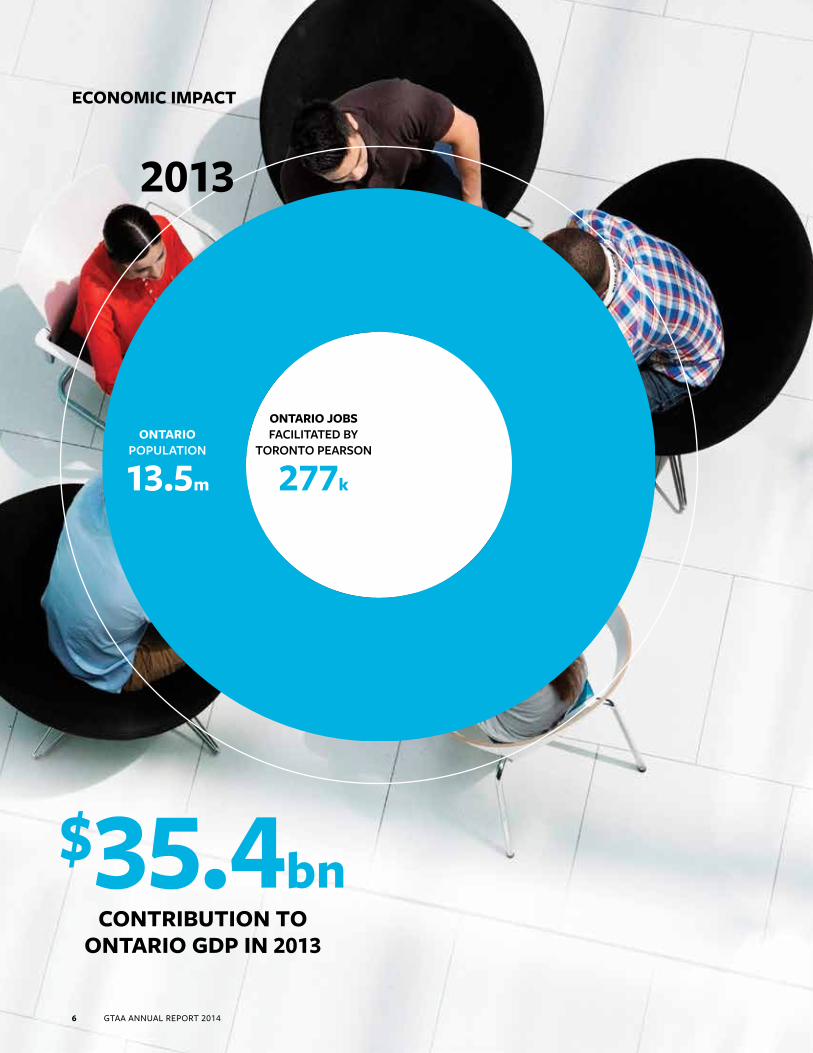
$35.4bnCONTRIBUTION TO
ONTARIO GDP IN 2013
ONTARIOPOPULATION
13.5m
ONTARIO JOBS FACILITATED BY
TORONTO PEARSON
277k
2013
6 GTAA ANNUAL REPORT 2014
ECONOMIC IMPACT
$58.6bnCONTRIBUTION TO
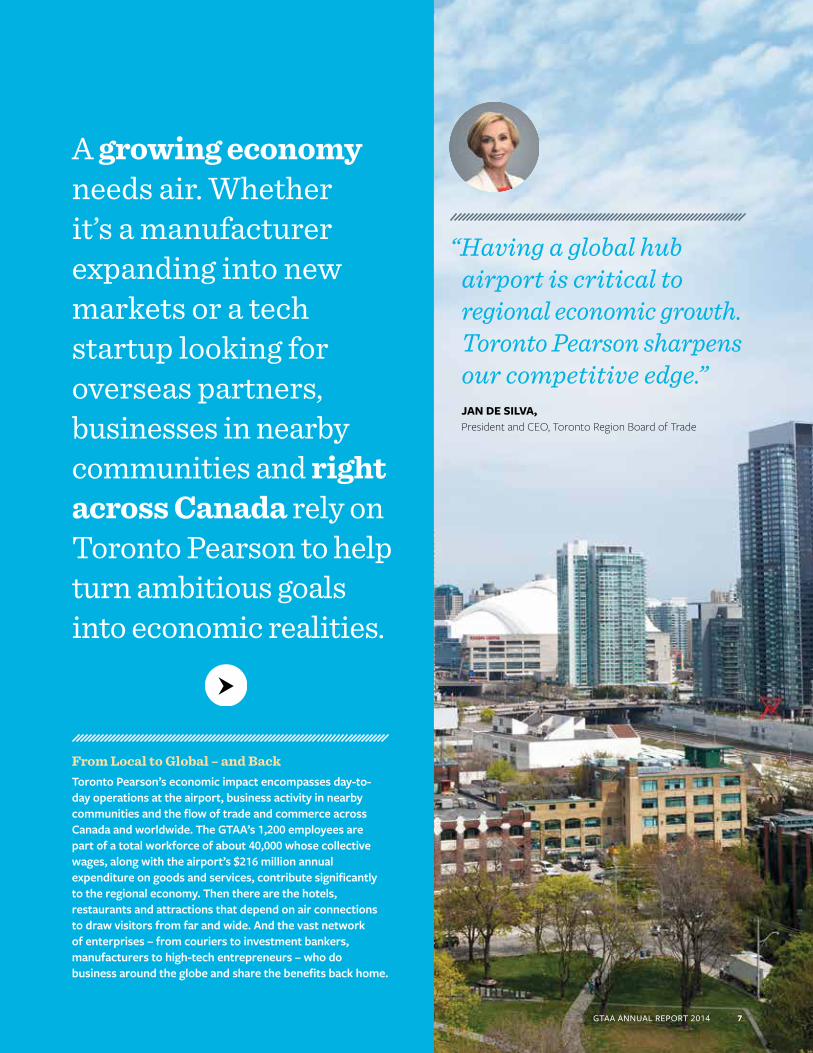
ONTARIO GDP IN 2033“Having a global hub
airport is critical to regional economic growth. Toronto Pearson sharpens our competitive edge.”JAN DE SILVA, President and CEO, Toronto Region Board of Trade
GTAA ANNUAL REPORT 2014 7
A growing economy needs air. Whether it’s a manufacturer expanding into new markets or a tech startup looking for overseas partners, businesses in nearby communities and right across Canada rely on Toronto Pearson to help turn ambitious goals into economic realities.
From Local to Global – and BackToronto Pearson’s economic impact encompasses day-to-day operations at the airport, business activity in nearby communities and the flow of trade and commerce across Canada and worldwide. The GTAA’s 1,200 employees are part of a total workforce of about 40,000 whose collective wages, along with the airport’s $216 million annual expenditure on goods and services, contribute significantly to the regional economy. Then there are the hotels, restaurants and attractions that depend on air connections to draw visitors from far and wide. And the vast network of enterprises – from couriers to investment bankers, manufacturers to high-tech entrepreneurs – who do business around the globe and share the benefits back home.
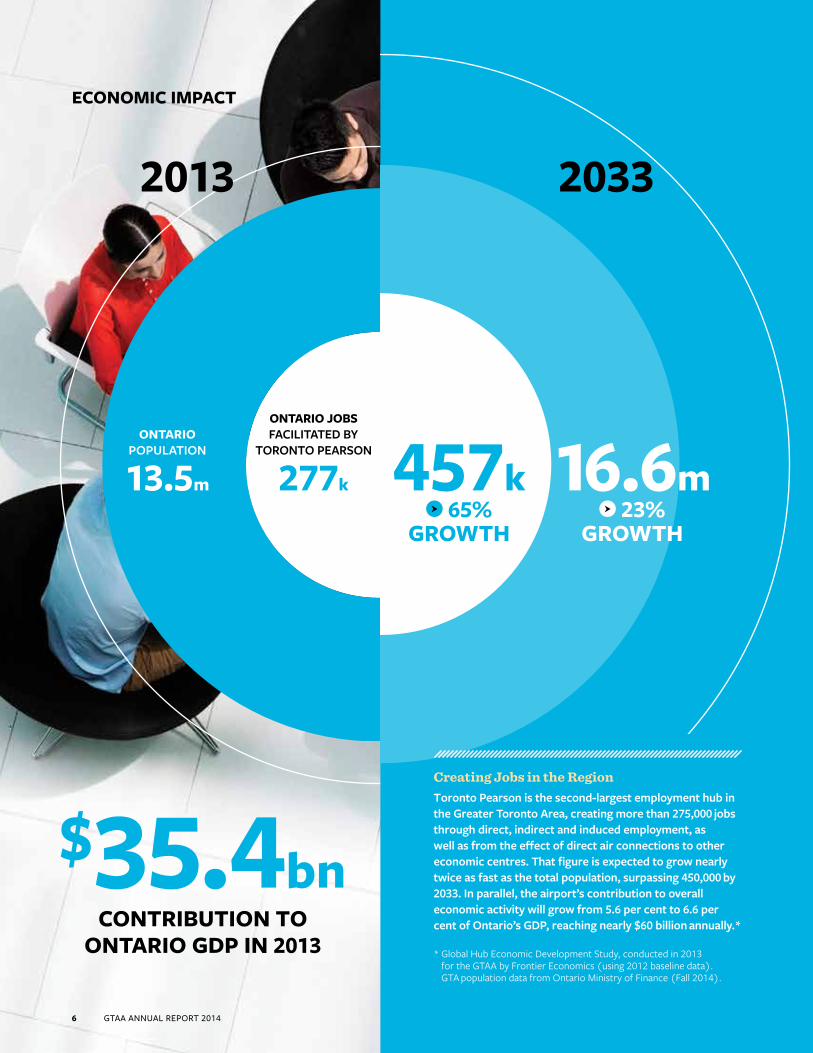
$35.4bnCONTRIBUTION TO
ONTARIO GDP IN 2013
ONTARIOPOPULATION
13.5m
ONTARIO JOBS FACILITATED BY
TORONTO PEARSON
277k
2013
6 GTAA ANNUAL REPORT 2014
ECONOMIC IMPACT
2033
457k 65%
GROWTH
16.6m 23%
GROWTH
Creating Jobs in the RegionToronto Pearson is the second-largest employment hub in the Greater Toronto Area, creating more than 275,000 jobs through direct, indirect and induced employment, as well as from the effect of direct air connections to other economic centres. That figure is expected to grow nearly twice as fast as the total population, surpassing 450,000 by 2033. In parallel, the airport’s contribution to overall economic activity will grow from 5.6 per cent to 6.6 per cent of Ontario’s GDP, reaching nearly $60 billion annually.*
* Global Hub Economic Development Study, conducted in 2013 for the GTAA by Frontier Economics (using 2012 baseline data). GTA population data from Ontario Ministry of Finance (Fall 2014).

$58.6bnCONTRIBUTION TO
ONTARIO GDP IN 2033“Having a global hub
airport is critical to regional economic growth. Toronto Pearson sharpens our competitive edge.”JAN DE SILVA, President and CEO, Toronto Region Board of Trade
GTAA ANNUAL REPORT 2014 7
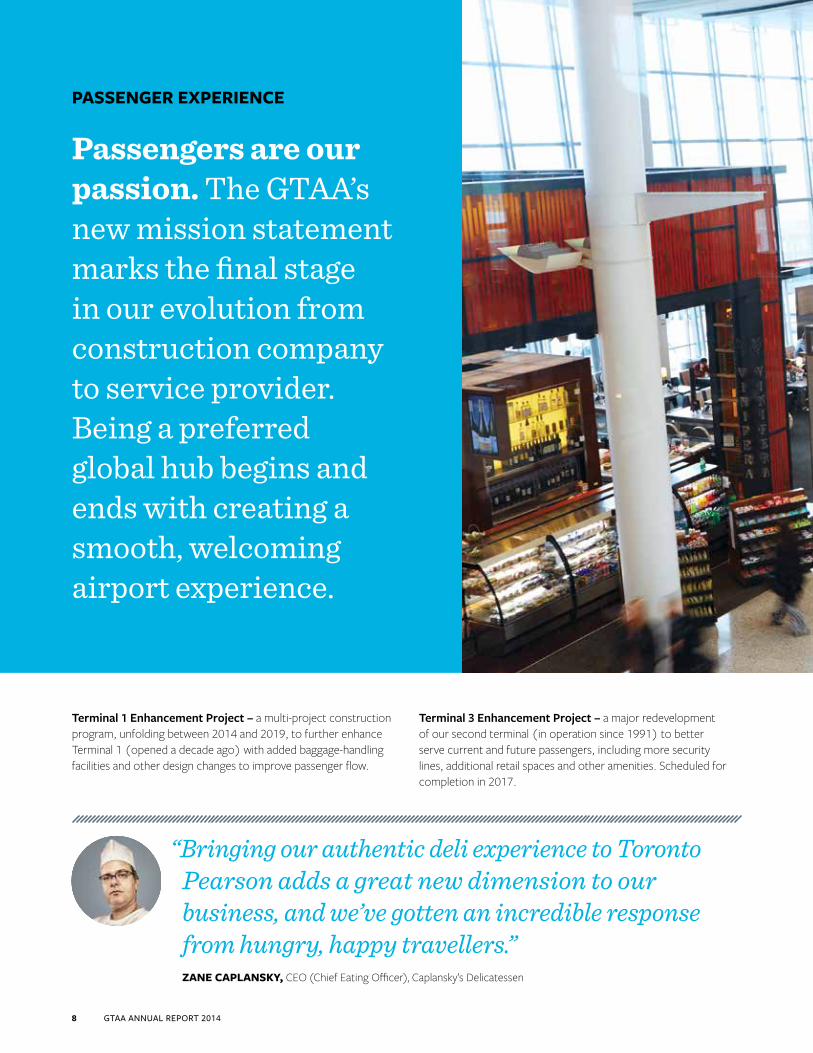
Passengers are our passion. The GTAA’s new mission statement marks the final stage in our evolution from construction company to service provider. Being a preferred global hub begins and ends with creating a smooth, welcoming airport experience.
Terminal 1 Enhancement Project – a multi-project construction program, unfolding between 2014 and 2019, to further enhance Terminal 1 (opened a decade ago) with added baggage-handling facilities and other design changes to improve passenger flow.
Terminal 3 Enhancement Project – a major redevelopment of our second terminal (in operation since 1991) to better serve current and future passengers, including more security lines, additional retail spaces and other amenities. Scheduled for completion in 2017.
“Bringing our authentic deli experience to Toronto Pearson adds a great new dimension to our business, and we’ve gotten an incredible response from hungry, happy travellers.”ZANE CAPLANSKY, CEO (Chief Eating Officer), Caplansky’s Delicatessen
8 GTAA ANNUAL REPORT 2014
PASSENGER EXPERIENCE
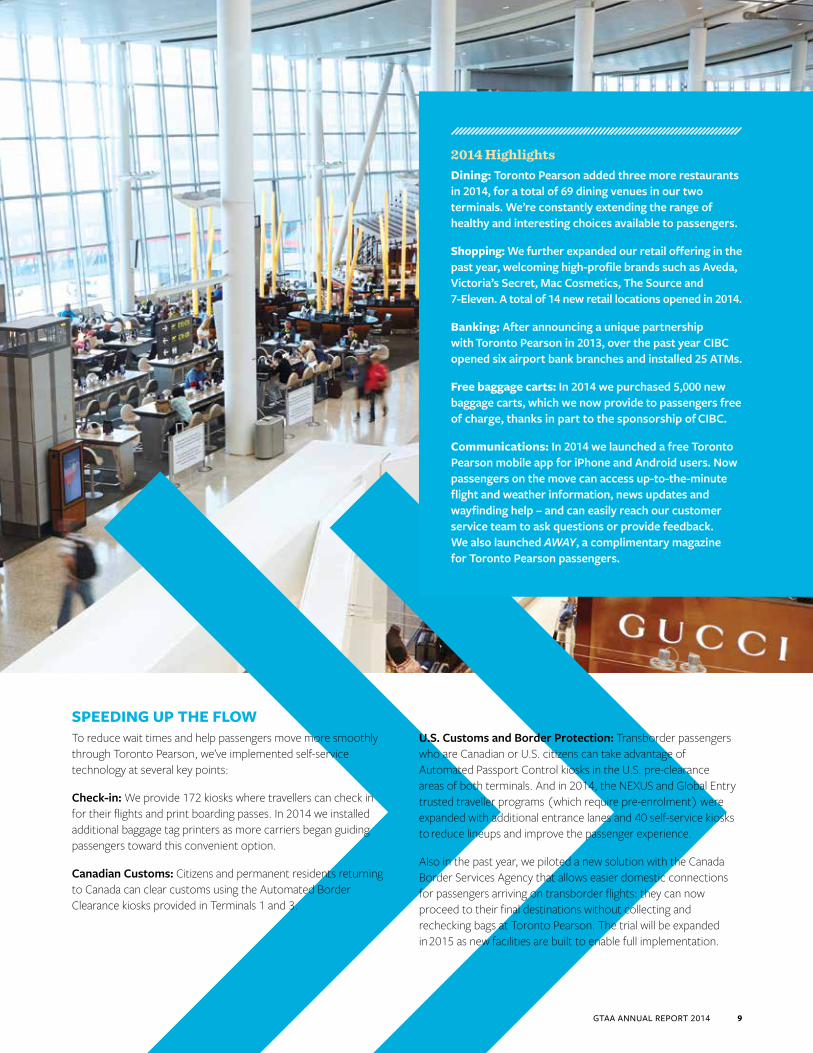
SPEEDING UP THE FLOWTo reduce wait times and help passengers move more smoothly through Toronto Pearson, we’ve implemented self-service technology at several key points:
Check-in: We provide 172 kiosks where travellers can check in for their flights and print boarding passes. In 2014 we installed additional baggage tag printers as more carriers began guiding passengers toward this convenient option.
Canadian Customs: Citizens and permanent residents returning to Canada can clear customs using the Automated Border Clearance kiosks provided in Terminals 1 and 3.
U.S. Customs and Border Protection: Transborder passengers who are Canadian or U.S. citizens can take advantage of Automated Passport Control kiosks in the U.S. pre-clearance areas of both terminals. And in 2014, the NEXUS and Global Entry trusted traveller programs (which require pre-enrolment) were expanded with additional entrance lanes and 40 self-service kiosks to reduce lineups and improve the passenger experience.
Also in the past year, we piloted a new solution with the Canada Border Services Agency that allows easier domestic connections for passengers arriving on transborder flights: they can now proceed to their final destinations without collecting and rechecking bags at Toronto Pearson. The trial will be expanded in 2015 as new facilities are built to enable full implementation.
2014 HighlightsDining: Toronto Pearson added three more restaurants in 2014, for a total of 69 dining venues in our two terminals. We’re constantly extending the range of healthy and interesting choices available to passengers.
Shopping: We further expanded our retail offering in the past year, welcoming high-profile brands such as Aveda, Victoria’s Secret, Mac Cosmetics, The Source and 7-Eleven. A total of 14 new retail locations opened in 2014.
Banking: After announcing a unique partnership with Toronto Pearson in 2013, over the past year CIBC opened six airport bank branches and installed 25 ATMs.
Free baggage carts: In 2014 we purchased 5,000 new baggage carts, which we now provide to passengers free of charge, thanks in part to the sponsorship of CIBC.
Communications: In 2014 we launched a free Toronto Pearson mobile app for iPhone and Android users. Now passengers on the move can access up-to-the-minute flight and weather information, news updates and wayfinding help – and can easily reach our customer service team to ask questions or provide feedback. We also launched AWAY, a complimentary magazine for Toronto Pearson passengers.
GTAA ANNUAL REPORT 2014 9
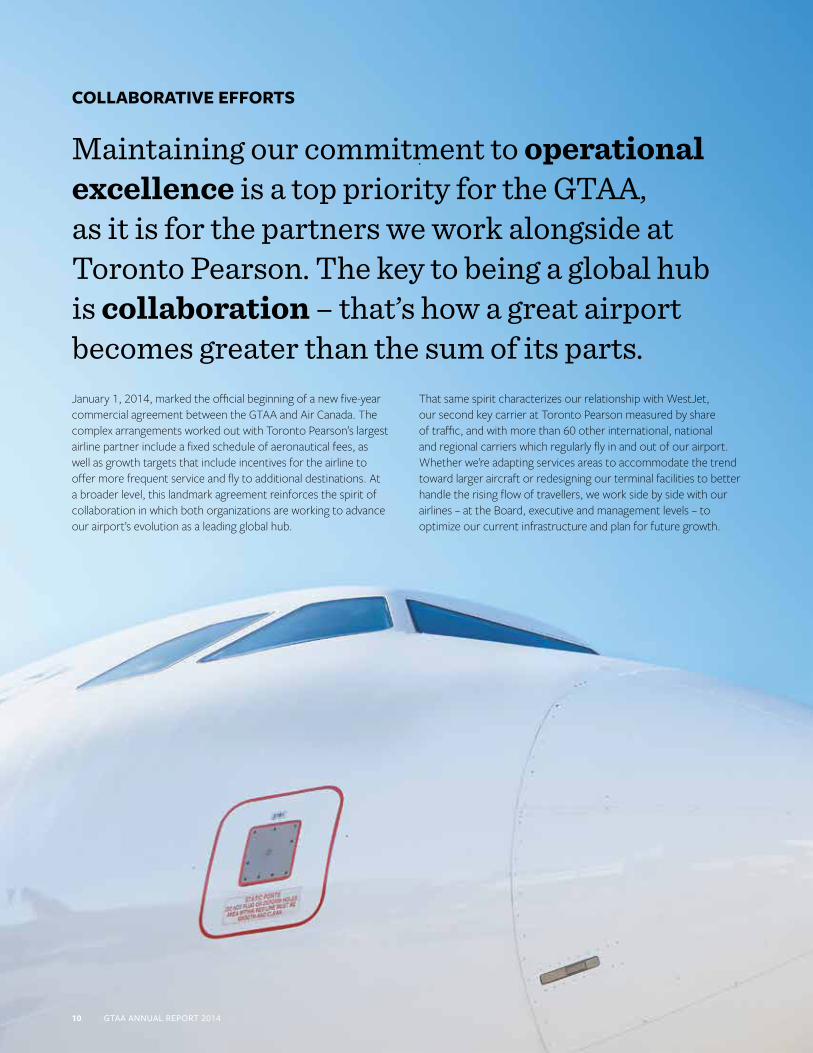
Maintaining our commitment to operational excellence is a top priority for the GTAA, as it is for the partners we work alongside at Toronto Pearson. The key to being a global hub is collaboration – that’s how a great airport becomes greater than the sum of its parts.January 1, 2014, marked the official beginning of a new five-year commercial agreement between the GTAA and Air Canada. The complex arrangements worked out with Toronto Pearson’s largest airline partner include a fixed schedule of aeronautical fees, as well as growth targets that include incentives for the airline to offer more frequent service and fly to additional destinations. At a broader level, this landmark agreement reinforces the spirit of collaboration in which both organizations are working to advance our airport’s evolution as a leading global hub.
That same spirit characterizes our relationship with WestJet, our second key carrier at Toronto Pearson measured by share of traffic, and with more than 60 other international, national and regional carriers which regularly fly in and out of our airport. Whether we’re adapting services areas to accommodate the trend toward larger aircraft or redesigning our terminal facilities to better handle the rising flow of travellers, we work side by side with our airlines – at the Board, executive and management levels – to optimize our current infrastructure and plan for future growth.
10 GTAA ANNUAL REPORT 2014
COLLABORATIVE EFFORTS
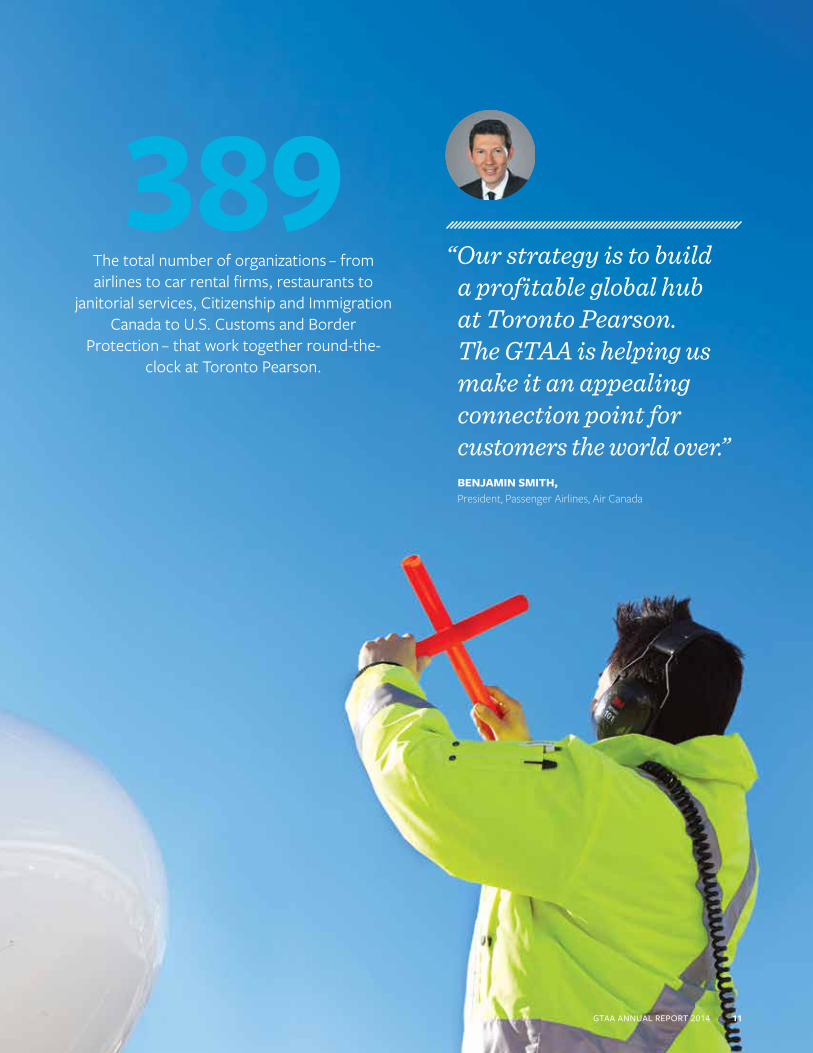
389The total number of organizations – from airlines to car rental firms, restaurants to
janitorial services, Citizenship and Immigration Canada to U.S. Customs and Border
Protection – that work together round-the- clock at Toronto Pearson.
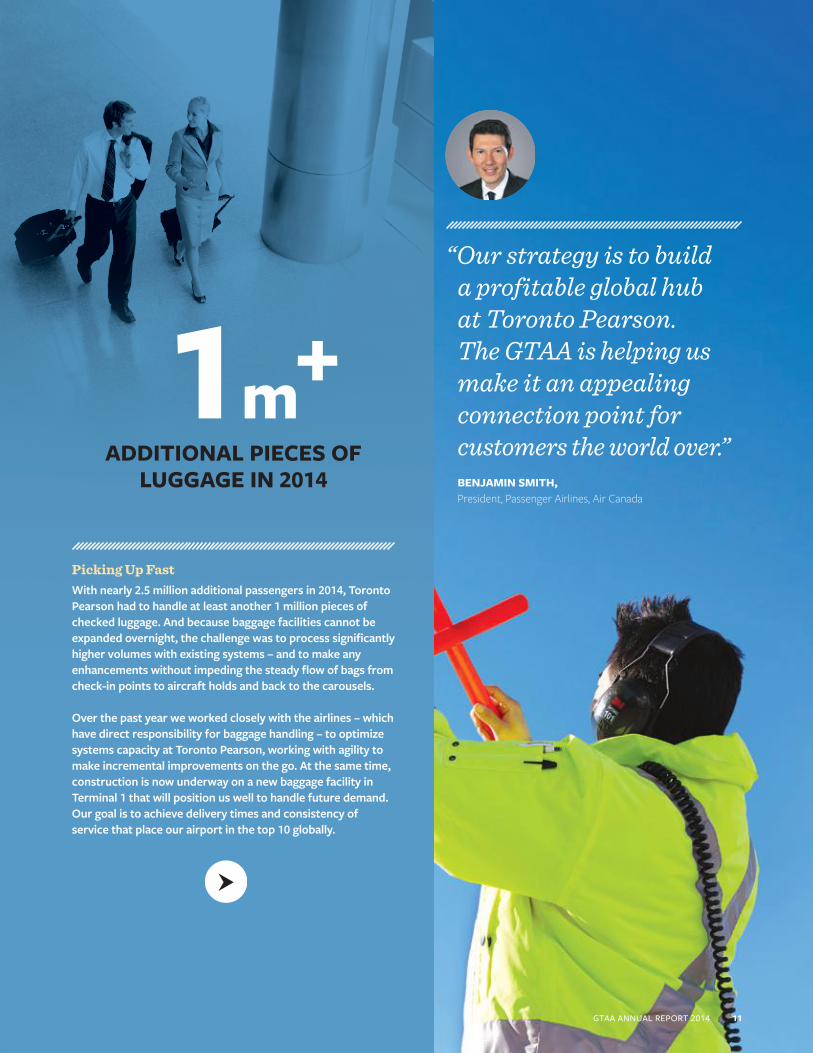
“Our strategy is to build a profitable global hub at Toronto Pearson. The GTAA is helping us make it an appealing connection point for customers the world over.”BENJAMIN SMITH, President, Passenger Airlines, Air Canada
GTAA ANNUAL REPORT 2014 11
Picking Up FastWith nearly 2.5 million additional passengers in 2014, Toronto Pearson had to handle at least another 1 million pieces of checked luggage. And because baggage facilities cannot be expanded overnight, the challenge was to process significantly higher volumes with existing systems – and to make any enhancements without impeding the steady flow of bags from check-in points to aircraft holds and back to the carousels.
Over the past year we worked closely with the airlines – which have direct responsibility for baggage handling – to optimize systems capacity at Toronto Pearson, working with agility to make incremental improvements on the go. At the same time, construction is now underway on a new baggage facility in Terminal 1 that will position us well to handle future demand. Our goal is to achieve delivery times and consistency of service that place our airport in the top 10 globally.
1mADDITIONAL PIECES OF
LUGGAGE IN 2014
+
Maintaining our commitment to operational excellence is a top priority for the GTAA, as it is for the partners we work alongside at Toronto Pearson. The key to being a global hub is collaboration – that’s how a great airport becomes greater than the sum of its parts.January 1, 2014, marked the official beginning of a new five-year commercial agreement between the GTAA and Air Canada. The complex arrangements worked out with Toronto Pearson’s largest airline partner include a fixed schedule of aeronautical fees, as well as growth targets that include incentives for the airline to offer more frequent service and fly to additional destinations. At a broader level, this landmark agreement reinforces the spirit of collaboration in which both organizations are working to advance our airport’s evolution as a leading global hub.
That same spirit characterizes our relationship with WestJet, our second key carrier at Toronto Pearson measured by share of traffic, and with more than 60 other international, national and regional carriers which regularly fly in and out of our airport. Whether we’re adapting services areas to accommodate the trend toward larger aircraft or redesigning our terminal facilities to better handle the rising flow of travellers, we work side by side with our airlines – at the Board, executive and management levels – to optimize our current infrastructure and plan for future growth.
10 GTAA ANNUAL REPORT 2014
COLLABORATIVE EFFORTS
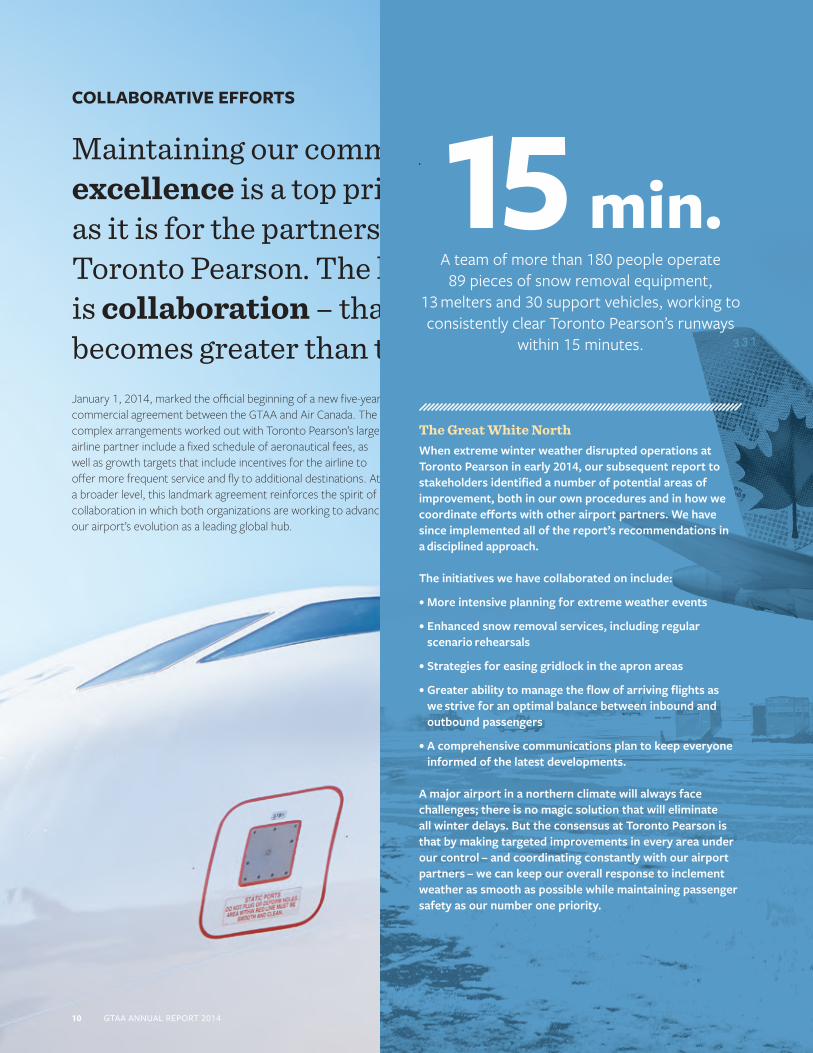
The Great White NorthWhen extreme winter weather disrupted operations at Toronto Pearson in early 2014, our subsequent report to stakeholders identified a number of potential areas of improvement, both in our own procedures and in how we coordinate efforts with other airport partners. We have since implemented all of the report’s recommendations in a disciplined approach.
The initiatives we have collaborated on include:
• More intensive planning for extreme weather events
• Enhanced snow removal services, including regular scenario rehearsals
• Strategies for easing gridlock in the apron areas
• Greater ability to manage the flow of arriving flights as we strive for an optimal balance between inbound and outbound passengers
• A comprehensive communications plan to keep everyone informed of the latest developments.
A major airport in a northern climate will always face challenges; there is no magic solution that will eliminate all winter delays. But the consensus at Toronto Pearson is that by making targeted improvements in every area under our control – and coordinating constantly with our airport partners – we can keep our overall response to inclement weather as smooth as possible while maintaining passenger safety as our number one priority.
15 min.A team of more than 180 people operate
89 pieces of snow removal equipment, 13 melters and 30 support vehicles, working to consistently clear Toronto Pearson’s runways
within 15 minutes.
389The total number of organizations – from airlines to car rental firms, restaurants to
janitorial services, Citizenship and Immigration Canada to U.S. Customs and Border
Protection – that work together round-the- clock at Toronto Pearson.
“Our strategy is to build a profitable global hub at Toronto Pearson. The GTAA is helping us make it an appealing connection point for customers the world over.”BENJAMIN SMITH, President, Passenger Airlines, Air Canada
GTAA ANNUAL REPORT 2014 11

As we respond to the challenges of growth, we’re bringing new focus to how we work as an organization. We’ve reaffirmed our core values and are encouraging our partners to join us in pursuing a common goal: to build an effective, customer-focused global hub.
In shaping our 20-year strategy for Toronto Pearson, we’ve recognized that to fulfill our vision of becoming the world’s best airport we need to nurture and develop a critical driver of success: our people. In 2014, the GTAA’s People and Culture leadership worked closely with the Human Resources and Compensation Committee of the Board of Directors to craft a comprehensive people strategy. We’ve set a five-year goal of moving the GTAA to the top quartile of high-performing organizations, benchmarked against recognized leaders in key sectors.
Through employee surveys, communications initiatives and new approaches to people management, we’ve underlined the GTAA’s central mission statement – Passengers are our passion – and worked to create a common language around cultural transformation, anchored by the core values of respect for one another and unwavering integrity. Having established our guiding “Rules of the Runway”, we’re now working to instill a set of clearly defined behaviours by which everyone in the organization will play a part in aligning our culture with the airport’s long-term goals.
12 GTAA ANNUAL REPORT 2014
SHARED COMMITMENT
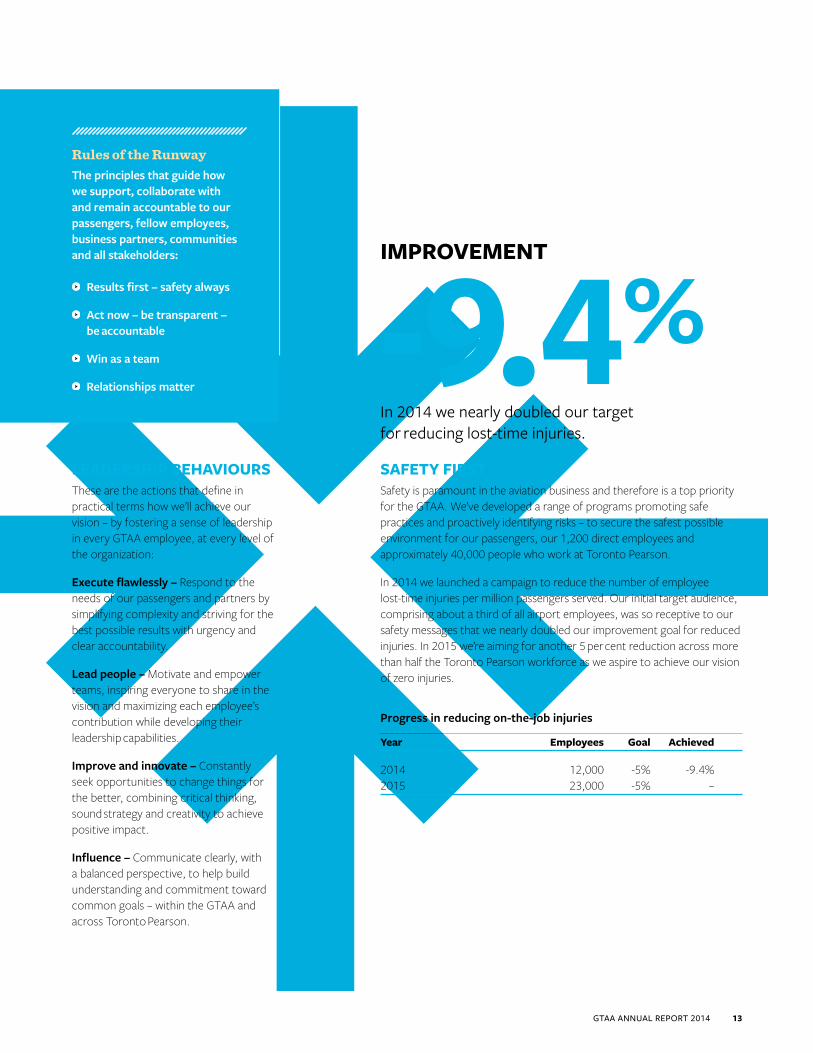
IMPROVEMENT
-9.4%In 2014 we nearly doubled our target for reducing lost-time injuries.
SAFETY FIRSTSafety is paramount in the aviation business and therefore is a top priority for the GTAA. We’ve developed a range of programs promoting safe practices and proactively identifying risks – to secure the safest possible environment for our passengers, our 1,200 direct employees and approximately 40,000 people who work at Toronto Pearson.
In 2014 we launched a campaign to reduce the number of employee lost-time injuries per million passengers served. Our initial target audience, comprising about a third of all airport employees, was so receptive to our safety messages that we nearly doubled our improvement goal for reduced injuries. In 2015 we’re aiming for another 5 per cent reduction across more than half the Toronto Pearson workforce as we aspire to achieve our vision of zero injuries.
Progress in reducing on-the-job injuries
Year Employees Goal Achieved
2014 12,000 -5% -9.4%2015 23,000 -5% –
LEADERSHIP BEHAVIOURSThese are the actions that define in practical terms how we’ll achieve our vision – by fostering a sense of leadership in every GTAA employee, at every level of the organization:
Execute flawlessly – Respond to the needs of our passengers and partners by simplifying complexity and striving for the best possible results with urgency and clear accountability.
Lead people – Motivate and empower teams, inspiring everyone to share in the vision and maximizing each employee’s contribution while developing their leadership capabilities.
Improve and innovate – Constantly seek opportunities to change things for the better, combining critical thinking, sound strategy and creativity to achieve positive impact.
Influence – Communicate clearly, with a balanced perspective, to help build understanding and commitment toward common goals – within the GTAA and across Toronto Pearson.
Rules of the RunwayThe principles that guide how we support, collaborate with and remain accountable to our passengers, fellow employees, business partners, communities and all stakeholders:
Results first – safety always
Act now – be transparent – be accountable
Win as a team
Relationships matter
GTAA ANNUAL REPORT 2014 13
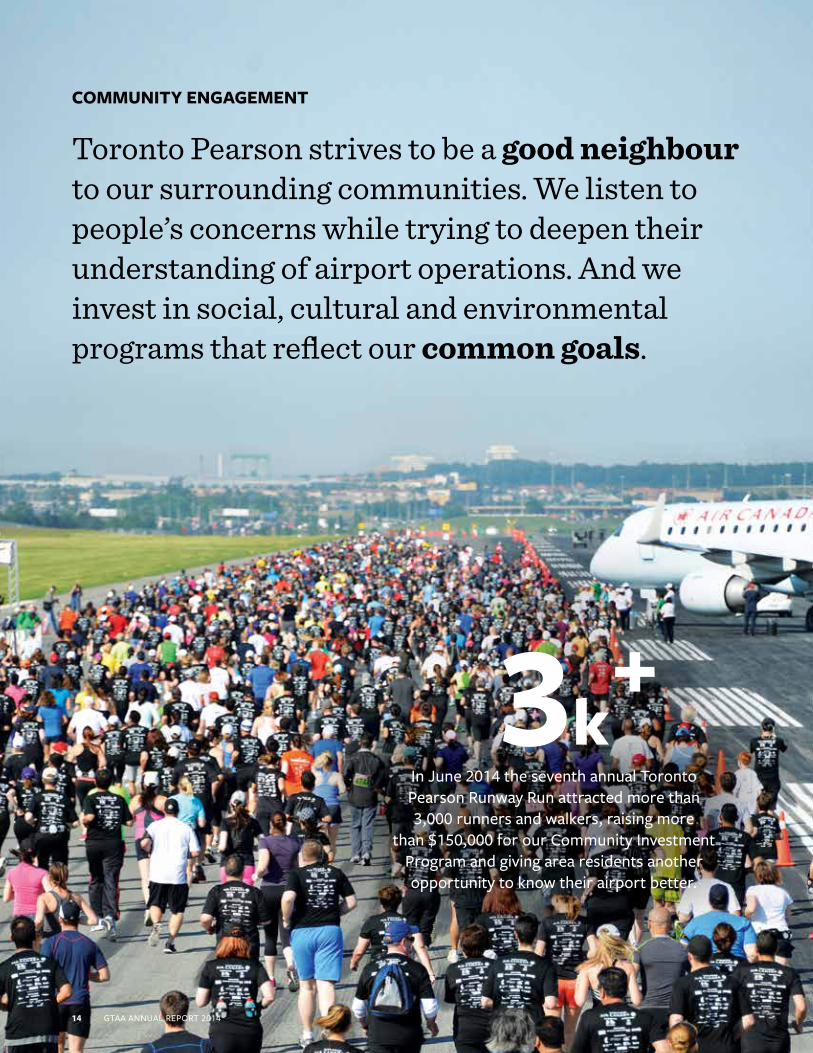
Toronto Pearson strives to be a good neighbour to our surrounding communities. We listen to people’s concerns while trying to deepen their understanding of airport operations. And we invest in social, cultural and environmental programs that reflect our common goals.
3kIn June 2014 the seventh annual Toronto Pearson Runway Run attracted more than 3,000 runners and walkers, raising more
than $150,000 for our Community Investment Program and giving area residents another opportunity to know their airport better.
+
COMMUNITY ENGAGEMENT
14 GTAA ANNUAL REPORT 2014

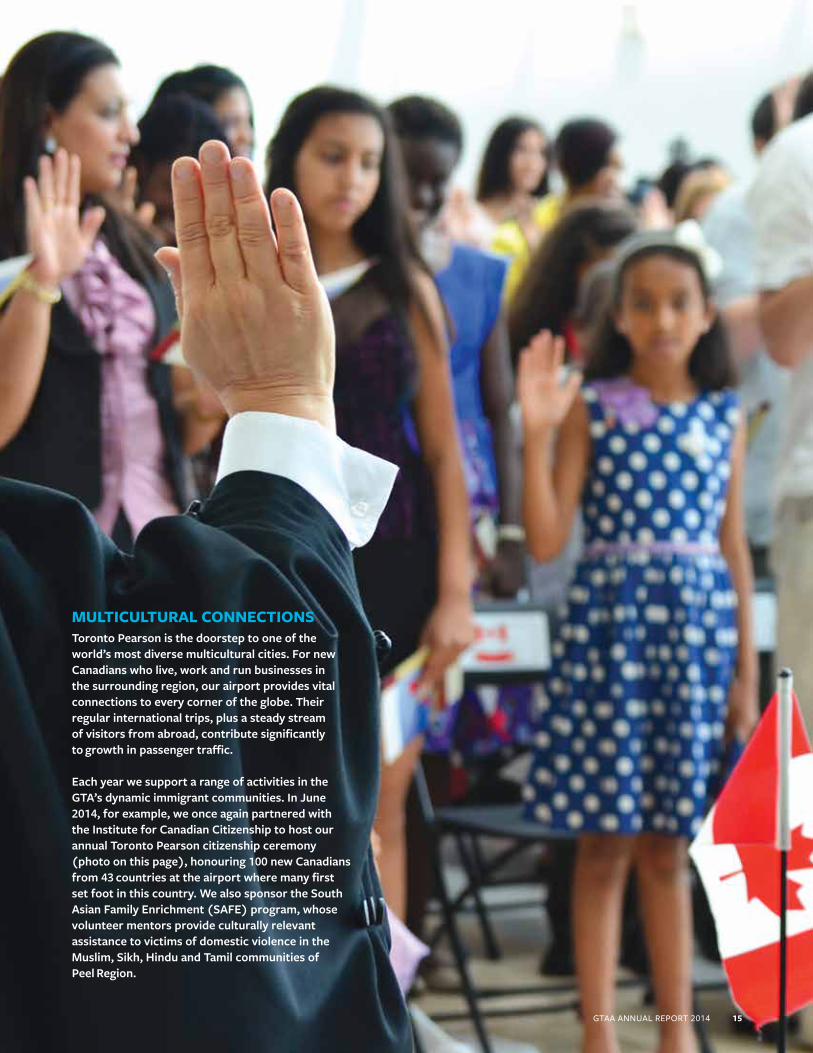
MULTICULTURAL CONNECTIONSToronto Pearson is the doorstep to one of the world’s most diverse multicultural cities. For new Canadians who live, work and run businesses in the surrounding region, our airport provides vital connections to every corner of the globe. Their regular international trips, plus a steady stream of visitors from abroad, contribute significantly to growth in passenger traffic.
Each year we support a range of activities in the GTA’s dynamic immigrant communities. In June 2014, for example, we once again partnered with the Institute for Canadian Citizenship to host our annual Toronto Pearson citizenship ceremony (photo on this page), honouring 100 new Canadians from 43 countries at the airport where many first set foot in this country. We also sponsor the South Asian Family Enrichment (SAFE) program, whose volunteer mentors provide culturally relevant assistance to victims of domestic violence in the Muslim, Sikh, Hindu and Tamil communities of Peel Region.
GTAA ANNUAL REPORT 2014 15
We're ListeningAircraft noise is a concern for all communities bordering major airports. At Toronto Pearson we engage with our neighbours on this issue, working with community representatives and our aviation-sector partners to raise awareness and address concerns. The GTAA’s Noise Management Office constantly monitors airport activities, recommending and implementing changes as required to our procedures. We respond to any complaints through a formal process, coordinating with airlines, NAV CANADA (which is responsible for air traffic control) and Transport Canada. We also publish regular advisories on airport activities that could have a short-term impact on noise. And we maintain WebTrak, an online service reporting real-time and historic data on all flights in and out of our airport.
Erasing the BoundariesIn 2014 the GTAA conducted in-depth consultations on extending the boundaries for noise complaints beyond the original 10 nautical miles (about 18.5 km) stipulated in the Transport Canada ground lease for Toronto Pearson. As of January 1, 2015, we will now respond to all residents of the Greater Toronto Area who feel they may be affected by airport traffic.
40In November 2014 the Community
Environment and Noise Advisory Committee (CENAC) held its 40th public forum where
community members can inquire about noise-related issues at Toronto Pearson. Typically
meeting four times a year, CENAC comprises residents and elected representatives from
Brampton, Mississauga and Toronto.
+
Toronto Pearson strives to be a good neighbour to our surrounding communities. We listen to people’s concerns while trying to deepen their understanding of airport operations. And we invest in social, cultural and environmental programs that reflect our common goals.
3kIn June 2014 the seventh annual Toronto Pearson Runway Run attracted more than 3,000 runners and walkers, raising more
than $150,000 for our Community Investment Program and giving area residents another opportunity to know their airport better.
+
COMMUNITY ENGAGEMENT
14 GTAA ANNUAL REPORT 2014
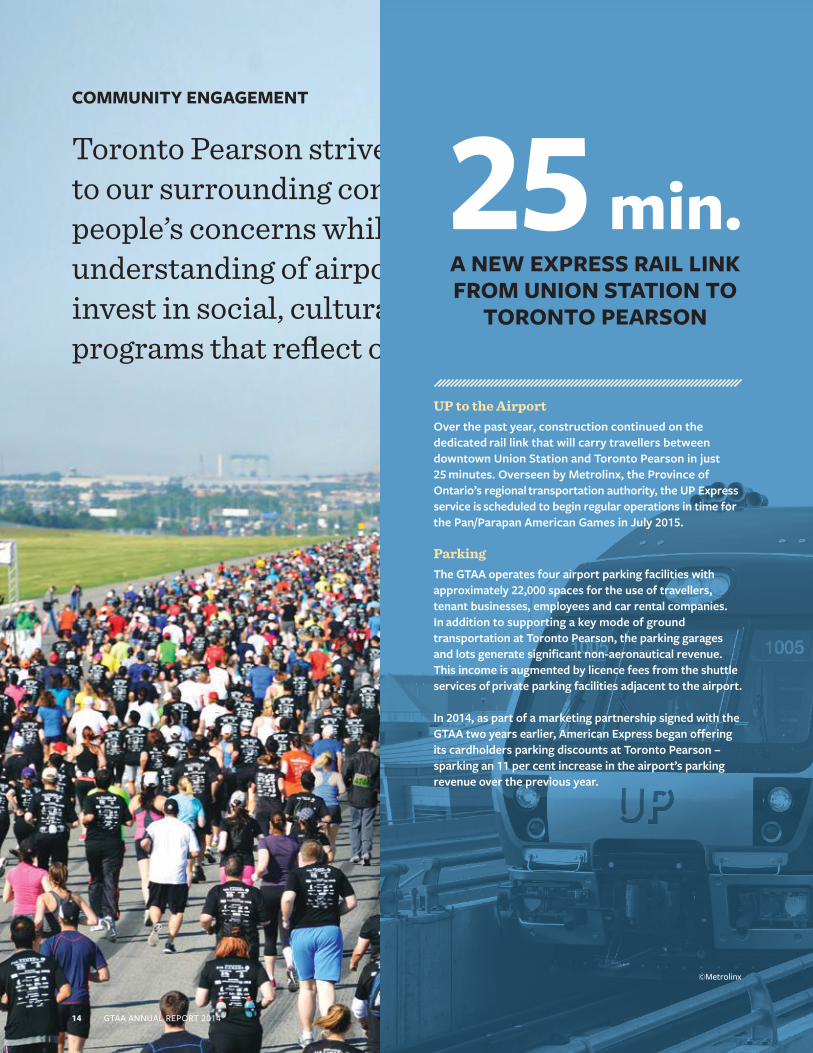
UP to the AirportOver the past year, construction continued on the dedicated rail link that will carry travellers between downtown Union Station and Toronto Pearson in just 25 minutes. Overseen by Metrolinx, the Province of Ontario’s regional transportation authority, the UP Express service is scheduled to begin regular operations in time for the Pan/Parapan American Games in July 2015.
ParkingThe GTAA operates four airport parking facilities with approximately 22,000 spaces for the use of travellers, tenant businesses, employees and car rental companies. In addition to supporting a key mode of ground transportation at Toronto Pearson, the parking garages and lots generate significant non-aeronautical revenue. This income is augmented by licence fees from the shuttle services of private parking facilities adjacent to the airport.
In 2014, as part of a marketing partnership signed with the GTAA two years earlier, American Express began offering its cardholders parking discounts at Toronto Pearson – sparking an 11 per cent increase in the airport’s parking revenue over the previous year.
25 min.A NEW EXPRESS RAIL LINK FROM UNION STATION TO
TORONTO PEARSON
©Metrolinx
MULTICULTURAL CONNECTIONSToronto Pearson is the doorstep to one of the world’s most diverse multicultural cities. For new Canadians who live, work and run businesses in the surrounding region, our airport provides vital connections to every corner of the globe. Their regular international trips, plus a steady stream of visitors from abroad, contribute significantly to growth in passenger traffic.
Each year we support a range of activities in the GTA’s dynamic immigrant communities. In June 2014, for example, we once again partnered with the Institute for Canadian Citizenship to host our annual Toronto Pearson citizenship ceremony (photo on this page), honouring 100 new Canadians from 43 countries at the airport where many first set foot in this country. We also sponsor the South Asian Family Enrichment (SAFE) program, whose volunteer mentors provide culturally relevant assistance to victims of domestic violence in the Muslim, Sikh, Hindu and Tamil communities of Peel Region.©Metrolinx
GTAA ANNUAL REPORT 2014 15
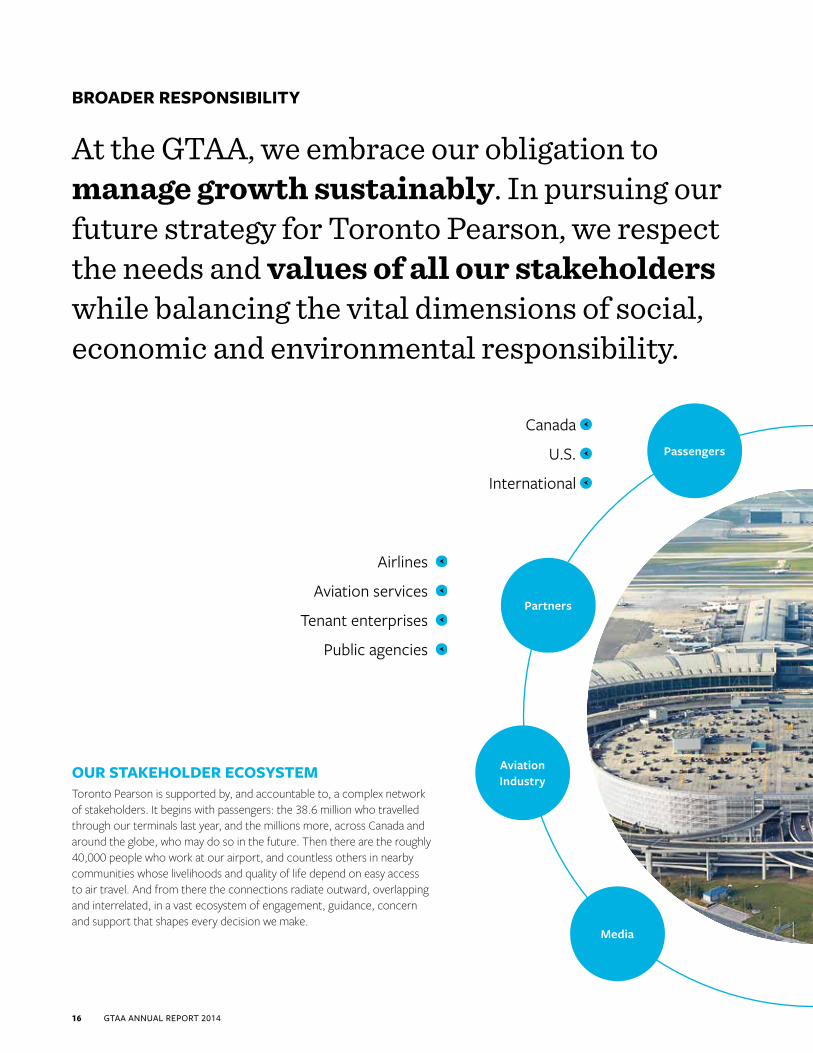
At the GTAA, we embrace our obligation to manage growth sustainably. In pursuing our future strategy for Toronto Pearson, we respect the needs and values of all our stakeholders while balancing the vital dimensions of social, economic and environmental responsibility.
Canada
U.S.
International
OUR STAKEHOLDER ECOSYSTEMToronto Pearson is supported by, and accountable to, a complex network of stakeholders. It begins with passengers: the 38.6 million who travelled through our terminals last year, and the millions more, across Canada and around the globe, who may do so in the future. Then there are the roughly 40,000 people who work at our airport, and countless others in nearby communities whose livelihoods and quality of life depend on easy access to air travel. And from there the connections radiate outward, overlapping and interrelated, in a vast ecosystem of engagement, guidance, concern and support that shapes every decision we make.
Media
Passengers
Airlines
Aviation services
Tenant enterprises
Public agencies
Partners
Aviation Industry
16 GTAA ANNUAL REPORT 2014
BROADER RESPONSIBILITY
GTAA (1,200)
Toronto Pearson (approx. 40,000)
Residents
Business leaders
Volunteers
Municipal
Provincial
Federal
International
Community
Employees
Government
Investment Community
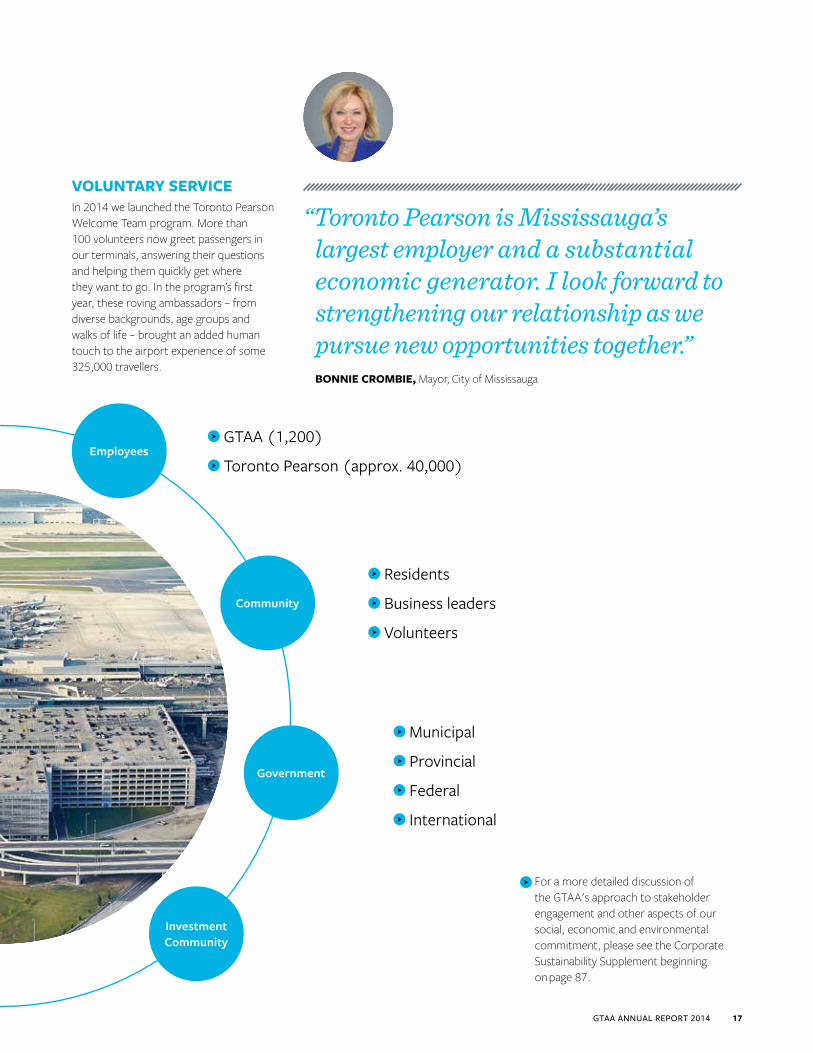
VOLUNTARY SERVICEIn 2014 we launched the Toronto Pearson Welcome Team program. More than 100 volunteers now greet passengers in our terminals, answering their questions and helping them quickly get where they want to go. In the program’s first year, these roving ambassadors – from diverse backgrounds, age groups and walks of life – brought an added human touch to the airport experience of some 325,000 travellers.
For a more detailed discussion of the GTAA's approach to stakeholder engagement and other aspects of our social, economic and environmental commitment, please see the Corporate Sustainability Supplement beginning on page 87.
“Toronto Pearson is Mississauga’s largest employer and a substantial economic generator. I look forward to strengthening our relationship as we pursue new opportunities together.” BONNIE CROMBIE, Mayor, City of Mississauga
GTAA ANNUAL REPORT 2014 17
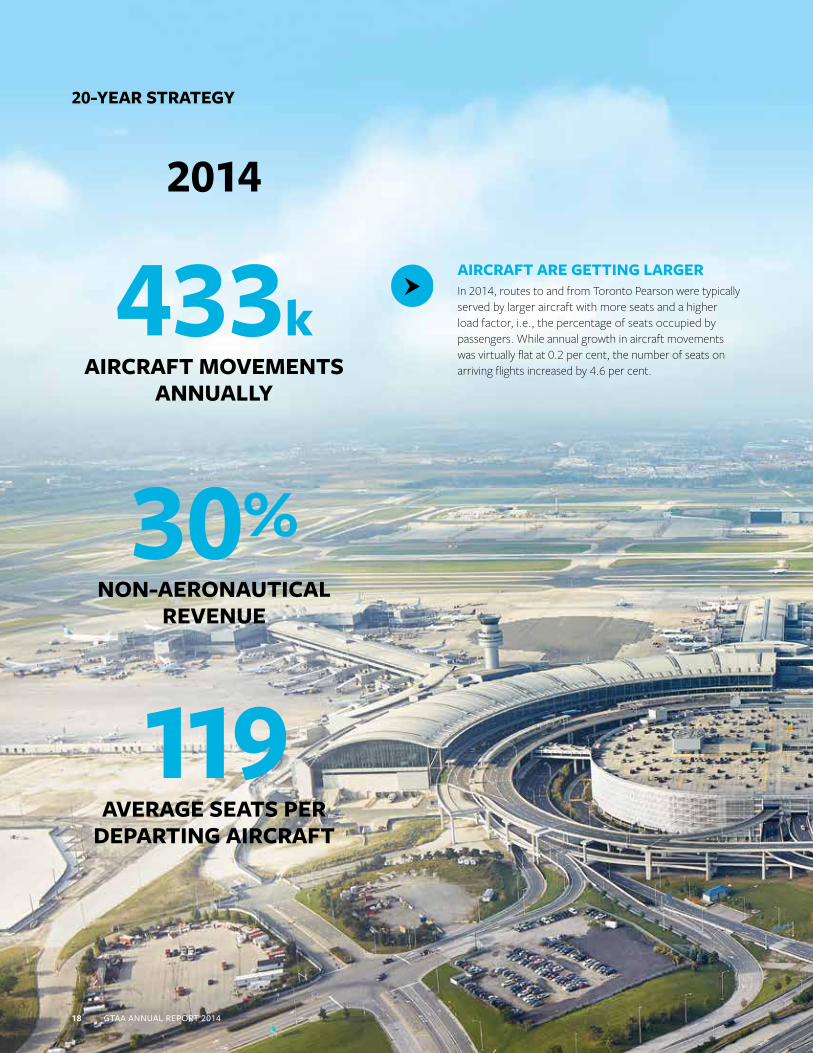
AIRCRAFT ARE GETTING LARGERIn 2014, routes to and from Toronto Pearson were typically served by larger aircraft with more seats and a higher load factor, i.e., the percentage of seats occupied by passengers. While annual growth in aircraft movements was virtually flat at 0.2 per cent, the number of seats on arriving flights increased by 4.6 per cent.
2014
433kAIRCRAFT MOVEMENTS
ANNUALLY
30%NON-AERONAUTICAL
REVENUE
119 AVERAGE SEATS PER
DEPARTING AIRCRAFT
20-YEAR STRATEGY
18 GTAA ANNUAL REPORT 2014
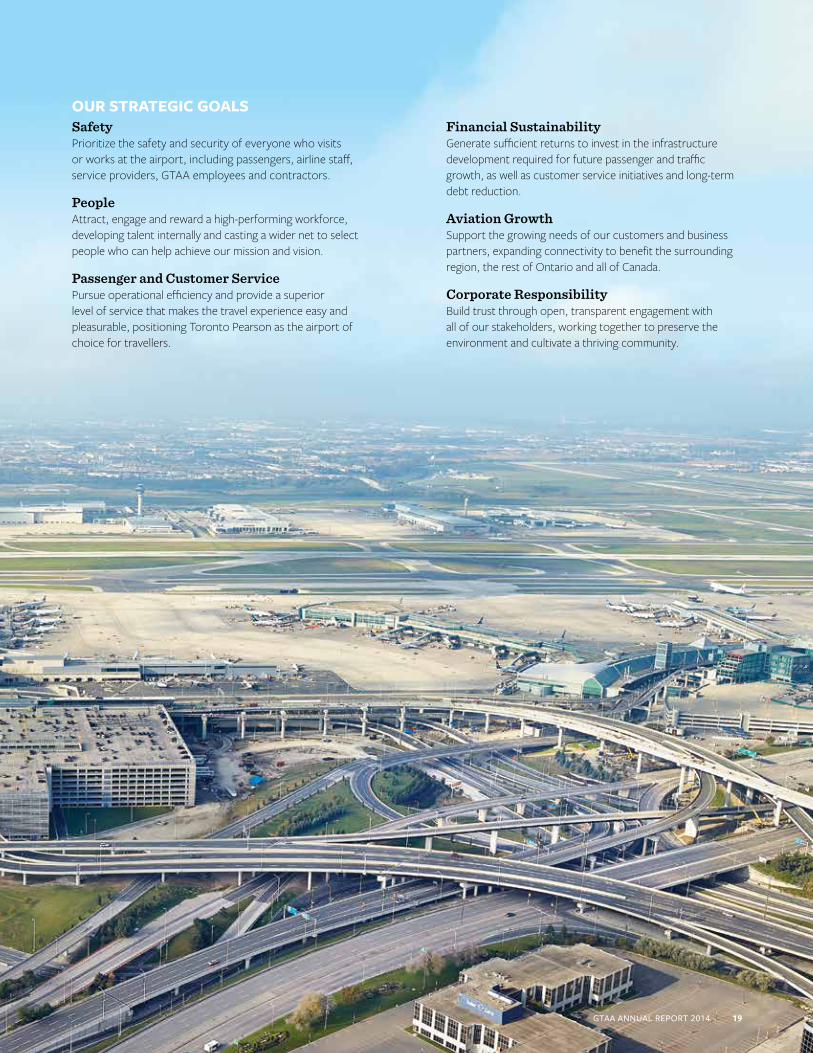
OUR STRATEGIC GOALSSafetyPrioritize the safety and security of everyone who visits or works at the airport, including passengers, airline staff, service providers, GTAA employees and contractors.
PeopleAttract, engage and reward a high-performing workforce, developing talent internally and casting a wider net to select people who can help achieve our mission and vision.
Passenger and Customer ServicePursue operational efficiency and provide a superior level of service that makes the travel experience easy and pleasurable, positioning Toronto Pearson as the airport of choice for travellers.
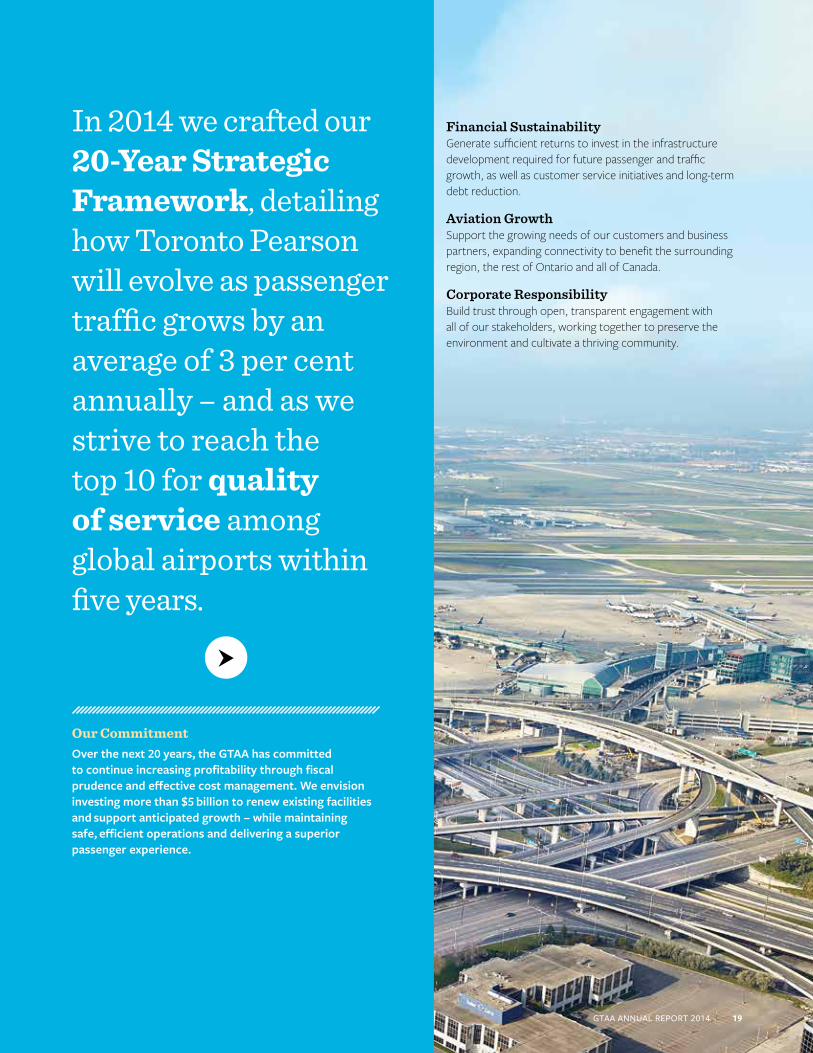
Financial SustainabilityGenerate sufficient returns to invest in the infrastructure development required for future passenger and traffic growth, as well as customer service initiatives and long-term debt reduction.
Aviation GrowthSupport the growing needs of our customers and business partners, expanding connectivity to benefit the surrounding region, the rest of Ontario and all of Canada.
Corporate ResponsibilityBuild trust through open, transparent engagement with all of our stakeholders, working together to preserve the environment and cultivate a thriving community.
GTAA ANNUAL REPORT 2014 19
In 2014 we crafted our 20-Year Strategic Framework, detailing how Toronto Pearson will evolve as passenger traffic grows by an average of 3 per cent annually – and as we strive to reach the top 10 for quality of service among global airports within five years.
Our Commitment Over the next 20 years, the GTAA has committed to continue increasing profitability through fiscal prudence and effective cost management. We envision investing more than $5 billion to renew existing facilities and support anticipated growth – while maintaining safe, efficient operations and delivering a superior passenger experience.
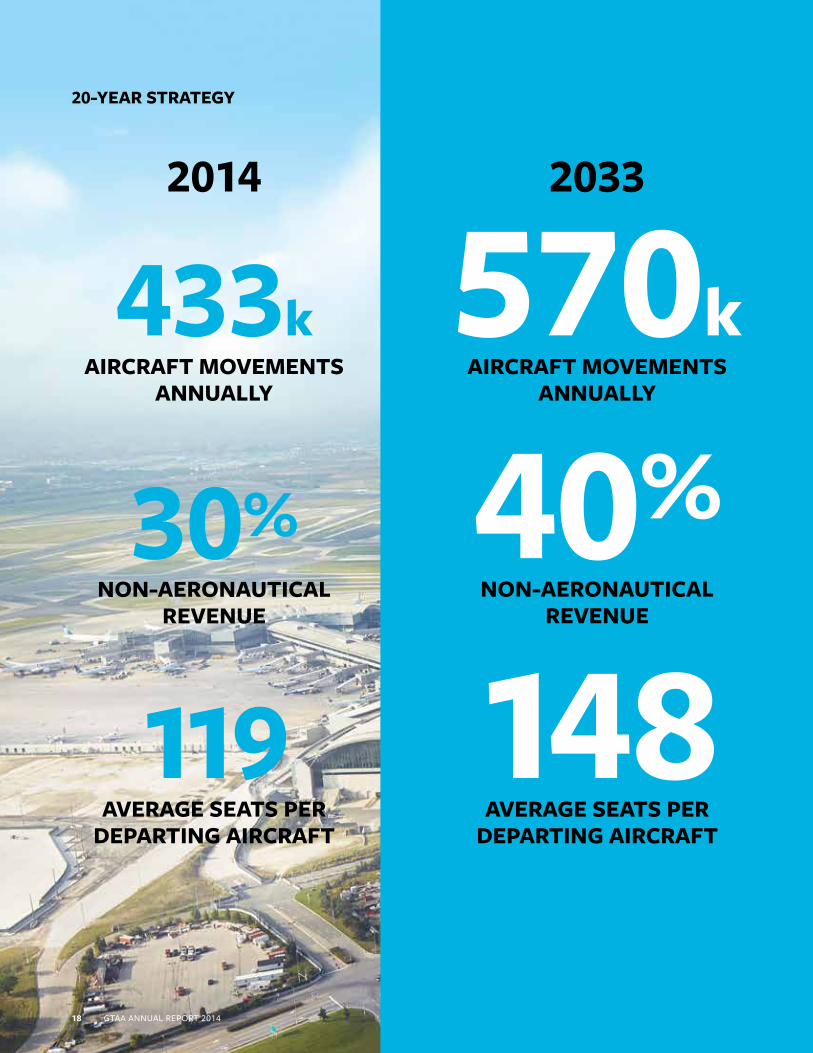
AIRCRAFT ARE GETTING LARGERIn 2014, routes to and from Toronto Pearson were typically served by larger aircraft with more seats and a higher load factor, i.e., the percentage of seats occupied by passengers. While annual growth in aircraft movements was virtually flat at 0.2 per cent, the number of seats on arriving flights increased by 4.6 per cent.
2014
433kAIRCRAFT MOVEMENTS
ANNUALLY
30%NON-AERONAUTICAL
REVENUE
119 AVERAGE SEATS PER
DEPARTING AIRCRAFT
20-YEAR STRATEGY
18 GTAA ANNUAL REPORT 2014
570kAIRCRAFT MOVEMENTS
ANNUALLY
40%NON-AERONAUTICAL
REVENUE
148AVERAGE SEATS PER
DEPARTING AIRCRAFT
2033
OUR STRATEGIC GOALSSafetyPrioritize the safety and security of everyone who visits or works at the airport, including passengers, airline staff, service providers, GTAA employees and contractors.
PeopleAttract, engage and reward a high-performing workforce, developing talent internally and casting a wider net to select people who can help achieve our mission and vision.
Passenger and Customer ServicePursue operational efficiency and provide a superior level of service that makes the travel experience easy and pleasurable, positioning Toronto Pearson as the airport of choice for travellers.
Financial SustainabilityGenerate sufficient returns to invest in the infrastructure development required for future passenger and traffic growth, as well as customer service initiatives and long-term debt reduction.
Aviation GrowthSupport the growing needs of our customers and business partners, expanding connectivity to benefit the surrounding region, the rest of Ontario and all of Canada.
Corporate ResponsibilityBuild trust through open, transparent engagement with all of our stakeholders, working together to preserve the environment and cultivate a thriving community.
GTAA ANNUAL REPORT 2014 19
OUR LEGACY FOR THE FUTUREA Message from the Chairman
Our continued progress over the past year speaks to the strength of our vision for Toronto Pearson and the momentum we’ve achieved as a global hub. It has been a privilege to help guide this vital enterprise while balancing the priorities of our diverse stakeholders.
Toronto Pearson has been the fastest growing airport in North America over the past four years. As our airline partners steadily expanded their services – connecting the Greater Toronto Area to 31 other Canadian cities, 44 major U.S. centres and 96 international destinations – we’ve joined a handful of airports worldwide in becoming a true global hub.
Of course, the growth of Canada’s largest airport cannot be separated from the broader course of economic growth in our region, throughout Ontario – where we contribute more than $35 billion annually to the economy – and across the country. Toronto Pearson’s evolution has mirrored the changing priorities of all our stakeholders. In the nine years that I’ve been privileged to sit on the GTAA Board of Directors, serving as Chairman since January 2013, I’ve been pleased to see the steadily increasing exchange of support between our airport and governments at the municipal, provincial and federal levels. Even more gratifying has been the deepening dialogue with nearby communities, as we’ve reached out to hear residents’ views and concerns, and invited them to get to know their airport better.
Another key stakeholder group is our airline partners. Among the milestones of 2014 was the formal commencement of our new five-year agreement with Air Canada. Over the past few years we’ve worked closely with Toronto Pearson’s principal carrier, strengthening our collaborative efforts and ensuring our goals are aligned. By engaging with Air Canada at the executive and Board levels, we’ve built a more robust business relationship and created a platform for future growth. This landmark agreement solidifies our position as a North American gateway and an international hub. In partnership with Air Canada, WestJet and all of our global and domestic airlines, we offer Canadians better access to the world while welcoming even more travellers to our doorstep.
Complementing this effort to provide more travel choices is our commitment to creating a superior airport experience for more than 100,000 passengers who fly in and out of Toronto Pearson on some 1,200 flights a day. Throughout 2014 we worked with our partners in security and border control to continue improving passenger flow while upholding the highest safety standards. And we extended our strategic investment in enhanced retail, dining and other services to make our airport even more attractive to passengers – while earning additional revenue toward our goal of financial sustainability.
As I approach the end of my term on the Board of Directors, I am excited by what the future holds for Toronto Pearson. We have a revitalized senior management team, with five talented leaders newly recruited by the Board. And our entire organization benefits from the inspired leadership of Howard Eng, who every day shows his gift for bringing out the best in people, just as we on the Board try to create a context in which the CEO and his team can excel. The impact of our combined efforts is evident in the 20-Year Strategic Framework on which we collaborated over the past year, creating a clear roadmap for the next two decades. We’ve applied the same exacting standards to the Board’s own practices, fine-tuning our governance framework and decision-making processes. I am especially proud of the role I’ve been able to play in creating a high-performing Board, as we all work to make the GTAA a model of operational excellence and fiscal accountability.
I leave the chairmanship with a deep sense of gratitude – to my Board and management colleagues, to all GTAA employees and to our many stakeholders – for the opportunity to help advance Toronto Pearson’s progress as a financially sustainable, passenger-centric global hub. We’ve been tested by experience, including some tough challenges, and pulled together as a team, guided by a sound strategy and well positioned for long-term growth. And that’s a legacy we can all be proud of.
VIJAY JEET KANWAR Chairman
“We offer Canadians better access to the world while welcoming even more travellers to our doorstep.”
20 GTAA ANNUAL REPORT 2014

“Our collective efforts grow stronger each day as we help Toronto Pearson move onward and upward.”
GROWTH WITH A PURPOSEA Message from the CEO
In 2015, 40 million passengers will fly in and out of Toronto Pearson. Within two decades, that figure will exceed 60 million. This is how we measure our evolution as a global hub. But our focus has never been on growth for growth’s sake.
Our airport must keep pace with steadily rising demand as economic activity in our surrounding communities and throughout Canada requires faster, easier connections to the world. At the same time, we’re responding to the needs of a large transborder area, spanning the U.S. Northeast and the Great Lakes heartland, with some 150 million potential travellers. And we’re drawing passengers from around the globe to a more convenient and welcoming continental gateway.
To describe Toronto Pearson as a global hub is no longer an aspiration. It’s what we are: ranked among the world’s top airports by passenger traffic, serving more international travellers than Chicago or Atlanta.
Our progress mirrors the economic evolution of an entire country. As Canada continues to build its competitive strength globally, Toronto Pearson is both an engine of growth and a catalyst for new opportunities. Our airport creates jobs, supports expanding businesses, advances innovation and helps Canadian companies connect with markets worldwide – which brings increased prosperity at home. And by strengthening global connectivity, we help to foster tourism, cultural exchange and immigration, all critical contributors to one of the world’s most vibrant metropolitan areas.
As stewards of this vital piece of national infrastructure, we manage Toronto Pearson to be a financially sustainable enterprise. The profits we generate are reinvested in continuously improving our airport to benefit all stakeholders. Last year our cash flows from operating activities reached an unprecedented $670 million. We’re deploying this surplus in three key areas:
• Stabilizing the fees charged to our airline partners, which in 2015 will be unchanged for the third consecutive year, maintaining an overall reduction in cost to carriers (measured on a per-passenger basis) of 30 per cent since 2007.
• Reducing the GTAA’s debt, beginning with a substantial purchase prior to scheduled maturity in 2014 – the first in our history.
• Making further investments in enhanced amenities and operational efficiency to create a comfortable, smooth-flowing airport experience for the passengers whose expectations define our purpose.
As we’ve continued to add new restaurants, shops and other services over the past year, non-aeronautical revenue has grown by 8 per cent and now represents approximately 30 per cent of total revenue, up from 24 per cent in 2011. But as important as these gains are to financial sustainability, our strategy is not aimed solely at improving the balance sheet. We’re working with our partners to deliver the best possible customer service, knowing this is what will ultimately drive our success as a global hub.
Our vision of becoming the world’s best airport has advanced significantly under the leadership of Vijay Kanwar, Chairman of the Board of Directors since 2013. As Vijay now steps down after serving a total of nine years on the Board, I join with the entire management team in thanking him for his astute guidance and energetic commitment to the GTAA. On his watch, we’ve accelerated our evolution from an airport builder and operator to a customer-focused service provider. We wish Vijay well in his future endeavours and look forward to working just as effectively with his successor.
In closing, let me reiterate my gratitude to all 40,000 people who work at Toronto, and especially to our 1,200 GTAA employees, for your dedication, diligence and readiness to embrace change. Together, we’ve accomplished a great deal – for our airport and for the communities in which it plays a proud part. There’s still more to do, but our collective efforts grow stronger each day as we help Toronto Pearson move onward and upward.
HOWARD ENG President and CEO
GTAA ANNUAL REPORT 2014 21

W. DOUGLAS ARMSTRONG
Douglas Armstrong had a long career as a senior public sector administrator, operated a small consulting business and is now a retired executive having served as a board member for a number of professional and community service committees.
Appointed by the Government of Canada
IAN L.T. CLARKE
Ian Clarke is Chief Financial Officer at Maple Leaf Sports & Entertainment Ltd., Canada’s pre-eminent leader in delivering top-quality sports and entertainment experiences.
Nominated by the Region of Durham
PAUL W. CURRIE
Paul Currie is President and Director of Currie Strategic Capital Inc. Mr. Currie is a seasoned executive with senior officer and director-level commercial experience in North America, Europe and Asia. Mr. Currie was formerly a senior executive with a number of public and privately owned businesses and a Coopers & Lybrand partner.
Community Member
JEFF P. FEGAN
Jeff Fegan is the former Chief Executive Officer of Dallas/Fort Worth (DFW) International Airport and past Chairman of the Board of Directors of Airports Council International – North America (ACI-NA).
Community Member
SHAUN C. FRANCIS
Shaun Francis is Executive Chair of Medcan Health Management Inc., a leading Canadian health management company.
Appointed by the Government of Canada
STEPHEN J. GRIGGS
Stephen Griggs is Chief Executive Officer of Smoothwater Capital Corporation, a company focused on activist investing in small- to mid-cap Canadian companies. Mr. Griggs is also Chair of the Board of Genesis Land Development Corp. and Equity Financial Holdings Inc., and is a director of several community organizations.
Nominated by the Region of Peel
BRIAN P. HERNER
Brian Herner is a founder and past President and CEO of BIOREM Technologies Inc., the leading supplier of biofilters for air pollution control, President of General Chemical (Canada) Ltd. and previously a Vice President of Zenon Environmental Inc.
Nominated by the Region of Halton
VIJAY JEET KANWARChairman
Vijay Kanwar is the co-founder, President and Chief Financial Officer of KMH Cardiology and Diagnostic Centres Inc., North America’s largest provider of nuclear cardiology services.
Appointed by the Province of Ontario
22 GTAA ANNUAL REPORT 2014
BOARD OF DIRECTORS

ROGER MAHABIR
Roger Mahabir is Chairman and CEO of Tracker Networks Inc. and President of Technology Innovations Inc. Most recently he was founder and CEO, Assurent Secure Technologies. Mr. Mahabir was previously Chief Information Officer, RBC Capital Markets (Royal Bank) and recognized as one of the industry’s top CIOs.
Community Member
KATHY MILSOM
Kathy Milsom is the Chair of the Standards Council of Canada, Chair of the Advisory Board for Direct Construction, and a Senior Fellow with the Canada School of Public Service. She is the former President and CEO of the Technical Standards and Safety Authority, and the Canada Lands Company, and former President of Vestar Facility Management.
Community Member
TERRANCE F. NORD
Terry Nord is a senior advisor to startup cargo airlines in Asia (China) and to aircraft leasing companies on aircraft purchase lease contracts. He has held senior executive positions with DHL Express (Brussels, Belgium), FedEx (Memphis, Tenn.), Air Canada and Canadian Airlines International.
Community Member
POONAM PURI
Poonam Puri is Professor of Law and former Associate Dean at Osgoode Hall Law School of York University. She is one of Canada's leading experts on corporate governance, corporate law and securities regulation.
Community Member
MICHELLE SAMSON-DOEL
Michelle Samson-Doel is the former Executive Chair of Multi-Marques, the largest bakery in Quebec, and has served on the Boards of the Ontario Lottery and Gaming Corporation (OLG) and Women’s College Hospital Foundation. She is presently Lead Director of Boralex Inc. (BLX), and is a member of the Women’s Leadership Council of the United Way of York Region.
Nominated by the Region of Peel
DANIELLE M. WATERS
Danielle Waters is the Managing Director–Canada of BCD Travel, a leading global travel management company, and the Principal of Water’s Edge Consulting, a private practice specializing in sales effectiveness, strategic planning and loyalty travel management.
Community Member
W. DAVID WILSON
David Wilson is the former Chair and Chief Executive Officer of the Ontario Securities Commission and is now retired following an extensive career in Canada’s financial services industry.
Nominated by the City of Toronto
GTAA ANNUAL REPORT 2014 23

MARTIN BOYER
Vice President and Chief Information Officer
CRAIG BRADBROOK
Vice President, Aviation Services
SCOTT COLLIER
Vice President, Customer and Terminal Services
NICOLE DESLOGES
Vice President, People and Culture
HOWARD ENG
President and Chief Executive Officer
SELMA M. LUSSENBURG
Vice President, Governance, Corporate Safety and Security, General Counsel and Corporate Secretary
HILLARY MARSHALL
Vice President, Stakeholder Relations and Communications
PATRICK NEVILLE
Vice President, Airport Planning and Technical Services
JILL SHARLAND
Vice President and Chief Financial Officer
24 GTAA ANNUAL REPORT 2014
EXECUTIVE TEAM
GTAA ANNUAL REPORT 2014 25
CORPORATE GOVERNANCE
The GTAA management team reports to a diverse board of directors (“Board”) that is representative of the cultural mosaic of the Greater Toronto Area and the major economic sectors in the region which Toronto Pearson serves. The Board is “skills based” which means that the Directors have the abilities, experience and skills needed to oversee the GTAA’s complex and industry-leading activities managing Toronto Pearson, a vital facility for the region’s economic and social benefit.
The GTAA was incorporated in 1993 as a non-share capital corporation and in 2014 transitioned to the Canada Not-for-profit Corporations Act. As a corporation without share capital, the GTAA has Members rather than shareholders or other equity holders.
The GTAA is governed by a Board consisting of 15 Directors. The Directors are elected by the Members. Directors serve a term of three years and are eligible to be reappointed subject to a maximum term of nine years.
Five Directors are elected by the Members from candidates nominated by municipalities. Specifically, each of the Regional Municipalities of York, Halton, Peel and Durham and the City of Toronto is entitled to provide, on a rotating basis, the names of up to three candidates, and following an assessment process the Members elect one of them for each available position as a Director.
In addition, seven Directors are elected by the Members on a cyclical basis from a pool of eligible candidates who are identified and assessed through a search process which includes engaging the Law Society of Upper Canada, Professional Engineers Ontario, the Institute of Chartered Accountants of Ontario, the Toronto Region Board of Trade, the Board of Trade of the City of Mississauga and the Board of Trade of the City of Brampton.
Finally, the Government of Canada provides the names of two individuals and the Province of Ontario one individual, all of whom are elected as Directors by the Members.
All members of the GTAA’s Board are independent, as that term is defined in the applicable securities legislation.
The GTAA’s Board meets on a regular basis and views its principal responsibility as overseeing the conduct of the GTAA’s business and setting the strategic direction for the GTAA. The Board ensures that long-term goals and strategies are developed and implemented to ensure Toronto Pearson continues to support and foster growth in the Greater Toronto Area.
The Board also ensures that the necessary systems are in place to manage the risks associated with the GTAA’s business and to monitor and measure management’s performance in carrying out the GTAA’s objectives.
In 2014 there were five standing committees of the Board: the Audit Committee; the Corporate Governance and Nominating Committee; the Environment, Safety, Security and Stakeholder Relations Committee; the Human Resources and Compensation Committee; and the Planning and Commercial Development Committee. The mandates of each Committee of the Board are as follows:
AUDIT COMMITTEEThe Audit Committee’s mandate is to fulfill the legal obligations that apply to audit committees and to assist the Board in fulfilling its oversight responsibilities with respect to financial reporting, accounting, auditing and internal controls. In so doing, the Committee reviews all aspects of the GTAA’s financial and accounting management procedures and oversees the integrity of the GTAA’s financial statements and financial reporting process. It also oversees the work of the GTAA’s external auditor engaged for the purpose of preparing or issuing an auditor’s report, overseeing the qualifications and independence of the external auditor and providing an open avenue of communication between the senior management of the GTAA, the external auditor, the internal auditor, and the members of the Board and Committees of the Board.
In addition, the Committee reviews the risk management and insurance programs to minimize risk and exposure and ensure compliance with the insurance requirements under the Ground Lease and the Master Trust Indenture. Finally, the Committee monitors and oversees the defined benefit and defined contribution pension plans for the GTAA’s employees. The Charter of the Audit Committee is attached to the GTAA’s Annual Information Form, which may be accessed at www.sedar.com.
26 GTAA ANNUAL REPORT 2014
CORPORATE GOVERNANCE
CORPORATE GOVERNANCE AND NOMINATING COMMITTEEThe Corporate Governance and Nominating Committee is charged with the development, recommendation to the Board, implementation and assessment of effective corporate governance principles. The Committee also is responsible for developing and reviewing the roles and responsibilities of the Board, the Chair of the Board and the President and Chief Executive Officer, overseeing the Member nomination process, recommending candidates for appointment as Members, establishing an orientation program for new Directors, reviewing the terms of reference of Board Committees, assessing the effectiveness of the Board and the Committees of the Board, and ensuring compliance with corporate governance requirements.
ENVIRONMENT, SAFETY, SECURITY AND STAKEHOLDER RELATIONS COMMITTEEThe Environment, Safety, Security and Stakeholder Relations Committee’s mandate includes providing leadership and oversight of matters pertaining to the GTAA’s relationships with government, the community and stakeholders, its strategic communications program relating to such relationships, the environment, public safety, airport security, the GTAA’s internal security, airport operations, emergency preparedness, and corporate social responsibility practices and reporting.
HUMAN RESOURCES AND COMPENSATION COMMITTEEThe Human Resources and Compensation Committee’s mandate is to oversee matters related to the GTAA’s human resources strategy, including occupational health and safety, hiring, employee training and development, succession planning for key management positions, the GTAA’s compensation and benefit policies, recruitment and compensation matters relating to the President and Chief Executive Officer and officers, and matters relating to regulatory disclosure of compensation.
PLANNING AND COMMERCIAL DEVELOPMENT COMMITTEEThe Planning and Commercial Development Committee’s mandate includes oversight of the GTAA’s commercial development of the airport, business strategy, planning, development and utilization of infrastructure and facilities to meet the needs of the GTAA’s customers and stakeholders, including air carriers, passengers and cargo shippers. It also is responsible for ensuring that the GTAA has an appropriate, up-to-date and approved master plan, and that the GTAA has in place the management systems necessary to undertake such matters.
MANAGEMENT’S DISCUSSION AND ANALYSISFOR THE YEAR ENDED DECEMBER 31, 2014 Dated March 11, 2015
FORWARD-LOOKING INFORMATION This Management’s Discussion and Analysis (“MD&A”) contains certain forward-looking information. This forward-looking information is based on a variety of assumptions and is subject to risks and uncertainties. Please refer to the section titled “Caution Regarding Forward-Looking Information” contained at the end of this MD&A for a discussion of such risks and uncertainties and the material factors and assumptions related to the forward-looking information.
This report discusses the financial and operating results of the Greater Toronto Airports Authority (the “GTAA”) for the year ended December 31, 2014, and should be read in conjunction with the Financial Statements of the GTAA for the years ended December 31, 2014 and 2013, and the Annual Information Form for the year ended December 31, 2014. These documents provide additional information on certain matters that may or may not be discussed in this report. Additional information relating to the GTAA, including the Annual Information Form and the Financial Statements referred to above, is available on SEDAR at www.sedar.com. The GTAA’s Financial Statements and MD&A are also available on its website at www.torontopearson.com.
GTAA ANNUAL REPORT 2014 27
CORPORATE PROFILEThe GTAA was incorporated in March 1993 as a corporation without share capital under the Canada Corporations Act and recognized as a Canadian Airport Authority by the federal government in November 1994. Effective February 27, 2014, the GTAA was continued under the Canada Not-for-profit Corporations Act, the successor legislation to the Canada Corporations Act. The GTAA is authorized to operate airports within the south-central Ontario region, including the Greater Toronto Area (the “GTA”), on a commercial basis, to set fees for their use and to develop and improve the facilities. In accordance with this mandate, the GTAA currently manages and operates Toronto Pearson International Airport (the “Airport” or “Toronto Pearson”) under a ground lease with the federal government, which was executed in December 1996 (the “Ground Lease”). The Ground Lease has a term of 60 years, with one renewal term of 20 years. The Ground Lease is available on SEDAR at www.sedar.com and on the GTAA’s website at www.torontopearson.com.
BUSINESS STRATEGYThe Airport has sufficient infrastructure capacity to meet projected air travel demands for several years. During this period, additional investment in the Airport will relate to repairs and maintenance, as well as operational and passenger processing improvements, or will be made to generate additional non-aeronautical revenues, all within existing facilities. New capital expenditures and financing activities may be required by the GTAA in future years to increase the Airport’s overall capacity to meet the anticipated air travel needs of the region. This development will be undertaken only as appropriate in response to increases in air travel demand.
During 2013, the GTAA developed its 20-year strategic framework. This strategic framework is used as the basis for developing the GTAA’s five-year business plans and annual business plans and budgets.
The 20-year strategic framework seeks to position the Airport to meet the travel demands of the south-central Ontario region in a sustainable manner. The 20-year strategic framework is guided by three overarching principles: financial sustainability, customer experience and operational excellence. The overarching principles are intended to create a balanced approach to the GTAA’s strategic business decisions. Through this strategic framework, the GTAA will meet the growing demand for air travel by making optimum use of existing facilities before investing in new capital infrastructure. This strategy is demonstrated by the deferral of certain capital projects disclosed in the Annual Information Form for the year ended December 31, 2011 (the “Planned Capital Projects”). During the 2012 to 2014 period, the GTAA determined that it could defer certain of the large capital projects by taking advantage of new technology and implementing smaller capital projects to increase passenger and aircraft processing capacity within the existing terminal and airfield footprint. As a result the GTAA deferred approximately $511 million of capital expenditures in respect of the Planned Capital Projects and the associated debt service costs during this three year-period.
During 2014, the GTAA refined its 20-year strategic framework by introducing new vision and mission statements and developing and integrating an ancillary framework that will inform and guide its long-term corporate strategy. The GTAA also developed corporate sustainability and people strategic frameworks which are directly linked to the elements of the overall 20-year strategic framework.
In 2014, the GTAA completed the recruitment for five vacant executive positions. The appointment of the five new executive officers supports the GTAA’s ability to achieve its 20-year strategic framework.
OUTLOOK The recovery in aviation activity and the improving financial results of the GTAA that began in 2010 have continued throughout 2014. However, there continues to be some risk for the air travel industry due to, among other risks, the uneven global economic outlook, volatile oil prices and currency fluctuations. The GTAA is cautiously optimistic about future growth in Airport activity and it anticipates moderate growth in 2015. During 2014, passenger traffic grew by 6.8 per cent compared to 2013. The GTAA remains focused on activities designed to continue to reduce costs, grow non-aeronautical revenues by offering products and services which passengers value and work with air carriers to expand capacity on existing routes and attract new air service.
The GTAA believes that continued prudent planning and strategy-setting will strengthen the GTAA and enable Toronto Pearson to capitalize on growth opportunities as the economy and air travel demand continue to grow. The GTAA is at a stage in its development where the Airport has sufficient capacity to meet passenger demand for several years. The GTAA remains keenly focused on optimizing the utilization of existing assets before investing in additional capital infrastructure. As a result, the demand for new capital development funds is greatly reduced from the period when the GTAA was engaged in the major redevelopment of the Airport completed in 2007. While the GTAA is placing increasing emphasis on utilizing internally generated cash flows to fund capital investments, the GTAA may from time to time access the capital markets to refinance maturing debt and fund the redevelopment of existing assets as well as new major capital programs. The GTAA’s measured approach of matching Airport capacity to demand, together with the management focus expressed in its strategic framework, position the GTAA well to continue to meet the developing air travel needs of the south-central Ontario region in a sustainable manner.
28 GTAA ANNUAL REPORT 2014
OPERATING ACTIVITYThe GTAA monitors passenger activity levels and aircraft movements, including the type and size of aircraft, as both passenger and aircraft activity have a direct impact on its financial results.
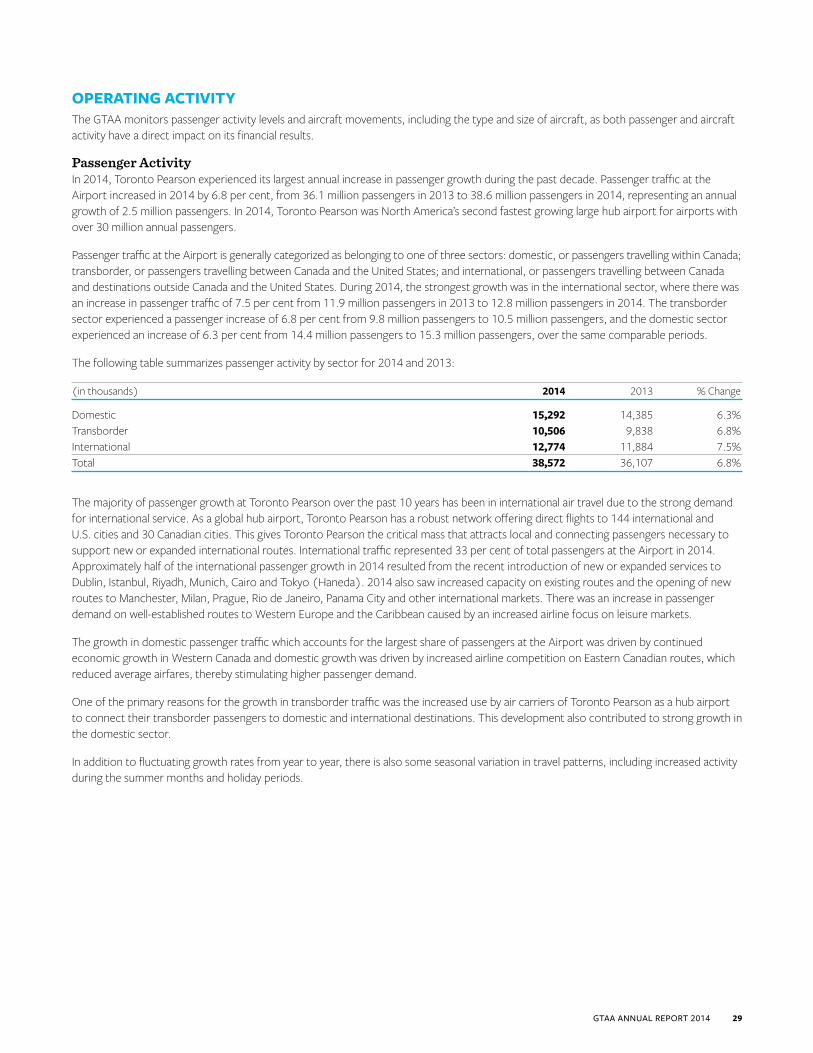
Passenger ActivityIn 2014, Toronto Pearson experienced its largest annual increase in passenger growth during the past decade. Passenger traffic at the Airport increased in 2014 by 6.8 per cent, from 36.1 million passengers in 2013 to 38.6 million passengers in 2014, representing an annual growth of 2.5 million passengers. In 2014, Toronto Pearson was North America’s second fastest growing large hub airport for airports with over 30 million annual passengers.
Passenger traffic at the Airport is generally categorized as belonging to one of three sectors: domestic, or passengers travelling within Canada; transborder, or passengers travelling between Canada and the United States; and international, or passengers travelling between Canada and destinations outside Canada and the United States. During 2014, the strongest growth was in the international sector, where there was an increase in passenger traffic of 7.5 per cent from 11.9 million passengers in 2013 to 12.8 million passengers in 2014. The transborder sector experienced a passenger increase of 6.8 per cent from 9.8 million passengers to 10.5 million passengers, and the domestic sector experienced an increase of 6.3 per cent from 14.4 million passengers to 15.3 million passengers, over the same comparable periods.
The following table summarizes passenger activity by sector for 2014 and 2013:
(in thousands) 2014 2013 % Change
Domestic 15,292 14,385 6.3%Transborder 10,506 9,838 6.8%International 12,774 11,884 7.5%Total 38,572 36,107 6.8%
The majority of passenger growth at Toronto Pearson over the past 10 years has been in international air travel due to the strong demand for international service. As a global hub airport, Toronto Pearson has a robust network offering direct flights to 144 international and U.S. cities and 30 Canadian cities. This gives Toronto Pearson the critical mass that attracts local and connecting passengers necessary to support new or expanded international routes. International traffic represented 33 per cent of total passengers at the Airport in 2014. Approximately half of the international passenger growth in 2014 resulted from the recent introduction of new or expanded services to Dublin, Istanbul, Riyadh, Munich, Cairo and Tokyo (Haneda). 2014 also saw increased capacity on existing routes and the opening of new routes to Manchester, Milan, Prague, Rio de Janeiro, Panama City and other international markets. There was an increase in passenger demand on well-established routes to Western Europe and the Caribbean caused by an increased airline focus on leisure markets.
The growth in domestic passenger traffic which accounts for the largest share of passengers at the Airport was driven by continued economic growth in Western Canada and domestic growth was driven by increased airline competition on Eastern Canadian routes, which reduced average airfares, thereby stimulating higher passenger demand.
One of the primary reasons for the growth in transborder traffic was the increased use by air carriers of Toronto Pearson as a hub airport to connect their transborder passengers to domestic and international destinations. This development also contributed to strong growth in the domestic sector.
In addition to fluctuating growth rates from year to year, there is also some seasonal variation in travel patterns, including increased activity during the summer months and holiday periods.
GTAA ANNUAL REPORT 2014 29
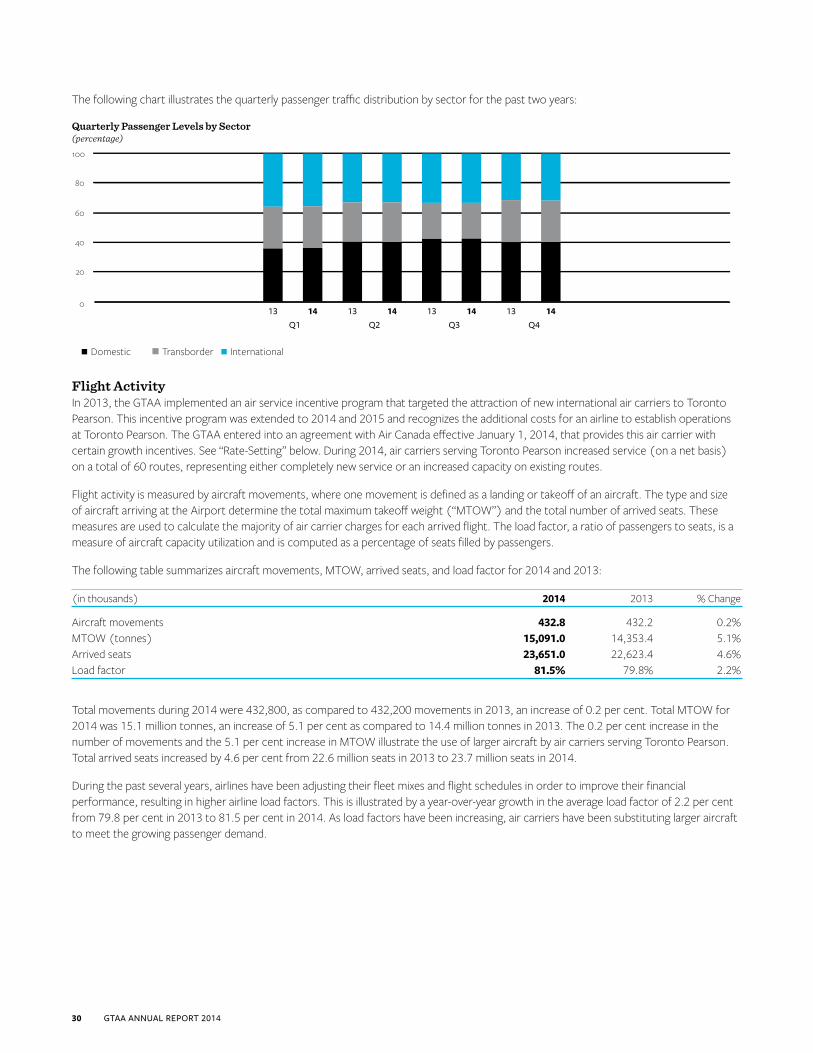
The following chart illustrates the quarterly passenger traffic distribution by sector for the past two years:
Flight ActivityIn 2013, the GTAA implemented an air service incentive program that targeted the attraction of new international air carriers to Toronto Pearson. This incentive program was extended to 2014 and 2015 and recognizes the additional costs for an airline to establish operations at Toronto Pearson. The GTAA entered into an agreement with Air Canada effective January 1, 2014, that provides this air carrier with certain growth incentives. See “Rate-Setting” below. During 2014, air carriers serving Toronto Pearson increased service (on a net basis) on a total of 60 routes, representing either completely new service or an increased capacity on existing routes.
Flight activity is measured by aircraft movements, where one movement is defined as a landing or takeoff of an aircraft. The type and size of aircraft arriving at the Airport determine the total maximum takeoff weight (“MTOW”) and the total number of arrived seats. These measures are used to calculate the majority of air carrier charges for each arrived flight. The load factor, a ratio of passengers to seats, is a measure of aircraft capacity utilization and is computed as a percentage of seats filled by passengers.
The following table summarizes aircraft movements, MTOW, arrived seats, and load factor for 2014 and 2013:
(in thousands) 2014 2013 % Change
Aircraft movements 432.8 432.2 0.2%MTOW (tonnes) 15,091.0 14,353.4 5.1%Arrived seats 23,651.0 22,623.4 4.6%Load factor 81.5% 79.8% 2.2%
Total movements during 2014 were 432,800, as compared to 432,200 movements in 2013, an increase of 0.2 per cent. Total MTOW for 2014 was 15.1 million tonnes, an increase of 5.1 per cent as compared to 14.4 million tonnes in 2013. The 0.2 per cent increase in the number of movements and the 5.1 per cent increase in MTOW illustrate the use of larger aircraft by air carriers serving Toronto Pearson. Total arrived seats increased by 4.6 per cent from 22.6 million seats in 2013 to 23.7 million seats in 2014.
During the past several years, airlines have been adjusting their fleet mixes and flight schedules in order to improve their financial performance, resulting in higher airline load factors. This is illustrated by a year-over-year growth in the average load factor of 2.2 per cent from 79.8 per cent in 2013 to 81.5 per cent in 2014. As load factors have been increasing, air carriers have been substituting larger aircraft to meet the growing passenger demand.
Q1 Q2 Q3 Q4
0
20
40
60
80
100
1413141314131413
� Domestic � Transborder � International
Quarterly Passenger Levels by Sector (percentage)
30 GTAA ANNUAL REPORT 2014
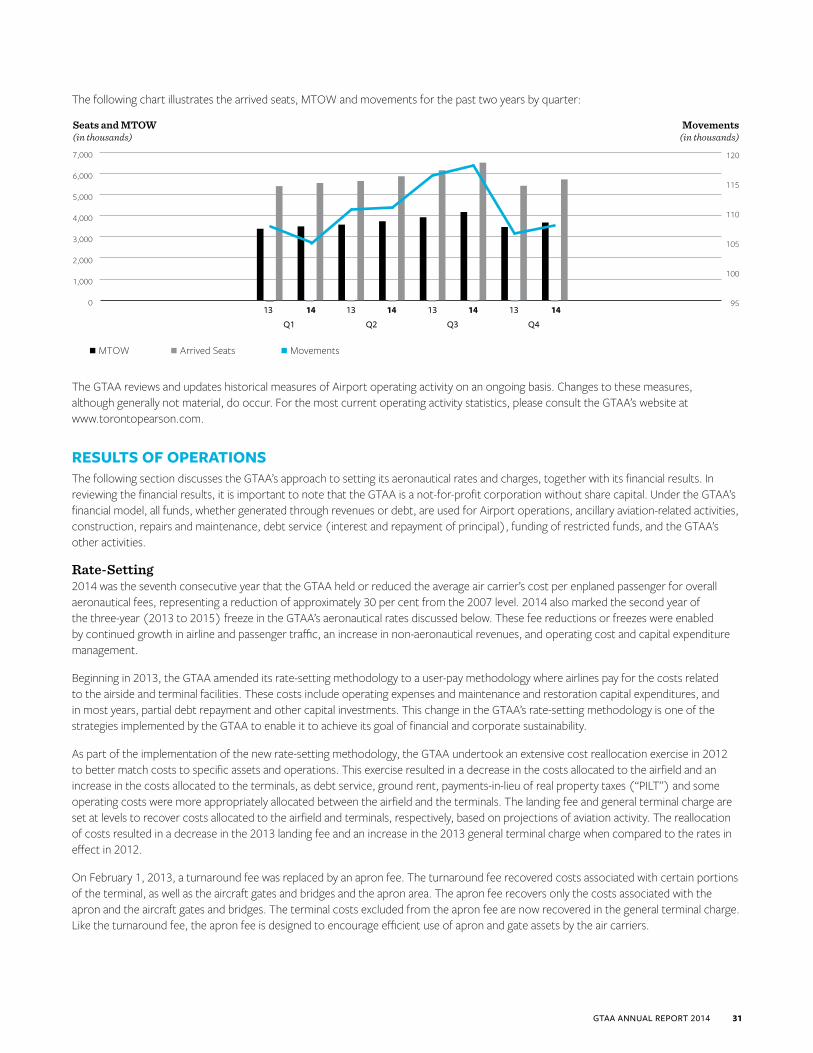
The following chart illustrates the arrived seats, MTOW and movements for the past two years by quarter:
The GTAA reviews and updates historical measures of Airport operating activity on an ongoing basis. Changes to these measures, although generally not material, do occur. For the most current operating activity statistics, please consult the GTAA’s website at www.torontopearson.com.
RESULTS OF OPERATIONS The following section discusses the GTAA’s approach to setting its aeronautical rates and charges, together with its financial results. In reviewing the financial results, it is important to note that the GTAA is a not-for-profit corporation without share capital. Under the GTAA’s financial model, all funds, whether generated through revenues or debt, are used for Airport operations, ancillary aviation-related activities, construction, repairs and maintenance, debt service (interest and repayment of principal), funding of restricted funds, and the GTAA’s other activities.
Rate-Setting2014 was the seventh consecutive year that the GTAA held or reduced the average air carrier’s cost per enplaned passenger for overall aeronautical fees, representing a reduction of approximately 30 per cent from the 2007 level. 2014 also marked the second year of the three-year (2013 to 2015) freeze in the GTAA’s aeronautical rates discussed below. These fee reductions or freezes were enabled by continued growth in airline and passenger traffic, an increase in non-aeronautical revenues, and operating cost and capital expenditure management.
Beginning in 2013, the GTAA amended its rate-setting methodology to a user-pay methodology where airlines pay for the costs related to the airside and terminal facilities. These costs include operating expenses and maintenance and restoration capital expenditures, and in most years, partial debt repayment and other capital investments. This change in the GTAA’s rate-setting methodology is one of the strategies implemented by the GTAA to enable it to achieve its goal of financial and corporate sustainability.
As part of the implementation of the new rate-setting methodology, the GTAA undertook an extensive cost reallocation exercise in 2012 to better match costs to specific assets and operations. This exercise resulted in a decrease in the costs allocated to the airfield and an increase in the costs allocated to the terminals, as debt service, ground rent, payments-in-lieu of real property taxes (“PILT”) and some operating costs were more appropriately allocated between the airfield and the terminals. The landing fee and general terminal charge are set at levels to recover costs allocated to the airfield and terminals, respectively, based on projections of aviation activity. The reallocation of costs resulted in a decrease in the 2013 landing fee and an increase in the 2013 general terminal charge when compared to the rates in effect in 2012.
On February 1, 2013, a turnaround fee was replaced by an apron fee. The turnaround fee recovered costs associated with certain portions of the terminal, as well as the aircraft gates and bridges and the apron area. The apron fee recovers only the costs associated with the apron and the aircraft gates and bridges. The terminal costs excluded from the apron fee are now recovered in the general terminal charge. Like the turnaround fee, the apron fee is designed to encourage efficient use of apron and gate assets by the air carriers.
0
1,000
2,000
3,000
4,000
5,000
6,000
7,000
141314131413141395
100
105
110
115
120
MTOW Arrived Seats Movements
Seats and MTOW(in thousands)
Q1 Q2 Q3 Q4
Movements(in thousands)
GTAA ANNUAL REPORT 2014 31

Other than discussed below with respect to Air Canada, in 2014 the GTAA maintained its aeronautical fees at 2013 levels and it intends to maintain the fees at those levels in 2015 as well. Keeping the fees unchanged provides greater price certainty for existing and potential new air carriers. The GTAA retains the right, however, to set fees as required and, if circumstances should vary from the GTAA’s expectations, the GTAA may alter its fees to ensure that its revenues are sufficient to cover its obligations.
Effective January 1, 2014, the GTAA and Air Canada implemented a new long-term commercial agreement (the “AC LTA”) to further develop Toronto Pearson as a global hub. The non-exclusive agreement covers an initial five-year term, and an extension for a further five years subject to certain conditions having been met, and includes fixed annual aeronautical fees for Air Canada and its family members, inclusive of landing fees, general terminal charges and apron fees. The fixed annual fees may be adjusted in certain circumstances, including instances where fees for all other carriers operating at the Airport are adjusted.
Certain key terms of the AC LTA are summarized below. For additional details regarding the AC LTA, see the GTAA’s Annual Information Form for the year ended December 31, 2014.
Scope – The AC LTA covers the aircraft movements of Air Canada, its wholly owned subsidiaries, and third-party air carriers with whom Air Canada has or enters into capacity purchase agreements and other arrangements as may be mutually agreed to be included in the scope of the AC LTA (“Air Canada Family Members”).
Term – The AC LTA became effective on January 1, 2014, and covers an initial five-year term expiring December 31, 2018. The term will be extended automatically for a further five years expiring December 31, 2023, provided that (i) Air Canada Family Members collectively meet an agreed increased passenger volume threshold during the 2018 calendar year, and (ii) the AC LTA has not otherwise been terminated prior to the expiry of the initial term. The GTAA may, at its option, elect to extend the initial term for the further five-year period notwithstanding that the applicable passenger volume threshold may not have been met.
Fees – The AC LTA provides for the payment by Air Canada of a fixed annual aeronautical base fee, plus applicable sales or other commodity taxes, during the term (including any extended term). The fixed annual aeronautical base fee covers costs that would otherwise be recovered by the GTAA from the Air Canada Family Members through the imposition of landing fees, general terminal charges and apron fees. In 2014, the annual aeronautical base fee was fixed at approximately $270 million. In 2015 and subsequent years, including any extension of the initial five-year term, the prior year’s fee will escalate by approximately one per cent annually.
The fixed annual aeronautical base fee may be increased or decreased in certain circumstances, including if the GTAA elects to adjust any one or more of its then-current published aeronautical charges payable by the remainder of the air carrier community at the Airport for any reason, including (without limitation) adjustments to address:
i. unbudgeted or unanticipated increases or decreases in the GTAA’s revenues (other than reductions pursuant to the payment of rebates under the AC LTA), costs or capital expenditures;
ii. increases or decreases in the GTAA’s costs arising from changes in or restructuring of the manner of provision of certain services at the Airport which are currently paid by the remainder of the air carrier community operating at the Airport directly to third-party service providers as third-party service fees; or
iii. other adjustments which the GTAA determines will be necessary in order to manage the level of the GTAA’s indebtedness in accordance with its requirements and objectives.
In the above circumstances, the GTAA will determine the amount of additional or reduced funds that it requires to raise through its aeronautical charges. Air Canada’s fixed annual aeronautical base fee is then adjusted by its proportionate share of the additional or reduced funds accordingly based on Air Canada’s share of 2013 aviation traffic. The proportionate share percentage remains unchanged throughout the term of the AC LTA.
Airport Improvement Fee – The GTAA expressly retains its right to increase or decrease the Airport Improvement Fee in its sole discretion, at any time during the term of the AC LTA.
Rebates – For each calendar year of the term, the AC LTA establishes certain passenger traffic thresholds for the Air Canada Family Members collectively. Provided that the Air Canada Family Members achieve the cumulative passenger threshold in a given year, Air Canada will receive a rebate calculated based on the additional revenues generated by incremental passenger growth at the Airport in excess of the threshold.
32 GTAA ANNUAL REPORT 2014
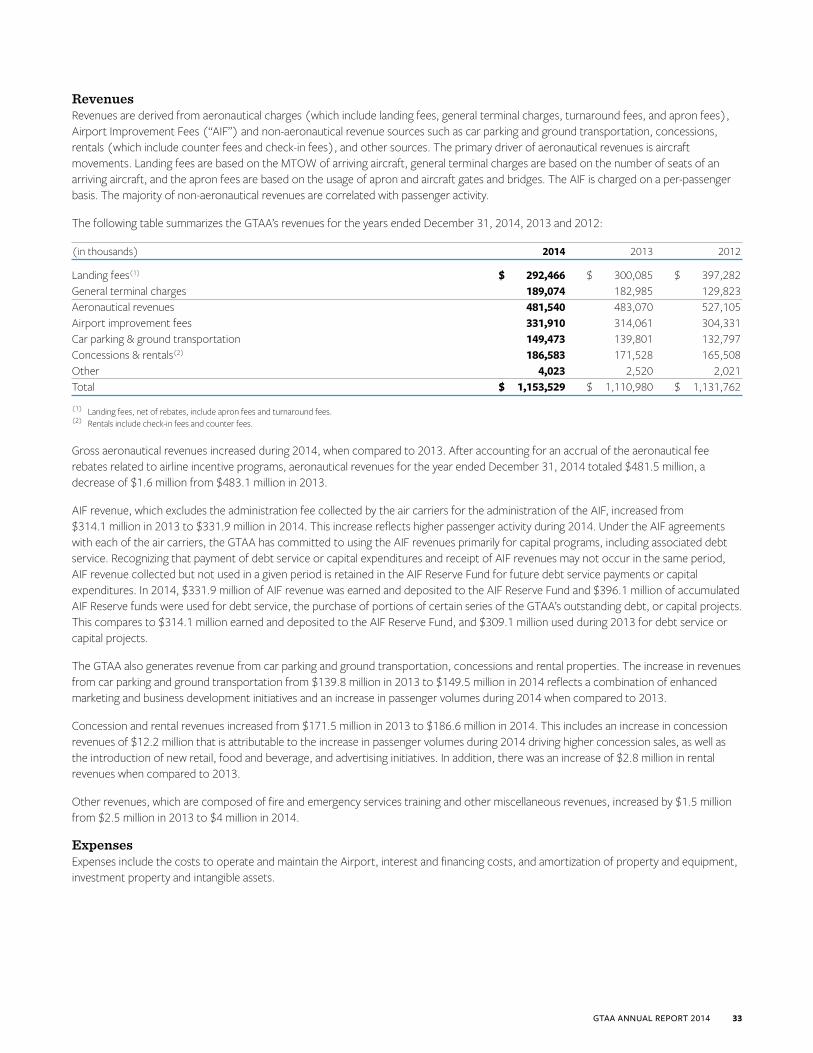
RevenuesRevenues are derived from aeronautical charges (which include landing fees, general terminal charges, turnaround fees, and apron fees), Airport Improvement Fees (“AIF”) and non-aeronautical revenue sources such as car parking and ground transportation, concessions, rentals (which include counter fees and check-in fees), and other sources. The primary driver of aeronautical revenues is aircraft movements. Landing fees are based on the MTOW of arriving aircraft, general terminal charges are based on the number of seats of an arriving aircraft, and the apron fees are based on the usage of apron and aircraft gates and bridges. The AIF is charged on a per-passenger basis. The majority of non-aeronautical revenues are correlated with passenger activity.
The following table summarizes the GTAA’s revenues for the years ended December 31, 2014, 2013 and 2012:
(in thousands) 2014 2013 2012
Landing fees(1) $ 292,466 $ 300,085 $ 397,282General terminal charges 189,074 182,985 129,823Aeronautical revenues 481,540 483,070 527,105Airport improvement fees 331,910 314,061 304,331Car parking & ground transportation 149,473 139,801 132,797Concessions & rentals(2) 186,583 171,528 165,508Other 4,023 2,520 2,021Total $ 1,153,529 $ 1,110,980 $ 1,131,762
(1) Landing fees, net of rebates, include apron fees and turnaround fees.(2) Rentals include check-in fees and counter fees.
Gross aeronautical revenues increased during 2014, when compared to 2013. After accounting for an accrual of the aeronautical fee rebates related to airline incentive programs, aeronautical revenues for the year ended December 31, 2014 totaled $481.5 million, a decrease of $1.6 million from $483.1 million in 2013.
AIF revenue, which excludes the administration fee collected by the air carriers for the administration of the AIF, increased from $314.1 million in 2013 to $331.9 million in 2014. This increase reflects higher passenger activity during 2014. Under the AIF agreements with each of the air carriers, the GTAA has committed to using the AIF revenues primarily for capital programs, including associated debt service. Recognizing that payment of debt service or capital expenditures and receipt of AIF revenues may not occur in the same period, AIF revenue collected but not used in a given period is retained in the AIF Reserve Fund for future debt service payments or capital expenditures. In 2014, $331.9 million of AIF revenue was earned and deposited to the AIF Reserve Fund and $396.1 million of accumulated AIF Reserve funds were used for debt service, the purchase of portions of certain series of the GTAA’s outstanding debt, or capital projects. This compares to $314.1 million earned and deposited to the AIF Reserve Fund, and $309.1 million used during 2013 for debt service or capital projects.
The GTAA also generates revenue from car parking and ground transportation, concessions and rental properties. The increase in revenues from car parking and ground transportation from $139.8 million in 2013 to $149.5 million in 2014 reflects a combination of enhanced marketing and business development initiatives and an increase in passenger volumes during 2014 when compared to 2013.
Concession and rental revenues increased from $171.5 million in 2013 to $186.6 million in 2014. This includes an increase in concession revenues of $12.2 million that is attributable to the increase in passenger volumes during 2014 driving higher concession sales, as well as the introduction of new retail, food and beverage, and advertising initiatives. In addition, there was an increase of $2.8 million in rental revenues when compared to 2013.
Other revenues, which are composed of fire and emergency services training and other miscellaneous revenues, increased by $1.5 million from $2.5 million in 2013 to $4 million in 2014.
ExpensesExpenses include the costs to operate and maintain the Airport, interest and financing costs, and amortization of property and equipment, investment property and intangible assets.
GTAA ANNUAL REPORT 2014 33
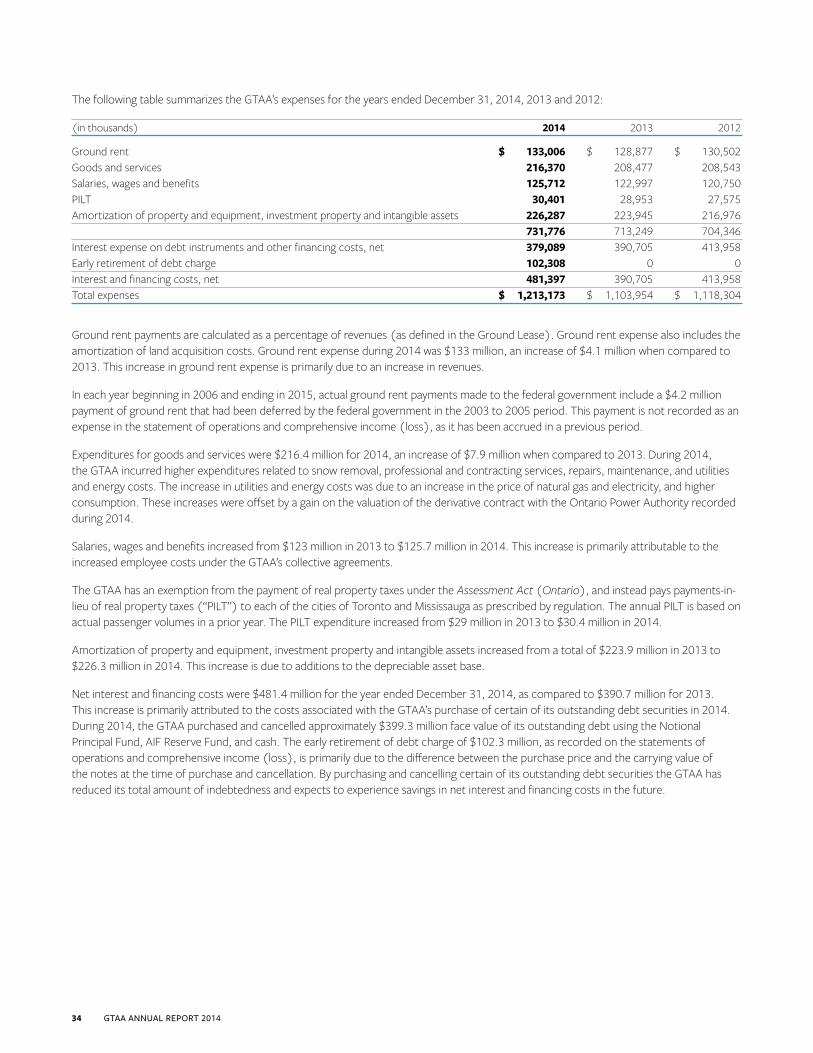
The following table summarizes the GTAA’s expenses for the years ended December 31, 2014, 2013 and 2012:
(in thousands) 2014 2013 2012
Ground rent $ 133,006 $ 128,877 $ 130,502Goods and services 216,370 208,477 208,543Salaries, wages and benefits 125,712 122,997 120,750PILT 30,401 28,953 27,575Amortization of property and equipment, investment property and intangible assets 226,287 223,945 216,976 731,776 713,249 704,346Interest expense on debt instruments and other financing costs, net 379,089 390,705 413,958Early retirement of debt charge 102,308 0 0Interest and financing costs, net 481,397 390,705 413,958Total expenses $ 1,213,173 $ 1,103,954 $ 1,118,304
Ground rent payments are calculated as a percentage of revenues (as defined in the Ground Lease). Ground rent expense also includes the amortization of land acquisition costs. Ground rent expense during 2014 was $133 million, an increase of $4.1 million when compared to 2013. This increase in ground rent expense is primarily due to an increase in revenues.
In each year beginning in 2006 and ending in 2015, actual ground rent payments made to the federal government include a $4.2 million payment of ground rent that had been deferred by the federal government in the 2003 to 2005 period. This payment is not recorded as an expense in the statement of operations and comprehensive income (loss), as it has been accrued in a previous period.
Expenditures for goods and services were $216.4 million for 2014, an increase of $7.9 million when compared to 2013. During 2014, the GTAA incurred higher expenditures related to snow removal, professional and contracting services, repairs, maintenance, and utilities and energy costs. The increase in utilities and energy costs was due to an increase in the price of natural gas and electricity, and higher consumption. These increases were offset by a gain on the valuation of the derivative contract with the Ontario Power Authority recorded during 2014.
Salaries, wages and benefits increased from $123 million in 2013 to $125.7 million in 2014. This increase is primarily attributable to the increased employee costs under the GTAA’s collective agreements.
The GTAA has an exemption from the payment of real property taxes under the Assessment Act (Ontario), and instead pays payments-in-lieu of real property taxes (“PILT”) to each of the cities of Toronto and Mississauga as prescribed by regulation. The annual PILT is based on actual passenger volumes in a prior year. The PILT expenditure increased from $29 million in 2013 to $30.4 million in 2014.
Amortization of property and equipment, investment property and intangible assets increased from a total of $223.9 million in 2013 to $226.3 million in 2014. This increase is due to additions to the depreciable asset base.
Net interest and financing costs were $481.4 million for the year ended December 31, 2014, as compared to $390.7 million for 2013. This increase is primarily attributed to the costs associated with the GTAA’s purchase of certain of its outstanding debt securities in 2014. During 2014, the GTAA purchased and cancelled approximately $399.3 million face value of its outstanding debt using the Notional Principal Fund, AIF Reserve Fund, and cash. The early retirement of debt charge of $102.3 million, as recorded on the statements of operations and comprehensive income (loss), is primarily due to the difference between the purchase price and the carrying value of the notes at the time of purchase and cancellation. By purchasing and cancelling certain of its outstanding debt securities the GTAA has reduced its total amount of indebtedness and expects to experience savings in net interest and financing costs in the future.
34 GTAA ANNUAL REPORT 2014
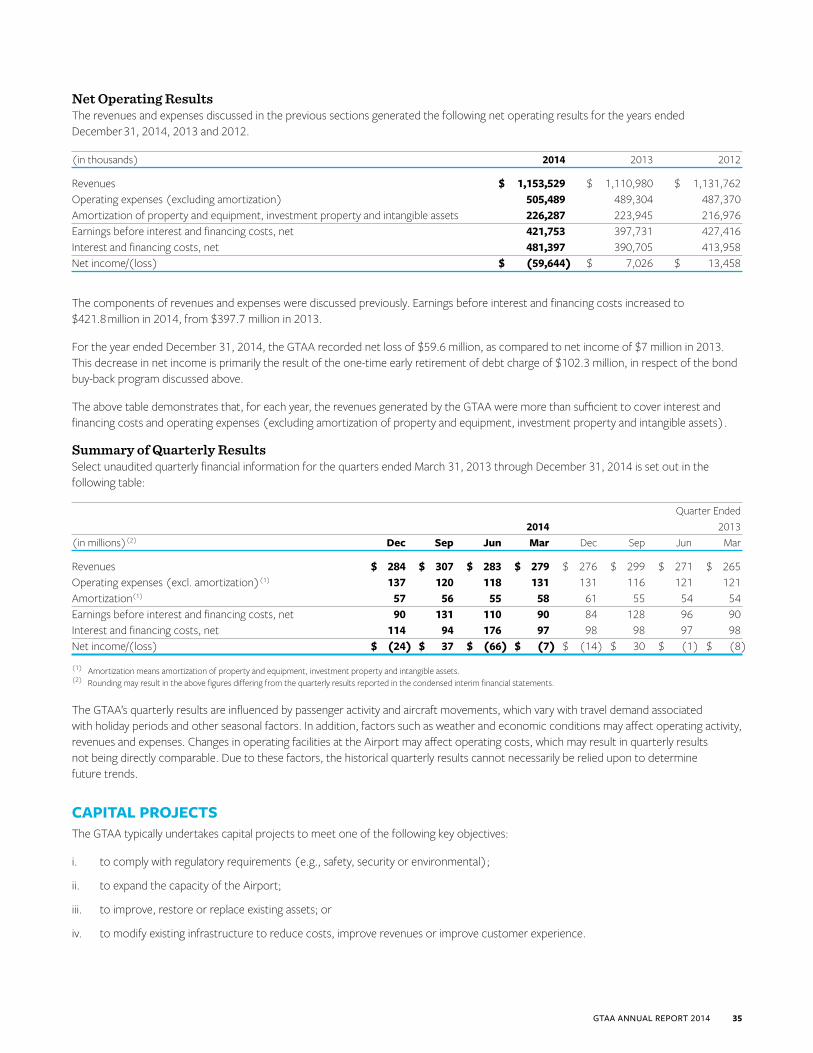
Net Operating Results The revenues and expenses discussed in the previous sections generated the following net operating results for the years ended December 31, 2014, 2013 and 2012.
(in thousands) 2014 2013 2012
Revenues $ 1,153,529 $ 1,110,980 $ 1,131,762Operating expenses (excluding amortization) 505,489 489,304 487,370 Amortization of property and equipment, investment property and intangible assets 226,287 223,945 216,976 Earnings before interest and financing costs, net 421,753 397,731 427,416 Interest and financing costs, net 481,397 390,705 413,958 Net income/(loss) $ (59,644) $ 7,026 $ 13,458
The components of revenues and expenses were discussed previously. Earnings before interest and financing costs increased to $421.8 million in 2014, from $397.7 million in 2013.
For the year ended December 31, 2014, the GTAA recorded net loss of $59.6 million, as compared to net income of $7 million in 2013. This decrease in net income is primarily the result of the one-time early retirement of debt charge of $102.3 million, in respect of the bond buy-back program discussed above.
The above table demonstrates that, for each year, the revenues generated by the GTAA were more than sufficient to cover interest and financing costs and operating expenses (excluding amortization of property and equipment, investment property and intangible assets).
Summary of Quarterly ResultsSelect unaudited quarterly financial information for the quarters ended March 31, 2013 through December 31, 2014 is set out in the following table:
Quarter Ended 2014 2013(in millions)(2) Dec Sep Jun Mar Dec Sep Jun Mar
Revenues $ 284 $ 307 $ 283 $ 279 $ 276 $ 299 $ 271 $ 265Operating expenses (excl. amortization)(1) 137 120 118 131 131 116 121 121Amortization(1) 57 56 55 58 61 55 54 54Earnings before interest and financing costs, net 90 131 110 90 84 128 96 90Interest and financing costs, net 114 94 176 97 98 98 97 98Net income/(loss) $ (24) $ 37 $ (66) $ (7) $ (14) $ 30 $ (1) $ (8)
(1) Amortization means amortization of property and equipment, investment property and intangible assets.(2) Rounding may result in the above figures differing from the quarterly results reported in the condensed interim financial statements.
The GTAA’s quarterly results are influenced by passenger activity and aircraft movements, which vary with travel demand associated with holiday periods and other seasonal factors. In addition, factors such as weather and economic conditions may affect operating activity, revenues and expenses. Changes in operating facilities at the Airport may affect operating costs, which may result in quarterly results not being directly comparable. Due to these factors, the historical quarterly results cannot necessarily be relied upon to determine future trends.
CAPITAL PROJECTSThe GTAA typically undertakes capital projects to meet one of the following key objectives:
i. to comply with regulatory requirements (e.g., safety, security or environmental);
ii. to expand the capacity of the Airport;
iii. to improve, restore or replace existing assets; or
iv. to modify existing infrastructure to reduce costs, improve revenues or improve customer experience.
GTAA ANNUAL REPORT 2014 35
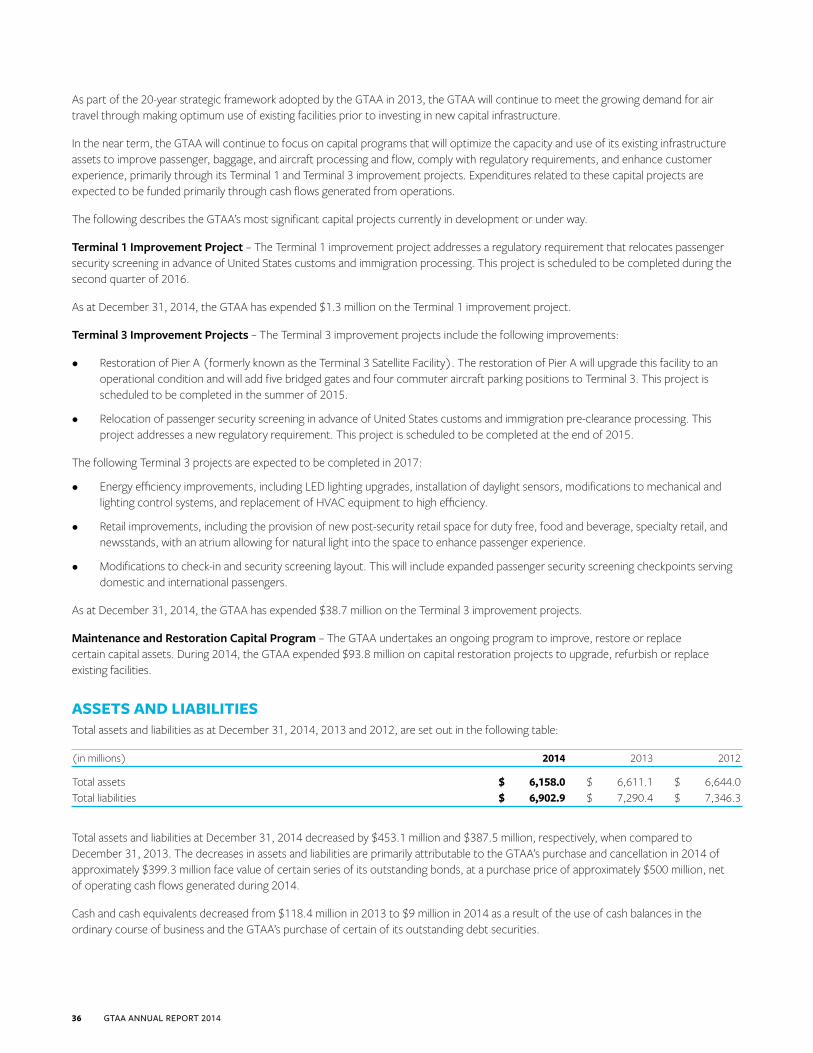
As part of the 20-year strategic framework adopted by the GTAA in 2013, the GTAA will continue to meet the growing demand for air travel through making optimum use of existing facilities prior to investing in new capital infrastructure.
In the near term, the GTAA will continue to focus on capital programs that will optimize the capacity and use of its existing infrastructure assets to improve passenger, baggage, and aircraft processing and flow, comply with regulatory requirements, and enhance customer experience, primarily through its Terminal 1 and Terminal 3 improvement projects. Expenditures related to these capital projects are expected to be funded primarily through cash flows generated from operations.
The following describes the GTAA’s most significant capital projects currently in development or under way.
Terminal 1 Improvement Project – The Terminal 1 improvement project addresses a regulatory requirement that relocates passenger security screening in advance of United States customs and immigration processing. This project is scheduled to be completed during the second quarter of 2016.
As at December 31, 2014, the GTAA has expended $1.3 million on the Terminal 1 improvement project.
Terminal 3 Improvement Projects – The Terminal 3 improvement projects include the following improvements:
• Restoration of Pier A (formerly known as the Terminal 3 Satellite Facility). The restoration of Pier A will upgrade this facility to an operational condition and will add five bridged gates and four commuter aircraft parking positions to Terminal 3. This project is scheduled to be completed in the summer of 2015.
• Relocation of passenger security screening in advance of United States customs and immigration pre-clearance processing. This project addresses a new regulatory requirement. This project is scheduled to be completed at the end of 2015.
The following Terminal 3 projects are expected to be completed in 2017:
• Energy efficiency improvements, including LED lighting upgrades, installation of daylight sensors, modifications to mechanical and lighting control systems, and replacement of HVAC equipment to high efficiency.
• Retail improvements, including the provision of new post-security retail space for duty free, food and beverage, specialty retail, and newsstands, with an atrium allowing for natural light into the space to enhance passenger experience.
• Modifications to check-in and security screening layout. This will include expanded passenger security screening checkpoints serving domestic and international passengers.
As at December 31, 2014, the GTAA has expended $38.7 million on the Terminal 3 improvement projects.
Maintenance and Restoration Capital Program – The GTAA undertakes an ongoing program to improve, restore or replace certain capital assets. During 2014, the GTAA expended $93.8 million on capital restoration projects to upgrade, refurbish or replace existing facilities.
ASSETS AND LIABILITIESTotal assets and liabilities as at December 31, 2014, 2013 and 2012, are set out in the following table:
(in millions) 2014 2013 2012
Total assets $ 6,158.0 $ 6,611.1 $ 6,644.0 Total liabilities $ 6,902.9 $ 7,290.4 $ 7,346.3
Total assets and liabilities at December 31, 2014 decreased by $453.1 million and $387.5 million, respectively, when compared to December 31, 2013. The decreases in assets and liabilities are primarily attributable to the GTAA’s purchase and cancellation in 2014 of approximately $399.3 million face value of certain series of its outstanding bonds, at a purchase price of approximately $500 million, net of operating cash flows generated during 2014.
Cash and cash equivalents decreased from $118.4 million in 2013 to $9 million in 2014 as a result of the use of cash balances in the ordinary course of business and the GTAA’s purchase of certain of its outstanding debt securities.
36 GTAA ANNUAL REPORT 2014
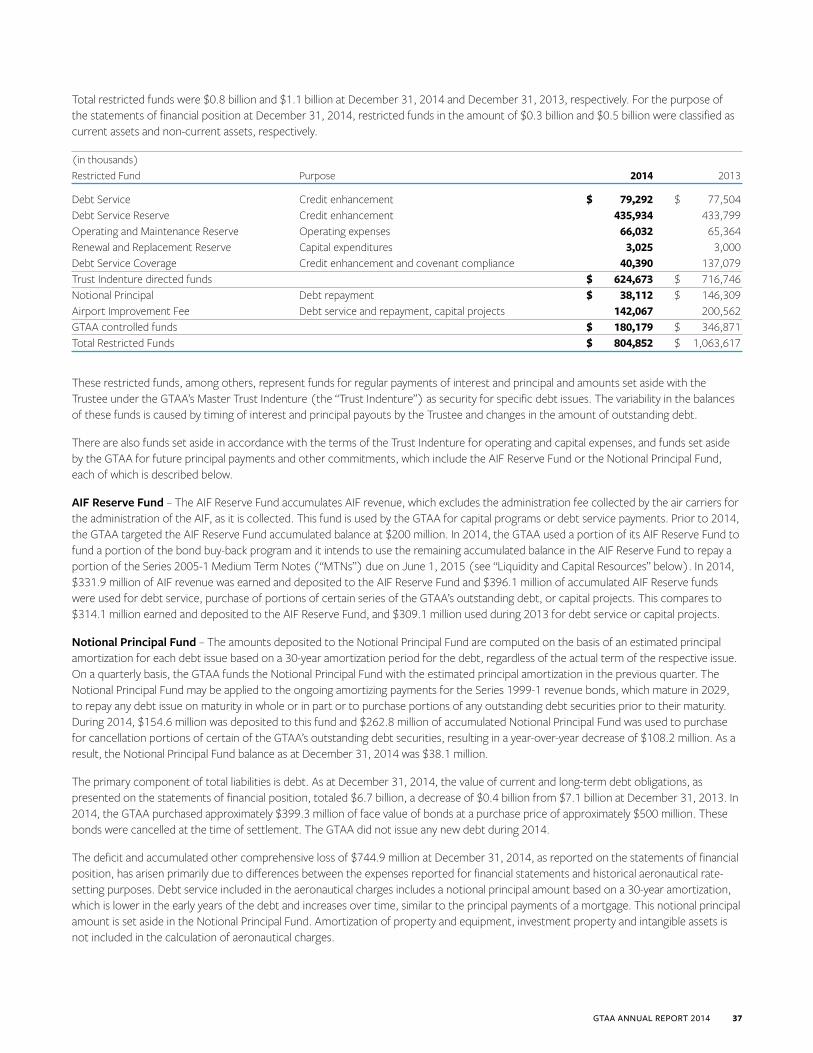
Total restricted funds were $0.8 billion and $1.1 billion at December 31, 2014 and December 31, 2013, respectively. For the purpose of the statements of financial position at December 31, 2014, restricted funds in the amount of $0.3 billion and $0.5 billion were classified as current assets and non-current assets, respectively.
(in thousands) Restricted Fund Purpose 2014 2013
Debt Service Credit enhancement $ 79,292 $ 77,504Debt Service Reserve Credit enhancement 435,934 433,799 Operating and Maintenance Reserve Operating expenses 66,032 65,364 Renewal and Replacement Reserve Capital expenditures 3,025 3,000 Debt Service Coverage Credit enhancement and covenant compliance 40,390 137,079 Trust Indenture directed funds $ 624,673 $ 716,746 Notional Principal Debt repayment $ 38,112 $ 146,309Airport Improvement Fee Debt service and repayment, capital projects 142,067 200,562 GTAA controlled funds $ 180,179 $ 346,871 Total Restricted Funds $ 804,852 $ 1,063,617
These restricted funds, among others, represent funds for regular payments of interest and principal and amounts set aside with the Trustee under the GTAA’s Master Trust Indenture (the “Trust Indenture”) as security for specific debt issues. The variability in the balances of these funds is caused by timing of interest and principal payouts by the Trustee and changes in the amount of outstanding debt.
There are also funds set aside in accordance with the terms of the Trust Indenture for operating and capital expenses, and funds set aside by the GTAA for future principal payments and other commitments, which include the AIF Reserve Fund or the Notional Principal Fund, each of which is described below.
AIF Reserve Fund – The AIF Reserve Fund accumulates AIF revenue, which excludes the administration fee collected by the air carriers for the administration of the AIF, as it is collected. This fund is used by the GTAA for capital programs or debt service payments. Prior to 2014, the GTAA targeted the AIF Reserve Fund accumulated balance at $200 million. In 2014, the GTAA used a portion of its AIF Reserve Fund to fund a portion of the bond buy-back program and it intends to use the remaining accumulated balance in the AIF Reserve Fund to repay a portion of the Series 2005-1 Medium Term Notes (“MTNs”) due on June 1, 2015 (see “Liquidity and Capital Resources” below). In 2014, $331.9 million of AIF revenue was earned and deposited to the AIF Reserve Fund and $396.1 million of accumulated AIF Reserve funds were used for debt service, purchase of portions of certain series of the GTAA’s outstanding debt, or capital projects. This compares to $314.1 million earned and deposited to the AIF Reserve Fund, and $309.1 million used during 2013 for debt service or capital projects.
Notional Principal Fund – The amounts deposited to the Notional Principal Fund are computed on the basis of an estimated principal amortization for each debt issue based on a 30-year amortization period for the debt, regardless of the actual term of the respective issue. On a quarterly basis, the GTAA funds the Notional Principal Fund with the estimated principal amortization in the previous quarter. The Notional Principal Fund may be applied to the ongoing amortizing payments for the Series 1999-1 revenue bonds, which mature in 2029, to repay any debt issue on maturity in whole or in part or to purchase portions of any outstanding debt securities prior to their maturity. During 2014, $154.6 million was deposited to this fund and $262.8 million of accumulated Notional Principal Fund was used to purchase for cancellation portions of certain of the GTAA’s outstanding debt securities, resulting in a year-over-year decrease of $108.2 million. As a result, the Notional Principal Fund balance as at December 31, 2014 was $38.1 million.
The primary component of total liabilities is debt. As at December 31, 2014, the value of current and long-term debt obligations, as presented on the statements of financial position, totaled $6.7 billion, a decrease of $0.4 billion from $7.1 billion at December 31, 2013. In 2014, the GTAA purchased approximately $399.3 million of face value of bonds at a purchase price of approximately $500 million. These bonds were cancelled at the time of settlement. The GTAA did not issue any new debt during 2014.
The deficit and accumulated other comprehensive loss of $744.9 million at December 31, 2014, as reported on the statements of financial position, has arisen primarily due to differences between the expenses reported for financial statements and historical aeronautical rate-setting purposes. Debt service included in the aeronautical charges includes a notional principal amount based on a 30-year amortization, which is lower in the early years of the debt and increases over time, similar to the principal payments of a mortgage. This notional principal amount is set aside in the Notional Principal Fund. Amortization of property and equipment, investment property and intangible assets is not included in the calculation of aeronautical charges.
GTAA ANNUAL REPORT 2014 37
The differential between notional amortization of debt and amortization of property and equipment, investment property and intangible assets contributes to the GTAA’s cumulative net deficit. The transition from the historical residual rate-setting model to one that targets cash flow is expected to contribute to an improvement in the net deficit position over time.
LIQUIDITY AND CAPITAL RESOURCESThe GTAA is a corporation without share capital and, accordingly, is funded through operating revenues, AIF revenues, restricted funds, the debt capital markets and its bank credit facilities. As noted previously, beginning in 2013, the GTAA transitioned from a residual rate-setting methodology to a rate-setting methodology that targets levels of cash flow sufficient to fund operating expenses, maintenance and restoration capital expenditures, and in most years, partial debt repayment and other capital investments. Consistent with its mandate, any excess funds generated by the GTAA are reinvested in the Airport or used for future debt repayments.
An overall Capital Markets Platform has been established by the GTAA with the Trust Indenture setting out the security and other common terms and conditions of all debt, including bank facilities, revenue bonds and MTNs. On February 10, 2014, the GTAA filed a shelf prospectus qualifying up to $1.5 billion of debt issuance for capital expenditures, reserve funds, debt refinancing and other approved uses through the 25-month period covered by the shelf prospectus. The program has been used to fund certain capital programs, and the GTAA will continue to access the debt markets to fund certain capital programs and to refinance some or all of its maturing debt. As of December 31, 2014, the GTAA had outstanding debt securities, including accrued interest and net of unamortized discounts and premiums, of approximately $6.7 billion. This amount excludes the credit facilities. Any proceeds received from debt issues that are not immediately required to fund capital projects or refinance maturing debt are invested in investment-grade debt instruments until such time as they are required.
The GTAA’s new approach to rate-setting, together with the GTAA’s prudent liquidity and interest rate risk management practices, enable the GTAA to proactively manage its debt levels and debt service costs. The GTAA has in the past redeemed certain of its debt prior to its scheduled maturity, and may do so in the future. In addition, the GTAA may from time to time seek to retire or purchase any outstanding debt through cash purchases in open market, privately negotiated transactions or otherwise. Such redemptions and purchases, if any, will depend on excess cash and reserve balances, prevailing market conditions, and other factors. As of the date of this report, the GTAA does not expect to purchase and cancel additional outstanding debt in the near term. These activities are intended to reduce the gross amount of the GTAA’s outstanding debt and reduce the GTAA’s annual net interest expense.
In 2014, the GTAA implemented the following key elements of its strategy to reduce its debt level and the annual debt service costs, and to reduce the negative carrying cost associated with maintaining certain reserve funds.
Bond Buy-Back Program – The GTAA purchased and cancelled approximately $399.3 million face value of certain series of its outstanding debt, at a purchase price of $500 million, using accumulated balances in the Notional Principal Fund, AIF Reserve Fund, and cash. The completion of the 2014 Bond Buy-Back Program enabled the GTAA to use its excess liquidity and reduce the negative carrying cost associated with holding cash and certain reserve funds. By purchasing and cancelling certain of its outstanding debt securities, the GTAA reduced its total indebtedness and expects to experience savings in net interest expense in the future.
Re-deployment of the AIF Reserve Fund – The GTAA used $58.5 million of its AIF Reserve Fund to fund a portion of the bond buy-back program. The re-deployment of these funds saved net interest expense on the purchased bonds and eliminated the negative carrying cost of the $58.5 million utilized. The GTAA intends to use the remaining $142.1 million accumulated balance in the AIF Reserve Fund to repay a portion of the $350 million Series 2005-1 MTNs due on June 1, 2015.
Increasing the Credit Facility – To replace the contingent liquidity formerly provided by the AIF Reserve Fund in November 2014, the GTAA increased its bank operating credit facility from $400 million to $600 million.
The GTAA currently maintains the following credit facilities: a revolving operating facility in the amount of $600 million (increased from $400 million in November 2014); a letter of credit facility in the amount of $100 million and an interest rate and foreign exchange hedging facility in the amount of $150 million (increased from $50 million in November 2014). The revolving operating facility and hedging facility mature on November 22, 2017, and each can be extended annually for one additional year with the lenders’ consent. The letter of credit facility matures on November 22, 2015, and can be extended annually for one additional year with the consent of the lender under such facility. The $600 million revolving operating credit facility is used to fund capital projects or operating expenses, as required, and provides flexibility on the timing for accessing the capital markets. These facilities rank pari passu with all other debt of the GTAA. Other than $2.4 million utilized by way of letters of credit, the GTAA had no funds drawn under the $600 million revolving operating facility, and no amounts were utilized under the $100 million letter of credit facility and the $150 million hedging facility, as at December 31, 2014.
38 GTAA ANNUAL REPORT 2014
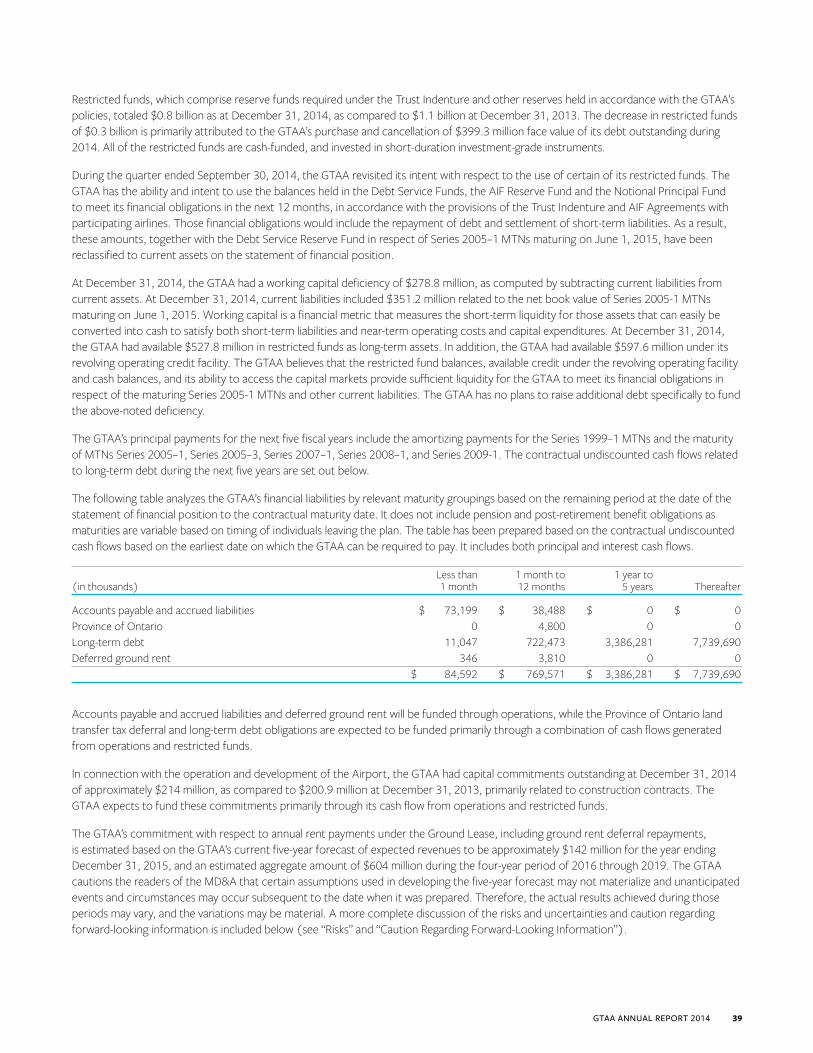
Restricted funds, which comprise reserve funds required under the Trust Indenture and other reserves held in accordance with the GTAA’s policies, totaled $0.8 billion as at December 31, 2014, as compared to $1.1 billion at December 31, 2013. The decrease in restricted funds of $0.3 billion is primarily attributed to the GTAA’s purchase and cancellation of $399.3 million face value of its debt outstanding during 2014. All of the restricted funds are cash-funded, and invested in short-duration investment-grade instruments.
During the quarter ended September 30, 2014, the GTAA revisited its intent with respect to the use of certain of its restricted funds. The GTAA has the ability and intent to use the balances held in the Debt Service Funds, the AIF Reserve Fund and the Notional Principal Fund to meet its financial obligations in the next 12 months, in accordance with the provisions of the Trust Indenture and AIF Agreements with participating airlines. Those financial obligations would include the repayment of debt and settlement of short-term liabilities. As a result, these amounts, together with the Debt Service Reserve Fund in respect of Series 2005–1 MTNs maturing on June 1, 2015, have been reclassified to current assets on the statement of financial position.
At December 31, 2014, the GTAA had a working capital deficiency of $278.8 million, as computed by subtracting current liabilities from current assets. At December 31, 2014, current liabilities included $351.2 million related to the net book value of Series 2005-1 MTNs maturing on June 1, 2015. Working capital is a financial metric that measures the short-term liquidity for those assets that can easily be converted into cash to satisfy both short-term liabilities and near-term operating costs and capital expenditures. At December 31, 2014, the GTAA had available $527.8 million in restricted funds as long-term assets. In addition, the GTAA had available $597.6 million under its revolving operating credit facility. The GTAA believes that the restricted fund balances, available credit under the revolving operating facility and cash balances, and its ability to access the capital markets provide sufficient liquidity for the GTAA to meet its financial obligations in respect of the maturing Series 2005-1 MTNs and other current liabilities. The GTAA has no plans to raise additional debt specifically to fund the above-noted deficiency.
The GTAA’s principal payments for the next five fiscal years include the amortizing payments for the Series 1999–1 MTNs and the maturity of MTNs Series 2005–1, Series 2005–3, Series 2007–1, Series 2008–1, and Series 2009-1. The contractual undiscounted cash flows related to long-term debt during the next five years are set out below.
The following table analyzes the GTAA’s financial liabilities by relevant maturity groupings based on the remaining period at the date of the statement of financial position to the contractual maturity date. It does not include pension and post-retirement benefit obligations as maturities are variable based on timing of individuals leaving the plan. The table has been prepared based on the contractual undiscounted cash flows based on the earliest date on which the GTAA can be required to pay. It includes both principal and interest cash flows.
Less than 1 month to 1 year to(in thousands) 1 month 12 months 5 years Thereafter
Accounts payable and accrued liabilities $ 73,199 $ 38,488 $ 0 $ 0 Province of Ontario 0 4,800 0 0 Long-term debt 11,047 722,473 3,386,281 7,739,690 Deferred ground rent 346 3,810 0 0 $ 84,592 $ 769,571 $ 3,386,281 $ 7,739,690
Accounts payable and accrued liabilities and deferred ground rent will be funded through operations, while the Province of Ontario land transfer tax deferral and long-term debt obligations are expected to be funded primarily through a combination of cash flows generated from operations and restricted funds.
In connection with the operation and development of the Airport, the GTAA had capital commitments outstanding at December 31, 2014 of approximately $214 million, as compared to $200.9 million at December 31, 2013, primarily related to construction contracts. The GTAA expects to fund these commitments primarily through its cash flow from operations and restricted funds.
The GTAA’s commitment with respect to annual rent payments under the Ground Lease, including ground rent deferral repayments, is estimated based on the GTAA’s current five-year forecast of expected revenues to be approximately $142 million for the year ending December 31, 2015, and an estimated aggregate amount of $604 million during the four-year period of 2016 through 2019. The GTAA cautions the readers of the MD&A that certain assumptions used in developing the five-year forecast may not materialize and unanticipated events and circumstances may occur subsequent to the date when it was prepared. Therefore, the actual results achieved during those periods may vary, and the variations may be material. A more complete discussion of the risks and uncertainties and caution regarding forward-looking information is included below (see “Risks” and “Caution Regarding Forward-Looking Information”).
GTAA ANNUAL REPORT 2014 39
The objective of the GTAA’s investment and cash management strategy is to ensure that the cash requirements for operations, capital programs and other demands are met, and to optimize the flexibility in accessing capital markets as may be required. The GTAA monitors its cash flow requirements accordingly. Given its current cash balance, availability on its credit facilities, restricted fund balances, ability to access the capital markets, and projected operating cash flows, the GTAA does not anticipate any funding shortfalls in 2015. However, there may be events outside of the control of the GTAA that could have a negative impact on its liquidity.
EARNINGS COVERAGEFor the 12-month period ended December 31, 2014, earnings before interest and financing costs for the GTAA were $421.8 million. Interest and financing costs for the same period, net of interest income, were $382.3 million, resulting in an earnings coverage ratio of 1.10:1.00.
The updated earnings coverage calculations have been provided to comply with disclosure requirements of the Canadian Securities Administrators (“CSA”). The earnings coverage ratio included above is computed in accordance with the CSA’s requirements and is not a measure under Generally Accepted Accounting Principles. An alternate measure of the GTAA’s ability to service its indebtedness is its obligation to comply with certain covenants in the Trust Indenture. The Trust Indenture contains a covenant that requires the GTAA to establish and maintain rates, rentals, charges, fees and services so that, among other things, Net Revenues, together with any Transfer from the General Fund in each Fiscal Year will be at least equal to 125 per cent of the Annual Debt Service for each Fiscal Year (as such capitalized terms are defined in the Trust Indenture).
The GTAA sets its rates in such a manner as to ensure the 125 per cent debt service covenant under the Trust Indenture is met. The debt service covenant test excludes amortization of property and equipment, investment property and intangible assets from expenses. However, it does include a notional amortization, over 30 years, of outstanding debt. Inclusion of debt amortization ensures that revenues are sufficient to retire debt over 30 years, which is considered appropriate for an infrastructure provider with significant, long-lived assets. This amortization of debt is reserved in the Notional Principal Fund and used for future debt repayments. As of the date of this report, the notional amortization of debt is less than the amortization of property and equipment, investment property and intangible assets recorded in the GTAA’s financial statements. As a result, the GTAA continues to meet the 125 per cent debt service covenant under the Trust Indenture, even though the earnings coverage ratio as calculated in accordance with the disclosure requirements of the Canadian Securities Administrators may at certain times be less.
SIGNIFICANT ACCOUNTING POLICIES AND ESTIMATESThe significant accounting policies of the GTAA and changes thereto are set out in Notes 3 and 4, respectively, of the Financial Statements as of December 31, 2014 and 2013.
The GTAA adopted the following new and revised standards effective January 1, 2014. These changes were made in accordance with the applicable transitional provisions.
Amendments to IAS 32, Financial Instruments: Presentation – The amendments clarify presentation requirements related to offsetting of financial assets and financial liabilities. The GTAA has adopted the amendments to IAS 32 effective January 1, 2014. The adoption of the amendments to IAS 32 did not have an impact on the financial statements.
Amendments to IAS 36, Impairment of Assets – These modifications include limited scope amendments to disclosure requirements in IAS 36. The GTAA has adopted the amendments to IAS 36 effective January 1, 2014. The adoption of the amendments to IAS 36 did not have an impact on the financial statements.
Amendments to IAS 39, Financial Instruments: Recognition and Measurement – The amendments provide clarification on whether an entity is required to discontinue hedge accounting in a circumstance where the hedging instrument is novated from one counterparty to another following the introduction of new regulations. The GTAA has adopted the amendments to IAS 39 effective January 1, 2014. The adoption of the amendments to IAS 39 did not have an impact on the financial statements.
International Financial Reporting Interpretations Committee 21 (“IFRIC 21”), Levies – This interpretation provides guidance on when to recognize a liability for a levy imposed by a government. The interpretation clarifies that the obligating event giving rise to a liability to pay a levy is the activity described in the relevant legislation that triggers payment of the levy. The GTAA has adopted IFRIC 21 effective January 1, 2014, which did not have a material impact on the financial statements.
40 GTAA ANNUAL REPORT 2014
In applying the GTAA’s accounting policies, management is required to make certain estimates or assumptions that affect the reported amount of assets and liabilities and the disclosure of commitments and contingencies at the date of the financial statements and the reported amounts of revenues and expenses during the reporting period. The critical accounting judgments and key sources of estimation uncertainty are set out in Note 5 of the Financial Statements as of December 31, 2014 and 2013. Actual results could differ from estimates.
Property and equipment for the Airport include items such as improvements to leased land, runways, terminals and other buildings, and roadways. These assets are recorded at cost and amortized over the estimated useful life of the asset. Amortization of assets commences when the asset is available for use, and for certain assets, such as the terminal buildings, the asset may be brought into or removed from operations in stages.
The timing for revenue recognition depends on the nature of the revenue and the specific agreements in place. Landing fees, general terminal charges and car parking revenues are recognized, net of estimated incentive program payments earned by air carriers, as the Airport facilities are utilized. Airport Improvement Fees are accrued upon the enplanement of the passenger. AIF revenue is remitted to the GTAA based on airlines self-assessing their passenger counts. An annual reconciliation is performed by the GTAA with air carriers. Concessions revenue is earned on a monthly basis and is recognized based on a percentage of sales or specified minimum rent guarantees. Ground transportation revenue is recognized based on a combination of the duration of the term of the licences and permits and utilization fees. Rentals revenue is recognized on a straight-line basis over the duration of the respective agreements.
The GTAA maintains defined benefit pension plans, defined contribution pension plans and other post-employment benefit plans for its employees. The cost of defined contribution pension plans is charged to expense as they are earned by employees. The cost of defined benefit plans and other post-employment benefit plans is determined using the projected unit credit method. The related pension asset/liability recognized in the statement of financial position is the present value of the defined benefit obligation at the statement of financial position date less the fair value of plan assets. The present value of the defined benefit obligation is determined by discounting the estimated future cash outflows using interest rates of high-quality corporate bonds that have terms to maturity approximating the terms of the related pension liability. Actuarial valuations for defined benefit plans are carried out at each statement of financial position date.
Actuarial gains and losses are recognized in full in the period in which they occur, in other comprehensive income without recycling to the statement of operations and comprehensive income (loss) in subsequent periods.
Past service costs are recognized in net income (loss) when incurred.
For funded plans, surpluses are recognized only to the extent that the surplus is considered recoverable. Recoverability is based primarily on the extent to which the GTAA can unilaterally reduce future contributions to the plan.
INTERNAL CONTROLS AND PROCEDURESManagement is responsible for establishing and maintaining disclosure controls and procedures to ensure that information required to be disclosed to satisfy the GTAA’s continuous disclosure obligations is recorded, processed, summarized and reported as required by applicable Canadian securities legislation. Management has carried out an evaluation of the effectiveness as of December 31, 2014, of the design and operation of the disclosure controls and procedures, as defined in National Instrument 52–109, Certification of Disclosure in Issuers’ Annual and Interim Filings, under the supervision of, and with the participation of, the President and CEO, and the Vice President and Chief Financial Officer (“CFO”). Based on this evaluation, the CEO and CFO concluded that the disclosure controls and procedures are effective in recording, processing, summarizing and reporting, on a timely basis, information required to be disclosed by the GTAA to satisfy its continuous disclosure obligations and are effective in ensuring that information required to be disclosed in the reports that the GTAA files is accumulated and communicated to management as appropriate to allow timely decisions regarding required disclosure. The Board of Directors has reviewed and approved the GTAA’s Disclosure Controls and Corporate Communications Policy. Management has determined that, as at December 31, 2014, the design and operation of the disclosure controls and procedures continues to be effective.
Management is responsible for designing and implementing internal controls over financial reporting to provide reasonable assurance regarding the reliability of the GTAA’s reporting and the preparation of financial statements for external purposes in accordance with IFRS. As required under National Instrument 52–109, the GTAA, under the supervision of, and with the participation of, the CEO and the CFO, has carried out an evaluation of the effectiveness, as at December 31, 2014, of its internal controls over financial reporting. Based on this evaluation, the GTAA’s CEO and CFO concluded that the GTAA maintained effective internal controls over financial reporting as at December 31, 2014. While no material weaknesses with respect to internal controls over financial reporting have been identified as at December 31, 2014, any assessment may not detect all weaknesses nor prevent or detect all misstatements because of inherent limitations.
GTAA ANNUAL REPORT 2014 41
Additionally, projections of any assessment of effectiveness to future periods are subject to the risk that controls may become inadequate due to changes in conditions or deterioration in the degree of compliance with the GTAA’s policies and procedures. No changes in the GTAA’s internal controls over financial reporting occurred during the last quarter and for the year ended December 31, 2014 that have materially affected, or are reasonably likely to materially affect, its internal control over financial reporting.
ENVIRONMENTAL MATTERSThe GTAA is committed to ensuring that activities undertaken at the Airport are carried out in an environmentally responsible manner, in compliance with applicable environmental laws and regulations, with appropriate management practices and with sensitivity to community and public concerns.
Environmental Risk Oversight and ManagementThe GTAA’s Board of Directors has delegated to its Environment, Safety, Security and Stakeholder Relations (“ESSSR”) Committee the responsibility for the oversight of environmental risks and related matters affecting the Airport. This Committee monitors management’s development and implementation of environmental policies, practices and activities including its Environmental Management Program. Management is responsible to ensure that such policies and practices are effective and meet or exceed legislative and regulatory requirements and best practices. The Committee and the Board review regular management reports relating to environmental risks, opportunities and matters.
Environmental Policy and ISO Certification – In 1999, the GTAA obtained ISO 14001 certification for its Environmental Management Program, the first airport in North America to earn this distinction. The GTAA has achieved re-certification annually since 1999. Through the process of annual ISO certification renewals and regular internal audits, the GTAA’s Environmental Management Program is being continuously improved.
As a requirement of the ISO 14001 certification, the GTAA developed and implemented an Environmental Policy for the Airport that is reviewed annually. The purpose of the GTAA’s Environmental Policy is to reduce and control the risks of environmental contamination, and to promote continuous improvement and regulatory compliance.
The air carriers, concessionaires and other commercial businesses that operate at the Airport are required to comply with environmental laws and regulations and with the environmental requirements contained in their leases or agreements with the GTAA, including compliance with the GTAA’s Environmental Policy. Through its Environmental Services division, the GTAA conducts scheduled inspections of tenants’, operators’ and contractors’ premises and operations to ensure compliance with environmental laws and contractual obligations, to identify potential environmental hazards and to make recommendations for the safe storage, handling and disposal of hazardous substances.
Environmental RiskThe GTAA adopted an Enterprise Risk Management (“ERM”) program to provide a disciplined approach for identifying, assessing, treating and managing risk. Using the ERM and the Environmental Management Program, environmental risks at the Airport are identified and ranked by severity and likelihood. Mitigation plans are then developed, implemented, monitored and continuously improved. The GTAA’s Environmental Services division provides quarterly reports on environmental risks and mitigation plan monitoring to senior management, the ESSSR Committee and/or the Board.
Spills of Hazardous Substances – The principal environmental risks at the Airport are spills of jet fuel, glycol-based deicing fluid and other hazardous substances. Virtually all of these substances are used, owned or handled by, or are within the care and control of, third parties operating at the Airport. The storage, use and transportation of hazardous substances are the responsibility of the owners of the hazardous substances and those having care and control of such substances. These parties are required to comply with the GTAA’s Environmental Management Program and applicable environmental laws and regulations.
Trends and Uncertainties – Climate ChangeThe trend toward global warming is expected to result in a change in climate that may manifest itself in more severe weather events and changes to climatic averages. As part of its preparedness for more severe weather events and changing climatic averages, in 2014 the GTAA updated its stormwater-flood study to determine what improvements or changes to its operational practices could be considered to prevent Airport flooding during severe storms. The GTAA will begin implementing the study’s recommendations in 2015. In addition, as part of its continuous improvement processes, the GTAA conducts a comprehensive review after each severe weather event to enhance its preparedness for future severe weather events.
42 GTAA ANNUAL REPORT 2014
To manage the release of greenhouse gases, which are related to global climate change, the GTAA implemented its Greenhouse Gas Management Policy in 2009. This policy requires the GTAA, by 2020, to reduce its greenhouse gas emissions (including those from purchased electricity) by 20 per cent below a 2006 baseline. During 2014, the GTAA continued to focus on energy use reduction, and projects that have been completed include substituting Light Emitting Diodes (“LEDs”) for inefficient incandescent and fluorescent lighting, and improving ventilation. The GTAA’s greenhouse gas emissions reduction program is a voluntary program that is consistent with the GTAA’s goal of achieving long-term sustainability.
Other Environmental MattersOther environmental matters include the Noise Management Program, environmental protection and the Partners in Project Green initiative.
Noise Management Program – The Ground Lease requires the GTAA to maintain a Noise Management Program. The GTAA’s Noise Management Program includes preferential runways, prescribed approach and departure flight procedures, and restrictions on the hours that certain types of aircraft may use the Airport. The GTAA maintains a Community Environment and Noise Advisory Committee composed of local residents, elected officials, representatives of the aviation industry and the GTAA. This committee meets regularly to discuss and review issues and complaints relating to noise and other environmental impacts of Airport operations. In addition, the GTAA has worked with the neighbouring municipalities to create an Airport Operating Area (“AOA”) surrounding the Airport. The AOA, which is based on noise contours, delineates an area within which land uses that are incompatible with Airport operations, including residential development and schools, are actively opposed by the GTAA. The AOA has been incorporated into the official plans of the cities of Toronto, Mississauga and Brampton, and the Region of Peel.
Environmental Protection – The two principal environmental protection programs implemented by the GTAA are its stormwater management master plan and the glycol recovery program.
The GTAA developed and implemented a stormwater management master plan for the Airport and constructed stormwater control facilities and related infrastructure to prevent stormwater run-off from runways and Airport lands from exceeding stormwater quality and quantity guidelines. The GTAA has updated its stormwater-flood study as described above (see Trends and Uncertainties – Climate Change).
The second principal environmental protection measure implemented by the GTAA is the glycol recovery program. Aircraft are de-iced at the Central De-icing Facility located in the infield area. Aircraft are also de-iced at the Hangar De-icing Facility located near Air Canada’s aircraft hangars, which facility became operational in January 2015. The glycol recovery program includes a series of catch basins or trench drains and underground tanks to collect glycol-based deicing fluid after it has been sprayed on aircraft. The captured deicing fluid is treated at off-Airport locations. The operational purpose of the glycol recovery program is to ensure that the use of glycol-based deicing fluid does not exceed environmental guidelines.
Partners in Project Green – The GTAA’s commitment to environmental responsibility extends beyond the boundaries of the Airport. Together with the Toronto and Region Conservation Authority, the GTAA initiated Partners in Project Green to develop and promote environmentally sustainable initiatives among the 12,500 companies located in the Pearson Eco-Business Zone, an area comprising over 12,000 hectares of industrial and commercial land surrounding the Airport.
RISKSThe GTAA’s Board of Directors is accountable for the oversight of the principal risks of the GTAA’s business and is responsible for monitoring that Management has effective policies and procedures to identify, assess, and manage such risks.
The GTAA has established an Enterprise Risk Management (“ERM”) program to instill risk awareness among employees and provide a disciplined approach to identify, assess, treat and manage risks. An enterprise-wide approach enables financial, customer, people and business risks to be managed and aligned with the GTAA’s strategic goals. The ERM program helps the GTAA to better understand uncertainty and its potential impact on strategic goals and is a key input into the GTAA’s decision-making process. The GTAA continues to review and improve its ERM program, by building stronger linkages between strategy, risk and opportunity, and by incorporating emerging risks based on current events that affect the GTAA’s business.
The GTAA, its operations and its financial results are subject to certain risks. At present, these risks include, without limitation, the risks set out below. Other risks are detailed from time to time in the GTAA’s publicly filed disclosure documents, including its Annual Information Form.
GTAA ANNUAL REPORT 2014 43
If any risks materialize, there could be a reduction in the GTAA’s revenues or an increase in its costs. The GTAA has the unfettered right to increase its aeronautical fees to ensure that its revenues are sufficient to cover its financial obligations.
Financial RiskAs of December 31, 2014, the GTAA had outstanding debt securities, including accrued interest and net of unamortized discounts and premiums, of approximately $6.7 billion. Depending on the timing of cash flows and actual operating activity levels, the GTAA may need to continue to access the capital markets to refinance maturing debt, finance future capital projects and fund reserve funds.
There are always risks when raising funds in the capital markets, including risks related to fluctuating interest rates and the availability of funds at any point in time. External factors, such as economic conditions, government policies, catastrophic events and the state of the financial markets, may have an impact on GTAA’s ability to access the capital markets.
As of the date of this report, the GTAA maintains a revolving operating facility in an amount of $600 million. This facility forms part of the GTAA’s contingent liquidity program and may be drawn upon to fund capital projects or operating expenses, as required, and provides flexibility on the timing for accessing the capital markets (see “Liquidity and Capital Resources” for details).
Strategic Development RiskIn 2013 and 2014, the GTAA developed and refined its 20-year strategic framework which identifies the strategic priorities that support its ability to meet the growing demand for air travel. Since these forward-looking plans are not able to anticipate all possible factors, there is a risk of developing strategies that may not enable the GTAA to achieve its corporate goals. The GTAA periodically conducts a comprehensive review of its strategic plans to incorporate any emerging factors that may influence business objectives.
Operational RiskInfrastructure – The provision of services at the Airport is dependent on the availability of physical assets such as runways and taxiways, terminal buildings, parking structures, and information technology. Should any of these assets become unavailable due to accident, event or maintenance failures, the ability to provide services and earn revenues may be impaired. The GTAA maintains insurance to protect against damage to property and business interruption. Although the GTAA maintains a well-developed asset management system including proactive inspections and monitoring, preventative maintenance, and repairs, there remains the risk of an unforeseen service disruption that may have an impact on operations or financial results. Other appropriate controls such as monitoring of service delivery standards, operating procedures and continuity plans have been established to ensure that the impact on passengers would be minimized.
Commercial Relationships – The GTAA works with a number of parties at the Airport to deliver services to passengers, air carriers, and others. These parties include government agencies, air carriers and third-party vendors. Should any of these parties fail to deliver services as required or in coordination with other partners including the GTAA, the GTAA’s ability to generate revenue or to deliver desired service levels and value to its customers and stakeholders, will be impacted.
There is a risk of an air carrier reducing or ceasing operations at the Airport, which may result in a temporary decline in the GTAA’s aviation activity and revenues until such time as replacement capacity is provided by existing or new air carriers. The GTAA maintains an effective credit and collections program which mitigates the financial loss due to a defaulting airline.
Security – The federal government is responsible for passenger, baggage and cargo screening at the Airport. The GTAA is responsible for other aspects of security, including maintaining secure access to restricted areas of the Airport and policing. The GTAA discharges its security requirements in compliance with the regulations set out by the federal government. A major security event anywhere in the world or changes in security regulations could result in more stringent regulations that could increase security screening processes or impose additional costs to the GTAA airlines and passengers.
Major Event – Any airport, including Toronto Pearson, is subject to the risk of a loss of confidence by air travellers as a result of a major event, such as an aircraft accident or terrorist attack at the Airport or elsewhere. This could lead to a temporary reduction in passenger demand processing capacity and the GTAA’s revenues.
Reputation – Any action or inaction by the GTAA, or any businesses or government agencies operating at the Airport, may impair Toronto Pearson’s image in the community or the public’s confidence in the Airport which could lead to a loss of revenue or additional expense to the GTAA should passenger traffic shift to another airport.
44 GTAA ANNUAL REPORT 2014

Industry RiskThe health of the air transportation industry and future airline traffic at the Airport give rise to a broad array of business and aviation risks that have the ability to slow or temporarily cease operations at the Airport and/or negatively affect passenger demand and therefore the GTAA’s revenues. These risks, among others, include: population growth; unemployment rates; economic conditions; regulatory actions and legislative changes; international air transportation agreements; increased security regulations; air carrier instability; the ability and willingness of airlines to provide air service; capital market conditions; the increase in the cost of air fares, including taxes and surcharges; currency fluctuations; labour disputes; the availability and cost of aviation fuel; carbon emission charges, taxes and restrictions; insurance costs; environmental regulation; the operation of the air traffic control system; the use of telecommunications and ground transportation as alternatives to air travel; volcanic eruptions; health epidemics and related travel advisories; geopolitical risk; war; and terrorist attacks, the perceived threat of terrorist attacks and additional security measures put in place to guard against such attacks.
Laws and Regulations RiskAirport operations are governed by federal, provincial and municipal regulations and standards. Changes in regulatory requirements by any level of government may have an impact on the GTAA’s cost to operate the Airport or the achievement of its strategic goals. The GTAA’s relationship with government agencies may affect its ability to influence positive change, deliver efficient and effective operations, and meet business goals.
People RiskIt is through an engaged and high-performing workforce that the GTAA will achieve its strategic goals. A failure by the GTAA to attract, develop and retain the right talent throughout the GTAA, while fostering a high-performance culture, may have an impact on the GTAA’s ability to realize its strategic goals. During the last two years, there have been six executive level departures as a result of retirement and management restructuring. During 2013 and 2014, the appointment of these executive positions was completed.
CAUTION REGARDING FORWARD-LOOKING INFORMATIONThis MD&A contains certain forward-looking information about the GTAA. This forward-looking information is based on a variety of assumptions and is subject to risks and uncertainties. There is significant risk that predictions, forecasts, conclusions and projections, which constitute forward-looking information, will not prove to be accurate, that the assumptions may not be correct and that actual results may vary from the forward-looking information. The GTAA cautions readers of this MD&A not to place undue reliance on the forward-looking information as a number of factors could cause actual results, conditions, actions or events to differ materially from the targets, expectations, estimates or intentions expressed in the forward-looking information.
Words such as “believe”, “expect”, “plan”, “intend”, “estimate”, “anticipate” and similar expressions, as well as future or conditional verbs such as “will”, “should”, “would” and “could” often identify forward-looking information. Specific forward-looking information in this MD&A includes, among others, statements regarding the following: the GTAA’s infrastructure capacity and its ability to meet projected air travel demand; additional investment in the Airport; the GTAA’s strategic framework; growth in domestic, transborder and international passenger traffic; the GTAA meeting growing demand for air travel through making optimum use of its existing facilities before investing in new infrastructure or facilities; future growth in Airport activity, including moderate growth during 2015; the GTAA’s capital borrowing requirements and program and its ability to access the capital markets; airline load factors and fleet mix; the GTAA’s rate-setting methodology and its relationship to financial and corporate sustainability and debt levels and service costs; cash flows, working capital and liquidity, including cash flows over the five-year period beginning in 2015, the GTAA’s ability to mitigate any working capital deficiency and no funding shortfalls in 2015; the effect of the apron fee and check-in fee on increasing efficiency in the use of Airport facilities; maintaining the GTAA’s 2013 aeronautical fees in 2015; reductions in average air carrier’s cost per enplaned passenger; the AC LTA entered into with Air Canada; budgets and expenditures relating to capital programs and the funding of such programs; terminal, airside, infield and other capital developments at the Airport and the funding of the developments; the commencement of operations of facilities currently under construction at the Airport; the redemption or purchase of outstanding debt and associated savings in net interest and financing costs; the use of certain restricted reserve funds; funding of outstanding capital commitments; the commencement of the implementation of the stormwater-flood study recommendations in 2015; and reductions in greenhouse gas emissions by 2020.
GTAA ANNUAL REPORT 2014 45

The forward-looking information is based on a variety of material factors and assumptions including, but not limited to, the following: long-term growth in population, employment and personal income will provide the basis for increased aviation demand in the GTA; the Canadian, U.S. and global economies will recover and grow at expected levels; air carrier capacity will meet the demand for air travel in the GTA; the growth and sustainability of air carriers will contribute to aviation demand in the GTA; the GTA will continue to attract domestic, transborder and international travellers; the commercial aviation industry will not be significantly affected by terrorism or the threat of terrorism; the cost of enhancing aviation security will not overly burden air carriers, passengers, shippers or the GTAA; no significant event will occur that has an impact on the ordinary course of business such as a natural disaster or other calamity; the GTAA will be able to access the capital markets at competitive terms and rates; and there are no significant cost over-runs or delays relating to capital programs. These assumptions are based on information currently available to the GTAA, including information obtained by the GTAA from third-party experts and analysts.
Risk factors that could cause actual results to differ materially from the results expressed or implied by forward-looking information include, among other things, continuing volatility in the economic recovery and future economic activity; high rates of unemployment and household debt; levels of aviation activity; air carrier instability; the availability of aviation liability and other insurance; the timing of recovery of receipt of insurance proceeds; construction risk; geopolitical unrest; terrorist attacks and the threat of terrorist attacks; war; health epidemics; labour disputes; capital market conditions; currency fluctuations; changes in laws; adverse amendments to the Ground Lease; the use of telecommunications and ground transportation as alternatives to air travel; the availability and cost of jet fuel; carbon emission costs and restrictions; adverse regulatory developments or proceedings; environmental issues; lawsuits; and other risks detailed from time to time in the GTAA’s publicly filed disclosure documents.
The forward-looking information contained in this MD&A represents expectations as of the date of this report and is subject to change. Except as required by applicable law, the GTAA disclaims any intention or obligation to update or revise any forward-looking information whether as a result of new information or future events or for any other reason.
46 GTAA ANNUAL REPORT 2014
MANAGEMENT’S RESPONSIBILITY FOR FINANCIAL REPORTING
The financial statements of the Greater Toronto Airports Authority have been prepared by management and approved by the Board of Directors and the Members of the Greater Toronto Airports Authority. Management is responsible for the preparation and presentation of the information contained in these financial statements and other sections of this Annual Report. The Greater Toronto Airports Authority maintains appropriate systems of internal control, policies and procedures which provide management with reasonable assurance that assets are safeguarded and that financial records are reliable and form a proper basis for the preparation of financial statements.
The Greater Toronto Airports Authority’s independent auditor, PricewaterhouseCoopers LLP, have been appointed by the Members of the Corporation to express their professional opinion on the fairness of these financial statements.
The Board of Directors ensures that management fulfills their responsibilities for financial reporting and internal controls through an Audit Committee, which is composed of five directors. This Committee reviews the financial statements and reports to the Board of Directors. The auditor has full and direct access to the Audit Committee.
HOWARD ENG JILL SHARLANDPresident and Chief Executive Officer Vice President and Chief Financial Officer
GTAA ANNUAL REPORT 2014 47
INDEPENDENT AUDITOR’S REPORT
To the Board of Directors of the Greater Toronto Airports Authority
We have audited the accompanying financial statements of the Greater Toronto Airports Authority, which comprise the statements of financial position as at December 31, 2014 and December 31, 2013 and the statements of operations and comprehensive income (loss), changes in deficit and accumulated other comprehensive income (loss) and cash flows for the years then ended, and the related notes, which comprise a summary of significant accounting policies and other explanatory information.
Management’s responsibility for the financial statementsManagement is responsible for the preparation and fair presentation of these financial statements in accordance with International Financial Reporting Standards, and for such internal control as management determines is necessary to enable the preparation of financial statements that are free from material misstatement, whether due to fraud or error.
Auditor’s responsibilityOur responsibility is to express an opinion on these financial statements based on our audits. We conducted our audits in accordance with Canadian generally accepted auditing standards. Those standards require that we comply with ethical requirements and plan and perform the audit to obtain reasonable assurance about whether the financial statements are free from material misstatement.
An audit involves performing procedures to obtain audit evidence about the amounts and disclosures in the financial statements. The procedures selected depend on the auditor’s judgment, including the assessment of the risks of material misstatement of the financial statements, whether due to fraud or error. In making those risk assessments, the auditor considers internal control relevant to the entity’s preparation and fair presentation of the financial statements in order to design audit procedures that are appropriate in the circumstances, but not for the purpose of expressing an opinion on the effectiveness of the entity’s internal control. An audit also includes evaluating the appropriateness of accounting policies used and the reasonableness of accounting estimates made by management, as well as evaluating the overall presentation of the financial statements.
We believe that the audit evidence we have obtained in our audits is sufficient and appropriate to provide a basis for our audit opinion.
OpinionIn our opinion, the financial statements present fairly, in all material respects, the financial position of the Greater Toronto Airports Authority as at December 31, 2014 and December 31, 2013 and its financial performance and its cash flows for the years then ended in accordance with International Financial Reporting Standards.
Chartered Professional Accountants, Licensed Public Accountants Toronto, Ontario March 11, 2015
48 GTAA ANNUAL REPORT 2014
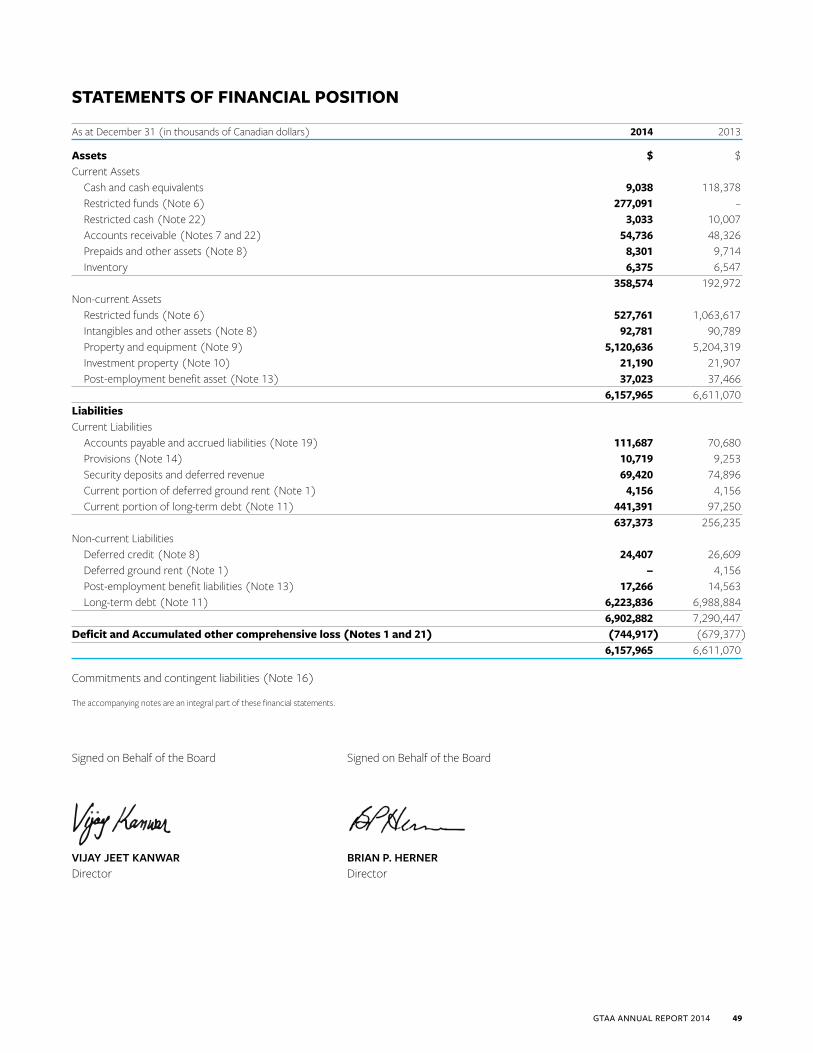
STATEMENTS OF FINANCIAL POSITION
As at December 31 (in thousands of Canadian dollars) 2014 2013
Assets $ $ Current Assets Cash and cash equivalents 9,038 118,378 Restricted funds (Note 6) 277,091 – Restricted cash (Note 22) 3,033 10,007 Accounts receivable (Notes 7 and 22) 54,736 48,326 Prepaids and other assets (Note 8) 8,301 9,714 Inventory 6,375 6,547 358,574 192,972 Non-current Assets Restricted funds (Note 6) 527,761 1,063,617 Intangibles and other assets (Note 8) 92,781 90,789 Property and equipment (Note 9) 5,120,636 5,204,319 Investment property (Note 10) 21,190 21,907 Post-employment benefit asset (Note 13) 37,023 37,466 6,157,965 6,611,070 LiabilitiesCurrent Liabilities Accounts payable and accrued liabilities (Note 19) 111,687 70,680 Provisions (Note 14) 10,719 9,253 Security deposits and deferred revenue 69,420 74,896 Current portion of deferred ground rent (Note 1) 4,156 4,156 Current portion of long-term debt (Note 11) 441,391 97,250 637,373 256,235 Non-current Liabilities Deferred credit (Note 8) 24,407 26,609 Deferred ground rent (Note 1) – 4,156 Post-employment benefit liabilities (Note 13) 17,266 14,563 Long-term debt (Note 11) 6,223,836 6,988,884 6,902,882 7,290,447 Deficit and Accumulated other comprehensive loss (Notes 1 and 21) (744,917) (679,377) 6,157,965 6,611,070
Commitments and contingent liabilities (Note 16)
The accompanying notes are an integral part of these financial statements.
Signed on Behalf of the Board Signed on Behalf of the Board
VIJAY JEET KANWAR BRIAN P. HERNERDirector Director
GTAA ANNUAL REPORT 2014 49
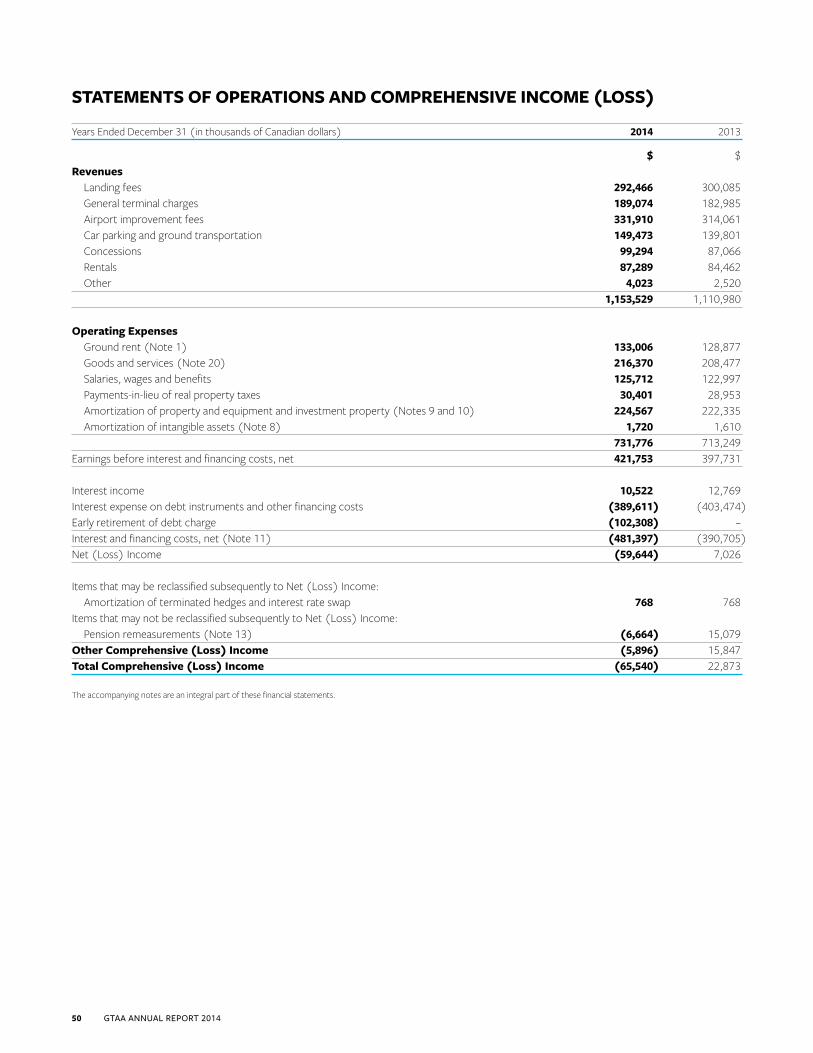
STATEMENTS OF OPERATIONS AND COMPREHENSIVE INCOME (LOSS)
Years Ended December 31 (in thousands of Canadian dollars) 2014 2013
$ $ Revenues Landing fees 292,466 300,085 General terminal charges 189,074 182,985 Airport improvement fees 331,910 314,061 Car parking and ground transportation 149,473 139,801 Concessions 99,294 87,066 Rentals 87,289 84,462 Other 4,023 2,520 1,153,529 1,110,980
Operating Expenses Ground rent (Note 1) 133,006 128,877 Goods and services (Note 20) 216,370 208,477 Salaries, wages and benefits 125,712 122,997 Payments-in-lieu of real property taxes 30,401 28,953 Amortization of property and equipment and investment property (Notes 9 and 10) 224,567 222,335 Amortization of intangible assets (Note 8) 1,720 1,610 731,776 713,249 Earnings before interest and financing costs, net 421,753 397,731
Interest income 10,522 12,769 Interest expense on debt instruments and other financing costs (389,611) (403,474)Early retirement of debt charge (102,308) – Interest and financing costs, net (Note 11) (481,397) (390,705)Net (Loss) Income (59,644) 7,026
Items that may be reclassified subsequently to Net (Loss) Income: Amortization of terminated hedges and interest rate swap 768 768 Items that may not be reclassified subsequently to Net (Loss) Income: Pension remeasurements (Note 13) (6,664) 15,079 Other Comprehensive (Loss) Income (5,896) 15,847 Total Comprehensive (Loss) Income (65,540) 22,873
The accompanying notes are an integral part of these financial statements.
50 GTAA ANNUAL REPORT 2014

STATEMENTS OF CHANGES IN DEFICIT AND ACCUMULATED OTHER COMPREHENSIVE INCOME (LOSS)
Accumulated Other ComprehensiveYear Ended December 31, 2014 (in thousands of Canadian dollars) Deficit Income (Loss) Total
$ $ $Balance, January 1, 2014 (665,429) (13,948) (679,377)Net Loss (59,644) – (59,644)Amortization of terminated hedges and interest rate swap – 768 768 Pension remeasurements (6,664) – (6,664)Total Comprehensive (Loss) Income for the year (66,308) 768 (65,540)Balance, December 31, 2014 (731,737) (13,180) (744,917)
Accumulated Other ComprehensiveYear Ended December 31, 2013 (in thousands of Canadian dollars) Deficit Income (Loss) Total
$ $ $Balance, January 1, 2013 (687,534) (14,716) (702,250)Net Income 7,026 – 7,026 Amortization of terminated hedges and interest rate swap – 768 768 Pension remeasurements 15,079 – 15,079 Total Comprehensive Income for the year 22,105 768 22,873 Balance, December 31, 2013 (665,429) (13,948) (679,377)
The accompanying notes are an integral part of these financial statements.
GTAA ANNUAL REPORT 2014 51

STATEMENTS OF CASH FLOWS
Years Ended December 31 (in thousands of Canadian dollars) 2014 2013
Cash Flows from (used in) Operating Activities $ $Net (Loss) Income (59,644) 7,026 Adjustments for: Amortization of property and equipment and investment property 224,567 222,335 Amortization of intangibles and other assets 3,163 3,019 Net loss on disposal of property and equipment and intangible assets 2,874 3,574 Change in fair value of derivative (8,914) (2,123) Derivative cash receipts 5,839 6,894 Post-employment benefit plans (3,518) (3,423) Interest expense on debt instruments and capitalized interest 385,894 399,791 Early retirement of debt charge 102,308 – Amortization of terminated hedges and interest rate swap 768 768 Amortization of deferred credit (2,202) (2,202) Net change in insurance recovery (Note 22) 7,561 (13,507)Changes in non-cash working capital: Accounts receivable (6,990) (7,963) Prepaids 1,732 1,116 Inventory 172 (460) Accounts payable and accrued liabilities 20,592 (19,171) Provisions 1,466 1,540 Security deposits and deferred revenue (5,476) (258) 670,192 596,956 Cash Flows from (used in) Investing Activities Acquisition and construction of property and equipment, investment property and intangible assets (122,041) (110,251) Proceeds on disposal of property and equipment 215 50 Land acquisition costs – (10,710) Decrease (Increase) in restricted funds 258,765 (131,506) 136,939 (252,417)Cash Flows used in Financing Activities Repayment of medium term notes and long-term debt (417,463) (18,676) Interest and early retirement of debt charge paid (494,852) (404,387) Payment of deferred ground rent payable (4,156) (4,156) (916,471) (427,219)Net Cash Outflow (109,340) (82,680)Cash and cash equivalents, beginning of year 118,378 201,058 Cash and cash equivalents, end of year 9,038 118,378
As at December 31, 2014, cash and cash equivalents consisted of short-term investments of $2.5 million (December 31, 2013 – $96.6 million), cash of $8.9 million (December 31, 2013 – $23.2 million) less outstanding cheques of $2.4 million (December 31, 2013 – $1.4 million).
The accompanying notes are an integral part of these financial statements.
52 GTAA ANNUAL REPORT 2014
NOTES TO THE FINANCIAL STATEMENTS
December 31, 2014 and 2013 (Unless otherwise stated, all amounts are in thousands of Canadian dollars)
1. General Information
NATIONAL AIRPORTS POLICYIn July 1994, the federal government announced its National Airports Policy whereby the management, operation and maintenance of 26 airports within the National Airport System were to be transferred through various ground lease arrangements to locally controlled Canadian Airport Authorities (“CAAs”). The National Airports Policy also prescribed the fundamental principles for the creation and operation of CAAs, including the public accountability principles to be adopted by each CAA.
CAAs are free to operate airports on a commercial basis and have the authority to set all fees and charges. The federal government retains regulatory control over aeronautics and as such will set safety and security standards for airports, license airports, and regulate the aviation industry as a whole.
CORPORATE PROFILE OF THE GREATER TORONTO AIRPORTS AUTHORITYThe Greater Toronto Airports Authority (“GTAA”) was incorporated on March 3, 1993, under Part II of the Canada Corporations Act as a corporation without share capital. Effective February 27, 2014, the GTAA transitioned to the Canada Not-for-profit Corporations Act, the successor legislation to Part II of the Canada Corporations Act. This corporate structure ensures that the excess of revenues over expenses is retained, and reinvested in the airport and airport operations under control of the GTAA.
The GTAA is exempt from federal and provincial income tax, as well as real property tax under the Assessment Act (Ontario). However, the GTAA is required to pay each of the cities of Toronto and Mississauga an amount as calculated in accordance with regulations under the Assessment Act (Ontario) as a payment-in-lieu of real property taxes.
The GTAA is authorized to develop, manage and operate airports within the south-central Ontario region, including the Greater Toronto Area, on a commercial basis, to set fees for their use and to develop and improve the facilities. In accordance with this mandate, the GTAA manages and operates Toronto Pearson International Airport (the “Airport”). Under the terms of a ground lease, the Airport was transferred to the GTAA in 1996. The Airport operates on 1,897 hectares of land, which includes Terminals 1 and 3; airside assets, including five runways, taxiways and aprons; groundside assets, including bridges and parking lots; infield assets, including an aircraft deicing facility and cargo buildings; and ancillary structures. Excluded are any assets owned by NAV CANADA, the operator of Canada’s civil air navigation system.
The GTAA is committed to the continuing development of the Airport. This includes continued redevelopment of the terminals, increasing airside capacity, increasing cargo and aircraft facilities and maintaining the roadway system.
The GTAA’s registered office and principal place of business is located at 3111 Convair Drive, Mississauga, Ontario, Canada.
AIRPORT SUBJECT TO GROUND LEASEOn December 2, 1996, the GTAA assumed the operation, management and control of the Airport for a period of 60 years, together with one renewal term of 20 years, by virtue of a ground lease (the “Ground Lease”) between the GTAA, as tenant, and Her Majesty the Queen in Right of Canada, represented by the Minister of Transport (“Transport Canada”), as landlord. The GTAA assumed the obligations of Transport Canada under all existing agreements at the Airport.
The Ground Lease is the principal document governing the relationship between the GTAA and Transport Canada at the Airport. It determines the rent to be paid and generally allocates risk and responsibilities between the GTAA and the federal government for all matters related to the operation of the Airport. Under the Ground Lease, all revenue and expenditure contracts in effect on December 1, 1996, were assigned to the GTAA. The GTAA did not assume any liability with respect to claims against the federal government incurred prior to December 2, 1996.
By virtue of its status as the tenant under the Ground Lease, the GTAA has the authority to set and collect airline rates and charges; negotiate and issue leases, licences and permits; and construct and develop the infrastructure of the Airport. The Ground Lease permits the GTAA to pledge its leasehold interest in the Airport as security.
GTAA ANNUAL REPORT 2014 53
Ground rent is calculated as a percentage of Airport Revenue, as defined by the Ground Lease and related documents, using escalating percentages with the following ranges: 0 per cent for Airport Revenue below $5.0 million, 1 per cent for Airport Revenue between $5.0 million and $10.0 million, 5 per cent for Airport Revenue between $10.0 million and $25.0 million, 8 per cent for Airport Revenue between $25.0 million and $100.0 million, 10 per cent for Airport Revenue between $100.0 million and $250.0 million, and 12 per cent for Airport Revenue in excess of $250.0 million. The calculation of Airport Revenue is subject to audit by Transport Canada.
2. Basis of Presentation These financial statements have been prepared in accordance with International Financial Reporting Standards (“IFRS”) as issued by the International Accounting Standards Board (“IASB”), and Interpretations of the International Financial Reporting Interpretations Committee (“IFRIC”) which the Canadian Accounting Standards Board has approved for incorporation into Part I of the Handbook for the Chartered Professional Accountants of Canada. These financial statements were approved by the Board of Directors on March 11, 2015.
In applying the GTAA’s accounting policies, as described in Note 3, Significant Accounting Policies, management is required to make judgements, estimates and assumptions about the carrying amount of assets and liabilities that are not readily apparent from other sources. The estimates and associated assumptions are based on historical experience and other factors that are considered to be relevant. Actual results may differ from these estimates. Accounting estimates and underlying assumptions are reviewed on an ongoing basis. Revisions to accounting estimates are recognized in the period in which the estimate is revised if the revision affects only that period, or in the period of the revision and future periods if the revision affects both current and future periods. The areas involving a higher degree of judgement or complexity, or areas where assumptions and estimates are significant to the financial statements, are disclosed in Note 5, Critical Accounting Judgements and Key Sources of Estimation Uncertainty.
3. Significant Accounting Policies The significant accounting policies used in the preparation of these financial statements are described below.
BASIS OF MEASUREMENTThe financial statements have been prepared on a going concern basis under the historical cost convention, except for the revaluation of certain financial assets and financial liabilities measured at fair value, including derivative instruments and available-for-sale investments.
SEGMENT REPORTINGThe GTAA consists of one reportable operating segment as defined under IFRS 8, Operating Segments.
FOREIGN CURRENCY TRANSLATIONThe financial statements are presented in Canadian dollars, which is the GTAA’s functional currency.
Foreign currency transactions are translated into the functional currency using the exchange rates prevailing at the dates of the transactions. Foreign exchange gains and losses resulting from the settlement of foreign currency transactions and from the translation at year-end exchange rates of monetary assets and liabilities denominated in currencies other than the GTAA’s functional currency are recognized in the statement of operations and comprehensive income (loss).
CASH AND CASH EQUIVALENTSCash and cash equivalents include cash on hand, deposits held with banks and other short-term, highly liquid investments with remaining terms to maturity of three months or less.
INVENTORYInventory consists of natural gas and parts and supplies held for use at the Airport. Inventory is stated at the lower of cost and net realizable value. Cost of natural gas is determined using the first-in, first-out method. Cost of parts and supplies is determined using the weighted-average cost method. Net realizable value is the estimated replacement cost.
54 GTAA ANNUAL REPORT 2014
FINANCIAL INSTRUMENTSFinancial assets and liabilities are recognized when the GTAA becomes a party to the contractual provisions of the instrument on the trade date. Financial assets are derecognized when the rights to receive cash flows from the assets have expired or have been transferred and the GTAA has transferred substantially all risks and rewards of ownership.
Financial assets and liabilities are offset and the net amount reported in the statement of financial position when there is a legally enforceable right to offset the recognized amounts and there is an intention to settle on a net basis or realize the asset and settle the liability simultaneously.
At initial recognition, the GTAA classifies its financial instruments in the following categories, depending on the purpose for which the instruments were acquired:
(i) Financial assets and liabilities at fair value through profit or loss: A financial asset or liability is classified in this category if acquired principally for the purpose of selling or repurchasing in the short term. Derivatives are also included in this category unless they are designated as hedges. The derivative instrument held by the GTAA classified in this category is the Ontario Power Authority (“OPA”) derivative (see Note 8, Intangibles and Other Assets).
Financial instruments in this category are recognized initially and subsequently at fair value. Transaction costs are expensed in the statement of operations and comprehensive income (loss) when incurred. Gains and losses arising from changes in fair value are presented in the statement of operations and comprehensive income (loss) within goods and services expense in the period in which they arise. Financial assets and liabilities at fair value through profit or loss are classified as current except for the portion expected to be realized or paid beyond 12 months of the statement of financial position date, which is classified as non-current.
(ii) Available-for-sale investments: Available-for-sale investments are non-derivatives that are either designated in this category or not classified in any of the other categories. The GTAA’s available-for-sale assets comprise investments in eligible short-term financial assets within restricted funds (see Note 6, Restricted Funds).
Available-for-sale investments are recognized initially at fair value plus transaction costs and are subsequently carried at fair value. Gains or losses arising from changes in fair value are recognized in other comprehensive (loss) income.
Interest on available-for-sale investments, calculated using the effective interest method, is recognized in the statement of operations and comprehensive income (loss) as part of interest income. When an available-for-sale investment is sold or impaired, the accumulated gains or losses are moved from accumulated other comprehensive (loss) income to the statement of operations and comprehensive income (loss) and included in interest and financing costs.
(iii) Loans and receivables: Loans and receivables are non-derivative financial assets with fixed or determinable payments that are not quoted in an active market. The GTAA’s loans and receivables are composed of cash and cash equivalents, restricted cash and accounts receivable and are included in current assets due to their short-term nature.
Loans and receivables are initially recognized at the amount expected to be received less, when material, a discount to reduce the loans and receivables to fair value.
(iv) Financial liabilities at amortized cost: Financial liabilities at amortized cost include accounts payable and accrued liabilities, provisions, security deposits, deferred ground rent and long-term debt. These items are initially recognized at the amount required to be paid less, when material, a discount to reduce the payables to fair value. Subsequently, these items are measured at amortized cost using the effective interest method. Long-term debt is recognized initially at fair value, net of any transaction costs incurred and discount/premiums, and subsequently recorded at amortized cost using the effective interest method.
Financial liabilities are classified as current liabilities if payments are due within 12 months. Otherwise, they are presented as non-current liabilities on the statement of financial position.
(v) Derivative financial instruments: Derivatives are initially recognized at fair value on the date a derivative contract is entered into and are subsequently remeasured at fair value. The method of recognizing the resulting gain or loss depends on whether the derivative is designated as a hedging instrument and, if so, the nature of the items being hedged.
Derivative financial instruments, including interest rate swaps, bond forwards, cash flow hedges and foreign exchange hedges, may be used from time to time to reduce exposure to fluctuations in interest rates and foreign exchange rates. Payments and receipts under interest rate swap agreements will be recognized as adjustments to interest and financing costs on the statement of operations and comprehensive income (loss) where the underlying instrument is a GTAA debt issue and as adjustments to interest income where the underlying instrument is an investment. Derivative financial instruments that are not designed by the GTAA to be in an effective hedging relationship are carried at fair value with the changes in fair value, including any payments and receipts made or received, being recorded in interest and financing costs on the statement of operations and comprehensive income (loss).
GTAA ANNUAL REPORT 2014 55

Currently, the GTAA has no derivative instruments outstanding that have been designated as hedges. However, certain gains and losses relating to terminated hedging instruments are being amortized to the statement of operations and comprehensive income (loss) over the term to maturity of the previously hedged item.
Derivatives embedded in other financial instruments or contracts are separated from their host contracts and accounted for as derivatives when their economic characteristics and risks are not closely related to those of the host contract, when the terms of the embedded derivative are the same as those of a free-standing derivative, and when the combined instrument or contract is not measured at fair value, with changes in fair value recognized in interest and financing costs on the statement of operations and comprehensive income (loss).
As at December 31, 2014, the GTAA does not have any outstanding contracts or financial instruments with embedded derivatives that require bifurcation.
IMPAIRMENT OF FINANCIAL ASSETSAt each reporting date, the GTAA assesses whether there is objective evidence that a financial asset is impaired. If such evidence exists, the GTAA recognizes an impairment loss.
IMPAIRMENT OF NON-FINANCIAL ASSETSProperty and equipment and intangible assets are tested for impairment when events or changes in circumstances indicate that the carrying amount may not be recoverable. The recoverable amount is the higher of an asset’s fair value, less costs to sell, and value in use (being the present value of the expected future cash flows of the relevant asset or cash-generating unit). An impairment loss is recognized for the amount by which the asset’s carrying amount exceeds its recoverable amount.
The GTAA evaluates impairment by examining long-lived assets for impairment indicators and examines any prior-period impairment losses for potential reversals when events or circumstances warrant such consideration.
LEASESOperating lease payments are recognized as an expense on a straight-line basis over the lease term except where another systematic basis is more representative of the time pattern in which economic benefits from the leased asset are consumed.
The Ground Lease is accounted for as an operating lease (see Note 12, Leases).
INTANGIBLES AND OTHER ASSETSAs required under the terms of the Ground Lease, the title of any land acquired is transferred to the federal government, while the GTAA retains use of the land. The purchase price for acquired land is recorded as land acquisition costs on the statement of financial position and amortized on a straight-line basis over the remaining term of the Ground Lease in ground rent expense on the statement of operations and comprehensive income (loss).
Computer software costs are capitalized and amortized on a straight-line basis in amortization of intangible assets on the statement of operations and comprehensive income (loss) over the period of their expected useful lives, which range from three to 20 years.
Deferred leasehold inducements are capitalized and amortized on a straight-line basis over the term of the respective lease. Amortization is netted against concessions revenue on the statement of operations and comprehensive income (loss).
These assets are reviewed for impairment whenever events or changes in circumstances indicate that the carrying amount may not be recoverable.
56 GTAA ANNUAL REPORT 2014

PROPERTY AND EQUIPMENTProperty and equipment are recorded at cost less accumulated amortization and include items such as improvements to leased land, runways, buildings and roadways. These assets will revert to Transport Canada upon the expiration or termination of the Ground Lease. No amounts are amortized longer than the lease term plus one renewal option.
Property and equipment are amortized at the following annual rates:
Buildings and structures (“Terminal and Airside assets”) Straight-line over four to 60 years
Bridges and approach systems (“Terminal and Airside assets”) Straight-line over 15 to 25 years
Baggage handling systems Straight-line over 18 to 25 years
Improvements to leased land Straight-line over the remaining term of the Ground Lease
Runways and taxiways (“Terminal and Airside assets”) Straight-line over 10 to 40 years
Operating assets Straight-line over three to 40 years
The GTAA allocates the amount initially recognized with respect to an item of property and equipment to its significant parts and amortizes separately each such part. Residual values, method of amortization and useful lives of the assets are reviewed annually and adjusted if appropriate.
Gains and losses on disposals of property and equipment are determined by comparing the proceeds with the carrying amount of the asset and are included as part of goods and services expense in the statement of operations and comprehensive income (loss).
Assets under construction are transferred to property and equipment when the asset is available for use, and amortization commences at that time.
BORROWING COSTSBorrowing costs directly attributable to the acquisition, construction or production of qualifying assets, which are assets that take a substantial period of time to get ready for their intended use, are added to the cost of those assets until such time as the assets are substantially ready for their intended use. All other borrowing costs are recognized in interest and financing costs on the statement of operations and comprehensive income (loss) in the period in which they are incurred.
INVESTMENT PROPERTYInvestment property is property held to earn rental income and is stated at historical cost less accumulated amortization and any recognized impairment loss. The fair value of investment property is estimated annually by using a discounted cash flow projection model.
Amortization on investment property assets is calculated using the straight-line method to allocate an asset’s cost over its estimated useful life. Amortization rates for each significant component range from 15 to 50 years.
Investment property is derecognized either when it has been disposed of or when the investment property is permanently withdrawn from use and no future economic benefit is expected from its disposal. The difference between the net disposal proceeds and the carrying amount of the asset is recognized in the statement of operations and comprehensive income (loss) in the period of derecognition. Transfers are made to or from the investment property category only when there is a change in use.
REVENUE RECOGNITIONRevenue is recognized when it is probable that the economic benefits will flow to the GTAA and delivery has occurred, when the sales price is fixed or determinable, stated net of discounts and value added taxes, and when collectability is reasonably assured.
Landing fees, general terminal charges and car parking revenues are recognized as Airport facilities are utilized. Airport Improvement Fees (“AIF”) are accrued upon the enplanement of the passenger. AIF revenue is remitted to the GTAA based on airlines self-assessing their passenger counts. An annual reconciliation is performed by the GTAA with air carriers. Concessions revenue is earned on a monthly basis and is recognized based on a percentage of sales or specified minimum rent guarantees. Ground transportation revenue is recognized based on a combination of the duration of the term of the licences and permits, and utilization fees. Rentals revenue is recognized straight-line over the duration of the respective agreements.
GTAA ANNUAL REPORT 2014 57
POST-EMPLOYMENT BENEFIT OBLIGATIONSThe GTAA maintains defined benefit pension plans, defined contribution pension plans and other post-employment benefit plans for its employees. The cost of defined contribution pension plans is charged to expense as they are earned by employees. The cost of defined benefit plans and other post-employment benefit plans is determined using the projected unit credit method. The related pension asset/liability recognized in the statement of financial position is the present value of the defined benefit obligation at the statement of financial position date less the fair value of plan assets. The present value of the defined benefit obligation is determined by discounting the estimated future cash outflows using interest rates of high-quality corporate bonds that have terms to maturity approximating the terms of the related pension liability. Actuarial valuations for defined benefit plans are carried out at each statement of financial position date.
Actuarial gains and losses are recognized in full in the period in which they occur, in other comprehensive (loss) income without recycling to the statement of operations and comprehensive income (loss) in subsequent periods.
Past service costs are recognized in net (loss) income when incurred.
For funded plans, surpluses are recognized only to the extent that the surplus is considered recoverable. Recoverability is based primarily on the extent to which the GTAA can unilaterally reduce future contributions to the plan.
PROVISIONSProvisions are recognized when the GTAA has a present obligation (legal or constructive) as a result of a past event, when it is more likely than not that the GTAA will be required to settle the obligation, and when a reliable estimate can be made of the amount of the obligation.
DEFERRED FINANCING COSTSDeferred financing costs (except for line of credit fees) and debt issuance premiums or discounts are included in debt balances and recognized as an adjustment to interest expense over the life of the debt. The GTAA uses the effective interest method to recognize bond interest expense.
COMPARATIVE FIGURESCertain comparative revenue figures have been reclassified to conform to the current period’s presentation.
4. Changes in Accounting Policy and DisclosuresThe GTAA has adopted the following new and revised standards effective January 1, 2014. These changes were made in accordance with the applicable transitional provisions.
a) Amendments to IAS 32, Financial Instruments: Presentation: The amendments clarify presentation requirements related to offsetting of financial assets and financial liabilities. The GTAA has adopted the amendments to IAS 32 effective January 1, 2014. The adoption of the amendments to IAS 32 did not have an impact on the financial statements.
b) Amendments to IAS 36, Impairment of Assets:These modifications include limited scope amendments to disclosure requirements in IAS 36. The GTAA has adopted the amendments to IAS 36 effective January 1, 2014. The adoption of the amendments to IAS 36 did not have an impact on the financial statements.
c) Amendments to IAS 39, Financial Instruments: Recognition and Measurement: The amendments provide clarification whether an entity is required to discontinue hedge accounting in a circumstance where the hedging instrument is novated from one counterparty to another following the introduction of new regulations. The GTAA has adopted the amendments to IAS 39 effective January 1, 2014. The adoption of the amendments to IAS 39 did not have an impact on the financial statements.
d) International Financial Reporting Interpretations Committee 21 (“IFRIC 21”), Levies: This interpretation provides guidance on when to recognize a liability for a levy imposed by a government. The interpretation clarifies that the obligating event giving rise to a liability to pay a levy is the activity described in the relevant legislation that triggers payment of the levy. The GTAA has adopted IFRIC 21 effective January 1, 2014, which did not have a material impact on the financial statements.
58 GTAA ANNUAL REPORT 2014

ACCOUNTING STANDARDS ISSUED BUT NOT YET APPLIEDa) Amendments to IAS 19, Employee Benefits:This standard was amended to clarify the application of IAS 19 to plans that require employees or third parties to contribute toward the cost of benefits. This amendment is required to be applied for years beginning on or after July 1, 2014. The adoption of the amendments to IAS 19 will not have an impact on the financial statements.
b) Amendment to IAS 24, Related Party Transactions:This standard was amended to clarify and simplify the definition of a related party and remove the requirement for government-related entities to disclose details of all transactions with government and other government-related entities. This amendment is required to be applied for years beginning on or after July 1, 2014. The GTAA does not expect any significant impact to the financial statements as a result of adopting the amendment to this standard.
c) Amendments to IFRS 7, Financial Instruments: Disclosure: This standard was amended to provide guidance on additional disclosures on transition from IAS 39 to IFRS 9. The amendments are effective on adoption of IFRS 9. The GTAA does not expect any significant impact to the financial statements as a result of adopting the amendments to this standard.
d) Amendment to IAS 1, Presentation of Financial Statements:This standard was amended to clarify guidance on materiality and aggregation, the presentation of subtotals, the structure of financial statements, and the disclosure of accounting policies. The amendment is required for years beginning on or after January 1, 2016. The GTAA has not yet assessed the impact of the amendment.
e) Amendments to IAS 16, Property, Plant and Equipment and IAS 38, Intangible Assets:The amendments to these standards clarify that the use of a revenue-based amortization method is not appropriate, and provide a rebuttable presumption for intangible assets. The amendments to the standards are effective for years beginning on or after January 1, 2016. The GTAA has not yet assessed the impact of the amendments.
f ) Amendment to IAS 19, Employee Benefits:The amendment to the standard clarifies guidance on discount rates for post-employment benefit obligations. The amendment is effective for years beginning on or after January 1, 2016. The GTAA has not yet assessed the impact of the amendment.
g) Amendment to IAS 34, Interim Financial Reporting:The amendment clarifies what is meant by the reference in the standard to information disclosed elsewhere in the interim financial report. The amendment to the standard is effective for years beginning on or after January 1, 2016. The GTAA has not yet assessed the impact of the amendment.
h) IFRS 15, Revenue from Contracts with Customers:This standard is a new standard on revenue recognition, superseding IAS 18, Revenue, IAS 11, Construction Contracts, and related interpretations. IFRS 15 specifies how and when an entity will recognize revenue as well as requiring such entities to provide users of financial statements with more informative, relevant disclosures. The standard provides a single, principles-based five-step model to be applied to all contracts with customers. It is effective for years beginning on or after January 1, 2017. The GTAA has not yet assessed the impact of the standard.
i) IFRS 9, Financial Instruments:This standard will replace the current IAS 39. The standard introduces new requirements for classifying and measuring financial assets and liabilities and a new model for general hedge accounting. The standard is effective for years beginning on or after January 1, 2018. The GTAA has not yet assessed the impact of the standard.
GTAA ANNUAL REPORT 2014 59
5. Critical Accounting Judgements and Key Sources of Estimation Uncertainty In applying the GTAA’s accounting policies, which are described in Note 3, Significant Accounting Policies, management is required to make judgements, estimates and assumptions about the carrying amount of assets and liabilities that are not readily apparent from other sources. The estimates and associated assumptions are based on historical experience and other factors that are considered to be relevant. Actual results may differ from these estimates.
Accounting estimates and underlying assumptions are reviewed on an ongoing basis. Revisions to accounting estimates are recognized in the period in which the estimate is revised if the revision affects only that period or in the period of the revision and future periods if the revision affects both current and future periods.
CRITICAL JUDGEMENTS IN APPLYING ACCOUNTING POLICIESThe following are the critical judgements that management has made in the process of applying the GTAA’s accounting policies and that have the most significant effect on the amounts recognized in the financial statements.
Property and Equipment, Intangibles and Investment PropertyCritical judgements are utilized in determining amortization rates and useful lives of these assets and whether impairments are necessary in accordance with Note 3, Significant Accounting Policies.
The fair value of investment property is determined using a valuation technique that uses assumptions, including discount rates, market conditions, rental rates and other factors.
IFRIC 12, Service Concession ArrangementsManagement has concluded that it does not fall within the scope of IFRIC 12, Service Concession Arrangements, given the current structure of the GTAA’s arrangements with Transport Canada, whereby the GTAA is not controlled by a single government.
KEY SOURCES OF ESTIMATION UNCERTAINTYThe following are the key assumptions concerning the future, and other key sources of estimation uncertainty at the end of the reporting period, that have a significant risk of causing a material adjustment to the carrying amounts of assets and liabilities within the next fiscal year.
OPA DerivativeThe fair value of the GTAA’s derivative is determined using a valuation technique that uses assumptions, including discount rates, forward gas and electricity prices, plant utilization, and other factors. These assumptions are subject to change depending on market and economic conditions and expected outcomes, including forward prices and volumes. Actual results may differ, resulting in adjustments to the fair value in the future. Additional information is disclosed in Note 18, Financial Instruments.
Post-employment Benefit ObligationsThe GTAA accounts for pension and other post-retirement benefits through the use of actuarial valuations. These valuations rely on statistical and other factors in order to anticipate future events. These factors include key actuarial assumptions, including discount rates, expected salary increases and mortality rates. Actual results may differ from results that are estimated based on assumptions. Additional information is disclosed in Note 13, Post-employment Benefit Obligations.
60 GTAA ANNUAL REPORT 2014

6. Restricted Funds Restricted funds consist of certain funds, the use of which is directed by the Master Trust Indenture (“Trust Indenture”) or Medium Term Note (“MTN”) offering documents, and which consist of the Debt Service Fund and Debt Service Reserve Fund (the “Trust Funds”) and Operations, Capital and Financing Funds. These funds are invested in cash or eligible short-term financial assets with less than one year to maturity as follows:
As at December 31 2014 2013
$ $ Debt Service Fund Principal 12,436 6,160 Interest 66,856 71,344 79,292 77,504 Debt Service Reserve Funds Revenue Bonds Series 1997–3 due December 3, 2027 36,955 36,755 Series 1999–1 due July 30, 2029 40,291 40,164 Medium Term Notes Series 2000–1 due June 12, 2030 38,774 38,575 Series 2001–1 due June 4, 2031 35,214 35,089 Series 2002–3 due October 15, 2032 38,439 38,278 Series 2004–1 due February 2, 2034 38,896 38,665 Series 2005–1 due June 1, 2015 17,620 17,534 Series 2005–3 due February 15, 2016 16,517 16,423 Series 2007–1 due June 1, 2017 21,957 21,828 Series 2008–1 due April 17, 2018 26,406 26,259 Series 2009–1 due November 20, 2019 35,856 35,672 Series 2010–1 due June 7, 2040 22,663 22,547 Series 2011–1 due February 25, 2041 32,008 31,893 Series 2011–2 due December 2, 2041 18,226 18,124 Series 2012–1 due September 21, 2022 12,174 12,144 Security for Bank Indebtedness Series 1997–A Pledge Bond – 3,849 Series 1997–B Pledge Bond 3,938 – 435,934 433,799 Operations, Capital and Financing Funds Operating and Maintenance Reserve Fund 66,032 65,364 Renewal and Replacement Reserve Fund 3,025 3,000 Airport Improvement Fee Reserve Fund 142,067 200,562 Notional Principal Fund 38,112 146,309 Debt Service Coverage Fund 40,390 137,079 289,626 552,314 804,852 1,063,617 Less: Current portion (277,091) – 527,761 1,063,617
During 2014, the GTAA revisited its intent with respect to the use of certain of its restricted funds. The GTAA has the ability and intent to use the balances held in the Debt Service Funds, the AIF Reserve Fund and the Notional Principal Fund to settle financial obligations in the next 12 months, in accordance with the provisions of the Trust Indenture and AIF agreements with participating airlines. Those financial obligations would include the repayment of debt and settlement of short-term liabilities. As a result, these amounts, together with the Debt Service Reserve Fund in respect of Series 2005–1 MTNs maturing on June 1, 2015, have been reclassified to current assets on the statement of financial position.
GTAA ANNUAL REPORT 2014 61
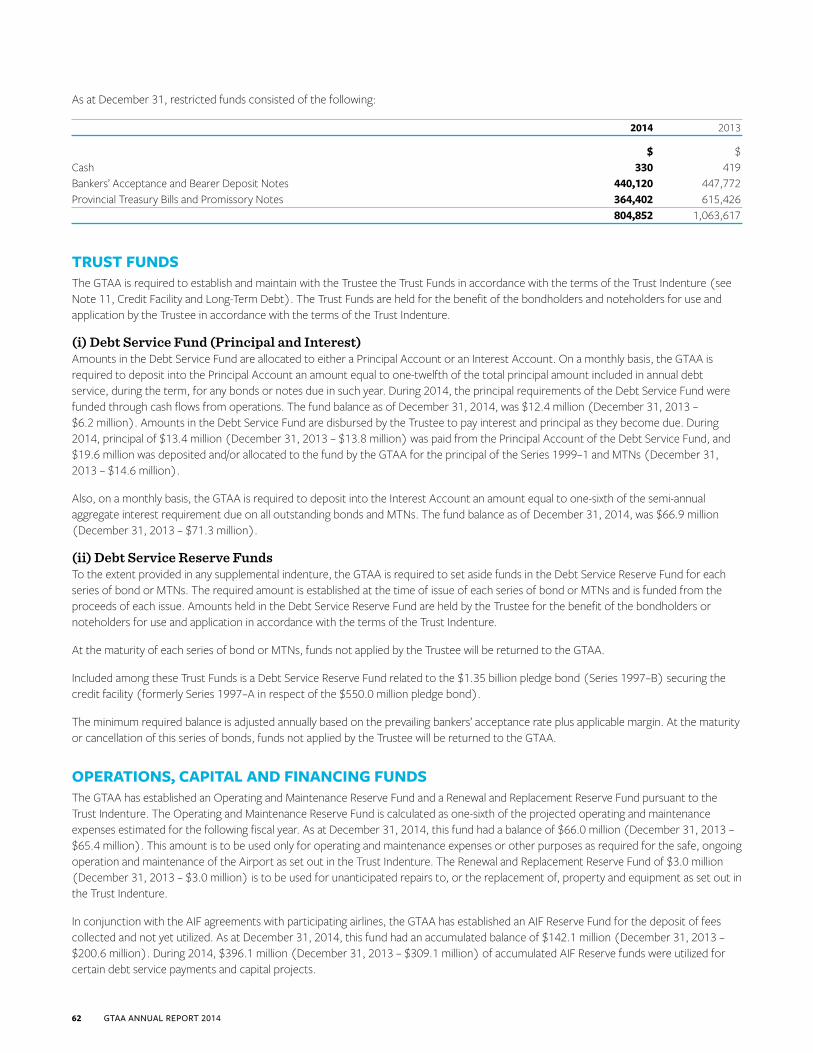
As at December 31, restricted funds consisted of the following:
2014 2013
$ $ Cash 330 419 Bankers’ Acceptance and Bearer Deposit Notes 440,120 447,772 Provincial Treasury Bills and Promissory Notes 364,402 615,426 804,852 1,063,617
TRUST FUNDSThe GTAA is required to establish and maintain with the Trustee the Trust Funds in accordance with the terms of the Trust Indenture (see Note 11, Credit Facility and Long-Term Debt). The Trust Funds are held for the benefit of the bondholders and noteholders for use and application by the Trustee in accordance with the terms of the Trust Indenture.
(i) Debt Service Fund (Principal and Interest)Amounts in the Debt Service Fund are allocated to either a Principal Account or an Interest Account. On a monthly basis, the GTAA is required to deposit into the Principal Account an amount equal to one-twelfth of the total principal amount included in annual debt service, during the term, for any bonds or notes due in such year. During 2014, the principal requirements of the Debt Service Fund were funded through cash flows from operations. The fund balance as of December 31, 2014, was $12.4 million (December 31, 2013 – $6.2 million). Amounts in the Debt Service Fund are disbursed by the Trustee to pay interest and principal as they become due. During 2014, principal of $13.4 million (December 31, 2013 – $13.8 million) was paid from the Principal Account of the Debt Service Fund, and $19.6 million was deposited and/or allocated to the fund by the GTAA for the principal of the Series 1999–1 and MTNs (December 31, 2013 – $14.6 million).
Also, on a monthly basis, the GTAA is required to deposit into the Interest Account an amount equal to one-sixth of the semi-annual aggregate interest requirement due on all outstanding bonds and MTNs. The fund balance as of December 31, 2014, was $66.9 million (December 31, 2013 – $71.3 million).
(ii) Debt Service Reserve FundsTo the extent provided in any supplemental indenture, the GTAA is required to set aside funds in the Debt Service Reserve Fund for each series of bond or MTNs. The required amount is established at the time of issue of each series of bond or MTNs and is funded from the proceeds of each issue. Amounts held in the Debt Service Reserve Fund are held by the Trustee for the benefit of the bondholders or noteholders for use and application in accordance with the terms of the Trust Indenture.
At the maturity of each series of bond or MTNs, funds not applied by the Trustee will be returned to the GTAA.
Included among these Trust Funds is a Debt Service Reserve Fund related to the $1.35 billion pledge bond (Series 1997–B) securing the credit facility (formerly Series 1997–A in respect of the $550.0 million pledge bond).
The minimum required balance is adjusted annually based on the prevailing bankers’ acceptance rate plus applicable margin. At the maturity or cancellation of this series of bonds, funds not applied by the Trustee will be returned to the GTAA.
OPERATIONS, CAPITAL AND FINANCING FUNDSThe GTAA has established an Operating and Maintenance Reserve Fund and a Renewal and Replacement Reserve Fund pursuant to the Trust Indenture. The Operating and Maintenance Reserve Fund is calculated as one-sixth of the projected operating and maintenance expenses estimated for the following fiscal year. As at December 31, 2014, this fund had a balance of $66.0 million (December 31, 2013 – $65.4 million). This amount is to be used only for operating and maintenance expenses or other purposes as required for the safe, ongoing operation and maintenance of the Airport as set out in the Trust Indenture. The Renewal and Replacement Reserve Fund of $3.0 million (December 31, 2013 – $3.0 million) is to be used for unanticipated repairs to, or the replacement of, property and equipment as set out in the Trust Indenture.
In conjunction with the AIF agreements with participating airlines, the GTAA has established an AIF Reserve Fund for the deposit of fees collected and not yet utilized. As at December 31, 2014, this fund had an accumulated balance of $142.1 million (December 31, 2013 – $200.6 million). During 2014, $396.1 million (December 31, 2013 – $309.1 million) of accumulated AIF Reserve funds were utilized for certain debt service payments and capital projects.
62 GTAA ANNUAL REPORT 2014
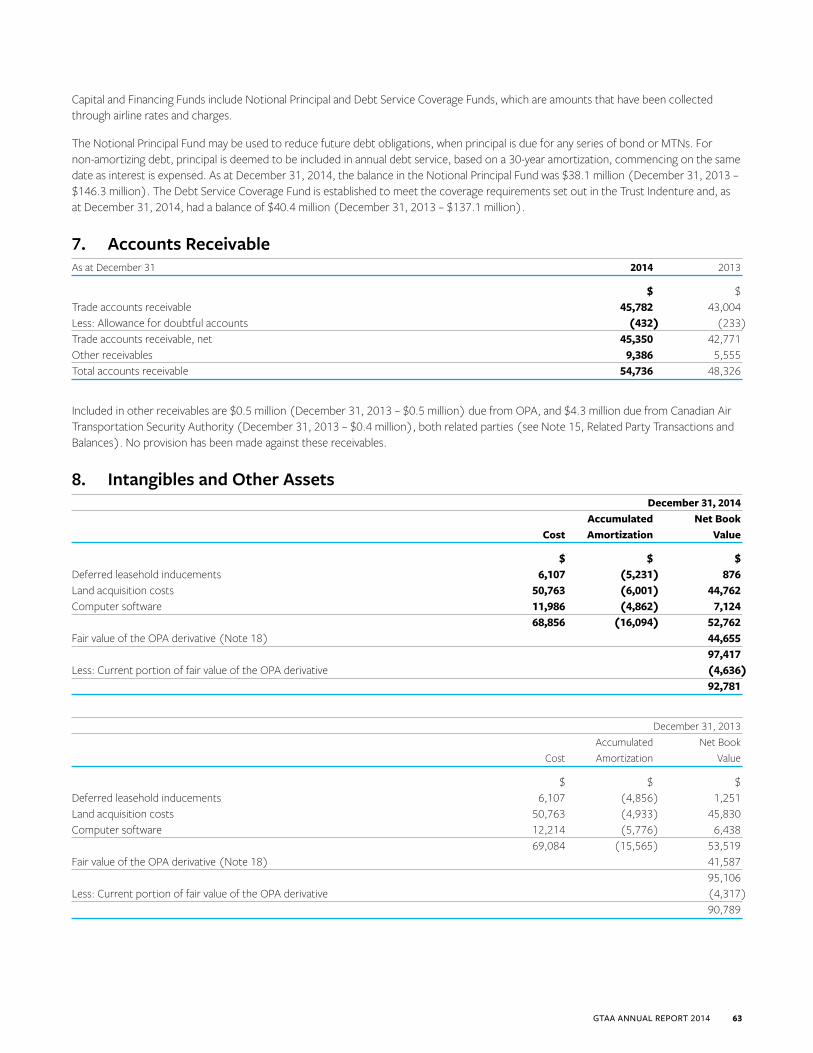
Capital and Financing Funds include Notional Principal and Debt Service Coverage Funds, which are amounts that have been collected through airline rates and charges.
The Notional Principal Fund may be used to reduce future debt obligations, when principal is due for any series of bond or MTNs. For non-amortizing debt, principal is deemed to be included in annual debt service, based on a 30-year amortization, commencing on the same date as interest is expensed. As at December 31, 2014, the balance in the Notional Principal Fund was $38.1 million (December 31, 2013 – $146.3 million). The Debt Service Coverage Fund is established to meet the coverage requirements set out in the Trust Indenture and, as at December 31, 2014, had a balance of $40.4 million (December 31, 2013 – $137.1 million).
7. Accounts ReceivableAs at December 31 2014 2013
$ $ Trade accounts receivable 45,782 43,004 Less: Allowance for doubtful accounts (432) (233)Trade accounts receivable, net 45,350 42,771 Other receivables 9,386 5,555 Total accounts receivable 54,736 48,326
Included in other receivables are $0.5 million (December 31, 2013 – $0.5 million) due from OPA, and $4.3 million due from Canadian Air Transportation Security Authority (December 31, 2013 – $0.4 million), both related parties (see Note 15, Related Party Transactions and Balances). No provision has been made against these receivables.
8. Intangibles and Other Assets December 31, 2014 Accumulated Net Book Cost Amortization Value
$ $ $ Deferred leasehold inducements 6,107 (5,231) 876 Land acquisition costs 50,763 (6,001) 44,762 Computer software 11,986 (4,862) 7,124 68,856 (16,094) 52,762 Fair value of the OPA derivative (Note 18) 44,655 97,417 Less: Current portion of fair value of the OPA derivative (4,636) 92,781
December 31, 2013 Accumulated Net Book Cost Amortization Value
$ $ $ Deferred leasehold inducements 6,107 (4,856) 1,251 Land acquisition costs 50,763 (4,933) 45,830 Computer software 12,214 (5,776) 6,438 69,084 (15,565) 53,519 Fair value of the OPA derivative (Note 18) 41,587 95,106 Less: Current portion of fair value of the OPA derivative (4,317) 90,789
GTAA ANNUAL REPORT 2014 63
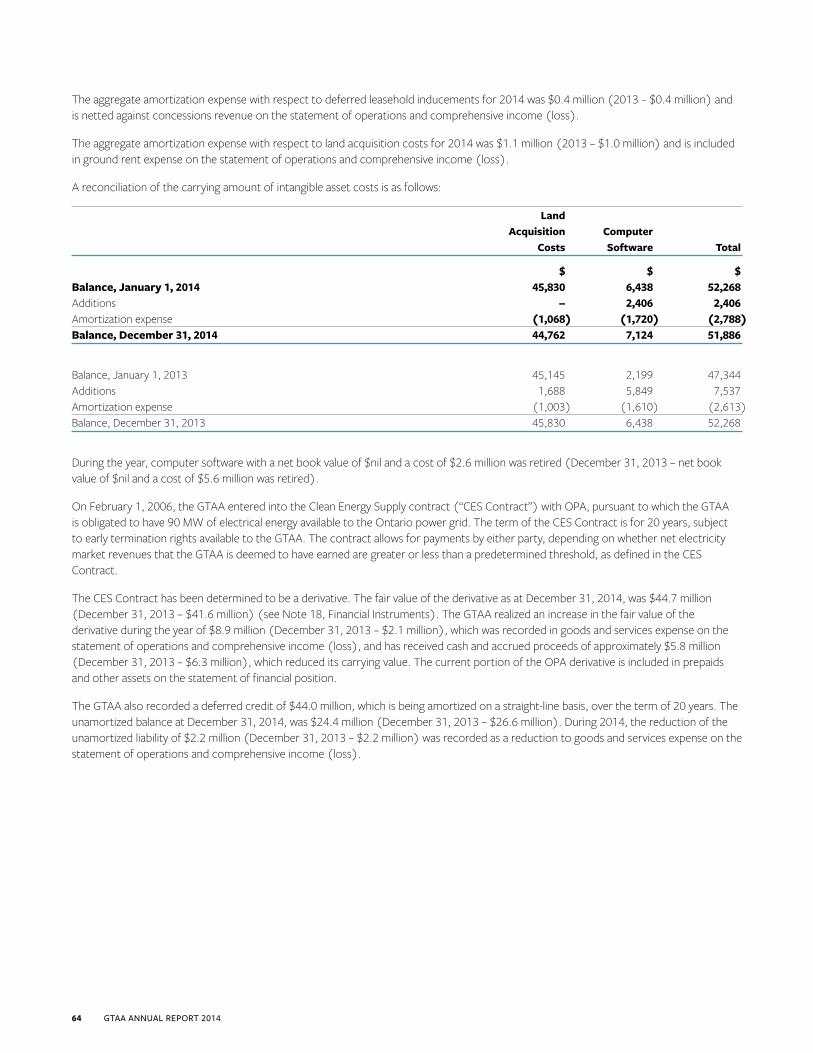
The aggregate amortization expense with respect to deferred leasehold inducements for 2014 was $0.4 million (2013 – $0.4 million) and is netted against concessions revenue on the statement of operations and comprehensive income (loss).
The aggregate amortization expense with respect to land acquisition costs for 2014 was $1.1 million (2013 – $1.0 million) and is included in ground rent expense on the statement of operations and comprehensive income (loss).
A reconciliation of the carrying amount of intangible asset costs is as follows:
Land Acquisition Computer Costs Software Total
$ $ $ Balance, January 1, 2014 45,830 6,438 52,268 Additions – 2,406 2,406 Amortization expense (1,068) (1,720) (2,788)Balance, December 31, 2014 44,762 7,124 51,886
Balance, January 1, 2013 45,145 2,199 47,344 Additions 1,688 5,849 7,537 Amortization expense (1,003) (1,610) (2,613)Balance, December 31, 2013 45,830 6,438 52,268
During the year, computer software with a net book value of $nil and a cost of $2.6 million was retired (December 31, 2013 – net book value of $nil and a cost of $5.6 million was retired).
On February 1, 2006, the GTAA entered into the Clean Energy Supply contract (“CES Contract”) with OPA, pursuant to which the GTAA is obligated to have 90 MW of electrical energy available to the Ontario power grid. The term of the CES Contract is for 20 years, subject to early termination rights available to the GTAA. The contract allows for payments by either party, depending on whether net electricity market revenues that the GTAA is deemed to have earned are greater or less than a predetermined threshold, as defined in the CES Contract.
The CES Contract has been determined to be a derivative. The fair value of the derivative as at December 31, 2014, was $44.7 million (December 31, 2013 – $41.6 million) (see Note 18, Financial Instruments). The GTAA realized an increase in the fair value of the derivative during the year of $8.9 million (December 31, 2013 – $2.1 million), which was recorded in goods and services expense on the statement of operations and comprehensive income (loss), and has received cash and accrued proceeds of approximately $5.8 million (December 31, 2013 – $6.3 million), which reduced its carrying value. The current portion of the OPA derivative is included in prepaids and other assets on the statement of financial position.
The GTAA also recorded a deferred credit of $44.0 million, which is being amortized on a straight-line basis, over the term of 20 years. The unamortized balance at December 31, 2014, was $24.4 million (December 31, 2013 – $26.6 million). During 2014, the reduction of the unamortized liability of $2.2 million (December 31, 2013 – $2.2 million) was recorded as a reduction to goods and services expense on the statement of operations and comprehensive income (loss).
64 GTAA ANNUAL REPORT 2014
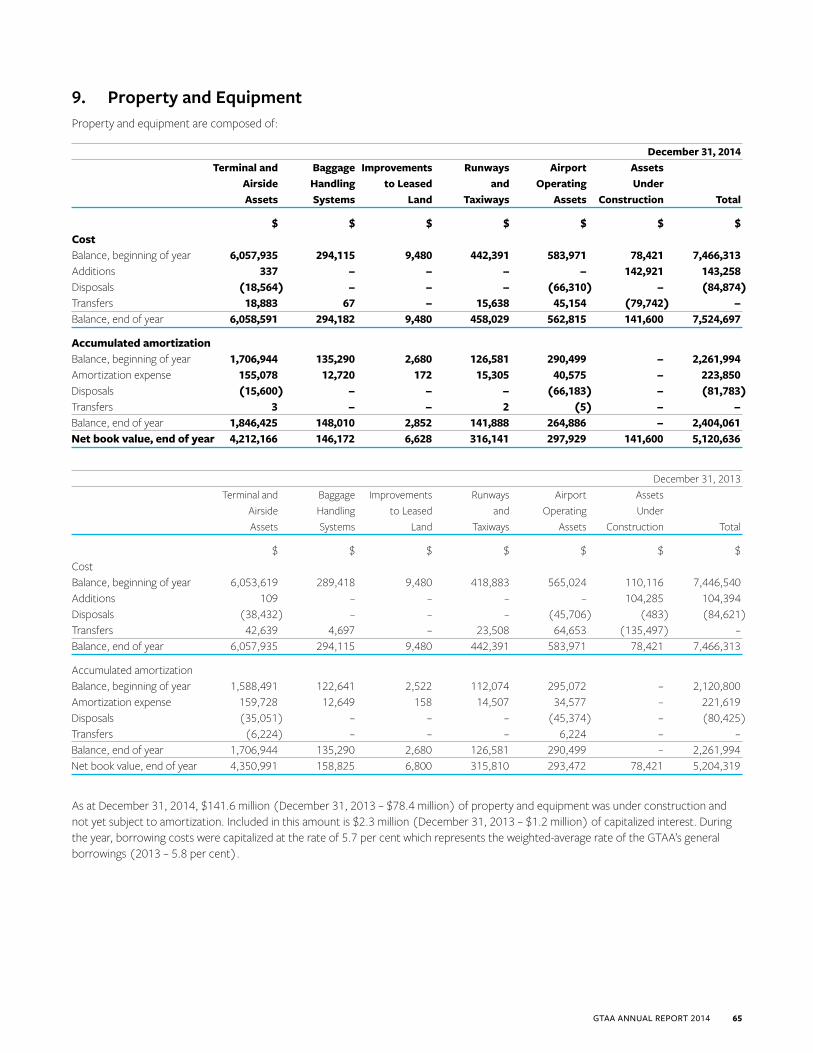
9. Property and Equipment Property and equipment are composed of:
December 31, 2014 Terminal and Baggage Improvements Runways Airport Assets Airside Handling to Leased and Operating Under Assets Systems Land Taxiways Assets Construction Total
$ $ $ $ $ $ $ CostBalance, beginning of year 6,057,935 294,115 9,480 442,391 583,971 78,421 7,466,313 Additions 337 – – – – 142,921 143,258 Disposals (18,564) – – – (66,310) – (84,874)Transfers 18,883 67 – 15,638 45,154 (79,742) – Balance, end of year 6,058,591 294,182 9,480 458,029 562,815 141,600 7,524,697
Accumulated amortizationBalance, beginning of year 1,706,944 135,290 2,680 126,581 290,499 – 2,261,994 Amortization expense 155,078 12,720 172 15,305 40,575 – 223,850 Disposals (15,600) – – – (66,183) – (81,783)Transfers 3 – – 2 (5) – – Balance, end of year 1,846,425 148,010 2,852 141,888 264,886 – 2,404,061 Net book value, end of year 4,212,166 146,172 6,628 316,141 297,929 141,600 5,120,636
December 31, 2013 Terminal and Baggage Improvements Runways Airport Assets Airside Handling to Leased and Operating Under Assets Systems Land Taxiways Assets Construction Total
$ $ $ $ $ $ $ CostBalance, beginning of year 6,053,619 289,418 9,480 418,883 565,024 110,116 7,446,540 Additions 109 – – – – 104,285 104,394 Disposals (38,432) – – – (45,706) (483) (84,621)Transfers 42,639 4,697 – 23,508 64,653 (135,497) – Balance, end of year 6,057,935 294,115 9,480 442,391 583,971 78,421 7,466,313
Accumulated amortization Balance, beginning of year 1,588,491 122,641 2,522 112,074 295,072 – 2,120,800 Amortization expense 159,728 12,649 158 14,507 34,577 – 221,619 Disposals (35,051) – – – (45,374) – (80,425)Transfers (6,224) – – – 6,224 – – Balance, end of year 1,706,944 135,290 2,680 126,581 290,499 – 2,261,994 Net book value, end of year 4,350,991 158,825 6,800 315,810 293,472 78,421 5,204,319
As at December 31, 2014, $141.6 million (December 31, 2013 – $78.4 million) of property and equipment was under construction and not yet subject to amortization. Included in this amount is $2.3 million (December 31, 2013 – $1.2 million) of capitalized interest. During the year, borrowing costs were capitalized at the rate of 5.7 per cent which represents the weighted-average rate of the GTAA’s general borrowings (2013 – 5.8 per cent).
GTAA ANNUAL REPORT 2014 65
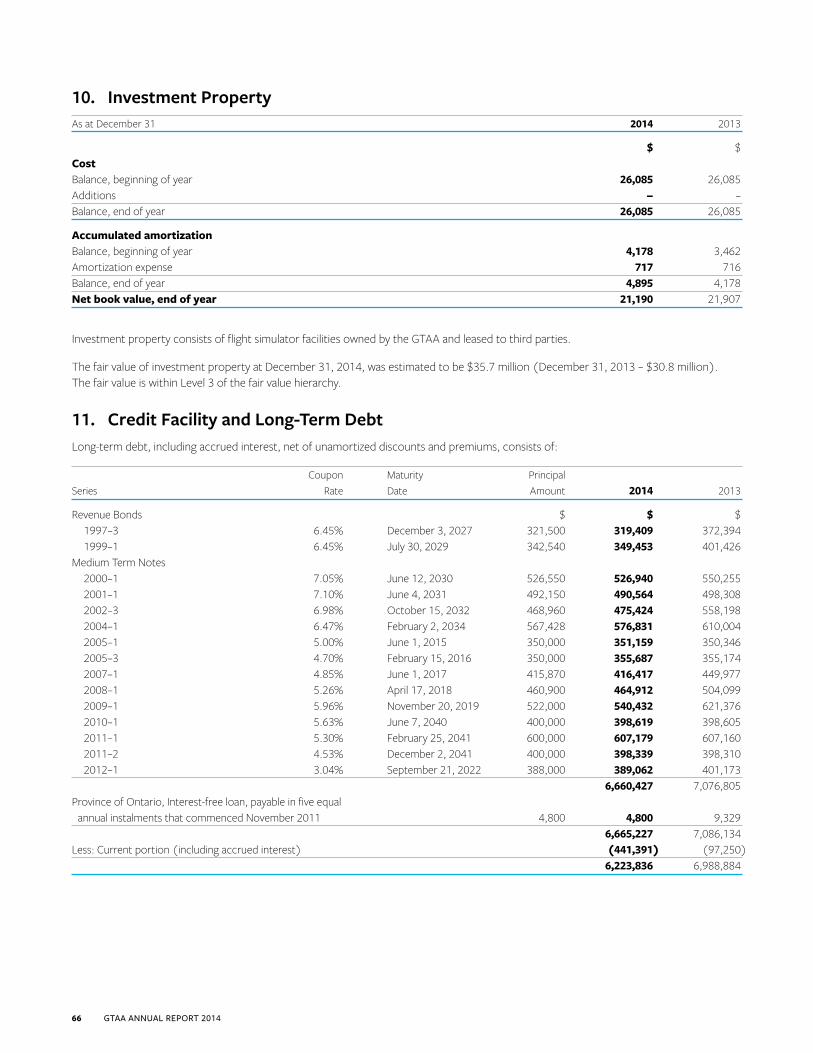
10. Investment PropertyAs at December 31 2014 2013
$ $ CostBalance, beginning of year 26,085 26,085 Additions – – Balance, end of year 26,085 26,085
Accumulated amortization Balance, beginning of year 4,178 3,462 Amortization expense 717 716 Balance, end of year 4,895 4,178 Net book value, end of year 21,190 21,907
Investment property consists of flight simulator facilities owned by the GTAA and leased to third parties.
The fair value of investment property at December 31, 2014, was estimated to be $35.7 million (December 31, 2013 – $30.8 million). The fair value is within Level 3 of the fair value hierarchy.
11. Credit Facility and Long-Term DebtLong-term debt, including accrued interest, net of unamortized discounts and premiums, consists of:
Coupon Maturity Principal Series Rate Date Amount 2014 2013
Revenue Bonds $ $ $ 1997–3 6.45% December 3, 2027 321,500 319,409 372,394 1999–1 6.45% July 30, 2029 342,540 349,453 401,426 Medium Term Notes 2000–1 7.05% June 12, 2030 526,550 526,940 550,255 2001–1 7.10% June 4, 2031 492,150 490,564 498,308 2002–3 6.98% October 15, 2032 468,960 475,424 558,198 2004–1 6.47% February 2, 2034 567,428 576,831 610,004 2005–1 5.00% June 1, 2015 350,000 351,159 350,346 2005–3 4.70% February 15, 2016 350,000 355,687 355,174 2007–1 4.85% June 1, 2017 415,870 416,417 449,977 2008–1 5.26% April 17, 2018 460,900 464,912 504,099 2009–1 5.96% November 20, 2019 522,000 540,432 621,376 2010–1 5.63% June 7, 2040 400,000 398,619 398,605 2011–1 5.30% February 25, 2041 600,000 607,179 607,160 2011–2 4.53% December 2, 2041 400,000 398,339 398,310 2012–1 3.04% September 21, 2022 388,000 389,062 401,173 6,660,427 7,076,805 Province of Ontario, Interest-free loan, payable in five equal annual instalments that commenced November 2011 4,800 4,800 9,329 6,665,227 7,086,134 Less: Current portion (including accrued interest) (441,391) (97,250) 6,223,836 6,988,884
66 GTAA ANNUAL REPORT 2014
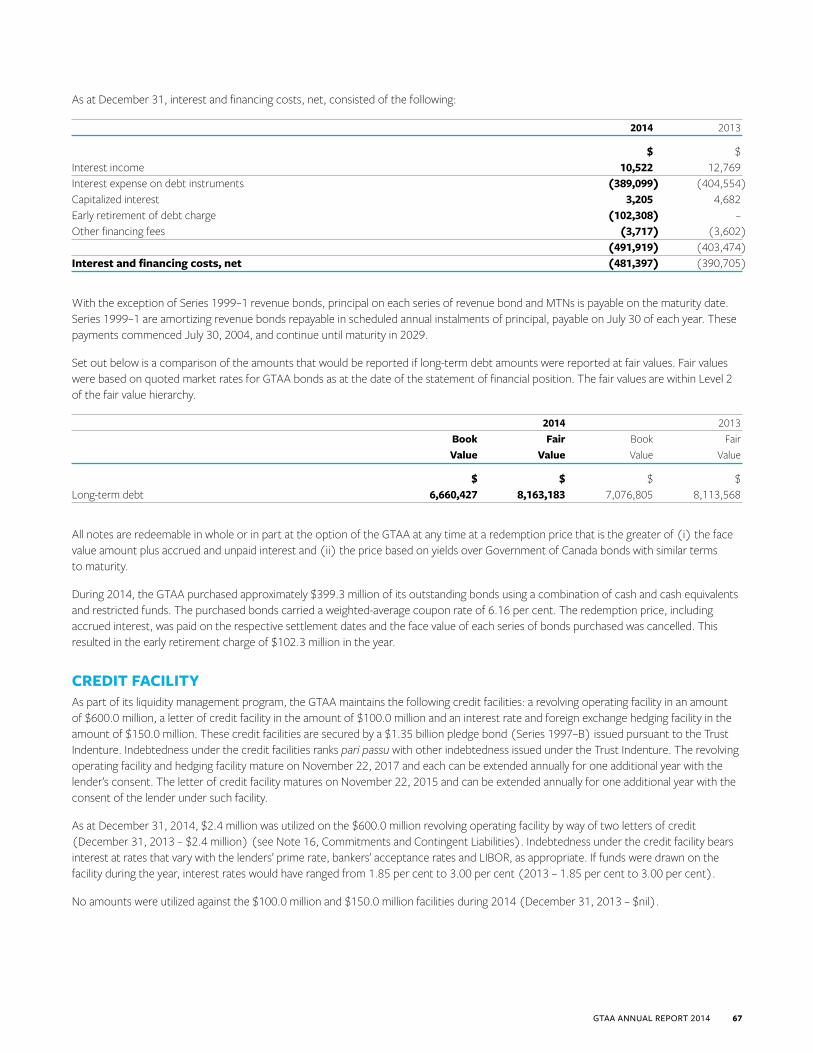
As at December 31, interest and financing costs, net, consisted of the following:
2014 2013
$ $ Interest income 10,522 12,769 Interest expense on debt instruments (389,099) (404,554)Capitalized interest 3,205 4,682 Early retirement of debt charge (102,308) – Other financing fees (3,717) (3,602) (491,919) (403,474)Interest and financing costs, net (481,397) (390,705)
With the exception of Series 1999–1 revenue bonds, principal on each series of revenue bond and MTNs is payable on the maturity date. Series 1999–1 are amortizing revenue bonds repayable in scheduled annual instalments of principal, payable on July 30 of each year. These payments commenced July 30, 2004, and continue until maturity in 2029.
Set out below is a comparison of the amounts that would be reported if long-term debt amounts were reported at fair values. Fair values were based on quoted market rates for GTAA bonds as at the date of the statement of financial position. The fair values are within Level 2 of the fair value hierarchy.
2014 2013 Book Fair Book Fair Value Value Value Value
$ $ $ $ Long-term debt 6,660,427 8,163,183 7,076,805 8,113,568
All notes are redeemable in whole or in part at the option of the GTAA at any time at a redemption price that is the greater of (i) the face value amount plus accrued and unpaid interest and (ii) the price based on yields over Government of Canada bonds with similar terms to maturity.
During 2014, the GTAA purchased approximately $399.3 million of its outstanding bonds using a combination of cash and cash equivalents and restricted funds. The purchased bonds carried a weighted-average coupon rate of 6.16 per cent. The redemption price, including accrued interest, was paid on the respective settlement dates and the face value of each series of bonds purchased was cancelled. This resulted in the early retirement charge of $102.3 million in the year.
CREDIT FACILITYAs part of its liquidity management program, the GTAA maintains the following credit facilities: a revolving operating facility in an amount of $600.0 million, a letter of credit facility in the amount of $100.0 million and an interest rate and foreign exchange hedging facility in the amount of $150.0 million. These credit facilities are secured by a $1.35 billion pledge bond (Series 1997–B) issued pursuant to the Trust Indenture. Indebtedness under the credit facilities ranks pari passu with other indebtedness issued under the Trust Indenture. The revolving operating facility and hedging facility mature on November 22, 2017 and each can be extended annually for one additional year with the lender’s consent. The letter of credit facility matures on November 22, 2015 and can be extended annually for one additional year with the consent of the lender under such facility.
As at December 31, 2014, $2.4 million was utilized on the $600.0 million revolving operating facility by way of two letters of credit (December 31, 2013 – $2.4 million) (see Note 16, Commitments and Contingent Liabilities). Indebtedness under the credit facility bears interest at rates that vary with the lenders’ prime rate, bankers’ acceptance rates and LIBOR, as appropriate. If funds were drawn on the facility during the year, interest rates would have ranged from 1.85 per cent to 3.00 per cent (2013 – 1.85 per cent to 3.00 per cent).
No amounts were utilized against the $100.0 million and $150.0 million facilities during 2014 (December 31, 2013 – $nil).
GTAA ANNUAL REPORT 2014 67
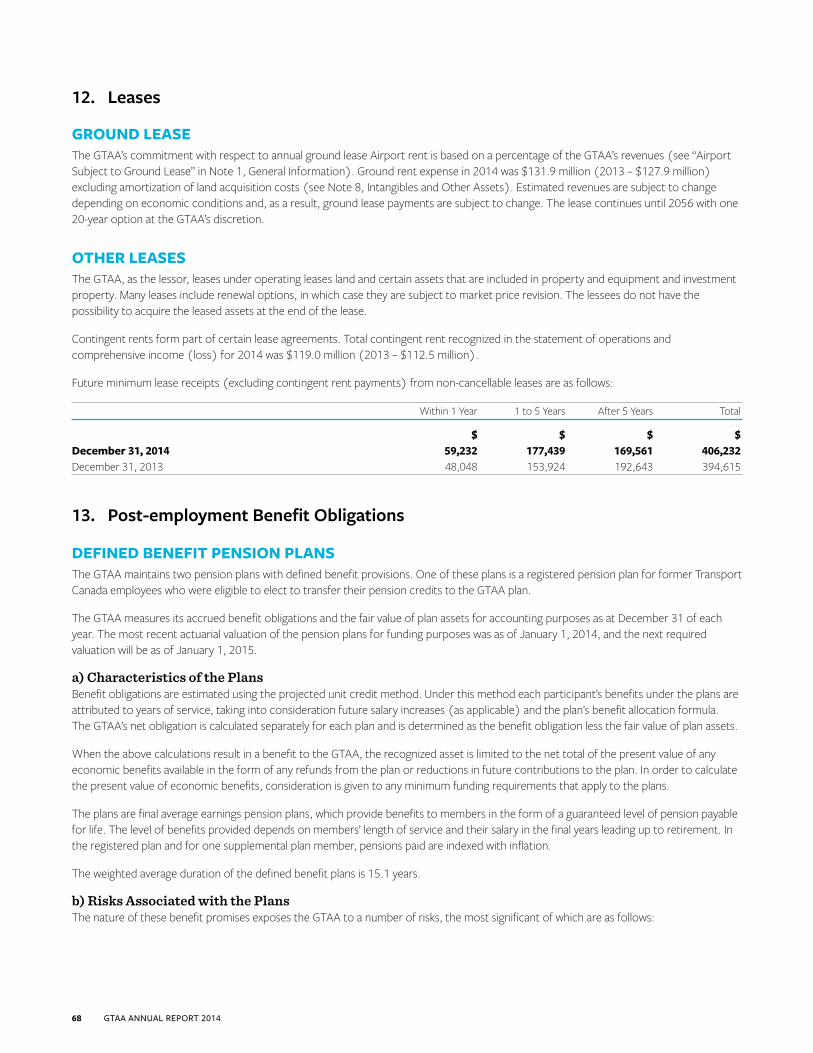
12. Leases
GROUND LEASEThe GTAA’s commitment with respect to annual ground lease Airport rent is based on a percentage of the GTAA’s revenues (see “Airport Subject to Ground Lease” in Note 1, General Information). Ground rent expense in 2014 was $131.9 million (2013 – $127.9 million) excluding amortization of land acquisition costs (see Note 8, Intangibles and Other Assets). Estimated revenues are subject to change depending on economic conditions and, as a result, ground lease payments are subject to change. The lease continues until 2056 with one 20-year option at the GTAA’s discretion.
OTHER LEASESThe GTAA, as the lessor, leases under operating leases land and certain assets that are included in property and equipment and investment property. Many leases include renewal options, in which case they are subject to market price revision. The lessees do not have the possibility to acquire the leased assets at the end of the lease.
Contingent rents form part of certain lease agreements. Total contingent rent recognized in the statement of operations and comprehensive income (loss) for 2014 was $119.0 million (2013 – $112.5 million).
Future minimum lease receipts (excluding contingent rent payments) from non-cancellable leases are as follows:
Within 1 Year 1 to 5 Years After 5 Years Total
$ $ $ $ December 31, 2014 59,232 177,439 169,561 406,232 December 31, 2013 48,048 153,924 192,643 394,615
13. Post-employment Benefit Obligations
DEFINED BENEFIT PENSION PLANSThe GTAA maintains two pension plans with defined benefit provisions. One of these plans is a registered pension plan for former Transport Canada employees who were eligible to elect to transfer their pension credits to the GTAA plan.
The GTAA measures its accrued benefit obligations and the fair value of plan assets for accounting purposes as at December 31 of each year. The most recent actuarial valuation of the pension plans for funding purposes was as of January 1, 2014, and the next required valuation will be as of January 1, 2015.
a) Characteristics of the PlansBenefit obligations are estimated using the projected unit credit method. Under this method each participant’s benefits under the plans are attributed to years of service, taking into consideration future salary increases (as applicable) and the plan’s benefit allocation formula. The GTAA’s net obligation is calculated separately for each plan and is determined as the benefit obligation less the fair value of plan assets.
When the above calculations result in a benefit to the GTAA, the recognized asset is limited to the net total of the present value of any economic benefits available in the form of any refunds from the plan or reductions in future contributions to the plan. In order to calculate the present value of economic benefits, consideration is given to any minimum funding requirements that apply to the plans.
The plans are final average earnings pension plans, which provide benefits to members in the form of a guaranteed level of pension payable for life. The level of benefits provided depends on members’ length of service and their salary in the final years leading up to retirement. In the registered plan and for one supplemental plan member, pensions paid are indexed with inflation.
The weighted average duration of the defined benefit plans is 15.1 years.
b) Risks Associated with the PlansThe nature of these benefit promises exposes the GTAA to a number of risks, the most significant of which are as follows:
68 GTAA ANNUAL REPORT 2014
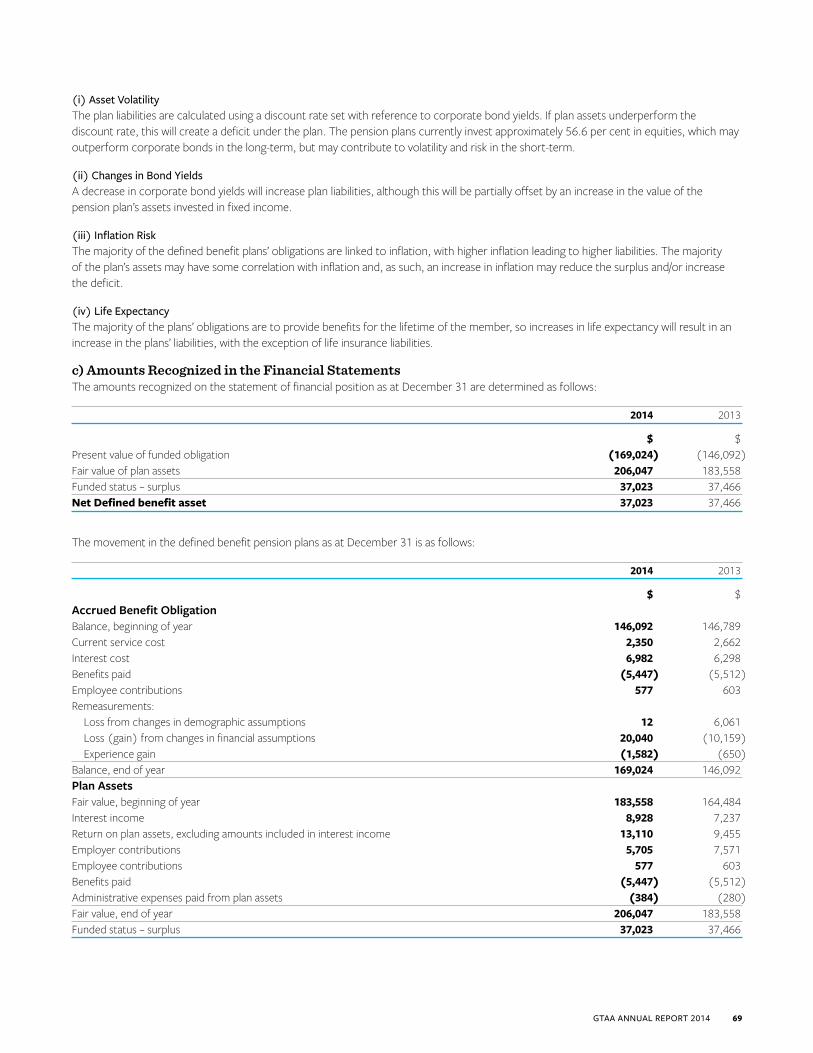
(i) Asset VolatilityThe plan liabilities are calculated using a discount rate set with reference to corporate bond yields. If plan assets underperform the discount rate, this will create a deficit under the plan. The pension plans currently invest approximately 56.6 per cent in equities, which may outperform corporate bonds in the long-term, but may contribute to volatility and risk in the short-term.
(ii) Changes in Bond YieldsA decrease in corporate bond yields will increase plan liabilities, although this will be partially offset by an increase in the value of the pension plan’s assets invested in fixed income.
(iii) Inflation RiskThe majority of the defined benefit plans’ obligations are linked to inflation, with higher inflation leading to higher liabilities. The majority of the plan’s assets may have some correlation with inflation and, as such, an increase in inflation may reduce the surplus and/or increase the deficit.
(iv) Life ExpectancyThe majority of the plans’ obligations are to provide benefits for the lifetime of the member, so increases in life expectancy will result in an increase in the plans’ liabilities, with the exception of life insurance liabilities.
c) Amounts Recognized in the Financial StatementsThe amounts recognized on the statement of financial position as at December 31 are determined as follows:
2014 2013
$ $ Present value of funded obligation (169,024) (146,092)Fair value of plan assets 206,047 183,558 Funded status – surplus 37,023 37,466 Net Defined benefit asset 37,023 37,466
The movement in the defined benefit pension plans as at December 31 is as follows:
2014 2013
$ $Accrued Benefit ObligationBalance, beginning of year 146,092 146,789 Current service cost 2,350 2,662 Interest cost 6,982 6,298 Benefits paid (5,447) (5,512)Employee contributions 577 603 Remeasurements: Loss from changes in demographic assumptions 12 6,061 Loss (gain) from changes in financial assumptions 20,040 (10,159) Experience gain (1,582) (650)Balance, end of year 169,024 146,092 Plan AssetsFair value, beginning of year 183,558 164,484 Interest income 8,928 7,237 Return on plan assets, excluding amounts included in interest income 13,110 9,455 Employer contributions 5,705 7,571 Employee contributions 577 603 Benefits paid (5,447) (5,512)Administrative expenses paid from plan assets (384) (280)Fair value, end of year 206,047 183,558 Funded status – surplus 37,023 37,466
GTAA ANNUAL REPORT 2014 69
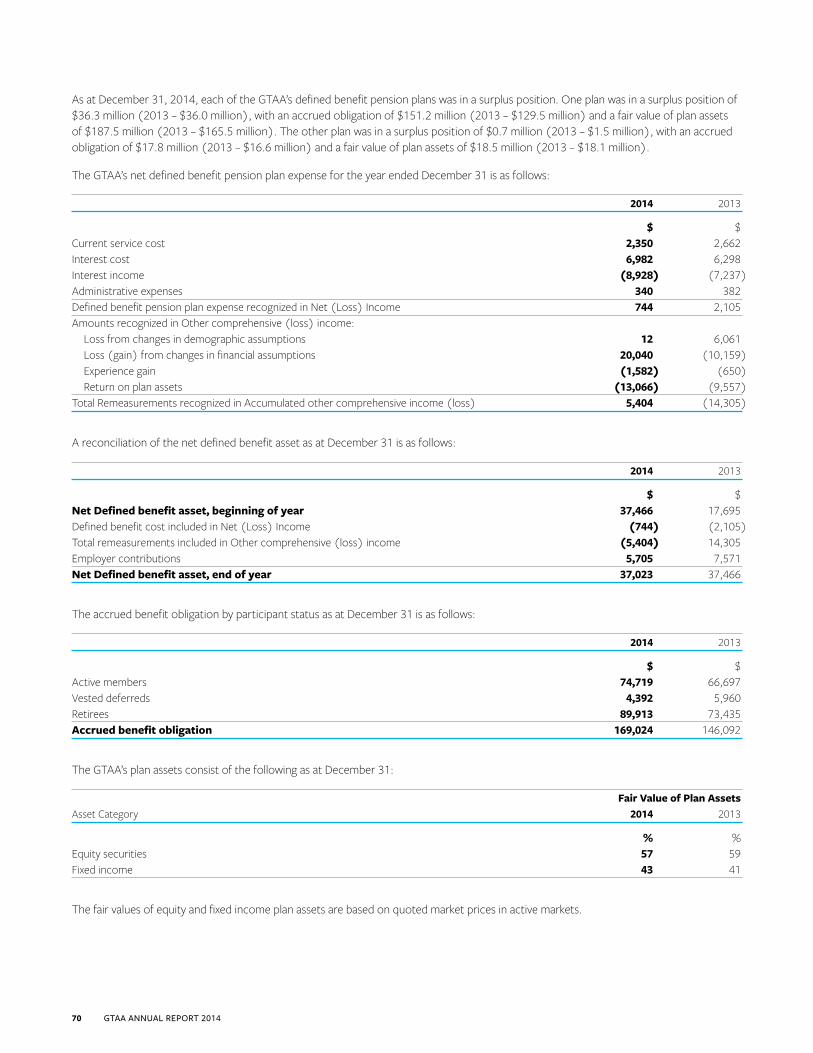
As at December 31, 2014, each of the GTAA’s defined benefit pension plans was in a surplus position. One plan was in a surplus position of $36.3 million (2013 – $36.0 million), with an accrued obligation of $151.2 million (2013 – $129.5 million) and a fair value of plan assets of $187.5 million (2013 – $165.5 million). The other plan was in a surplus position of $0.7 million (2013 – $1.5 million), with an accrued obligation of $17.8 million (2013 – $16.6 million) and a fair value of plan assets of $18.5 million (2013 – $18.1 million).
The GTAA’s net defined benefit pension plan expense for the year ended December 31 is as follows:
2014 2013
$ $ Current service cost 2,350 2,662 Interest cost 6,982 6,298 Interest income (8,928) (7,237)Administrative expenses 340 382 Defined benefit pension plan expense recognized in Net (Loss) Income 744 2,105 Amounts recognized in Other comprehensive (loss) income: Loss from changes in demographic assumptions 12 6,061 Loss (gain) from changes in financial assumptions 20,040 (10,159) Experience gain (1,582) (650) Return on plan assets (13,066) (9,557)Total Remeasurements recognized in Accumulated other comprehensive income (loss) 5,404 (14,305)
A reconciliation of the net defined benefit asset as at December 31 is as follows:
2014 2013
$ $ Net Defined benefit asset, beginning of year 37,466 17,695 Defined benefit cost included in Net (Loss) Income (744) (2,105)Total remeasurements included in Other comprehensive (loss) income (5,404) 14,305 Employer contributions 5,705 7,571 Net Defined benefit asset, end of year 37,023 37,466
The accrued benefit obligation by participant status as at December 31 is as follows:
2014 2013
$ $ Active members 74,719 66,697 Vested deferreds 4,392 5,960 Retirees 89,913 73,435 Accrued benefit obligation 169,024 146,092
The GTAA’s plan assets consist of the following as at December 31:
Fair Value of Plan AssetsAsset Category 2014 2013
% % Equity securities 57 59 Fixed income 43 41
The fair values of equity and fixed income plan assets are based on quoted market prices in active markets.
70 GTAA ANNUAL REPORT 2014
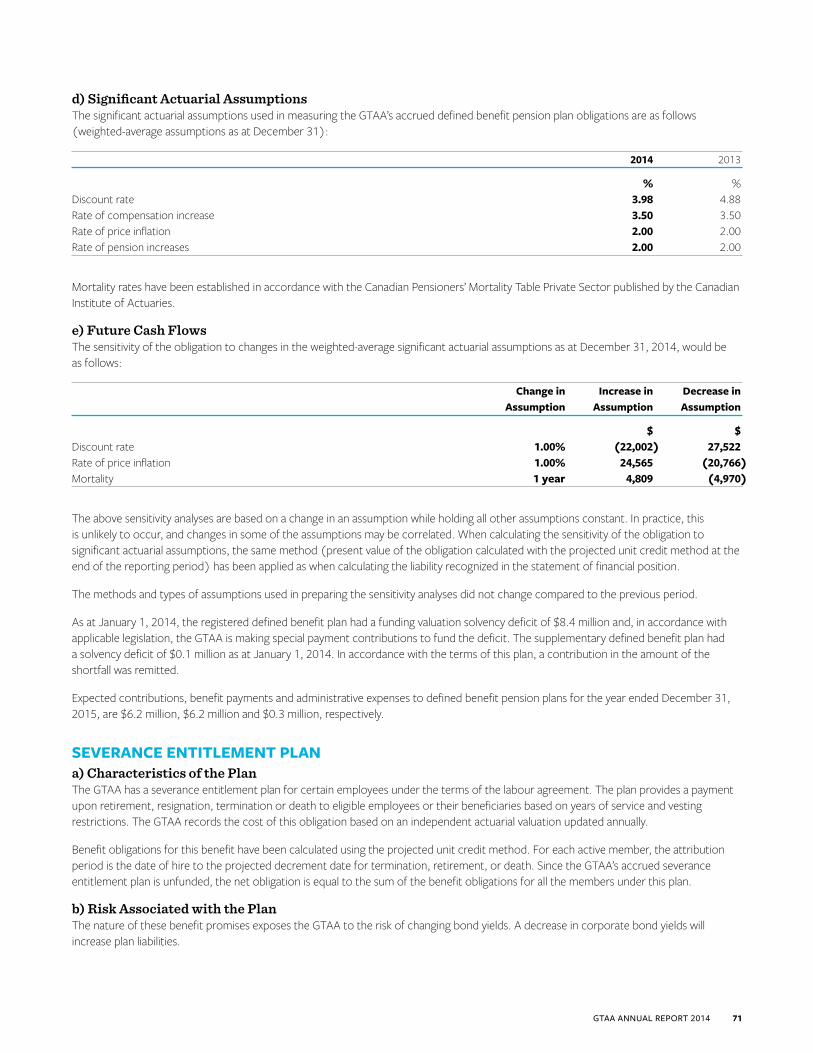
d) Significant Actuarial AssumptionsThe significant actuarial assumptions used in measuring the GTAA’s accrued defined benefit pension plan obligations are as follows (weighted-average assumptions as at December 31):
2014 2013
% % Discount rate 3.98 4.88 Rate of compensation increase 3.50 3.50 Rate of price inflation 2.00 2.00 Rate of pension increases 2.00 2.00
Mortality rates have been established in accordance with the Canadian Pensioners’ Mortality Table Private Sector published by the Canadian Institute of Actuaries.
e) Future Cash FlowsThe sensitivity of the obligation to changes in the weighted-average significant actuarial assumptions as at December 31, 2014, would be as follows:
Change in Increase in Decrease in Assumption Assumption Assumption
$ $ Discount rate 1.00% (22,002) 27,522 Rate of price inflation 1.00% 24,565 (20,766)Mortality 1 year 4,809 (4,970)
The above sensitivity analyses are based on a change in an assumption while holding all other assumptions constant. In practice, this is unlikely to occur, and changes in some of the assumptions may be correlated. When calculating the sensitivity of the obligation to significant actuarial assumptions, the same method (present value of the obligation calculated with the projected unit credit method at the end of the reporting period) has been applied as when calculating the liability recognized in the statement of financial position.
The methods and types of assumptions used in preparing the sensitivity analyses did not change compared to the previous period.
As at January 1, 2014, the registered defined benefit plan had a funding valuation solvency deficit of $8.4 million and, in accordance with applicable legislation, the GTAA is making special payment contributions to fund the deficit. The supplementary defined benefit plan had a solvency deficit of $0.1 million as at January 1, 2014. In accordance with the terms of this plan, a contribution in the amount of the shortfall was remitted.
Expected contributions, benefit payments and administrative expenses to defined benefit pension plans for the year ended December 31, 2015, are $6.2 million, $6.2 million and $0.3 million, respectively.
SEVERANCE ENTITLEMENT PLANa) Characteristics of the PlanThe GTAA has a severance entitlement plan for certain employees under the terms of the labour agreement. The plan provides a payment upon retirement, resignation, termination or death to eligible employees or their beneficiaries based on years of service and vesting restrictions. The GTAA records the cost of this obligation based on an independent actuarial valuation updated annually.
Benefit obligations for this benefit have been calculated using the projected unit credit method. For each active member, the attribution period is the date of hire to the projected decrement date for termination, retirement, or death. Since the GTAA’s accrued severance entitlement plan is unfunded, the net obligation is equal to the sum of the benefit obligations for all the members under this plan.
b) Risk Associated with the PlanThe nature of these benefit promises exposes the GTAA to the risk of changing bond yields. A decrease in corporate bond yields will increase plan liabilities.
GTAA ANNUAL REPORT 2014 71
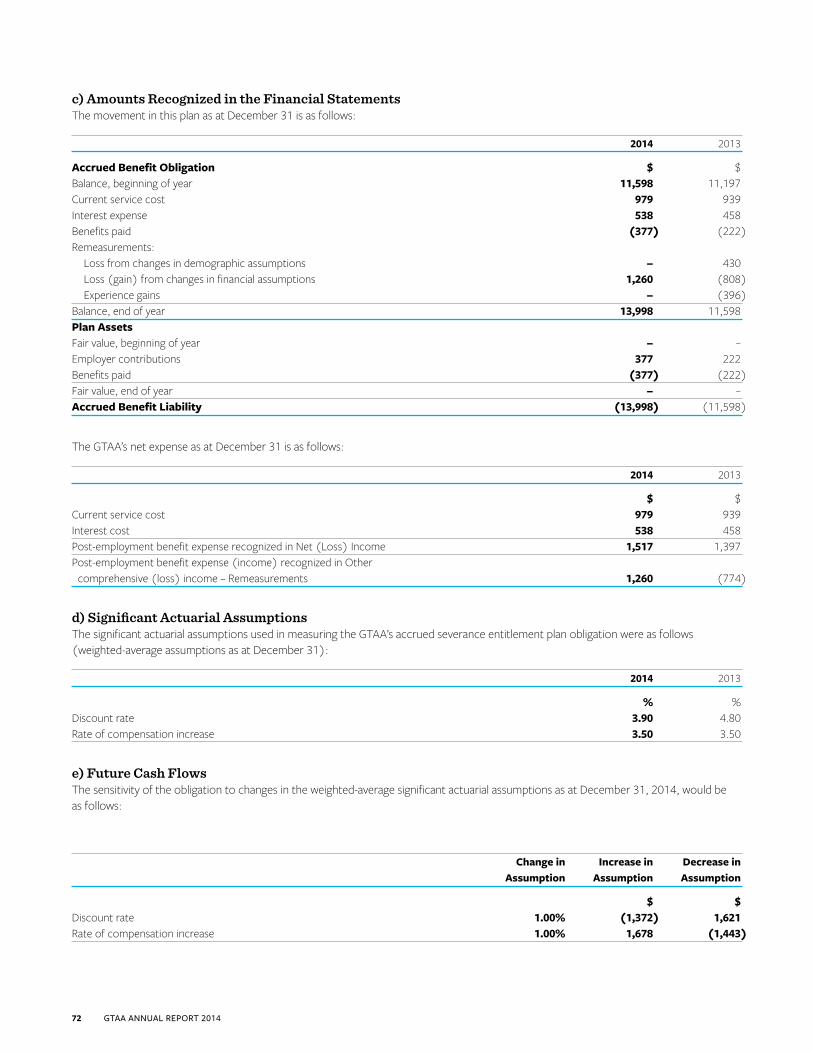
c) Amounts Recognized in the Financial StatementsThe movement in this plan as at December 31 is as follows:
2014 2013
Accrued Benefit Obligation $ $ Balance, beginning of year 11,598 11,197 Current service cost 979 939 Interest expense 538 458 Benefits paid (377) (222)Remeasurements: Loss from changes in demographic assumptions – 430 Loss (gain) from changes in financial assumptions 1,260 (808) Experience gains – (396)Balance, end of year 13,998 11,598 Plan AssetsFair value, beginning of year – – Employer contributions 377 222 Benefits paid (377) (222)Fair value, end of year – – Accrued Benefit Liability (13,998) (11,598)
The GTAA’s net expense as at December 31 is as follows:
2014 2013
$ $ Current service cost 979 939 Interest cost 538 458 Post-employment benefit expense recognized in Net (Loss) Income 1,517 1,397 Post-employment benefit expense (income) recognized in Other comprehensive (loss) income – Remeasurements 1,260 (774)
d) Significant Actuarial AssumptionsThe significant actuarial assumptions used in measuring the GTAA’s accrued severance entitlement plan obligation were as follows (weighted-average assumptions as at December 31):
2014 2013
% % Discount rate 3.90 4.80 Rate of compensation increase 3.50 3.50
e) Future Cash FlowsThe sensitivity of the obligation to changes in the weighted-average significant actuarial assumptions as at December 31, 2014, would be as follows:
Change in Increase in Decrease in Assumption Assumption Assumption
$ $ Discount rate 1.00% (1,372) 1,621 Rate of compensation increase 1.00% 1,678 (1,443)
72 GTAA ANNUAL REPORT 2014
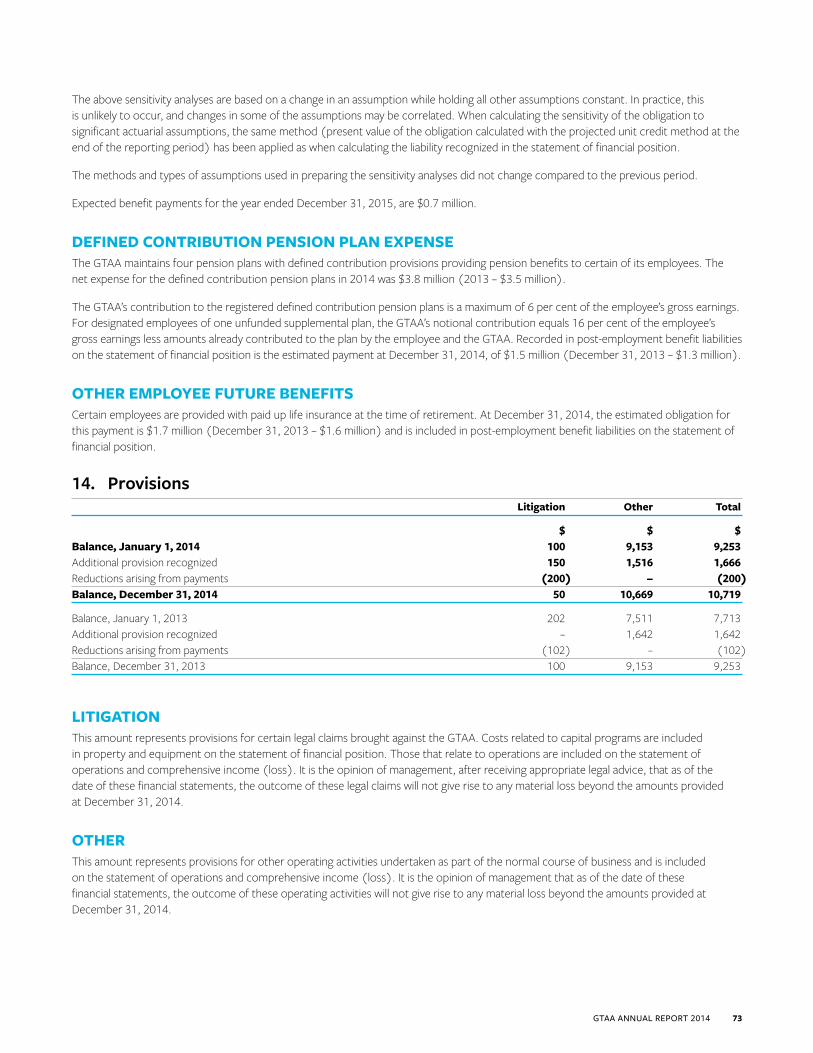
The above sensitivity analyses are based on a change in an assumption while holding all other assumptions constant. In practice, this is unlikely to occur, and changes in some of the assumptions may be correlated. When calculating the sensitivity of the obligation to significant actuarial assumptions, the same method (present value of the obligation calculated with the projected unit credit method at the end of the reporting period) has been applied as when calculating the liability recognized in the statement of financial position.
The methods and types of assumptions used in preparing the sensitivity analyses did not change compared to the previous period.
Expected benefit payments for the year ended December 31, 2015, are $0.7 million.
DEFINED CONTRIBUTION PENSION PLAN EXPENSEThe GTAA maintains four pension plans with defined contribution provisions providing pension benefits to certain of its employees. The net expense for the defined contribution pension plans in 2014 was $3.8 million (2013 – $3.5 million).
The GTAA’s contribution to the registered defined contribution pension plans is a maximum of 6 per cent of the employee’s gross earnings. For designated employees of one unfunded supplemental plan, the GTAA’s notional contribution equals 16 per cent of the employee’s gross earnings less amounts already contributed to the plan by the employee and the GTAA. Recorded in post-employment benefit liabilities on the statement of financial position is the estimated payment at December 31, 2014, of $1.5 million (December 31, 2013 – $1.3 million).
OTHER EMPLOYEE FUTURE BENEFITSCertain employees are provided with paid up life insurance at the time of retirement. At December 31, 2014, the estimated obligation for this payment is $1.7 million (December 31, 2013 – $1.6 million) and is included in post-employment benefit liabilities on the statement of financial position.
14. Provisions Litigation Other Total
$ $ $ Balance, January 1, 2014 100 9,153 9,253 Additional provision recognized 150 1,516 1,666 Reductions arising from payments (200) – (200)Balance, December 31, 2014 50 10,669 10,719
Balance, January 1, 2013 202 7,511 7,713 Additional provision recognized – 1,642 1,642 Reductions arising from payments (102) – (102)Balance, December 31, 2013 100 9,153 9,253
LITIGATION This amount represents provisions for certain legal claims brought against the GTAA. Costs related to capital programs are included in property and equipment on the statement of financial position. Those that relate to operations are included on the statement of operations and comprehensive income (loss). It is the opinion of management, after receiving appropriate legal advice, that as of the date of these financial statements, the outcome of these legal claims will not give rise to any material loss beyond the amounts provided at December 31, 2014.
OTHERThis amount represents provisions for other operating activities undertaken as part of the normal course of business and is included on the statement of operations and comprehensive income (loss). It is the opinion of management that as of the date of these financial statements, the outcome of these operating activities will not give rise to any material loss beyond the amounts provided at December 31, 2014.
GTAA ANNUAL REPORT 2014 73

15. Related Party Transactions and Balances
RELATED PARTIESThe GTAA is governed by a 15-member Board of Directors, of which five Directors are municipal nominees. Each of the regional municipalities of York, Halton, Peel and Durham and the City of Toronto is entitled to provide the names of up to three nominees, and the Board appoints one of the nominees for each of the five available positions as a municipally nominated Director. In addition, the Government of Canada and the Province of Ontario are entitled to appoint two Directors and one Director, respectively.
As a result of the ability of these governments to appoint Directors to the GTAA’s Board of Directors, these governments and their respective government-related entities are considered related parties for accounting purposes.
The GTAA has applied the exemption for government-related entities to disclose only significant transactions.
The post-employment benefit plan is also considered a related party. Transactions with the pension plan include contributions paid to the plan.
The GTAA entered into the following transactions with related parties during the year ended December 31, as included in the statement of operations and comprehensive income (loss):
2014 2013
$ $ Ground rent 131,938 127,874 Payments-in-lieu of real property taxes 30,401 28,953 Post-employment benefit plans expense 5,061 6,251
Amounts due from (to) and balances, including the OPA derivative, with respect to related parties as included in the statement of financial position were as follows:
2014 2013
$ $ Ontario Power Authority 44,655 41,587 Ground rent and deferred ground rent (3,578) (5,436)Commodity sales tax (4,497) (4,503)Province of Ontario, Interest-free loan (4,800) (9,600)Canadian Air Transport Security Authority 4,313 368
COMPENSATION OF KEY MANAGEMENTKey management includes the GTAA’s Directors and members of the Executive Committee.
The following table includes compensation to key management personnel for the year ended December 31 included in the statement of operations and comprehensive income (loss).
2014 2013
$ $ Salaries, fees and short-term benefits 5,025 4,959 Post-employment benefits 399 436 Other long-term benefits 9 11 Termination benefits 436 380 Total (included in salaries, wages and benefits) 5,869 5,786
74 GTAA ANNUAL REPORT 2014
16. Commitments and Contingent Liabilities
CAPITAL COMMITMENTSIn connection with the operation and development of the Airport, the GTAA had capital commitments outstanding at December 31, 2014, of approximately $214.0 million (December 31, 2013 – $200.9 million).
LETTERS OF CREDITTwo letters of credit for $2.4 million in total were outstanding as at December 31, 2014 (see Note 11, Credit Facility and Long-Term Debt), relating to the GTAA’s CES Contract with the OPA and the Fire and Emergency Services Training Institute. The letters of credit expire on April 11, 2015 and December 31, 2015, respectively.
ENVIRONMENTALThe GTAA is committed to ensuring that activities undertaken at the Airport are carried out in an environmentally responsible manner in compliance with applicable environmental laws and regulations and with sensitivity to community and public concerns.
INSURANCEThe Government of Canada has issued an Order-in-Council agreeing to provide indemnity to an airport operator for any third-party bodily injury and property damage coverage that became commercially unavailable due to the events of September 11, 2001.
The indemnity being provided to the GTAA, as an airport operator, shall not exceed the $1.0 billion limit obtained for aviation liability under the GTAA’s airport operators liability policy. As part of the original Order-in-Council, the GTAA is required to purchase a $50.0 million primary layer of aviation war risk liability coverage from commercial markets. The current undertaking has been extended to December 31, 2015.
With the aviation war risk program only designed to deal with liability matters, the GTAA purchases first-party terrorism property insurance in the amount of $300.0 million that writes back coverage that was excluded from the main property insurance policy following the events of September 11, 2001. This coverage is in place for 2015.
COGENERATION PLANTThe GTAA has entered into certain contracts in order to secure the supply and delivery of natural gas necessary for anticipated future operations of the Cogeneration Plant. Under these contracts, the GTAA will be required to make payments relating to both the delivery of natural gas based on standard rate agreements and the cost of natural gas as determined by market rates. The GTAA has also entered into a delivery contract that establishes a maximum volume of natural gas inventory that the GTAA is permitted to maintain, as of November 30 of each year. The GTAA has the option to dispose of natural gas in excess of this maximum volume either through consumption or through the sale of natural gas to third parties.
CONTINGENT LIABILITIESThe GTAA is subject to legal proceedings and claims from time to time which arise in the normal course of business. Where appropriate, the GTAA has recorded provisions while it actively pursues its position (see Note 14, Provisions). Where it is the opinion of management that the ultimate outcome of these matters will not result in a probable outflow of cash, no provisions have been recorded.
PAYMENTS-IN-LIEU OF DEVELOPMENT CHARGES The GTAA is not required to pay development charges to the City of Mississauga, the Regional Municipality of Peel (“Peel Region”) or the City of Toronto with respect to development at the Airport, but rather pays a payments-in-lieu of development charges (“PILDC”) in accordance with the Payments in Lieu of Taxes Act (Canada). The amount of PILDC is calculated by Public Works and Government Services Canada (“PWGSC”).
With respect to development undertaken by the GTAA at the Airport between 1996 and 2004, PWGSC paid PILDC in the amount of $0.8 million to the City of Mississauga and $4.1 million to Peel Region. As required by the Ground Lease, the GTAA reimbursed Transport Canada for such amounts. The City of Mississauga filed an application to increase the amount of the PILDC. The current claim by the City of Mississauga is $4.6 million. No amounts have been accrued as at December 31, 2014 with respect to this claim as the obligation relating to this application is not probable at this time.
GTAA ANNUAL REPORT 2014 75
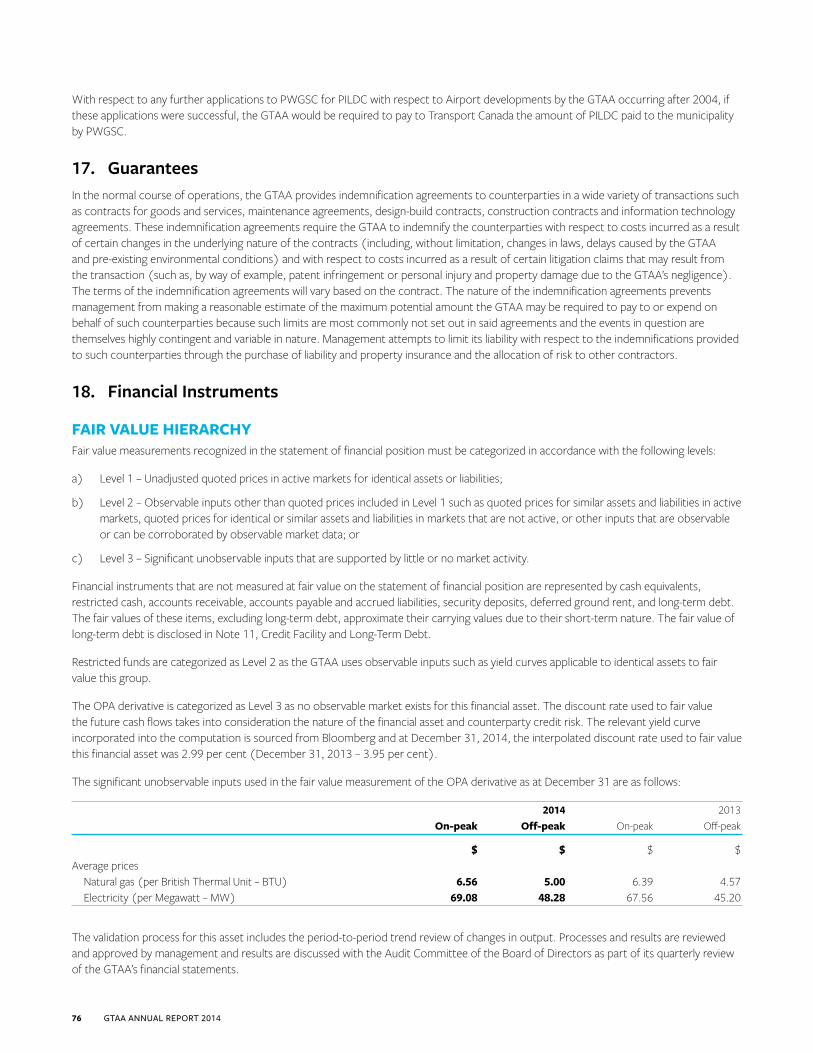
With respect to any further applications to PWGSC for PILDC with respect to Airport developments by the GTAA occurring after 2004, if these applications were successful, the GTAA would be required to pay to Transport Canada the amount of PILDC paid to the municipality by PWGSC.
17. Guarantees In the normal course of operations, the GTAA provides indemnification agreements to counterparties in a wide variety of transactions such as contracts for goods and services, maintenance agreements, design-build contracts, construction contracts and information technology agreements. These indemnification agreements require the GTAA to indemnify the counterparties with respect to costs incurred as a result of certain changes in the underlying nature of the contracts (including, without limitation, changes in laws, delays caused by the GTAA and pre-existing environmental conditions) and with respect to costs incurred as a result of certain litigation claims that may result from the transaction (such as, by way of example, patent infringement or personal injury and property damage due to the GTAA’s negligence). The terms of the indemnification agreements will vary based on the contract. The nature of the indemnification agreements prevents management from making a reasonable estimate of the maximum potential amount the GTAA may be required to pay to or expend on behalf of such counterparties because such limits are most commonly not set out in said agreements and the events in question are themselves highly contingent and variable in nature. Management attempts to limit its liability with respect to the indemnifications provided to such counterparties through the purchase of liability and property insurance and the allocation of risk to other contractors.
18. Financial Instruments
FAIR VALUE HIERARCHY Fair value measurements recognized in the statement of financial position must be categorized in accordance with the following levels:
a) Level 1 – Unadjusted quoted prices in active markets for identical assets or liabilities;
b) Level 2 – Observable inputs other than quoted prices included in Level 1 such as quoted prices for similar assets and liabilities in active markets, quoted prices for identical or similar assets and liabilities in markets that are not active, or other inputs that are observable or can be corroborated by observable market data; or
c) Level 3 – Significant unobservable inputs that are supported by little or no market activity.
Financial instruments that are not measured at fair value on the statement of financial position are represented by cash equivalents, restricted cash, accounts receivable, accounts payable and accrued liabilities, security deposits, deferred ground rent, and long-term debt. The fair values of these items, excluding long-term debt, approximate their carrying values due to their short-term nature. The fair value of long-term debt is disclosed in Note 11, Credit Facility and Long-Term Debt.
Restricted funds are categorized as Level 2 as the GTAA uses observable inputs such as yield curves applicable to identical assets to fair value this group.
The OPA derivative is categorized as Level 3 as no observable market exists for this financial asset. The discount rate used to fair value the future cash flows takes into consideration the nature of the financial asset and counterparty credit risk. The relevant yield curve incorporated into the computation is sourced from Bloomberg and at December 31, 2014, the interpolated discount rate used to fair value this financial asset was 2.99 per cent (December 31, 2013 – 3.95 per cent).
The significant unobservable inputs used in the fair value measurement of the OPA derivative as at December 31 are as follows:
2014 2013 On-peak Off-peak On-peak Off-peak
$ $ $ $ Average prices Natural gas (per British Thermal Unit – BTU) 6.56 5.00 6.39 4.57 Electricity (per Megawatt – MW) 69.08 48.28 67.56 45.20
The validation process for this asset includes the period-to-period trend review of changes in output. Processes and results are reviewed and approved by management and results are discussed with the Audit Committee of the Board of Directors as part of its quarterly review of the GTAA’s financial statements.
76 GTAA ANNUAL REPORT 2014
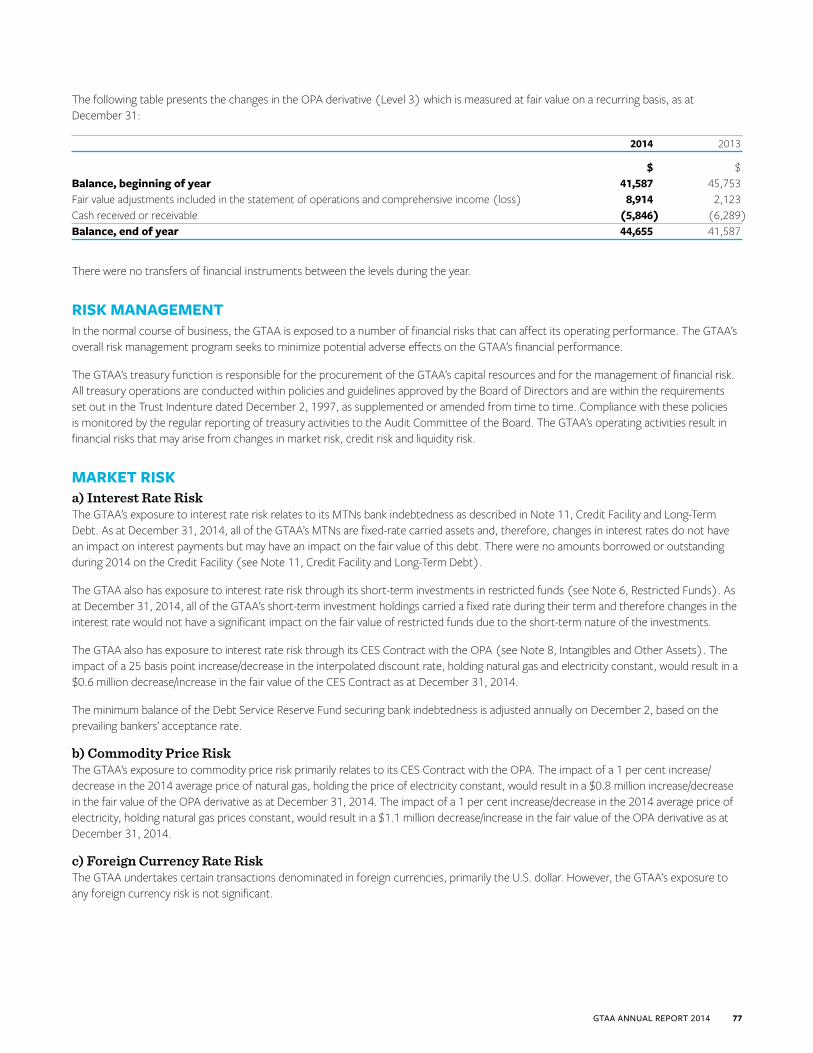
The following table presents the changes in the OPA derivative (Level 3) which is measured at fair value on a recurring basis, as at December 31:
2014 2013
$ $ Balance, beginning of year 41,587 45,753 Fair value adjustments included in the statement of operations and comprehensive income (loss) 8,914 2,123 Cash received or receivable (5,846) (6,289)Balance, end of year 44,655 41,587
There were no transfers of financial instruments between the levels during the year.
RISK MANAGEMENT In the normal course of business, the GTAA is exposed to a number of financial risks that can affect its operating performance. The GTAA’s overall risk management program seeks to minimize potential adverse effects on the GTAA’s financial performance.
The GTAA’s treasury function is responsible for the procurement of the GTAA’s capital resources and for the management of financial risk. All treasury operations are conducted within policies and guidelines approved by the Board of Directors and are within the requirements set out in the Trust Indenture dated December 2, 1997, as supplemented or amended from time to time. Compliance with these policies is monitored by the regular reporting of treasury activities to the Audit Committee of the Board. The GTAA’s operating activities result in financial risks that may arise from changes in market risk, credit risk and liquidity risk.
MARKET RISKa) Interest Rate RiskThe GTAA’s exposure to interest rate risk relates to its MTNs bank indebtedness as described in Note 11, Credit Facility and Long-Term Debt. As at December 31, 2014, all of the GTAA’s MTNs are fixed-rate carried assets and, therefore, changes in interest rates do not have an impact on interest payments but may have an impact on the fair value of this debt. There were no amounts borrowed or outstanding during 2014 on the Credit Facility (see Note 11, Credit Facility and Long-Term Debt).
The GTAA also has exposure to interest rate risk through its short-term investments in restricted funds (see Note 6, Restricted Funds). As at December 31, 2014, all of the GTAA’s short-term investment holdings carried a fixed rate during their term and therefore changes in the interest rate would not have a significant impact on the fair value of restricted funds due to the short-term nature of the investments.
The GTAA also has exposure to interest rate risk through its CES Contract with the OPA (see Note 8, Intangibles and Other Assets). The impact of a 25 basis point increase/decrease in the interpolated discount rate, holding natural gas and electricity constant, would result in a $0.6 million decrease/increase in the fair value of the CES Contract as at December 31, 2014.
The minimum balance of the Debt Service Reserve Fund securing bank indebtedness is adjusted annually on December 2, based on the prevailing bankers’ acceptance rate.
b) Commodity Price RiskThe GTAA’s exposure to commodity price risk primarily relates to its CES Contract with the OPA. The impact of a 1 per cent increase/decrease in the 2014 average price of natural gas, holding the price of electricity constant, would result in a $0.8 million increase/decrease in the fair value of the OPA derivative as at December 31, 2014. The impact of a 1 per cent increase/decrease in the 2014 average price of electricity, holding natural gas prices constant, would result in a $1.1 million decrease/increase in the fair value of the OPA derivative as at December 31, 2014.
c) Foreign Currency Rate RiskThe GTAA undertakes certain transactions denominated in foreign currencies, primarily the U.S. dollar. However, the GTAA’s exposure to any foreign currency risk is not significant.
GTAA ANNUAL REPORT 2014 77

CREDIT RISKThe GTAA is subject to credit risk through its financial assets. The GTAA performs ongoing credit valuations of these balances and maintains valuation allowances for potential credit loss.
Before accepting a new air carrier, the GTAA uses an external credit scoring system to assess the potential customer’s credit quality, as well as an internal credit rating system. Customers are subject to credit checks and require prepayment or a deposit in the form of cash, a letter of credit or a letter of guarantee. Operational and credit-related reviews for aeronautical customers are seasonally reviewed for appropriateness. Should the requirements for security deposits change, new payment terms or deposit requirements will be established. A security deposit is required for most non-aeronautical customers as well. Credit checks for these customers are performed at the time of the agreement negotiations, renewal and amendments.
The credit quality of financial assets that are neither past due nor impaired can be assessed by reference to external credit ratings (if available) or to historical information about the customer.
As at December 31 2014 2013
$ $ Cash and cash equivalents AA – 8,292 AA- – 18,698 A+ 2,593 84,438 A 6,445 6,950 9,038 118,378 Restricted fundsAAA 175,944 153,333 AA – 64,101 AA- 158,312 171,573 A+ 362,472 576,175 A 108,124 98,435 804,852 1,063,617 OPA derivativeA- 44,655 41,587 44,655 41,587
None of the financial assets that are fully performing have been renegotiated during the year.
The GTAA derives a substantial portion of its operating revenues from air carriers through landing fees and general terminal charges. There is a concentration of service with two air carriers that represents approximately 68.0 per cent (2013 – 62.7 per cent) of these fees and 27.9 per cent (2013 – 35.7 per cent) of the accounts receivable balance, excluding prepayments and/or deposits on hand, at December 31, 2014.
LIQUIDITY RISKThe GTAA manages liquidity risk by maintaining adequate cash, restricted funds and available credit facilities. Quarterly cash flow projections are prepared by management and reviewed by the Audit Committee to ensure a sufficient continuity of funding. To maintain a flexible program, debt maturities are spread over a range of dates, thereby ensuring that the GTAA is not exposed to excessive refinancing risk in any one year.
The GTAA maintains a line of credit and executes a Capital Markets Platform to meet cash needs as debt maturities occur (see Note 11, Credit Facility and Long-Term Debt, and Note 21, Capital Risk Management).
78 GTAA ANNUAL REPORT 2014
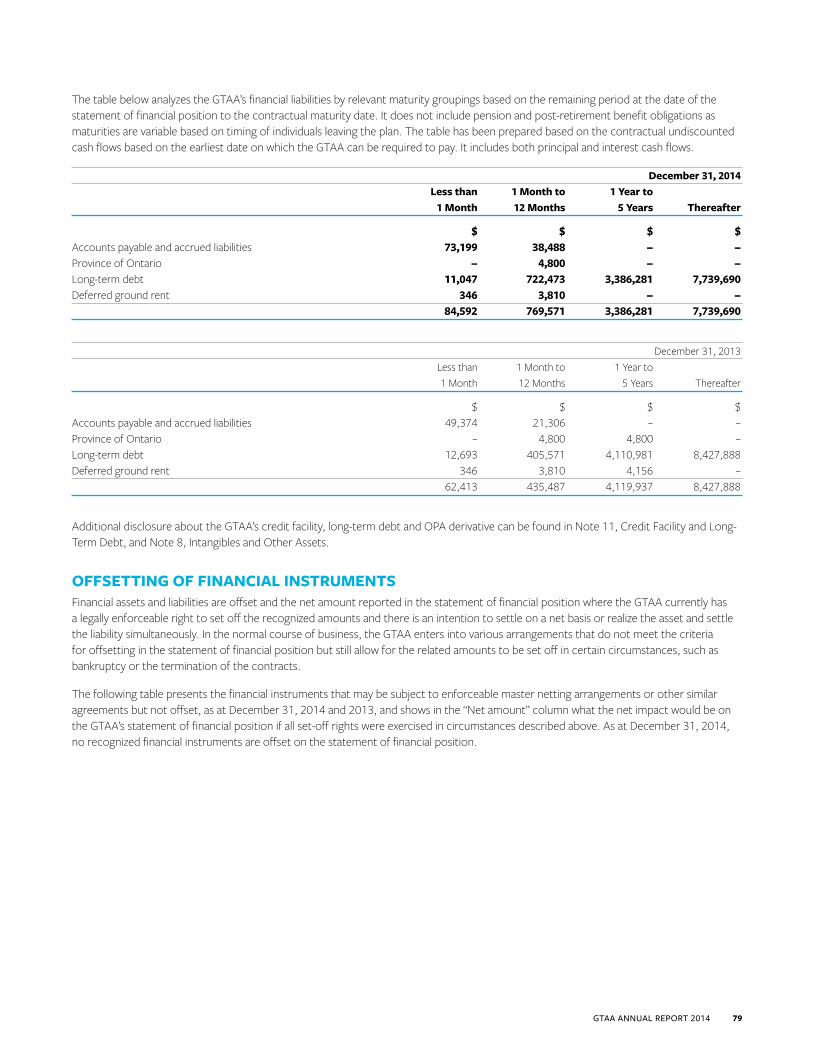
The table below analyzes the GTAA’s financial liabilities by relevant maturity groupings based on the remaining period at the date of the statement of financial position to the contractual maturity date. It does not include pension and post-retirement benefit obligations as maturities are variable based on timing of individuals leaving the plan. The table has been prepared based on the contractual undiscounted cash flows based on the earliest date on which the GTAA can be required to pay. It includes both principal and interest cash flows.
December 31, 2014 Less than 1 Month to 1 Year to 1 Month 12 Months 5 Years Thereafter
$ $ $ $ Accounts payable and accrued liabilities 73,199 38,488 – – Province of Ontario – 4,800 – – Long-term debt 11,047 722,473 3,386,281 7,739,690 Deferred ground rent 346 3,810 – – 84,592 769,571 3,386,281 7,739,690
December 31, 2013 Less than 1 Month to 1 Year to 1 Month 12 Months 5 Years Thereafter
$ $ $ $ Accounts payable and accrued liabilities 49,374 21,306 – – Province of Ontario – 4,800 4,800 – Long-term debt 12,693 405,571 4,110,981 8,427,888 Deferred ground rent 346 3,810 4,156 – 62,413 435,487 4,119,937 8,427,888
Additional disclosure about the GTAA’s credit facility, long-term debt and OPA derivative can be found in Note 11, Credit Facility and Long-Term Debt, and Note 8, Intangibles and Other Assets.
OFFSETTING OF FINANCIAL INSTRUMENTSFinancial assets and liabilities are offset and the net amount reported in the statement of financial position where the GTAA currently has a legally enforceable right to set off the recognized amounts and there is an intention to settle on a net basis or realize the asset and settle the liability simultaneously. In the normal course of business, the GTAA enters into various arrangements that do not meet the criteria for offsetting in the statement of financial position but still allow for the related amounts to be set off in certain circumstances, such as bankruptcy or the termination of the contracts.
The following table presents the financial instruments that may be subject to enforceable master netting arrangements or other similar agreements but not offset, as at December 31, 2014 and 2013, and shows in the “Net amount” column what the net impact would be on the GTAA’s statement of financial position if all set-off rights were exercised in circumstances described above. As at December 31, 2014, no recognized financial instruments are offset on the statement of financial position.
GTAA ANNUAL REPORT 2014 79
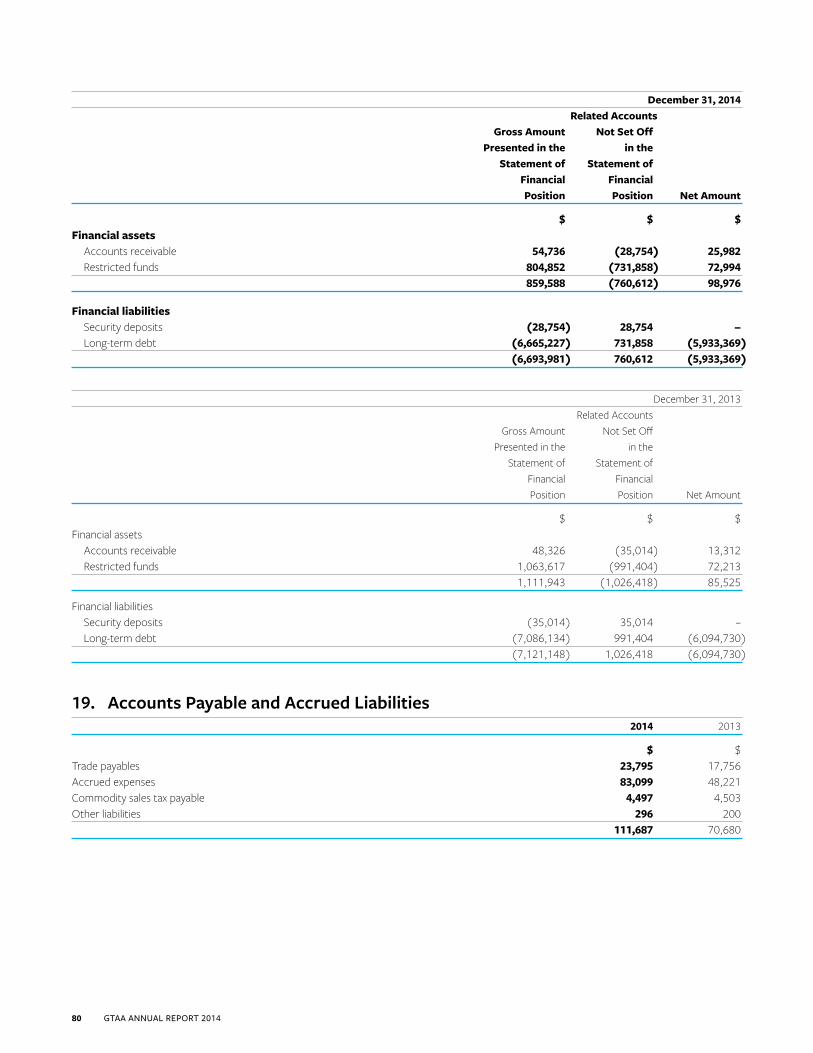
December 31, 2014 Related Accounts Gross Amount Not Set Off Presented in the in the Statement of Statement of Financial Financial Position Position Net Amount
$ $ $ Financial assets Accounts receivable 54,736 (28,754) 25,982 Restricted funds 804,852 (731,858) 72,994 859,588 (760,612) 98,976
Financial liabilities Security deposits (28,754) 28,754 – Long-term debt (6,665,227) 731,858 (5,933,369) (6,693,981) 760,612 (5,933,369)
December 31, 2013 Related Accounts Gross Amount Not Set Off Presented in the in the Statement of Statement of Financial Financial Position Position Net Amount
$ $ $ Financial assets Accounts receivable 48,326 (35,014) 13,312 Restricted funds 1,063,617 (991,404) 72,213 1,111,943 (1,026,418) 85,525
Financial liabilities Security deposits (35,014) 35,014 – Long-term debt (7,086,134) 991,404 (6,094,730) (7,121,148) 1,026,418 (6,094,730)
19. Accounts Payable and Accrued Liabilities 2014 2013
$ $ Trade payables 23,795 17,756 Accrued expenses 83,099 48,221 Commodity sales tax payable 4,497 4,503 Other liabilities 296 200 111,687 70,680
80 GTAA ANNUAL REPORT 2014
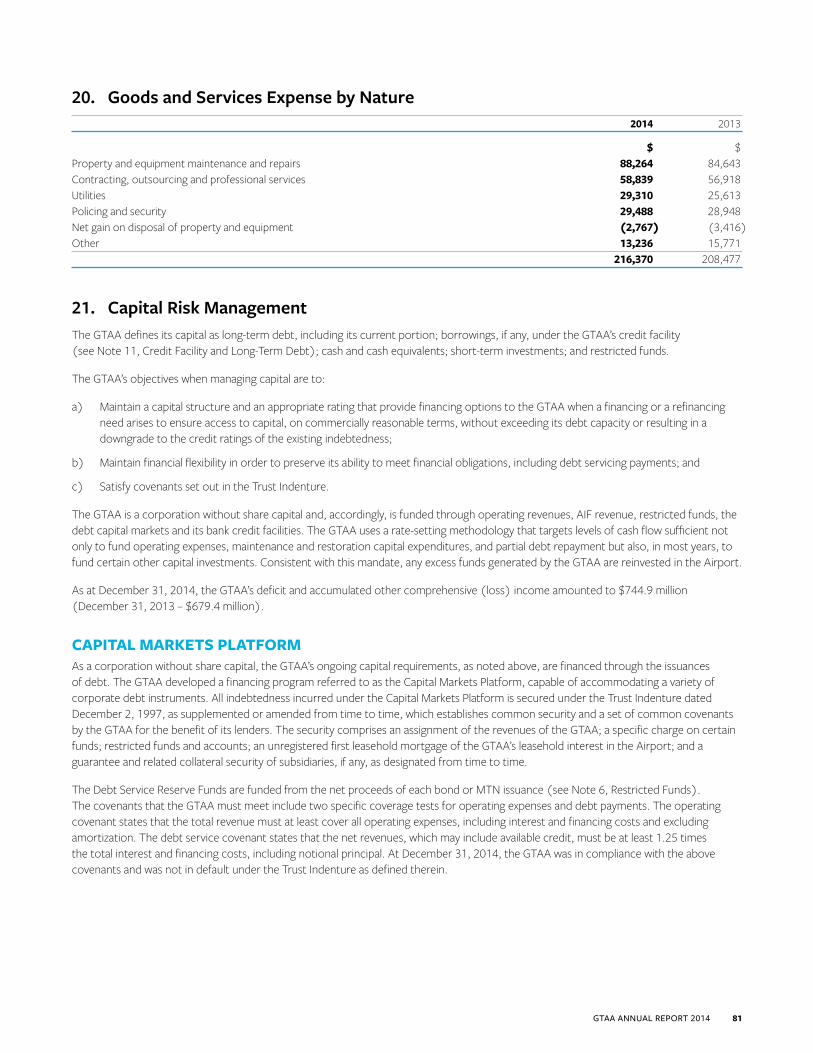
20. Goods and Services Expense by Nature 2014 2013
$ $ Property and equipment maintenance and repairs 88,264 84,643 Contracting, outsourcing and professional services 58,839 56,918 Utilities 29,310 25,613 Policing and security 29,488 28,948 Net gain on disposal of property and equipment (2,767) (3,416)Other 13,236 15,771 216,370 208,477
21. Capital Risk ManagementThe GTAA defines its capital as long-term debt, including its current portion; borrowings, if any, under the GTAA’s credit facility (see Note 11, Credit Facility and Long-Term Debt); cash and cash equivalents; short-term investments; and restricted funds.
The GTAA’s objectives when managing capital are to:
a) Maintain a capital structure and an appropriate rating that provide financing options to the GTAA when a financing or a refinancing need arises to ensure access to capital, on commercially reasonable terms, without exceeding its debt capacity or resulting in a downgrade to the credit ratings of the existing indebtedness;
b) Maintain financial flexibility in order to preserve its ability to meet financial obligations, including debt servicing payments; and
c) Satisfy covenants set out in the Trust Indenture.
The GTAA is a corporation without share capital and, accordingly, is funded through operating revenues, AIF revenue, restricted funds, the debt capital markets and its bank credit facilities. The GTAA uses a rate-setting methodology that targets levels of cash flow sufficient not only to fund operating expenses, maintenance and restoration capital expenditures, and partial debt repayment but also, in most years, to fund certain other capital investments. Consistent with this mandate, any excess funds generated by the GTAA are reinvested in the Airport.
As at December 31, 2014, the GTAA’s deficit and accumulated other comprehensive (loss) income amounted to $744.9 million (December 31, 2013 – $679.4 million).
CAPITAL MARKETS PLATFORMAs a corporation without share capital, the GTAA’s ongoing capital requirements, as noted above, are financed through the issuances of debt. The GTAA developed a financing program referred to as the Capital Markets Platform, capable of accommodating a variety of corporate debt instruments. All indebtedness incurred under the Capital Markets Platform is secured under the Trust Indenture dated December 2, 1997, as supplemented or amended from time to time, which establishes common security and a set of common covenants by the GTAA for the benefit of its lenders. The security comprises an assignment of the revenues of the GTAA; a specific charge on certain funds; restricted funds and accounts; an unregistered first leasehold mortgage of the GTAA’s leasehold interest in the Airport; and a guarantee and related collateral security of subsidiaries, if any, as designated from time to time.
The Debt Service Reserve Funds are funded from the net proceeds of each bond or MTN issuance (see Note 6, Restricted Funds). The covenants that the GTAA must meet include two specific coverage tests for operating expenses and debt payments. The operating covenant states that the total revenue must at least cover all operating expenses, including interest and financing costs and excluding amortization. The debt service covenant states that the net revenues, which may include available credit, must be at least 1.25 times the total interest and financing costs, including notional principal. At December 31, 2014, the GTAA was in compliance with the above covenants and was not in default under the Trust Indenture as defined therein.
GTAA ANNUAL REPORT 2014 81
22. Insurance RecoveryOn July 8, 2013, a severe storm event resulted in water damage to a number of Airport facilities. In the year, the GTAA recorded a net gain of $3.1 million in goods and services expense on the statement of operations and comprehensive income (loss). This balance represents the difference between the expected insurance claim proceeds and the net book value of damaged property and equipment and clean-up costs incurred as at December 31, 2014. To date, the GTAA has received approximately $20.5 million from the insurers, of which $17.5 million has been released by the Trustee to the GTAA. The remaining $3.0 million is included in restricted cash on the statement of financial position in accordance with the GTAA’s Insurance Trust Agreement. Included in accounts receivable is $2.9 million (December 31, 2013 – $3.5 million) in insurance proceeds receivable, representing amounts recoverable under the policy as at December 31, 2014, but not yet received.
In addition to the amounts recorded above, the GTAA expects to receive further insurance proceeds once restoration is completed and final costs are determined. At the same time, the GTAA has a commitment to perform restoration work and replace certain property and equipment in order to realize on its insurance proceeds. Accordingly, actual results may differ from the amounts currently recognized.
82 GTAA ANNUAL REPORT 2014
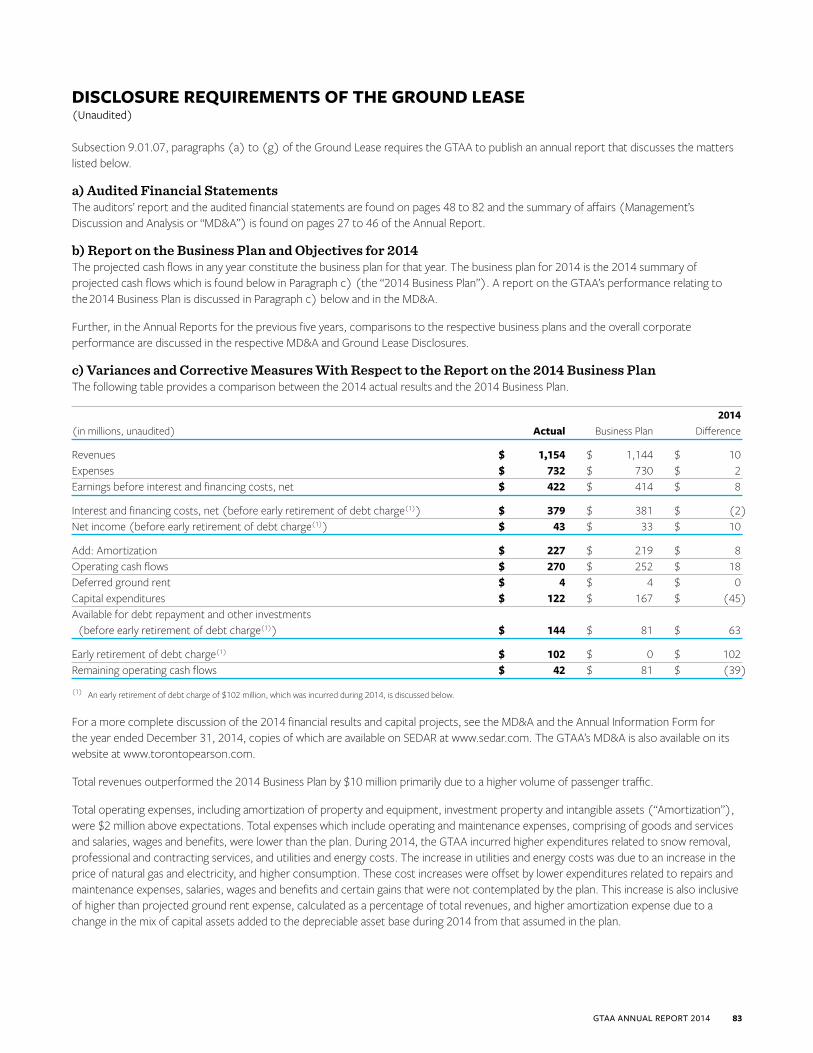
DISCLOSURE REQUIREMENTS OF THE GROUND LEASE(Unaudited)
Subsection 9.01.07, paragraphs (a) to (g) of the Ground Lease requires the GTAA to publish an annual report that discusses the matters listed below.
a) Audited Financial Statements The auditors’ report and the audited financial statements are found on pages 48 to 82 and the summary of affairs (Management’s Discussion and Analysis or “MD&A”) is found on pages 27 to 46 of the Annual Report.
b) Report on the Business Plan and Objectives for 2014 The projected cash flows in any year constitute the business plan for that year. The business plan for 2014 is the 2014 summary of projected cash flows which is found below in Paragraph c) (the “2014 Business Plan”). A report on the GTAA’s performance relating to the 2014 Business Plan is discussed in Paragraph c) below and in the MD&A.
Further, in the Annual Reports for the previous five years, comparisons to the respective business plans and the overall corporate performance are discussed in the respective MD&A and Ground Lease Disclosures.
c) Variances and Corrective Measures With Respect to the Report on the 2014 Business Plan The following table provides a comparison between the 2014 actual results and the 2014 Business Plan.
2014(in millions, unaudited) Actual Business Plan Difference
Revenues $ 1,154 $ 1,144 $ 10Expenses $ 732 $ 730 $ 2Earnings before interest and financing costs, net $ 422 $ 414 $ 8
Interest and financing costs, net (before early retirement of debt charge(1)) $ 379 $ 381 $ (2)Net income (before early retirement of debt charge(1)) $ 43 $ 33 $ 10
Add: Amortization $ 227 $ 219 $ 8Operating cash flows $ 270 $ 252 $ 18Deferred ground rent $ 4 $ 4 $ 0Capital expenditures $ 122 $ 167 $ (45)Available for debt repayment and other investments (before early retirement of debt charge(1)) $ 144 $ 81 $ 63
Early retirement of debt charge(1) $ 102 $ 0 $ 102Remaining operating cash flows $ 42 $ 81 $ (39)
(1) An early retirement of debt charge of $102 million, which was incurred during 2014, is discussed below.
For a more complete discussion of the 2014 financial results and capital projects, see the MD&A and the Annual Information Form for the year ended December 31, 2014, copies of which are available on SEDAR at www.sedar.com. The GTAA’s MD&A is also available on its website at www.torontopearson.com.
Total revenues outperformed the 2014 Business Plan by $10 million primarily due to a higher volume of passenger traffic.
Total operating expenses, including amortization of property and equipment, investment property and intangible assets (“Amortization”), were $2 million above expectations. Total expenses which include operating and maintenance expenses, comprising of goods and services and salaries, wages and benefits, were lower than the plan. During 2014, the GTAA incurred higher expenditures related to snow removal, professional and contracting services, and utilities and energy costs. The increase in utilities and energy costs was due to an increase in the price of natural gas and electricity, and higher consumption. These cost increases were offset by lower expenditures related to repairs and maintenance expenses, salaries, wages and benefits and certain gains that were not contemplated by the plan. This increase is also inclusive of higher than projected ground rent expense, calculated as a percentage of total revenues, and higher amortization expense due to a change in the mix of capital assets added to the depreciable asset base during 2014 from that assumed in the plan.
GTAA ANNUAL REPORT 2014 83
The net interest and financing costs (before early retirement of debt charge) were lower than projected by $2 million. During 2014, the GTAA purchased and cancelled approximately $399 million face value of its outstanding debt using the Notional Principal Fund, AIF Reserve Fund, and cash. The early retirement of debt charge of approximately $102 million, as recorded on the statements of operations and comprehensive income (loss), is primarily due to the difference between the purchase price and the carrying value of the notes at the time of purchase and cancellation. By purchasing and cancelling certain of its outstanding debt securities the GTAA has reduced its total amount of indebtedness and expects to experience savings in net interest and financing costs in the future.
The deposits to the Notional Principal, Debt Service Coverage and the Operations and Maintenance Funds were as projected.
None of the variances to the 2014 Business Plan discussed above were of a nature that caused the GTAA to take specific corrective actions.
d) Summary of the Five-Year Business PlanThe five-year Business Plan (2015 to 2019) is driven by the 20-year strategic framework, which is in turn based upon three fundamental strategic principles: financial sustainability, customer experience and operational excellence. This means that the GTAA will meet the growing demand for air travel by making optimum use of existing facilities before investing in new capital infrastructure. This will be achieved by improved passenger, baggage and aircraft processing and flow through the Airport, while delivering excellent customer service, atmosphere and amenities to all passengers.
The key revenue generation assumptions used to develop the 2015 Business Plan are that in 2015, the GTAA assumes the following:
• 40.2 million total passengers;
• Landed MTOW (> 19 tonnes) of 15 million tonnes; and
• Landed seats of 24.6 million.
Over the five-year forecast horizon, the primary driver for the GTAA’s Business Plan is the long-term growth in Airport activity. Specific revenue, customer service or cost-containment initiatives carried out over this period may also have an impact on revenues and expenses. The average annual passenger growth rate from 2015 to 2019 is projected to be approximately 3.7 per cent. During the same period, landed MTOW is expected to grow at an average annual growth rate of approximately 3 per cent, while landed seats are expected to grow by an average annual growth of approximately 3.5 per cent.
In setting its 2013 aeronautical rates, the GTAA announced its intention to maintain these rates at the 2013 level through to the end of 2015. If over this three-year period, however, circumstances should vary from the GTAA’s expectations, the GTAA may alter its rates as required over this period to ensure that its revenues are sufficient to cover its obligations.
During the Business Plan’s five-year horizon, the GTAA plans to continue to pursue its non-aeronautical revenue growth strategy. This will include the introduction of new retail, food and beverage offerings and advertising/sponsorship initiatives, and enhanced marketing and business development initiatives to increase parking revenues. Over the term of the Business Plan, growth in non-aeronautical revenues is expected to exceed passenger growth.
The GTAA typically undertakes capital projects to meet one of the following key objectives: (i) to comply with regulatory requirements (e.g., safety, security or environmental); (ii) to expand the capacity of the Airport; (iii) to improve, restore or replace existing assets; or (iv) to modify existing infrastructure to reduce costs, improve revenues or improve customer experience.
As part of the 20-year strategic framework adopted by the GTAA in 2013, the GTAA will continue to meet the growing demand for air travel through making optimum use of existing facilities prior to investing in new capital infrastructure.
In the near term, the GTAA will continue to focus on capital programs that will optimize the capacity and use of its existing infrastructure assets to improve passenger, baggage and aircraft processing and flow, comply with regulatory requirements, and enhance customer experience, primarily through its Terminal 1 and Terminal 3 improvement projects.
Expenditures related to these capital programs are expected to be funded primarily through cash flows generated from operations and the expenditures are expected to average approximately $200 million to $250 million per year over the next five years.
The reader is cautioned that some assumptions used to derive forecast information may not materialize and unanticipated events and circumstances may occur subsequent to the date when this summary was prepared. Therefore, the actual results achieved during the period may vary, and the variations may be material. For a more complete discussion of the risks and uncertainties and caution regarding forward-looking statements, see the MD&A and the Annual Information Form, copies of which are available on SEDAR at www.sedar.com. The GTAA’s MD&A is also available on its website at www.torontopearson.com.
84 GTAA ANNUAL REPORT 2014
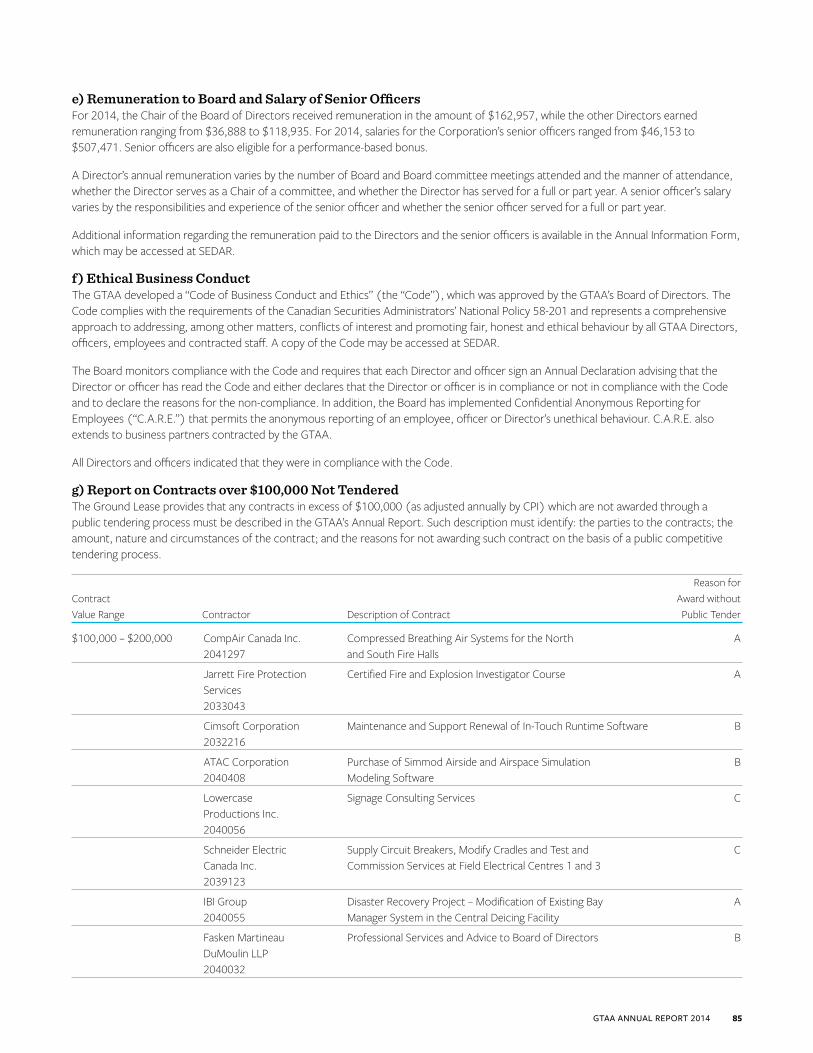
e) Remuneration to Board and Salary of Senior OfficersFor 2014, the Chair of the Board of Directors received remuneration in the amount of $162,957, while the other Directors earned remuneration ranging from $36,888 to $118,935. For 2014, salaries for the Corporation’s senior officers ranged from $46,153 to $507,471. Senior officers are also eligible for a performance-based bonus.
A Director’s annual remuneration varies by the number of Board and Board committee meetings attended and the manner of attendance, whether the Director serves as a Chair of a committee, and whether the Director has served for a full or part year. A senior officer’s salary varies by the responsibilities and experience of the senior officer and whether the senior officer served for a full or part year.
Additional information regarding the remuneration paid to the Directors and the senior officers is available in the Annual Information Form, which may be accessed at SEDAR.
f ) Ethical Business Conduct The GTAA developed a “Code of Business Conduct and Ethics” (the “Code”), which was approved by the GTAA’s Board of Directors. The Code complies with the requirements of the Canadian Securities Administrators’ National Policy 58-201 and represents a comprehensive approach to addressing, among other matters, conflicts of interest and promoting fair, honest and ethical behaviour by all GTAA Directors, officers, employees and contracted staff. A copy of the Code may be accessed at SEDAR.
The Board monitors compliance with the Code and requires that each Director and officer sign an Annual Declaration advising that the Director or officer has read the Code and either declares that the Director or officer is in compliance or not in compliance with the Code and to declare the reasons for the non-compliance. In addition, the Board has implemented Confidential Anonymous Reporting for Employees (“C.A.R.E.”) that permits the anonymous reporting of an employee, officer or Director’s unethical behaviour. C.A.R.E. also extends to business partners contracted by the GTAA.
All Directors and officers indicated that they were in compliance with the Code.
g) Report on Contracts over $100,000 Not Tendered The Ground Lease provides that any contracts in excess of $100,000 (as adjusted annually by CPI) which are not awarded through a public tendering process must be described in the GTAA’s Annual Report. Such description must identify: the parties to the contracts; the amount, nature and circumstances of the contract; and the reasons for not awarding such contract on the basis of a public competitive tendering process.
Reason forContract Award withoutValue Range Contractor Description of Contract Public Tender
$100,000 – $200,000 CompAir Canada Inc. Compressed Breathing Air Systems for the North A 2041297 and South Fire Halls
Jarrett Fire Protection Certified Fire and Explosion Investigator Course A Services 2033043
Cimsoft Corporation Maintenance and Support Renewal of In-Touch Runtime Software B 2032216
ATAC Corporation Purchase of Simmod Airside and Airspace Simulation B 2040408 Modeling Software
Lowercase Signage Consulting Services C Productions Inc. 2040056
Schneider Electric Supply Circuit Breakers, Modify Cradles and Test and C Canada Inc. Commission Services at Field Electrical Centres 1 and 3 2039123
IBI Group Disaster Recovery Project – Modification of Existing Bay A 2040055 Manager System in the Central Deicing Facility
Fasken Martineau Professional Services and Advice to Board of Directors B DuMoulin LLP 2040032
GTAA ANNUAL REPORT 2014 85

Reason forContract Award withoutValue Range Contractor Description of Contract Public Tender
$100,000 – $200,000 BlueCat Implementation and Software Licence to Upgrade Existing A (continued) Networks Inc. Virtual Server at the Integrated Operations Control Centre at 2040409/2040743 Terminal 1 and Associated Support and Maintenance Service
JCAI Inc. Support & Maintenance for Twenty Four Sign Boards B 2039984 at the Central Deicing Facility
Scotia Weather Weather Reporting and Equipment Maintenance Services A Services Inc. 2036517
SMS Consulting and Advisory Services for the Independent Electricity A Energy-Engineering Inc. System Operator’s Audit on the Generator Cost Guarantee Claims 2037860
Ahearn & Soper Inc. Replacement of Forty Computer Modules in Deicing Trucks B 2040352
Oracle Canada ULC Purchase of Three Solaris Servers With Associate Hardware A 1024400
$200,000 – $400,000 PASSUR Aerospace, Inc. Licence for Field Condition Reporting and Departure A 2038476 Metering Software Modules
IBI Group Design Consulting Services for the Emergency Operations A 2040064 Centre Expansion and the Radiant Heaters Installation in the Airfield Maintenance Facility Sand Storage Building
Chauntry Corporation Hosted Services for Online Parking Reservation System A Limited 2038170
Page Industries Inc. Supply of Eighty Seven Baggage Chutes for Terminals 1 and 3 C 2040069 Passenger Boarding Bridges
Kamrus Construction Provision of Airside Baggage Storage Facilities at Terminals 1 and 3 D 2040497
Bell Canada Bell Business Internet Dedicated Services A 2039760
Oracle Canada ULC Annual Maintenance and Support Services for Sun Server B 2034764 and Storage Systems
$400,000 – $600,000 Torcon, a Division Modifications and Construction to Upgrade the B of Aliya International Inc. Emergency Operations Centre 2040550
A. Where the GTAA determines that in connection with an existing contract for the supply of goods and services which is expiring, it is most efficient and practicable to extend or award a new contract to the existing contractor or services supplier where such contractor or services supplier has developed a specific skill set or knowledge base in respect of that contract not found on the market.
B. Where there is just one contractor or service supplier who can provide the required goods or services.
C. Where warranty, patent or copyright requirements or technical compatibility factors dictate a specific supplier.
D. In any other circumstances where the President and Chief Executive Officer determines it is necessary to do so having regard to the safe, efficient and practicable operation of Toronto Pearson.
86 GTAA ANNUAL REPORT 2014

ONWARD
UPW
ARD
GTAA ANNUAL REPORT 2014 87
SUSTAINABLE
GRO
WTH
CORPORATE SUSTAINABILITY SUPPLEMENT 2014
CORPORATE SUSTAINABILITY (Unaudited)
The GTAA has reported on our economic impact and our commitment to our people, communities and the environment since 2005. During that time, our language has changed as our understanding of sustainability has changed. Consequently, we have moved from talking about sustainability and corporate social responsibility as distinct categories, to reporting on corporate sustainability. This better reflects our belief that social responsibility is an aspect of sustainability and is aligned with the GTAA’s approved Strategic Framework. We also hope that this change will help us start a broader conversation about how sustainability contributes to reaching our long-term strategic goals.
In 2013, for the first time, we integrated sustainability reporting into our Annual Report. We felt this would provide our stakeholders with a broader understanding of our role in, and contribution to, the communities we serve. It also highlighted the connection between sustainability, including corporate responsibility programs, and overall performance. By improving in areas such as engagement, employee culture, customer service and community well-being, we are improving the GTAA.
In this year’s report, we are excited to discuss our recent corporate sustainability programs, plans, goals and performance, to show how they are aligned to our broader Strategic Framework and how they support our vision of being: “The Best Airport in the World; Making a Difference, Connecting the World.”
Toronto Pearson is poised for tremendous economic growth in the coming 20 years. So we need to be ready: to deliver outstanding customer service; to be recognized as an employer of choice; to continue working to minimize our environmental footprint; and to maintain the highest commitment to safety and security. To develop our strategy for meeting these challenges, our Board and executive team met with passengers, employees, airport customers, community leaders and other groups. The insights they gained will help position Toronto Pearson to be a leading global transportation hub in the years to come.
ABOUT OUR CORPORATE SUSTAINABILITY REPORTINGThis year, as in 2013, we are providing a self-declared “Comprehensive” report based on the most recent version of Global Reporting Initiative (GRI) Sustainability Reporting Guidelines (G4), as well as the Airport Operators Sector Supplement (AO), which we helped develop in 2011. The report focuses on our material topics, issues that have been identified as priorities to our stakeholder and the GTAA. In order to qualify as a “Comprehensive” report, certain information not provided in the report narrative is referenced in the Index. The Index features separately downloadable public documents, including a “Supplement”, which is a more complete version of the GRI Index.
To provide a balanced view of GTAA’s priorities, performance and initiatives, we report according to our Strategic Framework goals. Certain topics are dealt with in greater depth, based largely on recent feedback from our key stakeholders and our evolving business priorities. To provide context, we show, where possible, how our performance has changed over the years and how it relates to our medium- and long-term goals.
As in previous years, we used an internal verification program to assess our performance data, including, but not limited to, how the data was captured, collected, reviewed and reported. A sample of the information and data related to the performance indicators was evaluated to ensure that a documented process and adequate controls were in place, to help us ensure the data we presented is consistent and accurate. We maintain an ISO 14001 environmental management system, which helps us in determining our long-term objectives, and is externally audited to ensure the quality and credibility of our environmental data.
We continue to provide the information we have available and take each year as an opportunity to improve on the details of the data. Some values have been restated as a result of a change in unit being used or a change in how data was compiled as a consequence of the adoption of the updated and new GRI guidelines. This has been clearly indicated in the relevant sections.
“The Best Airport in the World; Making a Difference, Connecting the World.” GTAA STRATEGIC VISION
88 GTAA ANNUAL REPORT 2014
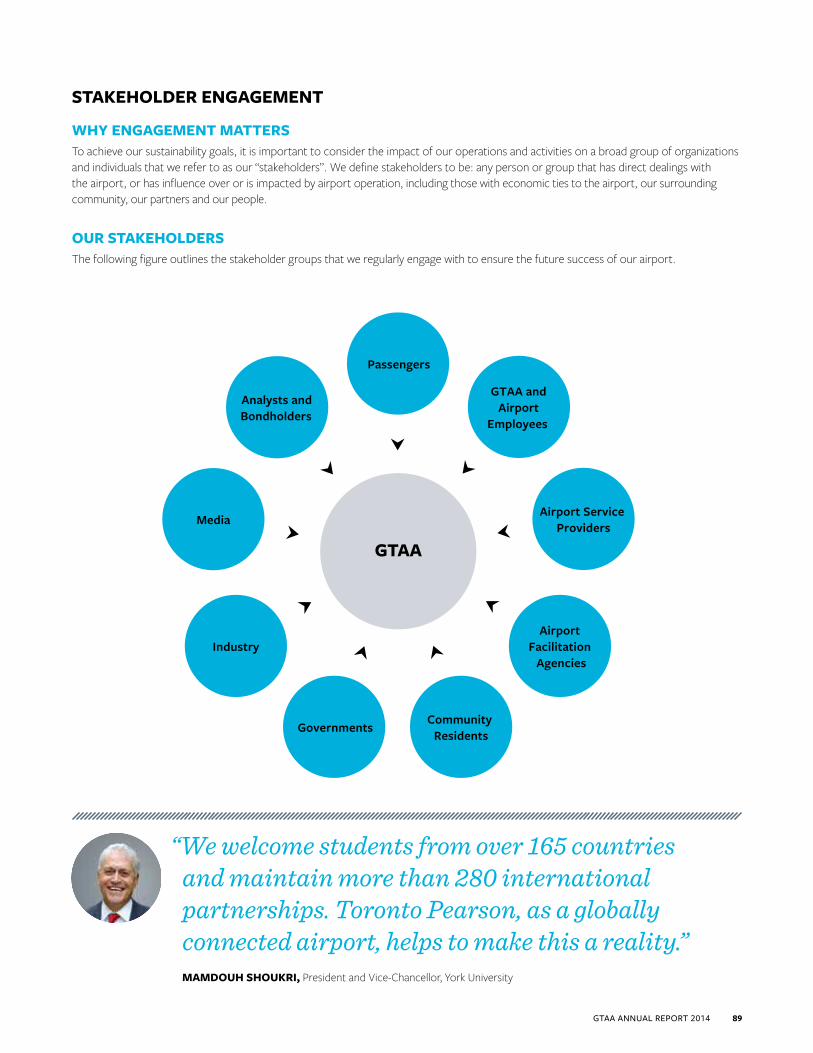
STAKEHOLDER ENGAGEMENT
WHY ENGAGEMENT MATTERS To achieve our sustainability goals, it is important to consider the impact of our operations and activities on a broad group of organizations and individuals that we refer to as our “stakeholders”. We define stakeholders to be: any person or group that has direct dealings with the airport, or has influence over or is impacted by airport operation, including those with economic ties to the airport, our surrounding community, our partners and our people.
OUR STAKEHOLDERS The following figure outlines the stakeholder groups that we regularly engage with to ensure the future success of our airport.
Passengers
Analysts and Bondholders
Industry
Media
GovernmentsCommunity
Residents
Airport Facilitation
Agencies
Airport Service Providers
GTAA and Airport
Employees
GTAA
“We welcome students from over 165 countries and maintain more than 280 international partnerships. Toronto Pearson, as a globally connected airport, helps to make this a reality.” MAMDOUH SHOUKRI, President and Vice-Chancellor, York University
GTAA ANNUAL REPORT 2014 89

HOW WE ENGAGE AND WHAT WE LEARNIn any relationship, including GTAA’s relationship with our stakeholders, perceptions, expectations and preferences can change. Consequently, we regularly evaluate and modify the ways in which we engage with stakeholders, making sure we reflect their preferences in order to effectively gather and report on their top priorities and concerns. This information is then incorporated in our broader corporate sustainability program goals and everyday initiatives.
The following tables show how we engage with our stakeholders on topics relating to corporate sustainability, how often we engage with them, and the topics that have been raised with them in 2014.
Passengers The GTAA exists to serve passengers, and the number that we serve is expected to grow by approximately 3% per year over the next 20 years. As their numbers grow, their expectations in the medium and long term are also likely to change. These factors, coupled with the focus on service captured in our Mission statement “Passengers Are Our Passion”, compel us to continually look for ways to maintain and improve our relationship with this group.
In 2014, we handled 2,507 complaints, 819 compliments and 1,993 inquiries through our customer feedback system. While the total complaints, led by baggage handling issues, were up during 2014, the total compliments also rose by 81%. While our central management system ensures that we address all passenger comments and complaints in a timely and appropriate way, we are also considering new technologies and approaches so Toronto Pearson and our partners can better meet passengers’ needs and expectations.
How We Engage How Often Topics
Passenger surveys, Airport Service Regularly Customer experience Quality (ASQ) Customer service Operational excellence Infrastructure
Web portal for passengers, visitors and the community (e.g., GTAA.com, Twitter, blogging) Continuously Various topics
Greater Toronto Airports Authority EmployeesWe directly employ 1,200 staff from the Greater Toronto Area and we understand the essential contribution they make to our organization. To establish an open, welcoming culture, which encourages ideas and attitudes that will help us achieve our strategic goals, we engage with employees on an ongoing basis. They are encouraged to share their thoughts on how we can improve in an annual survey and are kept informed of relevant events and initiatives via newsletters and our intranet. To further enhance employee engagement and strengthen our culture, we hold events and social activities throughout the year.
How We Engage How Often Topics
Updates on corporate intranet Continuously Upcoming events, staffing changes, operational updates and policy changes
All-employee meetings Biannually Topics of a timely nature
People Leaders Forum Quarterly Updating supervisory staff on company changes and initiatives
Employee opinion surveys Annually Engagement surveys
Anonymous complaints and “whistle-blowing” Continuously Special confidential “hotline” available to staff
Evening of Excellence Annually Recognition of corporate and staff accomplishments
Employee social activities Quarterly Fun, enjoyment and staff get-together (e.g., BBQ, Winterfest, holiday events)
Community tours (airside and terminal) 140 tours Airport operations
90 GTAA ANNUAL REPORT 2014

Airport Employees – Toronto Pearson Employee CommunityIn addition to our direct employees, we serve a community of approximately 40,000 people who work at Toronto Pearson. We consider all of these employees to be airport ambassadors and rely upon them to provide high-quality customer service, while operating in a way that is safe and considerate to their peers and our passengers. During the year our Community Relations team develops programs, events and initiatives to foster a sense of collegiality and cooperation among airport employees.
How We Engage How Often Topics
General community engagement email Continuously Operational updates, events, initiatives, volunteer opportunities, campaigns and discounts
Employee Updates section of the Toronto Pearson website Continuously
Email newsletter Monthly Various topics
Cross-functional airport working groups Monthly
Outreach/intercept events Periodically
Outreach – town halls and meetings Periodically General awareness and outreach
Large-scale community events Periodically Education and outreach
Airport employee tours (airside and terminal) On request Education and outreach
Airport Service ProvidersOur partners, including Toronto Pearson’s tenants as well as longer-term strategic partners, are essential to the success of our operations and our broader passenger and customer services. The GTAA’s Customer and Terminal Services department has a Terminal Operations team, consisting of Manager Operations – Terminals, Tenant Service Representatives, Passenger Service Representatives, Public Safety Officers, a Welcome Team and Operational Support Representatives, who are all available to take care of day-to-day operational and customer service needs and issues.
How We Engage How Often Topics
Airline Consultative Committee Quarterly Rates and charges, airport master plan, building infrastructure, development proposals and changes in policy and procedures
Airline consultative committee – Technical Quarterly Reviewing and endorsing building programs and enhancement Subcommittee projects exceeding $50 million
Toronto Pearson Facilitation Committee Quarterly Examining problems and proposing solutions arising in connection with aircraft, passengers, baggage, cargo, mail and stores
Airline Consultative Committee – Information Monthly Consulting and reviewing common-use information Technology & Telecommunications technology and telecommunications services to meet Subcommittee strategic objectives and operational needs
Commercial Affairs Subcommittee Monthly Commercial matters involving the air carrier and ground handler community
Passenger Operations Subcommittee Monthly Performance metrics, terminal projects, common-use services, customer and service initiatives
Airside Operations Subcommittee Monthly Ground handler performance, deicing, service levels, traffic management, baggage, Foreign Object Debris (FOD) program
Irregular Operations Subcommittee Biweekly Interruption to normal flow of passengers, aircraft or baggage. Day-Of communication/information flow and contingency plans
One-on-one meetings Regularly Various topics
GTAA ANNUAL REPORT 2014 91
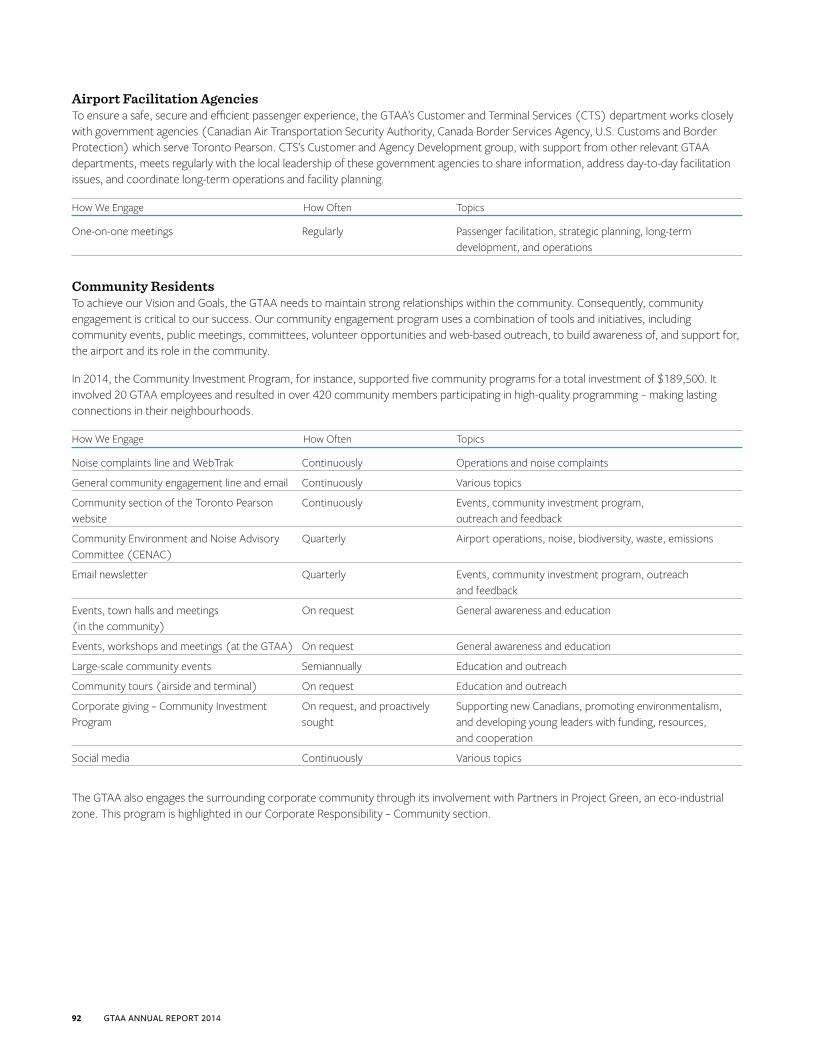
Airport Facilitation AgenciesTo ensure a safe, secure and efficient passenger experience, the GTAA’s Customer and Terminal Services (CTS) department works closely with government agencies (Canadian Air Transportation Security Authority, Canada Border Services Agency, U.S. Customs and Border Protection) which serve Toronto Pearson. CTS’s Customer and Agency Development group, with support from other relevant GTAA departments, meets regularly with the local leadership of these government agencies to share information, address day-to-day facilitation issues, and coordinate long-term operations and facility planning.
How We Engage How Often Topics
One-on-one meetings Regularly Passenger facilitation, strategic planning, long-term development, and operations
Community ResidentsTo achieve our Vision and Goals, the GTAA needs to maintain strong relationships within the community. Consequently, community engagement is critical to our success. Our community engagement program uses a combination of tools and initiatives, including community events, public meetings, committees, volunteer opportunities and web-based outreach, to build awareness of, and support for, the airport and its role in the community.
In 2014, the Community Investment Program, for instance, supported five community programs for a total investment of $189,500. It involved 20 GTAA employees and resulted in over 420 community members participating in high-quality programming – making lasting connections in their neighbourhoods.
How We Engage How Often Topics
Noise complaints line and WebTrak Continuously Operations and noise complaints
General community engagement line and email Continuously Various topics
Community section of the Toronto Pearson Continuously Events, community investment program, website outreach and feedback
Community Environment and Noise Advisory Quarterly Airport operations, noise, biodiversity, waste, emissions Committee (CENAC)
Email newsletter Quarterly Events, community investment program, outreach and feedback
Events, town halls and meetings On request General awareness and education (in the community)
Events, workshops and meetings (at the GTAA) On request General awareness and education
Large-scale community events Semiannually Education and outreach
Community tours (airside and terminal) On request Education and outreach
Corporate giving – Community Investment On request, and proactively Supporting new Canadians, promoting environmentalism, Program sought and developing young leaders with funding, resources, and cooperation
Social media Continuously Various topics
The GTAA also engages the surrounding corporate community through its involvement with Partners in Project Green, an eco-industrial zone. This program is highlighted in our Corporate Responsibility – Community section.
92 GTAA ANNUAL REPORT 2014

Governments The GTAA takes a progressive view on how it interacts with the communities that surround the airport. In the year 2014, the GTAA conducted 350 meetings with political stakeholders at the federal, provincial, regional and municipal levels of government. This outreach provided the opportunity to discuss the growth of our business, operations and impact, as well as our community relations programming. Our lobbying activities are registered in accordance with all applicable regulations, and further information relating to specific policy issues is available in the GTAA registrations on the federal, provincial and City of Toronto lobbyist registration websites.
How We Engage How Often Topics
Meetings 350 meetings in 2014 The growth of our business, operations and impact, as well as our community relations programming.
IndustryGTAA is actively involved with organizations including the Canadian Airport Council, Airports Council International, the International Civil Aviation Organization (ICAO) and the International Air Transportation Association (IATA). Through meetings, presentations and other channels, we stay in regular communication with the members and executives of these groups, to make sure that we are informed of, and have the opportunity to address, issues affecting the aviation industry and airports around the world.
How We Engage How Often Topics
Industry association meetings, conferences Regularly Airport operations and impacts and working groups
MediaWe recognize that we have an important role in engaging with the media to reach the public on many matters such as air traffic, weather, economic development and also topics linked to environmental and community responsibility, which includes providing timely updates when incidents occur. During the year, we receive many inquiries from print, broadcast (radio and television) and online media relating to every facet of airport operation and aviation in general. Each inquiry is handled by an appropriate GTAA spokesperson who responds specifically to the issues raised.
How We Engage How Often Topics
Interviews Continuously Operational issues, delays, cancellations, promotions of in-terminal activities
Press releases Continuously Financial results, executive changes, significant operational issues
Analysts and BondholdersEngaging with bondholders and analysts provides us with an opportunity to explain the GTAA story to investors and analysts, who influence the cost and availability of financial capital.
How We Engage How Often Discussion Topics
Speak at Investors’ Conferences Twice per year Activity, financial results, forecasts, capital and operational projects and financing needs
Respond to ad-hoc requests from investors Continuously Activity, financial results, forecasts, capital and operational and analysts projects and financing needs
GTAA ANNUAL REPORT 2014 93
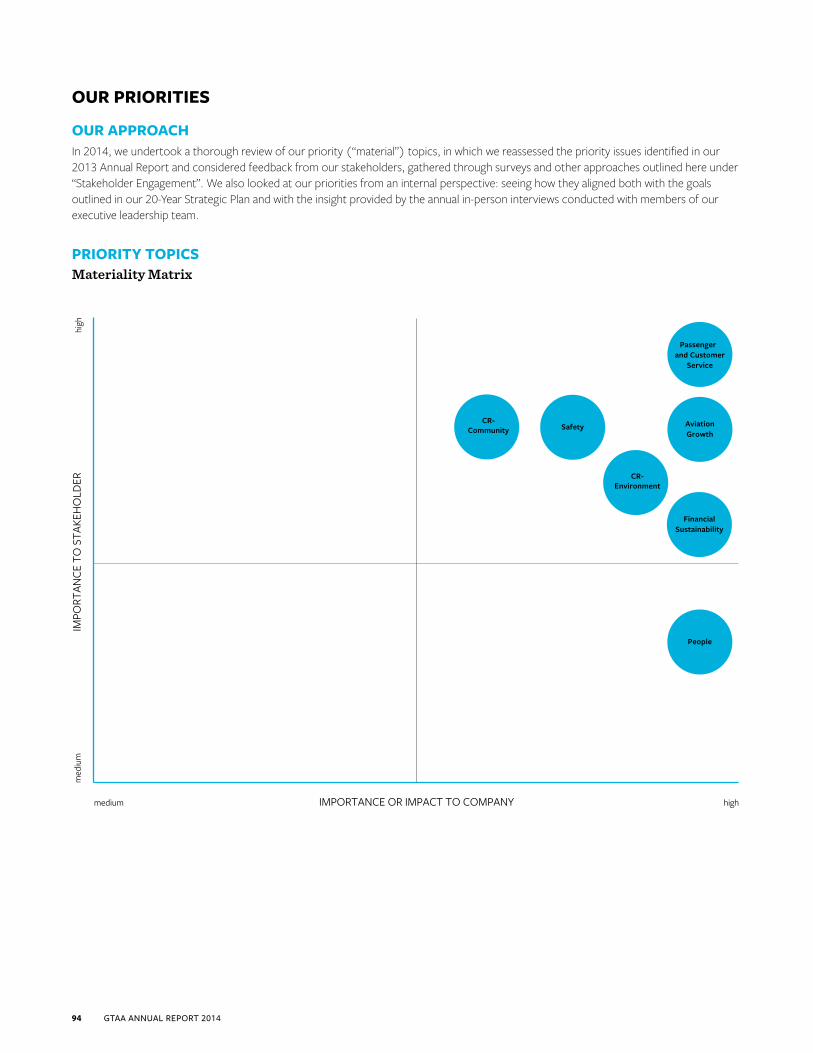
OUR PRIORITIES
OUR APPROACHIn 2014, we undertook a thorough review of our priority (“material”) topics, in which we reassessed the priority issues identified in our 2013 Annual Report and considered feedback from our stakeholders, gathered through surveys and other approaches outlined here under “Stakeholder Engagement”. We also looked at our priorities from an internal perspective: seeing how they aligned both with the goals outlined in our 20-Year Strategic Plan and with the insight provided by the annual in-person interviews conducted with members of our executive leadership team.
PRIORITY TOPICS Materiality Matrix
CR-Community
People
FinancialSustainability
Passenger and Customer
Service
Safety AviationGrowth
IMPORTANCE OR IMPACT TO COMPANY highmedium
high
med
ium
IMPO
RTAN
CE T
O S
TAKE
HO
LDER CR-
Environment
94 GTAA ANNUAL REPORT 2014
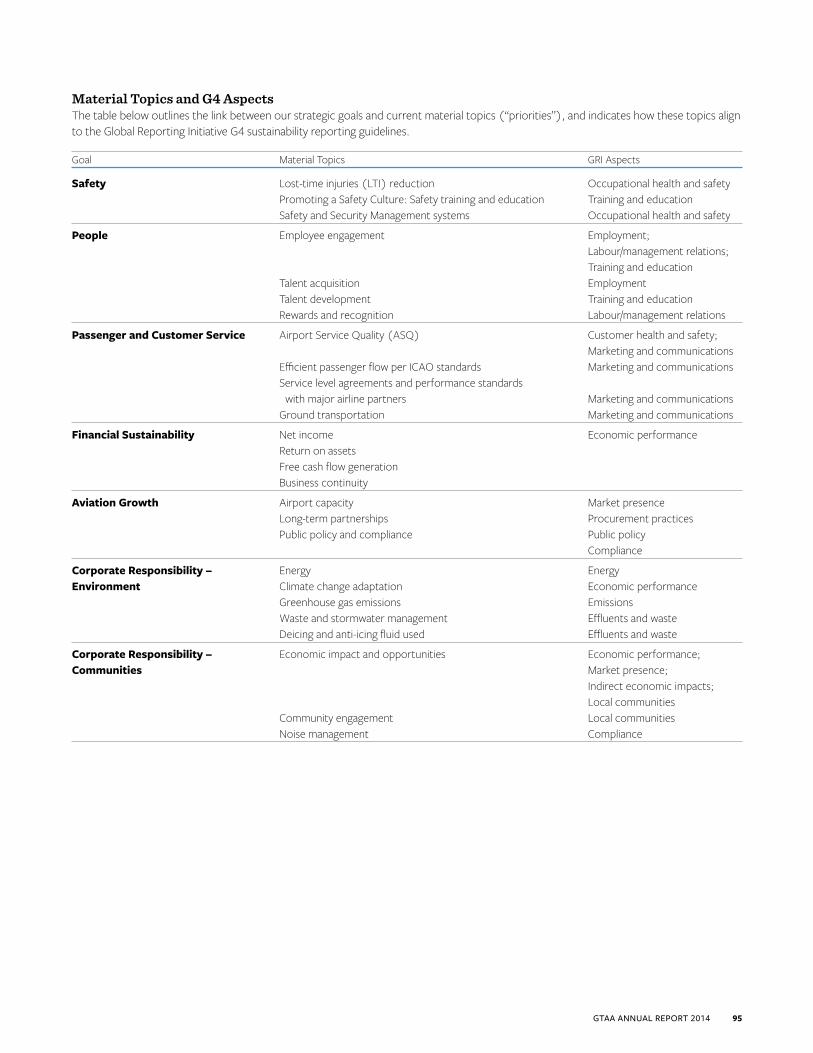
Material Topics and G4 Aspects The table below outlines the link between our strategic goals and current material topics (“priorities”), and indicates how these topics align to the Global Reporting Initiative G4 sustainability reporting guidelines.
Goal Material Topics GRI Aspects
Safety Lost-time injuries (LTI) reduction Occupational health and safety Promoting a Safety Culture: Safety training and education Training and education Safety and Security Management systems Occupational health and safety
People Employee engagement Employment; Labour/management relations; Training and education Talent acquisition Employment Talent development Training and education Rewards and recognition Labour/management relations
Passenger and Customer Service Airport Service Quality (ASQ) Customer health and safety; Marketing and communications Efficient passenger flow per ICAO standards Marketing and communications Service level agreements and performance standards with major airline partners Marketing and communications Ground transportation Marketing and communications
Financial Sustainability Net income Economic performance Return on assets Free cash flow generation Business continuity
Aviation Growth Airport capacity Market presence Long-term partnerships Procurement practices Public policy and compliance Public policy Compliance
Corporate Responsibility – Energy EnergyEnvironment Climate change adaptation Economic performance Greenhouse gas emissions Emissions Waste and stormwater management Effluents and waste Deicing and anti-icing fluid used Effluents and waste
Corporate Responsibility – Economic impact and opportunities Economic performance;Communities Market presence; Indirect economic impacts; Local communities Community engagement Local communities Noise management Compliance
GTAA ANNUAL REPORT 2014 95
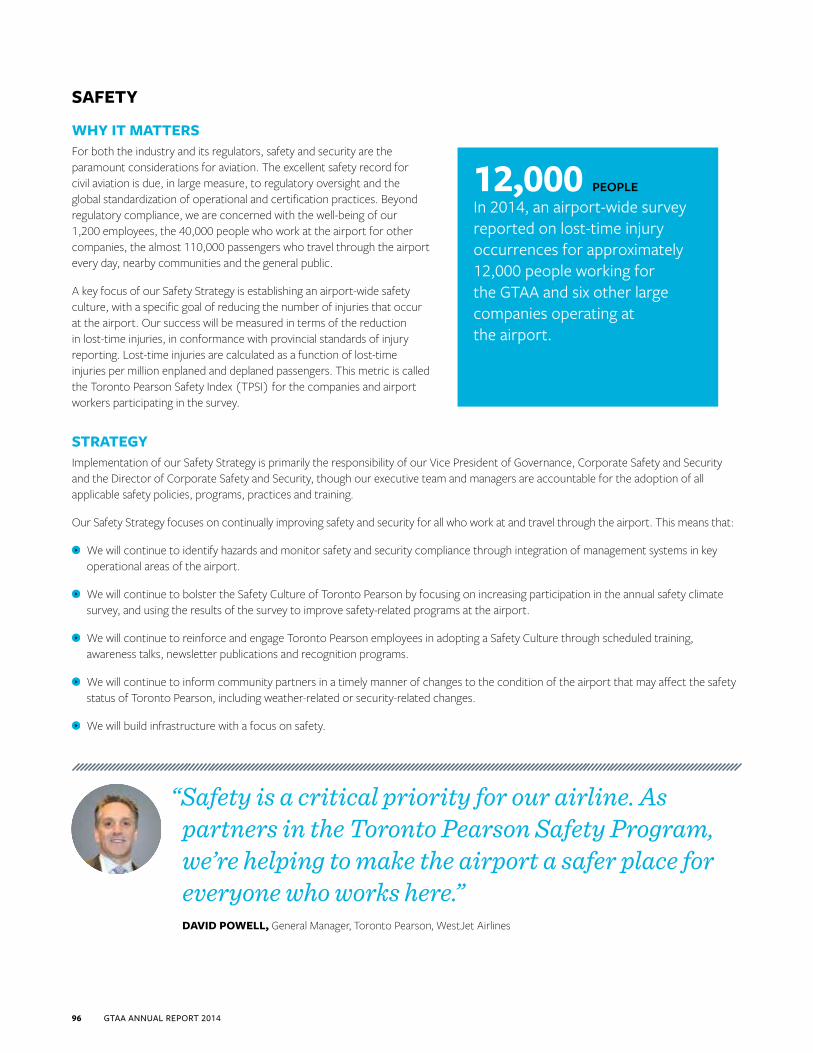
SAFETY
WHY IT MATTERSFor both the industry and its regulators, safety and security are the paramount considerations for aviation. The excellent safety record for civil aviation is due, in large measure, to regulatory oversight and the global standardization of operational and certification practices. Beyond regulatory compliance, we are concerned with the well-being of our 1,200 employees, the 40,000 people who work at the airport for other companies, the almost 110,000 passengers who travel through the airport every day, nearby communities and the general public.
A key focus of our Safety Strategy is establishing an airport-wide safety culture, with a specific goal of reducing the number of injuries that occur at the airport. Our success will be measured in terms of the reduction in lost-time injuries, in conformance with provincial standards of injury reporting. Lost-time injuries are calculated as a function of lost-time injuries per million enplaned and deplaned passengers. This metric is called the Toronto Pearson Safety Index (TPSI) for the companies and airport workers participating in the survey.
STRATEGY Implementation of our Safety Strategy is primarily the responsibility of our Vice President of Governance, Corporate Safety and Security and the Director of Corporate Safety and Security, though our executive team and managers are accountable for the adoption of all applicable safety policies, programs, practices and training.
Our Safety Strategy focuses on continually improving safety and security for all who work at and travel through the airport. This means that:
We will continue to identify hazards and monitor safety and security compliance through integration of management systems in key operational areas of the airport.
We will continue to bolster the Safety Culture of Toronto Pearson by focusing on increasing participation in the annual safety climate survey, and using the results of the survey to improve safety-related programs at the airport.
We will continue to reinforce and engage Toronto Pearson employees in adopting a Safety Culture through scheduled training, awareness talks, newsletter publications and recognition programs.
We will continue to inform community partners in a timely manner of changes to the condition of the airport that may affect the safety status of Toronto Pearson, including weather-related or security-related changes.
We will build infrastructure with a focus on safety.
12,000 PEOPLE
In 2014, an airport-wide survey reported on lost-time injury occurrences for approximately 12,000 people working for the GTAA and six other large companies operating at the airport.
“Safety is a critical priority for our airline. As partners in the Toronto Pearson Safety Program, we’re helping to make the airport a safer place for everyone who works here.”DAVID POWELL, General Manager, Toronto Pearson, WestJet Airlines
96 GTAA ANNUAL REPORT 2014

GOALS AND PERFORMANCETo support our Safety Strategy, we will pursue the Toronto Pearson Safety Program for employees at the airport, working toward a long-term vision of reducing lost time due to injuries to zero. In the near term, as described in the 5-Year Corporate Plan, we have introduced airport-wide safety education and initiatives and targeted a 5% per year reduction in lost-time injuries on a per million passenger basis.
This metric will be extended to include the passenger injuries at Toronto Pearson.
Goals:
Lost time due to injuries (LTI) per million enplaned plus deplaned passengers
2014
5%
REDUCTION
2019
5%
REDUCTION per year, from 2013 levels
2033
0 LOST-TIME injuries vision
GTAA Performance 2010 2011 2012 2013 2014
Lost-time injury frequency 0.84 1.7 1.2 0.74 0.62 (injuries/200,000 hours worked)Male 1.36 0.77 0.92 not availableFemale 0.34 0.43 0.29Lost-time injury severity 15.9 4.35 N/A 2.04 2.07 (hours lost/200,000 hours worked)Male 2.82 2.64 not availableFemale 1.53 0.57 No lost-time injuries (cases) 75 65 57 79 142Male 41 71 82Female 16 8 60Lost-time injuries (cases) 10 20 14 9 34Male 9 8 28Female 5 1 6
Improving Safety by Engaging with Our People and PartnersEvery year, the GTAA surveys its employees and airport partners to identify potential safety and security risks at the airport, as well as opportunities for improvement.
Last year, more than 12,000 people participated in the Toronto Pearson Safety Index survey and we anticipate that over 23,000 will take part in 2015. This high level of participation adds significant value to the insights that the survey provides.
“Toronto Pearson has a growing base of passengers, partners and employees, and a significant regional impact,” notes Jennifer Sullivan, Director of Corporate Safety and Security. “We need to be able to ensure the continued safety of the airport’s operations and activities. The feedback from this survey allows us to see where we can improve our practices today, while helping us to be even better prepared for the future.”
GTAA ANNUAL REPORT 2014 97
PEOPLE
WHY THEY MATTERThe GTAA is a service business, and like every business in the service sector, our people are critical to our success. We know that achieving our strategic vision will depend, in large measure, on an engaged, high-performing workforce. Each one the 40,000 people working at the airport must recognize that they are airport ambassadors, and bring this understanding to everything they do. The goal of our People Strategy is to be in the top quartile of high-performing organizations, and to reach that we have to be able to attract, develop and retain the right talent while fostering a high-performance culture.
STRATEGY The GTAA’s Vice President of People and Culture is responsible for our People Strategy. The ultimate goal of our People Strategy is to help position the GTAA among the top quartile of high-performing organizations. The newly adopted strategy guides our efforts to attract, develop, engage, retain and reward high-performing employees in order to build a workforce – and a workforce culture – that is focused on delivering superior service and operational excellence. To support this objective, we have adopted a robust performance management and rewards program that recognizes and incentivizes top talent, while reinforcing personal accountability. We are also working closely with our unions on developing new performance rewards and recognition programs for the unionized employees.
Successfully transitioned to an Occupational Health and Safety Management System
Launched an online course open to all employees on “Creating a Respectful Workplace”
“Rules” to help reach our goalsIn 2014, we finalized our “Rules of the Runway” – our foundation for building a high-performance culture at the GTAA, as well as the essence of our People Strategy.
The four “Rules of the Runway” should be reflected in all GTAA employee interactions, particularly with colleagues and passengers, and also guide our decision-making. As they become an essential part of the way we do things, they will help align our workforce and culture with the GTAA’s mission: Passengers Are Our Passion.
The “Rules of the Runway”:RESULTS FIRST – SAFETY ALWAYS• Uphold passenger service and operational excellence while ensuring safety for both passengers and employees of
the GTAA.
ACT NOW – BE TRANSPARENT – BE ACCOUNTABLE• Conduct business in a transparent and responsible manner and be held accountable to both passengers and employees.
WIN AS A TEAM• Understand that the success of the GTAA depends on teamwork and collaboration, both among employees and
business partners.
RELATIONSHIPS MATTER • Respect each other, our community and our passengers in strengthening our relationships at all times.
To ensure that clear expectations and shared goals lead to improved performance throughout the GTAA, our Vice President of People and Culture is working with other Vice Presidents and Directors on understanding best practices within their respective areas.
“Whether you lead people or not you can still be a leader in this organization,” notes Nicole Desloges, Vice President of People and Culture. “You can act as a team member or “champion” to influence people where there are opportunities for us to improve.”
98 GTAA ANNUAL REPORT 2014
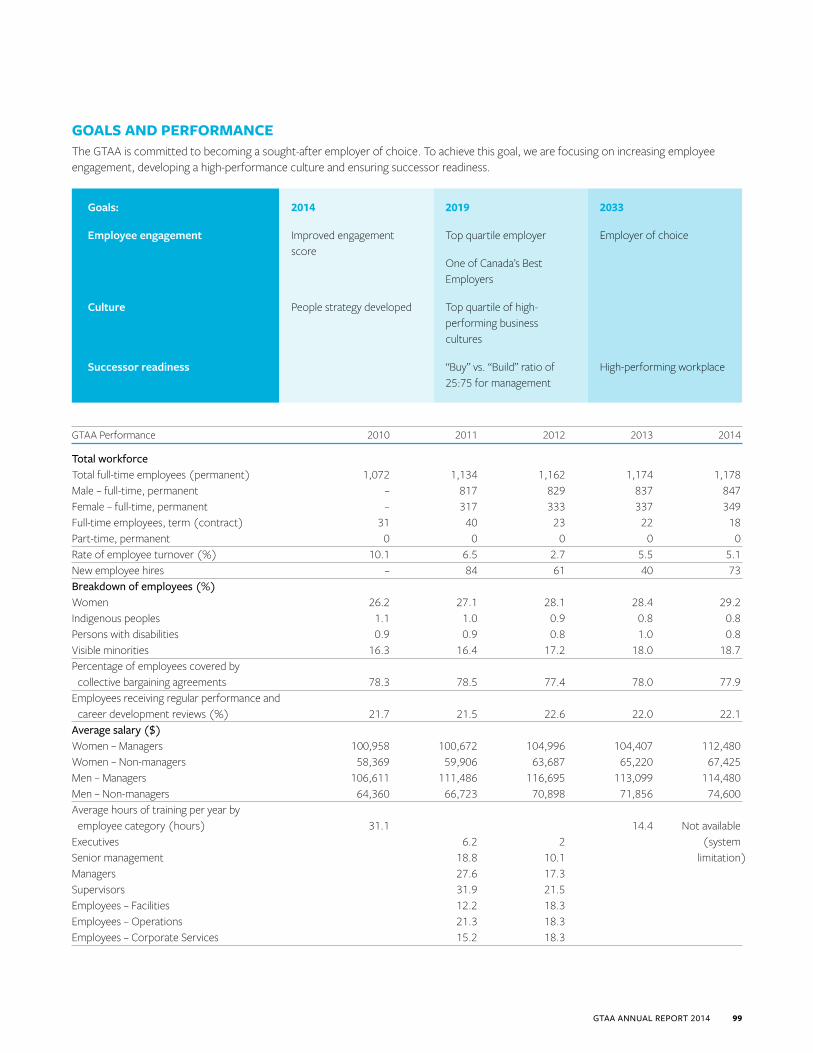
GOALS AND PERFORMANCEThe GTAA is committed to becoming a sought-after employer of choice. To achieve this goal, we are focusing on increasing employee engagement, developing a high-performance culture and ensuring successor readiness.
Goals:
Employee engagement
Culture
Successor readiness
2014
Improved engagement score
People strategy developed
2019
Top quartile employer
One of Canada’s Best Employers
Top quartile of high-performing business cultures
“Buy” vs. “Build” ratio of 25:75 for management
2033
Employer of choice
High-performing workplace
GTAA Performance 2010 2011 2012 2013 2014
Total workforceTotal full-time employees (permanent) 1,072 1,134 1,162 1,174 1,178Male – full-time, permanent – 817 829 837 847Female – full-time, permanent – 317 333 337 349Full-time employees, term (contract) 31 40 23 22 18Part-time, permanent 0 0 0 0 0Rate of employee turnover (%) 10.1 6.5 2.7 5.5 5.1New employee hires – 84 61 40 73Breakdown of employees (%)Women 26.2 27.1 28.1 28.4 29.2Indigenous peoples 1.1 1.0 0.9 0.8 0.8Persons with disabilities 0.9 0.9 0.8 1.0 0.8Visible minorities 16.3 16.4 17.2 18.0 18.7Percentage of employees covered by collective bargaining agreements 78.3 78.5 77.4 78.0 77.9Employees receiving regular performance and career development reviews (%) 21.7 21.5 22.6 22.0 22.1Average salary ($)Women – Managers 100,958 100,672 104,996 104,407 112,480Women – Non-managers 58,369 59,906 63,687 65,220 67,425Men – Managers 106,611 111,486 116,695 113,099 114,480Men – Non-managers 64,360 66,723 70,898 71,856 74,600Average hours of training per year by employee category (hours) 31.1 14.4 Not availableExecutives 6.2 2 (systemSenior management 18.8 10.1 limitation)Managers 27.6 17.3Supervisors 31.9 21.5Employees – Facilities 12.2 18.3 Employees – Operations 21.3 18.3Employees – Corporate Services 15.2 18.3
GTAA ANNUAL REPORT 2014 99
PASSENGER AND CUSTOMER SERVICE
WHY IT MATTERSThe GTAA’s commitment to delivering exceptional service as part of an outstanding passenger experience is captured in our mission statement: “Passengers Are Our Passion.” As the operator of Toronto Pearson, the GTAA plays a critical role in providing service to both passengers and to our customers, the airlines and other businesses located at Toronto Pearson.
We also work closely with our partners, such as the Canadian Air Transport Security Agency (CATSA), the Canada Border Services Agency (CBSA) and United States Customs and Border Protection (CBP), to ensure that everything at the airport runs as smoothly and efficiently as possible. Maintaining clear communications and strong relationships with our customers and partners is a priority for the GTAA, and an essential part of meeting our primary strategic goals.
Ultimately, we consider ourselves as the curator of the passenger experience and, with our customers and partners, we work toward the shared goals of making travel convenient and enjoyable, and establishing Toronto Pearson as the airport of choice for travellers.
STRATEGY The GTAA’s Passenger and Customer Service Strategy is principally the responsibility of our Vice President of Customer and Terminal Services. However, to ensure that passengers and customers are always considered in conjunction with other operational priorities, the strategy is developed and implemented in close collaboration with other departments, including Airport Planning and Technical Services, People and Culture, Stakeholder Relations and Communications and Information Technology Management.
Our long-term goal is to engage all of our service delivery partners in order to improve the end-to-end passenger experience. In the near term, we are working to enhance the quality of the passenger experience within the airport’s terminals, with a focus on two areas:
Flow – Efficient, predictable passenger and aircraft flows are essential to delivering consistently superior passenger experiences. By improving our processes and eliminating traffic bottlenecks to reduce wait times, we will make it easier and faster for people to move through our terminal. ICAO standards for passenger flow within terminals will be used as the measure of our performance. Outside the terminal, as air passenger and cargo traffic grow, we are also developing the airport’s groundside infrastructure to ensure efficient surface transport to and from Toronto Pearson. Finally, we are continually working to eliminate delays by achieving reliable operations in all weather conditions.
Services, atmosphere and amenities – We will work with our customers and partners to develop excellent food, beverage, retail, parking and other service offerings for passengers and visitors. At the same time, we will set and meet high service standards for cleanliness, lighting, space, and wait times, which includes improving times on baggage delivery and reducing arrival gate holds for aircraft. By helping to enhance the quality of service provided throughout the airport, the Passenger and Customer Service Plan will contribute to bolstering our reputation with passengers and to generating non-aeronautical revenues required to support the Financial Plan.
Launched the Toronto Pearson smartphone app to make travel planning easier
Our Airport Service Quality (ASQ) score and ranking have improved from the previous year
100 GTAA ANNUAL REPORT 2014

GOALS AND PERFORMANCEOver the medium and long term, we intend to meet or maintain the following key metrics:
Goals:
Airport Service Quality (ASQ) score – in size class
Passenger flow
2019
Top 10 of world airports (in size class)
Consistently meet ICAO standards
2033
Top 5 of world airports (in size class)
Consistently meet ICAO standards
Additional goals have been established for the short term (2014/15) to improve passenger and customer service:
Free baggage carts (achieved)
Volunteer program
Improved inbound baggage delivery
Reduced arrival gate holds
Improved directional signage
New retail offerings
GTAA Performance 2010 2011 2012 2013 2014
ASQ score and rank 4.03 4.02 4.07 4.05 4.06 (25–40M passenger class size) 11th 11th 15th 13thNon-aeronautical revenues (% total revenue) – 24.9% 26.2% 27.9% 30.1%
App helps passengers manage travel – in any weatherThe GTAA has developed a smartphone app that is improving the airport experience by making it easier for passengers to manage their travel plans – even in the face of potential weather delays.
The Toronto Pearson International Airport app gives passengers instant access to real time information relating to air travel, including weather conditions, flight status updates, other airport operations, as well as a direct call access to customer support and a forum for feedback on the airport.
In line with our strategy to deliver a better customer experience, we are working to enhance the app to include more accurate and timely push notifications on flight changes and weather delays, information on airport retail providers, and the amenities available to passengers at the airport.
“We want to invest more in innovation that will improve how we operate our facilities, manage our systems and programs, and provide greater opportunities to our people and our passengers,” notes Martin Boyer, Vice President and Chief Information Officer at GTAA.
GTAA ANNUAL REPORT 2014 101

AVIATION GROWTH
WHY IT MATTERSToronto Pearson is North America’s second-largest international gateway airport, serving approximately 12 million passengers in 2014. Its hub catchment area extends well beyond southern Ontario, as 150 million people, mainly in the northern United States, live within a 90-minute flight from Toronto Pearson.
To realize our vision of “connecting the world through Toronto Pearson”, to manage the challenge of projected growth and to compete with other hub airports for these connecting passengers, the airport must achieve operational excellence in terms of consistency, hassle-free flow and competitive minimum connect times.
STRATEGY Our Chief Executive Officer is responsible for our Aviation Growth Strategy, and he works in collaboration with the executive leadership team and the GTAA’s Board of Directors to ensure that it is incorporated across all business units. To fulfill Toronto Pearson’s role in connecting Canadians and helping Canada to compete globally, the Aviation Growth Strategy aims to support more flights to more international destinations with greater frequency; to provide for hassle-free passenger connections at the airport; and to provide good value to passengers by encouraging air carrier competition. To achieve these goals, the strategy is built around two primary objectives:
Attracting Growth – To maximize returns to Toronto Pearson and the larger community it serves, the GTAA will focus its efforts on serving local markets where there is high travel demand to provide increased connectivity to passengers.
Accommodating Growth – To efficiently manage the challenge of growth, we have developed an Infrastructure Plan, which considers improvements to airfield capacity and efficiency; aircraft, passenger and baggage flow at the terminals; and groundside transportation.
To address the challenge of long-term traffic growth that exceeds Toronto Pearson’s capacity, we are working with the regional airports and ground transportation stakeholders in southern Ontario on developing a Regional Airport and Ground Transportation Strategy.
10-year service agreement signed with Air Canada will support our planned growth and improve our systems and services
Opening of Metrolinx’s Union Pearson (UP) Express during the second quarter of 2015 will provide a fast 25-minute service to Toronto’s Union Station
The expected growth of the economy and the airport’s growing connectivity will contribute to a projected 64 million passengers travelling through Toronto Pearson in 2033.
102 GTAA ANNUAL REPORT 2014
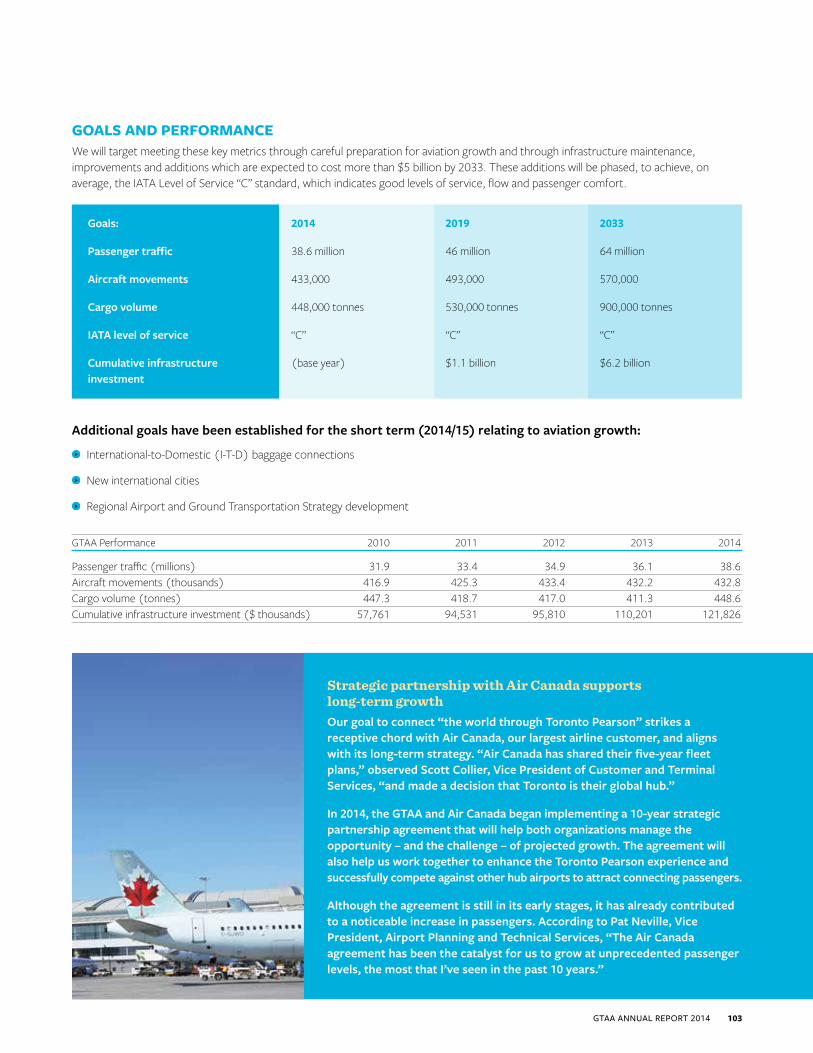
GOALS AND PERFORMANCEWe will target meeting these key metrics through careful preparation for aviation growth and through infrastructure maintenance, improvements and additions which are expected to cost more than $5 billion by 2033. These additions will be phased, to achieve, on average, the IATA Level of Service “C” standard, which indicates good levels of service, flow and passenger comfort.
Goals:
Passenger traffic
Aircraft movements
Cargo volume
IATA level of service
Cumulative infrastructure investment
2014
38.6 million
433,000
448,000 tonnes
“C”
(base year)
2019
46 million
493,000
530,000 tonnes
“C”
$1.1 billion
2033
64 million
570,000
900,000 tonnes
“C”
$6.2 billion
Additional goals have been established for the short term (2014/15) relating to aviation growth:
International-to-Domestic (I-T-D) baggage connections
New international cities
Regional Airport and Ground Transportation Strategy development
GTAA Performance 2010 2011 2012 2013 2014
Passenger traffic (millions) 31.9 33.4 34.9 36.1 38.6Aircraft movements (thousands) 416.9 425.3 433.4 432.2 432.8Cargo volume (tonnes) 447.3 418.7 417.0 411.3 448.6Cumulative infrastructure investment ($ thousands) 57,761 94,531 95,810 110,201 121,826
Strategic partnership with Air Canada supports long-term growthOur goal to connect “the world through Toronto Pearson” strikes a receptive chord with Air Canada, our largest airline customer, and aligns with its long-term strategy. “Air Canada has shared their five-year fleet plans,” observed Scott Collier, Vice President of Customer and Terminal Services, “and made a decision that Toronto is their global hub.”
In 2014, the GTAA and Air Canada began implementing a 10-year strategic partnership agreement that will help both organizations manage the opportunity – and the challenge – of projected growth. The agreement will also help us work together to enhance the Toronto Pearson experience and successfully compete against other hub airports to attract connecting passengers.
Although the agreement is still in its early stages, it has already contributed to a noticeable increase in passengers. According to Pat Neville, Vice President, Airport Planning and Technical Services, “The Air Canada agreement has been the catalyst for us to grow at unprecedented passenger levels, the most that I’ve seen in the past 10 years.”
GTAA ANNUAL REPORT 2014 103

CORPORATE RESPONSIBILITY – ENVIRONMENTAL
WHY IT MATTERSWe have always worked to mitigate the effect of our operations on nearby communities and the environment. So we are very aware that the anticipated growth in passenger volumes and number of flights at Toronto Pearson, as well as the expansion of infrastructure required to accommodate this growth, increases the potential for additional noise and environmental impacts.
To keep our commitments to our neighbours and the environment, we have a robust environmental management system within the Corporate Responsibility Strategy – to guide us on issues ranging from energy usage and sustainable construction options to stormwater quality and GHG emissions – which will help us continue to improve our resource efficiency and minimize our environmental footprint.
STRATEGY The GTAA’s Vice President of Airport Planning and Technical Services is principally responsible for the environment program within our Corporate Responsibility Strategy. Support is provided through collaboration with several groups within the GTAA, including Airport Planning, People and Culture and Information Management. Our Corporate Responsibility Strategy is built upon two critical programs: the Environmental Management Program and the Stakeholder Engagement program, which is described in “Stakeholder Engagement”. The GTAA’s Vice President of Airport Planning and Technical Services is principally responsible for the Environmental Management System. Support is provided through collaboration with several groups within the GTAA, including Airport Planning and Technical Services, People and Culture and Stakeholder Engagement. Guided by our Environmental Management System, the GTAA will continue to focus our efforts on improving energy consumption and greenhouse gas emissions, waste management, and air quality and water quality improvements.
Corporate Knights honours the GTAA in its inaugural Future 40 Responsible Corporate Leaders in Canada awards
Receive the Living City Foundation 2014 Award for Sustainable Communities for our support and participation in the Partners in Project Green (PiPG) eco-zone initiative
Significantly reduce electricity consumption at Terminal 1 through energy conservation initiatives undertaken with Enersource
“Through its guidance and leadership in Partners in Project Green, Toronto Pearson continues stimulating businesses to strengthen and green the region’s economy.”BRIAN DENNEY, CEO, Toronto and Region Conservation Authority
104 GTAA ANNUAL REPORT 2014

GOALS AND PERFORMANCEThe GTAA’s annual environmental goals are identified under our ISO 14001 Environmental Management System. Looking ahead, as part of our Corporate Responsibility Strategy, we will pursue a defined set of environmental goals by 2033.
Goals:
Stormwater
Water quality and spills
Ambient air quality
Solid waste
GHG emissions and climate change
Electricity consumption
Natural gas, gasoline, diesel
2015
Develop and implement an aqueous fire fighting foam (AFFF) management plan
Develop and implement an action plan associated with the Air Quality and Human Health Risk Assessment (2016)
Develop and implement an electric vehicle (EV) charging program
Determine vulnerability and resiliency of Toronto Pearson assets and operations to the projected impacts of climate change in the Greater Toronto Area and ensure appropriate adaptation responses (2017)
Conduct a feasibility study for compressed natural gas utilization on fleet vehicles
2019
Develop a roadmap for the GTAA to achieve zero waste (2017)
Develop a process for and carry out a 20% reduction in GHG emissions below 2006 levels
Reduce consumption by 3,200 MW (2% reduction per year)
2033
Maintain, improve and adapt to climate change
Improved ambient air quality
Zero waste
30% GHG reduction from 2013 levels
80% reduction by 2050 from 2006 levels
Additional goals have been established for the short term (2015–17) relating to environmental performance:
Evaluate corporate and community event practices to identify and implement greening opportunities.
Create an Environmental Awareness Campaign to highlight environmental performance in GTAA public spaces.
GTAA ANNUAL REPORT 2014 105

GTAA Performance 2010 2011 2012 2013 2014
Direct energy consumption Natural gas consumption (GJ) 1,404,993 1,232,384 1,305,484 970,417 900,479Unleaded fuel consumption (litres)1 581,205 536,604 566,197 510,501 485,544Diesel fuel consumption (litres)1 711,583 1,118,385 704,722 1,087,262 1,682,979Indirect energy consumption Total electricity consumption (MWh) 281,344 277,926 277,544 278,943 280,470 1,009,692 GJTotal energy consumption – non-renewable (MJ)2
Electricity consumption 1,009,692,000Heating consumption 900,479Gasoline fuel consumption 16,703Diesel fuel consumption 62,439Cooling consumption 0Subtotal 1,010,671,621Electricity sold 245,934,000Heating sold 33,216,713Cooling sold 0Total energy consumption 732,520,908Energy saved due to conservation and efficiency improvements (GJ)3 97,045 105,938 12,655 24,339 3,050Total direct and indirect greenhouse gas emissions (CO2e tonnes)4 113,134 76,579 74,008 60,022 64,471Emissions of ozone-depleting substances (ODS)Total ODS released (CFC-11 equivalent in tonnes)5 0.0087 0.9567 0.3570 0.0120 0.3530Other significant air emissions (does not include mobile sources)6
VOC emissions (tonnes) 2 20 15 34 6.7NOx emissions (tonnes) 40 37 38 42 43.9SO2 emissions (tonnes) 2 2 2 2 1.7CO emissions (tonnes) 31 42 34 37 37.7Total particulate matter (tonnes) 18 16 6 6 5.9PM2.5 (tonnes) 6 5 5 5 4.9Ambient air quality levels according to pollutant concentrations, by Canada-wide maximum acceptable limits (in parentheses)7
PM2.5 24-hour (30 mg/m3) – – 69 36 31SO2 1-hour (900 mg/m3) – 114 80 94 95SO2 24-hour (300 mg/m3) – 22 15 26 15SO2 annual (60 mg/m3) – 6 5 6 5NO2 1-hour (400 mg/m3) – 172 94 269 172NO2 24-hour (200 mg/m3) – 108 49 169 112CO 1-hour (35,000 mg/m3) – 16,949 9,963 4,959 5,924CO 8-hour (15,000 mg/m3) – 5,840 2,176 1,865 1,958Ozone (O3) 1-hour (160 mg/m3) – 165 148 151 103Ozone (O3) 24-hour (50 mg/m3) – 112 81 83 59Ozone (O3) annual (30 mg/m3) – 48 38 46 25Aircraft and pavement deicing/anti-icing fluid used8 Total glycol – for winter period (m3) 5,179 8,788 4,825 8,367 12,805Potassium acetate – quantity purchased (kg) 283,617 117,960 77,600 307,670 564,000Sodium formate – quantity purchased (kg) 475,057 540,000 470,000 434,000 709,000
106 GTAA ANNUAL REPORT 2014

GTAA Performance 2010 2011 2012 2013 2014
Non-hazardous wasteLandfill – general building (tonnes) 2,649 2,456 2,256 2,054 2,166Landfill – demolition waste (tonnes) 0 292 0 0 0Recycled – general buildings (tonnes) 2,915 3,492 3,801 4,064 4,224Recycled – demolition waste (tonnes) 2,771 171,893 0 0 0Recycled – logistics program shrinkwrap (tonnes) 13 11 12 12 12Hazardous wasteDisposal – total amount (litres) 222,981 633,301 173,739 364,333 184,636Disposal – total amount (kg) 988 2,768 52 46 44Recycled – computers/batteries (tonnes) 25 10 18 65 0.7Remediated and disposed of in landfill – 0 12,838 0 0 0 contaminated soil (tonnes) Significant spills (number) 0 1 0 1 8Wildlife strikes per 100,000 aircraft movements9 – 1.74 1.68 2.83 2.64Quality of stormwater (by CCME Water Quality Guidelines)Total glycol exceedances – 0 0 3 1Total number of glycol samples taken – 411 306 305 193Total BOD exceedances – 18 20 14 13Total number of BOD samples taken – 149 114 114 109
Notes:1 Includes mobile usage.2 GRI G4 Guideline changes for energy reporting.3 Unit change.4 2010 data have been restated to reflect latest emissions information from OPG (published after the release of the GTAA’s 2010 Corporate Responsibility Report). The 2011 estimate is
based on currently available data and may be updated in future. 5 During major chiller overhaul, drained fluid is measured against stated chiller capacity. The original amount placed in the chiller was never recorded.6 Calculations for 2011 include the use of road marking paints for the first time. This has significantly increased the reportable amount of VOCs at the airport.7 New indicator – reporting started in 2011.8 All values are based on the winter season due to their relationship to the winter operations of an airport.9 Transport Canada changed reporting criteria in 2013.
Conserving energy at Toronto PearsonWith the help of Enersource, in 2014 the GTAA participated in several provincial energy conservation initiatives, including the Embedded Energy Manager program and the Retrofit program.
Through salary subsidies provided by the Embedded Energy Manager program, we were able to hire a full-time energy manager who helped identify various ways to reduce energy consumption at Toronto Pearson. One recommendation was to participate in the Retrofit program, which focuses on potential energy savings to be found in the areas of lighting, motors and heating, ventilation and air conditioning (HVAC).
Under the Retrofit program, we replaced 1,100 metal halide light fixtures with state-of-the-art, light-emitting diode (LED) technology. This change is expected to save an estimated 890,000 kWh annually – the equivalent of taking more than 1,000 homes off the grid for an entire month.
The success already achieved through this lighting project has prompted GTAA employees to begin planning for similar provincial conservation projects throughout the rest of the airport.
GTAA ANNUAL REPORT 2014 107
CORPORATE RESPONSIBILITY – COMMUNITY
WHY IT MATTERSThe GTAA is committed to making a positive difference in the lives of employees, passengers, and people in nearby communities. One way we do this is through well-managed growth, which will deliver tangible benefits to stakeholders. We realize, however, that growth at Toronto Pearson has the potential for increased noise and other community impacts.
Community support is essential to keeping our social licence to operate and to our success in achieving our strategic goals. For this reason, the GTAA makes establishing strong, positive relationships with our local communities a top priority. More than 3.3 million people, encompassing 25 federal ridings, live within the vicinity of the airport and are potentially impacted by noise generated by departing and arriving aircraft.
We must have a plan in place, to ensure that governments and communities understand the economic, social and environmental benefits that Toronto Pearson brings to the region and the importance of its continued growth.
STRATEGY Our Stakeholder Engagement program is part of our Corporate Responsibility Strategy and is led by our Vice President of Stakeholder Relations and Communications. Significant collaboration also occurs with Customer and Terminal Services, People and Culture, and other groups within the GTAA to ensure that we continue to establish and maintain positive and constructive relationships with local businesses, governments and residents.
In our engagement with the community, we try to communicate the value and benefit of the airport, while also asking for the community’s feedback to help us improve the airport’s operations. As outlined in the Stakeholder Engagement program, we will:
Communicate issues openly and transparently to address the concerns of the immediate communities, to maintain trust, and to enhance Toronto Pearson’s reputation.
Convey our economic contribution to stakeholders and build awareness and understanding for airport growth, through a continuation and broadening of our outreach program.
Engage regional and national governments and community groups, leveraging all available tools including traditional and social media, public relations, speaking opportunities, and stakeholder and government outreach, to promote the economic impact of Toronto Pearson’s operations on the Canadian economy.
Use clear and transparent engagement tools such as WebTrak – an online service that residents can use to learn about aircraft operations and report airport noise concerns – to seek feedback from communities on critical issues such as noise management.
Continue to engage with everyone who works at Toronto Pearson to build a sense of community and keep them informed of our priorities.
Working with community and government representatives on economic development opportunities in the region through the consultative committee
Actively involved in public communication and engagement through CENAC and public forums to understand and respond to recent noise complaints
Working collaboratively through Partners in Project Green to reduce our region’s environmental footprint and expand community outreach
“I love this airport. If I can share my knowledge in a few words to make someone’s experience less stressful, that’s very rewarding.”BRANDON SMITH, Toronto Pearson Welcome Team Volunteer
108 GTAA ANNUAL REPORT 2014
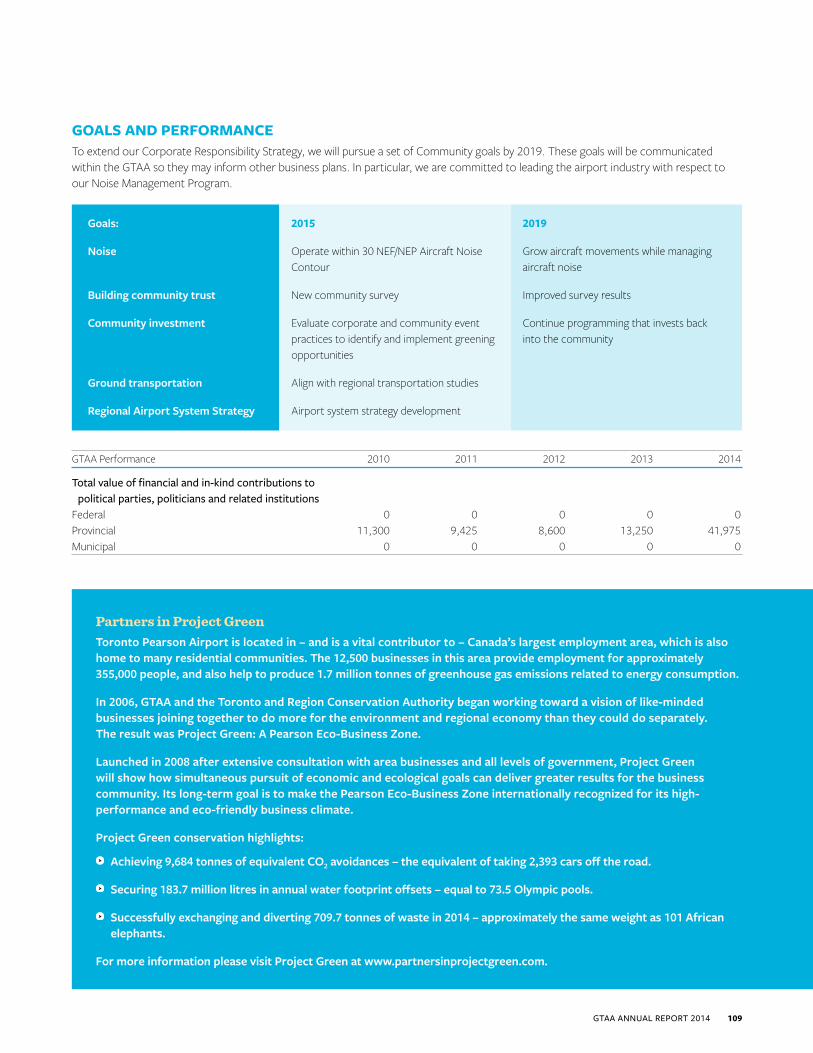
GOALS AND PERFORMANCETo extend our Corporate Responsibility Strategy, we will pursue a set of Community goals by 2019. These goals will be communicated within the GTAA so they may inform other business plans. In particular, we are committed to leading the airport industry with respect to our Noise Management Program.
Goals:
Noise
Building community trust
Community investment
Ground transportation
Regional Airport System Strategy
2015
Operate within 30 NEF/NEP Aircraft Noise Contour
New community survey
Evaluate corporate and community event practices to identify and implement greening opportunities
Align with regional transportation studies
Airport system strategy development
2019
Grow aircraft movements while managing aircraft noise
Improved survey results
Continue programming that invests back into the community
GTAA Performance 2010 2011 2012 2013 2014
Total value of financial and in-kind contributions to political parties, politicians and related institutions Federal 0 0 0 0 0Provincial 11,300 9,425 8,600 13,250 41,975Municipal 0 0 0 0 0
Partners in Project GreenToronto Pearson Airport is located in – and is a vital contributor to – Canada’s largest employment area, which is also home to many residential communities. The 12,500 businesses in this area provide employment for approximately 355,000 people, and also help to produce 1.7 million tonnes of greenhouse gas emissions related to energy consumption.
In 2006, GTAA and the Toronto and Region Conservation Authority began working toward a vision of like-minded businesses joining together to do more for the environment and regional economy than they could do separately. The result was Project Green: A Pearson Eco-Business Zone.
Launched in 2008 after extensive consultation with area businesses and all levels of government, Project Green will show how simultaneous pursuit of economic and ecological goals can deliver greater results for the business community. Its long-term goal is to make the Pearson Eco-Business Zone internationally recognized for its high-performance and eco-friendly business climate.
Project Green conservation highlights:
Achieving 9,684 tonnes of equivalent CO2 avoidances – the equivalent of taking 2,393 cars off the road.
Securing 183.7 million litres in annual water footprint offsets – equal to 73.5 Olympic pools.
Successfully exchanging and diverting 709.7 tonnes of waste in 2014 – approximately the same weight as 101 African elephants.
For more information please visit Project Green at www.partnersinprojectgreen.com.
GTAA ANNUAL REPORT 2014 109

GLOBAL REPORTING INITIATIVE (GRI) INDEX
OUR APPROACHTo make sure that our sustainability reporting is credible and comparable, we have prepared our Annual Report so that it follows the GRI G4 Sustainability Reporting Guidelines in accordance with Comprehensive reporting, as well as the GRI Airport Operator Sector Supplement (AO).
The GRI provides an internationally recognized framework for sustainability reporting, employing principles that are largely aligned with those of the MD&A. This report meets the requirements for “Comprehensive” reporting, as we report on each of the General Standard Disclosures, along with each of the Specific Standard Disclosures corresponding to our material/priority topics.
The Index that follows provides an overview of our 2014 disclosure, which links the GRI disclosures to specific sections of this Annual Report, or to additional public documents, including a “Supplement” which provides a more complete account of our GRI disclosure.
Additional information, including the Supplement and past sustainability reports, is located on the GTAA website (www.torontopearson.com/en/gtaa/corporate-social-responsibility).
GENERAL STANDARD DISCLOSURES Source
Strategy and AnalysisG4-1 CEO statement 20, 21G4-2 Key impacts, risks, and opportunities
Organizational ProfileG4-3 Report the name of the organization 28G4-4 Report the primary brands, products, and services 28G4-5 Report the location of the organization’s headquarters 114G4-6 Report the number of countries where the organization operates 28G4-7 Report the nature of ownership and legal form 28, 43G4-8 Report the markets served 28G4-9 Report the scale of the organization 2–7, 28–31G4-10 Employees and workforce 99G4-11 Report the percentage of total employees covered by collective bargaining agreements 99G4-12 Describe the organization’s supply chain SupplementG4-13 Report any significant changes during the reporting period Supplement
Commitments to External InitiativesG4-14 Precautionary approach/principle 42–45G4-15 List externally developed economic, environmental and social charters, principles, or other initiatives 88, 92, 93, 100G4-16 List memberships of associations and national or international advocacy organizations 92, 93, 107, 109
Identified Material Aspects and BoundariesG4-17 List all entities 28G4-18 Explain the process for defining the report content and the Aspect Boundaries 88G4-19 List all the material Aspects identified in the process for defining report content 95G4-20 For each material Aspect, report the Aspect Boundary within the organization 95G4-21 For each material Aspect, report the Aspect Boundary outside the organization 95G4-22 Report the effect of any restatements of information 107, SupplementG4-23 Report significant changes from previous reporting periods No change
Stakeholder EngagementG4-24 Provide a list of stakeholder groups engaged by the organization 16, 17, 89G4-25 Report the basis for identification and selection of stakeholders with whom to engage 89G4-26 Report the organization’s approach to stakeholder engagement 89–93G4-27 Report key topics and concerns that have been raised through stakeholder engagement 90–93
110 GTAA ANNUAL REPORT 2014
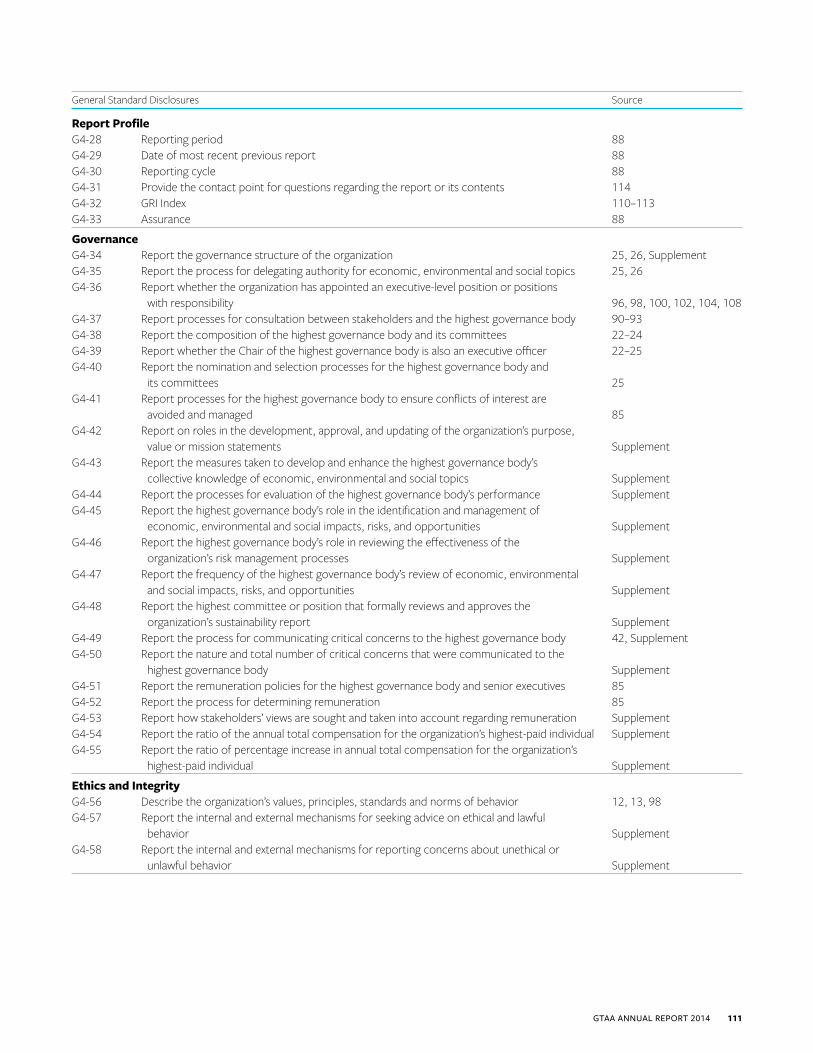
General Standard Disclosures Source
Report ProfileG4-28 Reporting period 88G4-29 Date of most recent previous report 88G4-30 Reporting cycle 88G4-31 Provide the contact point for questions regarding the report or its contents 114G4-32 GRI Index 110–113G4-33 Assurance 88
Governance G4-34 Report the governance structure of the organization 25, 26, SupplementG4-35 Report the process for delegating authority for economic, environmental and social topics 25, 26G4-36 Report whether the organization has appointed an executive-level position or positions with responsibility 96, 98, 100, 102, 104, 108G4-37 Report processes for consultation between stakeholders and the highest governance body 90–93G4-38 Report the composition of the highest governance body and its committees 22–24G4-39 Report whether the Chair of the highest governance body is also an executive officer 22–25G4-40 Report the nomination and selection processes for the highest governance body and its committees 25G4-41 Report processes for the highest governance body to ensure conflicts of interest are avoided and managed 85G4-42 Report on roles in the development, approval, and updating of the organization’s purpose, value or mission statements SupplementG4-43 Report the measures taken to develop and enhance the highest governance body’s collective knowledge of economic, environmental and social topics SupplementG4-44 Report the processes for evaluation of the highest governance body’s performance SupplementG4-45 Report the highest governance body’s role in the identification and management of economic, environmental and social impacts, risks, and opportunities SupplementG4-46 Report the highest governance body’s role in reviewing the effectiveness of the organization’s risk management processes SupplementG4-47 Report the frequency of the highest governance body’s review of economic, environmental and social impacts, risks, and opportunities SupplementG4-48 Report the highest committee or position that formally reviews and approves the organization’s sustainability report SupplementG4-49 Report the process for communicating critical concerns to the highest governance body 42, SupplementG4-50 Report the nature and total number of critical concerns that were communicated to the highest governance body SupplementG4-51 Report the remuneration policies for the highest governance body and senior executives 85G4-52 Report the process for determining remuneration 85G4-53 Report how stakeholders’ views are sought and taken into account regarding remuneration SupplementG4-54 Report the ratio of the annual total compensation for the organization’s highest-paid individual SupplementG4-55 Report the ratio of percentage increase in annual total compensation for the organization’s highest-paid individual Supplement
Ethics and IntegrityG4-56 Describe the organization’s values, principles, standards and norms of behavior 12, 13, 98G4-57 Report the internal and external mechanisms for seeking advice on ethical and lawful behavior SupplementG4-58 Report the internal and external mechanisms for reporting concerns about unethical or unlawful behavior Supplement
GTAA ANNUAL REPORT 2014 111

SPECIFIC STANDARD DISCLOSURES Source
ECONOMICEconomic PerformanceG4-DMA DMA 47, 48, 102, 103G4-EC1 Direct economic value generated and distributed 50G4-EC2 Financial implications and other risks and opportunities for the organization’s activities due to climate change 42, 43G4-EC3 Coverage of the organization’s defined benefit plan obligations 68–71, 99G4-EC4 Financial assistance received from government Supplement
Market PresenceG4-DMA DMA 102, 103G4-EC5 Ratios of standard entry level wage by gender compared to local minimum wage at significant locations of operation SupplementG4-EC6 Proportion of senior management hired from the local community at significant locations of operation SupplementAO1 Total number of passengers annually 103AO2 Annual total number of aircraft movements by day and by night 103AO3 Total amount of cargo tonnage 103
Indirect Economic ImpactsG4-DMA DMA 102, 103, 108, 109G4-EC7 Development and impact of infrastructure investments and services supported 103, SupplementG4-EC8 Significant indirect economic impacts, including the extent of impacts 102, 103, 108, 109
Procurement PracticesG4-DMA DMA SupplementG4-EC9 Proportion of spending on local suppliers at significant locations of operation Supplement
ENVIRONMENTALEnergyG4-DMA DMA 88, 104, 105, 107G4-EN3 Energy consumption within the organization 106G4-EN4 Energy consumption outside of the organization SupplementG4-EN5 Energy intensity SupplementG4-EN6 Reduction of energy consumption 106, SupplementG4-EN7 Reductions in energy requirements of products and services Supplement
EmissionsG4-DMA DMA 88, 104, 105, 107G4-EN15 Direct greenhouse gas (GHG) emissions (Scope 1) 106, SupplementG4-EN16 Energy indirect greenhouse gas (GHG) emissions (Scope 2) SupplementG4-EN17 Other indirect greenhouse gas (GHG) emissions (Scope 3) SupplementG4-EN18 Greenhouse gas (GHG) emissions intensity SupplementG4-EN19 Reduction of greenhouse gas (GHG) emissions SupplementG4-EN20 Emissions of ozone-depleting substances (ODS) 106G4-EN21 NOx, SOx, and other significant air emissions 106AO5 Ambient air quality levels 106
Effluents and WasteG4-DMA DMA 88, 104, 105, 107G4-EN22 Total water discharge by quality and destination SupplementG4-EN23 Total weight of waste by type and disposal method 107G4-EN24 Total number and volume of significant spills 107, SupplementG4-EN25 Weight of transported, imported, exported, or treated waste deemed hazardous under the terms of the Basel Convention SupplementG4-EN26 Identity, size, protected status, and biodiversity value of water bodies and related habitats significantly affected by the organization’s discharges of water and runoff SupplementAO6 Aircraft and pavement deicing/anti-icing fluid used and treated 106
112 GTAA ANNUAL REPORT 2014
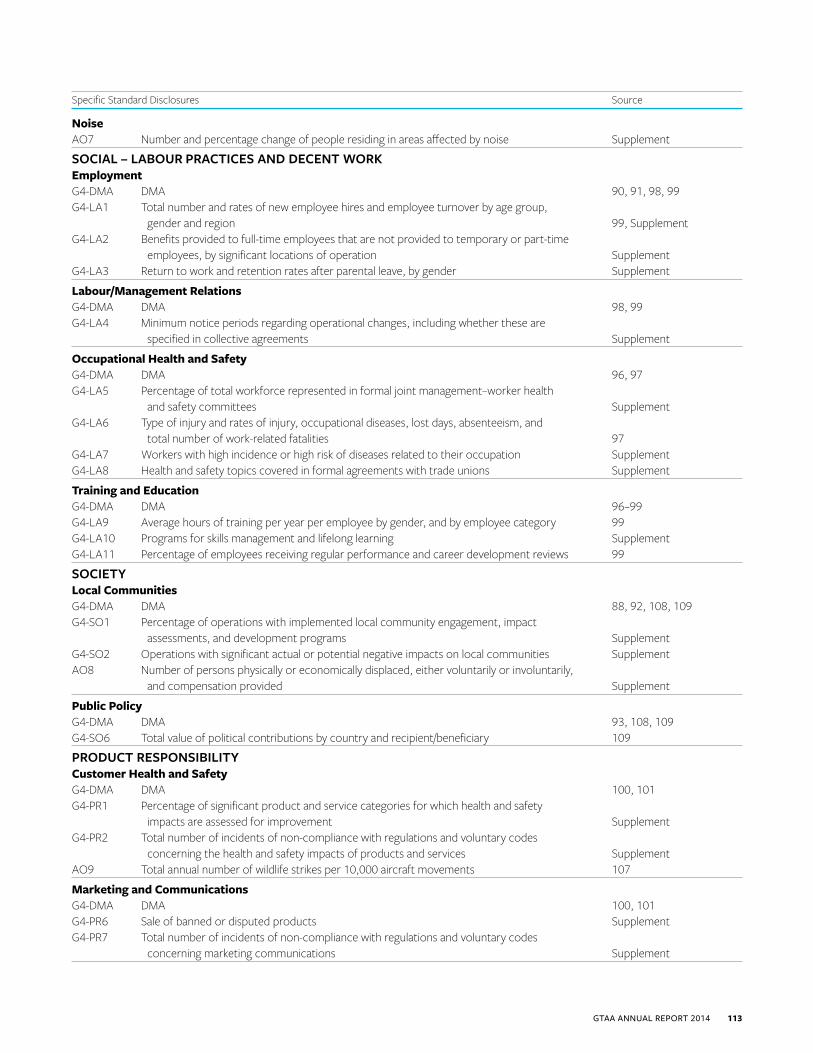
Specific Standard Disclosures Source
NoiseAO7 Number and percentage change of people residing in areas affected by noise Supplement
SOCIAL – LABOUR PRACTICES AND DECENT WORKEmploymentG4-DMA DMA 90, 91, 98, 99G4-LA1 Total number and rates of new employee hires and employee turnover by age group, gender and region 99, SupplementG4-LA2 Benefits provided to full-time employees that are not provided to temporary or part-time employees, by significant locations of operation SupplementG4-LA3 Return to work and retention rates after parental leave, by gender Supplement
Labour/Management RelationsG4-DMA DMA 98, 99G4-LA4 Minimum notice periods regarding operational changes, including whether these are specified in collective agreements Supplement
Occupational Health and SafetyG4-DMA DMA 96, 97G4-LA5 Percentage of total workforce represented in formal joint management–worker health and safety committees SupplementG4-LA6 Type of injury and rates of injury, occupational diseases, lost days, absenteeism, and total number of work-related fatalities 97G4-LA7 Workers with high incidence or high risk of diseases related to their occupation SupplementG4-LA8 Health and safety topics covered in formal agreements with trade unions Supplement
Training and EducationG4-DMA DMA 96–99G4-LA9 Average hours of training per year per employee by gender, and by employee category 99G4-LA10 Programs for skills management and lifelong learning SupplementG4-LA11 Percentage of employees receiving regular performance and career development reviews 99
SOCIETYLocal CommunitiesG4-DMA DMA 88, 92, 108, 109G4-SO1 Percentage of operations with implemented local community engagement, impact assessments, and development programs SupplementG4-SO2 Operations with significant actual or potential negative impacts on local communities SupplementAO8 Number of persons physically or economically displaced, either voluntarily or involuntarily, and compensation provided Supplement
Public PolicyG4-DMA DMA 93, 108, 109G4-SO6 Total value of political contributions by country and recipient/beneficiary 109
PRODUCT RESPONSIBILITYCustomer Health and SafetyG4-DMA DMA 100, 101G4-PR1 Percentage of significant product and service categories for which health and safety impacts are assessed for improvement SupplementG4-PR2 Total number of incidents of non-compliance with regulations and voluntary codes concerning the health and safety impacts of products and services SupplementAO9 Total annual number of wildlife strikes per 10,000 aircraft movements 107
Marketing and CommunicationsG4-DMA DMA 100, 101G4-PR6 Sale of banned or disputed products SupplementG4-PR7 Total number of incidents of non-compliance with regulations and voluntary codes concerning marketing communications Supplement
GTAA ANNUAL REPORT 2014 113
CORPORATE INFORMATION
HEAD OFFICE ADDRESSGreater Toronto Airports Authority3111 Convair Drive, P.O. Box 6031Toronto AMF, Ontario, Canada L5P 1B2T: 416-776-3000F: 416-776-3555TorontoPearson.com
EXECUTIVE TEAMMartin BoyerVice President and Chief Information Officer
Craig BradbrookVice President, Aviation Services
Scott CollierVice President, Customer and Terminal Services
Nicole DeslogesVice President, People and Culture
Howard EngPresident and Chief Executive Officer
Selma M. LussenburgVice President, Governance, Corporate Safety and Security, General Counsel and Corporate Secretary
Hillary MarshallVice President, Stakeholder Relations and Communications
Patrick C. NevilleVice President, Airport Planning and Technical Services
Jill SharlandVice President and Chief Financial Officer
J. Howard BohanVice President, Aviation Services Retired as of May 30, 2014
Brian P. GabelVice President and Chief Financial Officer Retired as of March 31, 2014
Toby C.D. LennoxVice President, Strategy Development and Stakeholder Relations Left as of May 9, 2014
ANNUAL PUBLIC MEETINGThe GTAA’s Annual Public Meeting will be held on May 6, 2015, at 1:30 p.m. at the Sheraton Gateway Hotel.
PUBLIC INFORMATIONRequests for general information should be directed to: Customer Service T: 416-776-9892 Email: [email protected]
AUDITORSPricewaterhouseCoopers LLP Toronto, Ontario
LEAD BANKCanadian Imperial Bank of Commerce Toronto, Ontario
PRINCIPAL LEGAL COUNSELOsler, Hoskin & Harcourt LLP Toronto, Ontario
PUBLICATIONS AVAILABLEThe GTAA offers publications on a variety of topics. Please visit www.torontopearson.com/en/gtaa/publications to view the complete list or email your request to [email protected].
114 GTAA ANNUAL REPORT 2014

We Welcome Your Feedback. If you have any questions or comments regarding this report, or suggestions for topics you’d like to see covered in future reports, please write to us at the address opposite (“Attention: Stakeholder Relations and Communications”) or send an email to [email protected].
Thanks for your interest.
The Greater Toronto Airports Authority (GTAA) was incorporated in 1993 and manages Toronto Pearson International Airport under terms set out in our December 1996 lease with the Canadian federal government.
CONCEPT AND DESIGN The Works Design Communications Ltd.
THEMATIC SECTION WRITING Doug Dolan
PRINTING RR Donnelley
CONTRIBUTING PHOTOGRAPHERS Laura Arsie Michael Mahovlich Lorella Zanetti Andrew Cline

Greater Toronto Airports Authority Toronto Pearson International Airport P.O. Box 6031, 3111 Convair Drive Toronto AMF, Ontario, Canada L5P 1B2
TorontoPearson.com