upstream and downstream approaches to inequalities in...
TRANSCRIPT

1
Upstream and Downstream Approaches to Inequalities in Health:
Challenges and Opportunities
George A. KaplanCenter for Social Epidemiology and Population Health
University of Michigan
©Ken Light CSEPH
Upstream and Downstream Approaches to Inequalities in Health
• The Context– The 800 lb. genome gorilla, health, and health inequalities– Social Epidemiology and Population Health– Socioeconomic inequalities in health
• Some current explorations (briefly)– The downstream/bloodstream side of inequality– The life course and cumulative disadvantage– Communities as crucibles for growing health inequality– Economic equity and health
CSEPH

2
Upstream and Downstream Approaches to Inequalities in Health
• Challenges and Opportunities– Metaphors and Models– Need for Theory– Analytic and Methodologic Pitfalls– Perils and Promise of Interdisciplinarity– Personalizing Populations– Moderating Essentialism– Lost Opportunities
CSEPH
At the end of a century in which the average life expectancy in the United States has increased by nearly thirty years, victory over disease and disability has become an understandably popular and realistic goal. (emphasis added)
Harold Varmus, 1999

3
More than 150 years ago Rudolf Virchow, the great German pathologist, journeyed to Upper Silesia to investigate a great typhus epidemic. In his report to the Prussian government he focused not on a search for the critical bacilli, or the necessary animal vectors for transmission to humans. Instead, he called attention to the social, economic, and cultural factors responsible for the epidemic. In education and full employment, he argued, lay the cures for the prevention of future epidemics..
The primary determinants of disease are mainly economic and social, and therefore its remedies must also be economic and social. Medicine and politics cannot and should not be kept apart.
Geoffrey Rose, The Strategy of Preventive Medicine, 1992

4
Stearns Co, MN LE= 83
Baltimore Co, MD LE=73
41 year range in life expectancy between the shortest (AI males in 6 counties in SD) and the longest (A/PI females in Bergen County, NJ) is equal to 90% of the global range in life expectancy (males in Sierra Leone vs. females in Japan)(Murray et al.,1998)
5
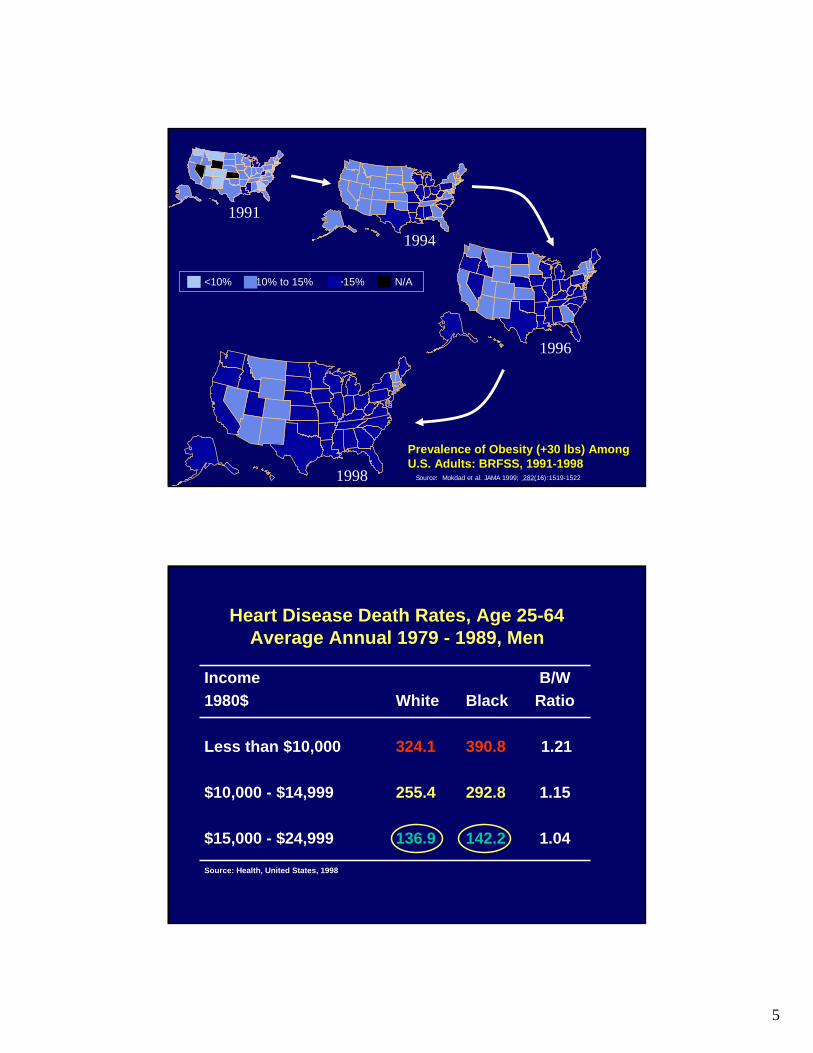
1998
1991
1994
1996
<10% 10% to 15% >15% N/A
Prevalence of Obesity (+30 lbs) Among U.S. Adults: BRFSS, 1991-1998
Source: Mokdad et al. JAMA 1999; 282(16):1519-1522
Heart Disease Death Rates, Age 25-64 Average Annual 1979 - 1989, Men
Income B/W1980$ White Black Ratio
Less than $10,000 324.1 390.8 1.21
$10,000 - $14,999 255.4 292.8 1.15
$15,000 - $24,999 136.9 142.2 1.04
Source: Health, United States, 1998

6
Life
cour
se
Social and Economic Policies
Physical Environment
Institutions (including medical care)
Living Conditions
Social RelationshipsIndividual Risk Factors
Genetic/ConstitutionalFactors
Pathophysiologicpathways
Individual/PopulationHealth
Determinants of Population Health and Health Inequalities
l
Upstream and Downstream Approaches to Inequalities in Health
• The Context– The 800 lb. genome gorilla, health, and health inequalities– Social Epidemiology and Population Health– Socioeconomic inequalities in health
• Some current explorations (briefly)– The downstream/bloodstream side of inequality– The life course and cumulative disadvantage– Communities as crucibles for growing health inequality– Economic equity and health
CSEPH
7
0
50
100
150
200
250
300
1966
1968
1970
1972
1974
1976
1978
1980
1982
1984
1986
1988
1990
1992
1994
1996
1998
2000
2002
Pub
licat
ions
/yea
r
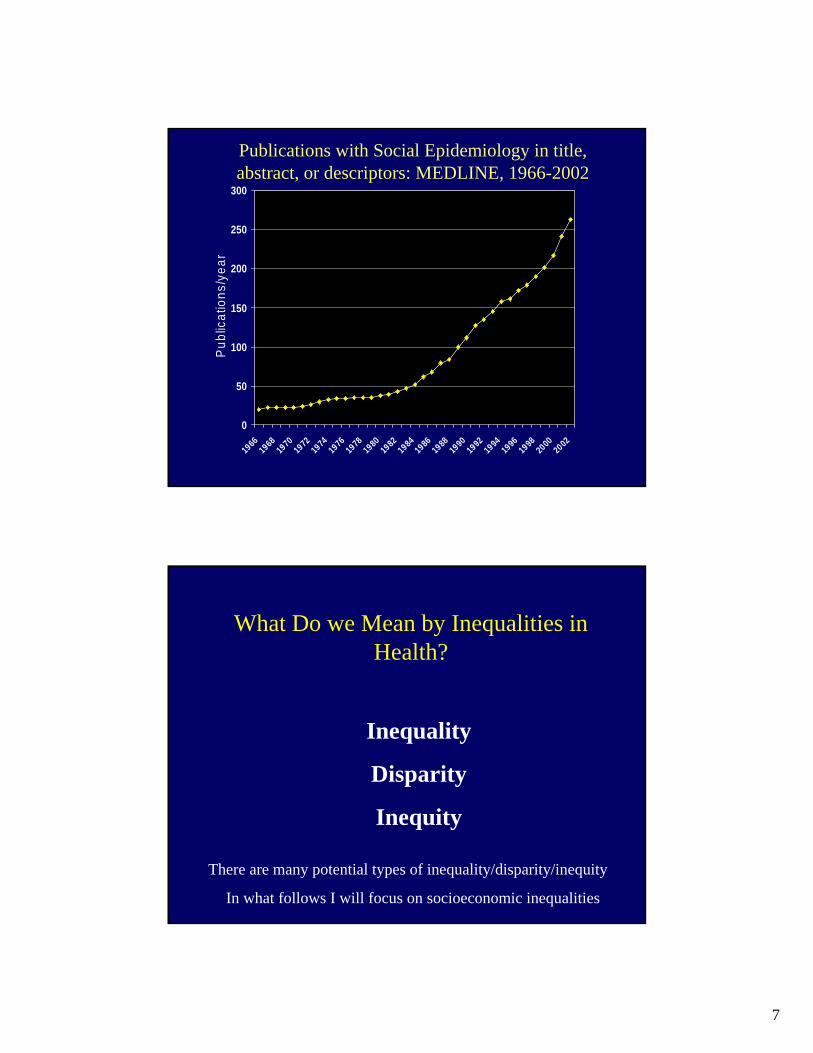
Publications with Social Epidemiology in title, abstract, or descriptors: MEDLINE, 1966-2002
What Do we Mean by Inequalities in Health?
Inequality
Disparity
Inequity
There are many potential types of inequality/disparity/inequity
In what follows I will focus on socioeconomic inequalities

8
Socioeconomic Position and Health
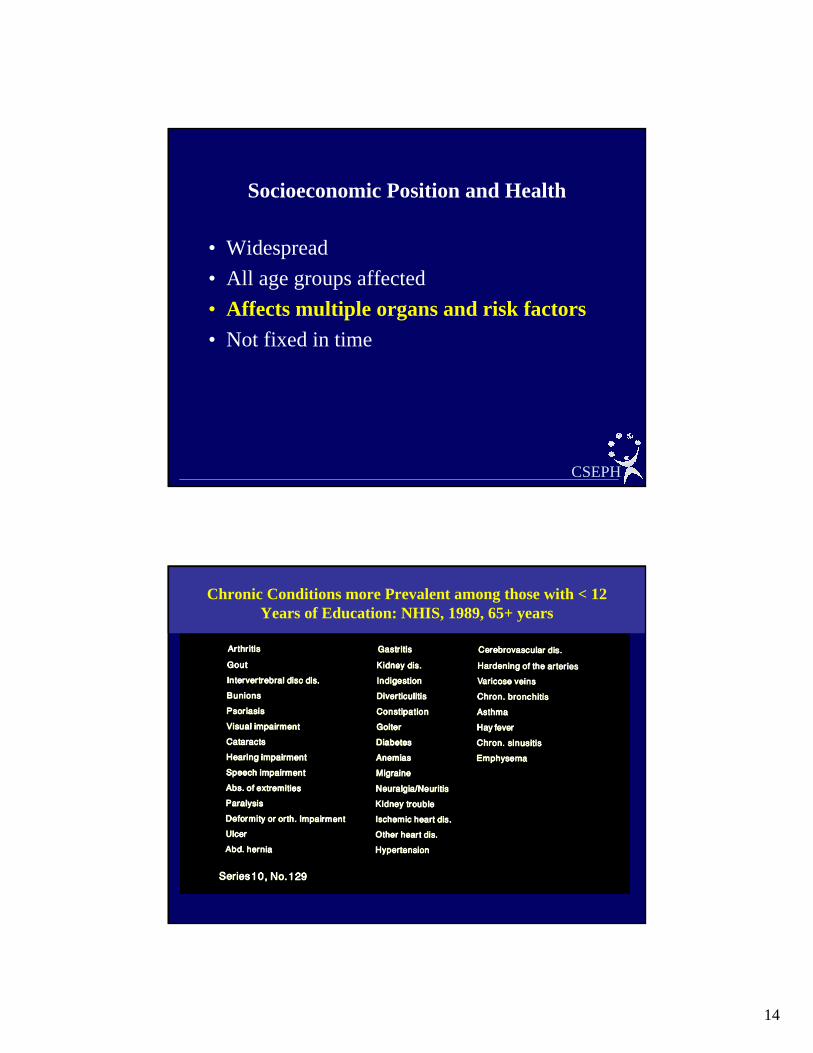
• Widespread• All age groups affected• Affects multiple organs and risk factors• Not fixed in time
CSEPH
Davey Smith et al.

9
Lord, 1955 17
Fatality Rates for Women Passengers on the Titanic
05
101520253035404550
1st Class 2nd Class 3rd Class
Cabin Class
Fata
lity
Rat
e (%
)
18
Number of publications per month with social class, socioeconomic factors, income or poverty listed as
descriptors: MEDLINE search, 1969 through mid-2000.
100
120
140
160
180
200
220
240
1969-72 1973-76 1977-80 1981-84 1985-88 1989-92 1993-96 1997-2000
Year
Publ
icat
ions
/Mon
th
Kaplan and Lynch, AJPH, 1997 + update 6/03/2000

10
Rogot et al., 1992 19
All-cause Mortality by IncomeNLMS, 25+ Years
020406080
100120140
White Male African-American Male
White Female African-American Female
SMR
Income Group < $5,000 $5-9,000 $10-14,999$15-19,999 $20-24,999 $25-49,999 > $50,000
0 50,000 100,000 150,000 200,000
Population Density
Relative Risk (RR) +/- 95% Confidence Interval for beta
RR = 1
Mean Income
0 50,000 100,000 150,000 200,000
1.0
2.0
1.5
2.5
0.5
Relative Risk of Death by Income & the Distribution of Income: USA, NLMS
Household IncomeMeanWolfson, Kaplan,Lynch, Ross, Backlund, BMJ, 1999
Income distribution
Relative risk of death compared to mean income
11
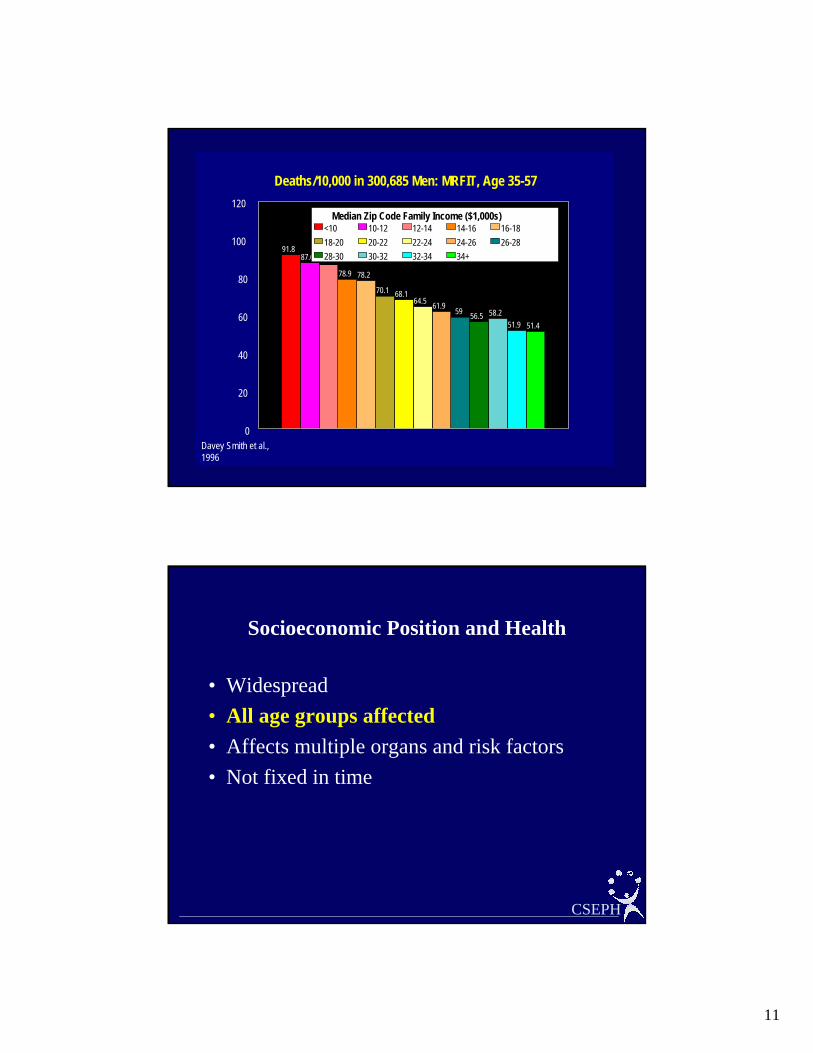
Deaths/10,000 in 300,685 Men: MRFIT, Age 35-57
Davey Smith et al., 1996
91.887.6 86.5
78.9 78.2
70.1 68.164.5 61.9 59 56.5 58.2
51.9 51.4
0
20
40
60
80
100
120Median Zip Code Family Income ($1,000s)
<10 10-12 12-14 14-16 16-1818-20 20-22 22-24 24-26 26-2828-30 30-32 32-34 34+
Socioeconomic Position and Health
• Widespread• All age groups affected• Affects multiple organs and risk factors• Not fixed in time
CSEPH

12
9.9
17.3
12.7
5.76.5
14.8
6.0
7.9
5.55.1
12.3
5.9 5.75.1
4.2
11.4
5.44.0
0
2
4
6
8
10
12
14
16
18
20
White, NH Black, NH Hispanic AmInd/AKNat Asian/PI
<12 12 13-15 >15
Infant Mortality Rates by Years of Education:United States, 1995, Mother 20+ years of age
Stunting* by Age and Poverty Status
USDHHS, 1986
12.9
6.87.4
5.23.9 3.7
2-5 6-11 12-17
Age
0.0
2.0
4.0
6.0
8.0
10.0
12.0
14.0
16.0Percent
Poverty Non-Poverty
*height<5th percentile
13
0
1
2
3
4
5
6
7
8
All White Af-Am
<$20K$20-29.9K$30-39.9K$40K+
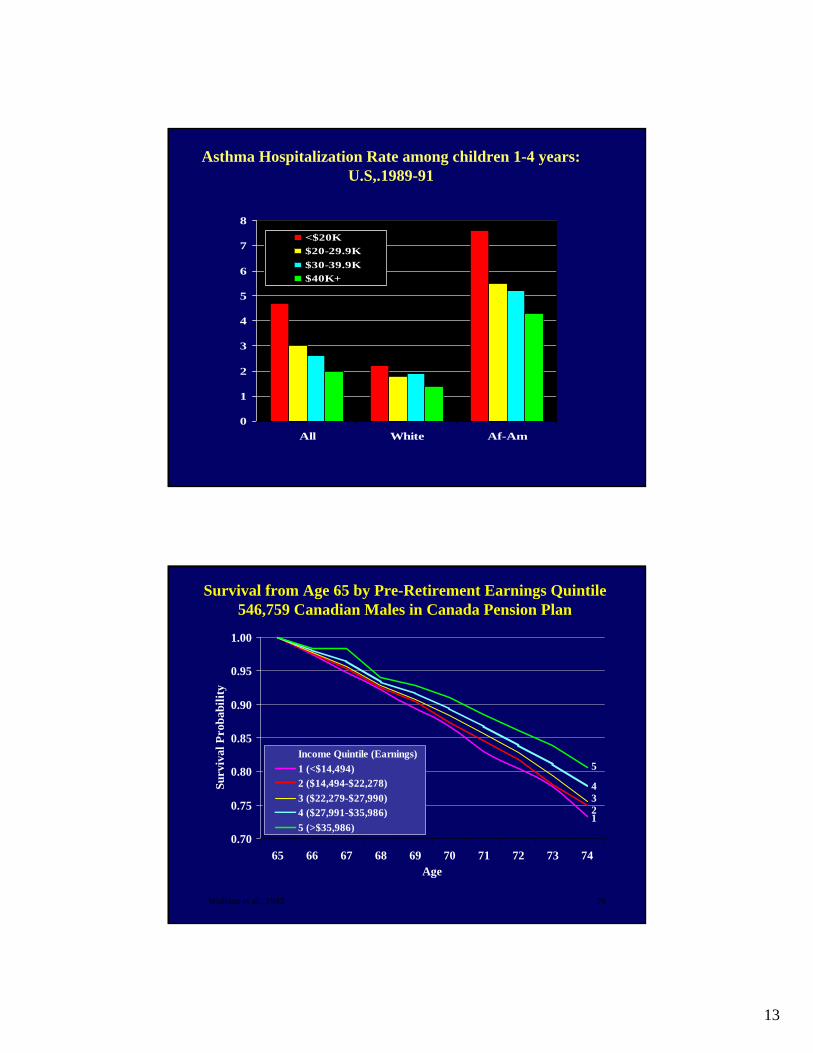
Asthma Hospitalization Rate among children 1-4 years: U.S,.1989-91
Wolfson et al., 1993 26
Survival from Age 65 by Pre-Retirement Earnings Quintile546,759 Canadian Males in Canada Pension Plan
0.70
0.75
0.80
0.85
0.90
0.95
1.00
65 66 67 68 69 70 71 72 73 74Age
Surv
ival
Pro
babi
lity
Income Quintile (Earnings)1 (<$14,494)2 ($14,494-$22,278)3 ($22,279-$27,990)4 ($27,991-$35,986)5 (>$35,986)
1234
5
14
Socioeconomic Position and Health
• Widespread• All age groups affected• Affects multiple organs and risk factors• Not fixed in time
CSEPH
Chronic Conditions more Prevalent among those with < 12 Years of Education: NHIS, 1989, 65+ years
15
Lynch et al., 1997 30
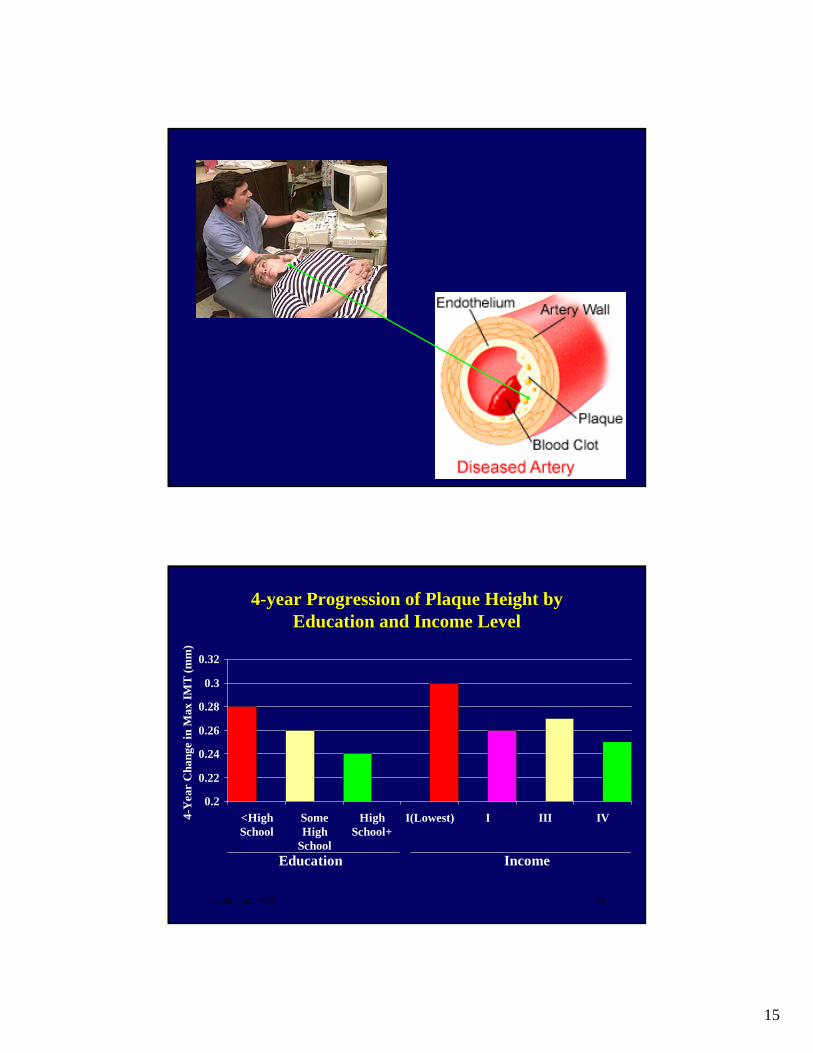
4-year Progression of Plaque Height by Education and Income Level
0.2
0.22
0.24
0.26
0.28
0.3
0.32
<HighSchool
SomeHigh
School
HighSchool+
I(Lowest) I III IV4-Y
ear
Cha
nge
in M
ax IM
T (m
m)
Education Income

16
Upstream and Downstream Approaches to Inequalities in Health
• Some current explorations (briefly)– The downstream/bloodstream side of inequality– The life course and cumulative disadvantage– Communities as crucibles for growing health
inequality– Economic equity and health
CSEPH
AnginaPectoris
MyocardialInfarction
Athero-sclerosis
Thrombosis
Lipidperoxidation
Othermechanisms
High LDL
Low HDL
High pro-oxidantsto antioxidants ratio
ObesityInsulinresistance
Hypertension
Low PA
Diet
SmokingPsychosocial
Factors
SES
17
Tissue Plasminogen Activator
0.10.20.20.30.3
1 (low) 2 3 4 (hi)
Income QuartileT
PA I
U/m
l
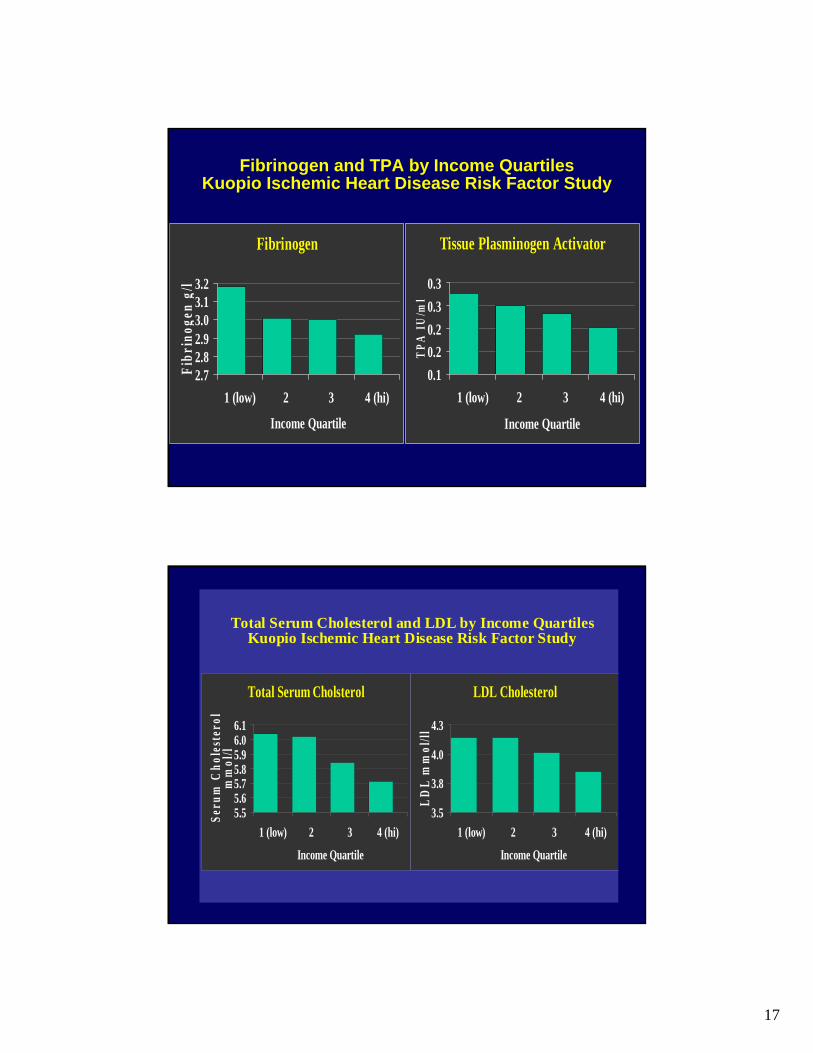
Fibrinogen and TPA by Income QuartilesKuopio Ischemic Heart Disease Risk Factor Study
Fibrinogen
2.72.82.93.03.13.2
1 (low) 2 3 4 (hi)
Income Quartile
Fibr
inog
en g
/l
LDL Cholesterol
3.5
3.8
4.0
4.3
1 (low) 2 3 4 (hi)
Income Quartile
LDL
mm
ol/ll
Total Serum Cholesterol and LDL by Income QuartilesKuopio Ischemic Heart Disease Risk Factor Study
Total Serum Cholsterol
5.55.65.75.85.96.06.1
1 (low) 2 3 4 (hi)
Income Quartile
Seru
m C
hole
ster
ol
mm
ol/l

18
Fasting Blood Glucose
4.5
4.8
5.0
1 (low) 2 3 4 (hi)
Income QuartileB
lood
Glu
cose
m
mol
/l
Systolic Blood Pressure and Fasting Glucose by IncomeQuartiles
Kuopio Ischemic Heart Disease Risk Factor Study
Systolic Blood Pressure
130.0
132.0
134.0
136.0
1 (low) 2 3 4 (hi)
Income Quartile
SBP
mm
Hg
130
135
140
145
150
155
160
Income Quintiles
WB
S (n
g/m
L)
Income and Whole Blood Serotonin in the KIHD Study
Everson-Rose et al., in progress

19
0102030405060708090
100
Pack-years(-100) % Drunk>2-3/mo % Sedentary
Primary or lessSome High SchoolHigh School or more
Behavioral Risk Factors by Level of EducationKuopio Ischemic Heart Disease Risk Factor Study
Lynch, Kaplan & Salonen, 1997
Sodium
2800290030003100320033003400
1 (low) 2 3 4 (hi)
Income Quartile
Na
(mg)
P/S Ratio
0.220.230.240.250.260.270.280.290.3
1 (low) 2 3 4 (hi)
Income Quartile
P/S
ratio
Vegetables
0
50
100
150
1 (low) 2 3 4 (hi)
Income Quartile
g/d
Fruits & Berries
0
50
100
150
200
2501 (low) 2 3 4 (hi)
Income Quartile
g/d
Dietary Consumption by Income QuartilesKuopio Ischemic Heart Disease Risk Factor Study
20
0
5
10
15
20
25
30
Depressio
n
Hopele
ssness
Hostilit
y
Sense of C
oherenc
e
Age
adj
uste
d Pr
eval
ence
(%)
Low Medium High
Lynch, Kaplan & Salonen, 1997
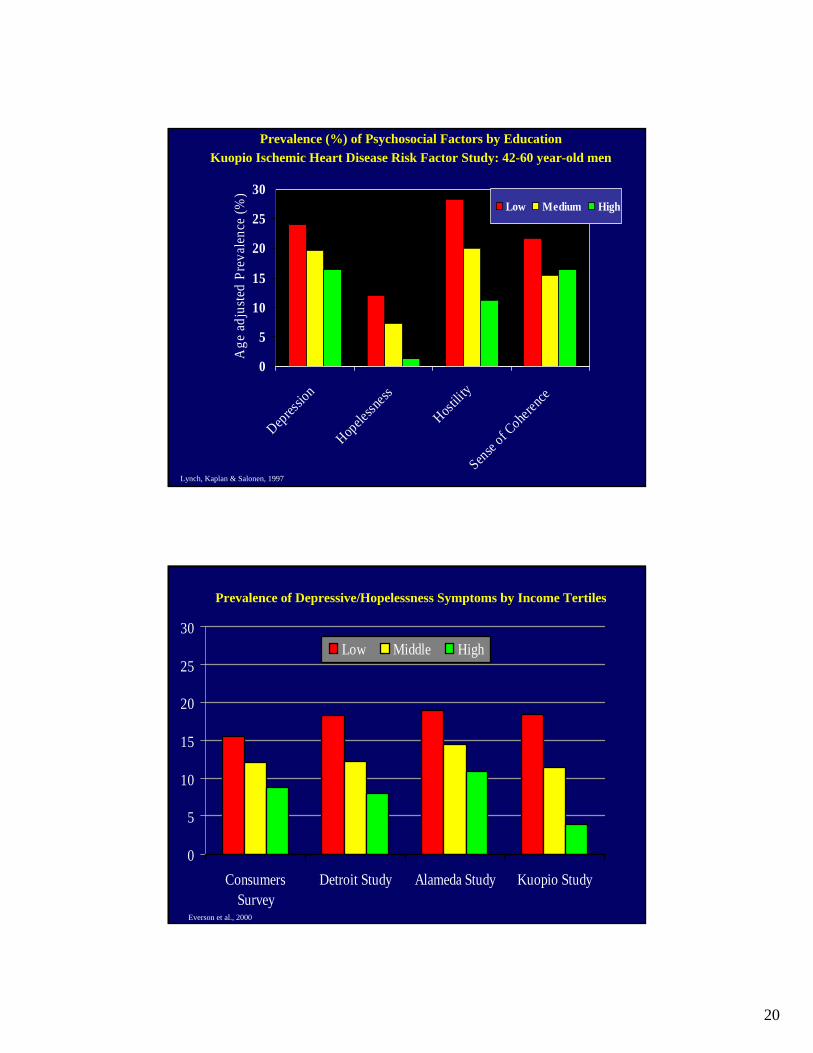
Prevalence (%) of Psychosocial Factors by EducationKuopio Ischemic Heart Disease Risk Factor Study: 42-60 year-old men
Prevalence of Depressive/Hopelessness Symptoms by Income Tertiles
0
5
10
15
20
25
30
ConsumersSurvey
Detroit Study Alameda Study Kuopio Study
Low Middle High
Everson et al., 2000
21
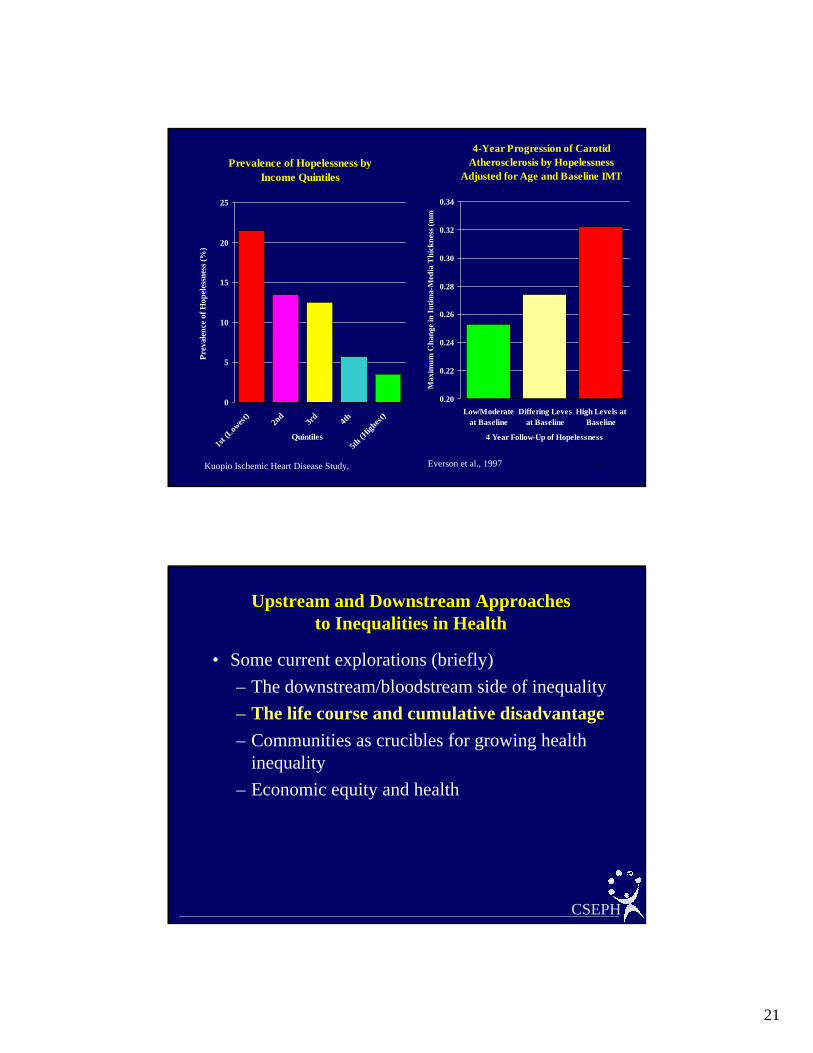
41
Prevalence of Hopelessness by Income Quintiles
0
5
10
15
20
25
1st (L
owest
)2n
d3r
d 4th
5th (H
ighest
)
Quintiles
Prev
alen
ce o
f Hop
eles
snes
s (%
)
4-Year Progression of Carotid Atherosclerosis by Hopelessness
Adjusted for Age and Baseline IMT
0.20
0.22
0.24
0.26
0.28
0.30
0.32
0.34
Low/Moderateat Baseline
Differing Levesat Baseline
High Levels atBaseline
4 Year Follow-Up of HopelessnessM
axim
um C
hang
e in
Intim
a-M
edia
Thi
ckne
ss (m
m
Kuopio Ischemic Heart Disease Study, Everson et al., 1997
Upstream and Downstream Approaches to Inequalities in Health
• Some current explorations (briefly)– The downstream/bloodstream side of inequality– The life course and cumulative disadvantage– Communities as crucibles for growing health
inequality– Economic equity and health
CSEPH
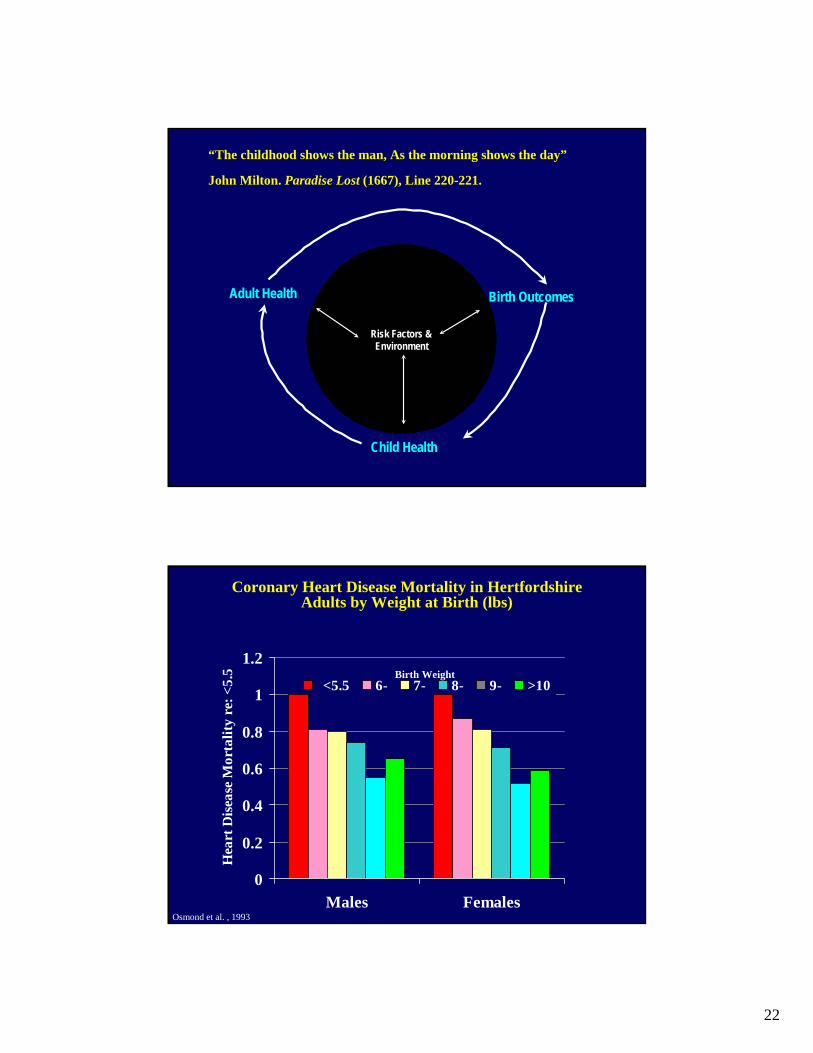
22
Risk Factors &Environment
Adult Health Birth Outcomes
Child Health
“The childhood shows the man, As the morning shows the day”
John Milton. Paradise Lost (1667), Line 220-221.
0
0.2
0.4
0.6
0.8
1
1.2
Males Females
Hea
rt D
isea
se M
orta
lity
re: <
5.5
<5.5 6- 7- 8- 9- >10Birth Weight
Coronary Heart Disease Mortality in Hertfordshire Adults by Weight at Birth (lbs)
Osmond et al. , 1993
23
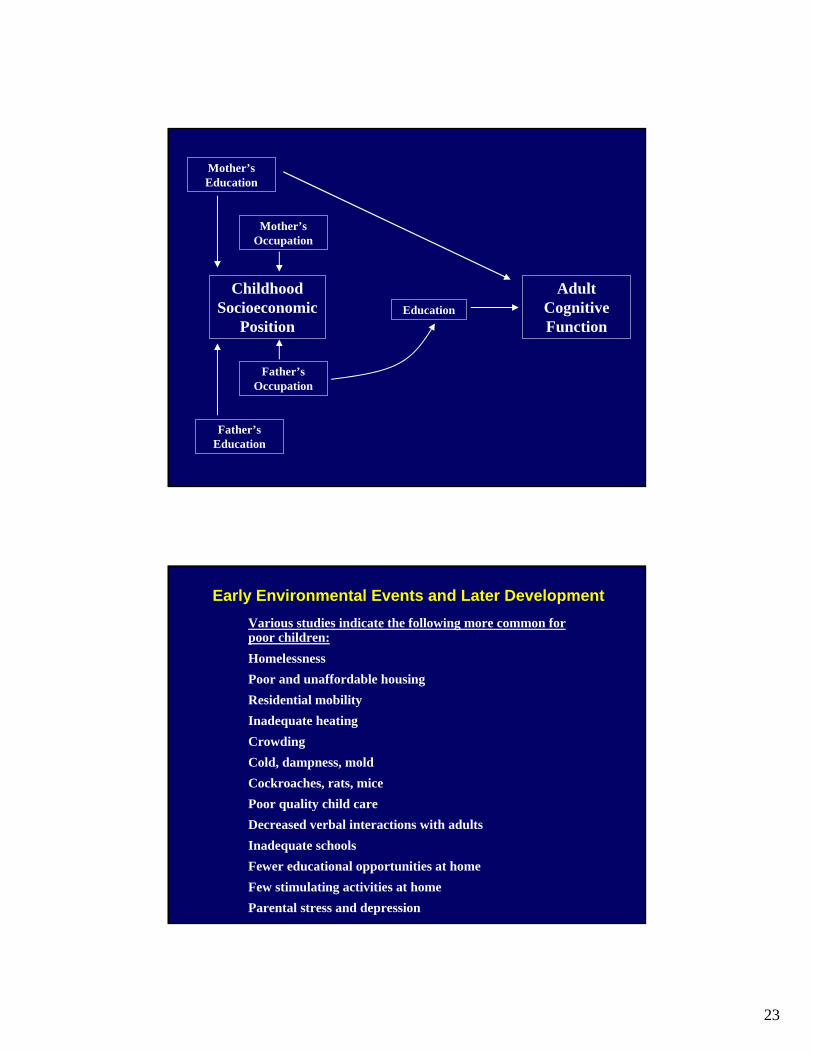
Adult Cognitive Function
Childhood Socioeconomic
Position
Mother’s Education
Mother’s Occupation
Education
Father’s Occupation
Father’s Education
Early Environmental Events and Later DevelopmentVarious studies indicate the following more common for poor children:HomelessnessPoor and unaffordable housingResidential mobilityInadequate heatingCrowdingCold, dampness, moldCockroaches, rats, micePoor quality child careDecreased verbal interactions with adultsInadequate schoolsFewer educational opportunities at homeFew stimulating activities at homeParental stress and depression
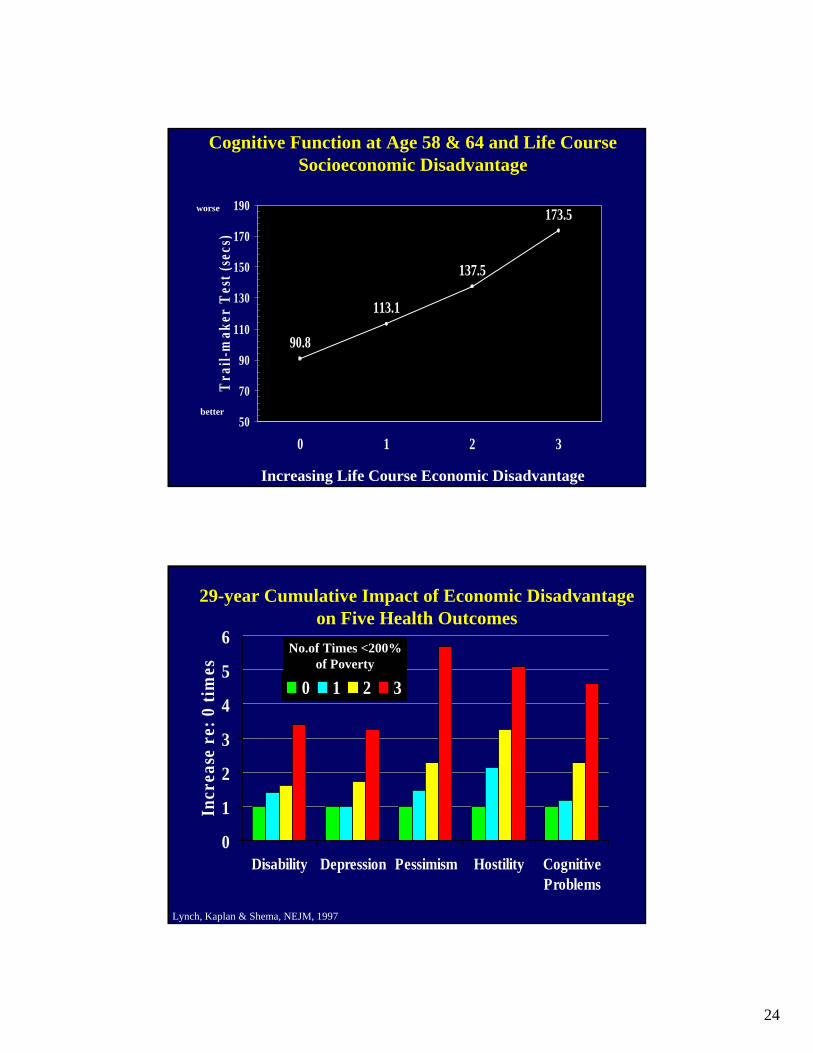
24
90.8
113.1
137.5
173.5
50
70
90
110
130
150
170
190
0 1 2 3
Tra
il-m
aker
Tes
t (se
cs)
Increasing Life Course Economic Disadvantage
Cognitive Function at Age 58 & 64 and Life Course Socioeconomic Disadvantage
worse
better
0
1
2
3
4
5
6
Disability Depression Pessimism Hostility CognitiveProblems
Incr
ease
re:
0 ti
mes
0 1 2 3
No.of Times <200% of Poverty
29-year Cumulative Impact of Economic Disadvantage on Five Health Outcomes
Lynch, Kaplan & Shema, NEJM, 1997
25
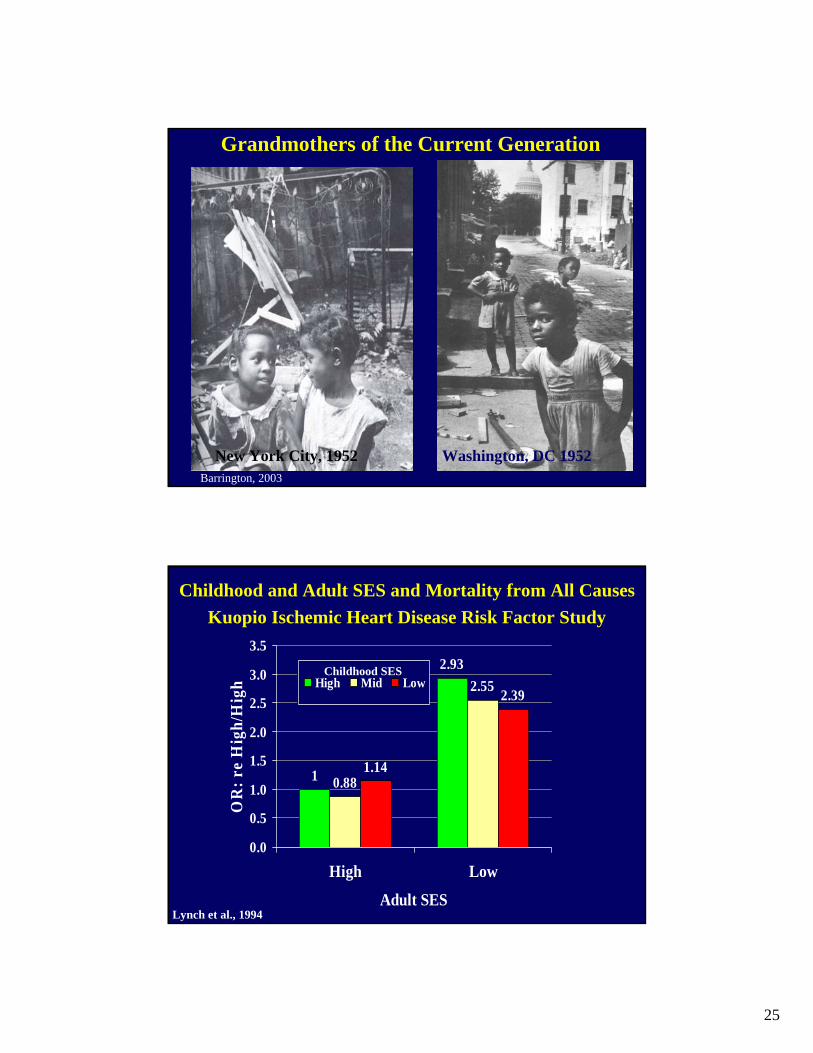
Washington, DC 1952New York City, 1952
Grandmothers of the Current Generation
Barrington, 2003
1
2.93
0.88
2.55
1.14
2.39
0.0
0.5
1.0
1.5
2.0
2.5
3.0
3.5
High Low
Adult SES
OR
: re
Hig
h/H
igh High Mid Low
Childhood SES
Childhood and Adult SES and Mortality from All CausesKuopio Ischemic Heart Disease Risk Factor Study
Lynch et al., 1994

26
Upstream and Downstream Approaches to Inequalities in Health
• Some current explorations (briefly)– The downstream/bloodstream side of inequality– The life course and cumulative disadvantage– Communities as crucibles for growing health
inequality– Economic equity and health
CSEPH
Haan et al., 1987 52
0.80
0.85
0.90
0.95
1.00
0 1000 2000 3000 4000Days
Prop
ortio
n Su
rviv
ing
Non-Poverty Area
Poverty Area
Age-adjusted Survival by Poverty Area Residence: Alameda County Study, 1965-1974
Survival curves from Cox model, estimated at age=60

27
Those who lived in the poverty area over the next 9 years:
• had twice the decrease in physical activity
• were more likely to become depressed
• were twice as likely to become disabled
• were less likely to be “successfully” aging
Those in the Poverty neighborhoods
• Were 5.8-8.0 lbs (M and F) heavier and gained 2.4-3.0 lbs (M & F) more over the next 9 years
(after adjustment for age, race, education & income)
• They were 3-8 times (depending on gender, race, and income) to develop NIDDM over the next 34 years
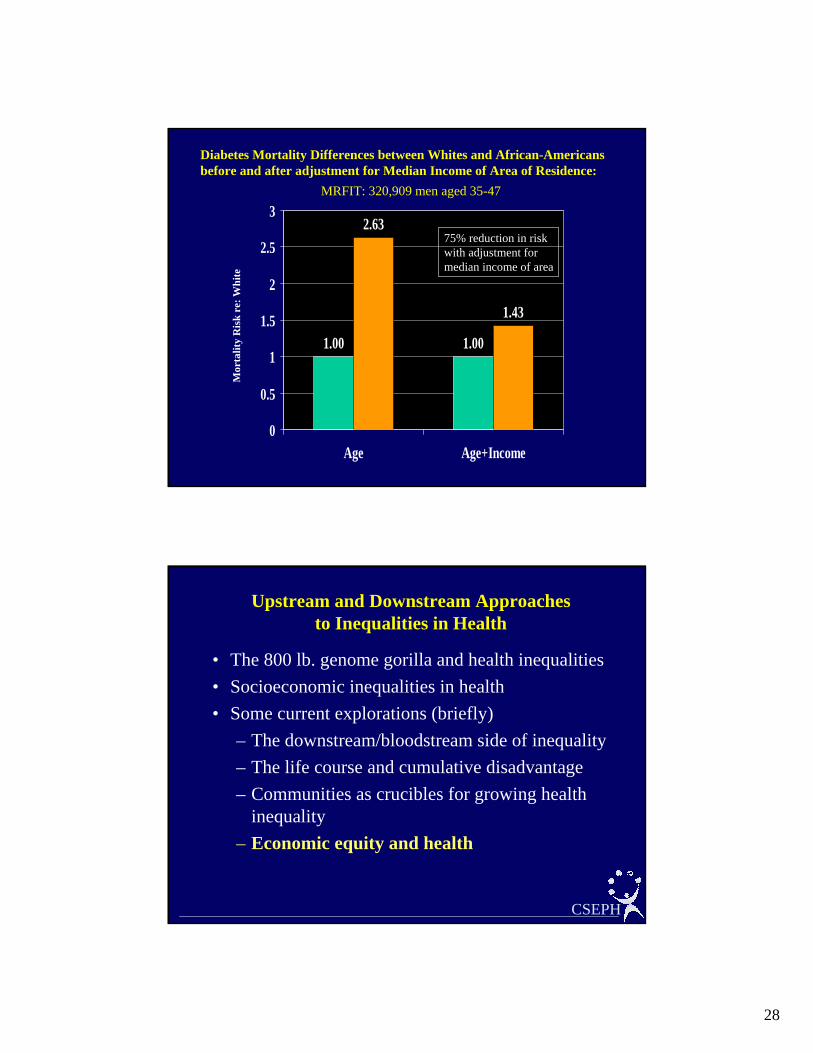
28
1.00 1.00
2.63
1.43
0
0.5
1
1.5
2
2.5
3
Age Age+Income
Diabetes Mortality Differences between Whites and African-Americans before and after adjustment for Median Income of Area of Residence:
MRFIT: 320,909 men aged 35-47
Mor
talit
y R
isk
re: W
hite
75% reduction in risk with adjustment for median income of area
Upstream and Downstream Approaches to Inequalities in Health
• The 800 lb. genome gorilla and health inequalities• Socioeconomic inequalities in health• Some current explorations (briefly)
– The downstream/bloodstream side of inequality– The life course and cumulative disadvantage– Communities as crucibles for growing health
inequality– Economic equity and health
CSEPH

29
U.S. Income Inequality
“The gap between rich and poor has grown into
an economic chasm so wide that this year the
richest 2.7 million Americans, the top 1 percent,
will have as many after-tax dollars to spend as
the bottom 100 million.”
NY Times, Sept 5, 1999

30
650
700
750
800
850
900
950
1000
17 18 19 20 21 22 23 24
Income Share Held by Poorest 50% of the Population
Age
-adj
uste
d T
otal
Mor
talit
y
Income Inequality and Mortality in US States, 1990(adjusted for State Median Income)
LA MS
NY
AL
KYWV
TX
TNAR
GA
OK
NM
FL
MO
CA
IL
AZ
SC
PAMI
MA
NCOH
VANJ
CT
MTKS
CO
RI
SD
OR
ND MNID
NEWA
NV
WY
IN
IA
ME
HI
DE
MD
AK
WI
VT
UT
NH
r = - 0.62
Kaplan et al. BMJ (1996)
Between 1980 and 1990, states that had the biggest increase in income inequality had the smallest decrease in mortality rates
r
% < High School Diploma -0.71
% High School Dropout -0.50
4th Grade Reading Scores -0.58
4th Grade Math Scores -0.64
Education / Total Spending -0.32
Library Books Per capita -0.42
Income Inequality and Selected Educational Indicators
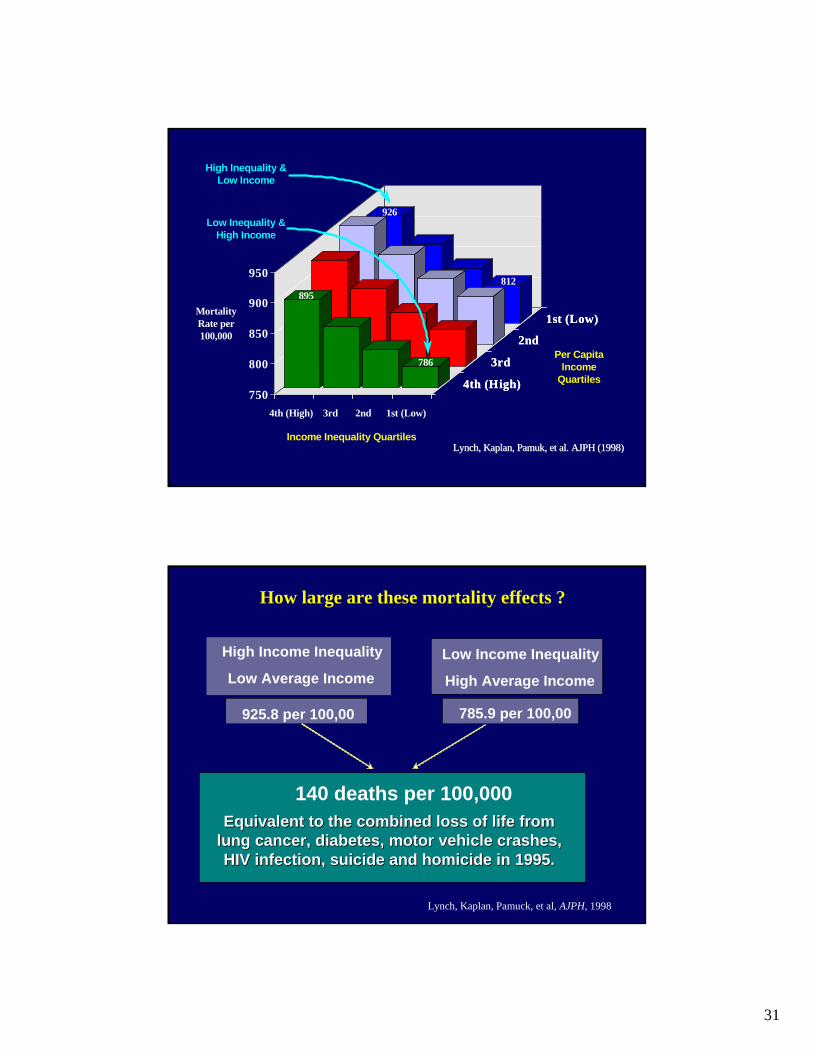
31
4th (High)
3rd
2nd
1st (Low)
750
800
850
900
950
4th (High)
3rd
2nd
1st (Low)
Income Inequality Quartiles
4th (High) 3rd 2nd 1st (Low)
Per CapitaIncome
Quartiles
MortalityRate per100,000
High Inequality &Low Income
Low Inequality &High Income
895
786
926
812
Lynch, Kaplan,Lynch, Kaplan, Pamuk Pamuk, et al. AJPH (1998), et al. AJPH (1998)
How large are these mortality effects ?
High Income Inequality
Low Average IncomeLow Income Inequality
High Average Income
925.8 per 100,00 785.9 per 100,00
140 deaths per 100,000Equivalent to the combined loss of life from Equivalent to the combined loss of life from
lung cancer, diabetes, motor vehicle crashes, lung cancer, diabetes, motor vehicle crashes, HIV infection, suicide and homicide in 1995.HIV infection, suicide and homicide in 1995.
Lynch, Kaplan, Pamuck, et al, AJPH, 1998

32
0.15 0.20 0.25 0.30Median Share of Income
200
300
400
500
600W
orki
ng-A
ge (2
5-64
) Mor
talit
y R
ate
per 1
00,0
00
Income Inequality and Working Age MortalityUSA, Canada, Australia, Sweden Metropolitan Areas1990/91
US metro areas n=282CAN metro areas n=53AUS metro areas n=18SWE metro areas n=40
Source:Canada: Ross, Dunn, WolfsonUS: Lynch and KaplanAustralia: GloverSweden: Henricksson
Ross et al., in progress
DO NOT CITE
Upstream and Downstream Approaches to Inequalities in Health
• Challenges and Opportunities– Metaphors and Models– Need for Theory– Analytic and Methodologic Pitfalls– Perils and Promise of Interdisciplinarity– Personalizing Populations– Moderating Essentialism– Lost Opportunities
CSEPH

33
````
Social and Economic Policies
Neighborhoods and CommunitiesInstitutions (including medical care)
Living Conditions
Social RelationshipsIndividual Risk Factors
Genetic/Constitutional Factors
Physical Environment
Individual/Population Health
Pathophysiologic pathways
Life
cour
se
Genetic/Constitutional Factors
Political EconomyInstitutions
DiscriminationCultureHistory
Distal Social Connections
Family
StructuralMacrosocial
Factors
Proximal Social Connections
Neighborhood CommunityOrganizational Connections
Friends
Individual Characteristics
SocioeconomicBehavioralPsychosocial
Life Course
Conception Old Age
Human BiologyGenetics
Pathological Biomarkers
GeneticCharacteristics
Pathobiology
Health Status
Work
Lynch, 2000

34
Material, PsychosocialSocial Structure
PathophysiologyOrgan Impairment
Early Life
DMCHD
Wellbeing
Culture
Genes
Work
Psychological
CNS
Neuroendocrine
ImmuneSocial Environment Health
Behavior
Marmot, 2001
Race-Ethnicity
Gender
SocioeconomicStatus
Health Outcomes1. Mortality2. Institutionalization3. Morbidity (Chronic)4. Functional Limitations5. Self-rated Health6. Cognitive Function7. DepressionEXPLANATORY VARIABLES
Medical Care and Insurance
Psychosocial Risk Factors1. Health Behaviors2. Social Relationships
and Supports3. Chronic and Acute
Stress 4. Psychological
Dispositions5. Social Roles and
Productive Activities
Physical/Chemical and Social Environmental Hazards
Social, Political, and Economic Conditions
and Policy
House, 2002
35
Upstream and Downstream Approaches to Inequalities in Health
• Challenges and Opportunities– Metaphors and Models– Need for Theory– Analytic and Methodologic Pitfalls– Perils and Promise of Interdisciplinarity– Personalizing Populations– Moderating Essentialism– Lost Opportunities
CSEPH

36
Upstream and Downstream Approaches to Inequalities in Health
• Challenges and Opportunities– Metaphors and Models– Need for Theory– Analytic and Methodologic Pitfalls– Perils and Promise of Interdisciplinarity– Personalizing Populations– Moderating Essentialism– Lost Opportunities
CSEPH
Upstream and Downstream Approaches to Inequalities in Health
• Challenges and Opportunities– Metaphors and Models– Need for Theory– Analytic and Methodologic Pitfalls– Perils and Promise of Interdisciplinarity– Personalizing Populations– Moderating Essentialism– Lost Opportunities
CSEPH

37
Upstream and Downstream Approaches to Inequalities in Health
• Challenges and Opportunities– Metaphors and Models– Need for Theory– Analytic and Methodologic Pitfalls– Perils and Promise of Interdisciplinarity– Personalizing Populations– Moderating Essentialism– Lost Opportunities
CSEPH
Upstream and Downstream Approaches to Inequalities in Health
• Challenges and Opportunities– Metaphors and Models– Need for Theory– Analytic and Methodologic Pitfalls– Perils and Promise of Interdisciplinarity– Personalizing Populations– Moderating Essentialism– Lost Opportunities
CSEPH
38
Upstream and Downstream Approaches to Inequalities in Health
• Challenges and Opportunities– Metaphors and Models– Need for Theory– Analytic and Methodologic Pitfalls– Perils and Promise of Interdisciplinarity– Personalizing Populations– Moderating Essentialism– Lost Opportunities
CSEPH
In a world of science in which the proximal and molecular explanation is seen as the “best,” a complete, satisfying, and useful understanding of inequalities in health may require the methodologic lens of complex systems and systems biology (even), the sensitivity and insights of the historian, poet and ethnographer, the knowledge of the biologist and ecologist, and the tools of the policy analyst and public health practitioner.

39
While there are many challenges, the study and remediation of inequalities in health coiuld serve as a model for a new scientific paradigm– bridging the social and the biological.
A tall order, but an exciting one that holds promise for breaking the link between the social divides in society and the health divides, and in doing so perhaps (???) even helping to decrease the social divides……..
78
````
Social and Economic Policies
Neighborhoods and CommunitiesInstitutions (including medical care)
Living Conditions
Social RelationshipsIndividual Risk Factors
Genetic/Constitutional Factors
Physical Environment
Individual/Population Health
Pathophysiologic pathways
Life
cour
se
Genetic/Constitutional Factors

40

41
Upstream and Downstream Approaches to Inequalities in Health
• The 800 lb. genome gorilla and health inequalities• Socioeconomic inequalities in health• Some current explorations (briefly)
– The downstream/bloodstream side of inequality– The life course and cumulative disadvantage– Communities as crucibles for growing health
inequality– Economic equity and health– Globalization and health– How do we understand?
• 1.2 billion people (20% of world’s population) are estimated to live on less than $1 per day
• 3 billion (49% of world’s population) on less than $2 per day
• 110 million primary school age children are out of school (60% of them girls)
• Many more live without adequate food, shelter, safe water, and sanitation.
WHO, Global Poverty Report, July, 2000

42
Social Impacts of 1998 Asian Financial Crisis in Thailand
Increases in:
• poverty
• unemployment
• divorce rates
• child abandonment
• drug use
Shivakumar et al., 2000
Debt Service vs. Other Expenditures in Pakistan
Debt Service(350B)
Development
Health Budget
Bhutta, 2000

43
Into Out of Net
World Bank 250 514.2 -264.2
IMF 0 329.1 -329.1
Cash Flow in and out of Pakistan from World Bank and IMF, 1999-2000
Bhutta, 2000
Globalization of the EconomyCapital ConcentrationLeveraged buy-outs, etc.
Changes inOccupational Structure
Downsizing/Job Losses
Deforestation
Meat Production
FarmingMigration
SocialCohesion
Blood PressureSmokingObesity
Flue-curing oftobacco
Real WagesWork HoursJob InsecurityIncome and
Wealth Inequality
Social Resources
Stress &Time Pressure
Other Risk Factors
Convenience &Fast Food
Poor Nutrition
High-strain, minimum wage jobs
CardiovascularDisease
Epidemiologic Transitionin Developing Countries
44
Upstream and Downstream Approaches to Inequalities in Health
• The 800 lb. genome gorilla and health inequalities• Socioeconomic inequalities in health• Some current explorations (briefly)
– The downstream/bloodstream side of inequality– The life course and cumulative disadvantage– Communities as crucibles for growing health
inequality– Economic equity and health– Globalization and health– How do we understand?
45

46
New UrbanismSmall, self-contained neighborhoods with the center no more than a quarter of a mile from the edge -- a reasonable walking distance. Improved public transit systems and greater integration of different types of land uses at the neighborhood level.
vs

47
9-10 fodiffere
$137 vs $13,995
100-fold difference!!
48
LBW
Low Maternal Education
Maternal Age
Prenatal Care
Health Insurance
Individual Level
Unemployment
Per Capita Crime
Wealth
Low Per Capita
Income
Neighborhood Level
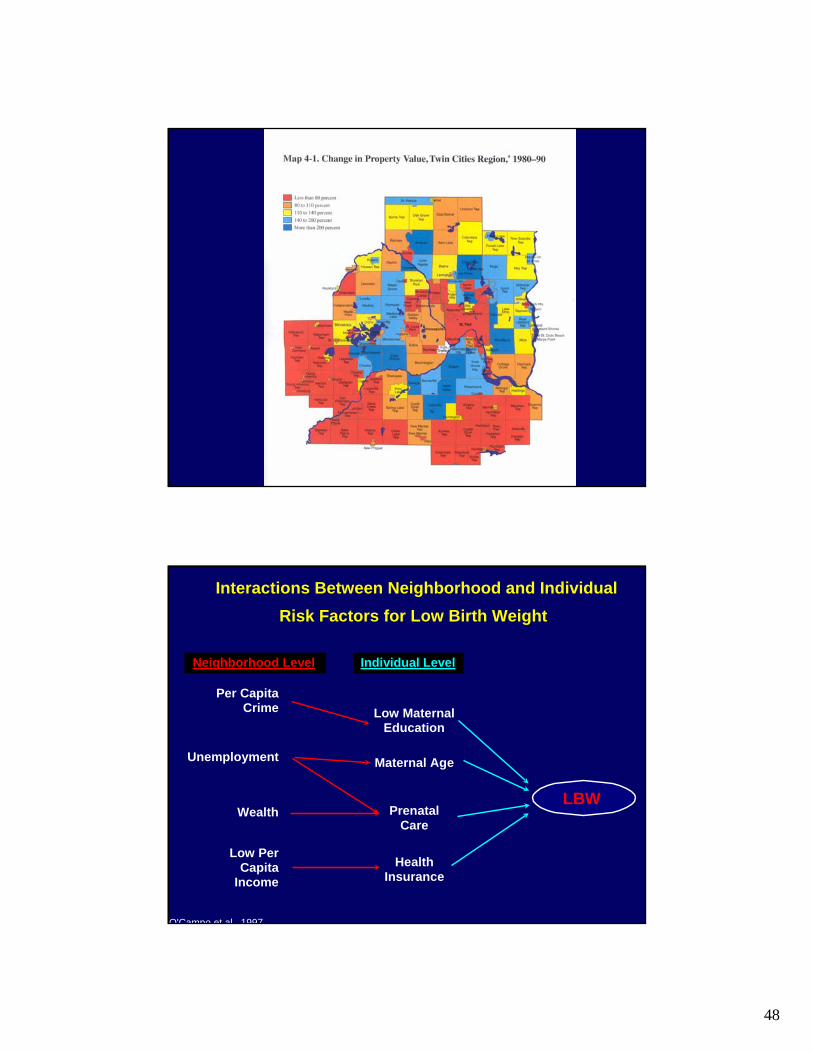
Interactions Between Neighborhood and Individual Risk Factors for Low Birth Weight
O'Campo et al 1997

49
9-10 fodiffere
Civic CultureSocial Values
IndividualIncome
MorbidityMortality by
Cause
SmokingDiet
ExerciseHostilityIsolation
PoliticalEconomy
Distributionof Income
Historical Factors
Political Institutions
Neo-Material Context
Education SystemWorking ConditionsIndustry BasePublic Health ServicesEnvironmental ControlsLand Use & ZoningRecreation FacilitiesTransportation SystemsAffordable Quality HousingAccess to Optimal NutritionChild CareAdvertising - cigarettes, etcDiscrimination
Perception of Placein the Social Hierarchy
DisrespectLack of Trust
Social CohesionSocial Capital
1
2
3
50
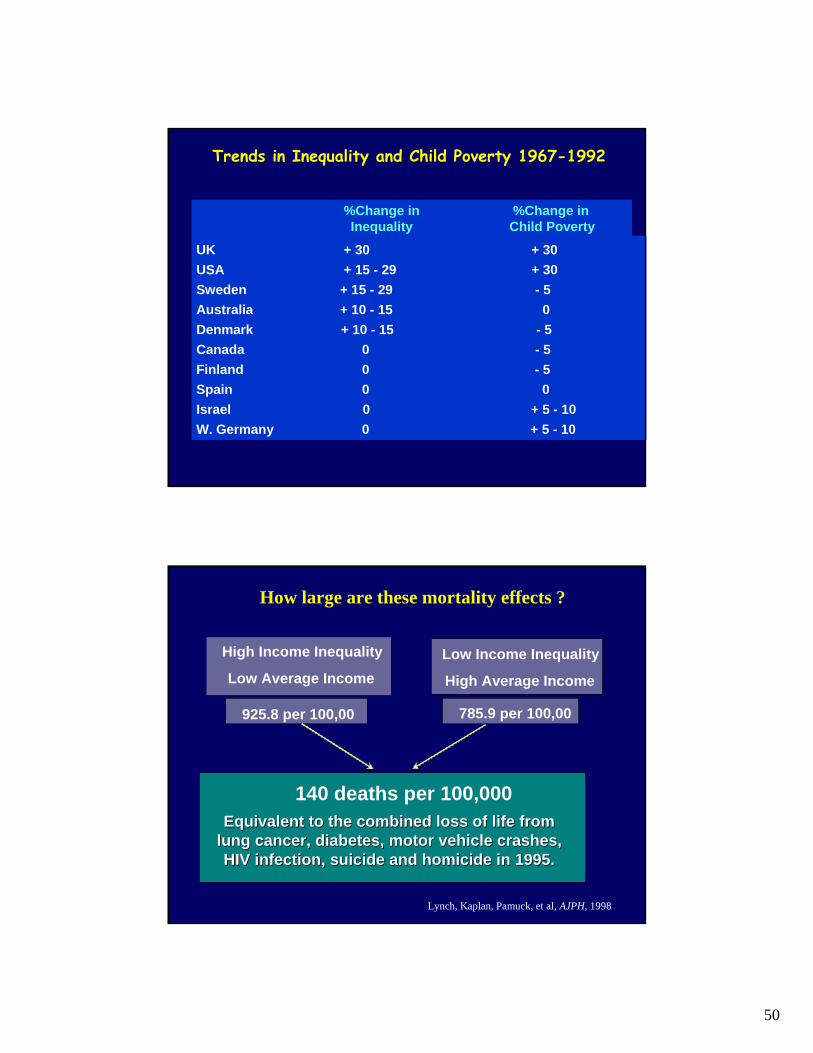
Trends in Inequality and Child Poverty 1967-1992
%Change in %Change in Inequality Child Poverty
UK + 30 + 30USA + 15 - 29 + 30 Sweden + 15 - 29 - 5Australia + 10 - 15 0Denmark + 10 - 15 - 5 Canada 0 - 5Finland 0 - 5Spain 0 0Israel 0 + 5 - 10W. Germany 0 + 5 - 10
How large are these mortality effects ?
High Income Inequality
Low Average IncomeLow Income Inequality
High Average Income
925.8 per 100,00 785.9 per 100,00
140 deaths per 100,000Equivalent to the combined loss of life from Equivalent to the combined loss of life from
lung cancer, diabetes, motor vehicle crashes, lung cancer, diabetes, motor vehicle crashes, HIV infection, suicide and homicide in 1995.HIV infection, suicide and homicide in 1995.
Lynch, Kaplan, Pamuck, et al, AJPH, 1998

51
Civic CultureSocial Values
IndividualIncome
MorbidityMortality by
Cause
SmokingDiet
ExerciseHostilityIsolation
PoliticalEconomy
Distributionof Income
Historical Factors
Political Institutions
Neo-Material Context
Education SystemWorking ConditionsIndustry BasePublic Health ServicesEnvironmental ControlsLand Use & ZoningRecreation FacilitiesTransportation SystemsAffordable Quality HousingAccess to Optimal NutritionChild CareAdvertising - cigarettes, etcDiscrimination
Perception of Placein the Social Hierarchy
DisrespectLack of Trust
Social CohesionSocial Capital
1
2
3
Trends in Inequality and Child Poverty 1967-1992
%Change in %Change in Inequality Child Poverty
UK + 30 + 30USA + 15 - 29 + 30 Sweden + 15 - 29 - 5Australia + 10 - 15 0Denmark + 10 - 15 - 5 Canada 0 - 5Finland 0 - 5Spain 0 0Israel 0 + 5 - 10W. Germany 0 + 5 - 10