upstand finite element analysis of slab bridges
DESCRIPTION
Upstand Finite Element Analysis of Slab BridgesTRANSCRIPT

Upstand ®nite element analysis of slab bridges
E.J. O'Brien a, *, D.L. Keoghb
aUniversity College Dublin, IrelandbRoughan and O'Donovan Consulting Engineers, Ireland
Received 26 May 1997; accepted 6 May 1998
Abstract
For slab bridge decks with wide transverse edge cantilevers, the plane grillage analogy is shown to be an
inaccurate method of linear elastic analysis due to variations in the vertical position of the neutral axis. The upstandgrillage analogy is also shown to give inaccurate results, this time due to inappropriate modelling of in-planedistortions. An alternative method, known as upstand ®nite element analysis, is proposed which is su�ciently simple
to be used on an everyday basis in the design o�ce. The method is shown to give much better agreement than theothers when compared with an elaborate three-dimensional solid ®nite element model. Single- and two-span bridgedecks with solid and voided sections are considered for both longitudinal and transverse bending stresses. # 1998
Elsevier Science Ltd. All rights reserved.
Keywords: Bridge; Bridge deck; Grillage; Finite element analysis; Voided slab
1. Introduction
The plane grillage analogy is a popular method
among bridge designers of modelling slab bridge decks
in two dimensions. It involves the idealisation of the
bridge slab as a mesh of longitudinal and transverse
beams all located in the same plane. Implicit in the
method is an assumption that all parts of the bridge
cross-section bend about a single neutral axis which is
generally taken to pass through the centroid of the
deck. The depth of this neutral axis (below some
datum, usually horizontal) is assumed not to vary
throughout the bridge. Finite element analysis (FEA)
is used extensively by bridge designers, but is most
often limited to planar analysis using plate bending el-
ements, which, like the plane grillage method, assumes
a constant neutral axis depth.
Slab bridge decks with wide edge cantilevers are
known to have neutral axes of variable depth. Fig. 1 il-
lustrates a bridge deck in which the neutral axis rises
signi®cantly towards the edges as the cantilevers
attempt to ¯ex about their own centroids. It has been
reported [8] that the neutral axis depth may also vary
in the longitudinal direction in some cases, such as
close to concentrated loads or adjacent to intermediate
supports in multispan decks.
Variability of neutral axis depth, when signi®cant,
results in the incorrect representation by a planar
analysis of the behaviour of the bridge deck. The pro-
blem can be overcome by the use of a three-dimen-
sional model. Such methods do not require all
members or elements representing parts of the deck to
be located in the one plane. Consequently this
approach does not require a pre-assumed neutral axis
position, and allows for a rational handling of cases in
which the neutral axis depth varies. Many such three-
dimensional techniques have been suggested, ranging
from space frame methods to ®nite element analysis
(FEA) using solid, brick-type elements. While these
methods can be successfully used to model a variable-
depth neutral axis, they are generally excessively com-
plex for everyday use in design o�ces. This paper
addresses the problems by proposing a simpli®ed but
accurate three-dimensional (3D) method, referred to
here as the upstand ®nite element analysis (upstand
Computers and Structures 69 (1998) 671±683
0045-7949/98/$ - see front matter # 1998 Elsevier Science Ltd. All rights reserved.
PII: S0045-7949(98 )00148-5
PERGAMON
* Corresponding author.

FEA) method. The method is simple enough to be
used in design o�ces for everyday design and is signi®-cantly more accurate than plane grillage or plane ®niteelement analysis, particularly for bridge slabs withwide edge cantilevers.
2. Three dimensional ®nite element analysis
In order to assess the accuracies of alternative sim-pli®ed methods of analysis, it was necessary to com-pare them to a considerably more accurate method for
a range of bridge decks. A program from the DYNA3Dsuite, NIKE3D [7], was used for this purpose to con-struct three-dimensional solid models from solid `brick'
elements. The program was tested extensively by com-
paring analysis results for simple beam and slabmodels with known values.
3. Grillage analysis methods
The theory and application of grillage analysis iswell established and has been discussed by manyauthors [3, 5, 12]. Results have been compared tomodels and full-size bridges in the past [2, 12] and the
method has been found to be reasonably accurate formany shapes of structure, loading conditions and sup-port arrangements. While it is widely used by bridge
designers, the plane grillage analogy has been found bythe authors [6] to be inaccurate for slab bridges withwide edge cantilevers.
Upstand grillage modelling is a simpli®ed three-dimensional technique, which is in e�ect an extensionof the plane grillage method. It has been suggested inthe past for the analysis of bridges with variable-depth
neutral axes [5]. Fig. 2(a) shows a single-span slabbridge deck with edge cantilevers. The length to depthratio of the cantilevers is 6:1 which is the maximum
considered practical. Fig. 2(b) shows an equivalent
Fig. 1. Slab bridge deck with wide edge cantilevers showing
non-uniform neutral axis.
Fig. 2. (a) Single span bridge deck and (b) upstand grillage model.
E. O'Brien, D. Keogh / Computers and Structures 69 (1998) 671±683672
upstand grillage model of this bridge deck. The model
is similar to a plane grillage except that each member
is located in the plane containing the centroid of the
portion of bridge it represents. Therefore it is not
necessary to assume an overall neutral axis position.
For the example illustrated, all members are located
on two planes, one for the edge cantilevers and one forthe main part of the deck. The grillage members in
each plane are connected by rigid vertical beams. Withsome programs, it may be necessary to use beams withvery large ¯exural rigidities, being e�ectively in®nite
while not being so large as to cause round-o� errors.A three-dimensional model such as the upstand gril-
lage, develops signi®cant forces in the plane of the
deck. Unfortunately a grillage is ine�ective at provid-ing a realistic representation of a slab subjected to in-plane forces due to the tendency for the beams to bend
individually in a similar manner to a Vierendeel girder.This behaviour is clearly not consistent with that of aslab. To overcome this problem, as has been suggestedby other authors [5], all of the nodes in the upstand
grillage were restrained against in-plane rotation.The upstand grillage of Fig. 2(b) was analysed using
the STRAP computer program [1], under the action of
opposing uniform moments applied at each end of thebridge deck. Typical concrete material properties werechosen for the model. A plane grillage analysis using
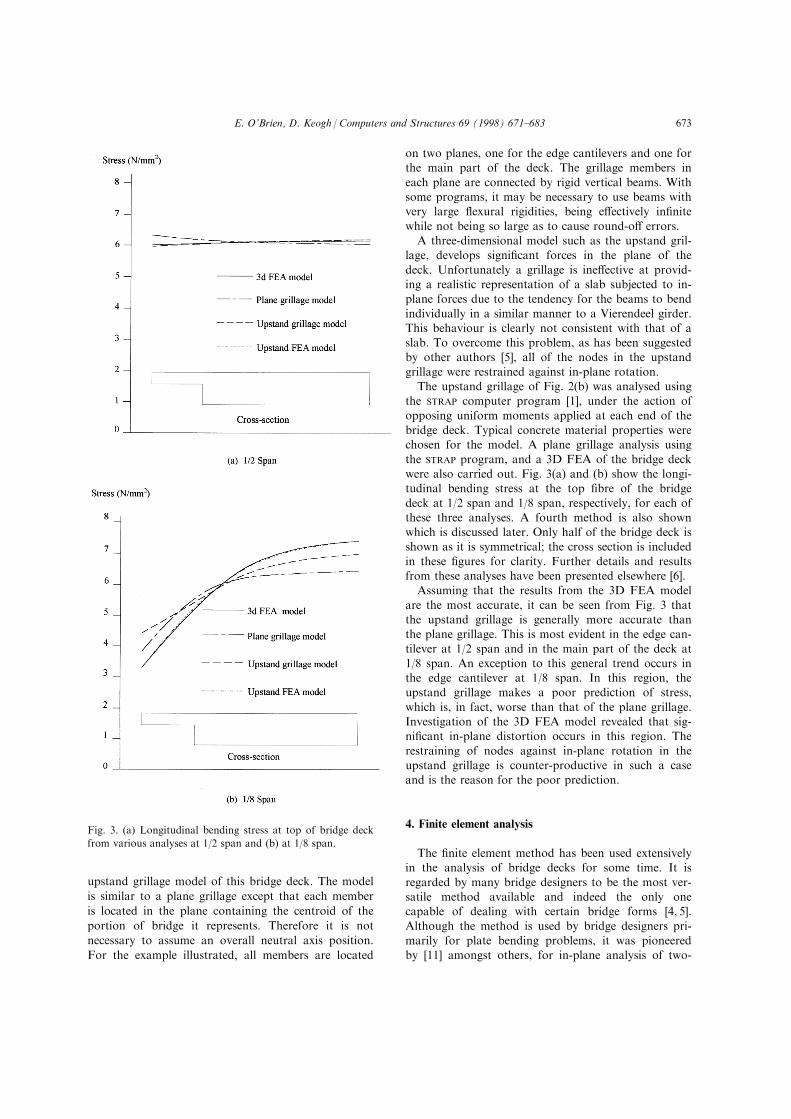
the STRAP program, and a 3D FEA of the bridge deckwere also carried out. Fig. 3(a) and (b) show the longi-tudinal bending stress at the top ®bre of the bridge
deck at 1/2 span and 1/8 span, respectively, for each ofthese three analyses. A fourth method is also shownwhich is discussed later. Only half of the bridge deck isshown as it is symmetrical; the cross section is included
in these ®gures for clarity. Further details and resultsfrom these analyses have been presented elsewhere [6].Assuming that the results from the 3D FEA model
are the most accurate, it can be seen from Fig. 3 thatthe upstand grillage is generally more accurate thanthe plane grillage. This is most evident in the edge can-
tilever at 1/2 span and in the main part of the deck at1/8 span. An exception to this general trend occurs inthe edge cantilever at 1/8 span. In this region, theupstand grillage makes a poor prediction of stress,
which is, in fact, worse than that of the plane grillage.Investigation of the 3D FEA model revealed that sig-ni®cant in-plane distortion occurs in this region. The
restraining of nodes against in-plane rotation in theupstand grillage is counter-productive in such a caseand is the reason for the poor prediction.
4. Finite element analysis
The ®nite element method has been used extensivelyin the analysis of bridge decks for some time. It is
regarded by many bridge designers to be the most ver-satile method available and indeed the only onecapable of dealing with certain bridge forms [4, 5].
Although the method is used by bridge designers pri-marily for plate bending problems, it was pioneeredby [11] amongst others, for in-plane analysis of two-
Fig. 3. (a) Longitudinal bending stress at top of bridge deck
from various analyses at 1/2 span and (b) at 1/8 span.
E. O'Brien, D. Keogh / Computers and Structures 69 (1998) 671±683 673

dimensional elastic structures. The method wasextended to the bending of slabs by Zienkiewicz andCheung [13] who also demonstrated the ability of the
method to deal with various boundary conditions,variable slab thicknesses and slab orthotropy. In recentyears, software has become available for personal com-puters which allows the use of plate ®nite element
models for everyday analysis of bridges in the designo�ce.
4.1. Upstand ®nite element analysis
The upstand FEA method, which is proposed here,
is similar to the upstand grillage method discussed inthe previous section, but with the grillage beamsreplaced by ®nite elements. The elements are locatedon di�erent planes, according to the geometry of the
bridge deck, and these planes of elements are con-nected, once again, by vertical beams with e�ectivelyin®nite ¯exural rigidity. As the model is three-dimen-
sional, the elements have to resist in-plane forces anddeformations as well as out-of-plane bending. Themethod is introduced here by means of a simple
example. It will then be further developed to coverother forms of bridge deck.An upstand FEA model of the single-span bridge
deck of Fig. 2(a) was analysed using the STRAP compu-
ter program for the same loading conditions. Themodel is shown in Fig. 4 with dimensions in metres.As with the upstand grillage model, the vertical mem-
bers were given e�ectively in®nite ¯exural rigidities.The ®nite elements, which were capable of modellingboth in-plane distortion and out-of-plane bending,
were isotropic and hence only their depth was requiredto de®ne their sti�ness. The depth of the elements wastaken to be equal to the depth of the portion of slab
which they represented and the same material proper-ties were used as in the previous model.The upstand FEA gave both bending moments and
axial forces in each element and the total stress wasarrived at by adding the stress components of each ofthese e�ects. Fig. 3(a) and (b), which shows the stressesfrom the 3D FEA, plane grillage and upstand grillage,
also shows the same quantity predicted by the upstandFEA model.The upstand FEA is seen to compare almost exactly
with the 3D FEA and the lines in the ®gures arealmost indistinguishable. This provides a greatimprovement over the upstand grillage and the plane
grillage with little increase in complexity. The tech-nique is extended to bridge decks with more complexgeometries in the following sections.
4.2. Upstand FEA of two-span bridge deck
To further develop the upstand FEA method, a two-span bridge deck with wide edge cantilevers was ana-
lysed under the action of its self-weight. The formu-lation of the upstand FEA model for the two-spancase follows directly from the single-span model, and
uses the same element dimensions and properties, asthe cross-sections of these two models are the same.The upstand FEA model is illustrated in Fig. 5.The longitudinal stress at the top of the bridge deck
predicted by this model was compared to that pre-dicted by a 3D FEA using the NIKE3D program. Thetop stress was taken this time at 0.1 m below the top
surface of the bridge as this location was convenientfor data processing purposes. As the bridge deck issymmetrical, results are only presented here for one
half of the deck (transversely) and for one span. Inorder to simplify the presentation of results, the (half)bridge deck was notionally divided transversely into 6
Fig. 4. Upstand FEA model of single span bridge deck.
E. O'Brien, D. Keogh / Computers and Structures 69 (1998) 671±683674

longitudinal strips of equal width and labelled as
shown in Fig. 6. The average top stress predicted bythe 3D FEA for each longitudinal strip is presented inFig. 7(a) while Fig. 7(b) shows the same quantity as
predicted by the upstand FEA model. A plane FEA ofthis bridge deck was also carried out and the same
results from this are shown in Fig. 7(c). It was con-sidered more appropriate to compare the results of theupstand FEA with a plane FEA rather than a plane
grillage. This shows that the improved accuracy is notdue to the use of ®nite elements, but rather due to the
three-dimensional nature of the model.The predictions of stress from the 3D FEA and the
upstand FEA follow the expected pattern, with zero
stress at the end support, maximum compressive stress(here shown negative) at 3/8 span, zero stress near 3/4
span and maximum tensile stress at the central sup-port. In addition, the ®gures show how the longitudi-nal stress varies transversely across the bridge deck.
The maximum stress occurs towards the centre of thebridge and diminishes towards the edge cantilever. Thepredictions of longitudinal stress from the plane FEA
also follow the expected pattern along the span, butdoes not show the longitudinal stress varying transver-
sely across the deck to the extent it does in the predic-tions of the other analyses. In fact, the plane FEApredicts an almost uniform longitudinal stress across
the width of the bridge deck, except for the edge of the
cantilever (strip C1) where it drops slightly over the
central support. This is due to the inability of theplane FEA to model the variation in neutral axis lo-cation.
Fig. 8 presents the same results in a form which fa-cilitates a direct comparison of the methods for each
longitudinal strip (C1±M4) in turn. By comparing thestress at C1 and C2 predicted by each of the three ana-lyses (Fig. 8(a) and (b)), the 3D FEA and upstand
FEA predictions are seen to be in very close agreementalong the entire span. The stress predicted by the plane
FEA, on the other hand, does not agree as well withthese. This disagreement is more pronounced near theedge of the cantilever at C1 (Fig. 8(a)) than at the
inside of the cantilever at C2 (Fig. 8(b)). The planeFEA predicts signi®cantly higher stresses in the cantile-ver than the other two analyses. This is due to the fact
that the plane FEA assumes a neutral axis which doesnot rise in the edge cantilever. This causes the second
moment of area of the cantilever to be too large, andthus to attract too much moment. Secondly, themoment which it attracts induces a higher stress
because the distance from the assumed neutral axis tothe top ®bre is too large.
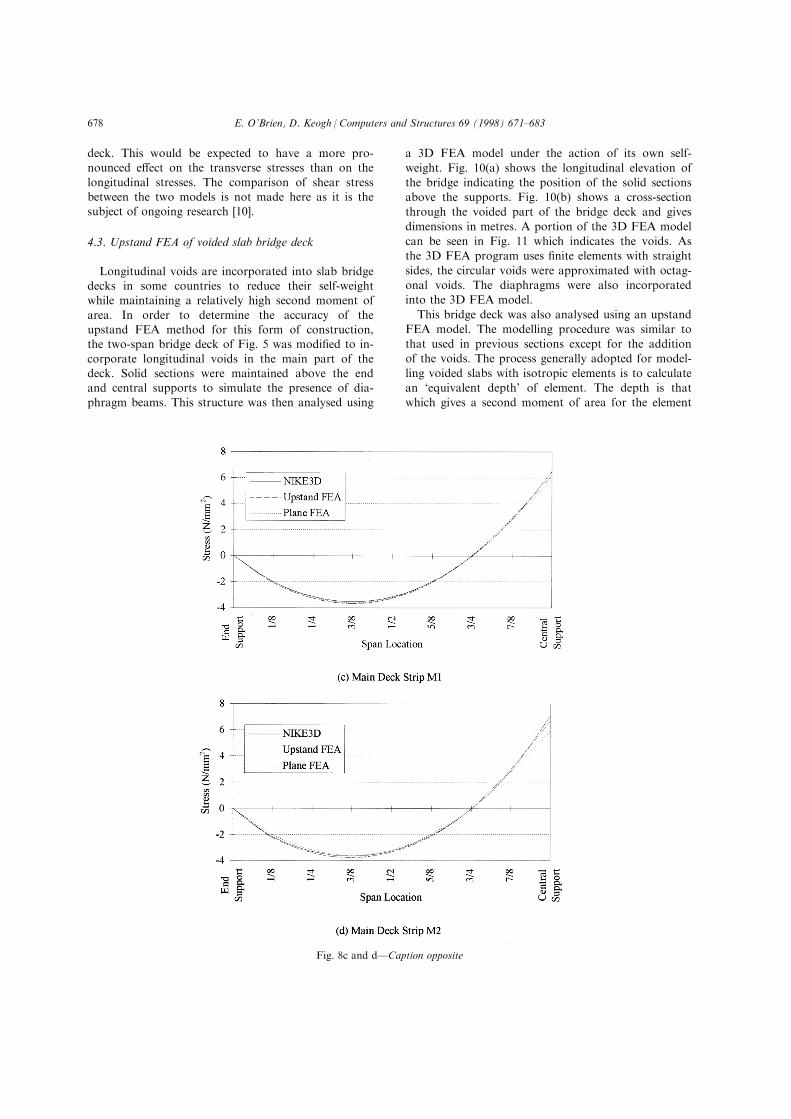
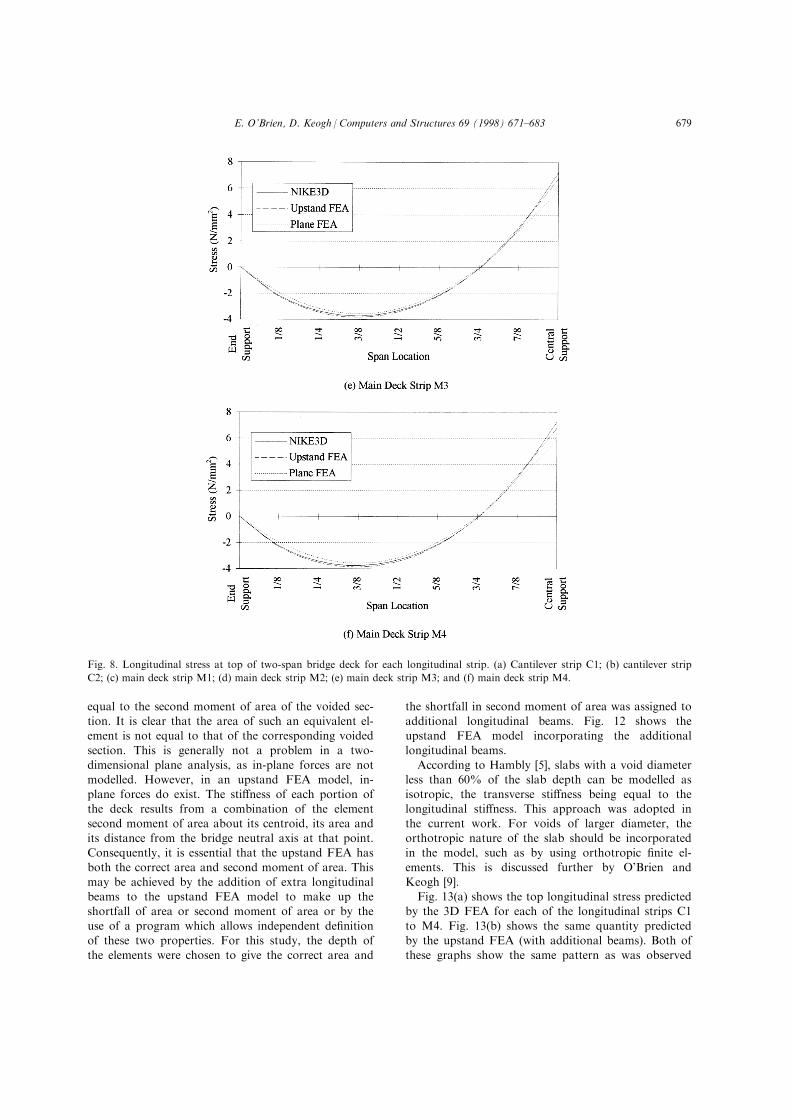
By comparing the stresses at other transverse lo-cations (Fig. 8(c)±(f)) it can be seen that all three ana-lyses predict stresses which are generally in close
agreement, but that those predicted by the plane FEA
Fig. 5. Upstand FEA model of two-span bridge deck.
Fig. 6. Subdivision of two-span bridge deck into longitudinal strips (`C' indicates cantilever strip, `M' indicates main deck strip).
E. O'Brien, D. Keogh / Computers and Structures 69 (1998) 671±683 675
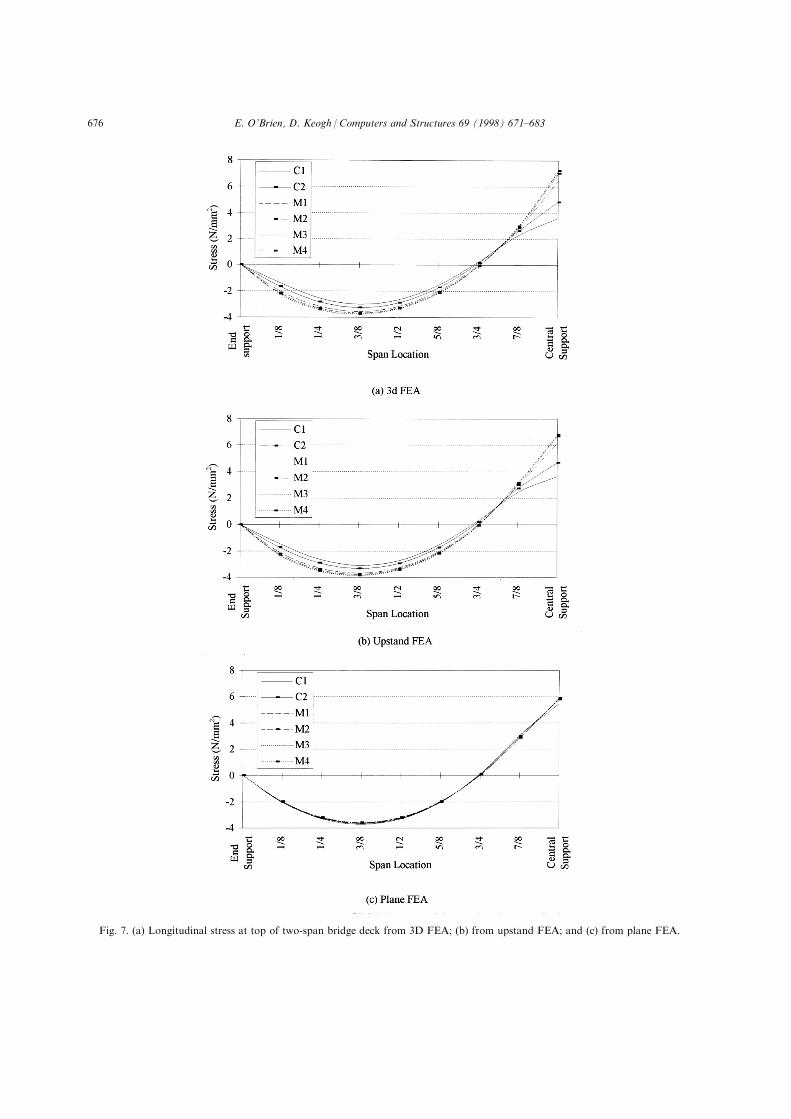
Fig. 7. (a) Longitudinal stress at top of two-span bridge deck from 3D FEA; (b) from upstand FEA; and (c) from plane FEA.
E. O'Brien, D. Keogh / Computers and Structures 69 (1998) 671±683676
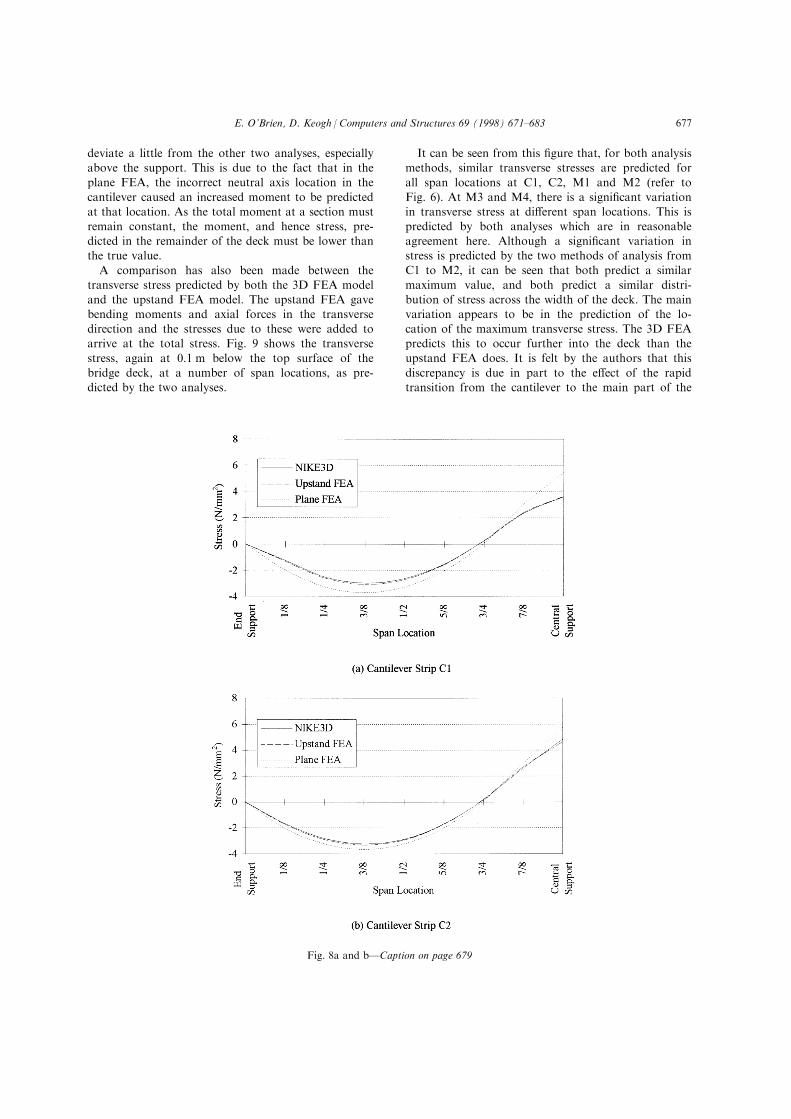
deviate a little from the other two analyses, especially
above the support. This is due to the fact that in the
plane FEA, the incorrect neutral axis location in the
cantilever caused an increased moment to be predicted
at that location. As the total moment at a section must
remain constant, the moment, and hence stress, pre-
dicted in the remainder of the deck must be lower than
the true value.
A comparison has also been made between the
transverse stress predicted by both the 3D FEA model
and the upstand FEA model. The upstand FEA gave
bending moments and axial forces in the transverse
direction and the stresses due to these were added to
arrive at the total stress. Fig. 9 shows the transverse
stress, again at 0.1 m below the top surface of the
bridge deck, at a number of span locations, as pre-
dicted by the two analyses.
It can be seen from this ®gure that, for both analysis
methods, similar transverse stresses are predicted for
all span locations at C1, C2, M1 and M2 (refer to
Fig. 6). At M3 and M4, there is a signi®cant variation
in transverse stress at di�erent span locations. This is
predicted by both analyses which are in reasonable
agreement here. Although a signi®cant variation in
stress is predicted by the two methods of analysis from
C1 to M2, it can be seen that both predict a similar
maximum value, and both predict a similar distri-
bution of stress across the width of the deck. The main
variation appears to be in the prediction of the lo-
cation of the maximum transverse stress. The 3D FEA
predicts this to occur further into the deck than the
upstand FEA does. It is felt by the authors that this
discrepancy is due in part to the e�ect of the rapid
transition from the cantilever to the main part of the
Fig. 8a and bÐCaption on page 679
E. O'Brien, D. Keogh / Computers and Structures 69 (1998) 671±683 677
deck. This would be expected to have a more pro-nounced e�ect on the transverse stresses than on the
longitudinal stresses. The comparison of shear stressbetween the two models is not made here as it is thesubject of ongoing research [10].
4.3. Upstand FEA of voided slab bridge deck
Longitudinal voids are incorporated into slab bridgedecks in some countries to reduce their self-weightwhile maintaining a relatively high second moment of
area. In order to determine the accuracy of theupstand FEA method for this form of construction,the two-span bridge deck of Fig. 5 was modi®ed to in-
corporate longitudinal voids in the main part of thedeck. Solid sections were maintained above the endand central supports to simulate the presence of dia-phragm beams. This structure was then analysed using
a 3D FEA model under the action of its own self-
weight. Fig. 10(a) shows the longitudinal elevation of
the bridge indicating the position of the solid sections
above the supports. Fig. 10(b) shows a cross-section
through the voided part of the bridge deck and gives
dimensions in metres. A portion of the 3D FEA model
can be seen in Fig. 11 which indicates the voids. As
the 3D FEA program uses ®nite elements with straight
sides, the circular voids were approximated with octag-
onal voids. The diaphragms were also incorporated
into the 3D FEA model.
This bridge deck was also analysed using an upstand
FEA model. The modelling procedure was similar to
that used in previous sections except for the addition
of the voids. The process generally adopted for model-
ling voided slabs with isotropic elements is to calculate
an `equivalent depth' of element. The depth is that
which gives a second moment of area for the element
Fig. 8c and dÐCaption opposite
E. O'Brien, D. Keogh / Computers and Structures 69 (1998) 671±683678
equal to the second moment of area of the voided sec-
tion. It is clear that the area of such an equivalent el-
ement is not equal to that of the corresponding voided
section. This is generally not a problem in a two-
dimensional plane analysis, as in-plane forces are not
modelled. However, in an upstand FEA model, in-
plane forces do exist. The sti�ness of each portion of
the deck results from a combination of the element
second moment of area about its centroid, its area and
its distance from the bridge neutral axis at that point.
Consequently, it is essential that the upstand FEA has
both the correct area and second moment of area. This
may be achieved by the addition of extra longitudinal
beams to the upstand FEA model to make up the
shortfall of area or second moment of area or by the
use of a program which allows independent de®nition
of these two properties. For this study, the depth of
the elements were chosen to give the correct area and
the shortfall in second moment of area was assigned to
additional longitudinal beams. Fig. 12 shows the
upstand FEA model incorporating the additional
longitudinal beams.
According to Hambly [5], slabs with a void diameterless than 60% of the slab depth can be modelled as
isotropic, the transverse sti�ness being equal to the
longitudinal sti�ness. This approach was adopted in
the current work. For voids of larger diameter, the
orthotropic nature of the slab should be incorporated
in the model, such as by using orthotropic ®nite el-
ements. This is discussed further by O'Brien and
Keogh [9].
Fig. 13(a) shows the top longitudinal stress predicted
by the 3D FEA for each of the longitudinal strips C1
to M4. Fig. 13(b) shows the same quantity predicted
by the upstand FEA (with additional beams). Both of
these graphs show the same pattern as was observed
Fig. 8. Longitudinal stress at top of two-span bridge deck for each longitudinal strip. (a) Cantilever strip C1; (b) cantilever strip
C2; (c) main deck strip M1; (d) main deck strip M2; (e) main deck strip M3; and (f) main deck strip M4.
E. O'Brien, D. Keogh / Computers and Structures 69 (1998) 671±683 679

for the solid bridge deck; that is zero stress at the end
support, maximum compressive stress at 3/8 span, zero
stress near 3/4 span and maximum tensile stress at the
central support. The variation of longitudinal stress
transversely across the bridge from M4 to C1 which
was observed in the solid bridge deck is again observed
in both of these ®gures.
Fig. 14 provides comparisons of the stresses of
the preceding ®gure for two typical longitudinal strips,
C1 and M1. The predictions from the two analyses
Fig. 9. Transverse stress at top of two-span bridge deck.
Fig. 10. (a) Longitudinal elevation and (b) cross-section of two-span voided bridge deck.
Fig. 11. Portion of 3D FEA model of two-span voided bridge deck.
E. O'Brien, D. Keogh / Computers and Structures 69 (1998) 671±683680

Fig. 12. Upstand FEA of voided bridge deck with additional longitudinal beams.
Fig. 13. (a) Longitudinal stress at top of voided bridge deck from 3D FEA and (b) from upstand FEA.
E. O'Brien, D. Keogh / Computers and Structures 69 (1998) 671±683 681
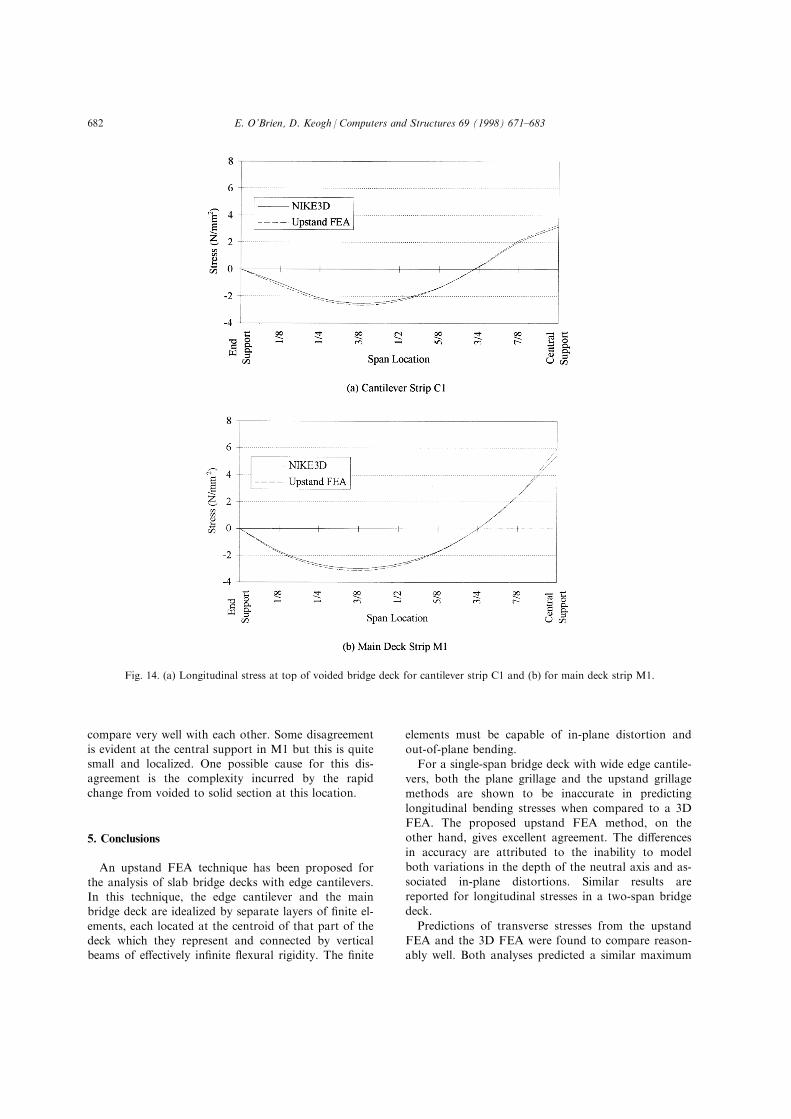
compare very well with each other. Some disagreement
is evident at the central support in M1 but this is quitesmall and localized. One possible cause for this dis-agreement is the complexity incurred by the rapid
change from voided to solid section at this location.
5. Conclusions
An upstand FEA technique has been proposed for
the analysis of slab bridge decks with edge cantilevers.In this technique, the edge cantilever and the mainbridge deck are idealized by separate layers of ®nite el-
ements, each located at the centroid of that part of thedeck which they represent and connected by verticalbeams of e�ectively in®nite ¯exural rigidity. The ®nite
elements must be capable of in-plane distortion and
out-of-plane bending.
For a single-span bridge deck with wide edge cantile-
vers, both the plane grillage and the upstand grillage
methods are shown to be inaccurate in predicting
longitudinal bending stresses when compared to a 3D
FEA. The proposed upstand FEA method, on the
other hand, gives excellent agreement. The di�erences
in accuracy are attributed to the inability to model
both variations in the depth of the neutral axis and as-
sociated in-plane distortions. Similar results are
reported for longitudinal stresses in a two-span bridge
deck.
Predictions of transverse stresses from the upstand
FEA and the 3D FEA were found to compare reason-
ably well. Both analyses predicted a similar maximum
Fig. 14. (a) Longitudinal stress at top of voided bridge deck for cantilever strip C1 and (b) for main deck strip M1.
E. O'Brien, D. Keogh / Computers and Structures 69 (1998) 671±683682

transverse stress and a similar distribution across thewidth of the deck. However, a discrepancy was noted
in the location of the point of maximum transversestress.A voided slab bridge deck, again with wide edge
cantilevers, was also analysed using the upstand FEAtechnique. The presence of the voids complicated themodelling and, for the software used, required the ad-
dition of extra beams in order to maintain both thecorrect area and second moment of area of the voidedsections. Isotropic ®nite elements were used as the void
depth was less than 60% of the slab depth. The modelwas analysed under the action of self-weight and a 3DFEA was carried out for comparison. The predictionsof top longitudinal stress from the upstand FEA once
again compared very well with those from the 3DFEA.
Acknowledgements
The authors would like to thank the developers of
the STRAP program and the Lawrence LivermoreNational Laboratory for providing the analysis soft-ware used in this paper.
References
[1] STRAP structural analysis programs user's manual version
6.00. Te-Aviv, Israel: ATIR Engineering Software
Development. 1991.
[2] Best BC. Methods of analysis for slab type structures.
London: CIRIA, 1974.
[3] Cope RJ, Clark LA. Concrete slabsÐanalysis and de-
sign. London: Elsevier, 1984.
[4] Cusens AR, Pama RP. Bridge deck analysis. London:
Wiley, 1975.
[5] Hambly EC. Bridge deck behaviour. Londonn: Chapman
& Hall, 1991.
[6] Keogh D L, O'Brien EJ. Recommendations on the use
of a 3-D grillage model for bridge deck analysis. Struct.
Engng Rev, 1996.
[7] Maker BN, Ferencz RM, Hallquist JO. NIKE3D a non-
linear, implicit, three dimensional ®nite element code for
solid and structural mechanics, user's manual. Lawrence
Livermore National Laboratory, report no. UCRL-MA-
105268, 1991.
[8] O'Brien EJ, Keogh DL. Neutral axis variation in bridge
decks. In: Third International Conference on
Computational Structures Technology. Budapest: Civil-
Comp Press, August, 1996: 421±7.
[9] O'Brien EJ, Keogh DL. Bridge deck analysis. London: E
& FN Spon, 1999.
[10] O'Brien SG, O'Brien EJ, Keogh DL. The calculation of
shear force in prestressed concrete bridge slabs. In: The
Concrete Way to Development. Johannesburg: FIP
Symposium, 1997: 233±7.
[11] Turner M J, Clough RW, Martin HC, Topp LJ. Sti�ness
and de¯ection analysis of complex structures. J. Aero.
Sci. 1956;23:805±23.
[12] West R. Recommendations on the use of grillage analysis
for slab and pseudo-slab bridge decks. London: C&CA/
CIRIA, 1973.
[13] Zienkiewicz O C, Cheung YK. The ®nite element method
for analysis of elastic isotropic and orthotropic slabs.
Proc. Instn. Civ. Engnrs 1964;28 Aug:471±88.
E. O'Brien, D. Keogh / Computers and Structures 69 (1998) 671±683 683