ups: tracking information - national fuel gas company · empire pipeline, inc. pendleton compressor...
TRANSCRIPT

UPS: Tracking Information
https://www.campusship.ups.com/...ight=1&carbonNeutralShipment=0&commercialInvoiceRemovalStatus=N&payment=0&displayFlag=1&[2/29/2016 9:59:09 AM]
Close Window
Tracking Detail
Your package has been delivered. Tracking Number: 1Z V31 Y26 A2 9201 129 9Type: Package Status: Delivered Delivered On: 02/29/2016 9:08 A.M. Signed By: GILL Location: RECEIVER Delivered To: 270 MICHIGAN AVE
BUFFALO, NY, US 14203
Shipped/Billed On: 02/26/2016 Reference Number(s): 0890, 04-89639 Service: NEXT DAY AIR Special Instructions: ADULT SIGNATURE REQUIRED Weight: 1.00 Lb
Package Progress
Location Date Local Time Description
BUFFALO,NY, US
02/29/2016 9:08 A.M. DELIVERY
02/29/2016 6:00 A.M. OUT FOR DELIVERY
BUFFALO,NY, US
02/26/2016 9:24 P.M. DESTINATION SCAN
02/26/2016 9:15 P.M. ORIGIN SCAN
02/26/2016 5:26 P.M. PICKUP SCAN
US 02/26/2016 11:55 A.M. BILLING INFORMATION RECEIVED
Tracking results provided by UPS: 02/29/2016 9:58 A.M. ET
NOTICE: UPS authorizes you to use UPS tracking systems solely to track shipments tendered by or for you to UPS for delivery and for no other purpose. Any other use of UPS tracking systems and information is strictly prohibited.
Copyright © 1994-2016 United Parcel Service of America, Inc. All rights reserved.
UPS: Tracking Information
https://www.campusship.ups.com/...E-%5EN%5E-%5E0%5EN%5E0%5E&Requester=UIS&refNumbers=0890%2C+04-89639&loc=en_US[2/29/2016 9:59:19 AM]
Delivery Notification
Dear Customer,
This notice serves as proof of delivery for the shipment listed below.
Tracking Number: 1Z V31 Y26 A2 9201 129 9Reference Number(s): 0890, 04-89639Service: NEXT DAY AIRSpecial Instructions: ADULT SIGNATURE REQUIREDWeight: 1.00 LbShipped/Billed On: 02/26/2016Delivered On: 02/29/2016 9:08 A.M.Delivered To: 270 MICHIGAN AVE
BUFFALO, NY, US 14203Signed By: GILL
Location: RECEIVER
Thank you for giving us this opportunity to serve you.
Sincerely, UPS
Tracking results provided by UPS: 02/29/2016 9:59 A.M. ET
Empire Pipeline, Inc. Pendleton Compressor Station – NA2016 Page 1 of 4
AIR PERMIT APPLICATION EMPIRE PIPELINE, INC.
Pendleton Compressor Station Pendleton, New York
Empire Pipeline, Inc. (Empire) is submitting this air permit application for the proposed Pendleton Compressor Station which is part of National Fuel’s Northern Access 2016 project (NA2016). The application form is included as Attachment A to this package. BACKGROUND The proposed facility will consist of the following equipment:
• Two (2) 11,626 site-rated hp (11,107 ISO rated hp) Solar Taurus 70 turbines with SoLoNoX technology, equipped with oxidation catalysts.
• One (1) permit exempt 1,053 hp Caterpillar G3516 LE emergency generator with non-selective catalytic reduction (NSCR) catalyst.
The proposed facility is located in Pendleton, New York on Killian Road between Townline and Bear Ridge Roads. A Project Locus Map is included as Figure 1, and a Site Plan is included as Figure 2. The following sections describe the facility equipment and the results of Empire’s evaluations of Potential-to-Emit (PTE) emissions, air quality impacts, and regulatory applicability for each emissions source. Supporting documents are included as Attachments B through E. Compressor Turbines The proposed Solar Taurus 70 turbines will drive compressors used for compression of natural gas within Empire’s transmission pipeline system. The turbines are simple-cycle natural gas-fired combustion turbines with the state-of-the-art SoLoNoX technology. As a result, nitrous oxide (NOx) emissions will not exceed 15 parts per million on a dry volume basis (ppmvd) at 15% oxygen. The guaranteed turbine NOx emission rate of 15 ppmvd for the proposed turbines is 40 percent lower than the applicable 25 ppmvd at 15 percent oxygen NOx emission limit for stationary combustion turbines set forth under 40 CFR 60, Subpart KKKK, paragraph 4320(a). Additionally, Empire is voluntarily electing to install oxidation catalysts on each of the turbine exhaust systems in order to reduce carbon monoxide (CO), volatile organic compounds (VOC), hydrocarbon hazardous air pollutants (HAPs), and formaldehyde (HCHO) emissions. Furthermore, Empire has committed to additional leading industry best management practices and has elected to install a vent gas recovery system at the facility. Vent gas recovery, and turbine dry seal technology will reduce natural gas and VOC venting to the atmosphere. Pollutant-to-emit (PTE) emissions from the proposed turbines were calculated based on site-specific emissions and operational data provided by the Solar Predicted Emissions Performance Sheet for a Solar Taurus 70 turbine (included as Attachment C). The emissions and operational data corresponding to the 100% load and 0 degrees Fahrenheit (°F) ambient temperature operating case was selected for this application as a conservative emissions estimate. PTE
Empire Pipeline, Inc. Pendleton Compressor Station – NA2016 Page 2 of 4
emissions are based on 8,760 hours of operation per year and equipment operational maximums. (Refer to Attachment B). Turbine operation in extreme ambient conditions (i.e., subzero temperatures) results in higher hourly emissions of select pollutants than during normal operations. Based on a review of meteorological records provided by the National Weather Service, the number of days during which the turbines are anticipated to operate in subzero temperatures annually is very limited. Furthermore, Empire will be utilizing Solar’s optional Cold Ambient Fuel Logic Controls to reduce emissions under subzero ambient temperature operating conditions. For the purposes of PTE calculations, it has been conservatively assumed that the turbines will operate at 100% load and 0°F for 8,760 hours annually. Therefore, due to the limited hours the turbines will operate in subzero temperatures it is assumed that calculated PTE annual emissions are adequately conservative to account for increased hourly emissions under subzero conditions.
The proposed turbines are subject to the Federal Clean Air Act (CAA) New Source Performance Standards (NSPS) 40 CFR 60 Subpart KKKK since the turbines will be constructed after February 18, 2005 and have a heat input at peak load greater than or equal to 10 MMBtu/hr. Therefore, the turbines must meet the nitrous oxide (NOx) and sulfur dioxide (SO2) emission limits specified in §60.4320(a) and §60.4330(a), respectively, and demonstrate on-going compliance with the NOx emission limit as specified in §60.4340. By complying with the alternative procedures set forth in §60.4365, Empire will not be required to monitor the total sulfur content of the fuel. Required performance tests for NOx will be conducted in accordance with §60.4400 and a written report of the results of each performance test will be submitted as set forth in §60.4375(b). The proposed turbines are also subject to requirements of 6 NYCRR Subpart 227-1 and must meet the opacity limits and general requirements specified in §227-1.3 and §227-1.7, respectively. Emergency Generator The proposed Caterpillar G3516 LE emergency generator is a 1,053 hp 4-stroke rich burn stationary internal combustion engine which will be equipped with a non-selective catalytic reduction (NSCR) catalyst to reduce emissions of NOx, CO, VOCs, and HCHO. This engine is exempt from permitting under 6 NYCRR Part 201-3.2(c)(6) as it is an emergency power generation stationary internal combustion engine that operates for 500 hours per year or less. Emissions from the proposed emergency generator are included in the facility-wide PTE emissions calculations. (Refer to Attachment B). Although exempt from permitting, this engine is subject to Federal NSPS as detailed in 40 CFR 60 Subpart JJJJ. As shown on the Caterpillar G3516 LE Gas Engine Technical Data Sheet included as Attachment D, this engine will meet the Subpart JJJJ emission limits. In addition, Empire will obtain guarantees from the engine manufacturer that the engine will meet lower emission limits in order to further reduce emissions from the proposed emergency generator. Facility
The EPA released the proposed rule 40 CFR 60, Subpart OOOOa on August 18, 2015 to regulate emissions sources and emissions from the oil and gas industry not regulated by the current NSPS, 40 CFR 60, Subpart OOOO. Subpart OOOOa has not been finalized at the time of this application

Empire Pipeline, Inc. Pendleton Compressor Station – NA2016 Page 3 of 4
submittal but it is anticipated that the proposed facility will be subject to the final rule once promulgated and therefore be required to meet applicable leak detection, recordkeeping, reporting, and other proposed compliance requirements. AIR QUALITY IMPACT SCREENING ANALYSIS The New York Department of Environmental Conservation (NYSDEC) requested that an air quality impact screening analysis of nitrogen dioxide (NO2) and HCHO emissions from the proposed turbines and emergency generator be completed as part of the facility air permitting process in order to evaluate:
1. whether facility NO2 emissions will meet the 1-hr NO2 National Ambient Air Quality Standard (NAAQS); and
2. whether facility HCHO emissions will meet the short-term guidance concentration (SGC) and annual guidance concentration (AGC) specified in the NYSDEC’s Policy DAR-1: Guidelines for the Control of Toxic Ambient Air Contaminants (DAR-1).
An air quality impact analysis was completed in response to the NYSDEC request using AERSCREEN (Version 15181) to demonstrate that the proposed facility will comply with the NAAQS. The results of this analysis are presented in the report dated February 26, 2016, included as Attachment E. An analysis of facility HCHO emissions was also completed and is presented as Appendix C to the modeling report. The following tables summarize the findings of the air quality impact analysis and demonstrate that NO2 and HCHO emissions from the proposed Pendleton Compressor Station demonstrate compliance with the 1-hr NO2 NAAQS and the DAR-1 HCHO AGC and SGC requirements.
AERSCREEN Air Quality Impact Results Summary - 1-hr NO2
Emission Source Maximum 1-Hr Concentration (µg/m3)
Background Concentration
(µg/m3)
Modeled + Background
Concentration (µg/m3)
NAAQS (µg/m3)
TUR1 43.05 N/A N/A
188 TUR2 38.79 N/A N/A
Facility Total 81.8 91.7 173.6
AERSCREEN Air Quality Impact Results Summary - Formaldehyde
Emission Source Maximum 1-Hr Concentration
(µg/m3)
Short-term Guidance Value
(µg/m3)
Annual Concentration
(µg/m3)
Annual Guidance Value (µg/m3)
TUR1 0.0625
30
0.00625
0.06 TUR2 0.0477 0.00477
EGN 3.08 0.0176
Facility Total 3.32 0.0286
Empire Pipeline, Inc. Pendleton Compressor Station – NA2016 Page 4 of 4
CONCLUSION Empire has committed to installing equipment that meets or beats applicable regulatory emissions standards and has elected to utilize additional emissions control technologies to further reduce emissions at the proposed Pendleton Compressor Station. Based on the calculated PTE emissions, the Pendleton Compressor Station will have potential air pollutant emissions less than the applicable major source thresholds. Additionally, PTE emissions and the predicted actual emissions for the facility are below 50% of the applicable major source thresholds. Therefore, the facility meets the requirements for an Air Facility Registration Certificate specified under 6 NYCRR Subpart 201-4.1

Empire Pipeline, Inc. Pendleton Compressor Station – NA2016
Figure 1 Pendleton Compressor Station
Project Locus Map

5011I-14FIGURE 1
11-18-2015
CPS
AS NOTED
PROPOSED PENDLETON COMPRESSOR STATIONPENDLETON, NEW YORKEMPIRE PIPELINE, INC.
Project Locus Map
DAY ENVIRONMENTAL, INC.Environmental ConsultantsRochester, New York 14606New York, New York 10170
Date
Drawn By
Scale
Project No.Project Title
Drawing Title
day
Shawnee Rd
Killian Rd
Beach R
idge R
d
Townline Rd
Bear
Ridg
e Rd
Hill Rd
Aiken Rd
Meyer Rd
Tonawanda Creek Rd
Slusaric Rd
Loveland Rd
Klemer
Rd
Ontario Dr
Wildwing Dr
Knottingwood Dr
Brenon Rd
Bull Creek Dr
Ridgeview Dr S
Spice Crk
Kriston Ln
Niagara Falls Blvd
Moyer Rd
Berks
hire D
r
Cardinal Ln
Tonawanda Creek Rd
Copyright:© 2013 National Geographic Society, i-cubed0 2,000 4,0001,000
Feet
NOTE:
Topo imagery provided by ESRI Online Services andUSGS 7.5 Minute Quad of Tonawanda East, dated 1980.
Site Coordinates are in Decimal Degrees:78° 48' 38.26" W 43° 4' 55.68" N
Proposed Pendleton Compressor StationPendleton, New York
Docu
ment
Path:
E:\G
IS\G
IS Ma
pping
\Nati
on_F
uel\5
011I-
14NF
UEL-
Pend
leton
\5011
I-2 - P
endle
ton Lo
cus.m
xdLa
st Da
te Sa
ved:
19 N
ov 20
15

Empire Pipeline, Inc. Pendleton Compressor Station – NA2016
Figure 2 Pendleton Compressor Station
Facility Site Plan

01-2016
CPS
AS NOTED
CLK
01-2016
01-12-2016
DATE DRAWN
DATEDESIGNED BY
DRAWN BY
SCALE DATE ISSUED
Document Path: D:\GIS\GIS Mapping\Nation_Fuel\5011I-14NFUEL-Pendleton\Air Permit Application\5011I-1-APA - Facility Site Plan.mxdLast Date Saved: 19 Feb 2016
Environmental ConsultantsRochester, New York 14606New York, New York 10170
DAY ENVIRONMENTAL, INC.yad
Facility Site Plan
5011I-14
FIGURE 2
Legend!( Emission Points
!!
! ! ! !
!!!!
FencingProposed BuildingsProposed Property Boundary
EMPIRE PIPELINE, INC.PENDLETON COMPRESSOR STATION PENDLETON, NEW YORKAIR PERMIT APPLICATION
Project No.
Drawing Title
Project Title
³
0 150 30075Feet
!!
!!
!!
!!
!!
!
!
!
!
!
!
!
!
!
!
!
!
!
!
!!
!!
!!
!!
!!
!
!
!
!
!
!
!
!
!
!
!
!!
!
!
!
!
!
!
!
!
!
!!
!
!
!
!
!
!
!!
!
!!
!!
!!
!!
!!
!!
!
!
!
!
!
!
!
!(
!(
!(
Meter Bldg.
Compressor Bldg. 2
Compressor Bldg. 1
PDC Bldg.
Office Bldg.
Fuel Gas Bldg.
Proposed Emergency Generator
Aux Bldg.
Proposed Emission Point- 00002
Proposed Emission Point - 00001
KILLIAN RD
Empire Pipeline, Inc. Pendleton Compressor Station – NA2016
ATTACHMENT A Pendleton Compressor Station
Air Permit
Application Form


Page 2
- -
Subdivision Paragraph Subparagraph ClauseFacility State Only Requirements Continuation Sheet(s)
SubclauseTitle Type Part Subpart Section
For all emission units subject to any applicable requirements that will become effective during the term of the permit, this facility will meet such requirements on a timely basis.
Compliance certification reports will be submitted at least once per year. Each report will certify compliance status with respect to each applicable requirement, and the method used to determine the status.
Title Type Part Subparagraph ClauseSubpart SubclauseSection Subdivision Paragraph
Affected States (Title V Facilities Only) Vermont Massachusetts Rhode Island Pennsylvania Tribal Land: __________________
New Hampshire Connecticut New Jersey Ohio Tribal Land:
NAICS Code(s)SIC Code(s)
Facility Description Continuation Sheet(s)
Facility Applicable Federal Requirements Continuation Sheet(s)
Compliance Statements (Title V Facilities Only)I certify that as of the date of this application the facility is in compliance with all applicable requirements. Yes NoIf one or more emission units at the facility are not in compliance with all applicable requirements at the time of signing this application (the 'NO" box must be checked), the noncomplying units must be identified in the "Compliance Plan" block on page 8 of this form along with the compliance plan information required. For all emission units at the facility that are operating in compliance with all applicable requirements, complete the following:
This facility will continue to be operated and maintained in such a manner as to assure compliance for the duration of the permit, except those emission units referenced in the compliance plan portion of this application.
New York State Department of Environmental ConservationAir Permit Application
DEC ID
Project Description Continuation Sheet(s)
Section III - Facility InformationFacility Classification
Hospital Residential Educational/Institutional Commercial Industrial Utility
Empire Pipeline, Inc. is proposing to construct a new natural gas transmission compressor station in the Town ofPendleton, Niagara County, NY as part of the Northern Access 2016 Expansion Project. The proposed PendletonCompressor Station will consist of the following equipment: Two (2) 11,626 site-rated HP natural gas-fired compressorturbines each equipped with an oxidation catalyst control device; and one (1) permit exempt 1,053 HP emerg. gen.
4922 486210
The proposed facility is a natural gas compression station that will compress natural gas in Empire Pipeline, Inc'stransmission pipeline. The facility will operate two (2) 11,626 site-rated HP natural gas-fired compressor turbines eachequipped with an oxidation catalyst control device; and one (1) 1,053-HP emergency generator.
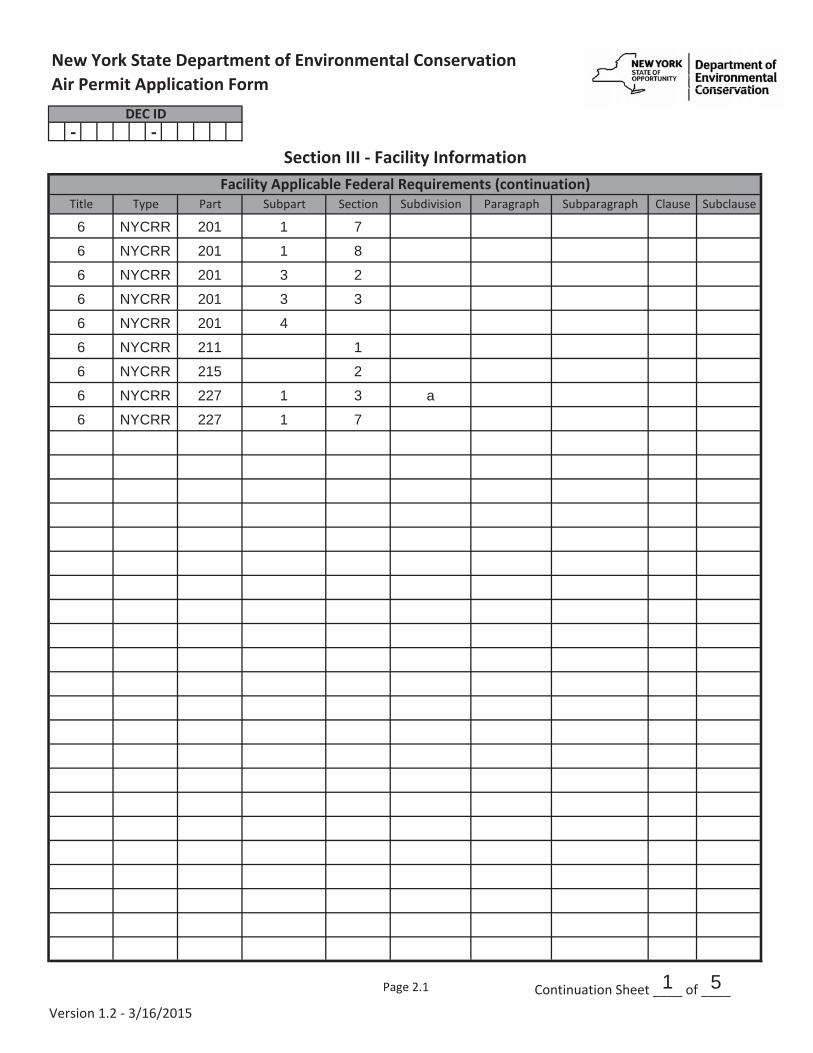
40 CFR 68
6 NYCRR 200 6
6 NYCRR 200 76 NYCRR 201 1 1
ECL 19 0301
6 NYCRR 201 1 4
6 NYCRR 201 1 56 NYCRR 211 2
Version 1.2 - 3/4/2015
- -
Continuation Sheet ____ of ____
Facility Applicable Federal Requirements (continuation)Paragraph SubclauseClauseSubparagraphTitle Type Part Subpart Section Subdivision
New York State Department of Environmental ConservationAir Permit Application Form
DEC ID
Section III - Facility Information
Page 2.1
6 NYCRR 201 1 7
6 NYCRR 201 1 8
6 NYCRR 201 3 2
6 NYCRR 201 3 3
6 NYCRR 201 4
6 NYCRR 211 1
6 NYCRR 215 2
6 NYCRR 227 1 3 a
6 NYCRR 227 1 7
1 5
Page 3
- -
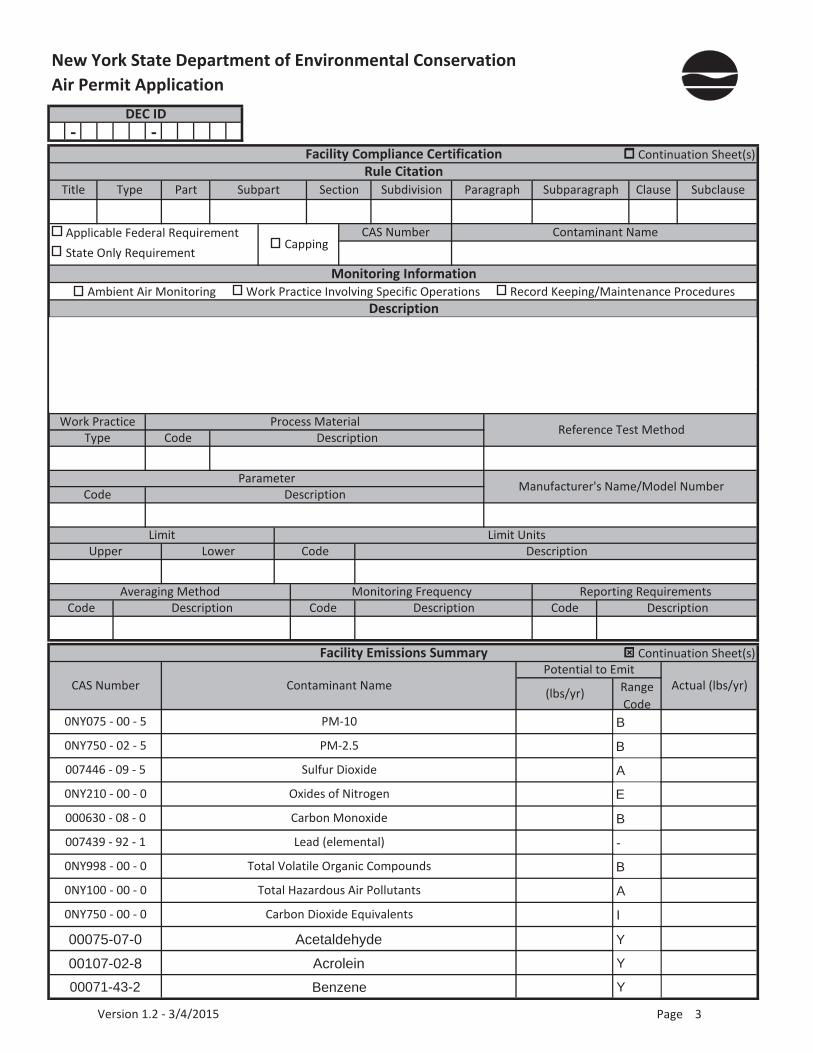
007439 - 92 - 1 Lead (elemental)
0NY750 - 00 - 0 Carbon Dioxide Equivalents
0NY998 - 00 - 0 Total Volatile Organic Compounds
0NY100 - 00 - 0 Total Hazardous Air Pollutants
000630 - 08 - 0 Carbon Monoxide
007446 - 09 - 5 Sulfur Dioxide
0NY210 - 00 - 0 Oxides of Nitrogen
0NY075 - 00 - 5 PM-10
Range Code
(lbs/yr)
0NY750 - 02 - 5 PM-2.5
CAS Number Contaminant Name
Facility Emissions Summary Continuation Sheet(s)Potential to Emit
Actual (lbs/yr)
Averaging Method Monitoring Frequency Reporting RequirementsCode Description Code Description Code Description
LimitUpper Lower
Limit UnitsCode Description
Work PracticeType Code Description
Process Material Reference Test Method
ParameterCode Description Manufacturer's Name/Model Number
Applicable Federal Requirement State Only Requirement
CappingCAS Number Contaminant Name
Monitoring Information Ambient Air Monitoring Work Practice Involving Specific Operations Record Keeping/Maintenance Procedures
Description
SubclauseRule Citation
Title Type Part Subpart Section Subdivision Paragraph Subparagraph Clause
DEC ID
Facility Compliance Certification Continuation Sheet(s)
New York State Department of Environmental ConservationAir Permit Application
B
B
A
E
B
-
B
A
I
00075-07-0 Acetaldehyde Y
00107-02-8 Acrolein Y
00071-43-2 Benzene Y
Version 1.2 - 3/4/2015
- -
Continuation Sheet ____ of ____
Actual(lbs/yr)
CAS No. Contaminant NamePTE
Range (lbs/yr)
New York State Department of Environmental ConservationAir Permit Application Form
DEC ID
Section III - Facility InformationFacility Emissions Summary (continuation)
Page 3.1
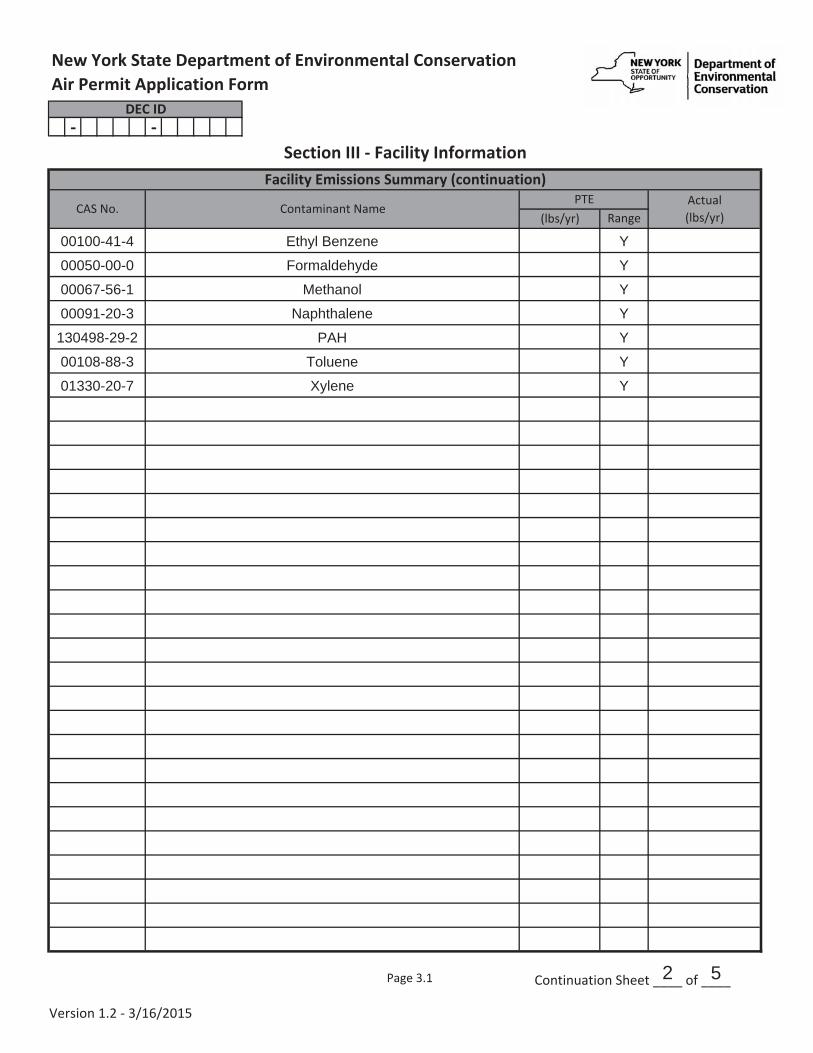
00100-41-4 Ethyl Benzene Y
00050-00-0 Formaldehyde Y
00067-56-1 Methanol Y
00091-20-3 Naphthalene Y
130498-29-2 PAH Y
00108-88-3 Toluene Y
01330-20-7 Xylene Y
2 5

Page 4
- -
-
Design Capacity
Design Capacity Units Waste Feed Waste TypeCode Description Code Description Code Description
Emission Source Date of Construction
Date of Operation
Date of Removal
Control Type Manufacturer's Name/Model NumberID Type Code Description
Design Capacity
Design Capacity UnitsCode Description
Waste FeedCode Description
Date of Construction
Date of Operation
Waste TypeCode Description
DescriptionManufacturer's
Name/Model NumberEmission Source
ID TypeDate of
RemovalControl Type
Code
Emission Source/Control Information Continuation Sheet(s)
Exit Velocity (FPS)
Exit Flow (ACFM)
NYTM (E) (KM) NYTM (N) (KM) Building Distance to Property Line (ft)
Date of Removal
Ground Elevation (ft)
Height (ft) Height Above Structure (ft)
Inside Diameter (in) Exit Temp. (oF)
Cross SectionLength (in) Width (in)
NYTM (E) (KM) NYTM (N) (KM) Building Distance to Property Line (ft)
Emission Point
Date of RemovalExit Velocity (FPS)
Exit Flow (ACFM)
Ground Elevation (ft)
Height (ft) Height Above Structure (ft)
Inside Diameter (in) Exit Temp. (oF)
Cross SectionLength (in) Width (in)
Emission PointEmission Point Information Continuation Sheet(s)
Building ID Length (ft) Width (ft) OrientationBuilding Name
Emission Unit
New York State Department of Environmental Conservation
Building Information Continuation Sheet(s)
Air Permit ApplicationDEC ID
Section IV - Emission Unit InformationEmission Unit Description Continuation Sheet(s)
Site Conditions - 0 degrees F/100% load
Site Conditions - 0 degrees F/100% load
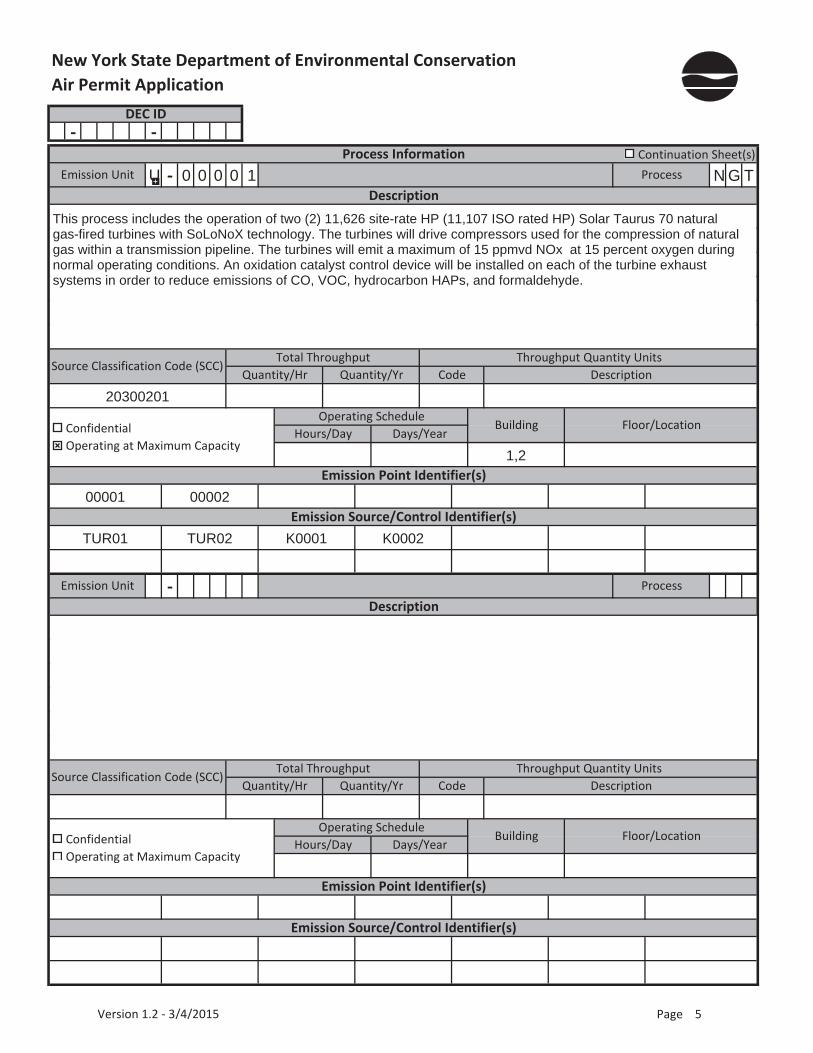
U 0 0 0 0 1This emission unit includes the operation of two (2) 11,626 site-rate HP (11,107 ISO rated HP) Solar Taurus 70 naturalgas-fired turbines with SoLoNoX technology. The turbines will drive compressors used for the compression of naturalgas within a transmission pipeline. The turbines will emit a maximum of 15 ppmvd NOx at 15 percent oxygen duringnormal operating conditions. An oxidation catalyst control device will be installed on each of the turbine exhaustsystems in order to reduce emissions of CO, VOC, hydrocarbon HAPs, and formaldehyde.
01 Compressor Building 1 74.5 62 330
02 Compressor Building 2 74.5 62 330
0 0 0 0 1
582 55.29 2.85 887 104 104
30.2 136199 01 1670 0 0 0 2
582 55.29 2.85 934 104 104
30.2 136199 02 223
T U R 0 1 C Fall 2016 Fall 2017 Solar Taurus 70
11,626 219 horsepower (mechanical)
T U R 0 2 C Fall 2016 Fall 2017 Solar Taurus 70
11,626 219 horsepower (mechanical)Version 1.2 - 3/4/2015

- -
-
Continuation Sheet ____ of ____
Code DescriptionDesign
CapacityDesign Capacity Units Waste Feed Waste Type
Code Description Code Description
Emission Source Date of Construction
Date of Operation
Date of Removal
Control Type Manufacturer's Name/Model No.ID Type Code Description
Code DescriptionDesign
CapacityDesign Capacity Units Waste Feed Waste Type
Code Description Code Description
Emission Source Date of Construction
Date of Operation
Date of Removal
Control Type Manufacturer's Name/Model No.ID Type Code Description
Code DescriptionDesign
CapacityDesign Capacity Units Waste Feed Waste Type
Code Description Code Description
Emission Source Date of Construction
Date of Operation
Date of Removal
Control Type Manufacturer's Name/Model No.ID Type Code Description
Code DescriptionDesign
CapacityDesign Capacity Units Waste Feed Waste Type
Code Description Code Description
Emission Source Date of Construction
Date of Operation
Date of Removal
Control Type Manufacturer's Name/Model No.ID Type Code Description
Code DescriptionDesign
CapacityDesign Capacity Units Waste Feed Waste Type
Code Description Code Description
Emission Source Date of Construction
Date of Operation
Date of Removal
Control Type Manufacturer's Name/Model No.ID Type Code Description
Waste TypeCode Description
Design Capacity
Design Capacity UnitsCode Description
Waste FeedCode Description
Control TypeCode Description
Manufacturer's Name/Model No.
Date of Construction
Date of Operation
Emission Unit
Emission SourceID Type
Date of Removal
New York State Department of Environmental ConservationAir Permit Application Form
DEC ID
Section IV - Emission Unit InformationEmission Source/Control (continuation)
Page 4.1
U 0 0 0 0 1
K0001 K Fall 2016 Spring 2017 110 Oxidation Catalyst Advanced Catalyst
K0002 K Fall 2016 Spring 2017 110 Oxidation Catalyst Advanced Catalyst
3 5
Page 5
- -
-
-
Confidential Operating at Maximum Capacity
Emission Source/Control Identifier(s)
Emission Point Identifier(s)
Emission Source/Control Identifier(s)
Throughput Quantity UnitsQuantity/Hr Quantity/Yr
Emission Unit Process
Description
Code
Operating ScheduleBuilding Floor/Location
Hours/Day Days/Year
Floor/Location
Emission Point Identifier(s)
Operating ScheduleHours/Day
Source Classification Code (SCC)Total Throughput
Quantity/Hr Quantity/YrThroughput Quantity Units
Building
Source Classification Code (SCC)Total Throughput
Description
Code Description
Emission Unit Process
Description
Confidential Operating at Maximum Capacity
Days/Year
New York State Department of Environmental ConservationAir Permit Application
DEC ID
Process Information Continuation Sheet(s)
U 0 0 0 0 1 N G T
This process includes the operation of two (2) 11,626 site-rate HP (11,107 ISO rated HP) Solar Taurus 70 naturalgas-fired turbines with SoLoNoX technology. The turbines will drive compressors used for the compression of naturalgas within a transmission pipeline. The turbines will emit a maximum of 15 ppmvd NOx at 15 percent oxygen duringnormal operating conditions. An oxidation catalyst control device will be installed on each of the turbine exhaustsystems in order to reduce emissions of CO, VOC, hydrocarbon HAPs, and formaldehyde.
20300201
1,2
00001 00002
TUR01 TUR02 K0001 K0002
Version 1.2 - 3/4/2015

Page 6
- -
Applicable Federal Requirement State Only Requirement CappingEmission Source
CAS Number Contaminant Name
Rule CitationTitle Type Part Subpart Section Subdivision
Monitoring Information
Emission Unit Emission Point
Process
Emission Unit Compliance Certification Continuation Sheet(s)
SubclauseParagraph Subparagraph Clause
Subparag. Cl. Subcl. Continuation Sheet(s)
Title Type PartEmission Unit
Emission Point
ProcessEmission Source
Emission Unit State Only RequirementsSubpart Section Subdiv. Parag.
ProcessEmission Source Title Subpart Subparag.Section Subdiv. Parag. Cl. Subcl.
Emission Unit Applicable Federal Requirements
DEC ID
New York State Department of Environmental ConservationAir Permit Application
PartType Continuation Sheet(s)
Emission UnitEmission
Point
Description
Ambient Air Monitoring Record Keeping/Maintenance ProceduresDescription
Work Practice Process MaterialReference Test Method
Type
ParameterManufacturer's Name/Model Number
Code Description
Continuous Emission Monitoring Monitoring of a Process or Control Device Parameters as a Surrogate Intermittent Emission Testing Work Practice Involving Specific Operations
Code Description
Limit Limit UnitsUpper Lower Code Description
Averaging Method Monitoring Frequency Reporting RequirementsCode Description Code Description
Code
U-00001 40 CFR 60 KKKK 4320 a
U-00001 40 CFR 60 KKKK 4330 a
U-00001 40 CFR 60 KKKK 4333 aU-00001 40 CFR 60 KKKK 4340 a
Version 1.2 - 3/4/2015

- -
Subpart Section Subdiv. Parag.
Continuation Sheet ____ of ____
Type Part Clause
New York State Department of Environmental ConservationAir Permit Application Form
DEC ID
Section IV - Emission Unit InformationEmission
UnitEmission
PointProcess
Emission Source
Emission Unit Applicable Federal Requirements (continuation)Title Subparag. Subcl.
Page 6.1
U-00001 40 CFR 60 KKKK 4365
U-00001 40 CFR 60 KKKK 4375 b
U-00001 40 CFR 60 KKKK 4400
4 5

- -
Subpart Section Subdiv. Parag.
Continuation Sheet ____ of ____
Type Part Clause
New York State Department of Environmental ConservationAir Permit Application Form
DEC ID
Section IV - Emission Unit InformationEmission
UnitEmission
PointProcess
Emission Source
Emission Unit Applicable Federal Requirements (continuation)Title Subparag. Subcl.
Page 6.2
Permit Exempt EmergencyGenerator Requirements
EXEMPT 40 CFR 60 JJJJ 4233 e
40 CFR 60 JJJJ 4234
40 CFR 60 JJJJ 4237 a
40 CFR 60 JJJJ 4243 b 2 ii
40 CFR 60 JJJJ 4243 d
40 CFR 60 JJJJ 4243 g
40 CFR 60 JJJJ 4244
40 CFR 60 JJJJ 4245 a 1
40 CFR 60 JJJJ 4245 a 2
40 CFR 60 JJJJ 4245 a 4
40 CFR 60 JJJJ 4245 b
40 CFR 60 JJJJ 4245 c
40 CFR 60 JJJJ 4245 d
40 CFR 60 JJJJ 4246
5 5

Page 7
- -
-
-
-
New York State Department of Environmental ConservationAir Permit Application
Clause SubclausePart Subpart Section Subdivision Paragraph Subparagraph
DEC ID
Determination of Non-Applicability (Title V Only) Continuation Sheet(s)Rule Citation
Title Type
Emission Unit Emission Point Process Emission Source Applicable Federal Requirement State Only Requirement
Type Part Subpart Section Subdivision Paragraph
Description
Rule CitationTitle
Emission Unit Process
Emission Unit Emission Point Process Emission Source Applicable Federal Requirement State Only Requirement
Description
Process Emissions Summary Continuation Sheet(s)
Subparagraph Clause Subclause
ERP How DeterminedCAS Number Contaminant Name % Thruput % Capture % Control ERP (lbs/hr)
Process
Potential to Emit(lbs/hr) (lbs/yr) (standard units)
Standard Units
Potential to Emit How Determined
Actual Emissions(lbs/hr) (lbs/yr)
Emission Unit
(standard units) (lbs/hr) (lbs/yr)
CAS Number Contaminant Name % Thruput % Capture % Control ERP (lbs/hr) ERP How Determined
Emission Unit Process
Potential to Emit Standard Units
Potential to Emit How Determined
Actual Emissions(lbs/hr) (lbs/yr)
(lbs/hr) (lbs/yr)
CAS Number Contaminant Name % Thruput % Capture % Control ERP (lbs/hr) ERP How Determined
Potential to Emit Standard Units
Potential to Emit How Determined
Actual Emissions(lbs/hr) (lbs/yr) (standard units)
Version 1.2 - 3/4/2015

Page 8
- -
-
New York State Department of Environmental ConservationAir Permit Application
ERP (lbs/yr)Potential to Emit
(lbs/hr) (lbs/yr)Actual Emissions
(lbs/hr) (lbs/yr)
CAS Number Contaminant Name
DEC ID
Emission Unit Emission Unit Emissions Summary Continuation Sheet(s)
CAS Number Contaminant Name
(lbs/yr) (lbs/hr) (lbs/yr)
ERP (lbs/yr)Potential to Emit Actual Emissions
(lbs/hr) (lbs/yr) (lbs/hr) (lbs/yr)
CAS Number Contaminant Name
ERP (lbs/yr)Potential to Emit Actual Emissions
(lbs/hr)
CAS Number Contaminant Name
Certified progress reports are to be submitted every 6 months beginning / /
ERP (lbs/yr)Potential to Emit Actual Emissions
(lbs/hr) (lbs/yr) (lbs/hr) (lbs/yr)
Parag. Subparag. Clause Subcl.
Compliance Plan Continuation Sheet(s)For any emission units which are not in compliance at the time of permit application, the applicant shall complete the following:
Consent Order
Emission Unit Process Emission Source
Applicable Federal RequirementTitle Type Part Subpart Section Subdiv.
Date ScheduledR/IRemedial Measure(s) / Intermediate Milestone(s)
Version 1.2 - 3/4/2015

Page 9
- -
- - /
- - /
Continuation Sheet(s)Emission Source
Date MethodBaseline Period ____ /____ /________ to ____ / ____ / ________
New York State Department of Environmental ConservationAir Permit Application
DEC ID
Request for Emission Reduction Credits
Emission Reduction Description
Contaminant Emission Reduction DataReduction
Facility to Use Future Reduction
CAS Number Contaminant NameERC (lbs/yr)
Netting Offset
Use of Emission Reduction Credits Continuation Sheet(s)
CAS Number Contaminant Name PEP (lbs/yr)
Application ID
Name
Location Address
City/ Town / Village State Zip
Name
Permit ID
Location Address
Emission SourceProposed Project Description
Contaminant Emissions Increase Data
ERC (lbs/yr)Netting OffsetContaminant Name
Statement of Compliance All facilities under the ownership of this "owner/firm" are operating in compliance with all applicable requirements and state
regulations including any compliance certification requirements under Section 114(a)(3) of the Clean Air Act Amendments of 1990, or are meeting the schedule of a consent order.
Source of Emission Reduction Credit - Facility
City/ Town / Village State Zip
Emission Source CAS Number
Version 1.2 - 3/4/2015
Page 10
- -
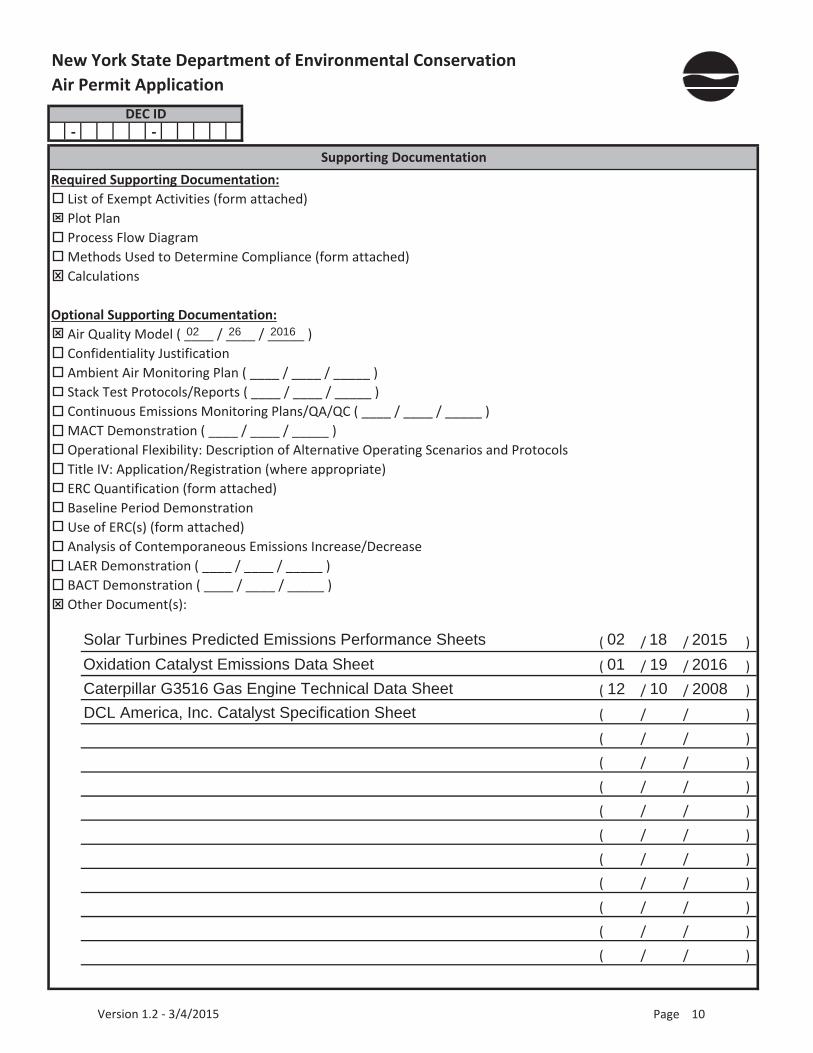
Required Supporting Documentation: List of Exempt Activities (form attached) Plot Plan Process Flow Diagram Methods Used to Determine Compliance (form attached) Calculations
Optional Supporting Documentation: Air Quality Model ( ____ / ____ / _____ ) Confidentiality Justification Ambient Air Monitoring Plan ( ____ / ____ / _____ ) Stack Test Protocols/Reports ( ____ / ____ / _____ ) Continuous Emissions Monitoring Plans/QA/QC ( ____ / ____ / _____ ) MACT Demonstration ( ____ / ____ / _____ ) Operational Flexibility: Description of Alternative Operating Scenarios and Protocols Title IV: Application/Registration (where appropriate) ERC Quantification (form attached) Baseline Period Demonstration Use of ERC(s) (form attached) Analysis of Contemporaneous Emissions Increase/Decrease LAER Demonstration ( ____ / ____ / _____ ) BACT Demonstration ( ____ / ____ / _____ ) Other Document(s):
( / / )
( / / )
( / / )
( / / )
New York State Department of Environmental ConservationAir Permit Application
DEC ID
Supporting Documentation
( / / )
( / / )
( / / )
( / / )
( / / )
( / / )
( / / )
( / / )
( / / )
( / / )
02 26 2016
Solar Turbines Predicted Emissions Performance Sheets 02 18 2015Oxidation Catalyst Emissions Data Sheet 01 19 2016Caterpillar G3516 Gas Engine Technical Data Sheet 12 10 2008DCL America, Inc. Catalyst Specification Sheet
Version 1.2 - 3/4/2015

Empire Pipeline, Inc. Pendleton Compressor Station – NA2016
ATTACHMENT B Pendleton Compressor Station
Emissions Calculations
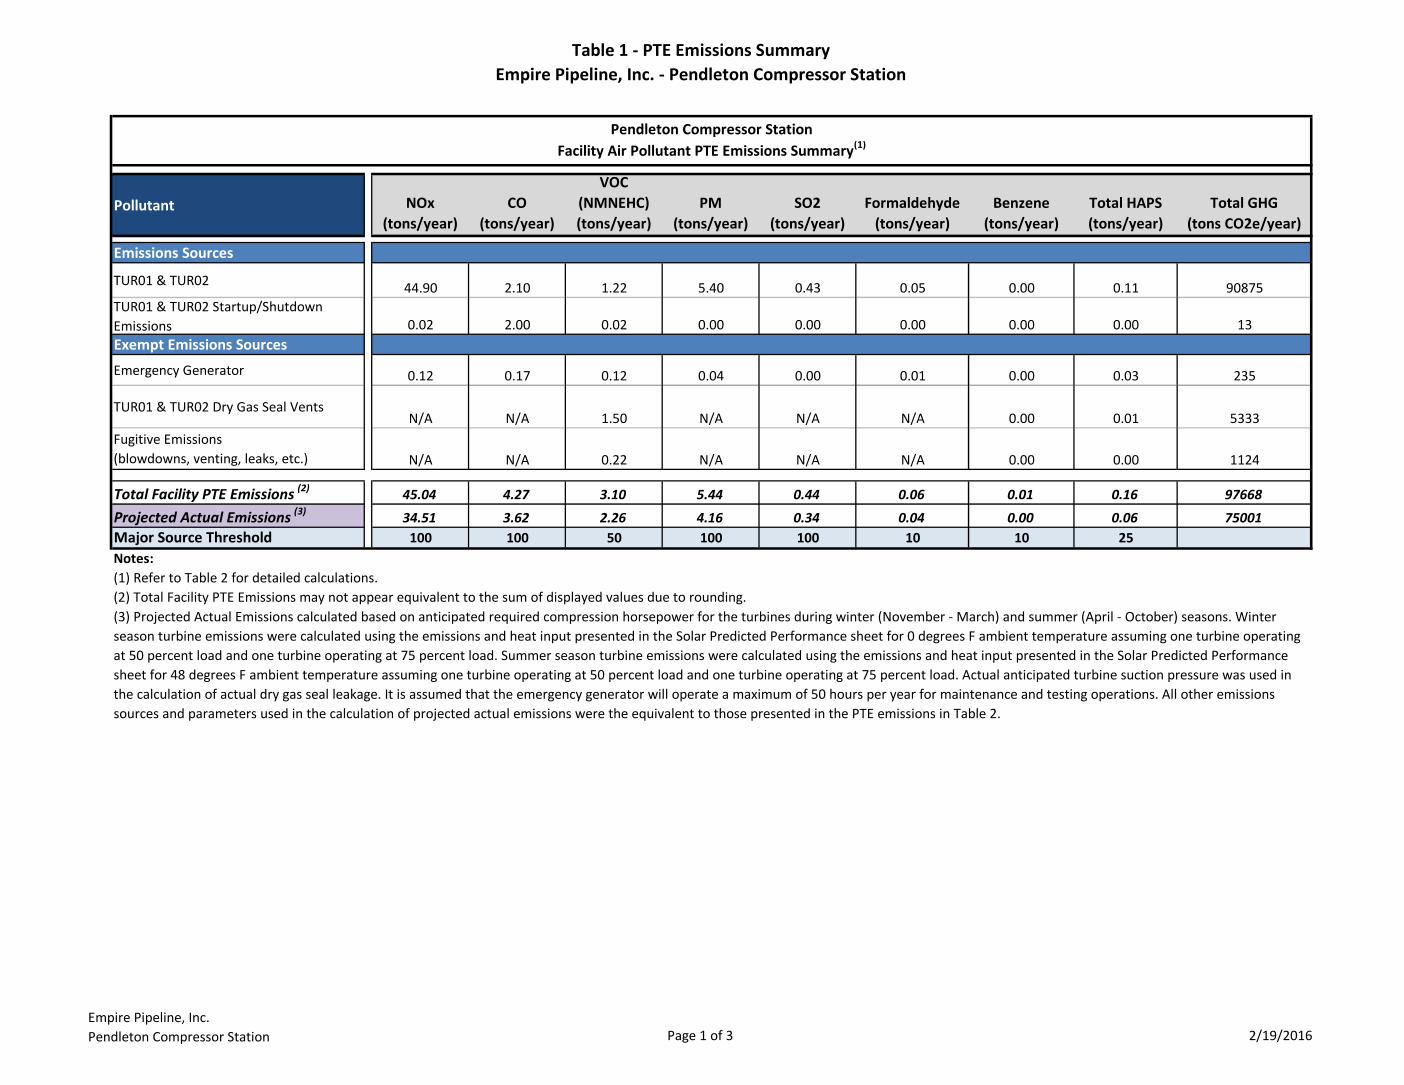
Table 1 - PTE Emissions SummaryEmpire Pipeline, Inc. - Pendleton Compressor Station
Empire Pipeline, Inc.Pendleton Compressor Station Page 1 of 3 2/19/2016
Pendleton Compressor StationFacility Air Pollutant PTE Emissions Summary(1)
Pollutant NOx (tons/year)
CO (tons/year)
VOC (NMNEHC) (tons/year)
PM (tons/year)
SO2 (tons/year)
Formaldehyde (tons/year)
Benzene (tons/year)
Total HAPS (tons/year)
Total GHG (tons CO2e/year)
Emissions Sources
TUR01 & TUR02 44.90 2.10 1.22 5.40 0.43 0.05 0.00 0.11 90875TUR01 & TUR02 Startup/Shutdown Emissions 0.02 2.00 0.02 0.00 0.00 0.00 0.00 0.00 13Exempt Emissions Sources
Emergency Generator 0.12 0.17 0.12 0.04 0.00 0.01 0.00 0.03 235
TUR01 & TUR02 Dry Gas Seal VentsN/A N/A 1.50 N/A N/A N/A 0.00 0.01 5333
Fugitive Emissions(blowdowns, venting, leaks, etc.) N/A N/A 0.22 N/A N/A N/A 0.00 0.00 1124
Total Facility PTE Emissions (2) 45.04 4.27 3.10 5.44 0.44 0.06 0.01 0.16 97668Projected Actual Emissions (3) 34.51 3.62 2.26 4.16 0.34 0.04 0.00 0.06 75001Major Source Threshold 100 100 50 100 100 10 10 25Notes:(1) Refer to Table 2 for detailed calculations.(2) Total Facility PTE Emissions may not appear equivalent to the sum of displayed values due to rounding.(3) Projected Actual Emissions calculated based on anticipated required compression horsepower for the turbines during winter (November - March) and summer (April - October) seasons. Winter season turbine emissions were calculated using the emissions and heat input presented in the Solar Predicted Performance sheet for 0 degrees F ambient temperature assuming one turbine operating at 50 percent load and one turbine operating at 75 percent load. Summer season turbine emissions were calculated using the emissions and heat input presented in the Solar Predicted Performance sheet for 48 degrees F ambient temperature assuming one turbine operating at 50 percent load and one turbine operating at 75 percent load. Actual anticipated turbine suction pressure was used in the calculation of actual dry gas seal leakage. It is assumed that the emergency generator will operate a maximum of 50 hours per year for maintenance and testing operations. All other emissions sources and parameters used in the calculation of projected actual emissions were the equivalent to those presented in the PTE emissions in Table 2.

Table 2 - PTE EmissionsEmpire Pipeline, Inc. - Pendleton Compressor Station
Empire Pipeline, Inc.Pendleton Compressor Station Page 2 of 3 2/19/2016
Source IDManufacturer/Model
Fuel Type Natural Gas Natural GasAnnual Operating Hours N/A N/A
Engine Horsepower N/A N/AHeat Input Capacity (MMBtu/hr) N/A N/A
Value Units lbs/hr tpy lbs/hr tpy lbs/hr tpy Value Units lbs/hr tpy lbs/hr tpyNOx 10.3 44.9 0.005 0.02 0.20 g/bhp-hr 0.46 0.12CO 0.48 2.10 0.456 2.00 0.30 g/bhp-hr 0.70 0.17VOC (NMNEHC) 0.28 1.22 0.343 1.50 0.005 0.023 0.20 g/bhp-hr 0.46 0.12 0.051 0.223PM Total 0.00660 lbs/MMBtu 1.23 5.40 0.0194 lbs/MMBtu 0.157 0.039SO2 0.000531 lbs/MMBtu 0.10 0.43 0.000588 lbs/MMBtu 0.005 0.001
Value Units lbs/hrtons
CO2e/year lbs/hr tons CO2e/year lbs/hr tons CO2e/year Value Units lbs/hrtons
CO2e/year lbs/hrtons
CO2e/year
CO2 110 lbs/MMBtu 20541 89968 0.071 0.311 3.00 13.1 110 lbs/MMBtu 892 223 0.015 0.067CH4 0.00860 lbs/MMBtu 1.61 176 48.7 5332 0.230 lbs/MMBtu 1.86 11.7 257 1125N2OTotal GHG 20543 90875 48.8 5333 3.00 13.1 894 235 257 1124
Value Units lbs/hr tpy lbs/hr tpy lbs/hr tpy Value Units lbs/hr tpy lbs/hr tpyAcetaldehyde 0.0000400 lbs/MMBtu 0.002 0.008 0 0 0.00279 lbs/MMBtu 0.023 0.006 0 0Acrolein 0.00000640 lbs/MMBtu 0.000 0.001 0 0 0.00263 lbs/MMBtu 0.021 0.005 0 0Benzene 0.0000120 lbs/MMBtu 0.001 0.002 0.000 0.001 0.00158 lbs/MMBtu 0.013 0.003 0.000 0.000Ethylbenzene 0.0000320 lbs/MMBtu 0.001 0.006 0.000 0.000 0.0000248 lbs/MMBtu 0.000 0.000 0.000 0.000Formaldehyde 0.001270 lbs/MMBtu 0.012 0.052 0.000 0.000 0.0205 lbs/MMBtu 0.040 0.010 0.000 0.000Hexane N/A 0.0000000 0.000 0.000 0.002 0.007 N/A 0 0.000 0.000 0.000 0.001Methanol N/A 0.0000000 0.000 0.000 0.000 0.000 0.00306 lbs/MMBtu 0.025 0.006 0.000 0.000PAH 0.00000220 lbs/MMBtu 0.000 0.000 0.000 0.000 0.000141 lbs/MMBtu 0.001 0.000 0.000 0.000Toluene 0.000130 lbs/MMBtu 0.006 0.025 0.000 0.000 0.000558 lbs/MMBtu 0.005 0.001 0.000 0.000Xylene 0.0000640 lbs/MMBtu 0.003 0.012 0.000 0.000 0.000195 lbs/MMBtu 0.002 0.000 0.000 0.000Total HAPs (12) 0.026 0.112 0.002 0.008 0.137 0.034 0.000 0.001
Notes:
(2) Equipment specifications based on Caterpillar G3516 LE specification sheet.
(4) Equipment specifications based on Solar T70 Predicted Emissions Performance sheet provided by the manufacturer.
(10) Global Warming Potentials: 25 for CH4, 298 for N20. Based on 40 CFR 98, Subpart A, Table A-1 - Global Warming Potentials.(11) Other HAPs, in addition to those listed as 'Selected HAPs' are emitted. Those HAPs are included in Total HAPs (see Note 11).(12) Total HAPs is the sum of emissions of all HAPs listed in the applicable AP-42 list for each combustion source.(13) Facility totals (Table 1) may not appear equivalent to sum of displayed values in this table due to rounding.
Pendleton Compressor StationFacility Air Pollutant PTE Emissions
TUR01 & TUR02 (Compressor Turbine Combustion Emissions with
Oxidation Catalysts)
TUR01 & TUR02(Compressor Turbine Gas Seal
Vent)
TUR01 & TUR02(Compressor Turbine
Startup/Shutdown Emissions)Fugitive EmissionsEmergency Generator
(6)87601162693.36
Solar Taurus 70 (x2) Solar Taurus 70 (x2) Solar Taurus 70 (x2)Natural Gas
(3)(4) (5) (7)(8)(9)
Caterpillar G3516 LENatural Gas
(1)(2)
Emissions
Greenhouse Gases (GHGs) (10)Emission Factor Emissions Emissions Emissions
Criteria PollutantEmission Factor Emissions Emissions
EmissionsEmission Factor
(7) Blowdown emissions estimates are based unit blowdown and emergency shutdown blowdown volumes for a similar National Fuel facility. It is conservatively assumed that the facility will have one unit blowdown per unit per month and 1 ESD event per year.
(9) Fugitive emissions sources include: valves, connectors, flanges, open-ended lines, blowdowns, centrifugal compressor venting, etc. Fugitive equipment leaks were calculated using average emission factors presented in Table 2-4 of EPA Document EPA-453/R-95-017, "Protocol for Equipment Leak Emissions Estimates". Source component counts were conservatively estimated based on another National Fuel facility. Centrifugal compressor venting was estimated using company wide "Reporter Emission Factors" for 2015; developed in accordance with the requirements of 40 CFR 98, Subpart W.
(8) Empire is electing to utilize vent gas recovery at the proposeed Pendleton Compressor Station to reduce emissions of vented natural gas to the atmosphere during blowdown events. However, based on the variability of blowdowns and difficulty in estimating exact emissions reductions from vent gas recovery, it has been conservatively assumed in these calculations that zero percent of vented gas is recovered.
Emissions Emissions
(1) Emission factors provided by AP-42 Table 3.2-3 with the exception of NOx, CO, VOC and HCHO which are based on the emission rates/reductions presented in the emergency generator catalyst manufacturer data sheet. Listed uncontrolled HCHO emission factor based on AP-42 Table 3.2-3. HCHO emissions calculated using the uncontrolled emission factor with manufacturer guaranteed 76% reduction applied.
(3) NOx, CO, and VOC emissions provided by Solar T70 predicted emissions performance sheet at 0 degrees F, 100% load, and 15 ppmv NOx at 15% O2. These conditions were assumed for year round operation in order to provide a conservative estimate of facility PTE emissions. Per Solar Product Information Letter (PIL) 168, VOC is estimated to be 20% of total predicted unburned hydrocarbons (UHC) value given in the predicted emissions performance sheet. The HCHO emission factor is provided by Solar PIL 168 for loads greater than 90%. Other emission factors provided by AP-42 Table 3.1. The oxidation catalyst reduces CO by 95.4%, VOC by 76.7%, and HCHO by 95%, which correspond to the minimum pollutant reduction percentages provided by the catalyst manufacturer's documentation.
(5) Emission factor for dry gas seals based on Solar Turbines Inc. PIL 251 dated January 28, 2013. Emission factor presented in PIL for C41 compressor set at 800 psig = 10 scf natural gas emitted per minute. CO2, CH4, and VOC emissions estimated using predicted natural gas stream composition from gas analyses.(6) Emissions estimates for startup/shutdown events based on Solar Turbine's PIL 170. Emissions per event: NOx = 1.1 lbs, CO = 166.5 lbs, VOC = 9.5 lbs, CO2 = 1094 lbs. Each turbine is assumed to have one startup/shutdown event per month. Estimate of VOCs calculated as 20% of given UHC Emissions based on Solar Turbine's PIL 168. The presented startup/shutdown values are conservatively assumed to be uncontrolled.
Select Individual Hazardous Air Pollutants (HAPs) (11)
Emission Factor Emissions Emissions
50010538.11
Emissions
EmissionsEmission Factor
Emission Factor
Emissions
Emissions
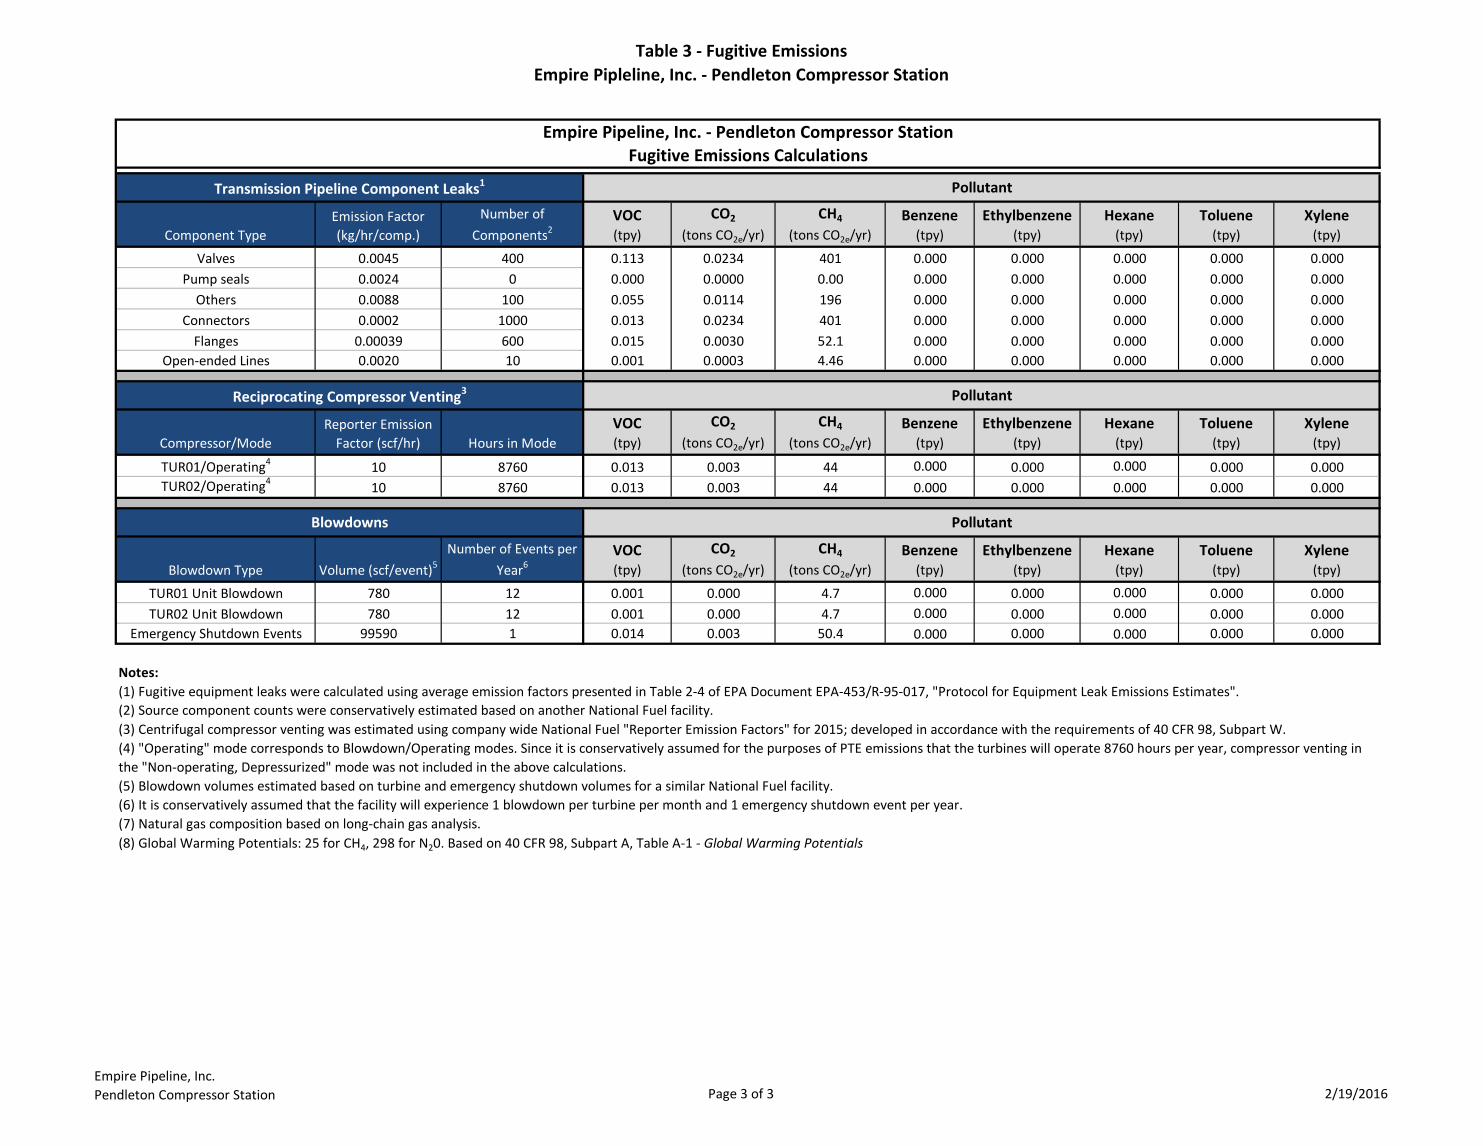
Table 3 - Fugitive EmissionsEmpire Pipleline, Inc. - Pendleton Compressor Station
Empire Pipeline, Inc.Pendleton Compressor Station Page 3 of 3 2/19/2016
Component TypeEmission Factor (kg/hr/comp.)
Number of Components2
VOC(tpy)
CO2
(tons CO2e/yr)CH4
(tons CO2e/yr)Benzene
(tpy)Ethylbenzene
(tpy)Hexane
(tpy)Toluene
(tpy)Xylene
(tpy)
Valves 0.0045 400 0.113 0.0234 401 0.000 0.000 0.000 0.000 0.000Pump seals 0.0024 0 0.000 0.0000 0.00 0.000 0.000 0.000 0.000 0.000
Others 0.0088 100 0.055 0.0114 196 0.000 0.000 0.000 0.000 0.000Connectors 0.0002 1000 0.013 0.0234 401 0.000 0.000 0.000 0.000 0.000
Flanges 0.00039 600 0.015 0.0030 52.1 0.000 0.000 0.000 0.000 0.000Open-ended Lines 0.0020 10 0.001 0.0003 4.46 0.000 0.000 0.000 0.000 0.000
Compressor/ModeReporter Emission
Factor (scf/hr) Hours in ModeVOC(tpy)
CO2
(tons CO2e/yr)CH4
(tons CO2e/yr)Benzene
(tpy)Ethylbenzene
(tpy)Hexane
(tpy)Toluene
(tpy)Xylene
(tpy)
TUR01/Operating4 10 8760 0.013 0.003 44 0.000 0.000 0.000 0.000 0.000TUR02/Operating4 10 8760 0.013 0.003 44 0.000 0.000 0.000 0.000 0.000
Blowdown Type Volume (scf/event)5Number of Events per
Year6VOC(tpy)
CO2
(tons CO2e/yr)CH4
(tons CO2e/yr)Benzene
(tpy)Ethylbenzene
(tpy)Hexane
(tpy)Toluene
(tpy)Xylene
(tpy)
TUR01 Unit Blowdown 780 12 0.001 0.000 4.7 0.000 0.000 0.000 0.000 0.000TUR02 Unit Blowdown 780 12 0.001 0.000 4.7 0.000 0.000 0.000 0.000 0.000
Emergency Shutdown Events 99590 1 0.014 0.003 50.4 0.000 0.000 0.000 0.000 0.000
Notes:
(2) Source component counts were conservatively estimated based on another National Fuel facility.
(8) Global Warming Potentials: 25 for CH4, 298 for N20. Based on 40 CFR 98, Subpart A, Table A-1 - Global Warming Potentials
Empire Pipeline, Inc. - Pendleton Compressor StationFugitive Emissions Calculations
Transmission Pipeline Component Leaks1 Pollutant
Reciprocating Compressor Venting3 Pollutant
(6) It is conservatively assumed that the facility will experience 1 blowdown per turbine per month and 1 emergency shutdown event per year.(7) Natural gas composition based on long-chain gas analysis.
Blowdowns Pollutant
(1) Fugitive equipment leaks were calculated using average emission factors presented in Table 2-4 of EPA Document EPA-453/R-95-017, "Protocol for Equipment Leak Emissions Estimates".
(3) Centrifugal compressor venting was estimated using company wide National Fuel "Reporter Emission Factors" for 2015; developed in accordance with the requirements of 40 CFR 98, Subpart W.(4) "Operating" mode corresponds to Blowdown/Operating modes. Since it is conservatively assumed for the purposes of PTE emissions that the turbines will operate 8760 hours per year, compressor venting in the "Non-operating, Depressurized" mode was not included in the above calculations.(5) Blowdown volumes estimated based on turbine and emergency shutdown volumes for a similar National Fuel facility.
Empire Pipeline, Inc. Pendleton Compressor Station – NA2016
ATTACHMENT C Pendleton Compressor Station
Solar Predicted Emissions Performance Sheet
15ppmvd NOx - 0°F Ambient Temperature/100% Load &
Oxidation Catalyst Emissions Data Sheet
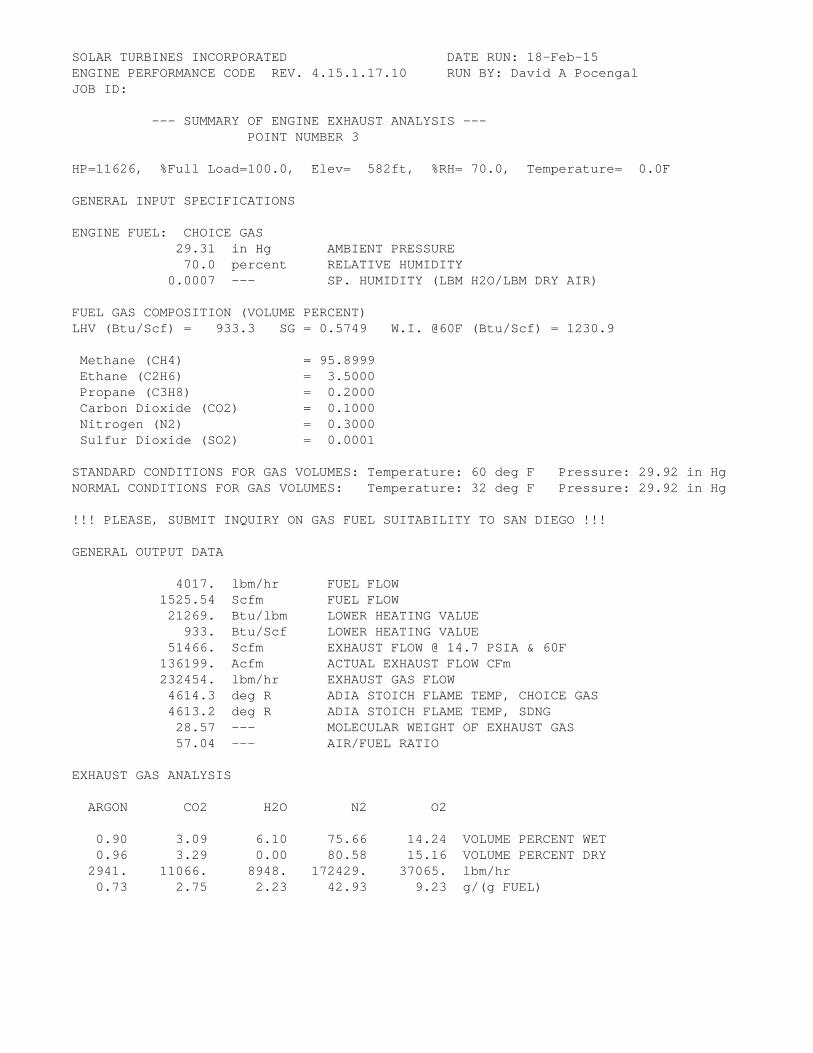
SOLAR TURBINES INCORPORATED DATE RUN: 18-Feb-15ENGINE PERFORMANCE CODE REV. 4.15.1.17.10 RUN BY: David A PocengalJOB ID:
--- SUMMARY OF ENGINE EXHAUST ANALYSIS --- POINT NUMBER 3
HP=11626, %Full Load=100.0, Elev= 582ft, %RH= 70.0, Temperature= 0.0F
GENERAL INPUT SPECIFICATIONS
ENGINE FUEL: CHOICE GAS 29.31 in Hg AMBIENT PRESSURE 70.0 percent RELATIVE HUMIDITY 0.0007 --- SP. HUMIDITY (LBM H2O/LBM DRY AIR)
FUEL GAS COMPOSITION (VOLUME PERCENT)LHV (Btu/Scf) = 933.3 SG = 0.5749 W.I. @60F (Btu/Scf) = 1230.9
Methane (CH4) = 95.8999 Ethane (C2H6) = 3.5000 Propane (C3H8) = 0.2000 Carbon Dioxide (CO2) = 0.1000 Nitrogen (N2) = 0.3000 Sulfur Dioxide (SO2) = 0.0001
STANDARD CONDITIONS FOR GAS VOLUMES: Temperature: 60 deg F Pressure: 29.92 in HgNORMAL CONDITIONS FOR GAS VOLUMES: Temperature: 32 deg F Pressure: 29.92 in Hg
!!! PLEASE, SUBMIT INQUIRY ON GAS FUEL SUITABILITY TO SAN DIEGO !!!
GENERAL OUTPUT DATA
4017. lbm/hr FUEL FLOW 1525.54 Scfm FUEL FLOW 21269. Btu/lbm LOWER HEATING VALUE 933. Btu/Scf LOWER HEATING VALUE 51466. Scfm EXHAUST FLOW @ 14.7 PSIA & 60F 136199. Acfm ACTUAL EXHAUST FLOW CFm 232454. lbm/hr EXHAUST GAS FLOW 4614.3 deg R ADIA STOICH FLAME TEMP, CHOICE GAS 4613.2 deg R ADIA STOICH FLAME TEMP, SDNG 28.57 --- MOLECULAR WEIGHT OF EXHAUST GAS 57.04 --- AIR/FUEL RATIO
EXHAUST GAS ANALYSIS
ARGON CO2 H2O N2 O2
0.90 3.09 6.10 75.66 14.24 VOLUME PERCENT WET 0.96 3.29 0.00 80.58 15.16 VOLUME PERCENT DRY 2941. 11066. 8948. 172429. 37065. lbm/hr 0.73 2.75 2.23 42.93 9.23 g/(g FUEL)

SOLAR TURBINES INCORPORATED DATE RUN: 18-Feb-15ENGINE PERFORMANCE CODE REV. 4.15.1.17.10 RUN BY: David A PocengalJOB ID:
NEW EQUIPMENT PREDICTED EMISSION PERFORMANCE DATA FOR POINT NUMBER 3
Fuel: CHOICE GAS Customer: Water Injection: NO Inquiry Number: Model: TAURUS 70-10802S CS/MD STANDARD GAS Emissions Data: REV. 0.1
The following predicted emissions performance is based on the following specificsingle point:
HP=11626, %Full Load=100.0, Elev= 582ft, %RH= 70.0, Temperature= 0.0F
NOX CO UHC 15.00 25.00 25.00 PPMvd at 15% O2 22.45 22.78 13.05 ton/yr 0.060 0.061 0.035 lbm/MMBtu (Fuel LHV) 0.59 0.60 0.34 lbm/(MW-hr) (gas turbine shaft pwr) 5.13 5.20 2.98 lbm/hr
NOTES: 1. For short-term emission limits such as lbs/hr., Solar recommends using "worst case" anticipated operating conditions specific to the application and the site conditions. Worst case for one pollutant is not necessarily the same for another. 2. Solar's typical SoLoNOx warranty, for ppm values, is available for greater than 0 deg F or -20 deg C, and between 50% and 100% load or gas, fuel, and between 65% and 100% load for liquid fuel except for the Centaur 40). An emission warranty for non-SoLoN x equipment is available for greater than 0 deg F or -20 deg C an 3. Fuel must meet Solar standard fuel specification ES 9-98. Emissions are based on the attached fuel composition, or, San Diego natural gas or equivalent. 4. If needed, Solar can provide Product Information Letters to address turbine operation outside typical warranty ranges, as well as non- warranted emissions of SO2, PM10/2.5, VOC, and formaldehyde. 5. Solar can provide factory testing in San Diego to ensure the actual unit(s) meet the above values within the tolerances quoted. Pricing and schedule impact will be provided upon request. 6. Any emissions warranty is applicable only for steady-state conditions and does not apply during start-up, shut-down, malfunction, or transient event.

SOLAR TURBINES INCORPORATED DATE RUN: 18-Feb-15ENGINE PERFORMANCE CODE REV. 4.15.1.17.10 RUN BY: David A PocengalJOB ID:
TAURUS 70-10802S CS/MD STANDARD GAS TBC-2 REV. 2.0 ES-ES2235 ES-ES2235
DATA FOR NOMINAL PERFORMANCE
*** GAS GENERATOR SPEED REFLECTS ELEVATED SPEED CONTROL METHODOLOGY. ALL OTHER PERFORMANCE PARAMETERS IDENTICAL TO NON ELEVATED SPEED CONTROL T70 MODELS. ***
Fuel Type CHOICE GAS
Elevation feet 582 Inlet Loss in H2O 4.0 Exhaust Loss in H2O 4.0 Accessory on GP Shaft HP 23.8
Engine Inlet Temp. deg F 0 0 0 Relative Humidity % 70.0 70.0 70.0 Elevation Loss HP 122 183 244 Inlet Loss HP 102 143 183 Exhaust Loss HP 45 57 68
Driven Equipment Speed RPM 9685 10929 11944 Optimum Equipment Speed RPM 9685 10929 11944 Gas Generator Speed % 98.0 99.3 100.0 Gas Generator Speed RPM 14891 15097 15200
Specified Load HP 50.0% 75.0% FULL Net Output Power HP 5813 8720 11626 Fuel Flow mmBtu/hr 62.21 75.28 85.43 Heat Rate Btu/HP-hr 10701 8634 7348 Therm Eff % 23.778 29.471 34.627
Inlet Air Flow lbm/hr 192760 217022 229125 Engine Exhaust Flow lbm/hr 195107 219911 232454 PCD psiG 157.3 203.4 246.8 Compensated PTIT deg F 1366 1366 1372 PT Exit Temperature deg F 1010 940 893 Exhaust Temperature deg F 910 898 887
FUEL GAS COMPOSITION (VOLUME PERCENT)LHV (Btu/Scf) = 933.3 SG = 0.5749 W.I. @60F (Btu/Scf) = 1230.9
Methane (CH4) = 95.8999 Ethane (C2H6) = 3.5000 Propane (C3H8) = 0.2000 Carbon Dioxide (CO2) = 0.1000 Nitrogen (N2) = 0.3000 Sulfur Dioxide (SO2) = 0.0001

STANDARD CONDITIONS FOR GAS VOLUMES: Temperature: 60 deg F Pressure: 29.92 in HgNORMAL CONDITIONS FOR GAS VOLUMES: Temperature: 32 deg F Pressure: 29.92 in Hg
!!! PLEASE, SUBMIT INQUIRY ON GAS FUEL SUITABILITY TO SAN DIEGO !!!
This performance was calculated with a basic inlet and exhaust system. Special equipment such as low noise silencers, special filters, heat recovery systems or cooling devices will affect engine performance. Performance shown is "Expected" performance at the pressure drops stated, not guaranteed.
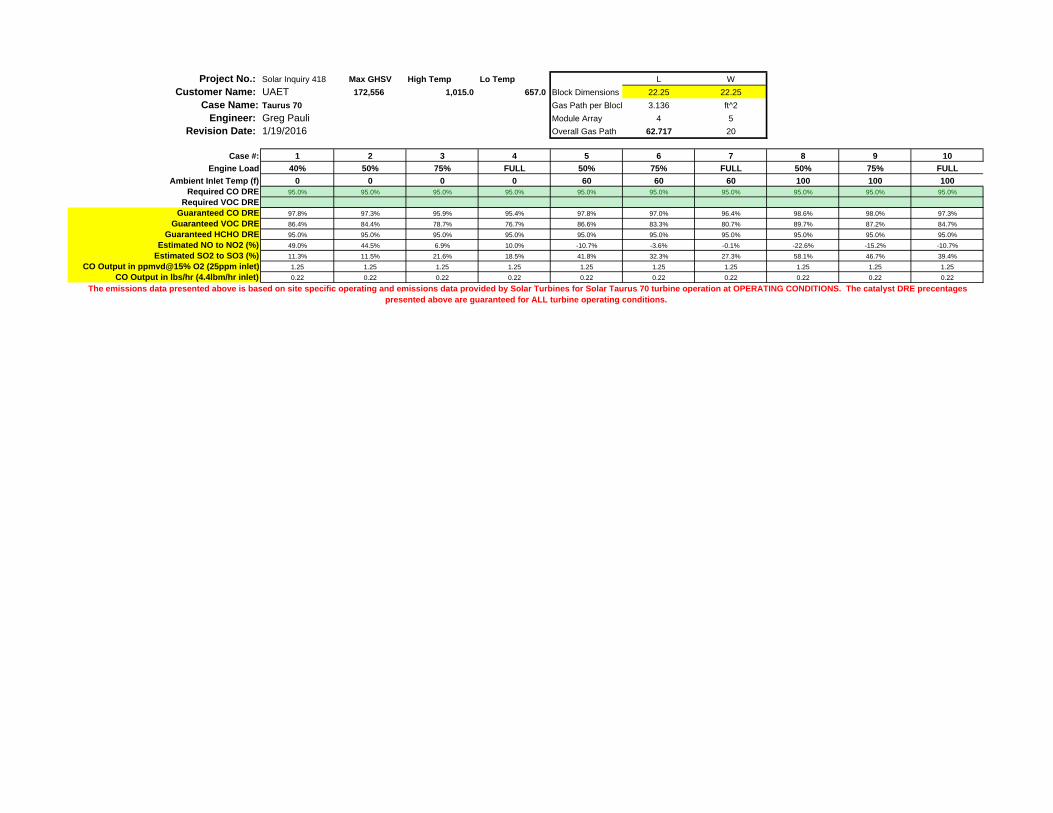
Project No.: Solar Inquiry 418 Max GHSV High Temp Lo Temp L WCustomer Name: UAET 172,556 1,015.0 657.0 Block Dimensions 22.25 22.25
Case Name: Taurus 70 Gas Path per Block 3.136 ft^2Engineer: Greg Pauli Module Array 4 5
Revision Date: 1/19/2016 Overall Gas Path 62.717 20
Case #: 1 2 3 4 5 6 7 8 9 10Engine Load 40% 50% 75% FULL 50% 75% FULL 50% 75% FULL
Ambient Inlet Temp (f) 0 0 0 0 60 60 60 100 100 100Required CO DRE 95.0% 95.0% 95.0% 95.0% 95.0% 95.0% 95.0% 95.0% 95.0% 95.0%
Required VOC DREGuaranteed CO DRE 97.8% 97.3% 95.9% 95.4% 97.8% 97.0% 96.4% 98.6% 98.0% 97.3%
Guaranteed VOC DRE 86.4% 84.4% 78.7% 76.7% 86.6% 83.3% 80.7% 89.7% 87.2% 84.7%Guaranteed HCHO DRE 95.0% 95.0% 95.0% 95.0% 95.0% 95.0% 95.0% 95.0% 95.0% 95.0%
Estimated NO to NO2 (%) 49.0% 44.5% 6.9% 10.0% -10.7% -3.6% -0.1% -22.6% -15.2% -10.7%Estimated SO2 to SO3 (%) 11.3% 11.5% 21.6% 18.5% 41.8% 32.3% 27.3% 58.1% 46.7% 39.4%
CO Output in ppmvd@15% O2 (25ppm inlet) 1.25 1.25 1.25 1.25 1.25 1.25 1.25 1.25 1.25 1.25CO Output in lbs/hr (4.4lbm/hr inlet) 0.22 0.22 0.22 0.22 0.22 0.22 0.22 0.22 0.22 0.22
The emissions data presented above is based on site specific operating and emissions data provided by Solar Turbines for Solar Taurus 70 turbine operation at OPERATING CONDITIONS. The catalyst DRE precentages presented above are guaranteed for ALL turbine operating conditions.
Empire Pipeline, Inc. Pendleton Compressor Station – NA2016
ATTACHMENT D Pendleton Compressor Station
Caterpillar G3516A
Gas Engine Technical Data Sheet &
DCL America, Inc. Catalyst Specification Sheet
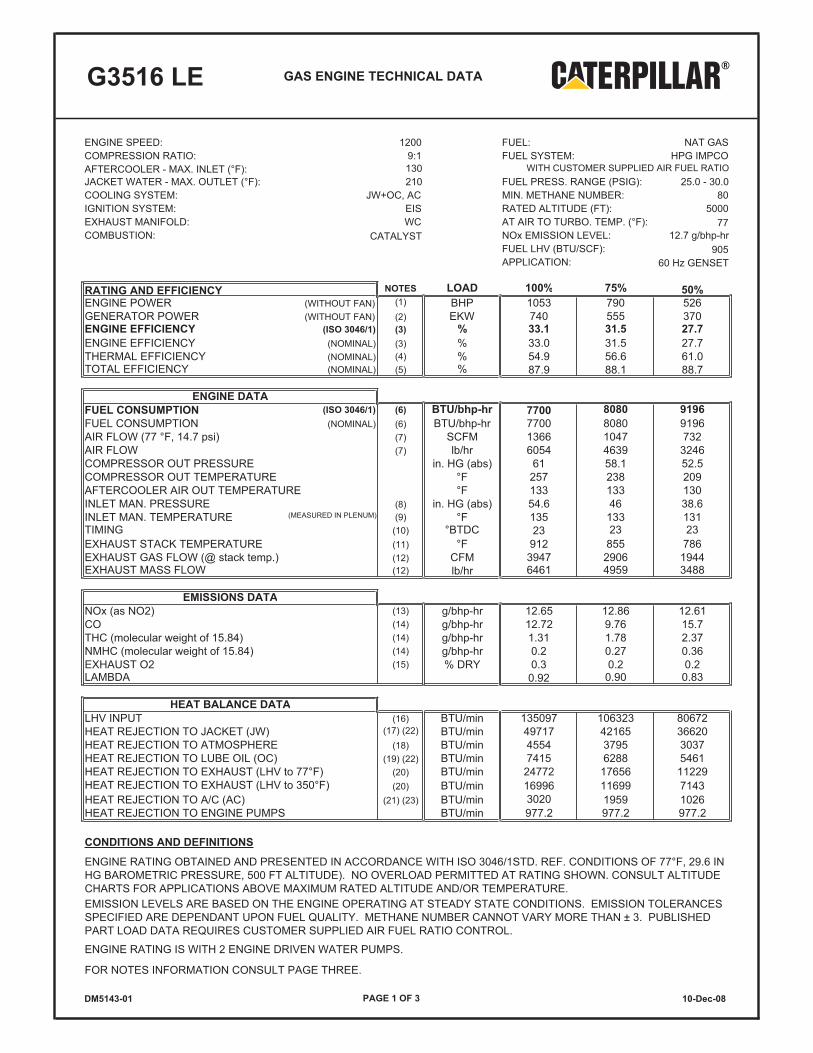
G3516 LE GAS ENGINE TECHNICAL DATA
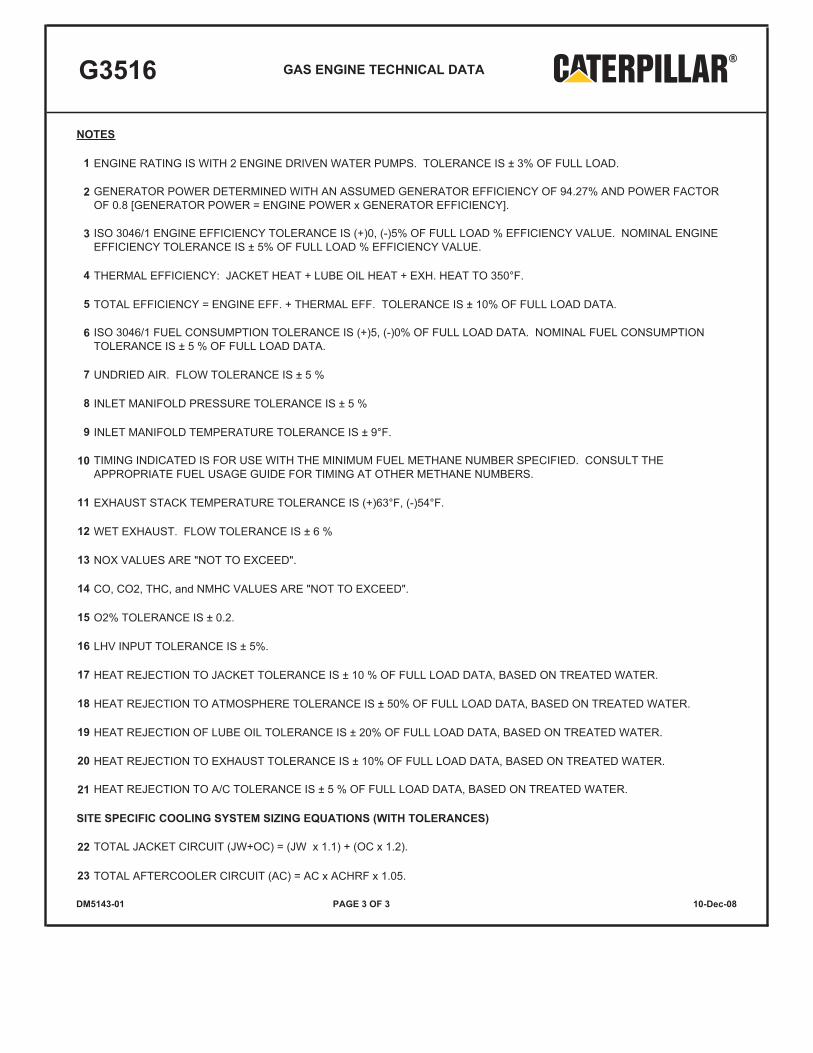
ENGINE SPEED: 1200 FUEL:COMPRESSION RATIO: 9:1 FUEL SYSTEM: HPG IMPCOAFTERCOOLER - MAX. INLET (°F): 130JACKET WATER - MAX. OUTLET (°F): 210 FUEL PRESS. RANGE (PSIG): 25.0 - 30.0COOLING SYSTEM: JW+OC, AC MIN. METHANE NUMBER: 80IGNITION SYSTEM: EIS RATED ALTITUDE (FT): 5000EXHAUST MANIFOLD: WC AT AIR TO TURBO. TEMP. (°F): 77COMBUSTION: CATALYST NOx EMISSION LEVEL: 12.7 g/bhp-hr
FUEL LHV (BTU/SCF): 905APPLICATION: 60 Hz GENSET
NOTES LOAD 100% 75% 50%ENGINE POWER (WITHOUT FAN) (1) BHP 1053 790 526GENERATOR POWER (WITHOUT FAN) (2) EKW 740 555 370ENGINE EFFICIENCY (ISO 3046/1) (3) % 33.1 31.5 27.7ENGINE EFFICIENCY (NOMINAL) (3) % 33.0 31.5 27.7THERMAL EFFICIENCY (NOMINAL) (4) % 54.9 56.6 61.0TOTAL EFFICIENCY (NOMINAL) (5) % 87.9 88.1 88.7
FUEL CONSUMPTION (ISO 3046/1) (6) BTU/bhp-hr 7700 8080 9196FUEL CONSUMPTION (NOMINAL) (6) BTU/bhp-hr 7700 8080 9196AIR FLOW (77 °F, 14.7 psi) (7) SCFM 1366 1047 732AIR FLOW (7) lb/hr 6054 4639 3246COMPRESSOR OUT PRESSURE in. HG (abs) 61 58.1 52.5COMPRESSOR OUT TEMPERATURE °F 257 238 209AFTERCOOLER AIR OUT TEMPERATURE °F 133 133 130INLET MAN. PRESSURE (8) in. HG (abs) 54.6 46 38.6INLET MAN. TEMPERATURE (MEASURED IN PLENUM) (9) °F 135 133 131TIMING (10) °BTDC 23 23 23EXHAUST STACK TEMPERATURE (11) °F 912 855 786
(12) CFM 3947 2906 1944EXHAUST MASS FLOW (12) lb/hr 6461 4959 3488
NOx (as NO2) (13) g/bhp-hr 12.65 12.86 12.61CO (14) g/bhp-hr 12.72 9.76 15.7THC (molecular weight of 15.84) (14) g/bhp-hr 1.31 1.78 2.37NMHC (molecular weight of 15.84) (14) g/bhp-hr 0.2 0.27 0.36EXHAUST O2 (15) % DRY 0.3 0.2 0.2LAMBDA 0.92 0.90 0.83
LHV INPUT (16) BTU/min 135097 106323 80672HEAT REJECTION TO JACKET (JW) (17) (22) BTU/min 49717 42165 36620HEAT REJECTION TO ATMOSPHERE (18) BTU/min 4554 3795 3037HEAT REJECTION TO LUBE OIL (OC) (19) (22) BTU/min 7415 6288 5461HEAT REJECTION TO EXHAUST (LHV to 77°F) (20) BTU/min 24772 17656 11229HEAT REJECTION TO EXHAUST (LHV to 350°F) (20) BTU/min 16996 11699 7143HEAT REJECTION TO A/C (AC) (21) (23) BTU/min 3020 1959 1026HEAT REJECTION TO ENGINE PUMPS BTU/min 977.2 977.2 977.2
CONDITIONS AND DEFINITIONS
ENGINE RATING IS WITH 2 ENGINE DRIVEN WATER PUMPS.
FOR NOTES INFORMATION CONSULT PAGE THREE.
DM5143-01 10-Dec-08PAGE 1 OF 3
ENGINE RATING OBTAINED AND PRESENTED IN ACCORDANCE WITH ISO 3046/1STD. REF. CONDITIONS OF 77°F, 29.6 IN HG BAROMETRIC PRESSURE, 500 FT ALTITUDE). NO OVERLOAD PERMITTED AT RATING SHOWN. CONSULT ALTITUDE CHARTS FOR APPLICATIONS ABOVE MAXIMUM RATED ALTITUDE AND/OR TEMPERATURE.EMISSION LEVELS ARE BASED ON THE ENGINE OPERATING AT STEADY STATE CONDITIONS. EMISSION TOLERANCES SPECIFIED ARE DEPENDANT UPON FUEL QUALITY. METHANE NUMBER CANNOT VARY MORE THAN ± 3. PUBLISHED PART LOAD DATA REQUIRES CUSTOMER SUPPLIED AIR FUEL RATIO CONTROL.
NAT GAS
HEAT BALANCE DATA
EMISSIONS DATA
ENGINE DATA
RATING AND EFFICIENCY
EXHAUST GAS FLOW (@ stack temp.)
WITH CUSTOMER SUPPLIED AIR FUEL RATIO
G3516 GAS ENGINE TECHNICAL DATA
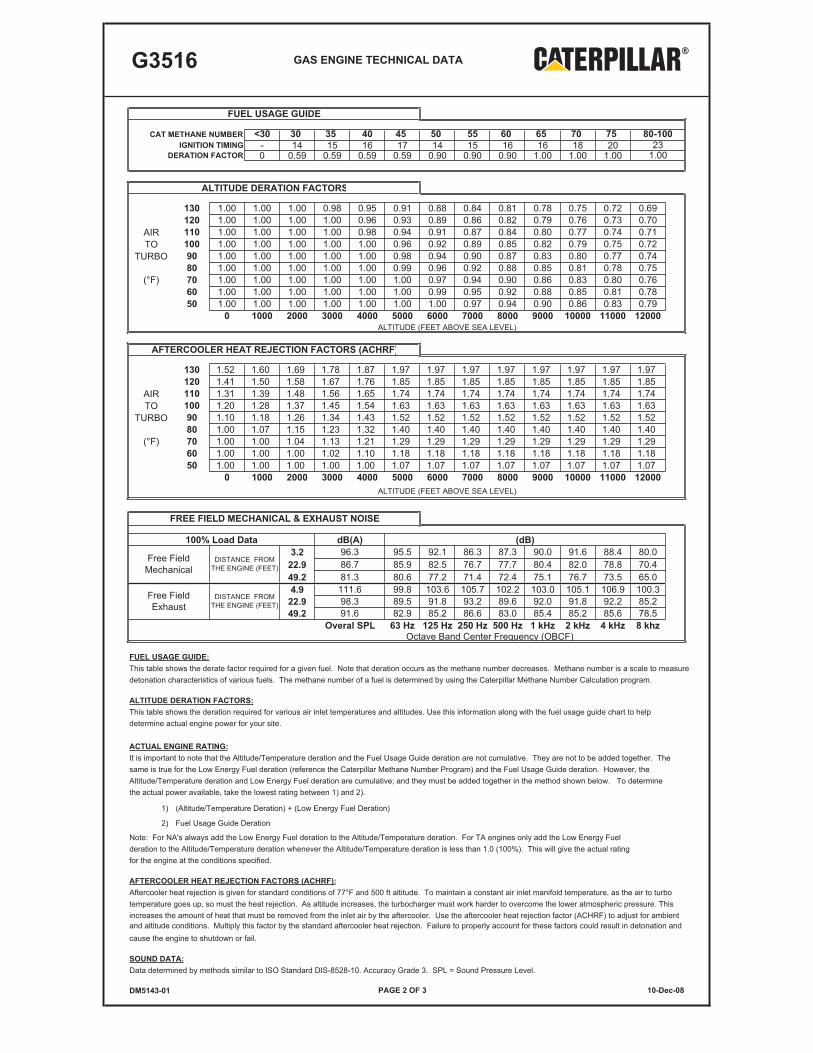
<30 30 35 40 45 50 55 60 65 70 75 80-100- 14 15 16 17 14 15 16 16 18 200 0.59 0.59 0.59 0.59 0.90 0.90 0.90 1.00 1.00 1.00
130 1.00 1.00 1.00 0.98 0.95 0.91 0.88 0.84 0.81 0.78 0.75 0.72 0.69120 1.00 1.00 1.00 1.00 0.96 0.93 0.89 0.86 0.82 0.79 0.76 0.73 0.70
AIR 110 1.00 1.00 1.00 1.00 0.98 0.94 0.91 0.87 0.84 0.80 0.77 0.74 0.71TO 100 1.00 1.00 1.00 1.00 1.00 0.96 0.92 0.89 0.85 0.82 0.79 0.75 0.72
TURBO 90 1.00 1.00 1.00 1.00 1.00 0.98 0.94 0.90 0.87 0.83 0.80 0.77 0.7480 1.00 1.00 1.00 1.00 1.00 0.99 0.96 0.92 0.88 0.85 0.81 0.78 0.75
(°F) 70 1.00 1.00 1.00 1.00 1.00 1.00 0.97 0.94 0.90 0.86 0.83 0.80 0.7660 1.00 1.00 1.00 1.00 1.00 1.00 0.99 0.95 0.92 0.88 0.85 0.81 0.7850 1.00 1.00 1.00 1.00 1.00 1.00 1.00 0.97 0.94 0.90 0.86 0.83 0.79
0 1000 2000 3000 4000 5000 6000 7000 8000 9000 10000 11000 12000ALTITUDE (FEET ABOVE SEA LEVEL)
130 1.52 1.60 1.69 1.78 1.87 1.97 1.97 1.97 1.97 1.97 1.97 1.97 1.97120 1.41 1.50 1.58 1.67 1.76 1.85 1.85 1.85 1.85 1.85 1.85 1.85 1.85
AIR 110 1.31 1.39 1.48 1.56 1.65 1.74 1.74 1.74 1.74 1.74 1.74 1.74 1.74TO 100 1.20 1.28 1.37 1.45 1.54 1.63 1.63 1.63 1.63 1.63 1.63 1.63 1.63
TURBO 90 1.10 1.18 1.26 1.34 1.43 1.52 1.52 1.52 1.52 1.52 1.52 1.52 1.5280 1.00 1.07 1.15 1.23 1.32 1.40 1.40 1.40 1.40 1.40 1.40 1.40 1.40
(°F) 70 1.00 1.00 1.04 1.13 1.21 1.29 1.29 1.29 1.29 1.29 1.29 1.29 1.2960 1.00 1.00 1.00 1.02 1.10 1.18 1.18 1.18 1.18 1.18 1.18 1.18 1.1850 1.00 1.00 1.00 1.00 1.00 1.07 1.07 1.07 1.07 1.07 1.07 1.07 1.07
0 1000 2000 3000 4000 5000 6000 7000 8000 9000 10000 11000 12000ALTITUDE (FEET ABOVE SEA LEVEL)
100% Load Data dB(A) (dB)3.2 96.3 95.5 92.1 86.3 87.3 90.0 91.6 88.4 80.0
22.9 86.7 85.9 82.5 76.7 77.7 80.4 82.0 78.8 70.449.2 81.3 80.6 77.2 71.4 72.4 75.1 76.7 73.5 65.04.9 111.6 99.8 103.6 105.7 102.2 103.0 105.1 106.9 100.3
22.9 98.3 89.5 91.8 93.2 89.6 92.0 91.8 92.2 85.249.2 91.6 82.9 85.2 86.6 83.0 85.4 85.2 85.6 78.5
Overal SPL 63 Hz 125 Hz 250 Hz 500 Hz 1 kHz 2 kHz 4 kHz 8 khzOctave Band Center Frequency (OBCF)
FUEL USAGE GUIDE:This table shows the derate factor required for a given fuel. Note that deration occurs as the methane number decreases. Methane number is a scale to measuredetonation characteristics of various fuels. The methane number of a fuel is determined by using the Caterpillar Methane Number Calculation program.
ALTITUDE DERATION FACTORS:This table shows the deration required for various air inlet temperatures and altitudes. Use this information along with the fuel usage guide chart to helpdetermine actual engine power for your site.
ACTUAL ENGINE RATING:It is important to note that the Altitude/Temperature deration and the Fuel Usage Guide deration are not cumulative. They are not to be added together. Thesame is true for the Low Energy Fuel deration (reference the Caterpillar Methane Number Program) and the Fuel Usage Guide deration. However, the Altitude/Temperature deration and Low Energy Fuel deration are cumulative; and they must be added together in the method shown below. To determinethe actual power available, take the lowest rating between 1) and 2).
1) (Altitude/Temperature Deration) + (Low Energy Fuel Deration)
2) Fuel Usage Guide Deration
Note: For NA's always add the Low Energy Fuel deration to the Altitude/Temperature deration. For TA engines only add the Low Energy Fuelderation to the Altitude/Temperature deration whenever the Altitude/Temperature deration is less than 1.0 (100%). This will give the actual ratingfor the engine at the conditions specified.
AFTERCOOLER HEAT REJECTION FACTORS (ACHRF):Aftercooler heat rejection is given for standard conditions of 77°F and 500 ft altitude. To maintain a constant air inlet manifold temperature, as the air to turbotemperature goes up, so must the heat rejection. As altitude increases, the turbocharger must work harder to overcome the lower atmospheric pressure. Thisincreases the amount of heat that must be removed from the inlet air by the aftercooler. Use the aftercooler heat rejection factor (ACHRF) to adjust for ambientand altitude conditions. Multiply this factor by the standard aftercooler heat rejection. Failure to properly account for these factors could result in detonation andcause the engine to shutdown or fail.
SOUND DATA:Data determined by methods similar to ISO Standard DIS-8528-10. Accuracy Grade 3. SPL = Sound Pressure Level.
DM5143-01
23
FUEL USAGE GUIDE
CAT METHANE NUMBERIGNITION TIMING
PAGE 2 OF 3 10-Dec-08
FREE FIELD MECHANICAL & EXHAUST NOISE
Free Field Exhaust
Free Field Mechanical
DISTANCE FROM THE ENGINE (FEET)
DISTANCE FROM THE ENGINE (FEET)
DERATION FACTOR 1.00
ALTITUDE DERATION FACTORS
AFTERCOOLER HEAT REJECTION FACTORS (ACHRF)
G3516 GAS ENGINE TECHNICAL DATA
NOTES
1 ENGINE RATING IS WITH 2 ENGINE DRIVEN WATER PUMPS. TOLERANCE IS ± 3% OF FULL LOAD.
2 GENERATOR POWER DETERMINED WITH AN ASSUMED GENERATOR EFFICIENCY OF 94.27% AND POWER FACTOR OF 0.8 [GENERATOR POWER = ENGINE POWER x GENERATOR EFFICIENCY].
3 ISO 3046/1 ENGINE EFFICIENCY TOLERANCE IS (+)0, (-)5% OF FULL LOAD % EFFICIENCY VALUE. NOMINAL ENGINE EFFICIENCY TOLERANCE IS ± 5% OF FULL LOAD % EFFICIENCY VALUE.
4 THERMAL EFFICIENCY: JACKET HEAT + LUBE OIL HEAT + EXH. HEAT TO 350°F.
5 TOTAL EFFICIENCY = ENGINE EFF. + THERMAL EFF. TOLERANCE IS ± 10% OF FULL LOAD DATA.
6 ISO 3046/1 FUEL CONSUMPTION TOLERANCE IS (+)5, (-)0% OF FULL LOAD DATA. NOMINAL FUEL CONSUMPTION TOLERANCE IS ± 5 % OF FULL LOAD DATA.
7 UNDRIED AIR. FLOW TOLERANCE IS ± 5 %
8 INLET MANIFOLD PRESSURE TOLERANCE IS ± 5 %
9 INLET MANIFOLD TEMPERATURE TOLERANCE IS ± 9°F.
10 TIMING INDICATED IS FOR USE WITH THE MINIMUM FUEL METHANE NUMBER SPECIFIED. CONSULT THE APPROPRIATE FUEL USAGE GUIDE FOR TIMING AT OTHER METHANE NUMBERS.
11 EXHAUST STACK TEMPERATURE TOLERANCE IS (+)63°F, (-)54°F.
12 WET EXHAUST. FLOW TOLERANCE IS ± 6 %
13 NOX VALUES ARE "NOT TO EXCEED".
14 CO, CO2, THC, and NMHC VALUES ARE "NOT TO EXCEED".
15 O2% TOLERANCE IS ± 0.2.
16 LHV INPUT TOLERANCE IS ± 5%.
17 HEAT REJECTION TO JACKET TOLERANCE IS ± 10 % OF FULL LOAD DATA, BASED ON TREATED WATER.
18 HEAT REJECTION TO ATMOSPHERE TOLERANCE IS ± 50% OF FULL LOAD DATA, BASED ON TREATED WATER.
19 HEAT REJECTION OF LUBE OIL TOLERANCE IS ± 20% OF FULL LOAD DATA, BASED ON TREATED WATER.
20 HEAT REJECTION TO EXHAUST TOLERANCE IS ± 10% OF FULL LOAD DATA, BASED ON TREATED WATER.
21 HEAT REJECTION TO A/C TOLERANCE IS ± 5 % OF FULL LOAD DATA, BASED ON TREATED WATER.
SITE SPECIFIC COOLING SYSTEM SIZING EQUATIONS (WITH TOLERANCES)
22 TOTAL JACKET CIRCUIT (JW+OC) = (JW x 1.1) + (OC x 1.2).
23 TOTAL AFTERCOOLER CIRCUIT (AC) = AC x ACHRF x 1.05.
DM5143-01 PAGE 3 OF 3 10-Dec-08

DCL America Inc. 27603 Commerce Oaks Drive, Oak Ridge North, TX 77385 Toll free: 1-877-965-8989 Fax: 281-605-5858 Email: [email protected] www.dcl-inc.com
PROJECT OVERVIEW
ENGINE DATA
Engine Model Cat G3412TA G3512 Cat G3516
Power 622 bhp 791 bhp 1053 bhp
Fuel PQNG PQNG PQNG
Exhaust Flow Rate 4168 lb/hr 5219 lb/hr 6461 lb/hr
Exhaust Temperature 1032 F 892 F 912 F
The catalyst model selection is based upon the reduction requirements above. Any variance in these requirements may affect the price and model required.
CATALYST DATA
Catalyst Model 2-DC74-8/12 CC 2-DC74.5-10/14 CC 2-DC74.5-10/16 CC
Type NSCR NSCR NSCR
# of Elements 2 2 2
Cell Density 300 cpsi 300 cpsi 300 cpsi
Approx. Dimensions See attached drawing
See attached drawing
See attached drawing
Approx. Weight 250 lbs 350 lbs 450 lbs
Approx. Pressure Drop 5.1” w.c. 3.7” w.c. 3.9” w.c.
Connection Size 8” inlet 12” outlet
10” inlet 14” outlet
10” inlet 16” outlet
Space Velocity (hr-1) 41,626 36,828 35,965
EMISSION REQUIREMENTS
Exhaust Component Catalyst Output (g/bhp-hr)
NOx 0.20
CO 0.30
VOC 0.20
CHOH >76% reduction
DCL America Inc. 27603 Commerce Oaks Drive, Oak Ridge North, TX 77385 Toll free: 1-877-965-8989 Fax: 281-605-5858 Email: [email protected] www.dcl-inc.com
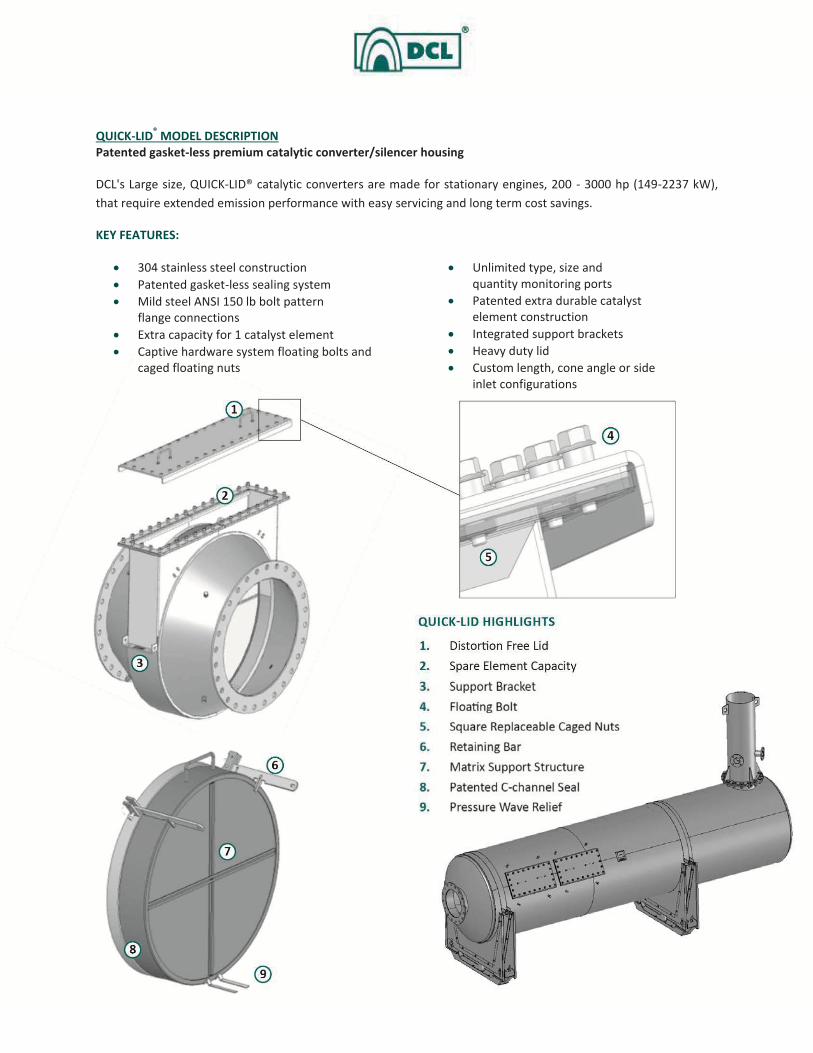
QUICK-LID® MODEL DESCRIPTION Patented gasket-less premium catalytic converter/silencer housing
DCL's Large size, QUICK-LID® catalytic converters are made for stationary engines, 200 - 3000 hp (149-2237 kW), that require extended emission performance with easy servicing and long term cost savings.
KEY FEATURES:
304 stainless steel construction Patented gasket-less sealing system Mild steel ANSI 150 lb bolt pattern flange connections Extra capacity for 1 catalyst element Captive hardware system floating bolts and caged floating nuts
Unlimited type, size and quantity monitoring ports Patented extra durable catalyst element construction Integrated support brackets Heavy duty lid Custom length, cone angle or side inlet configurations
Empire Pipeline, Inc. Pendleton Compressor Station – NA2016
ATTACHMENT E Pendleton Compressor Station
Air Quality Impact Screening Analysis Report

Empire Pipeline, Inc.
Pendleton Compressor Station
Killian Road, Pendleton, NY 14120
Air Quality Impact Modeling Analysis Report
Prepared for: Empire Pipeline, Inc. 6363 Main Street Williamsville, NY 14221
Prepared by: Day Environmental, Inc. 1563 Lyell Avenue Rochester, NY 14606 February 25, 2016
Empire Pipeline, Inc. Pendleton Compressor Station Air Quality Impact Modeling Analysis Report
DAY ENVIRONMENTAL, INC. Page i of i NFuel.5011I-14 / ZJT0070
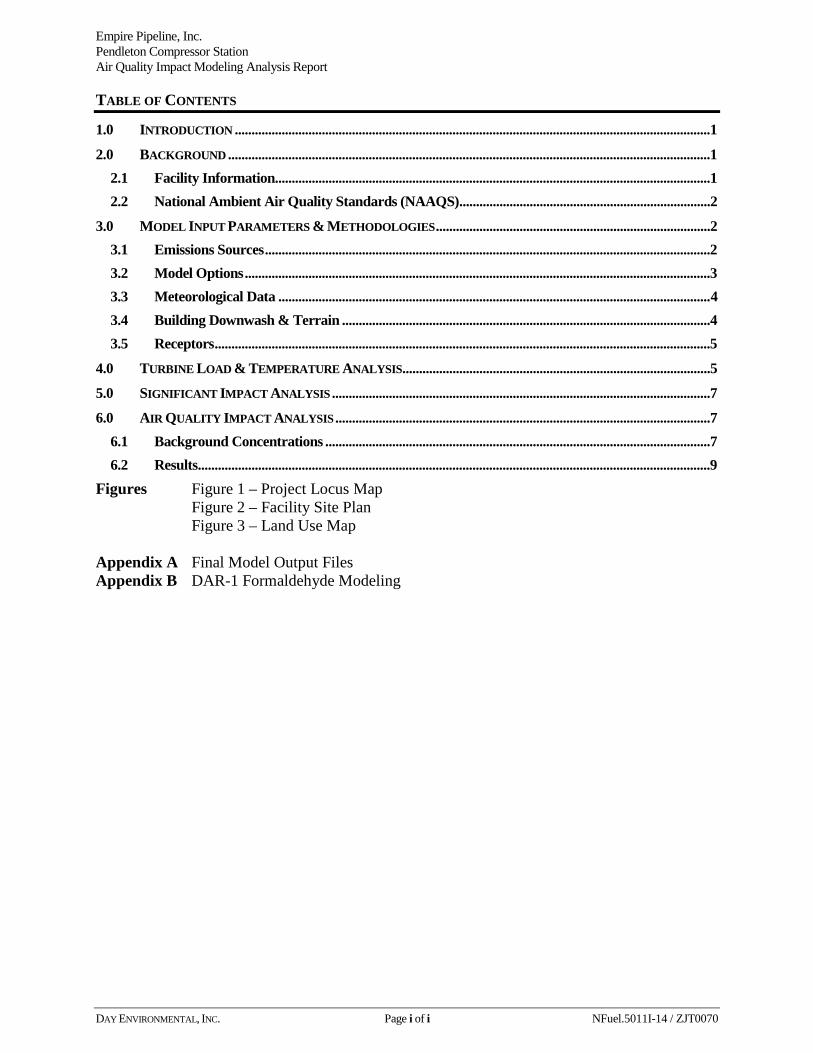
TABLE OF CONTENTS
1.0 INTRODUCTION ..............................................................................................................................................1
2.0 BACKGROUND ................................................................................................................................................1
2.1 Facility Information..................................................................................................................................1
2.2 National Ambient Air Quality Standards (NAAQS) ...........................................................................2
3.0 MODEL INPUT PARAMETERS & METHODOLOGIES ..................................................................................2
3.1 Emissions Sources .....................................................................................................................................2
3.2 Model Options ...........................................................................................................................................3
3.3 Meteorological Data .................................................................................................................................4
3.4 Building Downwash & Terrain ..............................................................................................................4
3.5 Receptors ....................................................................................................................................................5
4.0 TURBINE LOAD & TEMPERATURE ANALYSIS ............................................................................................5
5.0 SIGNIFICANT IMPACT ANALYSIS .................................................................................................................7
6.0 AIR QUALITY IMPACT ANALYSIS ................................................................................................................7
6.1 Background Concentrations ...................................................................................................................7
6.2 Results .........................................................................................................................................................9
Figures Figure 1 – Project Locus Map Figure 2 – Facility Site Plan Figure 3 – Land Use Map Appendix A Final Model Output Files Appendix B DAR-1 Formaldehyde Modeling

Empire Pipeline, Inc. Pendleton Compressor Station Air Quality Impact Modeling Analysis Report
DAY ENVIRONMENTAL, INC. Page 1 of 9 NFuel.5011I-14 / ZJT0070
1.0 INTRODUCTION Day Environmental, Inc. (DAY) has completed an air dispersion modeling analysis for Empire Pipeline Inc.’s (Empire’s) Pendleton Compressor Station (Pendleton) that is proposed as part of National Fuel Gas’s Northern Access 2016 Expansion Project (NA2016). The proposed Pendleton facility is a new, approximately 24,000-hp compressor station located in the Town of Pendleton, Niagara County, New York. An ambient air quality impact screening analysis has been requested by the New York State Department of Environmental Conservation (NYSDEC) as part of the air permit application review process to evaluate whether nitrous oxide (NO2) and formaldehyde emissions from proposed new sources will meet the 1-hr NO2 National Ambient Air Quality Standard (NAAQS) and the formaldehyde guidance concentrations in NYSDEC Policy DAR-1, respectively. Additionally, the Federal Regulatory Commission (FERC) requested, in support of the review of the environmental impact of NA2016 (Docket No. PF14-18-000), that Empire complete air modeling to evaluate whether proposed facility emissions will meet the NAAQS. In response to the above agency requests, this report summarizes the inputs and results of the screening modeling analysis using AERSCREEN (version 14151) and includes a comparison of modeled concentrations with the current NAAQS for the criteria pollutants carbon monoxide (CO), NO2, particulate matter (PM)2.5, PM10 and sulfur dioxide (SO2)..This analysis was completed using the Environmental Protection Agency’s (EPA’s) Appendix W to 40 CFR Part 51 – Guideline on Air Quality Models, the EPA’s AERSCREEN User’s Guide, and the NYSDEC’s DAR-10 – NYSDEC Guidelines on Dispersion Modeling Procedures for Air Quality Impact Analysis. The screening analysis results demonstrate that modeled concentrations do not exceed the NAAQS thresholds. A summary of the methods, input, and results of the modeling analysis is presented in the following sections. AERSCREEN output and supporting input files for the selected final model runs are included as Appendix A. A supplemental screening modeling analysis to evaluate whether facility formaldehyde emissions will meet the short-term guidance value (SGC) and annual guidance value (AGC) specified in the NYSDEC’s Policy DAR-1: Guidelines for the Control of Toxic Ambient Air Contaminants (DAR-1) is included as Appendix B. The DAR-1 screening analysis results demonstrate that modeled concentrations do not exceed the DAR-1 formaldehyde AGC and SGC. 2.0 BACKGROUND 2.1 Facility Information Empire’s Pendleton facility is located will Pendleton Township, Niagara County, NY. A locus map showing the proposed facility location is included as Figure 1. The modeling analysis incorporated the following proposed emissions sources: Proposed Sources:
• Two (2) 11,626 site-rated HP (11,107 ISO Conditions) Solar Taurus 70 natural gas-fired compressor turbines with SoLoNOx technology, equipped with oxidation catalysts; and
• One (1) 1,053 HP Caterpillar G3516 emergency generator with NSCR (3-way catalyst). A site layout plan showing the proposed facility layout and emission source locations is included as Figure 2.
Empire Pipeline, Inc. Pendleton Compressor Station Air Quality Impact Modeling Analysis Report
DAY ENVIRONMENTAL, INC. Page 2 of 9 NFuel.5011I-14 / ZJT0070
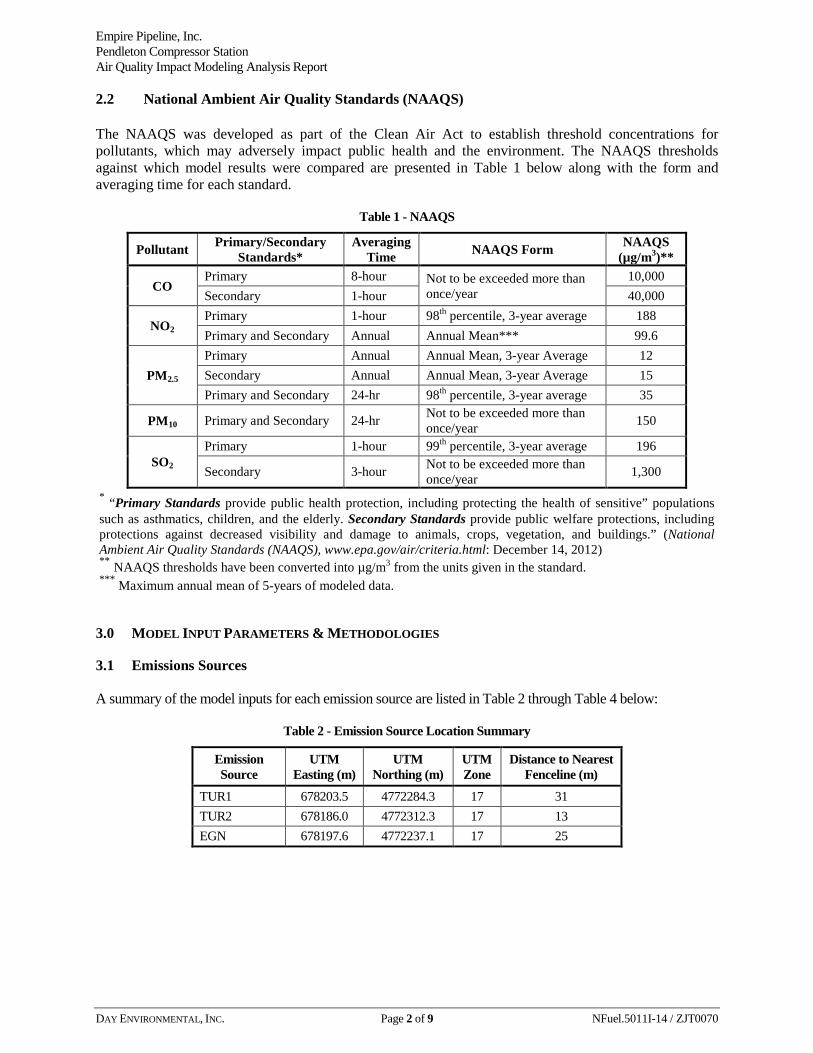
2.2 National Ambient Air Quality Standards (NAAQS) The NAAQS was developed as part of the Clean Air Act to establish threshold concentrations for pollutants, which may adversely impact public health and the environment. The NAAQS thresholds against which model results were compared are presented in Table 1 below along with the form and averaging time for each standard.
Table 1 - NAAQS
Pollutant Primary/Secondary Standards*
Averaging Time NAAQS Form NAAQS
(µg/m3)**
CO Primary 8-hour Not to be exceeded more than
once/year 10,000
Secondary 1-hour 40,000
NO2 Primary 1-hour 98th percentile, 3-year average 188 Primary and Secondary Annual Annual Mean*** 99.6
PM2.5
Primary Annual Annual Mean, 3-year Average 12 Secondary Annual Annual Mean, 3-year Average 15 Primary and Secondary 24-hr 98th percentile, 3-year average 35
PM10 Primary and Secondary 24-hr Not to be exceeded more than once/year 150
SO2 Primary 1-hour 99th percentile, 3-year average 196
Secondary 3-hour Not to be exceeded more than once/year 1,300
* “Primary Standards provide public health protection, including protecting the health of sensitive” populations such as asthmatics, children, and the elderly. Secondary Standards provide public welfare protections, including protections against decreased visibility and damage to animals, crops, vegetation, and buildings.” (National Ambient Air Quality Standards (NAAQS), www.epa.gov/air/criteria.html: December 14, 2012) ** NAAQS thresholds have been converted into µg/m3 from the units given in the standard. *** Maximum annual mean of 5-years of modeled data.
3.0 MODEL INPUT PARAMETERS & METHODOLOGIES 3.1 Emissions Sources A summary of the model inputs for each emission source are listed in Table 2 through Table 4 below:
Table 2 - Emission Source Location Summary
Emission Source
UTM Easting (m)
UTM Northing (m)
UTM Zone
Distance to Nearest Fenceline (m)
TUR1 678203.5 4772284.3 17 31 TUR2 678186.0 4772312.3 17 13 EGN 678197.6 4772237.1 17 25
Empire Pipeline, Inc. Pendleton Compressor Station Air Quality Impact Modeling Analysis Report
DAY ENVIRONMENTAL, INC. Page 3 of 9 NFuel.5011I-14 / ZJT0070
Table 3 - Emission Source Stack Dimensions
Emission Source
Stack Height (m)
Stack Effective
Diameter (m) TUR1 16.85 2.980
TUR2 16.85 2.980 EGN 5.68 0.360
Table 4 - Emission Rates
Emission Source Emission Rate
NOx 1-hr
NOx Annual
CO 1-hr
CO 8-hr
PM10 24-hr
PM2.5 24-hr
PM2.5 Annual
SO2 1-hr
SO2 3-hr
TUR1(1) g/sec 0.646 0.646 0.030 0.030 0.0776 0.0776 0.0776 0.00630 0.00630 lbs/hr 5.13 5.13 0.239 0.239 0.616 0.616 0.616 0.0469 0.0469
TUR2(1) g/sec 0.646 0.646 0.030 0.030 0.0776 0.0776 0.0776 0.00630 0.00630 lbs/hr 5.13 5.13 0.239 0.239 0.616 0.616 0.616 0.0469 0.0469
EGN g/sec 0.0585 0.0034 0.0877 0.0887 0.0198 0.0198 0.00113 0.00060 0.00060 lbs/hr 0.464 0.026 0.696 0.696 0.157 0.157 0.0090 0.0048 0.0048
3.2 Model Options AERSCREEN is capable of modeling a single emission source for each case, therefore each of the three emissions sources were modeled separately. In order to evaluate emissions on a facility-wide basis, maximum predicted concentrations from each source were assumed to be collocated and summed to establish a facility maximum concentration in accordance with the procedure outlined in EPA Guidance Document Screening Procedures for Estimating the Air Quality Impact of Stationary Sources Revised. This method is a conservative estimate of facility modeled concentration since the maximum predicted concentration may not occur in the same location for different sources. A land use analysis was conducted using the 2011 National Land Cover Dataset (NLCD) map2 according to the Land Use Procedure defined in 40 CFR 51, Appendix W, Section 7.2.3(c). This analysis evaluates the relative percentage of land use types within in a three-kilometer (km) radius circle centered on the facility to determine rural versus urban classification. The figure used in this analysis is included as Figure 3. The results of the land use analysis for the proposed Pendleton facility determined that the facility may be classified as rural and therefore rural dispersion coefficients were used. Evaluation of the NO2 standard may be completed using one of three methods, assigned as Tier 1 through Tier 3, in order to estimate the ratio of NO2 within the modeled NOx concentration. For this modeling effort, Tier 2 was adopted which assumes that 80% and 75% of the modeled NOx value is NO2, for the 1-hour and annual averages, respectively. The above listed default ambient ratios were established in a EPA March 2011 memorandum by Tyler Fox – Additional Clarification Regarding Application of Appendix W Modeling Guidance to the 1-hour NO2 National Ambient Air Quality Standard. If the default ambient ratios are used, Tier 2 can be applied without prior approval from the reviewing agency. As addressed in the March 2011 EPA memo listed above, the EPA does not allow for emissions from sources that do not operate continuously (intermittent) to be exempt from compliance with the NAAQS. However, the 1 Corresponds to turbine emission rates at 0 degrees F and 100 percent load. Refer to the turbine load and temperature analysis section below for a discussion of the determination of the worst case ambient temperature and engine load scenario for the compressor turbines. 2 NLCD data was obtained via the U.S. Geological Survey’s Multi-Resolution Land Characteristics Consortium at www.mrlc.gov.

Empire Pipeline, Inc. Pendleton Compressor Station Air Quality Impact Modeling Analysis Report
DAY ENVIRONMENTAL, INC. Page 4 of 9 NFuel.5011I-14 / ZJT0070
EPA recognizes that assuming continuous operation when modeling intermittent emissions may estimate concentrations that are not representative of actual facility emissions and therefore the EPA memo specifies that these emissions sources may be excluded for modeling compliance with the 1-hr NO2 and 1-hr SO2 NAAQS. For other pollutants and averaging periods, the EPA allows for the discretion of the reviewing agency to dictate how intermittent sources are handled in complying with the NAAQS. Therefore, based on NYSDEC guidance during prior air permit submittals, intermittent sources were included in long-term averaged models of NAAQS pollutants (i.e. averaged over periods greater than 24-hours). For short-term averaged models, intermittent sources were not included. The proposed emergency generator will not operate for greater than 500 hours per year to comply with the emergency generator hours limit in 6 NYCRR 201-3.2(c)(6). Consistent with EPA and NYSDEC guidance, emissions from the emergency generator were excluded from short-term averaged models. To account for the 500 hours of operation per year in the annual NO2 and PM2.5 models, the emergency generator maximum 1-hour emission rates were scaled based on the 500 hours of annual operation to determine an annual emission rate. Turbine operation in extreme ambient conditions (i.e., subzero temperatures) results in higher hourly emissions of select pollutants than during normal operations. Based on a review of meteorological records provided by the National Weather Service, the number of days during which the turbines are anticipated to operate in subzero temperatures annually is very limited. Consistent with EPA and NYSDEC guidance regarding intermittent sources, elevated NOx emissions generated under these conditions were excluded from the 1-hr NO2 analysis. Annual NO2 modeling for the turbines was completed by conservatively assuming that the annual NO2 emission rate is equivalent to the maximum 1-hr NO2 emission rate during normal operations. Elevated NOx emissions generated under subzero temperatures were excluded since these conditions occur for a very limited number of hours per year and are therefore not representative of annual operations. Consistent with NYSDEC guidance, the increased turbine CO emission rate during subzero temperature operation was not included in the 1-hr and 8-hr CO models. 3.3 Meteorological Data AERSCREEN automatically generates meteorological data based on user specified values of wind speed, maximum and minimum ambient temperatures, anemometer height, and facility surface characteristics. The 1992 NLCD map was processed using EPA’s AERSURFACE (Version 13016) to generate the surface characteristics for the proposed Pendleton Compressor Station. AERSURFACE processes the 1992 NLCD and generates seasonal values of albedo, Bowen ratio, and surface roughness across a maximum of twelve directional sectors extending from the selected location. Default values of 0.5 m/s minimum wind speed and 10 meter anemometer height were used in AERSCREEN, and the maximum and minimum temperatures (0°F - 100°F) were based on conservative estimates of local climate. 3.4 Building Downwash & Terrain In accordance with Appendix W of 40 CFR 51, exhaust stacks that are determined to be less than good engineering practice (GEP) formula height3 or 65 meters must be evaluated for building downwash effects that may lead to increased predicted ground level concentrations. As shown in Table 5 below, all stacks at the facility are less than GEP stack height or 65 meters and therefore were modeled at the proposed height and evaluated for downwash effects. The Building Profile Input Program with Plume Rise Model Enhancements (BPIP-PRIME), which is included within AERSCREEN, was used to analyze building downwash characteristics for the sources and structures at the facility. Building locations and dimensions were provided in a georeferenced CAD file and updated facility site plan.
3 HGEP = Hb + 1.5L, where Hb is the height of the dominating structure, and L is the lesser of the height or projected width.
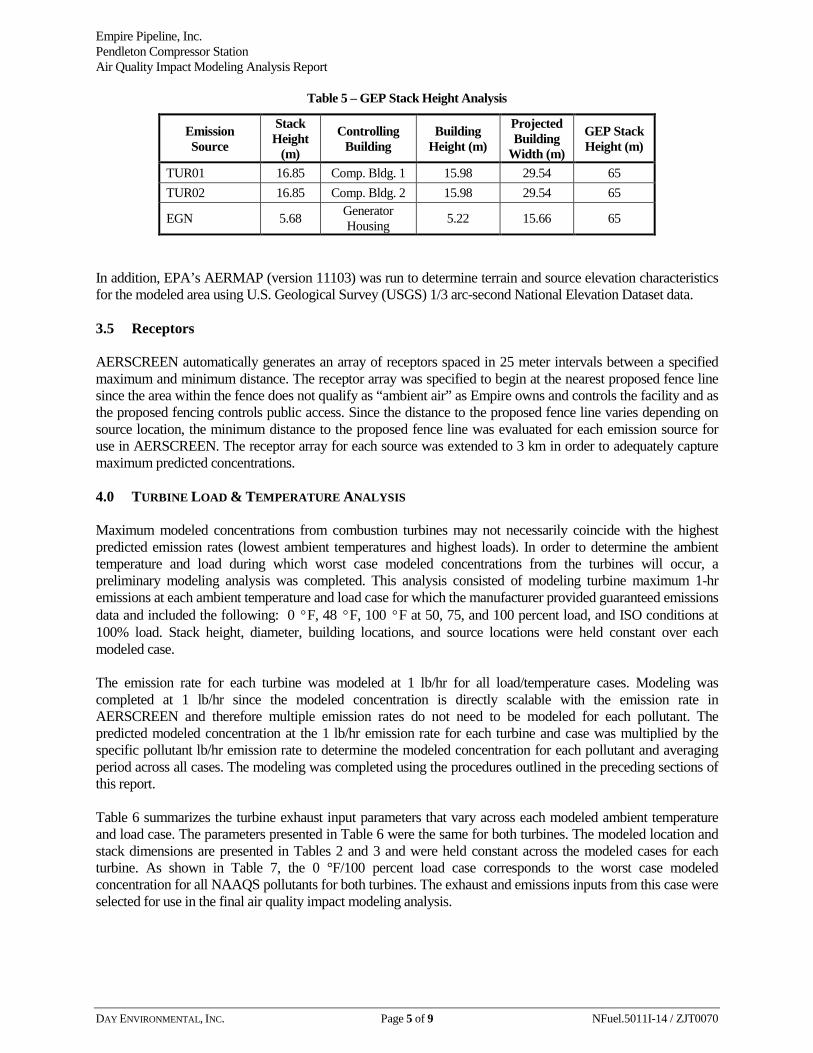
Empire Pipeline, Inc. Pendleton Compressor Station Air Quality Impact Modeling Analysis Report
DAY ENVIRONMENTAL, INC. Page 5 of 9 NFuel.5011I-14 / ZJT0070
Table 5 – GEP Stack Height Analysis
Emission Source
Stack Height
(m)
Controlling Building
Building Height (m)
Projected Building
Width (m)
GEP Stack Height (m)
TUR01 16.85 Comp. Bldg. 1 15.98 29.54 65 TUR02 16.85 Comp. Bldg. 2 15.98 29.54 65
EGN 5.68 Generator Housing 5.22 15.66 65
In addition, EPA’s AERMAP (version 11103) was run to determine terrain and source elevation characteristics for the modeled area using U.S. Geological Survey (USGS) 1/3 arc-second National Elevation Dataset data. 3.5 Receptors AERSCREEN automatically generates an array of receptors spaced in 25 meter intervals between a specified maximum and minimum distance. The receptor array was specified to begin at the nearest proposed fence line since the area within the fence does not qualify as “ambient air” as Empire owns and controls the facility and as the proposed fencing controls public access. Since the distance to the proposed fence line varies depending on source location, the minimum distance to the proposed fence line was evaluated for each emission source for use in AERSCREEN. The receptor array for each source was extended to 3 km in order to adequately capture maximum predicted concentrations. 4.0 TURBINE LOAD & TEMPERATURE ANALYSIS Maximum modeled concentrations from combustion turbines may not necessarily coincide with the highest predicted emission rates (lowest ambient temperatures and highest loads). In order to determine the ambient temperature and load during which worst case modeled concentrations from the turbines will occur, a preliminary modeling analysis was completed. This analysis consisted of modeling turbine maximum 1-hr emissions at each ambient temperature and load case for which the manufacturer provided guaranteed emissions data and included the following: 0 °F, 48 °F, 100 °F at 50, 75, and 100 percent load, and ISO conditions at 100% load. Stack height, diameter, building locations, and source locations were held constant over each modeled case. The emission rate for each turbine was modeled at 1 lb/hr for all load/temperature cases. Modeling was completed at 1 lb/hr since the modeled concentration is directly scalable with the emission rate in AERSCREEN and therefore multiple emission rates do not need to be modeled for each pollutant. The predicted modeled concentration at the 1 lb/hr emission rate for each turbine and case was multiplied by the specific pollutant lb/hr emission rate to determine the modeled concentration for each pollutant and averaging period across all cases. The modeling was completed using the procedures outlined in the preceding sections of this report. Table 6 summarizes the turbine exhaust input parameters that vary across each modeled ambient temperature and load case. The parameters presented in Table 6 were the same for both turbines. The modeled location and stack dimensions are presented in Tables 2 and 3 and were held constant across the modeled cases for each turbine. As shown in Table 7, the 0 °F/100 percent load case corresponds to the worst case modeled concentration for all NAAQS pollutants for both turbines. The exhaust and emissions inputs from this case were selected for use in the final air quality impact modeling analysis.
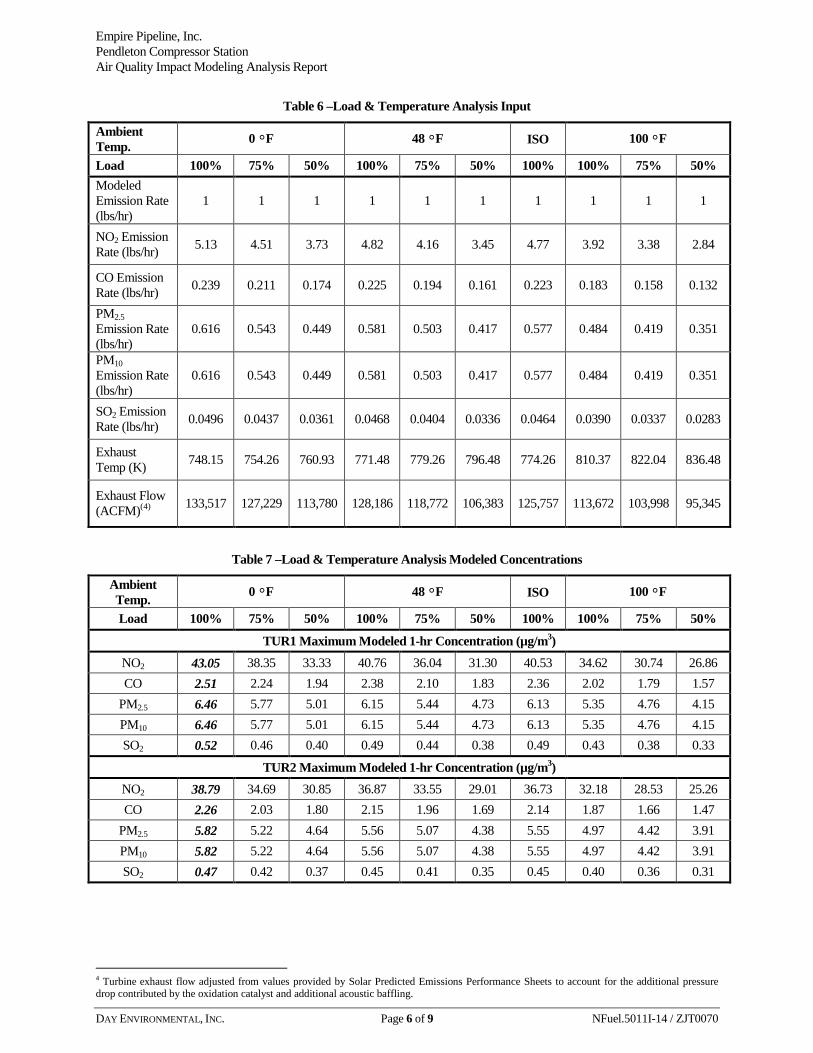
Empire Pipeline, Inc. Pendleton Compressor Station Air Quality Impact Modeling Analysis Report
DAY ENVIRONMENTAL, INC. Page 6 of 9 NFuel.5011I-14 / ZJT0070
Table 6 –Load & Temperature Analysis Input
Ambient Temp. 0 °F 48 °F ISO 100 °F
Load 100% 75% 50% 100% 75% 50% 100% 100% 75% 50% Modeled Emission Rate (lbs/hr)
1 1 1 1 1 1 1 1 1 1
NO2 Emission Rate (lbs/hr) 5.13 4.51 3.73 4.82 4.16 3.45 4.77 3.92 3.38 2.84
CO Emission Rate (lbs/hr) 0.239 0.211 0.174 0.225 0.194 0.161 0.223 0.183 0.158 0.132
PM2.5 Emission Rate (lbs/hr)
0.616 0.543 0.449 0.581 0.503 0.417 0.577 0.484 0.419 0.351
PM10 Emission Rate (lbs/hr)
0.616 0.543 0.449 0.581 0.503 0.417 0.577 0.484 0.419 0.351
SO2 Emission Rate (lbs/hr) 0.0496 0.0437 0.0361 0.0468 0.0404 0.0336 0.0464 0.0390 0.0337 0.0283
Exhaust Temp (K) 748.15 754.26 760.93 771.48 779.26 796.48 774.26 810.37 822.04 836.48
Exhaust Flow (ACFM)(4) 133,517 127,229 113,780 128,186 118,772 106,383 125,757 113,672 103,998 95,345
Table 7 –Load & Temperature Analysis Modeled Concentrations
Ambient Temp. 0 °F 48 °F ISO 100 °F
Load 100% 75% 50% 100% 75% 50% 100% 100% 75% 50%
TUR1 Maximum Modeled 1-hr Concentration (µg/m3) NO2 43.05 38.35 33.33 40.76 36.04 31.30 40.53 34.62 30.74 26.86 CO 2.51 2.24 1.94 2.38 2.10 1.83 2.36 2.02 1.79 1.57
PM2.5 6.46 5.77 5.01 6.15 5.44 4.73 6.13 5.35 4.76 4.15 PM10 6.46 5.77 5.01 6.15 5.44 4.73 6.13 5.35 4.76 4.15 SO2 0.52 0.46 0.40 0.49 0.44 0.38 0.49 0.43 0.38 0.33
TUR2 Maximum Modeled 1-hr Concentration (µg/m3) NO2 38.79 34.69 30.85 36.87 33.55 29.01 36.73 32.18 28.53 25.26 CO 2.26 2.03 1.80 2.15 1.96 1.69 2.14 1.87 1.66 1.47
PM2.5 5.82 5.22 4.64 5.56 5.07 4.38 5.55 4.97 4.42 3.91 PM10 5.82 5.22 4.64 5.56 5.07 4.38 5.55 4.97 4.42 3.91 SO2 0.47 0.42 0.37 0.45 0.41 0.35 0.45 0.40 0.36 0.31
4 Turbine exhaust flow adjusted from values provided by Solar Predicted Emissions Performance Sheets to account for the additional pressure drop contributed by the oxidation catalyst and additional acoustic baffling.

Empire Pipeline, Inc. Pendleton Compressor Station Air Quality Impact Modeling Analysis Report
DAY ENVIRONMENTAL, INC. Page 7 of 9 NFuel.5011I-14 / ZJT0070
5.0 SIGNIFICANT IMPACT ANALYSIS The EPA allows the use Significant Impact Levels (SILs) to determine if emissions from proposed new or modified emission sources will potentially cause or contribute to an impact on ambient air quality. If the maximum modeled concentrations from the proposed or modified sources do not exceed the corresponding SIL, compliance with the NAAQS is determined to be demonstrated and no further analysis is required. If the maximum modeled concentrations exceed the corresponding SIL, a cumulative impact analysis is required and modeled concentrations are summed with representative background concentrations for evaluation against the NAAQS. Table 8 summarizes the maximum modeled concentrations by emission source, the total facility modeled concentration, and SIL for each modeled pollutant and averaging period. Similar to the method described in Section 4.0, the modeled emission rate for each turbine was set at 1 lb/hr. The predicted modeled concentration at the 1 lb/hr emission rate for each turbine was multiplied by the specific pollutant lb/hr emission rate (refer to Table 4) to determine the modeled concentration for each pollutant and averaging period. As shown in Table 8, total facility modeled CO and SO2 concentrations do not exceed the corresponding SILs and will not cause or contribute to an impact on ambient air quality. Therefore, compliance with the CO and SO2 NAAQS is demonstrated and no further analysis is required for these pollutants. Total facility modeled NO2, PM10, and PM2.5 concentrations exceed the corresponding SILs and therefore a cumulative analysis was completed for evaluation against the NAAQS.
Table 8 – Significant Impact Analysis Results Summary
Pollutant Averaging Period
TUR1 Max Modeled Conc.
(µg/m3)
TUR2 Max Modeled Conc.
(µg/m3)
EGN Max Modeled Conc.
(µg/m3)
Total Facility Conc.
(µg/m3)
Significant Impact Level
(µg/m3)
NO2 1-hr 43.05 38.79 -- 81.8 7.5(5) Annual 4.04 3.64 1.74 9.4 1.0(6)
CO 1-hr 2.51 2.26 -- 4.8 2,000(6)
8-hr 2.26 2.03 -- 4.3 500(6)
PM2.5 24-hr 3.88 3.49 -- 7.4 1.2(7)
Annual 0.65 0.58 0.08 1.3 0.3(7)
PM10 24-hr 3.88 3.49 -- 7.4 5(6)
SO2 1-hr 0.53 0.47 -- 1.0 7.8(8) 3-hr 0.53 0.47 -- 1.0 25(6)
6.0 AIR QUALITY IMPACT ANALYSIS 6.1 Background Concentrations Based on the results of the significant impact analysis, a cumulative impact analysis was completed for Pendleton for the pollutants NO2, PM10, and PM2.5. Comparison to the NAAQS requires the inclusion of background concentrations of the NAAQS pollutants to the modeled facility concentration. Background concentrations were obtained from the nearest NYSDEC Ambient Air Quality Monitors depending on data availability since monitors may not collect data for all pollutants using the NYS Ambient Air Quality Reports 5 Wood, Anne Marie (June 28, 2010). General Guidance for Implementing the 1-hour NO2 National Ambient Air Quality Standard in Prevention of Significant Deterioration Permits, Including an Interim 1-hour NO2 Significant Impact Level. Research Triangle Park, NC: Environmental Protection Agency, Office of Air Quality Planning and Standards. 6 40 CFR 51.165(b)(2) 7 Page, Stephen D. (May 20, 2014). Guidance for PM2.5 Permit Modeling. Research Triangle Park, NC: Environmental Protection Agency. 8 Page, Stephen D. (August 13, 2010). Guidance Concerning the Implementation of the 1-hour SO2 NAAQS for the Prevention of Significant Deterioration Program. Research Triangle Park, NC: Environmental Protection Agency, Office of Air Quality Planning and Standards.
Empire Pipeline, Inc. Pendleton Compressor Station Air Quality Impact Modeling Analysis Report
DAY ENVIRONMENTAL, INC. Page 8 of 9 NFuel.5011I-14 / ZJT0070
for 2010 through 2014. Ambient air monitors were selected based on proximity to the proposed facility, collected data time period, data completeness, and land use. The nearest ambient air quality monitors for NO2 are the Amherst monitor (site no. 1451-03) located approximately 8 miles south-southeast of the proposed facility and the Buffalo monitor (site no. 1401-18) located approximately 14 miles south of the proposed facility. The nearest ambient air quality monitor for PM10 is the Niagara Falls monitor (site no. 3102-25) located approximately 10 miles west of the proposed facility. The nearest ambient air quality monitors for PM2.5 are the Brookside Terrace Monitor (site no. 1472-14) located approximately 7.5 miles southwest of the proposed facility; the Buffalo Near-Road monitor (site no. 1455-02) located approximately 13.5 miles south-southeast of the proposed facility; the Niagara Falls monitor; and the Buffalo monitor. The Amherst, Buffalo, Niagara Falls, Brookside Terrace, and Buffalo Near-Road monitors are located in urban land-use areas but were considered for inclusion in this analysis since they were the nearest available sources of air quality data and represent a conservative estimate of Pendleton background air quality. The Buffalo monitor was used as the source for NO2 ambient air quality concentrations based on the availability of recent data and completeness. Although the Amherst monitor is located in closest proximity to the proposed Pendleton facility, this monitor was not selected as a source for NO2 background air quality since this pollutant was not measured in 2013 or 2014. The Buffalo Near-Road monitor was similarly discounted since this pollutant was not measured in 2013 or 2014. The Brookside Terrace monitor was used as the source for PM2.5 background air quality based on the proximity to the proposed facility, completeness of data, and availability of recent data. The Buffalo monitor was not selected based on the greater distance to the facility relative to the Brookside Terrace monitor. The Niagara Falls and Buffalo Near-Road monitors were not selected since only one year of data was available for the 2012 through 2014 time period. The Niagara Falls monitor was the only available recent source of PM10 air quality data. However, measurements for 2013 and 2014 were not available since the NYSDEC has discontinued monitoring of PM10 in this region. Therefore, the selected PM10 background concentration was based on the most recent available data (2010 through 2012). The selected conservative background concentrations and source monitor are shown in Table 9. The listed annual concentrations for NO2 and PM2.5 represent the three year average of the annual concentrations. The listed 1-hr NO2 and 24-hr PM2.5 concentrations represent the 98th percentile concentration averaged over three years. The listed 24-hr PM10 concentration corresponds to the 2nd high value for each year, averaged over three years.
Table 9 - Selected Background Ambient Air Quality Data
Pollutant Monitor Site No. Averaging Period
Concentration (ppb)
Concentration (µg/m3)
Year Year Year Avg. Year Year Year Avg.
NO2 Buffalo 1401-18 2012 2013 2014 2012 2013 2014
1-hr 45.6 46.6 54.6 48.8 85.7 87.6 102.6 91.7 Annual 10.46 10.38 8.8 9.9 19.7 19.5 16.5 18.6
PM2.5 Brookside Terrace 1472-14
2012 2013 2014 24-hr 20.3 19.4 15.9 18.5
Annual 8.8 8.2 7.6 8.1
PM10 Niagara Falls 3102-25
2010 2011 2012 24-hr 47 32 42 40.3
Empire Pipeline, Inc. Pendleton Compressor Station Air Quality Impact Modeling Analysis Report
DAY ENVIRONMENTAL, INC. Page 9 of 9 NFuel.5011I-14 / ZJT0070
6.2 Results Table 10 below compares the total facility concentrations for NO2, PM2.5, and PM10 plus the selected background concentrations to the corresponding NAAQS value. [Note: As discussed in Section 5.0, the total facility concentrations for CO and SO2 do not exceed the established SILs. Therefore, compliance with the NAAQS is demonstrated for these pollutants and CO and SO2 are not listed in Table 10]. Similar to the method described in Section 4.0, each emissions source was modeled at a 1 lb/hr emission rate and the predicted modeled concentration scaled based on the specific pollutant lb/hr emission rate (refer to Table 4) to determine the modeled concentration for each pollutant and averaging period.
Table 10 - Summary of NAAQS Analysis
Pollutant Averaging Period
Total Facility Conc.
( µg/m3)
Background Conc.
( µg/m3)
Facility + Background
( µg/m3)
NAAQS Threshold ( µg/m3)
%NAAQS
NO2 1-hr 81.8 91.7 173.6 188 92 Annual 9.4 18.6 28.0 99.6 27
PM2.5 24-hr 7.4 18.5 25.9 35 82 Annual 1.3 8.1 9.4 12 78
PM10 24-hr 7.4 40.3 47.7 150 34 The modeling results indicate that emissions from the proposed Pendleton Compressor Station do not have the potential to exceed the threshold values established by the NAAQS at or beyond the facility fenceline.
Figure 1 Pendleton Compressor Station
Project Locus Map
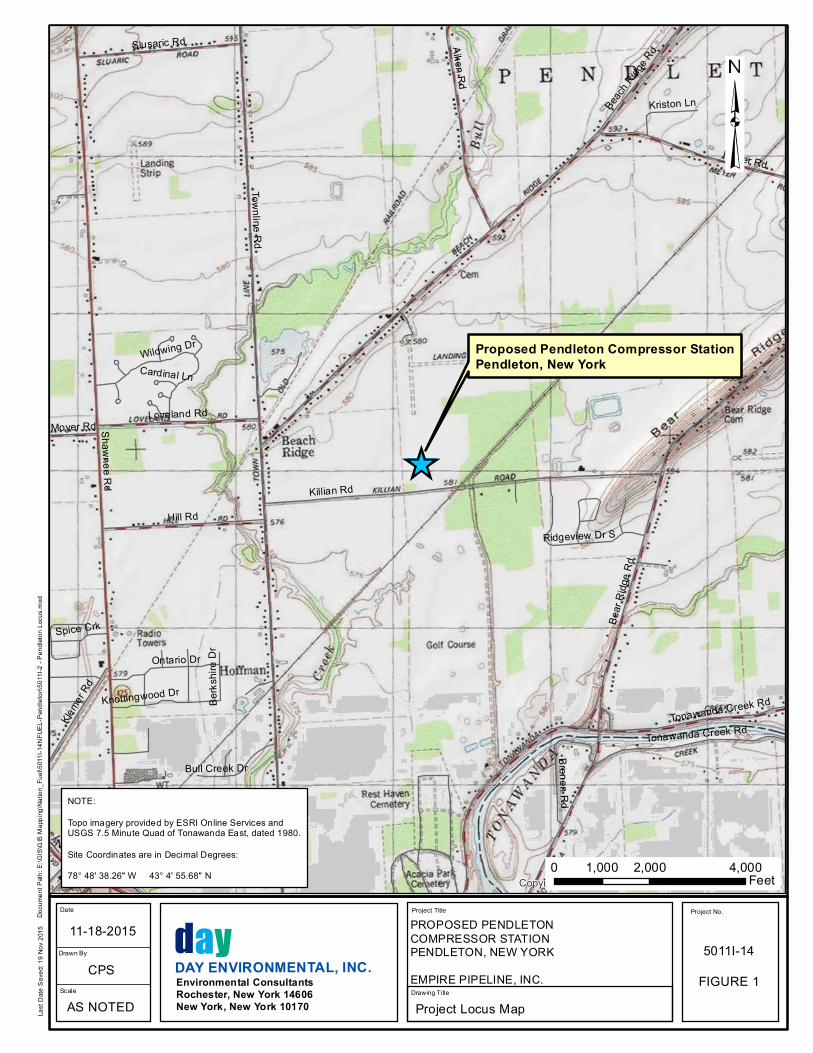
5011I-14FIGURE 1
11-18-2015
CPS
AS NOTED
PROPOSED PENDLETON COMPRESSOR STATIONPENDLETON, NEW YORKEMPIRE PIPELINE, INC.
Project Locus Map
DAY ENVIRONMENTAL, INC.Environmental ConsultantsRochester, New York 14606New York, New York 10170
Date
Drawn By
Scale
Project No.Project Title
Drawing Title
day
Shawnee Rd
Killian Rd
Beach R
idge R
d
Townline Rd
Bear
Ridg
e Rd
Hill Rd
Aiken Rd
Meyer Rd
Tonawanda Creek Rd
Slusaric Rd
Loveland Rd
Klemer
Rd
Ontario Dr
Wildwing Dr
Knottingwood Dr
Brenon Rd
Bull Creek Dr
Ridgeview Dr S
Spice Crk
Kriston Ln
Niagara Falls Blvd
Moyer Rd
Berks
hire D
r
Cardinal Ln
Tonawanda Creek Rd
Copyright:© 2013 National Geographic Society, i-cubed0 2,000 4,0001,000
Feet
NOTE:
Topo imagery provided by ESRI Online Services andUSGS 7.5 Minute Quad of Tonawanda East, dated 1980.
Site Coordinates are in Decimal Degrees:78° 48' 38.26" W 43° 4' 55.68" N
Proposed Pendleton Compressor StationPendleton, New York
Docu
ment
Path:
E:\G
IS\G
IS Ma
pping
\Nati
on_F
uel\5
011I-
14NF
UEL-
Pend
leton
\5011
I-2 - P
endle
ton Lo
cus.m
xdLa
st Da
te Sa
ved:
19 N
ov 20
15

Figure 2 Pendleton Compressor Station
Facility Site Plan
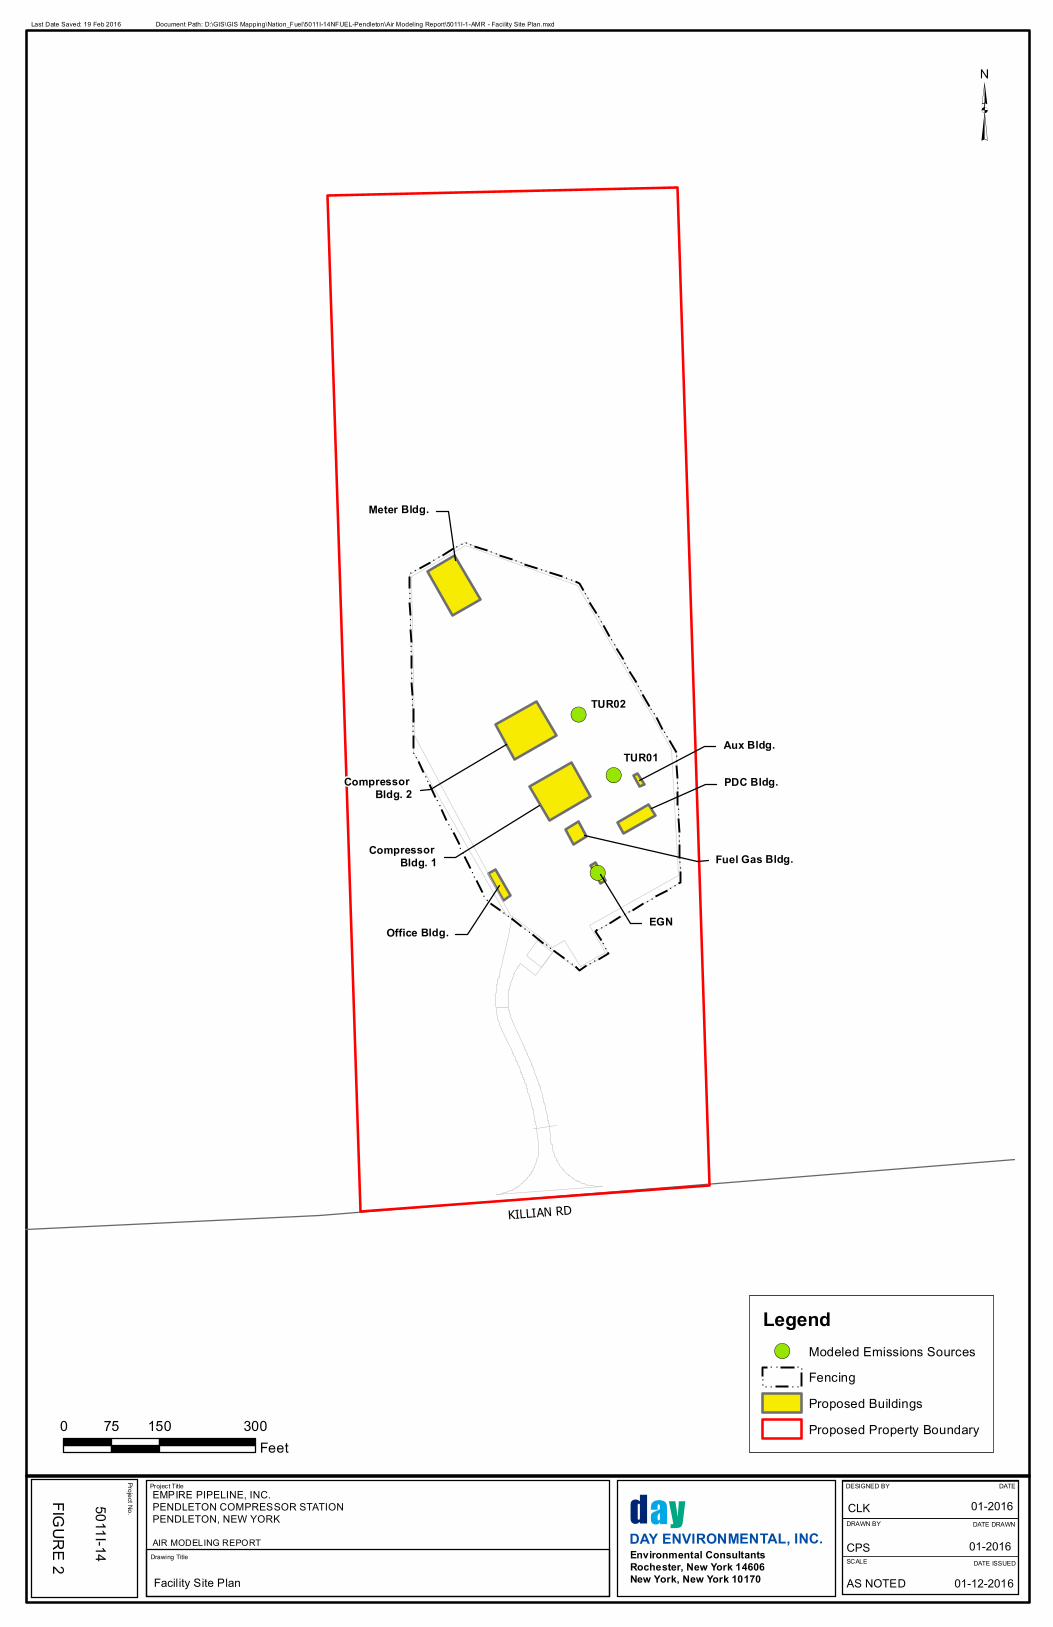
01-2016
CPS
AS NOTED
CLK
01-2016
01-12-2016
DATE DRAWN
DATEDESIGNED BY
DRAWN BY
SCALE DATE ISSUED
Document Path: D:\GIS\GIS Mapping\Nation_Fuel\5011I-14NFUEL-Pendleton\Air Modeling Report\5011I-1-AMR - Facility Site Plan.mxdLast Date Saved: 19 Feb 2016
Environmental ConsultantsRochester, New York 14606New York, New York 10170
DAY ENVIRONMENTAL, INC.yad
Facility Site Plan
5011I-14
FIGURE 2
Legend!( Modeled Emissions Sources
!!
! ! ! !
!!!!
FencingProposed BuildingsProposed Property Boundary
EMPIRE PIPELINE, INC.PENDLETON COMPRESSOR STATION PENDLETON, NEW YORKAIR MODELING REPORT
Project No.
Drawing Title
Project Title
³
0 150 30075Feet
!!
!!
!!
!!
!!
!
!
!
!
!
!
!
!
!
!
!
!
!
!
!!
!!
!!
!!
!!
!
!
!
!
!
!
!
!
!
!
!
!!
!
!
!
!
!
!
!
!
!
!!
!
!
!
!
!
!
!!
!
!!
!!
!!
!!
!!
!!
!
!
!
!
!
!
!
!(
!(
!(
Meter Bldg.
Compressor Bldg. 2
Compressor Bldg. 1
PDC Bldg.
Office Bldg.
Fuel Gas Bldg.
EGN
Aux Bldg.
TUR02
TUR01
KILLIAN RD

Figure 3 Pendleton Compressor Station
Land Use Map
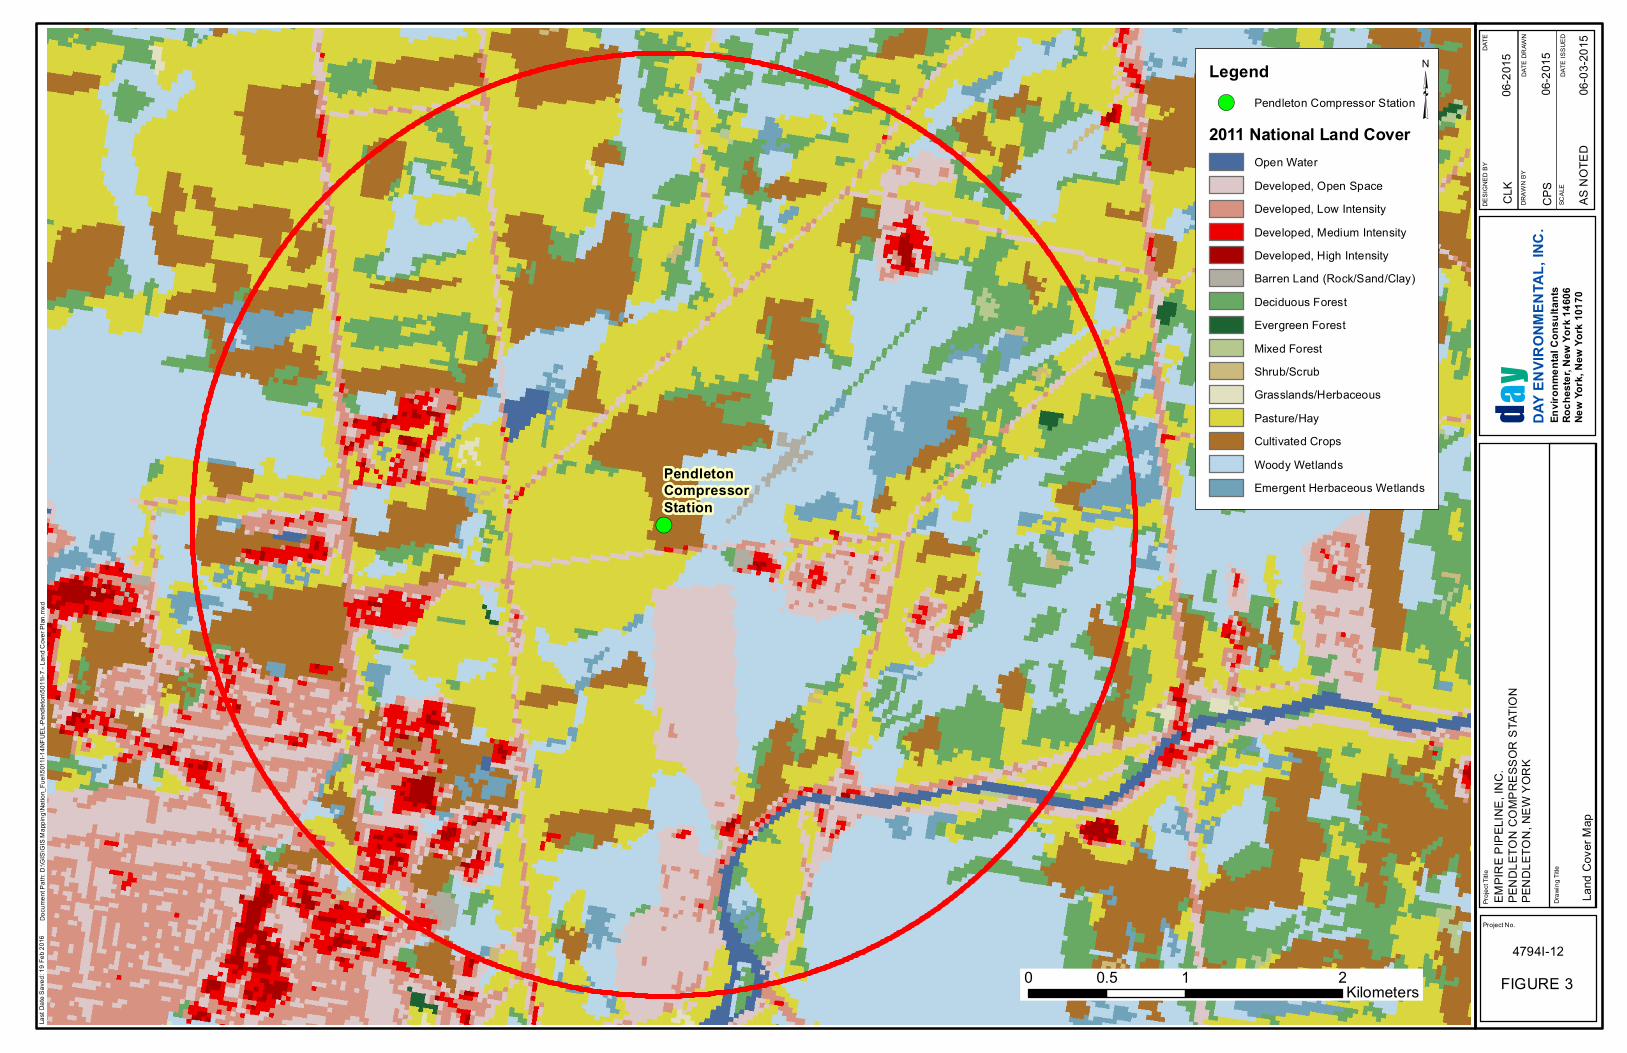
!(
PendletonCompressorStation
EMPIR
E PIP
ELIN
E, IN
C.PE
NDLE
TON
COMP
RESS
OR S
TATIO
NPE
NDLE
TON,
NEW
YORK
Land
Cov
er Ma
p
4794I-12
06-20
15
CPS
AS N
OTED
FIGURE 3
CLK
06-20
15
06-03
-2015
DATE
DRA
WN
DATE
DESI
GNED
BY
DRAW
N BY
SCAL
EDA
TE IS
SUED
Project No.
Draw
ing Ti
tle
Proje
ct Tit
le
0 1 20.5 Kilometers
Docu
ment
Path:
D:\G
IS\G
IS M
appin
g\Nati
on_F
uel\5
011I-
14NF
UEL-P
endle
ton\50
11I-7
- Lan
d Cov
er Pl
an.m
xdLa
st Da
te Sa
ved:
19 Fe
b 201
6
Envir
onme
ntal C
onsu
ltants
Roch
ester
, New
York
1460
6Ne
w Yo
rk, N
ew Yo
rk 10
170
DAY
ENVIR
ONME
NTAL
, INC.
yad
Legend!( Pendleton Compressor Station
2011 National Land CoverOpen WaterDeveloped, Open SpaceDeveloped, Low IntensityDeveloped, Medium IntensityDeveloped, High IntensityBarren Land (Rock/Sand/Clay)Deciduous ForestEvergreen ForestMixed ForestShrub/ScrubGrasslands/HerbaceousPasture/HayCultivated CropsWoody WetlandsEmergent Herbaceous Wetlands
³

Appendix A Pendleton Compressor Station
Model Project Files

AERSCREEN 15181 / AERMOD 15181 02/09/16 15:17:01
TITLE: PEND TUR1 0 DEG 100% LOAD NAAQS
----------------------------------------------------------------------------- ***************************** STACK PARAMETERS **************************** -----------------------------------------------------------------------------
SOURCE EMISSION RATE: 0.1260 g/s 1.000 lb/hr STACK HEIGHT: 16.85 meters 55.29 feet STACK INNER DIAMETER: 2.980 meters 117.32 inches PLUME EXIT TEMPERATURE: 748.2 K 887.0 Deg F PLUME EXIT VELOCITY: 9.035 m/s 29.64 ft/s STACK AIR FLOW RATE: 133524 ACFM STACK BASE LONGITUDE: -78.8108 deg 678204. Easting STACK BASE LATITUDE: 43.0823 deg 4772284. Northing STACK BASE UTM ZONE: 17 REFERENCE DATUM (NADA): 4 STACK BASE ELEVATION: 176.00 meters 577.43 feet RURAL OR URBAN: RURAL
DIGITAL ELEVATION MAP(S) C:\Users\STAFF~1.DAY\DOCUME~1\AIRMOD~1\AERSCR~1\NFDD98~1\NED_08~1\NED_08951897.tif
INITIAL PROBE DISTANCE = 3000. meters 9843. feet
----------------------------------------------------------------------------- *********************** BUILDING DOWNWASH PARAMETERS ********************** -----------------------------------------------------------------------------
USER DEFINED BPIPPRM INPUT FILE: C:\USERS\STAFF.DAYOFFICE\DESKTOP\PENDSITED\D_TUR1.TXT
MAXIMUM BUILDING HEIGHT: 16.0 meters 52.4 feet
MAXIMUM BUILDING LENGTH: 56.9 meters 186.7 feet
MINIMUM BUILDING WIDTH: 0.0 meters 0.0 feet
----------------------------------------------------------------------------- ************************** FLOW SECTOR ANALYSIS *************************** 25 meter receptor spacing: 31. meters - 3000. meters -----------------------------------------------------------------------------
MAXIMUM IMPACT RECEPTOR FLOW BUILD BUILD 1-HR CONC DIST HEIGHT TEMPORAL SECTOR WIDTH LENGTH XBADJ YBADJ (ug/m3) (m) (m) PERIOD ---------------------------------------------------------------------------------- 10 0.00 0.00 0.00 0.00 3.092 125.0 0.05 SUM 20 28.98 29.55 -31.39 20.66 2.899 150.0 0.05 WIN 30 27.54 29.03 -34.47 17.46 3.025 150.0 0.05 WIN 40 25.26 27.63 -36.49 13.73 3.603 150.0 0.05 WIN 50 22.22 25.39 -37.41 9.58 4.249 150.0 0.04 WIN 60 19.30 23.04 -37.53 5.14 4.225 175.0 0.11 WIN 70 22.89 25.90 -39.46 0.55 4.139 175.0 0.18 WIN 80 25.79 27.97 -40.19 -4.06 4.219 150.0 0.18 WIN 90 27.90 29.20 -57.10 19.95 1.580 175.0 0.29 WIN 100 29.17 29.54 -60.09 12.27 3.099 175.0 0.36 WIN
110 29.55 28.98 -35.15 -16.62 3.253 150.0 0.41 WIN 120 29.03 27.54 -60.55 -3.97 3.096 175.0 0.45 WIN 130 27.63 25.26 -58.01 -12.03 3.209 175.0 0.46 WIN 140 25.39 22.22 -53.71 -19.73 1.594 175.0 0.46 WIN 150 0.00 0.00 0.00 0.00 3.032 125.0 0.34 SUM 160 0.00 0.00 0.00 0.00 3.032 125.0 0.24 SUM 170 0.00 0.00 0.00 0.00 3.032 125.0 0.16 SUM 180 0.00 0.00 0.00 0.00 3.031 125.0 0.12 SUM 190 0.00 0.00 0.00 0.00 3.117 125.0 0.06 SUM 200 28.98 29.55 1.84 -20.66 7.106 50.0 0.08 AUT 210 27.54 29.03 5.44 -17.46 8.833 50.0 0.05 AUT 220 25.26 27.63 8.87 -13.73 5.197 50.0 0.03 SUM 230 22.22 25.39 12.03 -9.58 4.476 50.0 0.02 SUM 240 19.30 23.04 14.49 -5.14 4.843 50.0 0.01 SUM 250 22.89 25.90 13.56 -0.55 5.914 50.0 -0.01 SUM 260 25.79 27.97 12.22 4.06 5.795 50.0 -0.03 SUM 270 27.90 29.20 10.50 8.55 5.606 50.0 -0.05 SUM 280 29.17 29.54 8.47 12.78 5.113 50.0 -0.05 SUM 290 29.55 28.98 6.17 16.62 5.537 50.0 -0.05 SUM 300 29.03 27.54 3.69 19.95 8.734 50.0 -0.05 SUM 310* 38.27 56.91 1.10 17.36 10.34 75.0 -0.05 SUM 320 25.39 22.22 31.49 19.73 3.310 75.0 -0.05 SUM 330 0.00 0.00 0.00 0.00 3.105 125.0 -0.06 SUM 340 0.00 0.00 0.00 0.00 3.109 125.0 -0.04 SUM 350 0.00 0.00 0.00 0.00 3.115 125.0 0.02 SUM 360 0.00 0.00 0.00 0.00 3.092 125.0 0.04 SUM * = worst case flow sector
----------------------------------------------------------------------------- ********************** MAKEMET METEOROLOGY PARAMETERS ********************* -----------------------------------------------------------------------------
MIN/MAX TEMPERATURE: 255.0 / 311.0 (K)
MINIMUM WIND SPEED: 0.5 m/s
ANEMOMETER HEIGHT: 10.000 meters
SURFACE CHARACTERISTICS INPUT: C:\Users\staff.DAYOFFICE\Documents\Air Modeling - local copy\AERSCREEN\NFGSC - Pendleton\Land Use Data\Pend_SiteC_AERSURFACE.out
DOMINANT SECTOR: 5 (120 150) DOMINANT SEASON: Summer
ALBEDO: 0.18 BOWEN RATIO: 0.46 ROUGHNESS LENGTH: 0.546 (meters)
METEOROLOGY CONDITIONS USED TO PREDICT OVERALL MAXIMUM IMPACT -------------------------------------------------------------
YR MO DY JDY HR -- -- -- --- -- 10 05 06 6 01
H0 U* W* DT/DZ ZICNV ZIMCH M-O LEN Z0 BOWEN ALBEDO REF WS - - - - - - - - - - - - - - - - - - - - - - - - - - - - - - - - - - - - - - -64.00 1.370 -9.000 0.020 -999. 3686. 3833.6 0.546 0.46 0.18 10.00
HT REF TA HT - - - - - - - - - - - 10.0 311.0 2.0
WIND SPEED AT STACK HEIGHT (non-downwash): 11.8 m/s
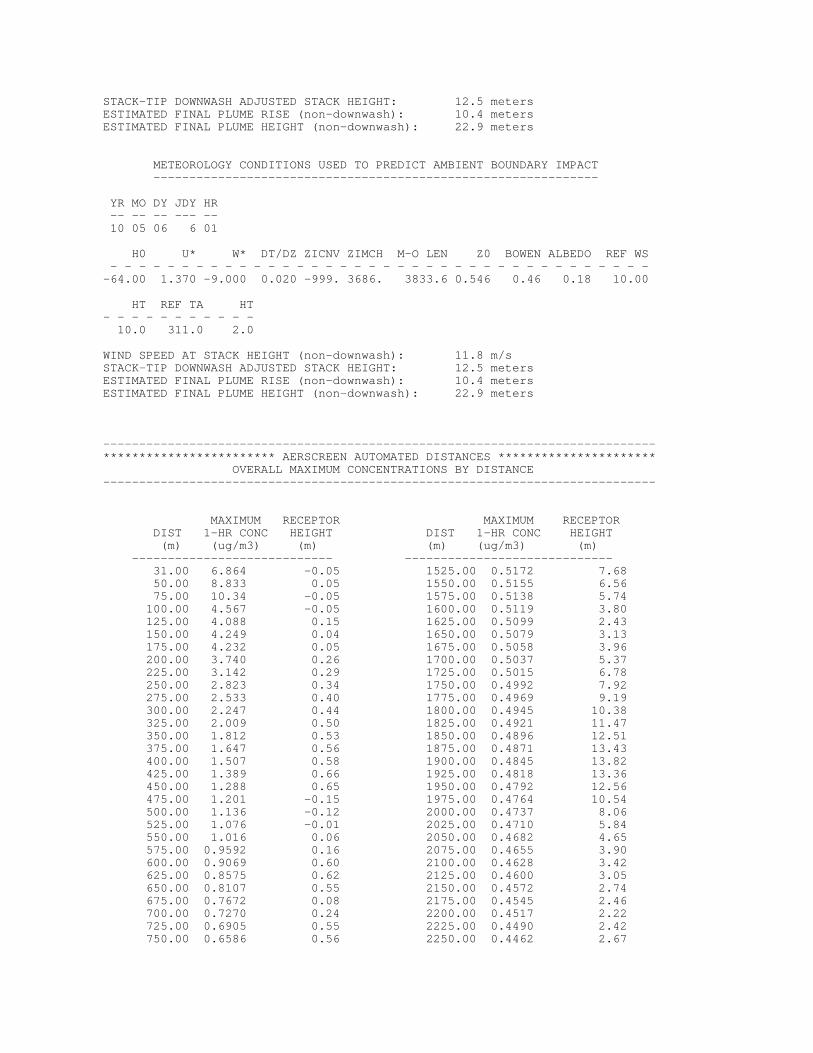
STACK-TIP DOWNWASH ADJUSTED STACK HEIGHT: 12.5 meters ESTIMATED FINAL PLUME RISE (non-downwash): 10.4 meters ESTIMATED FINAL PLUME HEIGHT (non-downwash): 22.9 meters
METEOROLOGY CONDITIONS USED TO PREDICT AMBIENT BOUNDARY IMPACT --------------------------------------------------------------
YR MO DY JDY HR -- -- -- --- -- 10 05 06 6 01
H0 U* W* DT/DZ ZICNV ZIMCH M-O LEN Z0 BOWEN ALBEDO REF WS - - - - - - - - - - - - - - - - - - - - - - - - - - - - - - - - - - - - - - -64.00 1.370 -9.000 0.020 -999. 3686. 3833.6 0.546 0.46 0.18 10.00
HT REF TA HT - - - - - - - - - - - 10.0 311.0 2.0
WIND SPEED AT STACK HEIGHT (non-downwash): 11.8 m/s STACK-TIP DOWNWASH ADJUSTED STACK HEIGHT: 12.5 meters ESTIMATED FINAL PLUME RISE (non-downwash): 10.4 meters ESTIMATED FINAL PLUME HEIGHT (non-downwash): 22.9 meters
----------------------------------------------------------------------------- ************************ AERSCREEN AUTOMATED DISTANCES ********************** OVERALL MAXIMUM CONCENTRATIONS BY DISTANCE -----------------------------------------------------------------------------
MAXIMUM RECEPTOR MAXIMUM RECEPTOR DIST 1-HR CONC HEIGHT DIST 1-HR CONC HEIGHT (m) (ug/m3) (m) (m) (ug/m3) (m) ---------------------------- ----------------------------- 31.00 6.864 -0.05 1525.00 0.5172 7.68 50.00 8.833 0.05 1550.00 0.5155 6.56 75.00 10.34 -0.05 1575.00 0.5138 5.74 100.00 4.567 -0.05 1600.00 0.5119 3.80 125.00 4.088 0.15 1625.00 0.5099 2.43 150.00 4.249 0.04 1650.00 0.5079 3.13 175.00 4.232 0.05 1675.00 0.5058 3.96 200.00 3.740 0.26 1700.00 0.5037 5.37 225.00 3.142 0.29 1725.00 0.5015 6.78 250.00 2.823 0.34 1750.00 0.4992 7.92 275.00 2.533 0.40 1775.00 0.4969 9.19 300.00 2.247 0.44 1800.00 0.4945 10.38 325.00 2.009 0.50 1825.00 0.4921 11.47 350.00 1.812 0.53 1850.00 0.4896 12.51 375.00 1.647 0.56 1875.00 0.4871 13.43 400.00 1.507 0.58 1900.00 0.4845 13.82 425.00 1.389 0.66 1925.00 0.4818 13.36 450.00 1.288 0.65 1950.00 0.4792 12.56 475.00 1.201 -0.15 1975.00 0.4764 10.54 500.00 1.136 -0.12 2000.00 0.4737 8.06 525.00 1.076 -0.01 2025.00 0.4710 5.84 550.00 1.016 0.06 2050.00 0.4682 4.65 575.00 0.9592 0.16 2075.00 0.4655 3.90 600.00 0.9069 0.60 2100.00 0.4628 3.42 625.00 0.8575 0.62 2125.00 0.4600 3.05 650.00 0.8107 0.55 2150.00 0.4572 2.74 675.00 0.7672 0.08 2175.00 0.4545 2.46 700.00 0.7270 0.24 2200.00 0.4517 2.22 725.00 0.6905 0.55 2225.00 0.4490 2.42 750.00 0.6586 0.56 2250.00 0.4462 2.67
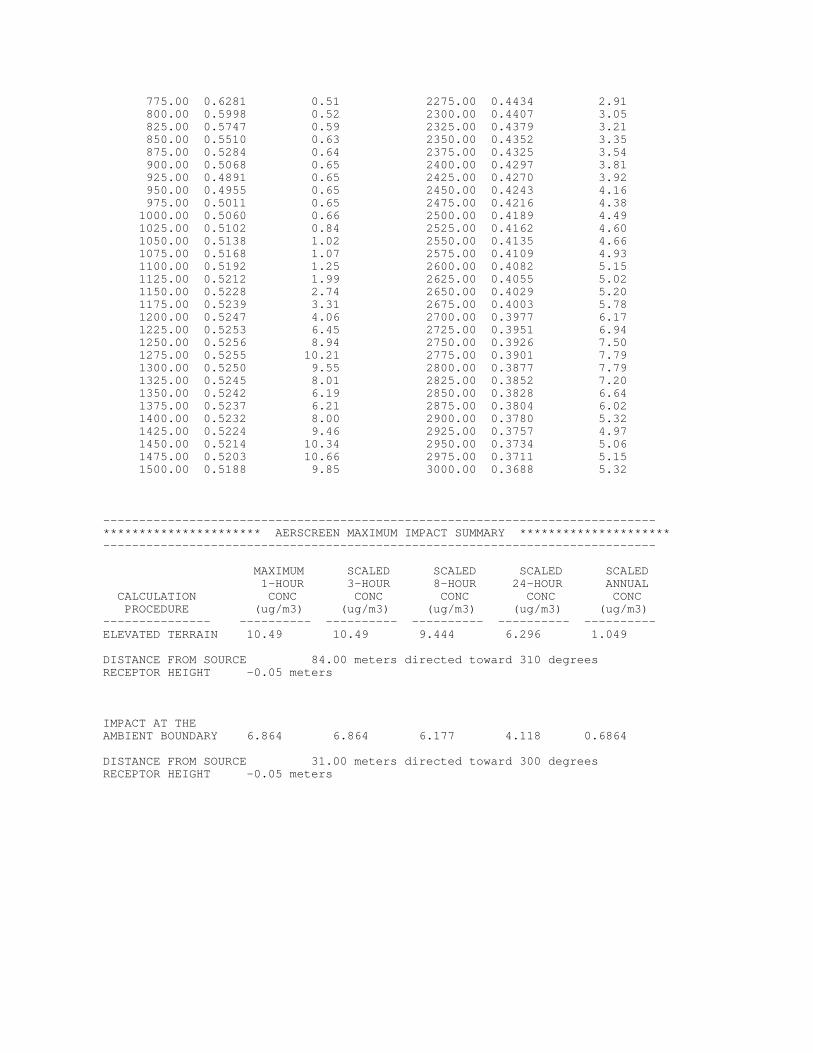
775.00 0.6281 0.51 2275.00 0.4434 2.91 800.00 0.5998 0.52 2300.00 0.4407 3.05 825.00 0.5747 0.59 2325.00 0.4379 3.21 850.00 0.5510 0.63 2350.00 0.4352 3.35 875.00 0.5284 0.64 2375.00 0.4325 3.54 900.00 0.5068 0.65 2400.00 0.4297 3.81 925.00 0.4891 0.65 2425.00 0.4270 3.92 950.00 0.4955 0.65 2450.00 0.4243 4.16 975.00 0.5011 0.65 2475.00 0.4216 4.38 1000.00 0.5060 0.66 2500.00 0.4189 4.49 1025.00 0.5102 0.84 2525.00 0.4162 4.60 1050.00 0.5138 1.02 2550.00 0.4135 4.66 1075.00 0.5168 1.07 2575.00 0.4109 4.93 1100.00 0.5192 1.25 2600.00 0.4082 5.15 1125.00 0.5212 1.99 2625.00 0.4055 5.02 1150.00 0.5228 2.74 2650.00 0.4029 5.20 1175.00 0.5239 3.31 2675.00 0.4003 5.78 1200.00 0.5247 4.06 2700.00 0.3977 6.17 1225.00 0.5253 6.45 2725.00 0.3951 6.94 1250.00 0.5256 8.94 2750.00 0.3926 7.50 1275.00 0.5255 10.21 2775.00 0.3901 7.79 1300.00 0.5250 9.55 2800.00 0.3877 7.79 1325.00 0.5245 8.01 2825.00 0.3852 7.20 1350.00 0.5242 6.19 2850.00 0.3828 6.64 1375.00 0.5237 6.21 2875.00 0.3804 6.02 1400.00 0.5232 8.00 2900.00 0.3780 5.32 1425.00 0.5224 9.46 2925.00 0.3757 4.97 1450.00 0.5214 10.34 2950.00 0.3734 5.06 1475.00 0.5203 10.66 2975.00 0.3711 5.15 1500.00 0.5188 9.85 3000.00 0.3688 5.32
----------------------------------------------------------------------------- ********************** AERSCREEN MAXIMUM IMPACT SUMMARY ********************* -----------------------------------------------------------------------------
MAXIMUM SCALED SCALED SCALED SCALED 1-HOUR 3-HOUR 8-HOUR 24-HOUR ANNUAL CALCULATION CONC CONC CONC CONC CONC PROCEDURE (ug/m3) (ug/m3) (ug/m3) (ug/m3) (ug/m3) --------------- ---------- ---------- ---------- ---------- ---------- ELEVATED TERRAIN 10.49 10.49 9.444 6.296 1.049
DISTANCE FROM SOURCE 84.00 meters directed toward 310 degrees RECEPTOR HEIGHT -0.05 meters
IMPACT AT THE AMBIENT BOUNDARY 6.864 6.864 6.177 4.118 0.6864
DISTANCE FROM SOURCE 31.00 meters directed toward 300 degrees RECEPTOR HEIGHT -0.05 meters
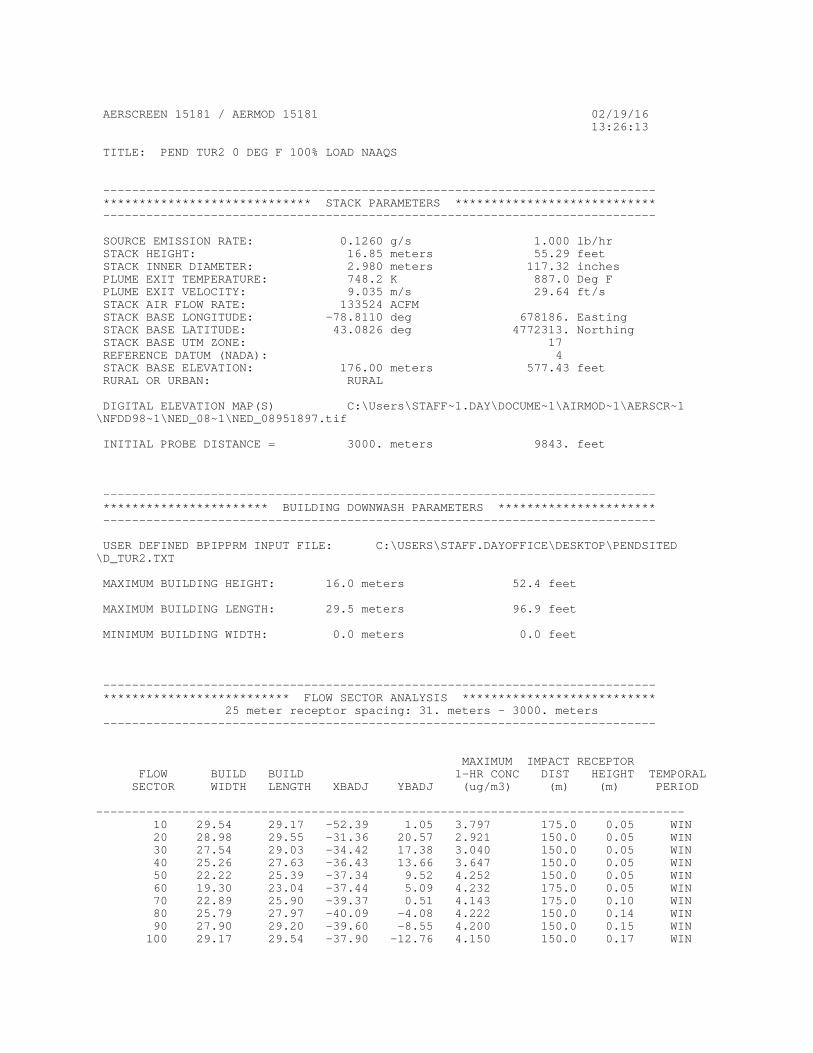
AERSCREEN 15181 / AERMOD 15181 02/19/16 13:26:13
TITLE: PEND TUR2 0 DEG F 100% LOAD NAAQS
----------------------------------------------------------------------------- ***************************** STACK PARAMETERS **************************** -----------------------------------------------------------------------------
SOURCE EMISSION RATE: 0.1260 g/s 1.000 lb/hr STACK HEIGHT: 16.85 meters 55.29 feet STACK INNER DIAMETER: 2.980 meters 117.32 inches PLUME EXIT TEMPERATURE: 748.2 K 887.0 Deg F PLUME EXIT VELOCITY: 9.035 m/s 29.64 ft/s STACK AIR FLOW RATE: 133524 ACFM STACK BASE LONGITUDE: -78.8110 deg 678186. Easting STACK BASE LATITUDE: 43.0826 deg 4772313. Northing STACK BASE UTM ZONE: 17 REFERENCE DATUM (NADA): 4 STACK BASE ELEVATION: 176.00 meters 577.43 feet RURAL OR URBAN: RURAL
DIGITAL ELEVATION MAP(S) C:\Users\STAFF~1.DAY\DOCUME~1\AIRMOD~1\AERSCR~1\NFDD98~1\NED_08~1\NED_08951897.tif
INITIAL PROBE DISTANCE = 3000. meters 9843. feet
----------------------------------------------------------------------------- *********************** BUILDING DOWNWASH PARAMETERS ********************** -----------------------------------------------------------------------------
USER DEFINED BPIPPRM INPUT FILE: C:\USERS\STAFF.DAYOFFICE\DESKTOP\PENDSITED\D_TUR2.TXT
MAXIMUM BUILDING HEIGHT: 16.0 meters 52.4 feet
MAXIMUM BUILDING LENGTH: 29.5 meters 96.9 feet
MINIMUM BUILDING WIDTH: 0.0 meters 0.0 feet
----------------------------------------------------------------------------- ************************** FLOW SECTOR ANALYSIS *************************** 25 meter receptor spacing: 31. meters - 3000. meters -----------------------------------------------------------------------------
MAXIMUM IMPACT RECEPTOR FLOW BUILD BUILD 1-HR CONC DIST HEIGHT TEMPORAL SECTOR WIDTH LENGTH XBADJ YBADJ (ug/m3) (m) (m) PERIOD ---------------------------------------------------------------------------------- 10 29.54 29.17 -52.39 1.05 3.797 175.0 0.05 WIN 20 28.98 29.55 -31.36 20.57 2.921 150.0 0.05 WIN 30 27.54 29.03 -34.42 17.38 3.040 150.0 0.05 WIN 40 25.26 27.63 -36.43 13.66 3.647 150.0 0.05 WIN 50 22.22 25.39 -37.34 9.52 4.252 150.0 0.05 WIN 60 19.30 23.04 -37.44 5.09 4.232 175.0 0.05 WIN 70 22.89 25.90 -39.37 0.51 4.143 175.0 0.10 WIN 80 25.79 27.97 -40.09 -4.08 4.222 150.0 0.14 WIN 90 27.90 29.20 -39.60 -8.55 4.200 150.0 0.15 WIN 100 29.17 29.54 -37.90 -12.76 4.150 150.0 0.17 WIN

110 29.55 28.98 -35.06 -16.58 3.267 150.0 0.20 WIN 120 29.03 27.54 -31.14 -19.90 3.026 150.0 0.30 WIN 130 0.00 0.00 0.00 0.00 3.090 125.0 0.29 SUM 140 0.00 0.00 0.00 0.00 3.090 125.0 0.29 SUM 150 0.00 0.00 0.00 0.00 3.032 125.0 0.24 SUM 160 25.90 22.89 20.77 -19.81 2.046 175.0 0.24 WIN 170 27.97 25.79 22.27 -13.92 4.009 75.0 0.10 SUM 180 29.20 27.90 23.10 -7.60 4.368 75.0 0.08 SUM 190 29.54 29.17 23.22 -1.05 4.733 75.0 0.05 SUM 200 28.98 29.55 22.64 5.53 4.838 75.0 0.03 SUM 210* 27.54 29.03 5.39 -17.38 8.816 50.0 -0.01 AUT 220 25.26 27.63 19.45 17.99 6.610 50.0 -0.02 AUT 230 22.22 25.39 11.95 -9.52 4.483 50.0 -0.04 SUM 240 19.30 23.04 14.41 -5.09 4.651 50.0 -0.05 SUM 250 22.89 25.90 13.47 -0.51 5.912 50.0 -0.05 SUM 260 25.79 27.97 12.12 4.08 5.787 50.0 -0.05 SUM 270 27.90 29.20 10.40 8.55 5.432 50.0 -0.05 SUM 280 29.17 29.54 8.37 12.76 4.961 50.0 -0.05 SUM 290 29.55 28.98 6.08 16.58 5.529 50.0 -0.05 SUM 300 29.03 27.54 3.61 19.90 8.715 50.0 -0.05 SUM 310 0.00 0.00 0.00 0.00 3.835 75.0 -0.05 SUM 320 0.00 0.00 0.00 0.00 3.832 75.0 -0.06 SUM 330 0.00 0.00 0.00 0.00 3.107 125.0 -0.05 SUM 340 25.90 22.89 -43.66 19.81 1.990 175.0 -0.04 WIN 350 27.97 25.79 -48.06 13.92 3.934 175.0 0.05 WIN 360 29.20 27.90 -51.00 7.60 3.908 175.0 0.05 WIN * = worst case flow sector
----------------------------------------------------------------------------- ********************** MAKEMET METEOROLOGY PARAMETERS ********************* -----------------------------------------------------------------------------
MIN/MAX TEMPERATURE: 255.0 / 311.0 (K)
MINIMUM WIND SPEED: 0.5 m/s
ANEMOMETER HEIGHT: 10.000 meters
SURFACE CHARACTERISTICS INPUT: C:\Users\staff.DAYOFFICE\Documents\Air Modeling - local copy\AERSCREEN\NFGSC - Pendleton\Land Use Data\Pend_SiteC_AERSURFACE.out
DOMINANT SECTOR: 2 ( 30 60) DOMINANT SEASON: Autumn
ALBEDO: 0.18 BOWEN RATIO: 0.76 ROUGHNESS LENGTH: 0.309 (meters)
METEOROLOGY CONDITIONS USED TO PREDICT OVERALL MAXIMUM IMPACT -------------------------------------------------------------
YR MO DY JDY HR -- -- -- --- -- 10 04 15 15 13
H0 U* W* DT/DZ ZICNV ZIMCH M-O LEN Z0 BOWEN ALBEDO REF WS - - - - - - - - - - - - - - - - - - - - - - - - - - - - - - - - - - - - - - 257.79 1.171 1.800 0.020 864. 2913. -594.4 0.309 0.76 0.18 10.00
HT REF TA HT - - - - - - - - - - - 10.0 311.0 2.0
WIND SPEED AT STACK HEIGHT (non-downwash): 11.4 m/s

STACK-TIP DOWNWASH ADJUSTED STACK HEIGHT: 12.6 meters ESTIMATED FINAL PLUME RISE (non-downwash): 59.3 meters ESTIMATED FINAL PLUME HEIGHT (non-downwash): 71.9 meters
METEOROLOGY CONDITIONS USED TO PREDICT AMBIENT BOUNDARY IMPACT --------------------------------------------------------------
YR MO DY JDY HR -- -- -- --- -- 10 05 06 15 01
H0 U* W* DT/DZ ZICNV ZIMCH M-O LEN Z0 BOWEN ALBEDO REF WS - - - - - - - - - - - - - - - - - - - - - - - - - - - - - - - - - - - - - - -64.00 1.370 -9.000 0.020 -999. 3686. 3833.6 0.546 0.46 0.18 10.00
HT REF TA HT - - - - - - - - - - - 10.0 311.0 2.0
WIND SPEED AT STACK HEIGHT (non-downwash): 11.8 m/s STACK-TIP DOWNWASH ADJUSTED STACK HEIGHT: 12.5 meters ESTIMATED FINAL PLUME RISE (non-downwash): 10.4 meters ESTIMATED FINAL PLUME HEIGHT (non-downwash): 22.9 meters
----------------------------------------------------------------------------- ************************ AERSCREEN AUTOMATED DISTANCES ********************** OVERALL MAXIMUM CONCENTRATIONS BY DISTANCE -----------------------------------------------------------------------------
MAXIMUM RECEPTOR MAXIMUM RECEPTOR DIST 1-HR CONC HEIGHT DIST 1-HR CONC HEIGHT (m) (ug/m3) (m) (m) (ug/m3) (m) ---------------------------- ----------------------------- 31.00 6.871 -0.05 1525.00 0.5174 10.87 50.00 8.816 -0.01 1550.00 0.5157 9.76 75.00 5.725 0.00 1575.00 0.5139 8.57 100.00 4.060 -0.05 1600.00 0.5120 7.47 125.00 4.146 0.13 1625.00 0.5100 5.33 150.00 4.252 0.05 1650.00 0.5079 3.38 175.00 4.234 0.05 1675.00 0.5058 2.38 200.00 3.981 0.27 1700.00 0.5036 2.75 225.00 3.282 0.35 1725.00 0.5014 3.44 250.00 2.943 0.41 1750.00 0.4991 4.39 275.00 2.650 0.44 1775.00 0.4968 5.55 300.00 2.369 0.54 1800.00 0.4944 6.70 325.00 2.117 0.57 1825.00 0.4919 7.98 350.00 1.906 0.64 1850.00 0.4895 9.33 375.00 1.727 0.60 1875.00 0.4870 10.65 400.00 1.576 0.51 1900.00 0.4844 12.11 425.00 1.447 0.59 1925.00 0.4818 13.21 450.00 1.336 0.51 1950.00 0.4792 13.73 475.00 1.240 0.41 1975.00 0.4765 13.73 500.00 1.155 0.33 2000.00 0.4738 12.81 525.00 1.081 -0.13 2025.00 0.4710 10.35 550.00 1.020 -0.03 2050.00 0.4683 7.76 575.00 0.9618 0.16 2075.00 0.4655 5.96 600.00 0.9081 0.42 2100.00 0.4628 4.95 625.00 0.8588 0.64 2125.00 0.4600 4.41 650.00 0.8130 0.27 2150.00 0.4573 3.87 675.00 0.7704 0.35 2175.00 0.4545 3.34 700.00 0.7307 0.43 2200.00 0.4517 2.96 725.00 0.6936 0.44 2225.00 0.4490 2.90 750.00 0.6589 0.44 2250.00 0.4462 2.96
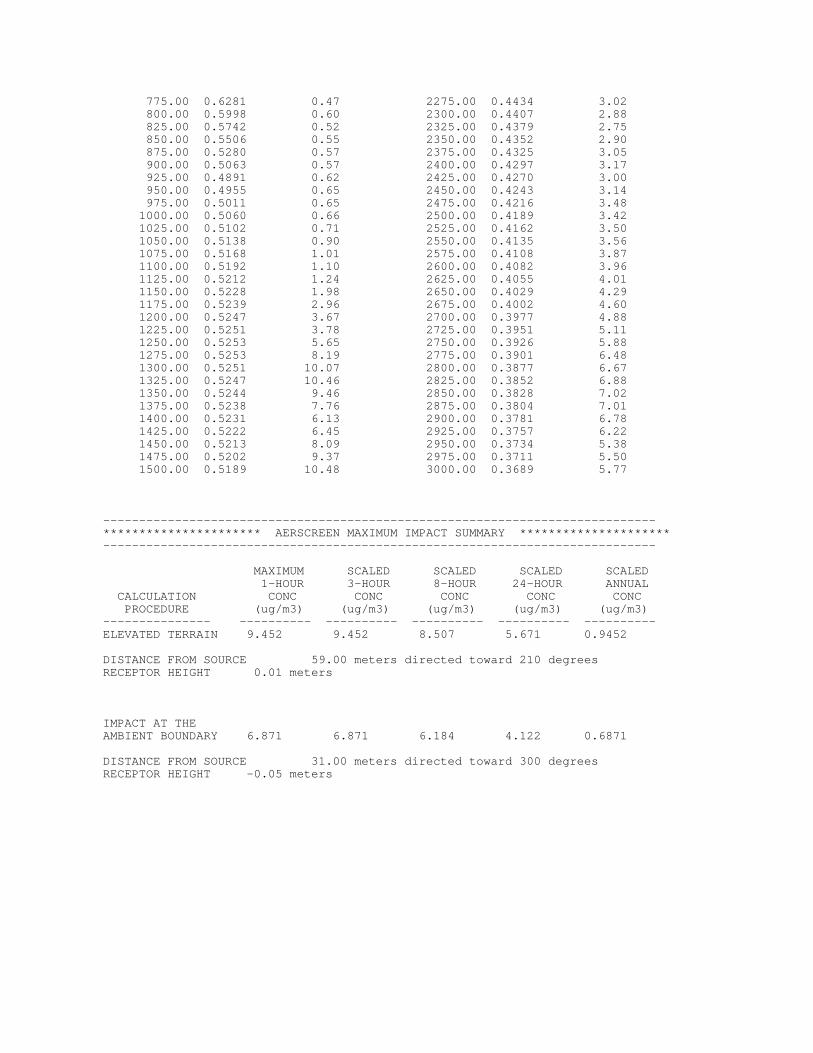
775.00 0.6281 0.47 2275.00 0.4434 3.02 800.00 0.5998 0.60 2300.00 0.4407 2.88 825.00 0.5742 0.52 2325.00 0.4379 2.75 850.00 0.5506 0.55 2350.00 0.4352 2.90 875.00 0.5280 0.57 2375.00 0.4325 3.05 900.00 0.5063 0.57 2400.00 0.4297 3.17 925.00 0.4891 0.62 2425.00 0.4270 3.00 950.00 0.4955 0.65 2450.00 0.4243 3.14 975.00 0.5011 0.65 2475.00 0.4216 3.48 1000.00 0.5060 0.66 2500.00 0.4189 3.42 1025.00 0.5102 0.71 2525.00 0.4162 3.50 1050.00 0.5138 0.90 2550.00 0.4135 3.56 1075.00 0.5168 1.01 2575.00 0.4108 3.87 1100.00 0.5192 1.10 2600.00 0.4082 3.96 1125.00 0.5212 1.24 2625.00 0.4055 4.01 1150.00 0.5228 1.98 2650.00 0.4029 4.29 1175.00 0.5239 2.96 2675.00 0.4002 4.60 1200.00 0.5247 3.67 2700.00 0.3977 4.88 1225.00 0.5251 3.78 2725.00 0.3951 5.11 1250.00 0.5253 5.65 2750.00 0.3926 5.88 1275.00 0.5253 8.19 2775.00 0.3901 6.48 1300.00 0.5251 10.07 2800.00 0.3877 6.67 1325.00 0.5247 10.46 2825.00 0.3852 6.88 1350.00 0.5244 9.46 2850.00 0.3828 7.02 1375.00 0.5238 7.76 2875.00 0.3804 7.01 1400.00 0.5231 6.13 2900.00 0.3781 6.78 1425.00 0.5222 6.45 2925.00 0.3757 6.22 1450.00 0.5213 8.09 2950.00 0.3734 5.38 1475.00 0.5202 9.37 2975.00 0.3711 5.50 1500.00 0.5189 10.48 3000.00 0.3689 5.77
----------------------------------------------------------------------------- ********************** AERSCREEN MAXIMUM IMPACT SUMMARY ********************* -----------------------------------------------------------------------------
MAXIMUM SCALED SCALED SCALED SCALED 1-HOUR 3-HOUR 8-HOUR 24-HOUR ANNUAL CALCULATION CONC CONC CONC CONC CONC PROCEDURE (ug/m3) (ug/m3) (ug/m3) (ug/m3) (ug/m3) --------------- ---------- ---------- ---------- ---------- ---------- ELEVATED TERRAIN 9.452 9.452 8.507 5.671 0.9452
DISTANCE FROM SOURCE 59.00 meters directed toward 210 degrees RECEPTOR HEIGHT 0.01 meters
IMPACT AT THE AMBIENT BOUNDARY 6.871 6.871 6.184 4.122 0.6871
DISTANCE FROM SOURCE 31.00 meters directed toward 300 degrees RECEPTOR HEIGHT -0.05 meters

AERSCREEN 15181 / AERMOD 15181 02/09/16 16:05:02
TITLE: PEND EGN 1 LB/HR NAAQS
----------------------------------------------------------------------------- ***************************** STACK PARAMETERS **************************** -----------------------------------------------------------------------------
SOURCE EMISSION RATE: 0.1260 g/s 1.000 lb/hr STACK HEIGHT: 5.68 meters 18.64 feet STACK INNER DIAMETER: 0.356 meters 14.00 inches PLUME EXIT TEMPERATURE: 762.0 K 911.9 Deg F PLUME EXIT VELOCITY: 19.113 m/s 62.71 ft/s STACK AIR FLOW RATE: 4022 ACFM STACK BASE LONGITUDE: -78.8109 deg 678198. Easting STACK BASE LATITUDE: 43.0819 deg 4772237. Northing STACK BASE UTM ZONE: 17 REFERENCE DATUM (NADA): 4 STACK BASE ELEVATION: 176.00 meters 577.43 feet RURAL OR URBAN: RURAL
DIGITAL ELEVATION MAP(S) C:\Users\STAFF~1.DAY\DOCUME~1\AIRMOD~1\AERSCR~1\NFDD98~1\NED_08~1\NED_08951897.tif
INITIAL PROBE DISTANCE = 3000. meters 9843. feet
----------------------------------------------------------------------------- *********************** BUILDING DOWNWASH PARAMETERS ********************** -----------------------------------------------------------------------------
USER DEFINED BPIPPRM INPUT FILE: C:\USERS\STAFF.DAYOFFICE\DESKTOP\PENDSITED\D_EGN.TXT
MAXIMUM BUILDING HEIGHT: 16.0 meters 52.4 feet
MAXIMUM BUILDING LENGTH: 27.9 meters 91.5 feet
MINIMUM BUILDING WIDTH: 3.9 meters 12.7 feet
----------------------------------------------------------------------------- ************************** FLOW SECTOR ANALYSIS *************************** 25 meter receptor spacing: 24. meters - 3000. meters -----------------------------------------------------------------------------
MAXIMUM IMPACT RECEPTOR FLOW BUILD BUILD 1-HR CONC DIST HEIGHT TEMPORAL SECTOR WIDTH LENGTH XBADJ YBADJ (ug/m3) (m) (m) PERIOD ---------------------------------------------------------------------------------- 10 12.72 13.87 -6.63 0.34 82.59 23.5 0.06 SPR 20 14.11 12.39 -5.95 0.39 80.51 23.5 0.07 SUM 30 15.07 10.54 -5.10 0.42 77.99 25.0 0.09 SPR 40 15.58 8.37 -4.09 0.45 77.52 25.0 0.11 SPR 50 15.61 5.94 -2.96 0.46 68.19 50.0 0.08 WIN 60 15.30 3.87 -2.00 0.45 72.78 50.0 0.09 WIN 70 15.65 6.45 -3.36 0.43 67.21 50.0 0.11 WIN 80 15.52 8.83 -4.63 0.40 75.67 25.0 0.13 SPR 90 14.92 10.94 -5.75 0.36 75.52 25.0 0.13 SPR 100 13.87 12.72 -6.70 0.31 74.86 25.0 0.14 SPR

110 12.39 14.11 -7.44 0.24 79.50 23.5 0.14 SUM 120 10.54 15.07 -7.96 0.17 81.37 23.5 0.15 SUM 130 27.63 25.26 -52.18 17.27 34.96 50.0 0.20 WIN 140 25.39 22.22 -86.07 15.13 34.64 75.0 0.24 WIN 150 23.04 19.30 -86.10 1.88 43.58 75.0 0.16 WIN 160 25.90 22.89 -87.06 -11.43 41.93 75.0 0.15 WIN 170 27.97 25.79 -54.29 -12.20 47.87 50.0 0.07 SPR 180 29.20 27.90 -52.60 -19.20 37.05 50.0 0.06 SPR 190 12.72 13.87 -7.24 -0.34 78.61 23.5 0.10 SPR 200 14.11 12.39 -6.44 -0.39 75.82 25.0 0.10 SPR 210 15.07 10.54 -5.44 -0.42 76.84 25.0 0.09 SPR 220 15.58 8.37 -4.28 -0.45 76.87 25.0 0.09 WIN 230 15.61 5.94 -2.99 -0.46 66.14 50.0 0.05 WIN 240 15.30 3.87 -1.87 -0.45 64.80 25.0 0.08 WIN 250 15.65 6.45 -3.08 -0.43 64.08 25.0 0.07 WIN 260 15.52 8.83 -4.20 -0.40 79.17 25.0 0.06 WIN 270 14.92 10.94 -5.19 -0.36 79.62 25.0 0.05 WIN 280 13.87 12.72 -6.02 -0.31 80.72 23.5 0.05 SPR 290 12.39 14.11 -6.67 -0.24 85.01 23.5 0.04 WIN 300* 10.54 15.07 -7.11 -0.17 87.55 23.5 0.04 WIN 310 27.63 25.26 26.92 -17.27 73.33 75.0 -0.05 SPR 320 25.39 22.22 30.84 -10.14 59.87 75.0 -0.05 WIN 330 3.87 15.30 -7.20 0.06 83.69 23.5 0.02 WIN 340 25.90 22.89 31.44 4.82 66.22 75.0 -0.05 WIN 350 27.97 25.79 28.50 12.20 52.38 75.0 -0.05 WIN 360 29.20 27.90 24.70 19.20 75.73 75.0 -0.05 SPR * = worst case flow sector
----------------------------------------------------------------------------- ********************** MAKEMET METEOROLOGY PARAMETERS ********************* -----------------------------------------------------------------------------
MIN/MAX TEMPERATURE: 255.0 / 311.0 (K)
MINIMUM WIND SPEED: 0.5 m/s
ANEMOMETER HEIGHT: 10.000 meters
SURFACE CHARACTERISTICS INPUT: C:\Users\staff.DAYOFFICE\Documents\Air Modeling - local copy\AERSCREEN\NFGSC - Pendleton\Land Use Data\Pend_SiteC_AERSURFACE.out
DOMINANT SECTOR: 5 (120 150) DOMINANT SEASON: Winter
ALBEDO: 0.55 BOWEN RATIO: 0.50 ROUGHNESS LENGTH: 0.110 (meters)
METEOROLOGY CONDITIONS USED TO PREDICT OVERALL MAXIMUM IMPACT -------------------------------------------------------------
YR MO DY JDY HR -- -- -- --- -- 10 05 31 31 01
H0 U* W* DT/DZ ZICNV ZIMCH M-O LEN Z0 BOWEN ALBEDO REF WS - - - - - - - - - - - - - - - - - - - - - - - - - - - - - - - - - - - - - - -33.10 0.611 -9.000 0.020 -999. 1097. 656.8 0.110 0.50 0.55 7.00
HT REF TA HT - - - - - - - - - - - 10.0 311.0 2.0
WIND SPEED AT STACK HEIGHT (non-downwash): 6.1 m/s

STACK-TIP DOWNWASH ADJUSTED STACK HEIGHT: 5.7 meters ESTIMATED FINAL PLUME RISE (non-downwash): 3.5 meters ESTIMATED FINAL PLUME HEIGHT (non-downwash): 9.2 meters
METEOROLOGY CONDITIONS USED TO PREDICT AMBIENT BOUNDARY IMPACT --------------------------------------------------------------
YR MO DY JDY HR -- -- -- --- -- 10 05 31 31 01
H0 U* W* DT/DZ ZICNV ZIMCH M-O LEN Z0 BOWEN ALBEDO REF WS - - - - - - - - - - - - - - - - - - - - - - - - - - - - - - - - - - - - - - -33.10 0.611 -9.000 0.020 -999. 1097. 656.8 0.110 0.50 0.55 7.00
HT REF TA HT - - - - - - - - - - - 10.0 311.0 2.0
WIND SPEED AT STACK HEIGHT (non-downwash): 6.1 m/s STACK-TIP DOWNWASH ADJUSTED STACK HEIGHT: 5.7 meters ESTIMATED FINAL PLUME RISE (non-downwash): 3.5 meters ESTIMATED FINAL PLUME HEIGHT (non-downwash): 9.2 meters
----------------------------------------------------------------------------- ************************ AERSCREEN AUTOMATED DISTANCES ********************** OVERALL MAXIMUM CONCENTRATIONS BY DISTANCE -----------------------------------------------------------------------------
MAXIMUM RECEPTOR MAXIMUM RECEPTOR DIST 1-HR CONC HEIGHT DIST 1-HR CONC HEIGHT (m) (ug/m3) (m) (m) (ug/m3) (m) ---------------------------- ----------------------------- 23.50 87.55 0.04 1525.00 15.68 0.63 25.00 86.41 0.03 1550.00 15.35 0.65 50.00 72.78 0.09 1575.00 15.01 0.74 75.00 75.73 -0.05 1600.00 14.68 0.82 100.00 48.15 0.07 1625.00 14.36 1.27 125.00 43.08 -0.05 1650.00 14.05 1.37 150.00 45.11 -0.03 1675.00 13.75 1.52 175.00 48.64 -0.02 1700.00 13.44 1.61 200.00 50.95 0.04 1725.00 13.14 1.72 225.00 51.80 -0.05 1750.00 12.84 1.78 250.00 51.67 -0.04 1775.00 12.54 1.83 275.00 50.87 0.04 1800.00 12.24 1.91 300.00 49.59 0.05 1825.00 11.95 2.00 325.00 48.09 0.05 1850.00 11.66 2.07 350.00 46.15 0.05 1875.00 11.37 2.12 375.00 44.16 0.13 1900.00 11.08 2.17 400.00 42.36 0.15 1925.00 10.80 2.25 425.00 40.72 0.14 1950.00 10.52 2.28 450.00 39.23 0.18 1975.00 10.24 2.33 475.00 37.86 0.25 2000.00 9.967 2.40 500.00 36.60 0.23 2025.00 9.696 2.45 525.00 35.44 0.22 2050.00 9.428 2.46 550.00 34.36 0.24 2075.00 9.164 2.54 575.00 33.36 0.29 2100.00 8.904 2.55 600.00 32.42 0.35 2125.00 8.647 2.60 625.00 31.55 0.36 2150.00 8.393 2.65 650.00 30.72 0.37 2175.00 8.144 2.65 675.00 29.95 0.37 2200.00 7.899 2.74 700.00 29.23 0.42 2225.00 7.658 2.82 725.00 28.54 0.43 2250.00 7.421 2.85

750.00 27.89 0.49 2275.00 7.188 2.88 775.00 27.28 0.56 2300.00 6.959 2.95 800.00 26.70 0.80 2325.00 6.735 2.94 825.00 26.14 1.76 2350.00 6.515 3.02 850.00 25.61 2.39 2375.00 6.299 3.06 875.00 25.11 2.61 2400.00 6.088 3.10 900.00 24.63 2.61 2425.00 5.881 3.16 925.00 24.17 2.66 2450.00 5.679 3.21 950.00 23.73 2.53 2475.00 5.481 3.24 975.00 23.32 2.34 2500.00 5.288 3.25 1000.00 22.92 2.18 2525.00 5.099 3.26 1025.00 22.53 2.05 2550.00 4.915 3.29 1050.00 22.16 1.87 2575.00 4.735 3.35 1075.00 21.81 1.71 2600.00 4.560 3.36 1100.00 21.46 1.57 2625.00 4.389 3.40 1125.00 21.12 1.40 2650.00 4.223 3.44 1150.00 20.78 1.24 2675.00 4.061 3.45 1175.00 20.44 1.11 2700.00 3.903 3.45 1200.00 20.09 0.99 2725.00 3.754 2.83 1225.00 19.75 0.86 2750.00 3.620 2.79 1250.00 19.41 0.78 2775.00 3.489 2.80 1275.00 19.07 0.68 2800.00 3.362 2.82 1300.00 18.73 0.60 2825.00 3.238 2.88 1325.00 18.39 0.55 2850.00 3.117 2.94 1350.00 18.05 0.56 2875.00 3.000 2.97 1375.00 17.68 -0.07 2900.00 2.885 3.01 1400.00 17.31 -0.14 2925.00 2.774 3.08 1425.00 17.03 0.42 2950.00 2.667 3.17 1450.00 16.69 0.45 2975.00 2.562 3.23 1475.00 16.35 0.47 3000.00 2.460 3.30 1500.00 16.02 0.56
----------------------------------------------------------------------------- ********************** AERSCREEN MAXIMUM IMPACT SUMMARY ********************* -----------------------------------------------------------------------------
MAXIMUM SCALED SCALED SCALED SCALED 1-HOUR 3-HOUR 8-HOUR 24-HOUR ANNUAL CALCULATION CONC CONC CONC CONC CONC PROCEDURE (ug/m3) (ug/m3) (ug/m3) (ug/m3) (ug/m3) --------------- ---------- ---------- ---------- ---------- ---------- ELEVATED TERRAIN 87.55 87.55 78.79 52.53 8.755
DISTANCE FROM SOURCE 23.50 meters directed toward 300 degrees RECEPTOR HEIGHT 0.04 meters
IMPACT AT THE AMBIENT BOUNDARY 87.55 87.55 78.79 52.53 8.755
DISTANCE FROM SOURCE 23.50 meters directed toward 300 degrees RECEPTOR HEIGHT 0.04 meters

D_TUR1'BREEZE BPIP''p''METERS' 1.0'UTMY' 0.008'OFFICE' 1 1764 3.736848 678153.50 4772221.80 678144.71 4772236.43 678147.84 4772238.31 678156.64 4772223.68'PDC' 1 1764 3.81 678223.60 4772265.50 678208.97 4772256.71 678205.83 4772261.93 678220.46 4772270.73'EGNHOUS' 1 1764 5.221224 678199.70 4772230.00 678191.85 4772243.06 678194.94 4772244.92 678202.79 4772231.86'METER' 1 1764 5.385816 678124.60 4772358.30 678112.04 4772379.20 678125.10 4772387.05 678137.66 4772366.15'FG' 1 1764 2.795016 678185.80 4772250.90 678181.72 4772257.69 678187.73 4772261.30 678191.81 4772254.51'COMP2' 1 1764 15.98371 678175.60 4772302.00 678156.14 4772290.30 678146.40 4772306.50 678165.87 4772318.20'COMP1' 1 1764 15.98371 678193.00 4772273.50 678173.54 4772261.80 678163.80 4772278.00 678183.27 4772289.70'AUX' 1 1764 2.5908 678218.30 4772280.30 678216.21 4772279.05 678213.08 4772284.29 678215.18 4772285.541 'TUR1' 176 16.85 678203.5 4772284.3
Page 1
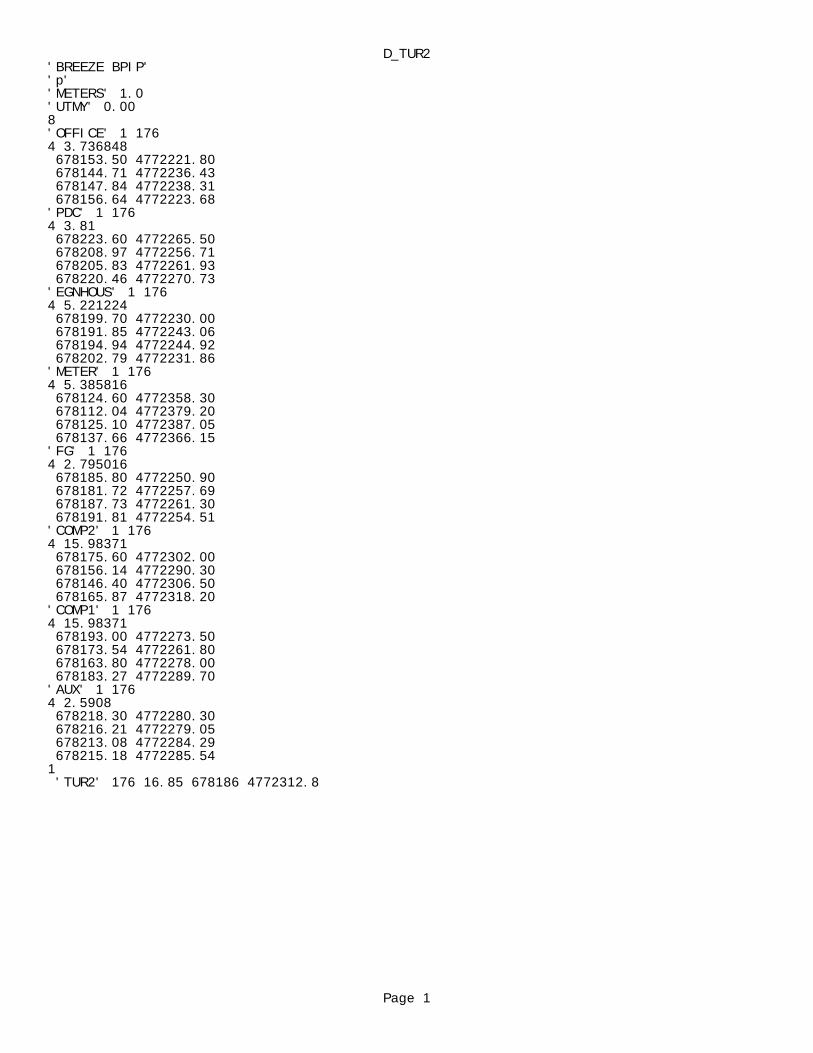
D_TUR2'BREEZE BPIP''p''METERS' 1.0'UTMY' 0.008'OFFICE' 1 1764 3.736848 678153.50 4772221.80 678144.71 4772236.43 678147.84 4772238.31 678156.64 4772223.68'PDC' 1 1764 3.81 678223.60 4772265.50 678208.97 4772256.71 678205.83 4772261.93 678220.46 4772270.73'EGNHOUS' 1 1764 5.221224 678199.70 4772230.00 678191.85 4772243.06 678194.94 4772244.92 678202.79 4772231.86'METER' 1 1764 5.385816 678124.60 4772358.30 678112.04 4772379.20 678125.10 4772387.05 678137.66 4772366.15'FG' 1 1764 2.795016 678185.80 4772250.90 678181.72 4772257.69 678187.73 4772261.30 678191.81 4772254.51'COMP2' 1 1764 15.98371 678175.60 4772302.00 678156.14 4772290.30 678146.40 4772306.50 678165.87 4772318.20'COMP1' 1 1764 15.98371 678193.00 4772273.50 678173.54 4772261.80 678163.80 4772278.00 678183.27 4772289.70'AUX' 1 1764 2.5908 678218.30 4772280.30 678216.21 4772279.05 678213.08 4772284.29 678215.18 4772285.541 'TUR2' 176 16.85 678186 4772312.8
Page 1

D_EGN'BREEZE BPIP''p''METERS' 1.0'UTMY' 0.008'OFFICE' 1 1764 3.736848 678153.50 4772221.80 678144.71 4772236.43 678147.84 4772238.31 678156.64 4772223.68'PDC' 1 1764 3.81 678223.60 4772265.50 678208.97 4772256.71 678205.83 4772261.93 678220.46 4772270.73'EGNHOUS' 1 1764 5.221224 678199.70 4772230.00 678191.85 4772243.06 678194.94 4772244.92 678202.79 4772231.86'METER' 1 1764 5.385816 678124.60 4772358.30 678112.04 4772379.20 678125.10 4772387.05 678137.66 4772366.15'FG' 1 1764 2.795016 678185.80 4772250.90 678181.72 4772257.69 678187.73 4772261.30 678191.81 4772254.51'COMP2' 1 1764 15.98371 678175.60 4772302.00 678156.14 4772290.30 678146.40 4772306.50 678165.87 4772318.20'COMP1' 1 1764 15.98371 678193.00 4772273.50 678173.54 4772261.80 678163.80 4772278.00 678183.27 4772289.70'AUX' 1 1764 2.5908 678218.30 4772280.30 678216.21 4772279.05 678213.08 4772284.29 678215.18 4772285.541 'EGN' 176 5.68 678197.6 4772237.1
Page 1
Appendix B Pendleton Compressor Station
DAR-1 Formaldehyde Modeling

Empire Pipeline, Inc. Pendleton Compressor Station Air Quality Impact Modeling Analysis Report – APPENDIX B
DAY ENVIRONMENTAL, INC. Page B-1 of B-2 NFuel.5011I-14 / ZJT0070
DAR-1 FORMALDEHYDE MODELING ANALYSIS The NYSDEC requested as part of the air permit application process that Empire evaluate whether that the formaldehyde emissions from the proposed new sources for the Pendleton Compressor Station will meet the formaldehyde short-term and annual guidance concentrations (SGC and AGC) specified in DAR-1. In response to the NYSDEC’s request, a modeling analysis was completed using AERSCREEN (version 15181) and the results of this analysis presented below. The emission point information, meteorological parameters, building downwash and terrain, and receptor spacing used in this analysis was equivalent to that presented in the above report. In accordance with DAR-1, receptors began at the facility property line to evaluate off-site impacts and were extended to a distance of 3 kilometers (km). A similar turbine load and temperature analysis was completed for formaldehyde according to the procedure outlined in Section 4.0 of the above report. Table B-1 below summarizes the model input parameters for each ambient temperature and load case as well as the modeled formaldehyde concentration predicted in AERSCREEN, respectively. As shown in Table B-1, the 0 °F/75 percent load case corresponds to the worst case modeled concentration for TUR01 and TUR02. The exhaust and emissions inputs from this case were selected for use in the final modeling analysis.
Table B-1 – Formaldehyde Load & Temperature Analysis
Ambient Temp. 0 °F 48 °F ISO 100 °F Load 100% 75% 50% 100% 75% 50% 100% 100% 75% 50% Modeled HCHO Emission Rate (g/sec)
0.000747 0.000741 0.000612 0.000705 0.000686 0.000569 0.000700 0.000587 0.000572 0.000480
Modeled HCHO Emission Rate (lbs/hr)
0.00593 0.00588 0.00486 0.00559 0.00544 0.00452 0.00555 0.00466 0.00454 0.00381
Exhaust Temp (K) 748.15 754.26 760.93 771.48 779.26 796.48 774.26 810.37 822.04 836.48
Exhaust Flow (ACFM)(9) 133,517 127,229 113,780 128,186 118,772 106,383 125,757 113,672 103,998 95,345
1-hr Formaldehyde Modeled Concentration (µg/m3)
TUR01 0.0622 0.0625 0.0543 0.0592 0.0590 0.0512 0.0590 0.0514 0.0516 0.0450 TUR02 0.0471 0.0477 0.0427 0.0535 0.0549 0.0475 0.0534 0.0478 0.0479 0.0423
Emission rates for each modeled source are listed in Table B-2 below. The proposed emergency generator will not operate for greater than 500 hours per year in accordance with 6 NYCRR 201-3.2(c)(6). DAR-1 does not establish a procedure for the treatment of intermittent emissions sources and therefore, emergency generator emissions were included in formaldehyde short-term modeling. To simulate the limited number of hours during which the emergency generator will operate annually in the annual formaldehyde modeling, the emergency generator maximum 1-hr formaldehyde emission rate was scaled based on 500 hours of operation to establish an annual emission rate.
9 Turbine exhaust flow adjusted from values provided by Solar Predicted Emissions Performance Sheets to account for the additional pressure drop contributed by the oxidation catalyst and additional acoustic baffling.

Empire Pipeline, Inc. Pendleton Compressor Station Air Quality Impact Modeling Analysis Report – APPENDIX B
DAY ENVIRONMENTAL, INC. Page B-2 of B-2 NFuel.5011I-14 / ZJT0070
Table B-2 – Modeled Formaldehyde Emission Rates
Emission Source Emission Rate
Formaldehyde 1-hr
Formaldehyde Annual
TUR1 g/sec 0.000741 0.000741
lbs/hr 0.00588 0.00588
TUR2 g/sec 0.000741 0.000741
lbs/hr 0.00588 0.00588
EGN g/sec 0.005 0.0030
lbs/hr 0.040 0.0023
Modeled formaldehyde concentrations from each emissions source were conservatively summed to establish a facility maximum concentration. AERSCREEN and supporting project files are included with this Appendix. Modeled results are presented in Table B-3.
Table B-3 – Modeled Formaldehyde Concentrations
Emission Source Modeled Concentrations µg/m3 DAR-1 Standard µg/m3
Formaldehyde 1-hr
Formaldehyde Annual SGC AGC
TUR1 0.0625 0.00625
TUR2 0.0477 0.00477
EGN 3.08 0.0176
TOTAL 3.32 0.0286 30 0.06
As shown in Table B-3 above, off-site formaldehyde emissions from the proposed Pendleton Compressor Station do not have the potential to exceed the DAR-1 formaldehyde SGC and AGC.
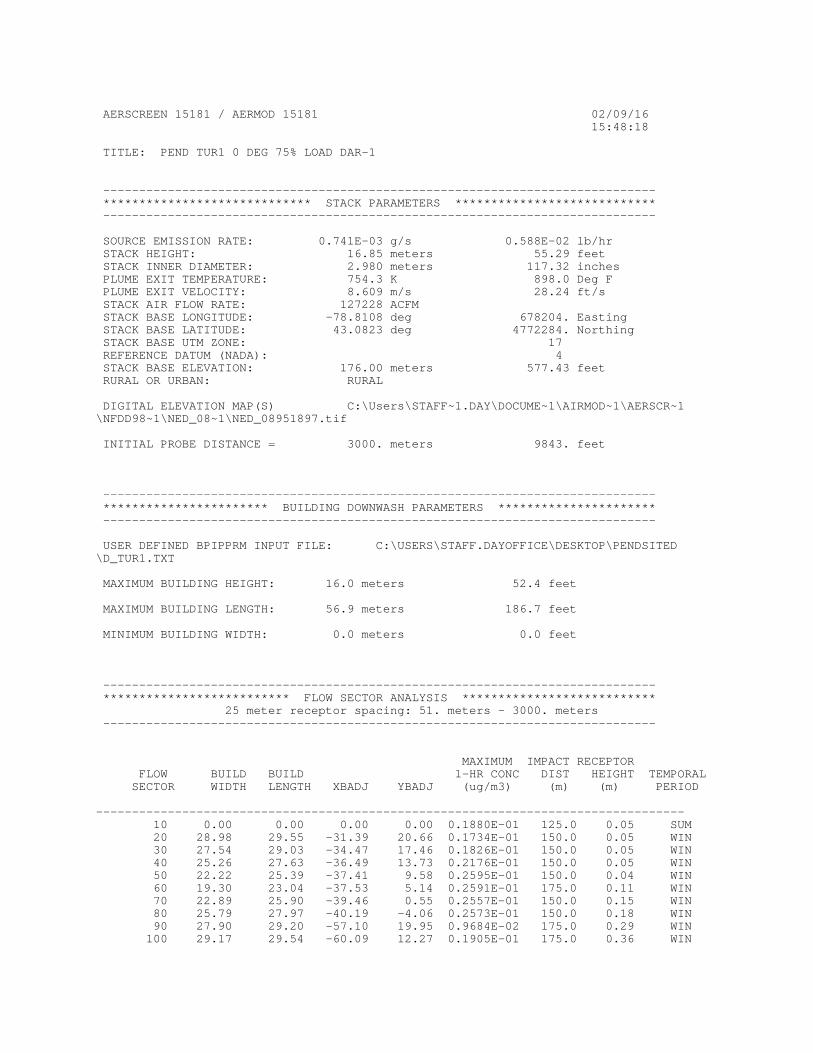
AERSCREEN 15181 / AERMOD 15181 02/09/16 15:48:18
TITLE: PEND TUR1 0 DEG 75% LOAD DAR-1
----------------------------------------------------------------------------- ***************************** STACK PARAMETERS **************************** -----------------------------------------------------------------------------
SOURCE EMISSION RATE: 0.741E-03 g/s 0.588E-02 lb/hr STACK HEIGHT: 16.85 meters 55.29 feet STACK INNER DIAMETER: 2.980 meters 117.32 inches PLUME EXIT TEMPERATURE: 754.3 K 898.0 Deg F PLUME EXIT VELOCITY: 8.609 m/s 28.24 ft/s STACK AIR FLOW RATE: 127228 ACFM STACK BASE LONGITUDE: -78.8108 deg 678204. Easting STACK BASE LATITUDE: 43.0823 deg 4772284. Northing STACK BASE UTM ZONE: 17 REFERENCE DATUM (NADA): 4 STACK BASE ELEVATION: 176.00 meters 577.43 feet RURAL OR URBAN: RURAL
DIGITAL ELEVATION MAP(S) C:\Users\STAFF~1.DAY\DOCUME~1\AIRMOD~1\AERSCR~1\NFDD98~1\NED_08~1\NED_08951897.tif
INITIAL PROBE DISTANCE = 3000. meters 9843. feet
----------------------------------------------------------------------------- *********************** BUILDING DOWNWASH PARAMETERS ********************** -----------------------------------------------------------------------------
USER DEFINED BPIPPRM INPUT FILE: C:\USERS\STAFF.DAYOFFICE\DESKTOP\PENDSITED\D_TUR1.TXT
MAXIMUM BUILDING HEIGHT: 16.0 meters 52.4 feet
MAXIMUM BUILDING LENGTH: 56.9 meters 186.7 feet
MINIMUM BUILDING WIDTH: 0.0 meters 0.0 feet
----------------------------------------------------------------------------- ************************** FLOW SECTOR ANALYSIS *************************** 25 meter receptor spacing: 51. meters - 3000. meters -----------------------------------------------------------------------------
MAXIMUM IMPACT RECEPTOR FLOW BUILD BUILD 1-HR CONC DIST HEIGHT TEMPORAL SECTOR WIDTH LENGTH XBADJ YBADJ (ug/m3) (m) (m) PERIOD ---------------------------------------------------------------------------------- 10 0.00 0.00 0.00 0.00 0.1880E-01 125.0 0.05 SUM 20 28.98 29.55 -31.39 20.66 0.1734E-01 150.0 0.05 WIN 30 27.54 29.03 -34.47 17.46 0.1826E-01 150.0 0.05 WIN 40 25.26 27.63 -36.49 13.73 0.2176E-01 150.0 0.05 WIN 50 22.22 25.39 -37.41 9.58 0.2595E-01 150.0 0.04 WIN 60 19.30 23.04 -37.53 5.14 0.2591E-01 175.0 0.11 WIN 70 22.89 25.90 -39.46 0.55 0.2557E-01 150.0 0.15 WIN 80 25.79 27.97 -40.19 -4.06 0.2573E-01 150.0 0.18 WIN 90 27.90 29.20 -57.10 19.95 0.9684E-02 175.0 0.29 WIN 100 29.17 29.54 -60.09 12.27 0.1905E-01 175.0 0.36 WIN
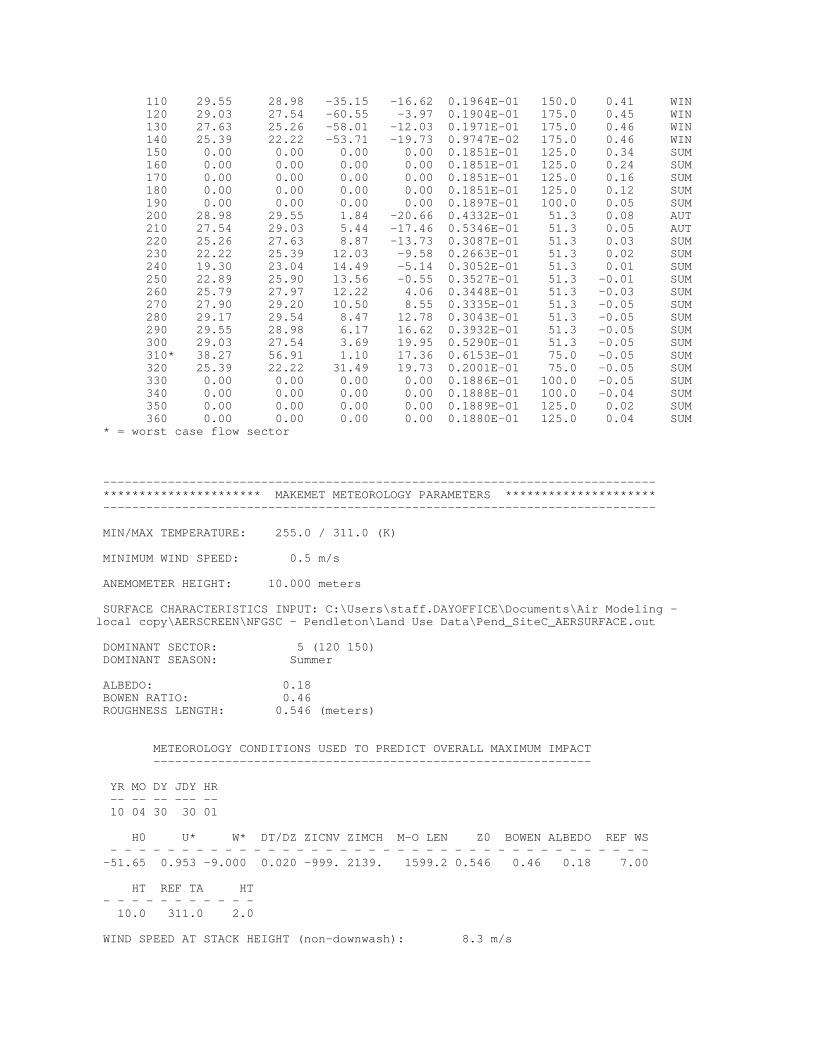
110 29.55 28.98 -35.15 -16.62 0.1964E-01 150.0 0.41 WIN 120 29.03 27.54 -60.55 -3.97 0.1904E-01 175.0 0.45 WIN 130 27.63 25.26 -58.01 -12.03 0.1971E-01 175.0 0.46 WIN 140 25.39 22.22 -53.71 -19.73 0.9747E-02 175.0 0.46 WIN 150 0.00 0.00 0.00 0.00 0.1851E-01 125.0 0.34 SUM 160 0.00 0.00 0.00 0.00 0.1851E-01 125.0 0.24 SUM 170 0.00 0.00 0.00 0.00 0.1851E-01 125.0 0.16 SUM 180 0.00 0.00 0.00 0.00 0.1851E-01 125.0 0.12 SUM 190 0.00 0.00 0.00 0.00 0.1897E-01 100.0 0.05 SUM 200 28.98 29.55 1.84 -20.66 0.4332E-01 51.3 0.08 AUT 210 27.54 29.03 5.44 -17.46 0.5346E-01 51.3 0.05 AUT 220 25.26 27.63 8.87 -13.73 0.3087E-01 51.3 0.03 SUM 230 22.22 25.39 12.03 -9.58 0.2663E-01 51.3 0.02 SUM 240 19.30 23.04 14.49 -5.14 0.3052E-01 51.3 0.01 SUM 250 22.89 25.90 13.56 -0.55 0.3527E-01 51.3 -0.01 SUM 260 25.79 27.97 12.22 4.06 0.3448E-01 51.3 -0.03 SUM 270 27.90 29.20 10.50 8.55 0.3335E-01 51.3 -0.05 SUM 280 29.17 29.54 8.47 12.78 0.3043E-01 51.3 -0.05 SUM 290 29.55 28.98 6.17 16.62 0.3932E-01 51.3 -0.05 SUM 300 29.03 27.54 3.69 19.95 0.5290E-01 51.3 -0.05 SUM 310* 38.27 56.91 1.10 17.36 0.6153E-01 75.0 -0.05 SUM 320 25.39 22.22 31.49 19.73 0.2001E-01 75.0 -0.05 SUM 330 0.00 0.00 0.00 0.00 0.1886E-01 100.0 -0.05 SUM 340 0.00 0.00 0.00 0.00 0.1888E-01 100.0 -0.04 SUM 350 0.00 0.00 0.00 0.00 0.1889E-01 125.0 0.02 SUM 360 0.00 0.00 0.00 0.00 0.1880E-01 125.0 0.04 SUM * = worst case flow sector
----------------------------------------------------------------------------- ********************** MAKEMET METEOROLOGY PARAMETERS ********************* -----------------------------------------------------------------------------
MIN/MAX TEMPERATURE: 255.0 / 311.0 (K)
MINIMUM WIND SPEED: 0.5 m/s
ANEMOMETER HEIGHT: 10.000 meters
SURFACE CHARACTERISTICS INPUT: C:\Users\staff.DAYOFFICE\Documents\Air Modeling - local copy\AERSCREEN\NFGSC - Pendleton\Land Use Data\Pend_SiteC_AERSURFACE.out
DOMINANT SECTOR: 5 (120 150) DOMINANT SEASON: Summer
ALBEDO: 0.18 BOWEN RATIO: 0.46 ROUGHNESS LENGTH: 0.546 (meters)
METEOROLOGY CONDITIONS USED TO PREDICT OVERALL MAXIMUM IMPACT -------------------------------------------------------------
YR MO DY JDY HR -- -- -- --- -- 10 04 30 30 01
H0 U* W* DT/DZ ZICNV ZIMCH M-O LEN Z0 BOWEN ALBEDO REF WS - - - - - - - - - - - - - - - - - - - - - - - - - - - - - - - - - - - - - - -51.65 0.953 -9.000 0.020 -999. 2139. 1599.2 0.546 0.46 0.18 7.00
HT REF TA HT - - - - - - - - - - - 10.0 311.0 2.0
WIND SPEED AT STACK HEIGHT (non-downwash): 8.3 m/s
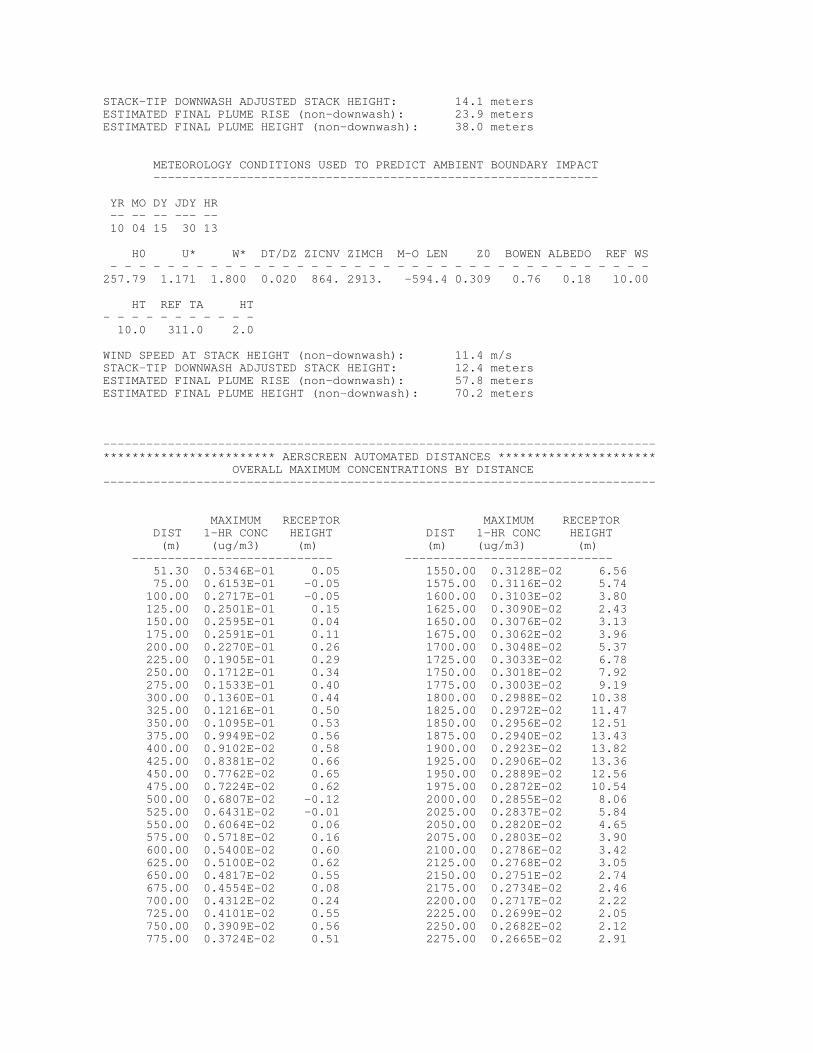
STACK-TIP DOWNWASH ADJUSTED STACK HEIGHT: 14.1 meters ESTIMATED FINAL PLUME RISE (non-downwash): 23.9 meters ESTIMATED FINAL PLUME HEIGHT (non-downwash): 38.0 meters
METEOROLOGY CONDITIONS USED TO PREDICT AMBIENT BOUNDARY IMPACT --------------------------------------------------------------
YR MO DY JDY HR -- -- -- --- -- 10 04 15 30 13
H0 U* W* DT/DZ ZICNV ZIMCH M-O LEN Z0 BOWEN ALBEDO REF WS - - - - - - - - - - - - - - - - - - - - - - - - - - - - - - - - - - - - - - 257.79 1.171 1.800 0.020 864. 2913. -594.4 0.309 0.76 0.18 10.00
HT REF TA HT - - - - - - - - - - - 10.0 311.0 2.0
WIND SPEED AT STACK HEIGHT (non-downwash): 11.4 m/s STACK-TIP DOWNWASH ADJUSTED STACK HEIGHT: 12.4 meters ESTIMATED FINAL PLUME RISE (non-downwash): 57.8 meters ESTIMATED FINAL PLUME HEIGHT (non-downwash): 70.2 meters
----------------------------------------------------------------------------- ************************ AERSCREEN AUTOMATED DISTANCES ********************** OVERALL MAXIMUM CONCENTRATIONS BY DISTANCE -----------------------------------------------------------------------------
MAXIMUM RECEPTOR MAXIMUM RECEPTOR DIST 1-HR CONC HEIGHT DIST 1-HR CONC HEIGHT (m) (ug/m3) (m) (m) (ug/m3) (m) ---------------------------- ----------------------------- 51.30 0.5346E-01 0.05 1550.00 0.3128E-02 6.56 75.00 0.6153E-01 -0.05 1575.00 0.3116E-02 5.74 100.00 0.2717E-01 -0.05 1600.00 0.3103E-02 3.80 125.00 0.2501E-01 0.15 1625.00 0.3090E-02 2.43 150.00 0.2595E-01 0.04 1650.00 0.3076E-02 3.13 175.00 0.2591E-01 0.11 1675.00 0.3062E-02 3.96 200.00 0.2270E-01 0.26 1700.00 0.3048E-02 5.37 225.00 0.1905E-01 0.29 1725.00 0.3033E-02 6.78 250.00 0.1712E-01 0.34 1750.00 0.3018E-02 7.92 275.00 0.1533E-01 0.40 1775.00 0.3003E-02 9.19 300.00 0.1360E-01 0.44 1800.00 0.2988E-02 10.38 325.00 0.1216E-01 0.50 1825.00 0.2972E-02 11.47 350.00 0.1095E-01 0.53 1850.00 0.2956E-02 12.51 375.00 0.9949E-02 0.56 1875.00 0.2940E-02 13.43 400.00 0.9102E-02 0.58 1900.00 0.2923E-02 13.82 425.00 0.8381E-02 0.66 1925.00 0.2906E-02 13.36 450.00 0.7762E-02 0.65 1950.00 0.2889E-02 12.56 475.00 0.7224E-02 0.62 1975.00 0.2872E-02 10.54 500.00 0.6807E-02 -0.12 2000.00 0.2855E-02 8.06 525.00 0.6431E-02 -0.01 2025.00 0.2837E-02 5.84 550.00 0.6064E-02 0.06 2050.00 0.2820E-02 4.65 575.00 0.5718E-02 0.16 2075.00 0.2803E-02 3.90 600.00 0.5400E-02 0.60 2100.00 0.2786E-02 3.42 625.00 0.5100E-02 0.62 2125.00 0.2768E-02 3.05 650.00 0.4817E-02 0.55 2150.00 0.2751E-02 2.74 675.00 0.4554E-02 0.08 2175.00 0.2734E-02 2.46 700.00 0.4312E-02 0.24 2200.00 0.2717E-02 2.22 725.00 0.4101E-02 0.55 2225.00 0.2699E-02 2.05 750.00 0.3909E-02 0.56 2250.00 0.2682E-02 2.12 775.00 0.3724E-02 0.51 2275.00 0.2665E-02 2.91

800.00 0.3560E-02 0.52 2300.00 0.2648E-02 3.05 825.00 0.3410E-02 0.59 2325.00 0.2631E-02 3.21 850.00 0.3268E-02 0.63 2350.00 0.2614E-02 3.35 875.00 0.3132E-02 0.64 2375.00 0.2597E-02 3.54 900.00 0.3002E-02 0.65 2400.00 0.2580E-02 3.81 925.00 0.2960E-02 0.65 2425.00 0.2563E-02 3.92 950.00 0.2997E-02 0.65 2450.00 0.2547E-02 4.16 975.00 0.3029E-02 0.65 2475.00 0.2530E-02 4.38 1000.00 0.3056E-02 0.65 2500.00 0.2513E-02 4.49 1025.00 0.3081E-02 0.84 2525.00 0.2497E-02 4.60 1050.00 0.3108E-02 1.02 2550.00 0.2480E-02 4.66 1075.00 0.3130E-02 1.07 2575.00 0.2464E-02 4.93 1100.00 0.3149E-02 1.25 2600.00 0.2447E-02 5.15 1125.00 0.3165E-02 1.99 2625.00 0.2431E-02 5.02 1150.00 0.3177E-02 2.74 2650.00 0.2415E-02 5.20 1175.00 0.3187E-02 3.31 2675.00 0.2399E-02 5.78 1200.00 0.3195E-02 4.06 2700.00 0.2384E-02 6.17 1225.00 0.3201E-02 6.45 2725.00 0.2368E-02 6.94 1250.00 0.3205E-02 8.94 2750.00 0.2353E-02 7.50 1275.00 0.3206E-02 10.21 2775.00 0.2338E-02 7.79 1300.00 0.3205E-02 9.55 2800.00 0.2323E-02 7.79 1325.00 0.3202E-02 8.01 2825.00 0.2308E-02 7.20 1350.00 0.3197E-02 6.19 2850.00 0.2294E-02 6.64 1375.00 0.3192E-02 6.21 2875.00 0.2279E-02 6.02 1400.00 0.3186E-02 8.00 2900.00 0.2265E-02 5.32 1425.00 0.3180E-02 9.46 2925.00 0.2251E-02 8.95 1450.00 0.3172E-02 10.34 2950.00 0.2237E-02 9.02 1475.00 0.3162E-02 10.66 2975.00 0.2223E-02 8.95 1500.00 0.3152E-02 9.85 3000.00 0.2210E-02 8.87 1525.00 0.3140E-02 7.68
----------------------------------------------------------------------------- ********************** AERSCREEN MAXIMUM IMPACT SUMMARY ********************* -----------------------------------------------------------------------------
MAXIMUM SCALED SCALED SCALED SCALED 1-HOUR 3-HOUR 8-HOUR 24-HOUR ANNUAL CALCULATION CONC CONC CONC CONC CONC PROCEDURE (ug/m3) (ug/m3) (ug/m3) (ug/m3) (ug/m3) --------------- ---------- ---------- ---------- ---------- ---------- ELEVATED TERRAIN 0.6250E-01 0.6250E-01 0.5625E-01 0.3750E-01 0.6250E-02
DISTANCE FROM SOURCE 84.00 meters directed toward 310 degrees RECEPTOR HEIGHT -0.05 meters
IMPACT AT THE AMBIENT BOUNDARY 0.5346E-01 0.5346E-01 0.4812E-01 0.3208E-01 0.5346E-02
DISTANCE FROM SOURCE 51.30 meters directed toward 210 degrees RECEPTOR HEIGHT 0.05 meters

AERSCREEN 15181 / AERMOD 15181 02/09/16 15:57:09
TITLE: PEND TUR2 0 DEG F 75% LOAD DAR-1
----------------------------------------------------------------------------- ***************************** STACK PARAMETERS **************************** -----------------------------------------------------------------------------
SOURCE EMISSION RATE: 0.741E-03 g/s 0.588E-02 lb/hr STACK HEIGHT: 16.85 meters 55.29 feet STACK INNER DIAMETER: 2.980 meters 117.32 inches PLUME EXIT TEMPERATURE: 754.3 K 898.0 Deg F PLUME EXIT VELOCITY: 8.609 m/s 28.24 ft/s STACK AIR FLOW RATE: 127228 ACFM STACK BASE LONGITUDE: -78.8110 deg 678186. Easting STACK BASE LATITUDE: 43.0826 deg 4772313. Northing STACK BASE UTM ZONE: 17 REFERENCE DATUM (NADA): 4 STACK BASE ELEVATION: 176.00 meters 577.43 feet RURAL OR URBAN: RURAL
DIGITAL ELEVATION MAP(S) C:\Users\STAFF~1.DAY\DOCUME~1\AIRMOD~1\AERSCR~1\NFDD98~1\NED_08~1\NED_08951897.tif
INITIAL PROBE DISTANCE = 3000. meters 9843. feet
----------------------------------------------------------------------------- *********************** BUILDING DOWNWASH PARAMETERS ********************** -----------------------------------------------------------------------------
USER DEFINED BPIPPRM INPUT FILE: C:\USERS\STAFF.DAYOFFICE\DESKTOP\PENDSITED\D_TUR2.TXT
MAXIMUM BUILDING HEIGHT: 16.0 meters 52.4 feet
MAXIMUM BUILDING LENGTH: 29.5 meters 96.9 feet
MINIMUM BUILDING WIDTH: 0.0 meters 0.0 feet
----------------------------------------------------------------------------- ************************** FLOW SECTOR ANALYSIS *************************** 25 meter receptor spacing: 68. meters - 3000. meters -----------------------------------------------------------------------------
MAXIMUM IMPACT RECEPTOR FLOW BUILD BUILD 1-HR CONC DIST HEIGHT TEMPORAL SECTOR WIDTH LENGTH XBADJ YBADJ (ug/m3) (m) (m) PERIOD ---------------------------------------------------------------------------------- 10 29.54 29.17 -52.39 1.05 0.2324E-01 175.0 0.05 WIN 20 28.98 29.55 -31.36 20.57 0.1747E-01 150.0 0.05 WIN 30 27.54 29.03 -34.42 17.38 0.1835E-01 150.0 0.05 WIN 40 25.26 27.63 -36.43 13.66 0.2215E-01 150.0 0.05 WIN 50 22.22 25.39 -37.34 9.52 0.2597E-01 150.0 0.05 WIN 60 19.30 23.04 -37.44 5.09 0.2595E-01 175.0 0.05 WIN 70 22.89 25.90 -39.37 0.51 0.2559E-01 150.0 0.10 WIN 80 25.79 27.97 -40.09 -4.08 0.2574E-01 150.0 0.14 WIN 90 27.90 29.20 -39.60 -8.55 0.2554E-01 150.0 0.15 WIN 100 29.17 29.54 -37.90 -12.76 0.2517E-01 125.0 0.13 SPR

110 29.55 28.98 -35.06 -16.58 0.1974E-01 150.0 0.20 WIN 120 29.03 27.54 -31.14 -19.90 0.1815E-01 150.0 0.30 WIN 130 0.00 0.00 0.00 0.00 0.1879E-01 125.0 0.29 SUM 140 0.00 0.00 0.00 0.00 0.1879E-01 125.0 0.29 SUM 150 0.00 0.00 0.00 0.00 0.1851E-01 125.0 0.24 SUM 160 25.90 22.89 20.77 -19.81 0.1365E-01 68.0 0.11 SUM 170 27.97 25.79 22.27 -13.92 0.2389E-01 75.0 0.10 SUM 180 29.20 27.90 23.10 -7.60 0.2597E-01 68.0 0.06 SUM 190 29.54 29.17 23.22 -1.05 0.2916E-01 68.0 0.04 SUM 200 28.98 29.55 22.64 5.53 0.2975E-01 68.0 0.03 SUM 210 27.54 29.03 5.39 -17.38 0.2626E-01 68.0 0.02 SUM 220* 25.26 27.63 19.45 17.99 0.4712E-01 68.0 0.00 AUT 230 22.22 25.39 11.95 -9.52 0.1930E-01 125.0 -0.03 WIN 240 19.30 23.04 14.41 -5.09 0.1704E-01 100.0 -0.05 WIN 250 22.89 25.90 13.47 -0.51 0.2197E-01 68.0 -0.05 SUM 260 25.79 27.97 12.12 4.08 0.3076E-01 68.0 -0.05 SUM 270 27.90 29.20 10.40 8.55 0.3242E-01 68.0 -0.05 SUM 280 29.17 29.54 8.37 12.76 0.2944E-01 68.0 -0.05 SUM 290 29.55 28.98 6.08 16.58 0.2771E-01 68.0 -0.05 SUM 300 29.03 27.54 3.61 19.90 0.2537E-01 68.0 -0.05 SPR 310 0.00 0.00 0.00 0.00 0.2374E-01 68.0 -0.05 SUM 320 0.00 0.00 0.00 0.00 0.2374E-01 68.0 -0.05 SUM 330 0.00 0.00 0.00 0.00 0.1885E-01 100.0 -0.06 SUM 340 25.90 22.89 -43.66 19.81 0.1206E-01 175.0 -0.04 WIN 350 27.97 25.79 -48.06 13.92 0.2403E-01 175.0 0.05 WIN 360 29.20 27.90 -51.00 7.60 0.2392E-01 175.0 0.05 WIN * = worst case flow sector
----------------------------------------------------------------------------- ********************** MAKEMET METEOROLOGY PARAMETERS ********************* -----------------------------------------------------------------------------
MIN/MAX TEMPERATURE: 255.0 / 311.0 (K)
MINIMUM WIND SPEED: 0.5 m/s
ANEMOMETER HEIGHT: 10.000 meters
SURFACE CHARACTERISTICS INPUT: C:\Users\staff.DAYOFFICE\Documents\Air Modeling - local copy\AERSCREEN\NFGSC - Pendleton\Land Use Data\Pend_SiteC_AERSURFACE.out
DOMINANT SECTOR: 2 ( 30 60) DOMINANT SEASON: Autumn
ALBEDO: 0.18 BOWEN RATIO: 0.76 ROUGHNESS LENGTH: 0.309 (meters)
METEOROLOGY CONDITIONS USED TO PREDICT OVERALL MAXIMUM IMPACT -------------------------------------------------------------
YR MO DY JDY HR -- -- -- --- -- 10 04 15 15 13
H0 U* W* DT/DZ ZICNV ZIMCH M-O LEN Z0 BOWEN ALBEDO REF WS - - - - - - - - - - - - - - - - - - - - - - - - - - - - - - - - - - - - - - 257.79 1.171 1.800 0.020 864. 2913. -594.4 0.309 0.76 0.18 10.00
HT REF TA HT - - - - - - - - - - - 10.0 311.0 2.0
WIND SPEED AT STACK HEIGHT (non-downwash): 11.4 m/s
STACK-TIP DOWNWASH ADJUSTED STACK HEIGHT: 12.4 meters ESTIMATED FINAL PLUME RISE (non-downwash): 57.8 meters ESTIMATED FINAL PLUME HEIGHT (non-downwash): 70.2 meters
METEOROLOGY CONDITIONS USED TO PREDICT AMBIENT BOUNDARY IMPACT --------------------------------------------------------------
YR MO DY JDY HR -- -- -- --- -- 10 04 15 15 13
H0 U* W* DT/DZ ZICNV ZIMCH M-O LEN Z0 BOWEN ALBEDO REF WS - - - - - - - - - - - - - - - - - - - - - - - - - - - - - - - - - - - - - - 257.79 1.171 1.800 0.020 864. 2913. -594.4 0.309 0.76 0.18 10.00
HT REF TA HT - - - - - - - - - - - 10.0 311.0 2.0
WIND SPEED AT STACK HEIGHT (non-downwash): 11.4 m/s STACK-TIP DOWNWASH ADJUSTED STACK HEIGHT: 12.4 meters ESTIMATED FINAL PLUME RISE (non-downwash): 57.8 meters ESTIMATED FINAL PLUME HEIGHT (non-downwash): 70.2 meters
----------------------------------------------------------------------------- ************************ AERSCREEN AUTOMATED DISTANCES ********************** OVERALL MAXIMUM CONCENTRATIONS BY DISTANCE -----------------------------------------------------------------------------
MAXIMUM RECEPTOR MAXIMUM RECEPTOR DIST 1-HR CONC HEIGHT DIST 1-HR CONC HEIGHT (m) (ug/m3) (m) (m) (ug/m3) (m) ---------------------------- ----------------------------- 68.00 0.4712E-01 0.00 1550.00 0.3129E-02 9.76 75.00 0.3436E-01 0.00 1575.00 0.3117E-02 8.57 100.00 0.2462E-01 0.04 1600.00 0.3104E-02 7.47 125.00 0.2517E-01 0.13 1625.00 0.3090E-02 5.33 150.00 0.2597E-01 0.05 1650.00 0.3076E-02 3.38 175.00 0.2595E-01 0.05 1675.00 0.3062E-02 2.38 200.00 0.2412E-01 0.27 1700.00 0.3048E-02 2.75 225.00 0.1977E-01 0.35 1725.00 0.3033E-02 3.44 250.00 0.1773E-01 0.41 1750.00 0.3018E-02 4.39 275.00 0.1595E-01 0.44 1775.00 0.3003E-02 5.55 300.00 0.1427E-01 0.54 1800.00 0.2987E-02 6.70 325.00 0.1275E-01 0.57 1825.00 0.2971E-02 7.98 350.00 0.1148E-01 0.64 1850.00 0.2955E-02 9.33 375.00 0.1040E-01 0.60 1875.00 0.2939E-02 10.65 400.00 0.9486E-02 0.51 1900.00 0.2923E-02 12.11 425.00 0.8704E-02 0.59 1925.00 0.2906E-02 13.21 450.00 0.8031E-02 0.51 1950.00 0.2889E-02 13.73 475.00 0.7445E-02 0.41 1975.00 0.2872E-02 13.73 500.00 0.6933E-02 0.33 2000.00 0.2855E-02 12.81 525.00 0.6480E-02 0.29 2025.00 0.2838E-02 10.35 550.00 0.6076E-02 0.26 2050.00 0.2820E-02 7.76 575.00 0.5714E-02 0.18 2075.00 0.2803E-02 5.96 600.00 0.5388E-02 0.42 2100.00 0.2786E-02 4.95 625.00 0.5095E-02 0.64 2125.00 0.2768E-02 4.41 650.00 0.4821E-02 0.65 2150.00 0.2751E-02 3.87 675.00 0.4567E-02 0.35 2175.00 0.2734E-02 3.34 700.00 0.4330E-02 0.43 2200.00 0.2717E-02 2.96 725.00 0.4114E-02 0.29 2225.00 0.2699E-02 2.90 750.00 0.3913E-02 0.36 2250.00 0.2682E-02 2.96 775.00 0.3726E-02 0.47 2275.00 0.2665E-02 3.02

800.00 0.3560E-02 0.60 2300.00 0.2648E-02 2.88 825.00 0.3408E-02 0.52 2325.00 0.2631E-02 2.75 850.00 0.3265E-02 0.55 2350.00 0.2614E-02 2.90 875.00 0.3129E-02 0.57 2375.00 0.2597E-02 3.05 900.00 0.2999E-02 0.57 2400.00 0.2580E-02 2.84 925.00 0.2960E-02 0.62 2425.00 0.2563E-02 3.00 950.00 0.2997E-02 0.63 2450.00 0.2547E-02 3.39 975.00 0.3029E-02 0.65 2475.00 0.2530E-02 3.28 1000.00 0.3056E-02 0.65 2500.00 0.2513E-02 3.42 1025.00 0.3081E-02 0.71 2525.00 0.2497E-02 3.50 1050.00 0.3108E-02 0.90 2550.00 0.2480E-02 3.56 1075.00 0.3130E-02 1.01 2575.00 0.2464E-02 3.87 1100.00 0.3149E-02 1.10 2600.00 0.2447E-02 3.67 1125.00 0.3164E-02 1.24 2625.00 0.2431E-02 4.01 1150.00 0.3177E-02 1.98 2650.00 0.2415E-02 4.29 1175.00 0.3187E-02 2.96 2675.00 0.2399E-02 4.60 1200.00 0.3194E-02 3.67 2700.00 0.2383E-02 4.88 1225.00 0.3199E-02 3.78 2725.00 0.2368E-02 5.11 1250.00 0.3203E-02 5.65 2750.00 0.2353E-02 5.88 1275.00 0.3205E-02 8.19 2775.00 0.2338E-02 6.48 1300.00 0.3205E-02 10.07 2800.00 0.2323E-02 6.67 1325.00 0.3203E-02 10.46 2825.00 0.2308E-02 6.88 1350.00 0.3199E-02 9.46 2850.00 0.2294E-02 7.02 1375.00 0.3193E-02 7.76 2875.00 0.2279E-02 7.01 1400.00 0.3186E-02 6.13 2900.00 0.2265E-02 6.78 1425.00 0.3178E-02 6.45 2925.00 0.2251E-02 6.22 1450.00 0.3171E-02 8.09 2950.00 0.2237E-02 8.33 1475.00 0.3162E-02 9.37 2975.00 0.2223E-02 8.22 1500.00 0.3152E-02 10.48 3000.00 0.2210E-02 8.09 1525.00 0.3141E-02 10.87
----------------------------------------------------------------------------- ********************** AERSCREEN MAXIMUM IMPACT SUMMARY ********************* -----------------------------------------------------------------------------
MAXIMUM SCALED SCALED SCALED SCALED 1-HOUR 3-HOUR 8-HOUR 24-HOUR ANNUAL CALCULATION CONC CONC CONC CONC CONC PROCEDURE (ug/m3) (ug/m3) (ug/m3) (ug/m3) (ug/m3) --------------- ---------- ---------- ---------- ---------- ---------- ELEVATED TERRAIN 0.4771E-01 0.4771E-01 0.4294E-01 0.2863E-01 0.4771E-02
DISTANCE FROM SOURCE 70.00 meters directed toward 220 degrees RECEPTOR HEIGHT 0.00 meters
IMPACT AT THE AMBIENT BOUNDARY 0.4712E-01 0.4712E-01 0.4241E-01 0.2827E-01 0.4712E-02
DISTANCE FROM SOURCE 68.00 meters directed toward 220 degrees RECEPTOR HEIGHT 0.00 meters
AERSCREEN 15181 / AERMOD 15181 02/09/16 16:08:18
TITLE: PEND EGN 1 LB/HR DAR-1
----------------------------------------------------------------------------- ***************************** STACK PARAMETERS **************************** -----------------------------------------------------------------------------
SOURCE EMISSION RATE: 0.1260 g/s 1.000 lb/hr STACK HEIGHT: 5.68 meters 18.64 feet STACK INNER DIAMETER: 0.356 meters 14.00 inches PLUME EXIT TEMPERATURE: 762.0 K 911.9 Deg F PLUME EXIT VELOCITY: 19.113 m/s 62.71 ft/s STACK AIR FLOW RATE: 4022 ACFM STACK BASE LONGITUDE: -78.8109 deg 678198. Easting STACK BASE LATITUDE: 43.0819 deg 4772237. Northing STACK BASE UTM ZONE: 17 REFERENCE DATUM (NADA): 4 STACK BASE ELEVATION: 176.00 meters 577.43 feet RURAL OR URBAN: RURAL
DIGITAL ELEVATION MAP(S) C:\Users\STAFF~1.DAY\DOCUME~1\AIRMOD~1\AERSCR~1\NFDD98~1\NED_08~1\NED_08951897.tif
INITIAL PROBE DISTANCE = 3000. meters 9843. feet
----------------------------------------------------------------------------- *********************** BUILDING DOWNWASH PARAMETERS ********************** -----------------------------------------------------------------------------
USER DEFINED BPIPPRM INPUT FILE: C:\USERS\STAFF.DAYOFFICE\DESKTOP\PENDSITED\D_EGN.TXT
MAXIMUM BUILDING HEIGHT: 16.0 meters 52.4 feet
MAXIMUM BUILDING LENGTH: 27.9 meters 91.5 feet
MINIMUM BUILDING WIDTH: 3.9 meters 12.7 feet
----------------------------------------------------------------------------- ************************** FLOW SECTOR ANALYSIS *************************** 25 meter receptor spacing: 58. meters - 3000. meters -----------------------------------------------------------------------------
MAXIMUM IMPACT RECEPTOR FLOW BUILD BUILD 1-HR CONC DIST HEIGHT TEMPORAL SECTOR WIDTH LENGTH XBADJ YBADJ (ug/m3) (m) (m) PERIOD ---------------------------------------------------------------------------------- 10 12.72 13.87 -6.63 0.34 61.52 57.5 -0.03 WIN 20 14.11 12.39 -5.95 0.39 62.45 57.5 -0.01 WIN 30 15.07 10.54 -5.10 0.42 65.13 57.5 0.03 WIN 40 15.58 8.37 -4.09 0.45 67.29 57.5 0.06 WIN 50 15.61 5.94 -2.96 0.46 64.68 57.5 0.07 WIN 60 15.30 3.87 -2.00 0.45 67.68 57.5 0.08 WIN 70 15.65 6.45 -3.36 0.43 63.82 57.5 0.10 WIN 80 15.52 8.83 -4.63 0.40 66.50 57.5 0.15 WIN 90 14.92 10.94 -5.75 0.36 63.28 57.5 0.20 WIN 100 13.87 12.72 -6.70 0.31 62.37 57.5 0.24 WIN

110 12.39 14.11 -7.44 0.24 61.57 57.5 0.24 WIN 120 10.54 15.07 -7.96 0.17 61.90 57.5 0.23 WIN 130 27.63 25.26 -52.18 17.27 35.26 57.5 0.23 WIN 140 25.39 22.22 -86.07 15.13 34.64 75.0 0.24 WIN 150 23.04 19.30 -86.10 1.88 43.58 75.0 0.16 WIN 160 25.90 22.89 -87.06 -11.43 41.93 75.0 0.15 WIN 170 27.97 25.79 -54.29 -12.20 47.38 225.0 0.14 SPR 180 29.20 27.90 -52.60 -19.20 36.70 57.5 0.07 SPR 190 12.72 13.87 -7.24 -0.34 61.32 57.5 0.05 WIN 200 14.11 12.39 -6.44 -0.39 62.46 57.5 0.05 WIN 210 15.07 10.54 -5.44 -0.42 61.04 57.5 0.05 WIN 220 15.58 8.37 -4.28 -0.45 64.50 57.5 0.05 WIN 230 15.61 5.94 -2.99 -0.46 60.98 57.5 0.05 WIN 240 15.30 3.87 -1.87 -0.45 53.11 57.5 0.05 WIN 250 15.65 6.45 -3.08 -0.43 49.36 57.5 0.05 WIN 260 15.52 8.83 -4.20 -0.40 52.78 57.5 0.05 WIN 270 14.92 10.94 -5.19 -0.36 57.66 57.5 0.03 WIN 280 13.87 12.72 -6.02 -0.31 56.35 57.5 0.02 WIN 290 12.39 14.11 -6.67 -0.24 57.04 57.5 0.02 WIN 300 10.54 15.07 -7.11 -0.17 53.41 57.5 0.00 WIN 310 27.63 25.26 26.92 -17.27 73.33 75.0 -0.05 SPR 320 25.39 22.22 30.84 -10.14 59.87 57.5 -0.04 WIN 330 3.87 15.30 -7.20 0.06 55.28 57.5 -0.05 WIN 340 25.90 22.89 31.44 4.82 66.22 57.5 -0.05 WIN 350 27.97 25.79 28.50 12.20 52.38 57.5 -0.05 WIN 360* 29.20 27.90 24.70 19.20 75.73 75.0 -0.05 SPR * = worst case flow sector
----------------------------------------------------------------------------- ********************** MAKEMET METEOROLOGY PARAMETERS ********************* -----------------------------------------------------------------------------
MIN/MAX TEMPERATURE: 255.0 / 311.0 (K)
MINIMUM WIND SPEED: 0.5 m/s
ANEMOMETER HEIGHT: 10.000 meters
SURFACE CHARACTERISTICS INPUT: C:\Users\staff.DAYOFFICE\Documents\Air Modeling - local copy\AERSCREEN\NFGSC - Pendleton\Land Use Data\Pend_SiteC_AERSURFACE.out
DOMINANT SECTOR: 7 (180 210) DOMINANT SEASON: Spring
ALBEDO: 0.15 BOWEN RATIO: 0.39 ROUGHNESS LENGTH: 0.042 (meters)
METEOROLOGY CONDITIONS USED TO PREDICT OVERALL MAXIMUM IMPACT -------------------------------------------------------------
YR MO DY JDY HR -- -- -- --- -- 10 08 16 16 12
H0 U* W* DT/DZ ZICNV ZIMCH M-O LEN Z0 BOWEN ALBEDO REF WS - - - - - - - - - - - - - - - - - - - - - - - - - - - - - - - - - - - - - - 173.99 0.202 1.200 0.020 379. 209. -4.6 0.042 0.39 0.15 2.00
HT REF TA HT - - - - - - - - - - - 10.0 311.0 2.0
WIND SPEED AT STACK HEIGHT (non-downwash): 1.9 m/s
STACK-TIP DOWNWASH ADJUSTED STACK HEIGHT: 5.7 meters ESTIMATED FINAL PLUME RISE (non-downwash): 29.7 meters ESTIMATED FINAL PLUME HEIGHT (non-downwash): 35.4 meters
METEOROLOGY CONDITIONS USED TO PREDICT AMBIENT BOUNDARY IMPACT --------------------------------------------------------------
YR MO DY JDY HR -- -- -- --- -- 10 06 27 16 01
H0 U* W* DT/DZ ZICNV ZIMCH M-O LEN Z0 BOWEN ALBEDO REF WS - - - - - - - - - - - - - - - - - - - - - - - - - - - - - - - - - - - - - - -21.41 0.395 -9.000 0.020 -999. 571. 274.8 0.010 0.50 0.55 7.00
HT REF TA HT - - - - - - - - - - - 10.0 311.0 2.0
WIND SPEED AT STACK HEIGHT (non-downwash): 6.4 m/s STACK-TIP DOWNWASH ADJUSTED STACK HEIGHT: 5.7 meters ESTIMATED FINAL PLUME RISE (non-downwash): 6.4 meters ESTIMATED FINAL PLUME HEIGHT (non-downwash): 12.1 meters
----------------------------------------------------------------------------- ************************ AERSCREEN AUTOMATED DISTANCES ********************** OVERALL MAXIMUM CONCENTRATIONS BY DISTANCE -----------------------------------------------------------------------------
MAXIMUM RECEPTOR MAXIMUM RECEPTOR DIST 1-HR CONC HEIGHT DIST 1-HR CONC HEIGHT (m) (ug/m3) (m) (m) (ug/m3) (m) ---------------------------- ----------------------------- 57.50 67.68 0.08 1550.00 15.35 0.65 75.00 75.73 -0.05 1575.00 15.01 0.74 100.00 48.15 0.07 1600.00 14.68 0.82 125.00 43.08 -0.05 1625.00 14.36 1.27 150.00 45.11 -0.03 1650.00 14.05 1.37 175.00 48.64 -0.02 1675.00 13.75 1.52 200.00 50.95 0.04 1700.00 13.44 1.61 225.00 51.80 -0.05 1725.00 13.14 1.72 250.00 51.67 -0.04 1750.00 12.84 1.78 275.00 50.87 0.04 1775.00 12.54 1.83 300.00 49.59 0.05 1800.00 12.24 1.91 325.00 48.09 0.05 1825.00 11.95 2.00 350.00 46.15 0.05 1850.00 11.66 2.07 375.00 44.16 0.13 1875.00 11.37 2.12 400.00 42.36 0.15 1900.00 11.08 2.17 425.00 40.72 0.14 1925.00 10.80 2.25 450.00 39.23 0.18 1950.00 10.52 2.28 475.00 37.86 0.25 1975.00 10.24 2.33 500.00 36.60 0.23 2000.00 9.967 2.40 525.00 35.44 0.22 2025.00 9.696 2.45 550.00 34.36 0.24 2050.00 9.428 2.46 575.00 33.36 0.29 2075.00 9.164 2.54 600.00 32.42 0.35 2100.00 8.904 2.55 625.00 31.55 0.36 2125.00 8.647 2.60 650.00 30.72 0.37 2150.00 8.393 2.65 675.00 29.95 0.37 2175.00 8.144 2.65 700.00 29.23 0.42 2200.00 7.899 2.74 725.00 28.54 0.43 2225.00 7.658 2.82 750.00 27.89 0.49 2250.00 7.421 2.85 775.00 27.28 0.56 2275.00 7.188 2.88

800.00 26.70 0.80 2300.00 6.959 2.95 825.00 26.14 1.76 2325.00 6.735 2.94 850.00 25.61 2.39 2350.00 6.515 3.02 875.00 25.11 2.61 2375.00 6.299 3.06 900.00 24.63 2.61 2400.00 6.088 3.10 925.00 24.17 2.66 2425.00 5.881 3.16 950.00 23.73 2.53 2450.00 5.679 3.21 975.00 23.32 2.34 2475.00 5.481 3.24 1000.00 22.92 2.18 2500.00 5.288 3.25 1025.00 22.53 2.05 2525.00 5.099 3.26 1050.00 22.16 1.87 2550.00 4.915 3.29 1075.00 21.81 1.71 2575.00 4.735 3.35 1100.00 21.46 1.57 2600.00 4.560 3.36 1125.00 21.12 1.40 2625.00 4.389 3.40 1150.00 20.78 1.24 2650.00 4.223 3.44 1175.00 20.44 1.11 2675.00 4.061 3.45 1200.00 20.09 0.99 2700.00 3.903 3.45 1225.00 19.75 0.86 2725.00 3.754 2.83 1250.00 19.41 0.78 2750.00 3.620 2.79 1275.00 19.07 0.68 2775.00 3.489 2.80 1300.00 18.73 0.60 2800.00 3.362 2.82 1325.00 18.39 0.55 2825.00 3.238 2.88 1350.00 18.05 0.56 2850.00 3.117 2.94 1375.00 17.68 -0.07 2875.00 3.000 2.97 1400.00 17.31 -0.14 2900.00 2.885 3.01 1425.00 17.03 0.42 2925.00 2.774 3.08 1450.00 16.69 0.45 2950.00 2.667 3.17 1475.00 16.35 0.47 2975.00 2.562 3.23 1500.00 16.02 0.56 3000.00 2.460 3.30 1525.00 15.68 0.63
----------------------------------------------------------------------------- ********************** AERSCREEN MAXIMUM IMPACT SUMMARY ********************* -----------------------------------------------------------------------------
MAXIMUM SCALED SCALED SCALED SCALED 1-HOUR 3-HOUR 8-HOUR 24-HOUR ANNUAL CALCULATION CONC CONC CONC CONC CONC PROCEDURE (ug/m3) (ug/m3) (ug/m3) (ug/m3) (ug/m3) --------------- ---------- ---------- ---------- ---------- ---------- ELEVATED TERRAIN 76.90 76.90 69.21 46.14 7.690
DISTANCE FROM SOURCE 61.00 meters directed toward 360 degrees RECEPTOR HEIGHT -0.04 meters
IMPACT AT THE AMBIENT BOUNDARY 67.68 67.68 60.91 40.61 6.768
DISTANCE FROM SOURCE 57.50 meters directed toward 60 degrees RECEPTOR HEIGHT 0.08 meters