upm q2 results 2014 - wms-cornelius - advanced...
TRANSCRIPT
Jussi Pesonen
President and CEO
5 August 2014
UPM Q2 RESULTS 2014
| © UPM
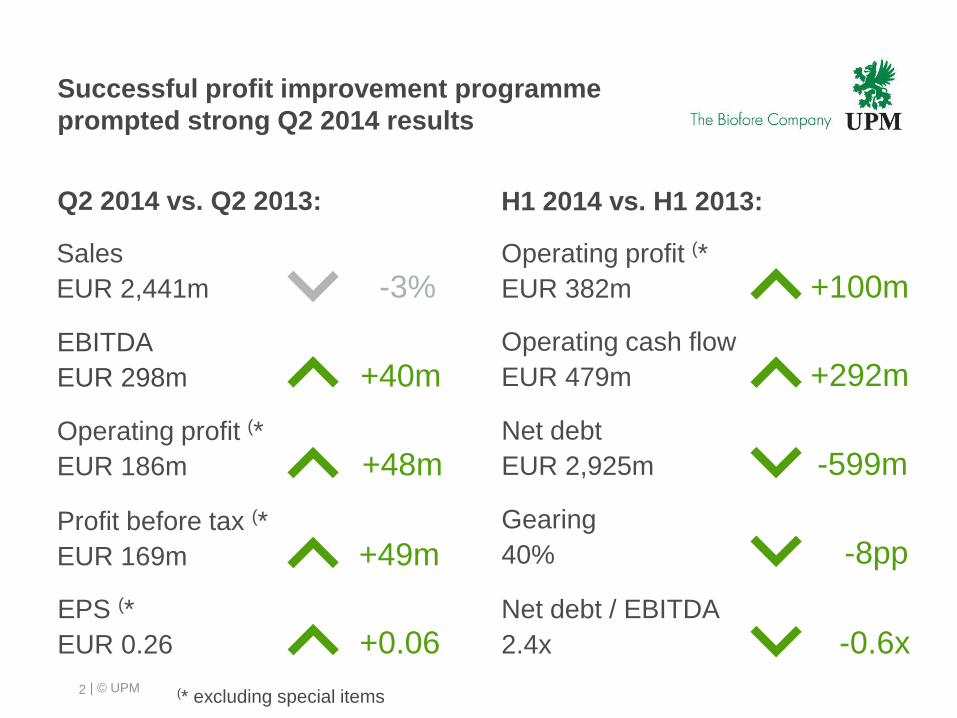
Sales
EUR 2,441m -3%
EBITDA
EUR 298m +40m
Successful profit improvement programme
prompted strong Q2 2014 results
Operating cash flow
EUR 479m +292m
Net debt
EUR 2,925m -599m
(* excluding special items2
Operating profit (*
EUR 186m +48m
Profit before tax (*
EUR 169m +49m Gearing
40% -8pp
Net debt / EBITDA
2.4x -0.6x
Q2 2014 vs. Q2 2013:
EPS (*
EUR 0.26 +0.06
Operating profit (*
EUR 382m +100m
H1 2014 vs. H1 2013:
| © UPM
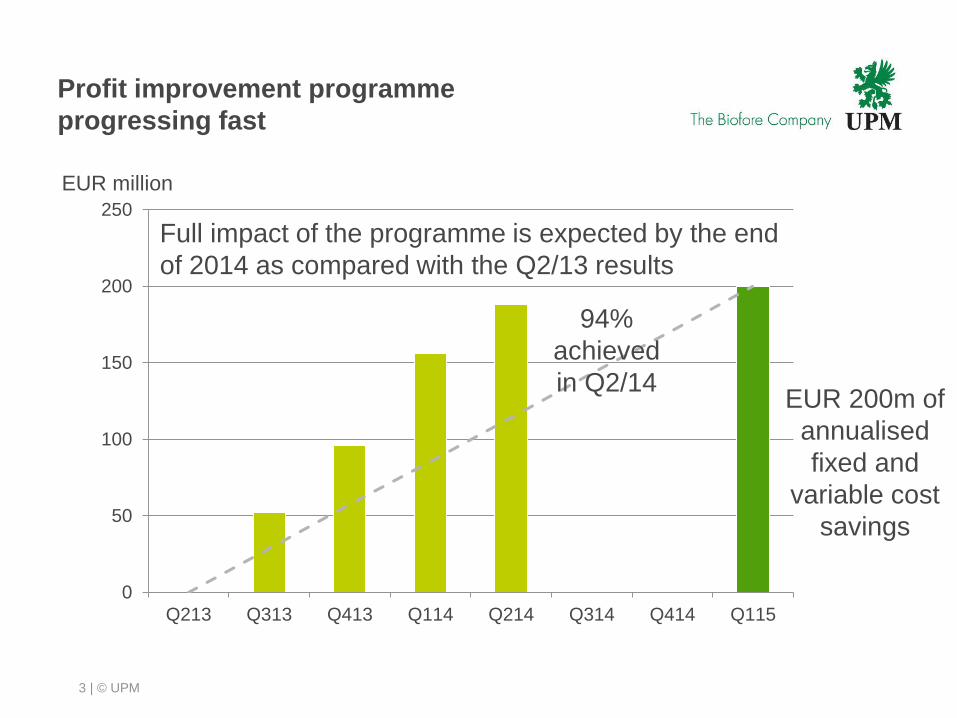
Profit improvement programme
progressing fast
0
50
100
150
200
250
Q213 Q313 Q413 Q114 Q214 Q314 Q414 Q115
3
EUR million
Full impact of the programme is expected by the end
of 2014 as compared with the Q2/13 results
94%
achieved
in Q2/14EUR 200m of
annualised
fixed and
variable cost
savings
| © UPM
0
100
200
300
400
500
600
700
800
EBITDA
H1/13
EBITDA
H1/14
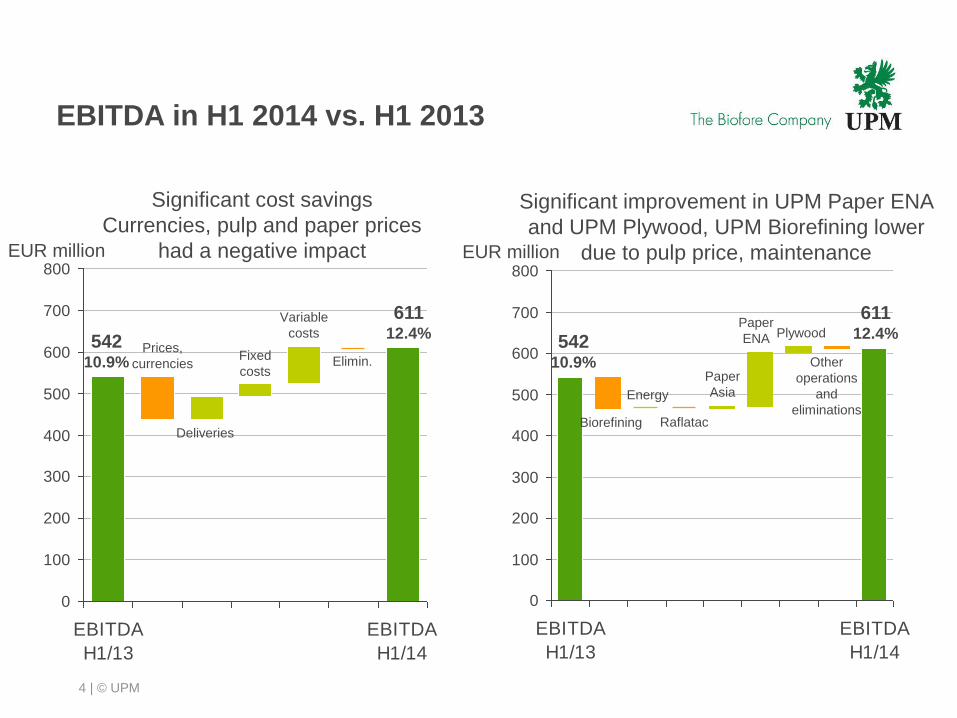
EBITDA in H1 2014 vs. H1 2013
Raflatac
Paper
Asia
Other
operations
and
eliminationsEnergy
Biorefining
Paper
ENA Plywood
0
100
200
300
400
500
600
700
800
EBITDA
H1/13
EBITDA
H1/14
EUR million
Prices,
currencies
Variable
costs
Fixed
costs
Deliveries
Significant cost savings
Currencies, pulp and paper prices
had a negative impact EUR million
Significant improvement in UPM Paper ENA
and UPM Plywood, UPM Biorefining lower
due to pulp price, maintenance
4
Elimin.
54210.9%
61112.4%
54210.9%
61112.4%

| © UPM
Operating profit *) by business area
5
0
2
4
6
8
10
0
10
20
30
40
50
Q312
Q412
Q113
Q213
Q313
Q413
Q114
Q214
0
4
8
12
16
20
0
20
40
60
80
100
Q312
Q412
Q113
Q213
Q313
Q413
Q114
Q214
0
10
20
30
40
50
0
20
40
60
80
100
Q312
Q412
Q113
Q213
Q313
Q413
Q114
Q214
0
2
4
6
8
10
0
10
20
30
40
50
Q312
Q412
Q113
Q213
Q313
Q413
Q114
Q214
-4
-2
0
2
4
6
-40
-20
0
20
40
60
Q312
Q412
Q113
Q213
Q313
Q413
Q114
Q214
-3
0
3
6
9
12
-5
0
5
10
15
20
Q312
Q412
Q113
Q213
Q313
Q413
Q114
Q214
EURm % of salesUPM Paper Asia EURm % of salesUPM Paper ENA EURm % of salesUPM Plywood
EURm % of salesUPM RaflatacEURm % of salesUPM EnergyEURm % of salesUPM Biorefining
*) excluding special items
| © UPM
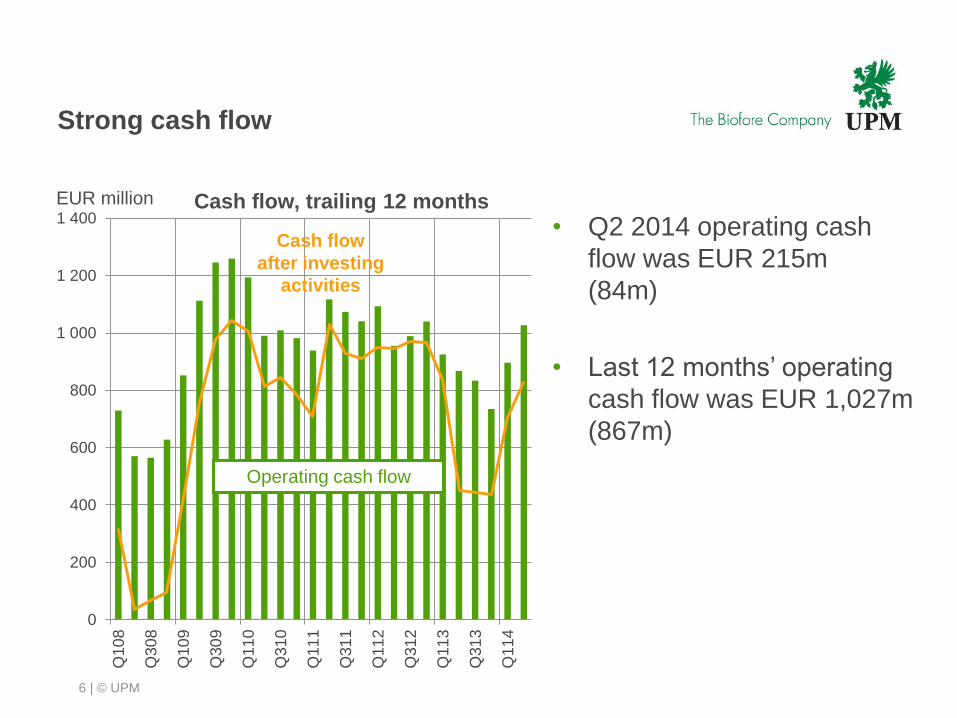
Strong cash flow
6
0
200
400
600
800
1 000
1 200
1 400
Q10
8
Q30
8
Q10
9
Q30
9
Q11
0
Q31
0
Q11
1
Q31
1
Q11
2
Q31
2
Q11
3
Q31
3
Q11
4
Operating cash flow
Cash flow
after investing
activities
EUR million Cash flow, trailing 12 months
• Q2 2014 operating cash
flow was EUR 215m
(84m)
• Last 12 months’ operating
cash flow was EUR 1,027m
(867m)
| © UPM
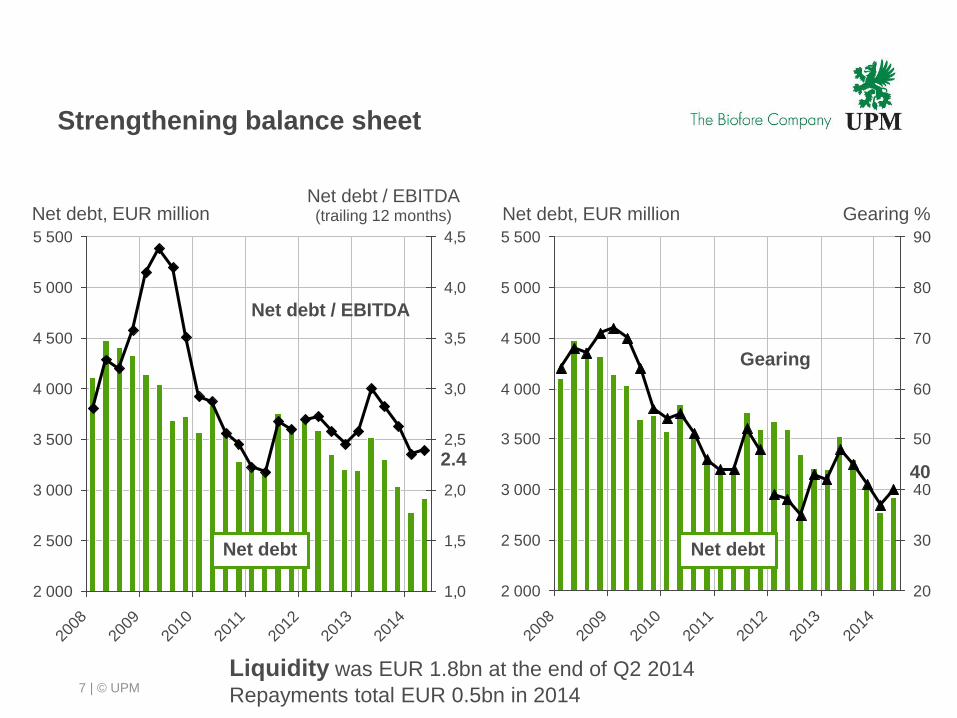
Strengthening balance sheet
7
2 000
2 500
3 000
3 500
4 000
4 500
5 000
5 500
2008
2009
2010
2011
2012
2013
2014
1,0
1,5
2,0
2,5
3,0
3,5
4,0
4,5
Net debt, EUR millionNet debt / EBITDA(trailing 12 months)
Net debt
Net debt / EBITDA
2.4
2 000
2 500
3 000
3 500
4 000
4 500
5 000
5 500
2008
2009
2010
2011
2012
2013
2014
20
30
40
50
60
70
80
90
Net debt, EUR million Gearing %
Net debt
Gearing
40
Liquidity was EUR 1.8bn at the end of Q2 2014
Repayments total EUR 0.5bn in 2014
| © UPM
UPM business outlook is broadly stable *)
*) See complete wording of the "Outlook"
in the Q2 2014 interim report
• In H2 2014, UPM’s performance is expected to be underpinned by similar or slightly better performance in UPM Paper ENA, UPM Paper Asia, UPM Raflatac, UPM Plywood and UPM Energy, when compared to H2 2013.
• UPM Biorefining performance in H2 2014 compared to H2 2013 continues to be impacted by lower chemical pulp prices.
• Commercial production of renewable diesel at the Lappeenranta biorefinery is expected to start during the autumn 2014. The impact on UPM Biorefining earnings is expected to be minor during H2 2014.
| © UPM8
| © UPM
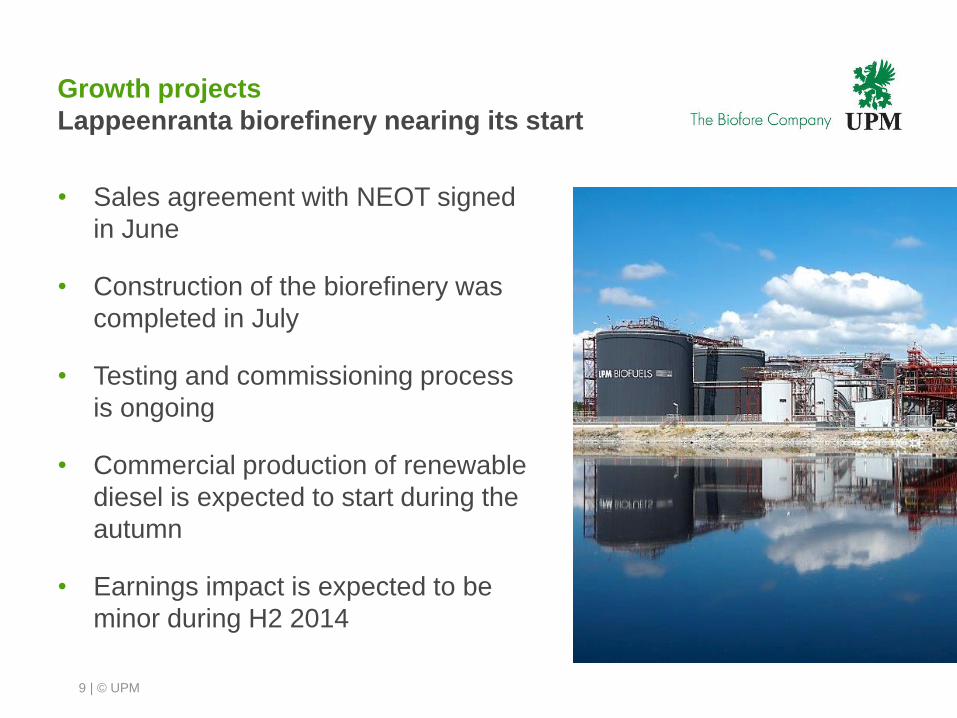
Growth projects
Lappeenranta biorefinery nearing its start
• Sales agreement with NEOT signed
in June
• Construction of the biorefinery was
completed in July
• Testing and commissioning process
is ongoing
• Commercial production of renewable
diesel is expected to start during the
autumn
• Earnings impact is expected to be
minor during H2 2014
9
| © UPM
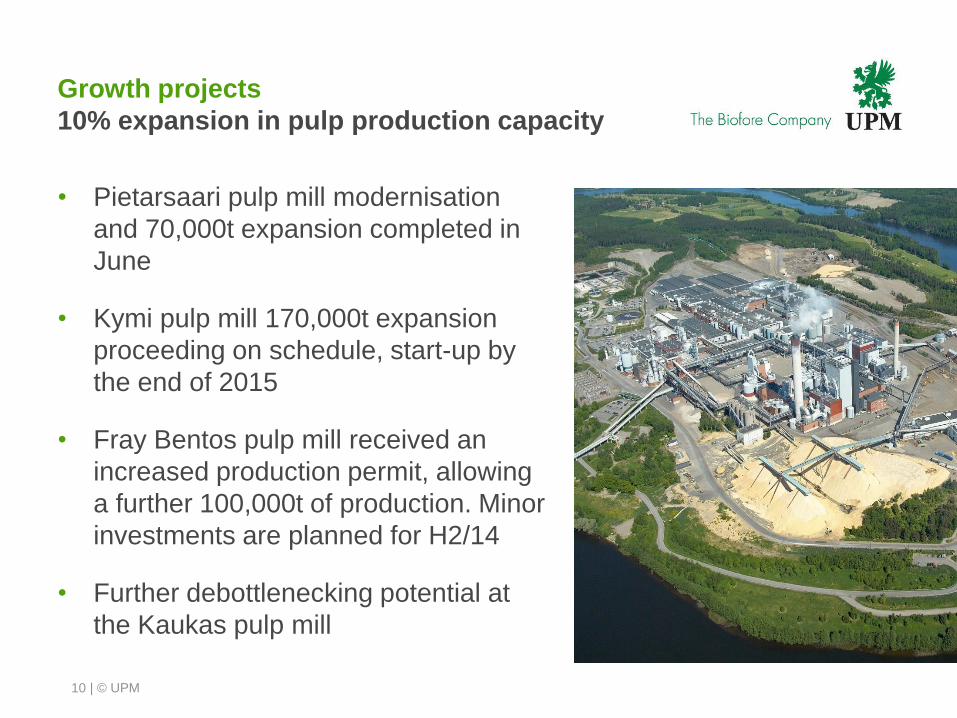
Growth projects
10% expansion in pulp production capacity
• Pietarsaari pulp mill modernisation
and 70,000t expansion completed in
June
• Kymi pulp mill 170,000t expansion
proceeding on schedule, start-up by
the end of 2015
• Fray Bentos pulp mill received an
increased production permit, allowing
a further 100,000t of production. Minor
investments are planned for H2/14
• Further debottlenecking potential at
the Kaukas pulp mill
10

| © UPM
Growth projects
Growth in developing markets
• Investment in labelling materials and
woodfree speciality papers at the
UPM Changshu mill in China,
capacity of 360,000t, start-up by the
end of 2015
• 50% increase in self-adhesive
labelstock coating capacity in APAC,
start-up by the end of 2014
• Expansion of filmic labelstock
production in Nowa Wies, Poland,
start-up in Q1 2015
11
| © UPM
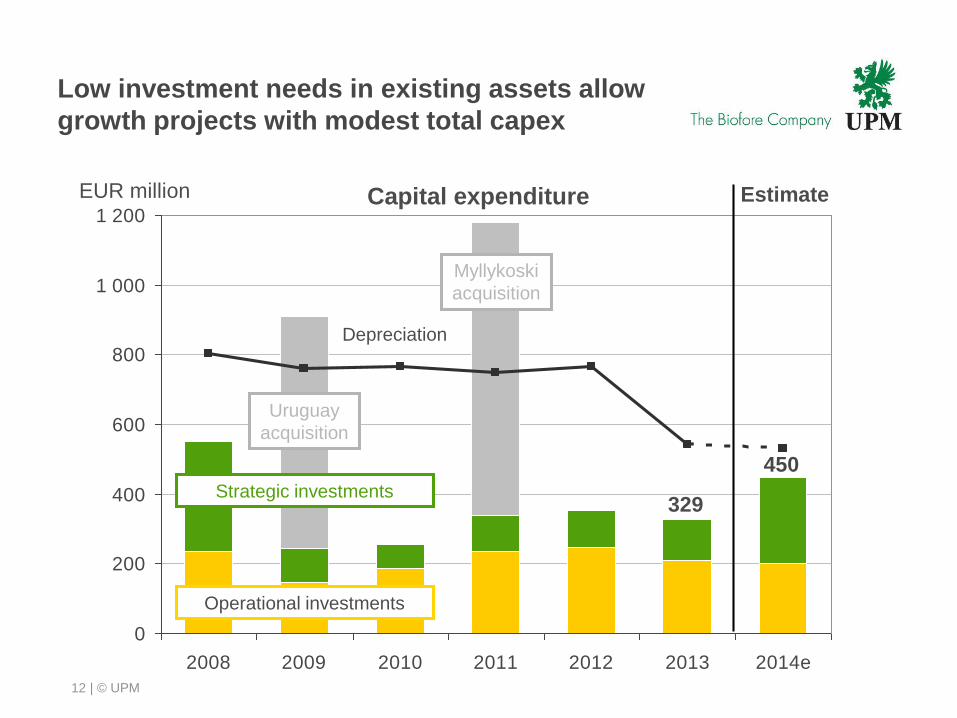
Low investment needs in existing assets allow
growth projects with modest total capex
12
0
200
400
600
800
1 000
1 200
2008 2009 2010 2011 2012 2013 2014e
EUR million
Operational investments
329
Capital expenditure
Strategic investments
Depreciation
Uruguay
acquisition
Myllykoski
acquisition
450
Estimate
| © UPM
Summary
• Strong Q2 2014 results thanks to fast implementation
of the profit improvement programme
• Strong cash flow and further strengthening balance
sheet
• Solid progress in growth projects
13
| © UPM
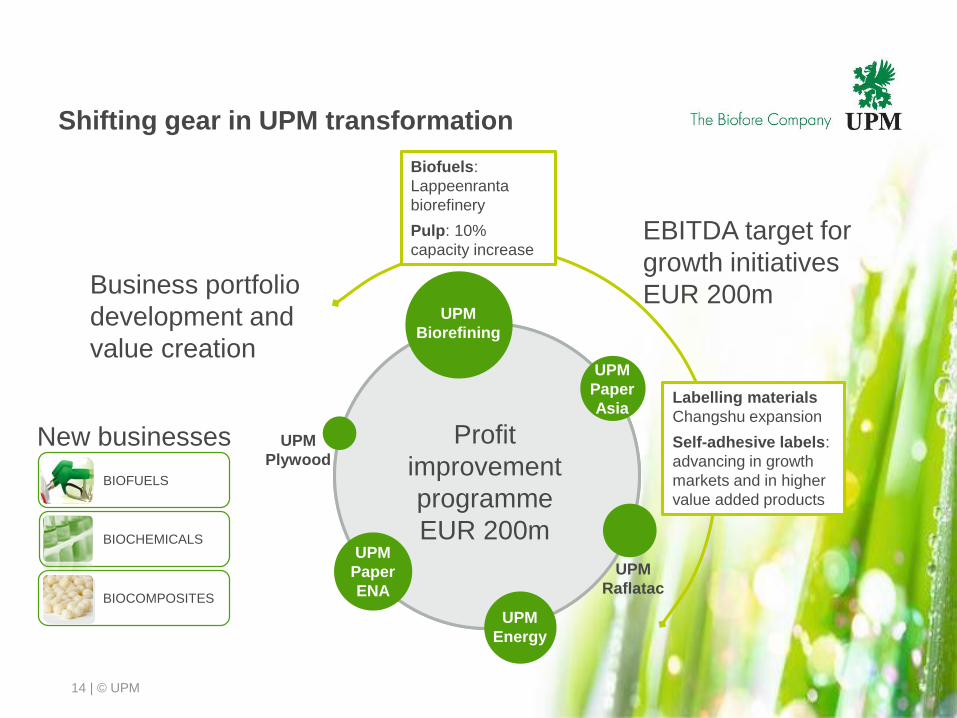
Profit
improvement
programme
EUR 200m
Shifting gear in UPM transformation
14
UPM
Biorefining
UPM
Paper
Asia
UPM
Raflatac
UPM
Energy
UPM
Paper
ENA
UPM
Plywood
EBITDA target for
growth initiatives
EUR 200m
Biofuels:
Lappeenranta
biorefinery
Pulp: 10%
capacity increase
Labelling materials
Changshu expansion
Self-adhesive labels:
advancing in growth
markets and in higher
value added products
Business portfolio
development and
value creation
BIOCHEMICALS
BIOCOMPOSITES
BIOFUELS
New businesses

FINANCIALS Q2 2014
| © UPM
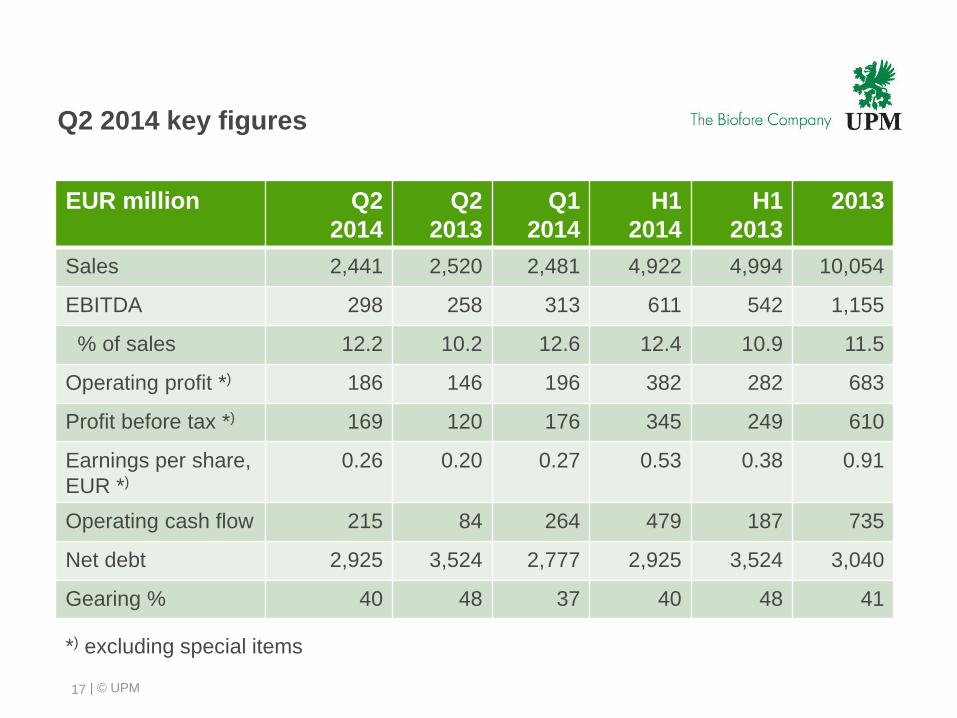
Q2 2014 key figures
EUR million Q2
2014
Q2
2013
Q1
2014
H1
2014
H1
2013
2013
Sales 2,441 2,520 2,481 4,922 4,994 10,054
EBITDA 298 258 313 611 542 1,155
% of sales 12.2 10.2 12.6 12.4 10.9 11.5
Operating profit *) 186 146 196 382 282 683
Profit before tax *) 169 120 176 345 249 610
Earnings per share,
EUR *)
0.26 0.20 0.27 0.53 0.38 0.91
Operating cash flow 215 84 264 479 187 735
Net debt 2,925 3,524 2,777 2,925 3,524 3,040
Gearing % 40 48 37 40 48 41
17
*) excluding special items
| © UPM
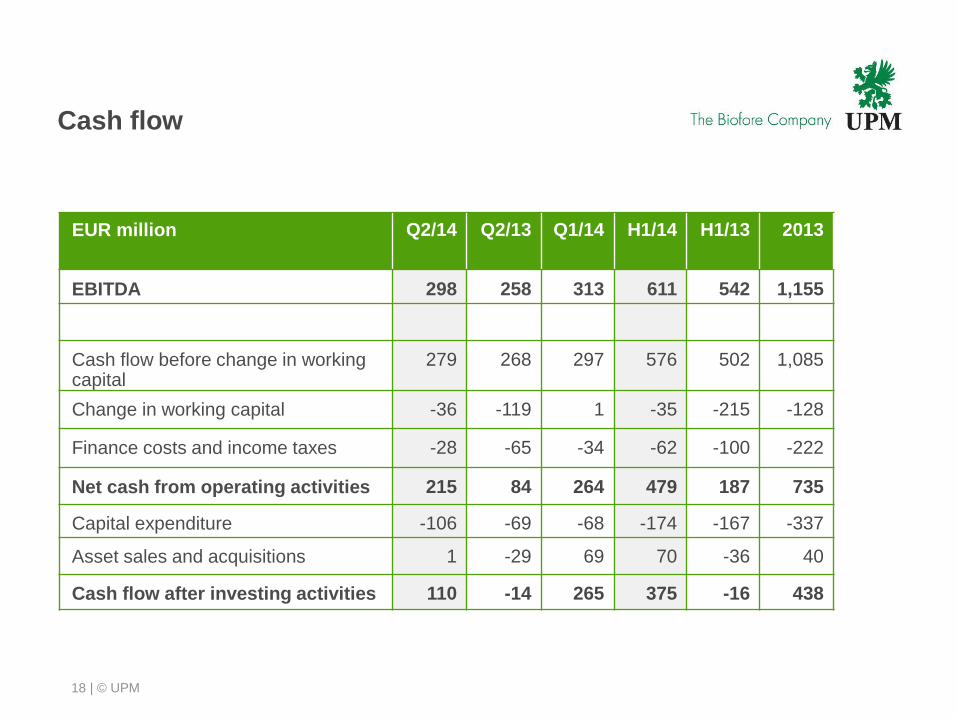
Cash flow
EUR million Q2/14 Q2/13 Q1/14 H1/14 H1/13 2013
EBITDA 298 258 313 611 542 1,155
Cash flow before change in working capital
279 268 297 576 502 1,085
Change in working capital -36 -119 1 -35 -215 -128
Finance costs and income taxes -28 -65 -34 -62 -100 -222
Net cash from operating activities 215 84 264 479 187 735
Capital expenditure -106 -69 -68 -174 -167 -337
Asset sales and acquisitions 1 -29 69 70 -36 40
Cash flow after investing activities 110 -14 265 375 -16 438
18
| © UPM
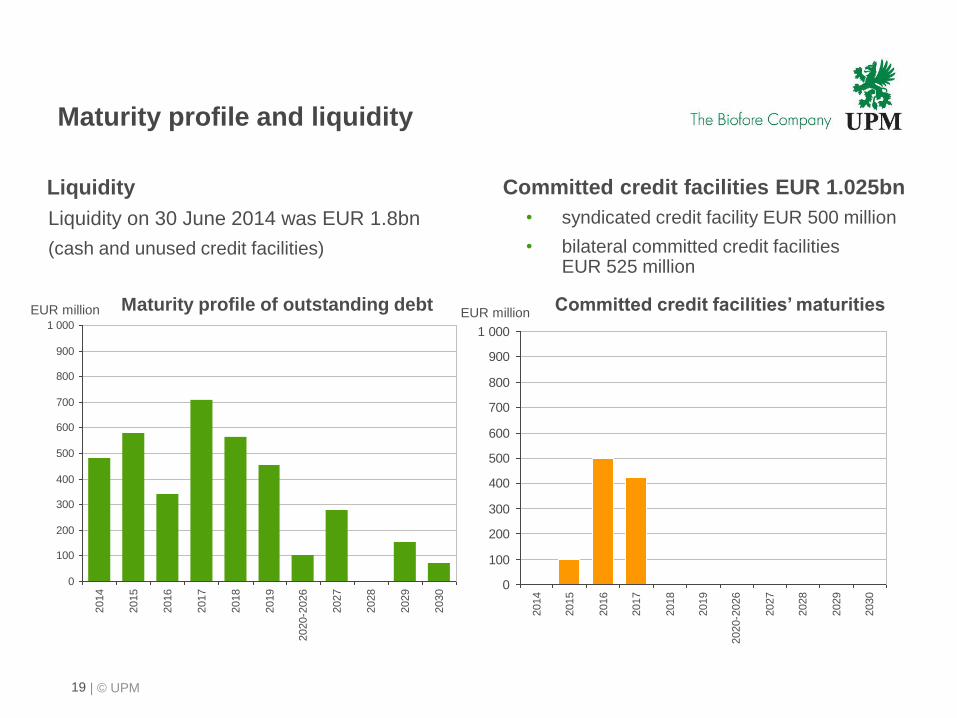
Maturity profile and liquidity
19
0
100
200
300
400
500
600
700
800
900
1 000
2014
2015
2016
2017
2018
2019
2020-2
026
2027
2028
2029
2030
EUR million
0
100
200
300
400
500
600
700
800
900
1 000
2014
2015
2016
2017
2018
2019
2020-2
026
2027
2028
2029
2030
EUR million
Liquidity
Liquidity on 30 June 2014 was EUR 1.8bn
(cash and unused credit facilities)
• syndicated credit facility EUR 500 million
• bilateral committed credit facilities EUR 525 million
Committed credit facilities EUR 1.025bn
Maturity profile of outstanding debt Committed credit facilities’ maturities
| © UPM
UPM Biorefining Q2 2014 vs. Q2 2013
20
0
20
40
60
80
100
Q1 12
Q2 12
Q3 12
Q4 12
Q1 13
Q2 13
Q3 13
Q4 13
Q1 14
Q2 14
0
4
8
12
16
20
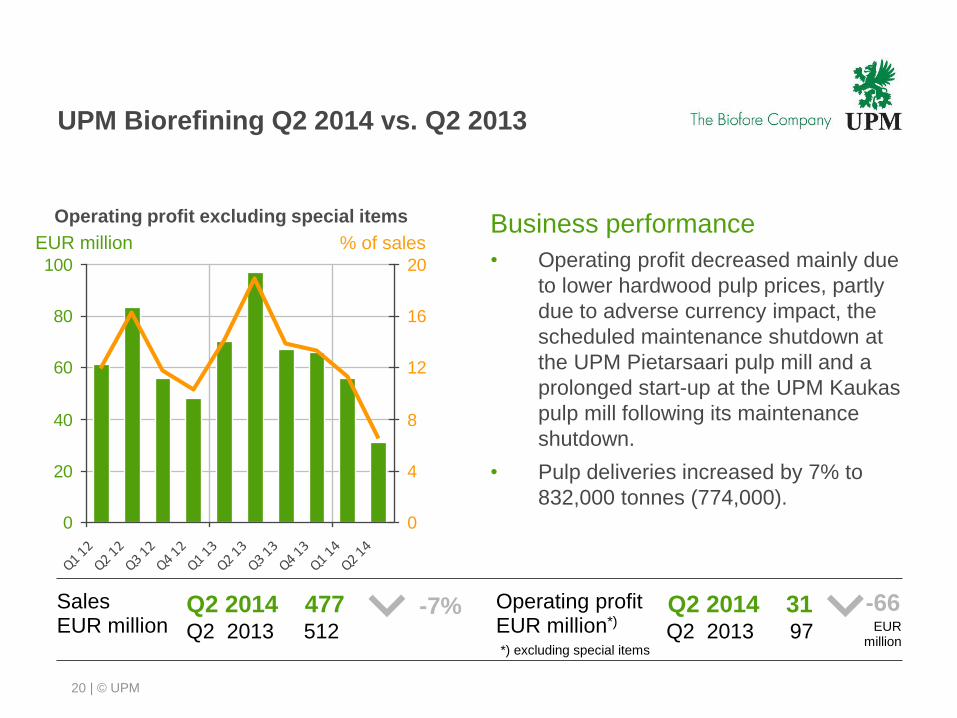
Q2 2014 477Q2 2013 512
SalesEUR million
-66Q2 2014 31Q2 2013 97
Operating profit excluding special items
EUR million
Operating profitEUR million*)
*) excluding special items
EURmillion
% of salesBusiness performance
• Operating profit decreased mainly due
to lower hardwood pulp prices, partly
due to adverse currency impact, the
scheduled maintenance shutdown at
the UPM Pietarsaari pulp mill and a
prolonged start-up at the UPM Kaukas
pulp mill following its maintenance
shutdown.
• Pulp deliveries increased by 7% to
832,000 tonnes (774,000).
-7%
| © UPM
UPM Energy Q2 2014 vs. Q2 2013
21
0
20
40
60
80
100
Q1 12
Q2 12
Q3 12
Q4 12
Q1 13
Q2 13
Q3 13
Q4 13
Q1 14
Q2 14
0
10
20
30
40
50
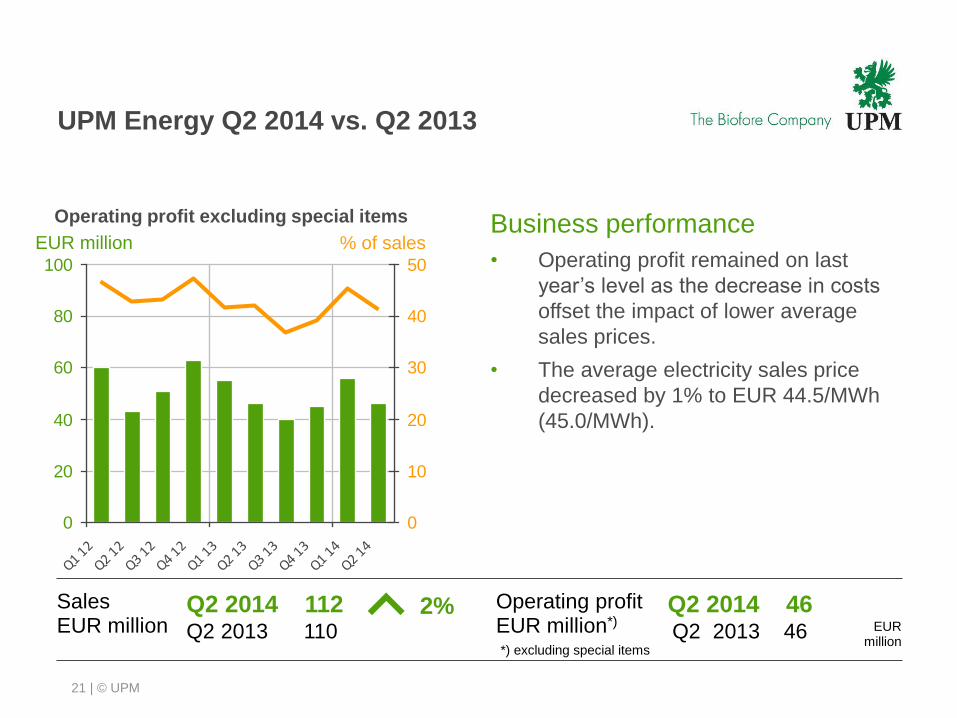
Q2 2014 112Q2 2013 110
SalesEUR million
Q2 2014 46Q2 2013 46
Operating profit excluding special items
Operating profitEUR million*)
*) excluding special items
EURmillion
Business performance
• Operating profit remained on last
year’s level as the decrease in costs
offset the impact of lower average
sales prices.
• The average electricity sales price
decreased by 1% to EUR 44.5/MWh
(45.0/MWh).
EUR million % of sales
2%
| © UPM
UPM Raflatac Q2 2014 vs. Q2 2013
22
0
10
20
30
40
50
Q1 12
Q2 12
Q3 12
Q4 12
Q1 13
Q2 13
Q3 13
Q4 13
Q1 14
Q2 14
0
2
4
6
8
10
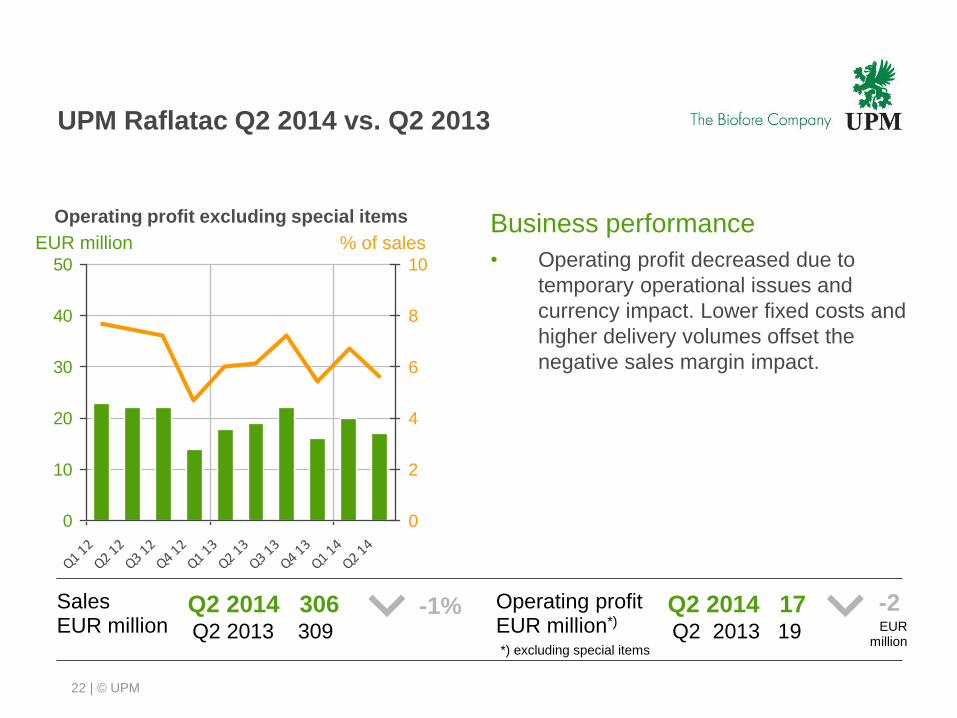
Q2 2014 306Q2 2013 309
SalesEUR million
Q2 2014 17Q2 2013 19
Operating profitEUR million*)
Operating profit excluding special items
EURmillion
Business performance
• Operating profit decreased due to
temporary operational issues and
currency impact. Lower fixed costs and
higher delivery volumes offset the
negative sales margin impact.
*) excluding special items
EUR million % of sales
-1% -2
| © UPM
UPM Paper Asia Q2 2014 vs. Q2 2013
23
0
10
20
30
40
50
Q1 12
Q2 12
Q3 12
Q4 12
Q1 13
Q2 13
Q3 13
Q4 13
Q1 14
Q2 14
0
3
6
9
12
15
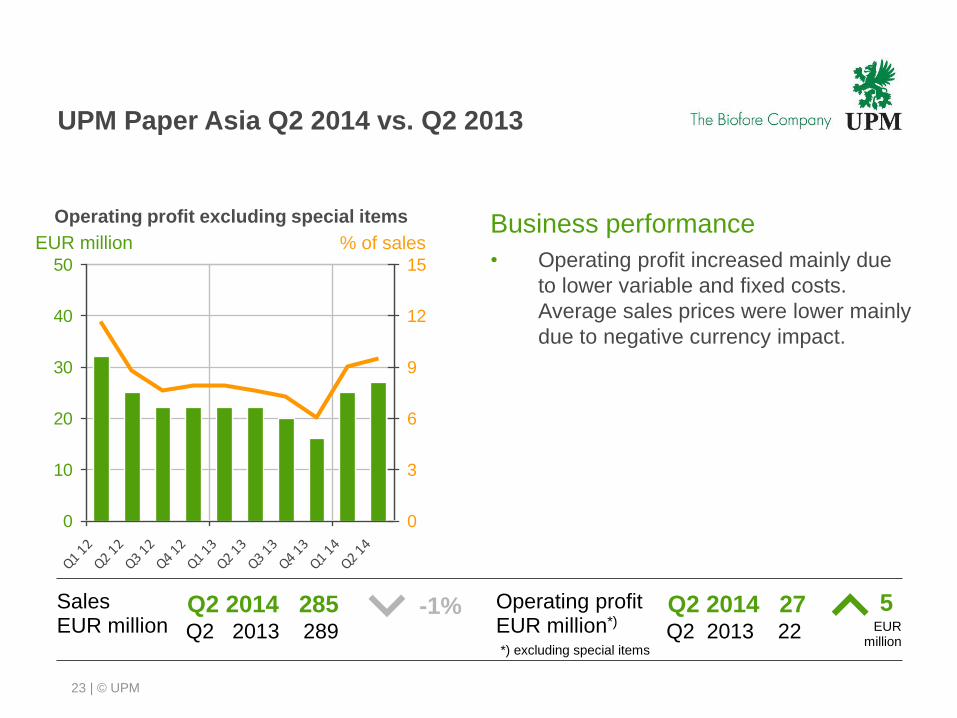
Q2 2014 285Q2 2013 289
SalesEUR million
Q2 2014 27Q2 2013 22
Operating profitEUR million*)
*) excluding special items
Operating profit excluding special items
EURmillion
Business performance
• Operating profit increased mainly due
to lower variable and fixed costs.
Average sales prices were lower mainly
due to negative currency impact.
5
EUR million % of sales
-1%
| © UPM
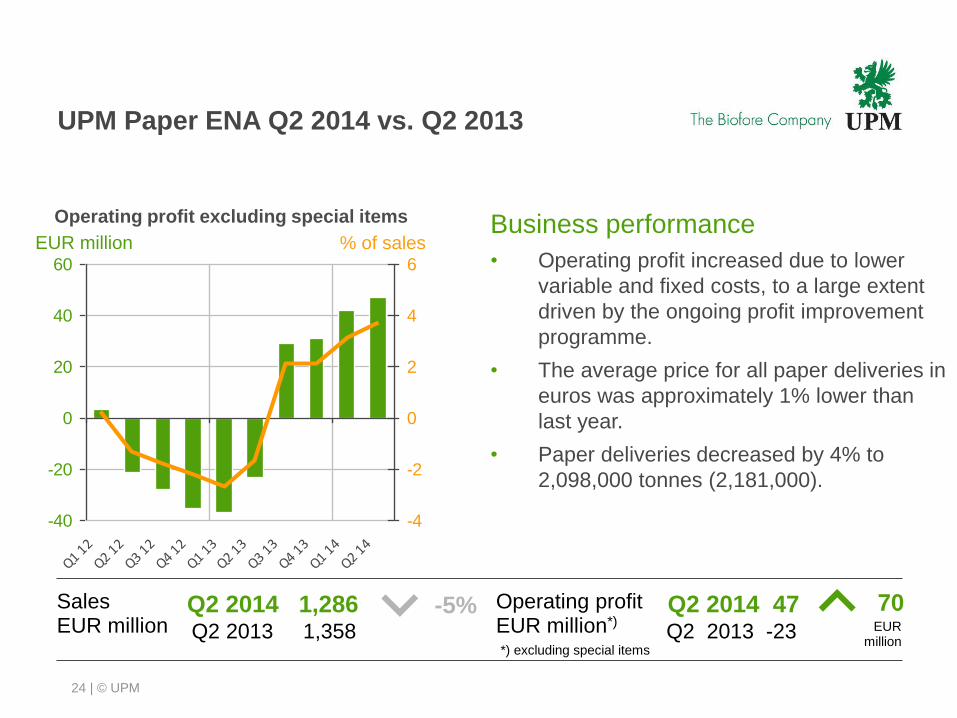
UPM Paper ENA Q2 2014 vs. Q2 2013
24
-40
-20
0
20
40
60
Q1 12
Q2 12
Q3 12
Q4 12
Q1 13
Q2 13
Q3 13
Q4 13
Q1 14
Q2 14
-4
-2
0
2
4
6
Q2 2014 1,286Q2 2013 1,358
SalesEUR million
70Q2 2014 47Q2 2013 -23
Operating profit excluding special items
Operating profitEUR million*)
*) excluding special items
EURmillion
-5%
Business performance
• Operating profit increased due to lower
variable and fixed costs, to a large extent
driven by the ongoing profit improvement
programme.
• The average price for all paper deliveries in
euros was approximately 1% lower than
last year.
• Paper deliveries decreased by 4% to
2,098,000 tonnes (2,181,000).
EUR million % of sales
| © UPM
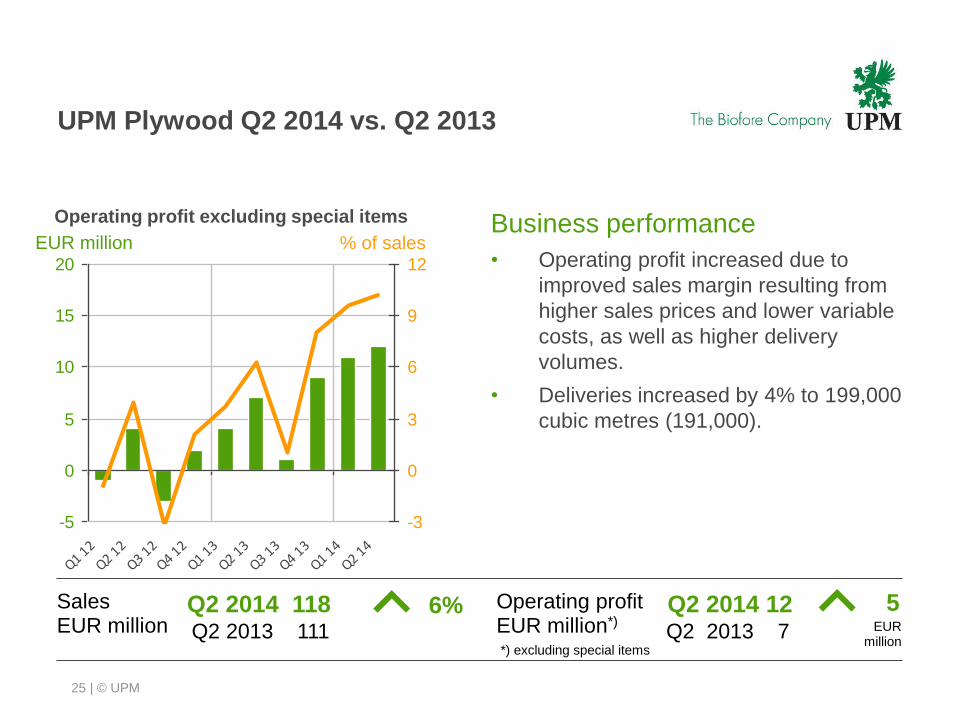
UPM Plywood Q2 2014 vs. Q2 2013
25
-5
0
5
10
15
20
Q1 12
Q2 12
Q3 12
Q4 12
Q1 13
Q2 13
Q3 13
Q4 13
Q1 14
Q2 14
-3
0
3
6
9
12
Q2 2014 118Q2 2013 111
SalesEUR million
5Q2 2014 12Q2 2013 7
Operating profit excluding special items
Operating profitEUR million*)
6%EUR
million
Business performance
• Operating profit increased due to
improved sales margin resulting from
higher sales prices and lower variable
costs, as well as higher delivery
volumes.
• Deliveries increased by 4% to 199,000
cubic metres (191,000).
*) excluding special items
EUR million % of sales
