upm financial statements
TRANSCRIPT
UPMfinancial
statements release 2018
Jussi Pesonen
President and CEO
31 January 2019
| © UPM2
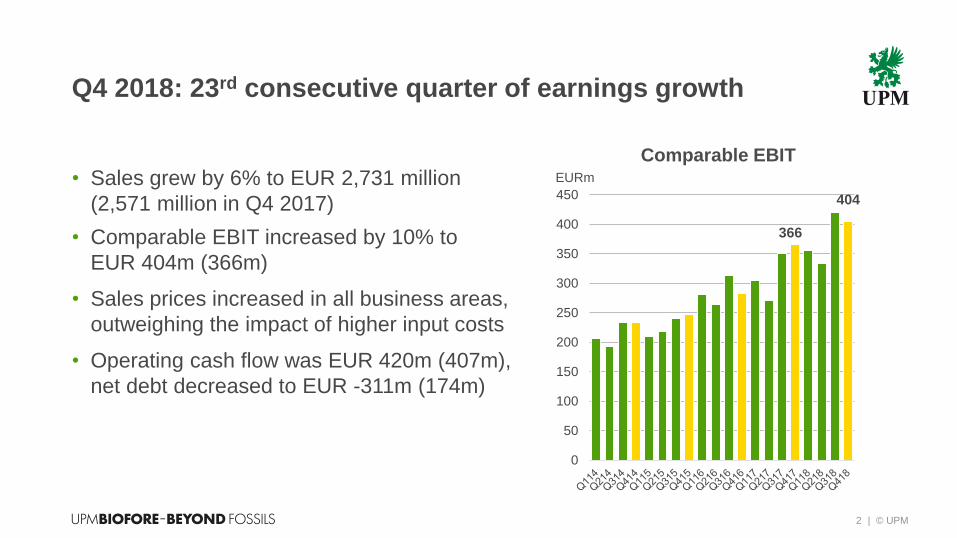
Q4 2018: 23rd consecutive quarter of earnings growth
• Sales grew by 6% to EUR 2,731 million
(2,571 million in Q4 2017)
• Comparable EBIT increased by 10% to
EUR 404m (366m)
• Sales prices increased in all business areas,
outweighing the impact of higher input costs
• Operating cash flow was EUR 420m (407m),
net debt decreased to EUR -311m (174m)
0
50
100
150
200
250
300
350
400
450
EURm
Comparable EBIT
404
366
| © UPM
0
100
200
300
400
500
600
700
Q3/18 Q4/18
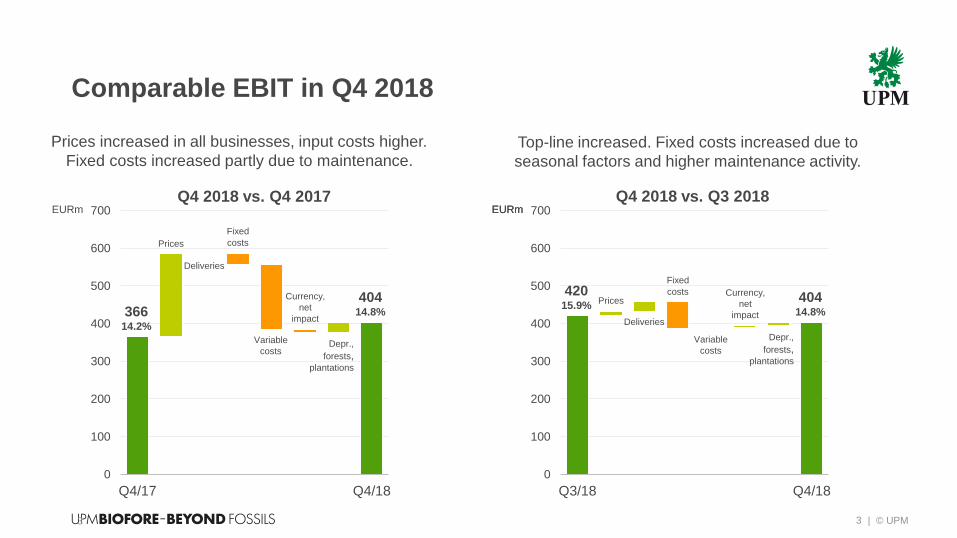
Comparable EBIT in Q4 2018
EURm
3
Top-line increased. Fixed costs increased due to
seasonal factors and higher maintenance activity.
Prices increased in all businesses, input costs higher.
Fixed costs increased partly due to maintenance.
0
100
200
300
400
500
600
700
Q4/17 Q4/18
EURm
Prices
Variable
costs
Fixed
costs
Deliveries
36614.2%
40414.8%
Currency,
net
impact
Depr.,
forests,plantations
EURm
Prices
Variable
costs
Fixed
costs
Deliveries
42015.9%
40414.8%
Currency,
net
impact
Depr.,
forests,plantations
Q4 2018 vs. Q4 2017 Q4 2018 vs. Q3 2018
3

| © UPM
Comparable EBIT by business area
4
0
2,5
5
7,5
10
12,5
15
0
10
20
30
40
50
60
0
5
10
15
20
25
30
35
0
40
80
120
160
200
240
280
0
2,5
5
7,5
10
12,5
15
0
10
20
30
40
50
60
-2,5
0
2,5
5
7,5
10
12,5
15
-20
0
20
40
60
80
100
120
EURm % of sales
UPM Specialty Papers
EURm % of sales
UPM Communication Papers
EURm % of sales
EURm % of sales
UPM Raflatac
EURm % of salesEURm % of salesUPM Biorefining
0
10
20
30
40
50
60
0
10
20
30
40
50
60UPM Energy
0
3
6
9
12
15
18
0
10
20
30
40
50
60UPM Plywood
| © UPM
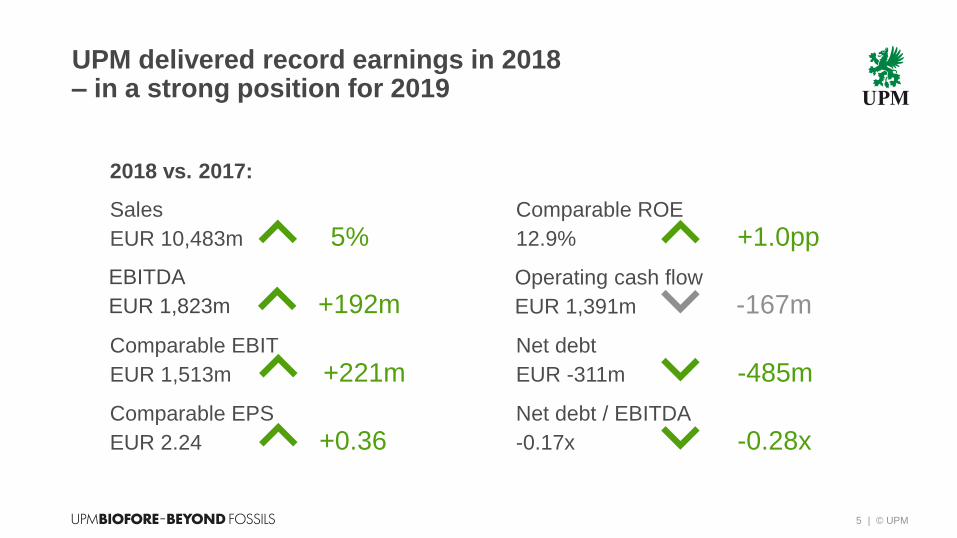
UPM delivered record earnings in 2018 – in a strong position for 2019
5
Sales
EUR 10,483m 5%
EBITDA
EUR 1,823m +192m
Comparable EBIT
EUR 1,513m +221m
2018 vs. 2017:
Comparable EPS
EUR 2.24 +0.36
Net debt
EUR -311m -485m
Operating cash flow
EUR 1,391m -167m
Net debt / EBITDA
-0.17x -0.28x
Comparable ROE
12.9% +1.0pp
| © UPM6
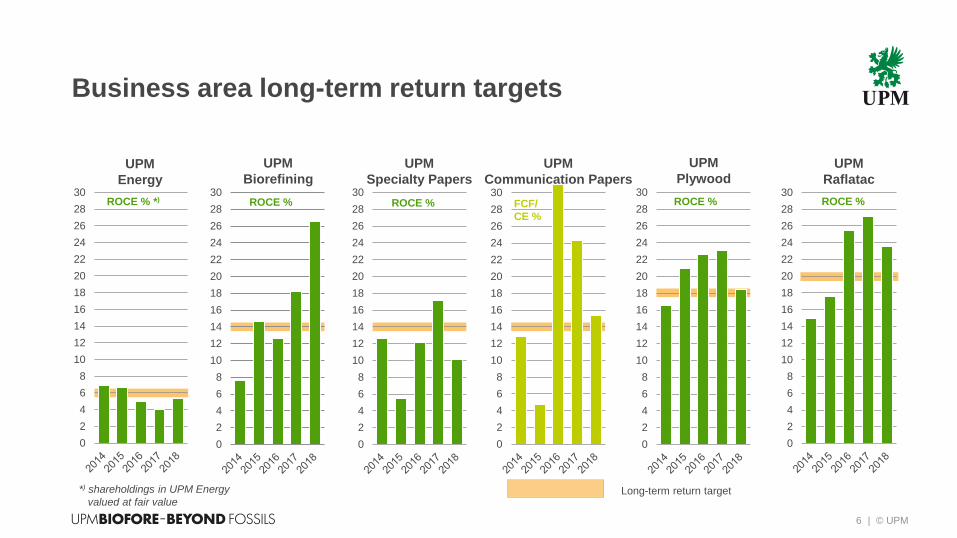
Business area long-term return targets
0
2
4
6
8
10
12
14
16
18
20
22
24
26
28
30ROCE %
0
2
4
6
8
10
12
14
16
18
20
22
24
26
28
30ROCE % *)
0
2
4
6
8
10
12
14
16
18
20
22
24
26
28
30ROCE %
0
2
4
6
8
10
12
14
16
18
20
22
24
26
28
30
0
2
4
6
8
10
12
14
16
18
20
22
24
26
28
30ROCE %
0
2
4
6
8
10
12
14
16
18
20
22
24
26
28
30ROCE %
*) shareholdings in UPM Energy
valued at fair valueLong-term return target
UPM
Specialty Papers
UPM
Communication Papers
UPM
PlywoodUPM
Raflatac
UPM
Energy
UPM
Biorefining
FCF/
CE %
| © UPM
-0,5
0,0
0,5
1,0
1,5
2,0
2,5
3,0
-750
0
750
1 500
2 250
3 000
3 750
4 500
2013 2014 2015 2016 2017 2018
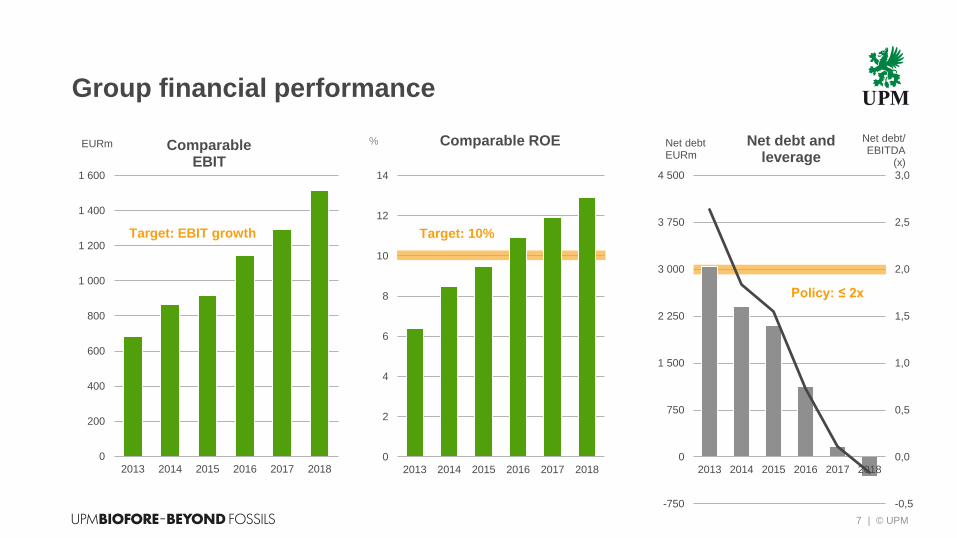
Net debtEURm
Net debt/EBITDA
(x)
Net debt and leverage
7
Group financial performance
0
200
400
600
800
1 000
1 200
1 400
1 600
2013 2014 2015 2016 2017 2018
EURm Comparable EBIT
0
2
4
6
8
10
12
14
2013 2014 2015 2016 2017 2018
% Comparable ROE
Target: 10%Target: EBIT growth
Policy: ≤ 2x
| © UPM
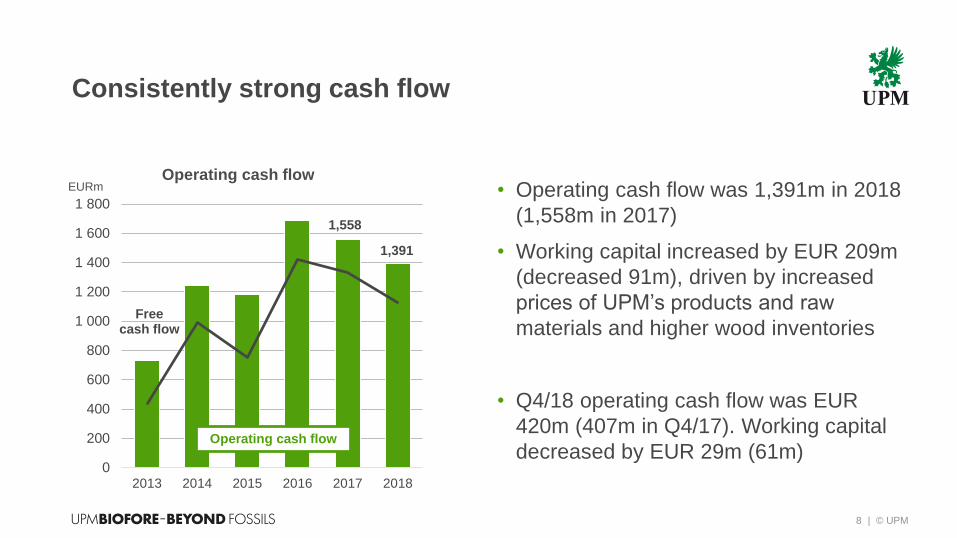
Consistently strong cash flow
8
• Operating cash flow was 1,391m in 2018
(1,558m in 2017)
• Working capital increased by EUR 209m
(decreased 91m), driven by increased
prices of UPM’s products and raw
materials and higher wood inventories
• Q4/18 operating cash flow was EUR
420m (407m in Q4/17). Working capital
decreased by EUR 29m (61m)0
200
400
600
800
1 000
1 200
1 400
1 600
1 800
2013 2014 2015 2016 2017 2018
Operating cash flow
1,391
Free cash flow
Operating cash flow
EURm
1,558
| © UPM
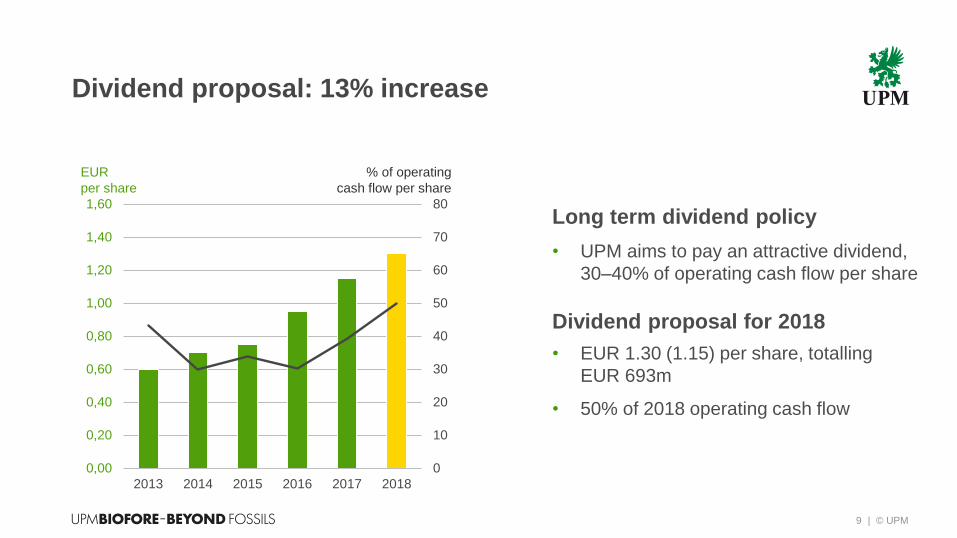
Dividend proposal: 13% increase
9
0
10
20
30
40
50
60
70
80
0,00
0,20
0,40
0,60
0,80
1,00
1,20
1,40
1,60
2013 2014 2015 2016 2017 2018
EUR
per share
% of operating
cash flow per share
Long term dividend policy
• UPM aims to pay an attractive dividend,
30–40% of operating cash flow per share
Dividend proposal for 2018
• EUR 1.30 (1.15) per share, totalling
EUR 693m
• 50% of 2018 operating cash flow
The global economic growth is estimated to continue in 2019, albeit at a slower pace than in
2018. There are, however, significant uncertainties related to this, including trade negotiations
between China and the US, growth in China, the undefined nature of Brexit and political
uncertainties in several countries. These issues may have an impact on the global economic
growth and on UPM’s product and raw material markets during 2019.
UPM reached record earnings in 2018. UPM’s business performance is expected to continue at
a good level in 2019.
In 2019, favorable demand is expected to continue for most UPM businesses. Demand decline
is expected to continue for UPM Communication Papers.
In the beginning of the year 2019, pulp prices are expected to be lower and graphic paper
prices in Europe are expected to be higher than in Q4 2018.
Input costs are expected to stabilise after the significant increases seen in 2018. UPM will
continue measures to reduce both variable and fixed costs.
Fair value increases of forest assets are not expected to contribute meaningfully to comparable
EBIT in 2019.
Outlook for 2019
| © UPM
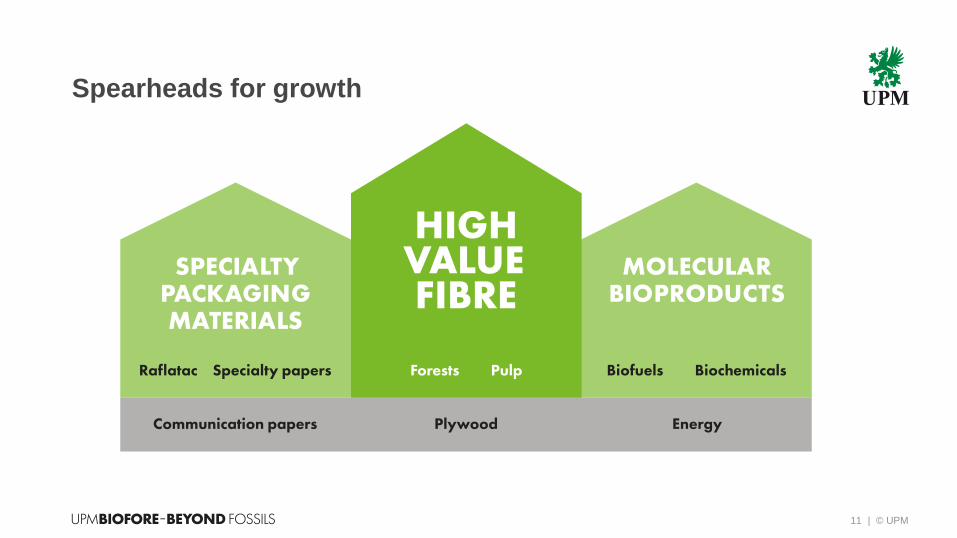
Spearheads for growth
11
| © UPM12
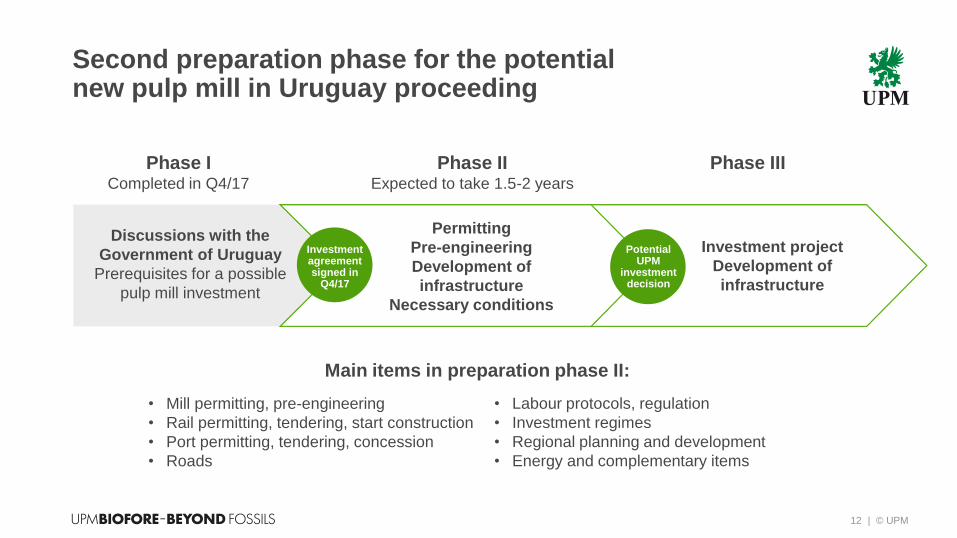
Second preparation phase for the potential new pulp mill in Uruguay proceeding
• Labour protocols, regulation
• Investment regimes
• Regional planning and development
• Energy and complementary items
• Mill permitting, pre-engineering
• Rail permitting, tendering, start construction
• Port permitting, tendering, concession
• Roads
Phase ICompleted in Q4/17
Phase IIExpected to take 1.5-2 years
Phase III
Discussions with the
Government of Uruguay
Prerequisites for a possible
pulp mill investment
Investment project
Development of
infrastructure
Main items in preparation phase II:
Investment agreement signed in
Q4/17
Permitting
Pre-engineering
Development of
infrastructure
Necessary conditions
Potential UPM
investment decision
| © UPM13
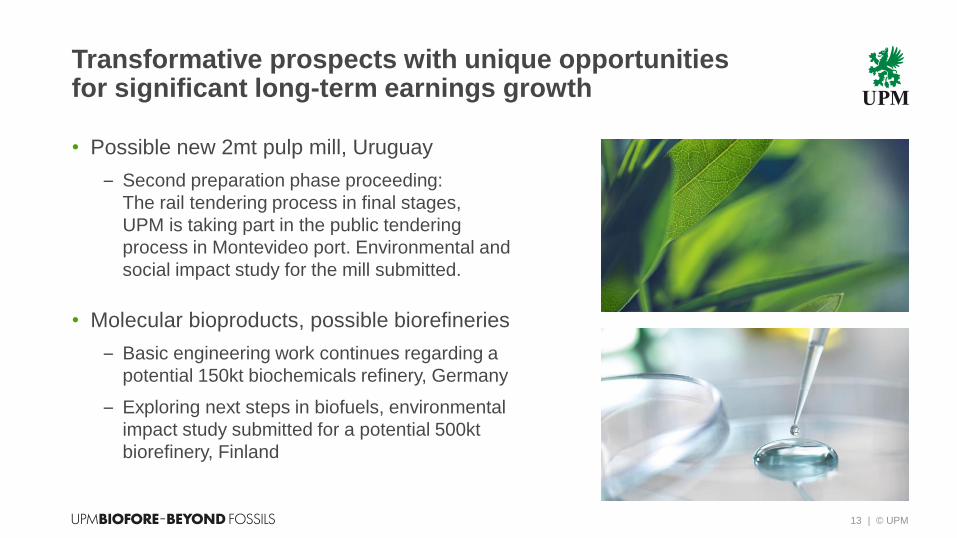
Transformative prospects with unique opportunities for significant long-term earnings growth
• Possible new 2mt pulp mill, Uruguay
– Second preparation phase proceeding:
The rail tendering process in final stages,
UPM is taking part in the public tendering
process in Montevideo port. Environmental and
social impact study for the mill submitted.
• Molecular bioproducts, possible biorefineries
– Basic engineering work continues regarding a
potential 150kt biochemicals refinery, Germany
– Exploring next steps in biofuels, environmental
impact study submitted for a potential 500kt
biorefinery, Finland
| © UPM14
Focused growth projects to develop market position while maintaining and growing earnings
• Completed – Kaukas pulp mill expansion
+30kt in Q2 2018, Finland
– Jämsänkoski release liner expansion+40kt in Q4 2018, Finland
– Raflatac speciality label expansionin Q1 2019, Finland
• Construction stage– Chudovo plywood mill expansion
+45k m3 in Q3 2019, Russia
– Nordland PM2 conversion to release liner +110kt in Q4 2019, Germany
– Changshu release liner expansion+40kt in Q1 2020, China
– Kuusankoski hydropower refurbishmentin Q4 2022, Finland
| © UPM
Summary
• UPM delivered record earnings in 2018, Q4 was the 23rd consecutive
quarter of earnings growth.
• UPM is in a strong position for 2019, while there are uncertainties in
the global economy.
• UPM’s business performance is expected to continue at a good level
in 2019.
• Preparations continue for UPM’s transformative prospects with unique
opportunities for significant long-term earnings growth.
• Dividend proposal +13%, reflects UPM’s exceptional financial position
and confidence in future cash generation.
15
| © UPM
Inspired by the
limitless opportunities
of bioeconomy
Delivering renewable
and responsible
solutions
Innovating for
a future beyond
fossils
16 | © UPM Biofore – Beyond Fossils
| © UPM18
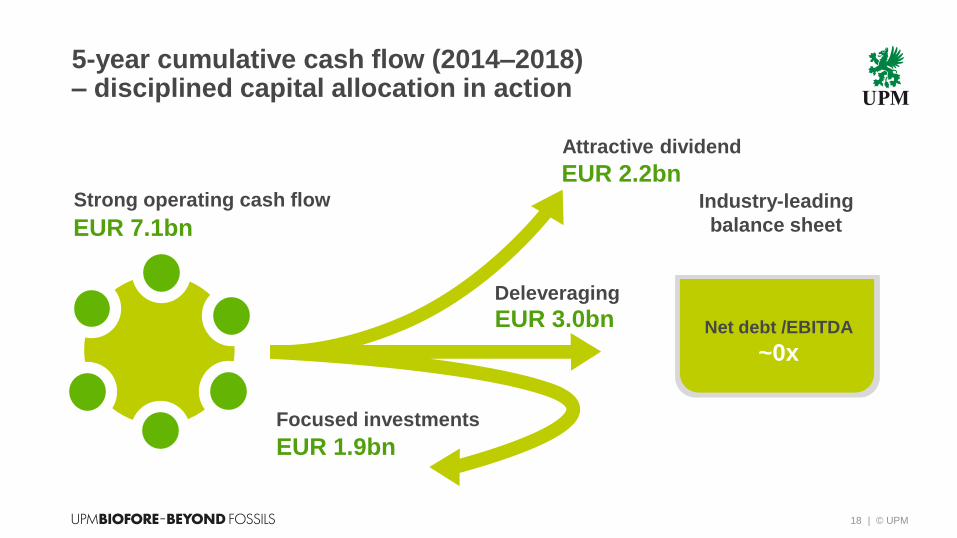
5-year cumulative cash flow (2014–2018)– disciplined capital allocation in action
EUR 7.1bn
Deleveraging
Strong operating cash flow
Attractive dividend
Focused investments
EUR 1.9bn
EUR 3.0bn
EUR 2.2bnIndustry-leading
balance sheet
Net debt /EBITDA
~0x
| © UPM19
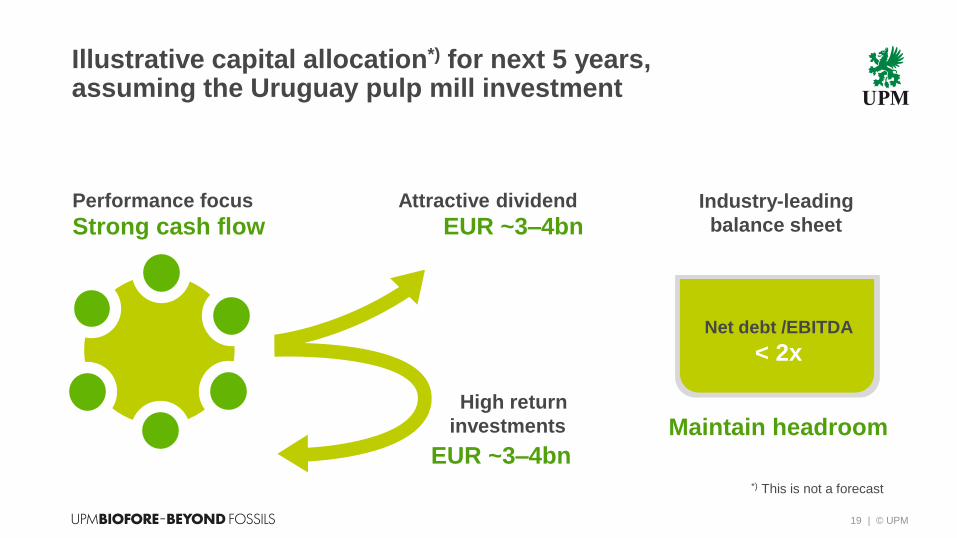
Illustrative capital allocation*) for next 5 years,assuming the Uruguay pulp mill investment
Industry-leading
balance sheet
Net debt /EBITDA
< 2x
Attractive dividend
EUR ~3–4bnPerformance focus
Strong cash flow
High return
investments
EUR ~3–4bn
Maintain headroom
*) This is not a forecast

| © UPM
Low investment needs in existing assets allow growth projects with modest total capex
0
200
400
600
800
1 000
1 200
2009 2010 2011 2012 2013 2014 2015 2016 2017 2018 2019E
EURm
Operational investments
Capital expenditure
Strategic investments
Uruguay
acquisition
Estimate
303
Myllykoski
acquisition
20
350
*) Excluding potential
transformative prospects
*)
Depreciation
| © UPM21
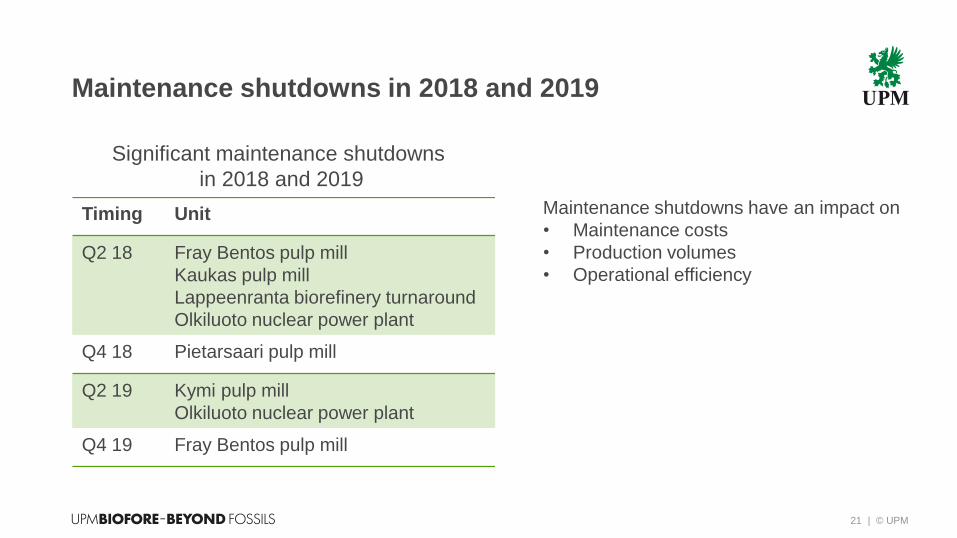
Maintenance shutdowns in 2018 and 2019
Maintenance shutdowns have an impact on
• Maintenance costs
• Production volumes
• Operational efficiency
Timing Unit
Q2 18 Fray Bentos pulp mill
Kaukas pulp mill
Lappeenranta biorefinery turnaround
Olkiluoto nuclear power plant
Q4 18 Pietarsaari pulp mill
Q2 19 Kymi pulp mill
Olkiluoto nuclear power plant
Q4 19 Fray Bentos pulp mill
Significant maintenance shutdowns
in 2018 and 2019
| © UPM22
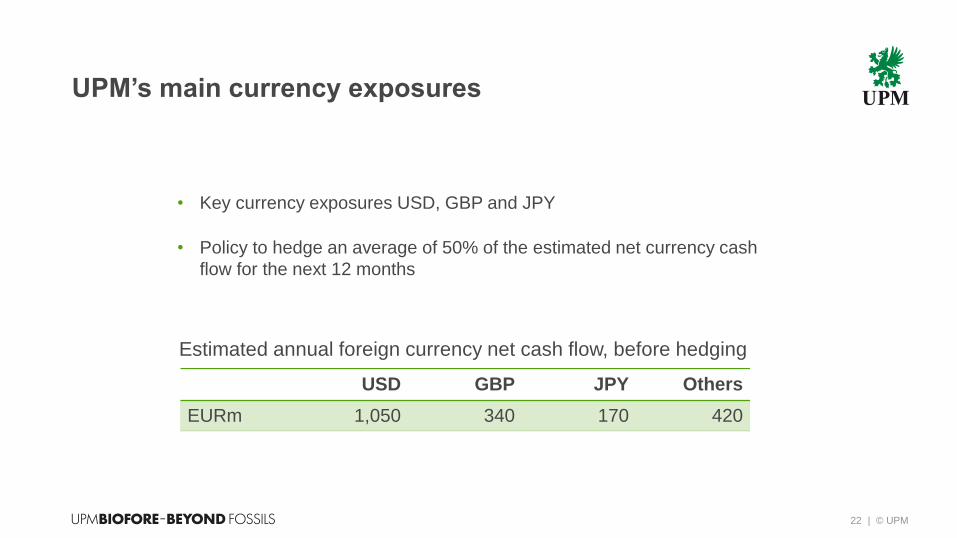
UPM’s main currency exposures
• Key currency exposures USD, GBP and JPY
• Policy to hedge an average of 50% of the estimated net currency cash
flow for the next 12 months
Estimated annual foreign currency net cash flow, before hedging
USD GBP JPY Others
EURm 1,050 340 170 420
| © UPM
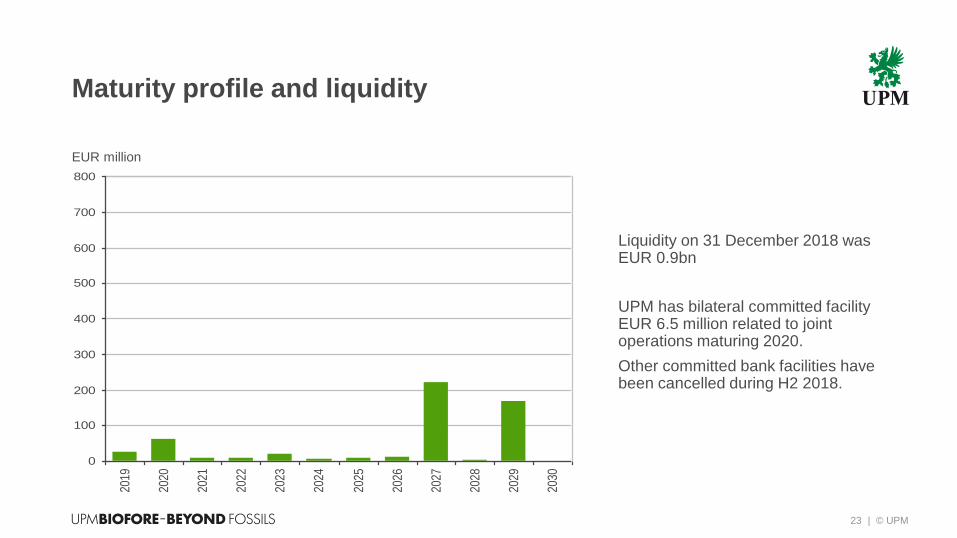
Maturity profile and liquidity
23
0
100
200
300
400
500
600
700
800
2019
2020
2021
2022
2023
2024
2025
2026
2027
2028
2029
2030
Liquidity on 31 December 2018 was EUR 0.9bn
UPM has bilateral committed facility EUR 6.5 million related to joint operations maturing 2020.
Other committed bank facilities have been cancelled during H2 2018.
EUR million
| © UPM
300
400
500
600
700
800
900
1000
1100
1200
1300
USD/tonne
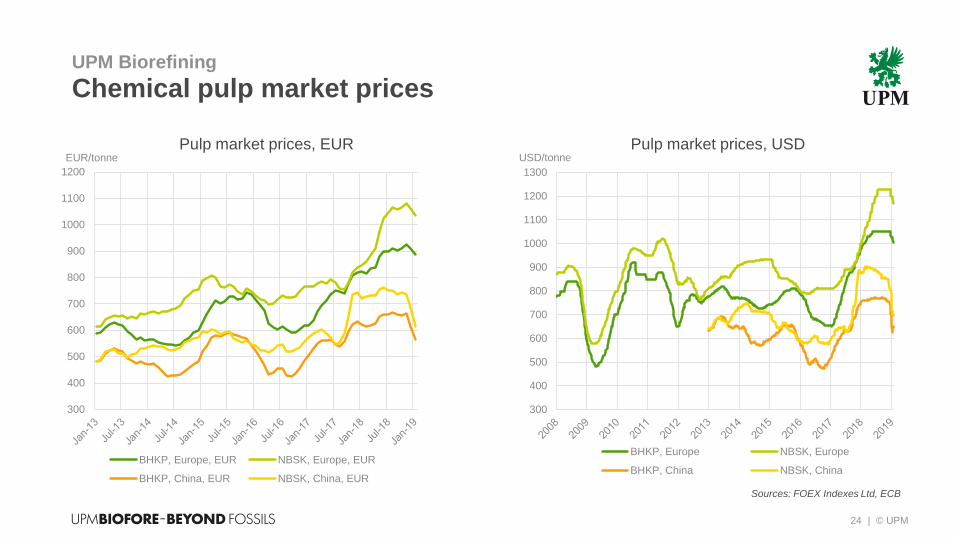
BHKP, Europe NBSK, Europe
BHKP, China NBSK, China
Chemical pulp market prices
24
UPM Biorefining
300
400
500
600
700
800
900
1000
1100
1200
EUR/tonne
BHKP, Europe, EUR NBSK, Europe, EUR
BHKP, China, EUR NBSK, China, EUR
Pulp market prices, USDPulp market prices, EUR
Sources: FOEX Indexes Ltd, ECB
| © UPM25
UPM Energy
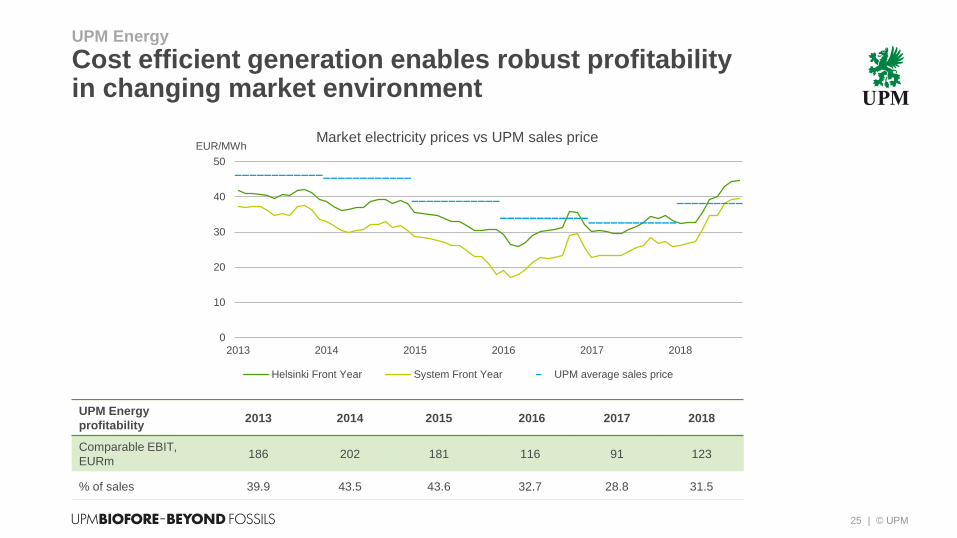
profitability2013 2014 2015 2016 2017 2018
Comparable EBIT,
EURm186 202 181 116 91 123
% of sales 39.9 43.5 43.6 32.7 28.8 31.5
UPM Energy
Cost efficient generation enables robust profitability in changing market environment
0
10
20
30
40
50
2013 2014 2015 2016 2017 2018
EUR/MWhMarket electricity prices vs UPM sales price
Helsinki Front Year System Front Year UPM average sales price
| © UPM
400
500
600
700
800
900
1000
1100
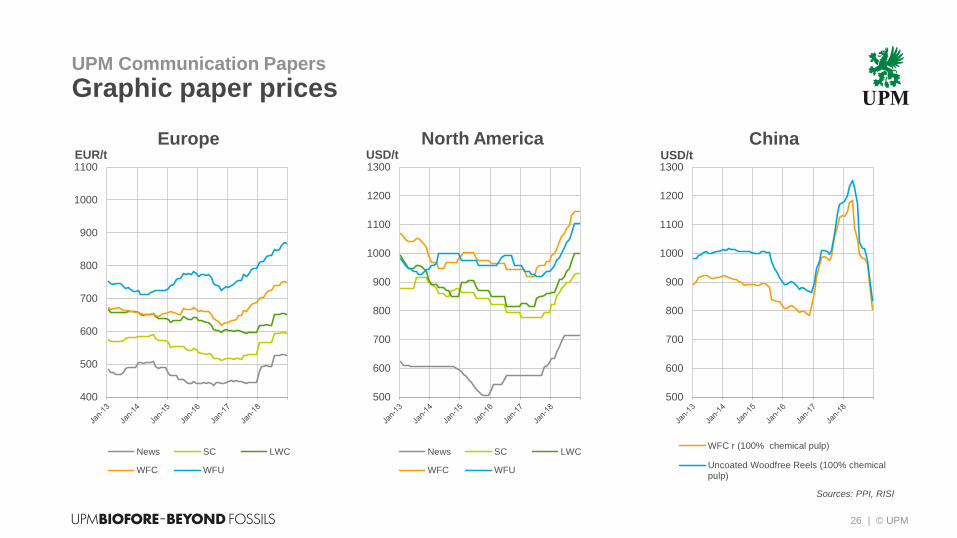
News SC LWC
WFC WFU
26
UPM Communication Papers
Graphic paper prices
EUR/t
EuropeUSD/t USD/t
ChinaNorth America
500
600
700
800
900
1000
1100
1200
1300
WFC r (100% chemical pulp)
Uncoated Woodfree Reels (100% chemicalpulp)
500
600
700
800
900
1000
1100
1200
1300
News SC LWC
WFC WFU
Sources: PPI, RISI
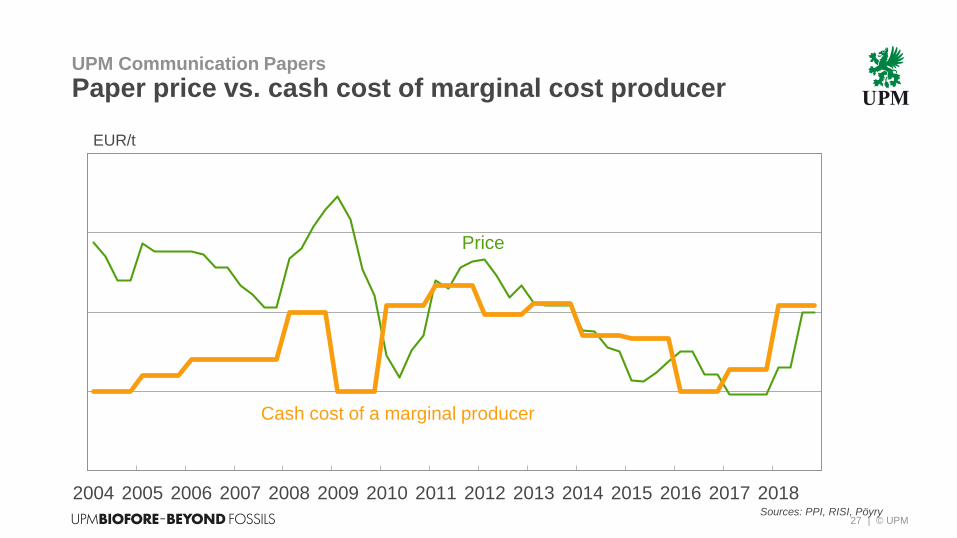
| © UPM27
UPM Communication Papers
Paper price vs. cash cost of marginal cost producer
Sources: PPI, RISI, Pöyry
2004 2005 2006 2007 2008 2009 2010 2011 2012 2013 2014 2015 2016 2017 2018
EUR/t
Cash cost of a marginal producer
Price
