upgrading grain elevators to facilitate multicar rail shipments
TRANSCRIPT
Upgrading Grain Elevators to Facilitate Multicar
Rail Shipments Stephen Fuller
Kerry Litzenberg Larry Makus
Hector Viscencio
This article provides an investment analysis of the decision to upgrade grain elevators to multicar grain loadout facilities subject to changes in rail rates, levels of wheat production, and competitors’ price response. The motivation for additional investment comes from railroads offering shippers more attractive rail rates for multicar shipments. The analysis is used to evaluate the decision to upgrade a set of selected Plains elevators and identify the effect of varying investment levels, various levels of rail rate reductions, small and large annual grain production levels, and a declining elevator gross margin on return to upgrading investment. The analysis uses a spatial model to calculate grain flows at selected elevators as a result of rate changes and then uses a computerized budgeting routine to evaluate the investment decision.
Rail carriers now offer individual grain shippers lower rates if shipments are made in multiple-car lots. Railroads are able to reduce operating costs through multiple-car, point-to-point grain movements. Multicar shipments generally expe- dite equipment handling, shorten equipment turnaround, and permit more pro- ductive use of railroad capital and labor. Therefore, railroads often offer contracts which feature reduced rates if grain handlers make large multicar shipments. Although railroads have begun offering these lower rates in response to recent legislation, current contracts with elevators suggest opportunities for reduced rates will continue. However, many country elevator facilities are not currently capable of making multiple carload shipments for which significant rate reductions may be offered. Most country elevators do not have the necessary rail car loading
Stephen Fuller is Professor and Kerry Litzenberg is Associate Professor in the Department of Agricultural Economics at Texas A&M University.
Larry Makus is a former Research Associate at Texas A&M University.
Hector Viscencio is currently an Assistant Research Scientist in the Department of Agricultural Economics at Texas A&M University.
Agribusiness, Vol. 2, No. 2, 247-263 (1986) 0 1986 by John Wiley & Sons, Inc. CCC 0742-4477/86/020247-17604.00
248 FULLER ET AL.
capacity nor track space (rail car holding capacity) to accommodate multicar shipments; therefore, substantial plant upgrading investment may be necessary before contracting can be an attractive alternative.
Since lower rail rates, offered as a result of the upgrading investment, could ultimately be reflected in a higher farmer grain price, these investments would increase the elevator’s grain receipts and revenues. The decision to upgrade a country elevator, in order to contract at reduced rates, is dependent on the magnitude of the added grain revenues and upgrading costs. This study focuses on the methodology of evaluating these upgrading investments and then applies this methodology to evaluate the decision to upgrade a set of selected Texas Plains country elevators. This decision-making methodology is particularly impor- tant to individual grain elevators faced with these investment decisions since numerous interrelated factors must be analyzed.
Since several factors are believed to influence the profitability of elevator upgrading investments, three alternative cases are analyzed to illustrate the use of this decision making procedure. A priori, the magnitude of railroad rate reduc- tions and the size of elevator upgrading investment would affect profitability. Accordingly, combinations of three rail rate reductions (5.0, 7.5, and 10.0 cents) and three elevator upgrading investments (25-, 50-, 75-car loadout capacities) are examined in each case. The first case examines the profitability of upgrading investment under existing or average production levels. In this case, elevators’ per bushel gross margin and the production of the study region are at region averages. Because of the variability in annual grain production, a second case explores the effect of fluctuating production levels on the profitability of upgrading investment. The third case examines the effect of declining gross margins resulting from competitors’ reactions to upgrading investments by the grain handling firm. An upgraded elevator which offers a higher grain price to area farmers may invite retaliatory action from competing elevators. Competing elevators may choose to increase their offering price by lowering their gross margin, which may subse- quently require the upgrading elevator to take similar action. The effect of this altered competitive environment is the subject of the third case.
STUDY REGION
This study focuses on a 90 X 175 mile grain-producing region in the upper portion of the Texas panhandle. Wheat is the principal grain exiting the region and 75 to 95% of the area’s annual wheat production is destined for the ports of Houston and Galveston. Since export movements lend themselves to multicar, point-to-point hauls, the profitability of upgrading investment is based only on anticipated wheat volumes at ten potential multicar loading facilities. This region is generally characterized by a low grain production density; thus assembly of large volumes to a central elevator location will involve an enlarged market area and increased assembly cost.
The study region is located approximately 725 miles from Texas Gulf ports and is served by country elevators in 53 separate cities, 44 of these locations are served by railroads while nine locations have only truck service. The Atchin- son, Topeka and Santa Fe (ATSF), Burlington Northen (BN), Texas North Western (TNW), and Southern Pacific (SP) railroad companies operate in the study area. The ATSF and BN railroads are the area’s principal grain carriers.
UPGRADING GRAIN ELEVATORS 249
Historically, the region’s railroads offered a single-car transit rate which allowed wheat to be shipped from country elevators to Gulf ports on a single-car through- rate that included a stop-over at inland terminals. A grain shipper’s transportation charge on export-destined wheat was not unfavorably affected by transshipment at inland elevator locations; accordingly, substantial volumes moved through these facilities. In 1981, ATSF introduced multicar rates that continued to allow transit at inland terminals. These rates allowed one or more cars to be shipped from a country elevator to a transit station (inland terminal) and reshipped to a port facility in not less than 60-car shipments. More recently, the ATSF has offered several shipment options. One option allows the country elevator to make direct 5-car shipments to p ~ r t elevators, while the second option allows the country elevator to ship one or more cars to a transit station (inland terminal) for reship- ment to a Gulf port elevator in not less than 25-car lots. However, these multicar rates that feature transshipment fail to reflect efficiencies that are available with direct shipments. Hence, significantly lower rates and an attractive return on upgrading investment may exist for firms shipping directly to port facilities in multicar units.
STRUCTURE OF THE MODEL AND THE ANALYTICAL PROCEDURE
The research is carried out in two phases. The initial phase is accomplished with a spatial model that estimates wheat receipts and gross margin revenues at selected upgraded country elevators, as these facilities’ export rail rates are adjusted downward to reflect shipments in multicar units. Because of a high degree of interdependence among grain assembly, handling, and transportation activities, the spatial model represents the entire system. In the second phase, a computerized country elevator budget is employed to calculate return on each elevator’s upgrading investment. For this study, investments are considered fea- sible only for elevators experiencing a 10% or greater return on investments3
The estimate of wheat receipts at the upgraded elevators is based on several assumptions. First, it is assumed that elevators operate in a competitive envi- ronment and the grain price offered to farmers is a reflection of costs incurred in grain handling and transportation of grain to principal markets; i.e., if an elevator’s transportation charge is lowered, the elevator will offer an increased grain price to the farmer. Further, it is assumed that a farmer’s selection of an elevator for grain delivery is based on nearby elevators’ offering prices and delivery costs to respective elevators.
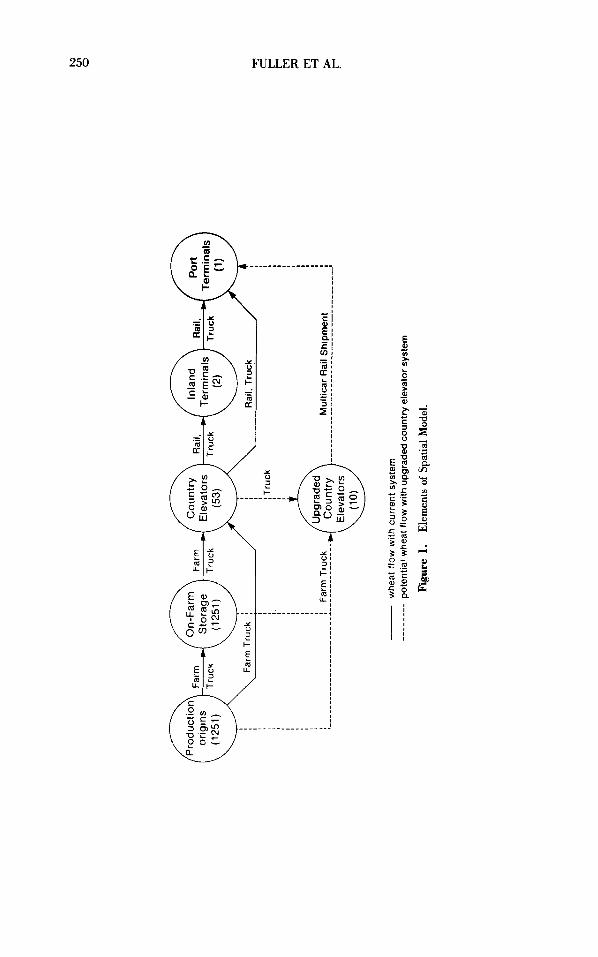
The initial research phase is accomplished with a resource-minimizing network flow model which includes essential elements of the study area’s export wheat marketing system. The model’s principal elements are (1) 1251 production origin’s (farms) grain supplies; (2) 1251 production origin’s farm storage capacities and costs; (3) farmer grain truck assembly rates to area elevators; (4) truck and rail transportation rates that link 53 country elevators, 10 upgraded country elevators, 2 inland terminals and one port terminal; (5) elevator facilities’ grain handling and storage capacities and per bushel gross margins; and (6) export demands. Figure 1 presents the major elements of the spatial model and its associated linkages. A mathematical representation of the model is presented in the Appen- dix.
I I I I Tru
ck
I I
A
Mu
ltic
ar R
ail S
hip
men
t
Ele
vato
rs
I Fa
rm T
ruck
j __
____
____
____
____
____
__ A _
______
______
__ 4
whe
at f
low
with
cur
rent
sys
tem
--
_ - - __
_ po
ten
tial
whe
at f
low
with
upg
rade
d co
un
try
elev
ator
sys
tem
Fig
ure
1.
Ele
men
ts o
f S
pat
ial M
od
el.
UPGRADING GRAIN ELEVATORS 251
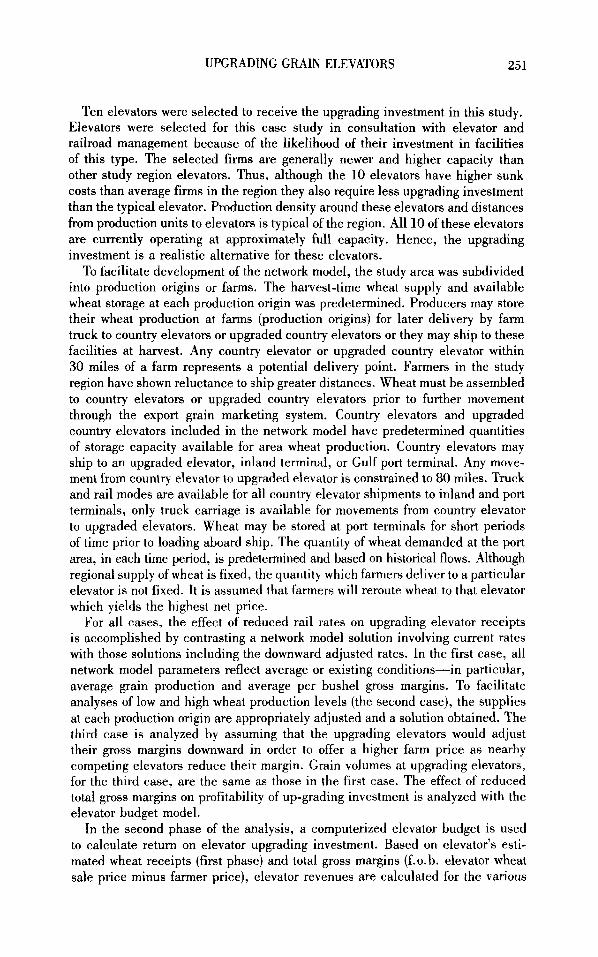
Ten elevators were selected to receive the upgrading investment in this study. Elevators were selected for this case study in consultation with elevator and railroad management because of the likelihood of their investment in facilities of this type. The selected firms are generally newer and higher capacity than other study region elevators. Thus, although the 10 elevators have higher sunk costs than average firms in the region they also require less upgrading investment than the typical elevator. Production density around these elevators and distances from production units to elevators is typical of the region. All 10 of these elevators are currently operating at approximately full capacity. Hence, the upgrading investment is a realistic alternative for these elevators.
To facilitate development of the network model, the study area was subdivided into production origins or farms. The harvest-time wheat supply and available wheat storage at each production origin was predetermined. Producers may store their wheat production at farms (production origins) for later delivery by farm truck to country elevators or upgraded country elevators or they may ship to these facilities at harvest. Any country elevator or upgraded country elevator within 30 miles of a farm represents a potential delivery point. Farmers in the study region have shown reluctance to ship greater distances. Wheat must be assembled to country elevators or upgraded country elevators prior to further movement through the export grain marketing system. Country elevators and upgraded country elevators included in the network model have predetermined quantities of storage capacity available for area wheat production. Country elevators may ship to an upgraded elevator, inland terminal, or Gulf port terminal. Any move- ment from country elevator to upgraded elevator is constrained to 80 miles. Truck and rail modes are available for all country elevator shipments to inland and port terminals, only truck carriage is available for movements from country elevator to upgraded elevators. Wheat may be stored at port terminals for short periods of time prior to loading aboard ship. The quantity of wheat demanded at the port area, in each time period, is predetermined and based on historical flows. Although regional supply of wheat is fixed, the quantity which farmers deliver to a particular elevator is not fixed. It is assumed that farmers will reroute wheat to that elevator which yields the highest net price.
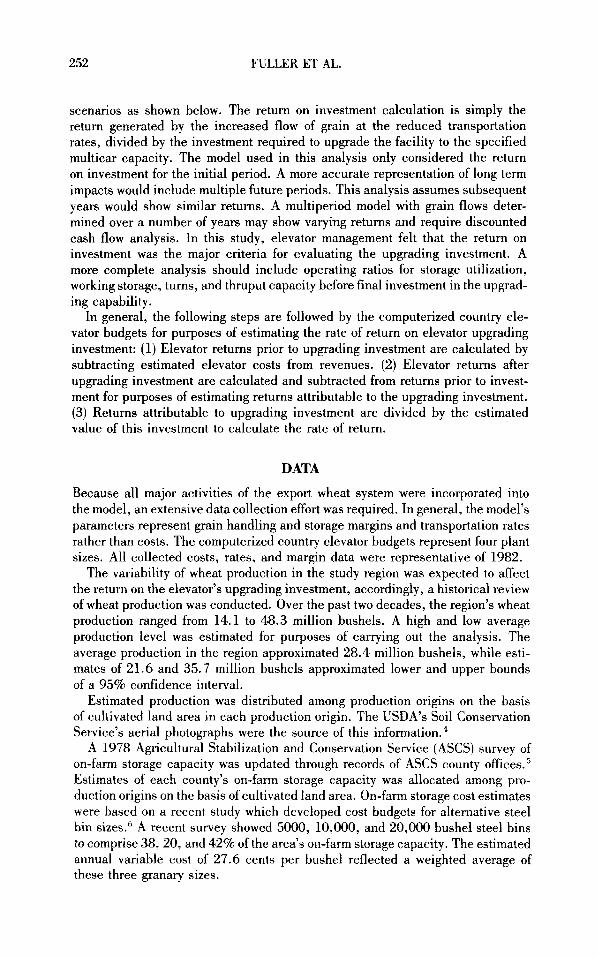
For all cases, the effect of reduced rail rates on upgrading elevator receipts is accomplished by contrasting a network model solution involving current rates with those solutions including the downward adjusted rates. In the first case, all network model parameters reflect average or existing conditions-in particular, average grain production and average per bushel gross margins. To facilitate analyses of low and high wheat production levels (the second case), the supplies at each production origin are appropriately adjusted and a solution obtained. The third case is analyzed by assuming that the upgrading elevators would adjust their gross margins downward in order to offer a higher farm price as nearby competing elevators reduce their margin. Grain volumes at upgrading elevators, for the third case, are the same as those in the first case. The effect of reduced total gross margins on profitability of up-grading investment is analyzed with the elevator budget model.
In the second phase of the analysis, a computerized elevator budget is used to calculate return on elevator upgrading investment. Based on elevator’s esti- mated wheat receipts (first phase) and total gross margins (f.0.b. elevator wheat sale price minus farmer price), elevator revenues are calculated for the various
252 FULLER ET AL.
scenarios as shown below. The return on investment calculation is simply the return generated by the increased flow of grain at the reduced transportation rates, divided by the investment required to upgrade the facility to the specified multicar capacity. The model used in this analysis only considered the return on investment for the initial period. A more accurate representation of long term impacts would include multiple future periods. This analysis assumes subsequent years would show similar returns. A multiperiod model with grain flows deter- mined over a number of years may show varying returns and require discounted cash flow analysis. In this study, elevator management felt that the return on investment was the major criteria for evaluating the upgrading investment. A more complete analysis should include operating ratios for storage utilization, working storage, turns, and thruput capacity before final investment in the upgrad- ing capability.
In general, the following steps are followed by the computerized country ele- vator budgets for purposes of estimating the rate of return on elevator upgrading investment: (1) Elevator returns prior to upgrading investment are calculated by subtracting estimated elevator costs from revenues. (2) Elevator returns after upgrading investment are calculated and subtracted from returns prior to invest- ment for purposes of estimating returns attributable to the upgrading investment. (3) Returns attributable to upgrading investment are divided by the estimated value of this investment to calculate the rate of return.
DATA
Because all major activities of the export wheat system were incorporated into the model, an extensive data collection effort was required. In general, the model’s parameters represent grain handling and storage margins and transportation rates rather than costs. The computerized country elevator budgets represent four plant sizes. All collected costs, rates, and margin data were representative of 1982.
The variability of wheat production in the study region was expected to affect the return on the elevator’s upgrading investment, accordingly, a historical review of wheat production was conducted. Over the past two decades, the region’s wheat production ranged from 14.1 to 48.3 million bushels. A high and low average production level was estimated for purposes of carrying out the analysis. The average production in the region approximated 28.4 million bushels, while esti- mates of 21.6 and 35.7 million bushels approximated lower and upper bounds of a 95% confidence interval.
Estimated production was distributed among production origins on the basis of cultivated land area in each production origin. The USDA’s Soil Conservation Service’s aerial photographs were the source of this inf~rmation.~
A 1978 Agricultural Stabilization and Conservation Service (ASCS) survey of on-farm storage capacity was updated through records of ASCS county offices. Estimates of each county’s on-farm storage capacity was allocated among pro- duction origins on the basis of cultivated land area. On-farm storage cost estimates were based on a recent study which developed cost budgets for alternative steel bin sizes.6 A recent survey showed 5000, 10,000, and 20,000 bushel steel bins to comprise 38’20, and 42% of the area’s on-farm storage capacity. The estimated annual variable cost of 27.6 cents per bushel reflected a weighted average of these three granary sizes.
UPGRADING GRAIN ELEVATORS 253
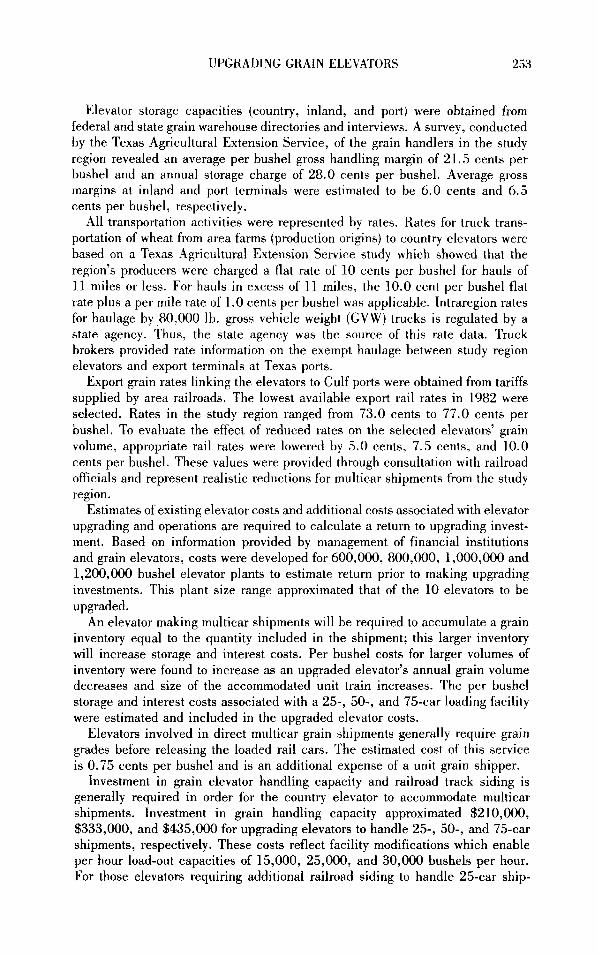
Elevator storage capacities (country, inland, and port) were obtained from federal and state grain warehouse directories and interviews. A survey, conducted by the Texas Agricultural Extension Service, of the grain handlers in the study region revealed an average per bushel gross handling margin of 21.5 cents per bushel and an annual storage charge of 28.0 rents per bushel. Average gross margins at inland and port terminals were estimated to be 6.0 cents and 6.5 cents per bushel, respectively.
All transportation activities were represented by rates. Rates for truck trans- portation of wheat from area farms (production origins) to country elevators were based on a Texas Agricultural Extension Service study which showed that the region’s producers were charged a flat rate of 10 cents per bushel for hauls of 11 miles or less. For hauls in excess of 11 miles, the 10.0 cent per bushel flat rate plus a per mile rate of 1.0 cents per bushel was applicable. Intraregion rates for haulage by 80,000 lb. gross vehicle weight (GVW) trucks is regulated by a state agency. Thus, the state agency was the source of this rate data. Truck brokers provided rate information on the exempt haulage between study region elevators and export terminals at Texas ports.
Export grain rates linking the elevators to Gulf ports were obtained from tariffs supplied by area railroads. The lowest available export rail rates in 1982 were selected. Rates in the study region ranged from 73.0 cents to 77.0 cents per bushel. To evaluate the effect of reduced rates on the selected elevators’ grain volume, appropriate rail rates were lowered by 5.0 cents, 7.5 cents, and 10.0 cents per bushel. These values were provided through consultation with railroad officials and represent realistic reductions for multicar shipments from the study region.
Estimates of existing elevator costs and additional costs associated with elevator upgrading and operations are required to calculate a return to upgrading invest- ment. Based on information provided by management of financial institutions and grain elevators, costs were developed for 600,000, 800,000, 1,000,000 and 1,200,000 bushel elevator plants to estimate return prior to making upgrading investments. This plant size range approximated that of the 10 elevators to be upgraded.
An elevator making multicar shipments will be required to accumulate a grain inventory equal to the quantity included in the shipment; this larger inventory will increase storage and interest costs. Per bushel costs for larger volumes of inventory were found to increase as an upgraded elevator’s annual grain volume decreases and size of the accommodated unit train increases. The per bushel storage and interest costs associated with a 2 5 , 50-, and 75-car loading facility were estimated and included in the upgraded elevator costs.
Elevators involved in direct multicar grain shipments generally require grain grades before releasing the loaded rail cars. The estimated cost of this service is 0.75 cents per bushel and is an additional expense of a unit grain shipper.
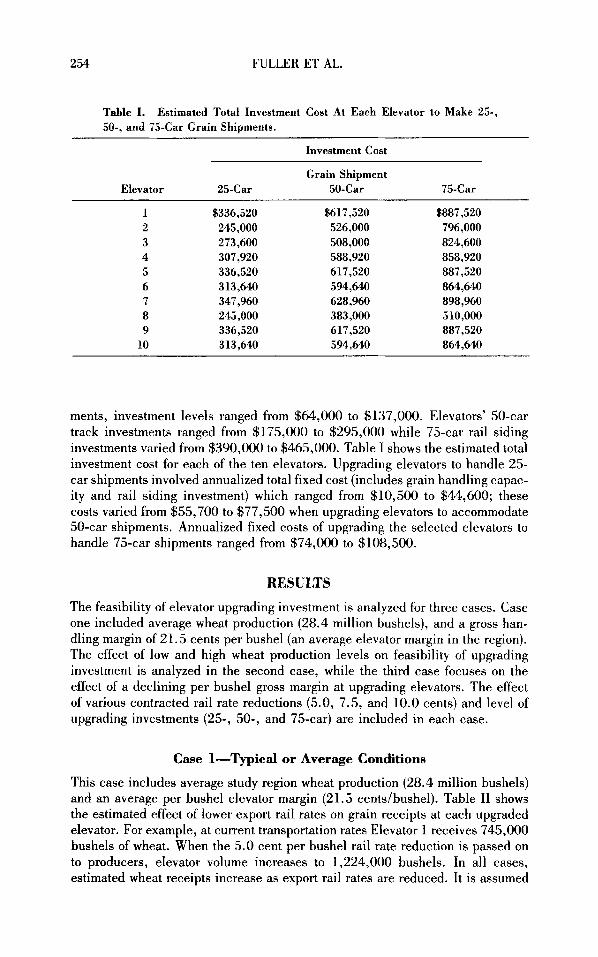
Investment in grain elevator handling capacity and railroad track siding is generally required in order for the country elevator to accommodate multicar shipments. Investment in grain handling capacity approximated $210,000, $333,000, and $435,000 for upgrading elevators to handle 25-, 50-, and 75-car shipments, respectively. These costs reflect facility modifications which enable per hour load-out capacities of 15,000. 25,000, and 30,000 bushels per hour. For those elevators requiring additional railroad siding to handle 25-car ship-
254 FULLER ET AL.
Table I. 50-, and 75-Car Grain Shipments.
Estimated Total Investment Cost At Each Elevator to Make 25-,
Investment Cost
Grain Shipment Elevator 25-Car 50-Car 75-Car
1 $336,520 56 17,520 $887,520 2 245,000 526,000 796,000 3 2 73,600 508,000 824,600 4 307,920 588,920 858,920 5 336,520 617,520 887,520 6 313,640 594,640 864,640 7 347,960 628,960 898,960 8 245,000 383,000 510,000 9 336,520 617,520 887,520
10 313,640 594,640 864,640
ments, investment levels ranged from $64,000 to $137,000. Elevators’ 50-car track investments ranged from $175,000 to $295,000 while 75-car rail siding investments varied from $390,000 to $465,000. Table I shows the estimated total investment cost for each of the ten elevators. Upgrading elevators to handle 25- car shipments involved annualized total fixed cost (includes grain handling capac- ity and rail siding investment) which ranged from $10,500 to $44,600; these costs varied from $55,700 to $77,500 when upgrading elevators to accommodate 50-car shipments. Annualized fixed costs of upgrading the selected elevators to handle 75-car shipments ranged from $74,000 to $108,500.
RESULTS The feasibility of elevator upgrading investment is analyzed for three cases. Case one included average wheat production (28.4 million bushels), and a gross han- dling margin of 21.5 cents per bushel (an average elevator margin in the region). The effect of low and high wheat production levels on feasibility of upgrading investment is analyzed in the second case, while the third case focuses on the effect of a declining per bushel gross margin at upgrading elevators. The effect of various contracted rail rate reductions (5.0, 7.5, and 10.0 cents) and level of upgrading investments (25-, 50-, and 75-car) are included in each case.
Case 1-Typical or Average Conditions
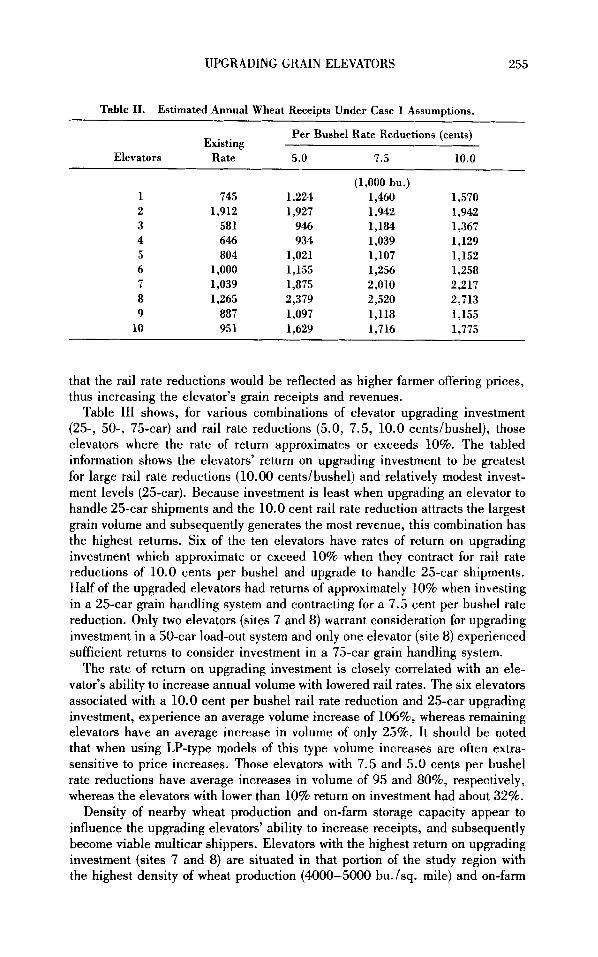
This case includes average study region wheat production (28.4 million bushels) and an average per bushel elevator margin (21.5 centdbushel). Table I1 shows the estimated effect of lower export rail rates on grain receipts at each upgraded elevator. For example, at current transportation rates Elevator 1 receives 745,000 bushels of wheat. When the 5.0 cent per bushel rail rate reduction is passed on to producers, elevator volume increases to 1,224,000 bushels. In all cases, estimated wheat receipts increase as export rail rates are reduced. It is assumed
UPGRADING GRAIN ELEVATORS 255
Table 11. Estimated Annual Wheat Receipts Under Case 1 Assumptions.
Per Bushel Rate Reductions (cents)
Elevators Rate 5.0 7.5 10.0 Existing
(1,000 bu.) 1 745 1,224 1,460 1,570 2 1,912 1,927 1,942 1,942 3 58 1 946 1,184 1,367 4 646 934 1,039 1,129 5 804 1,021 1,107 1,152 6 1,000 1,155 1,256 1,258 7 1,039 1,875 2,010 2,217 8 1,265 2,379 2,520 2,713 9 887 1,097 1,118 1,155
10 951 1,629 1,716 1,775
that the rail rate reductions would be reflected as higher farmer offering prices, thus increasing the elevator’s grain receipts and revenues.
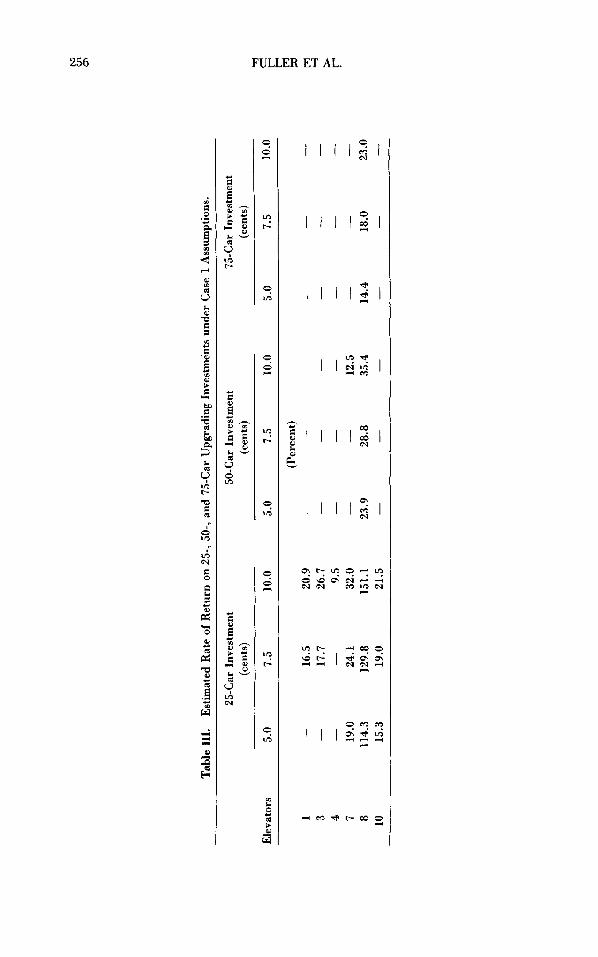
Table I11 shows, for various combinations of elevator upgrading investment (25-, 50-, 75-car) and rail rate reductions (5.0, 7.5, 10.0 cendbushel), those elevators where the rate of return approximates or exceeds 10%. The tabled information shows the elevators’ return on upgrading investment to be greatest for large rail rate reductions (10.00 cents/bushel) and relatively modest invest- ment levels (25-car). Because investment is least when upgrading an elevator to handle 25-car shipments and the 10.0 cent rail rate reduction attracts the largest grain volume and subsequently generates the most revenue, this combination has the highest returns. Six of the ten elevators have rates of return on upgrading investment which approximate or exceed 10% when they contract for rail rate reductions of 10.0 cents per bushel and upgrade to handle 25-car shipments. Half of the upgraded elevators had returns of approximately 10% when investing in a 25-car grain handling system and contracting for a 7.5 cent per bushel rate reduction. Only two elevators (sites 7 and 8) warrant consideration for upgrading investment in a SO-car load-out system and only one elevator (site 8) experienced sufficient returns to consider investment in a 75-car grain handling system.
The rate of return on upgrading investment is closely correlated with an ele- vator’s ability to increase annual volume with lowered rail rates. The six elevators associated with a 10.0 cent per bushel rail rate reduction and 25-car upgrading investment, experience an average volume increase of 106%, whereas remaining elevators have an average increase in volume of only 25%. It should be noted that when using LP-type models of this type volume increases are often extra- sensitive to price increases. Those elevators with 7.5 and 5.0 cents per bushel rate reductions have average increases in volume of 95 and 80%, respectively, whereas the elevators with lower than 10% return on investment had about 32%.
Density of nearby wheat production and on-farm storage capacity appear to influence the upgrading elevators’ ability to increase receipts, and subsequently become viable multicar shippers. Elevators with the highest return on upgrading investment (sites 7 and 8) are situated in that portion of the study region with the highest density of wheat production (4000-5000 bu./sq. mile) and on-farm
Tab
le 1
11.
Est
imat
ed R
ate
of R
etur
n on
25-
, SO
-, an
d 75
-Car
Upg
radi
ng I
nves
tmen
ts u
nder
Cas
e 1 A
ssum
ptio
ns.
75-C
ar I
nves
tmen
t 25
-Car
Inv
estm
ent
50-C
ar I
nves
tmen
t (c
ents
) (c
ents
) (c
ents
)
Ele
vato
rs
5.0
7.5
10.0
5.
0 7.
5 10
.0
5.0
7.5
10.0
(Per
cent
) -
-
-
-
-
-
1
-
16.5
20
.9
3 -
17.7
26
.7
9.5
4 7 19
.0
24.1
32
.O
8 11
4.3
129.
8 15
1.1
23.9
28
.8
35.4
14
.4
18.0
23
.0
10
15.3
19
.0
21.5
-
-
-
-
-
-
-
-
-
-
-
-
-
-
-
-
-
-
12.5
-
-
-
-
-
-
-
UPGRADING GRAIN ELEVATORS 257
storage capacity (2700-4000 bu. /sq. mile). Grain volumes at these elevators increase an average of 84, 96, and 113% with rate reductions of 5.0, 7.5, and 10.0 cents per bushel, respectively. Wheat production density at most remaining sites range from about 2000 to 3500 bushels per square mile. Profitability of upgrading remaining sites seems to be closely related to on-farm storage capacity. Sites 3, 4, 5, and 6 have a similar density of nearby wheat production; however, only sites 3 and 4 are feasible and this is due to the relatively large on-farm storage capacity (3200 bu./sq. mile). On-farm storage capacity near sites 5 and 6 averaged about 1000 bushels per square mile. The model solution shows all upgraded elevators to fill at harvest and, because a system of satellite elevators does not evolve, all additional receipts come from on-farm storage.
The very high rate of return to upgrading investment at elevator 8 is, in part, attributable to its modest need for upgrading investment. The annualized upgrad- ing cost of this location ($10,500) is about one-fourth that of most upgrading elevators. In spite of the small upgrading investment and high rate of return at elevator 8, there does not appear to be, in general, a close correlation between level of upgrading investment and rates of return above 10%. For example, elevator 7 has the highest annualized cost ($44,600) but has relatively high returns to upgrading investment, whereas elevator 2 has the second lowest annu- alized cost ($35,000) but shows less than a 10% return at any combination of rate reduction and investment level.
Case 2-Low and High Wheat Production Levels
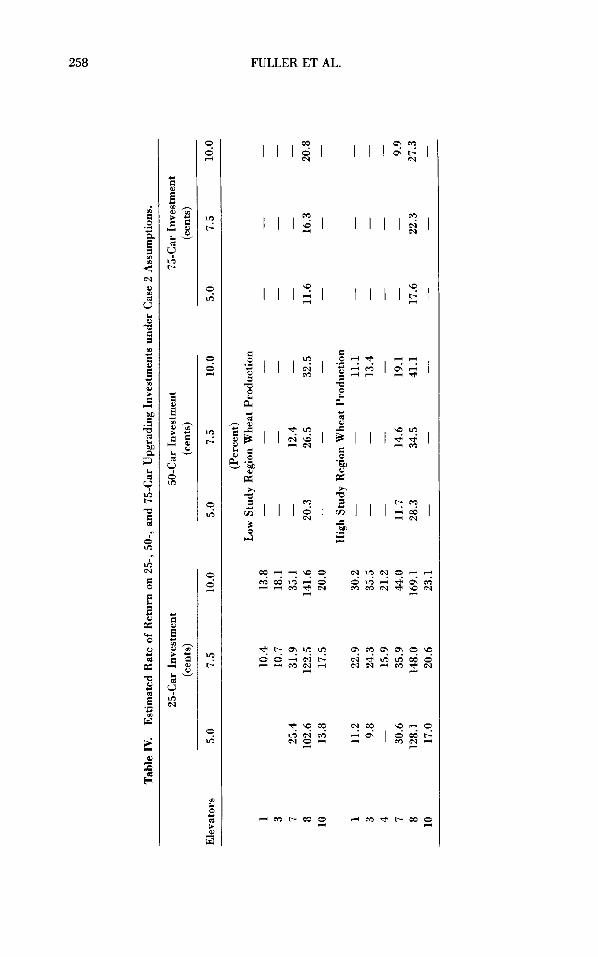
Case 2 is designed to identify the effect of variable annual wheat production on returns to upgrading investment. In this case, all variables except the wheat production level are as in Case 1. Rates of return to upgrading investment are calculated at low and high production levels of 21.6 and 35.7 million bushels, respectively (Table IV).
Elevators that exhibited returns greater than 10% at the average production level generally also yielded an acceptable rate of return at low and high production levels. However, some combinations of investments ( 2 5 , 50-, or 75-car) and rate reductions (5.0, 7.5, and 10.0 cents) showed higher returns at increased production levels.
Case 3-Declining Gross Margin at Upgrading Elevator
An upgrading elevator which offers increased farmer prices may generate retal- iatory action from competing elevators. Competing elevators may reduce their margin in order to offer higher prices, thus affecting the upgrading elevator’s ability to attract the increased volume and simultaneously maintain the 21.5 cent per bushel gross margin. Analysis in this case is based on the assumption that the upgrading elevator will meet competition by lowering its margin in order to retain its volume. That is, competition is met by lowering its gross margin and retaining the original volume rather than maintaining the 21.5 cent per bushel margin and subsequently reducing annual wheat receipts.
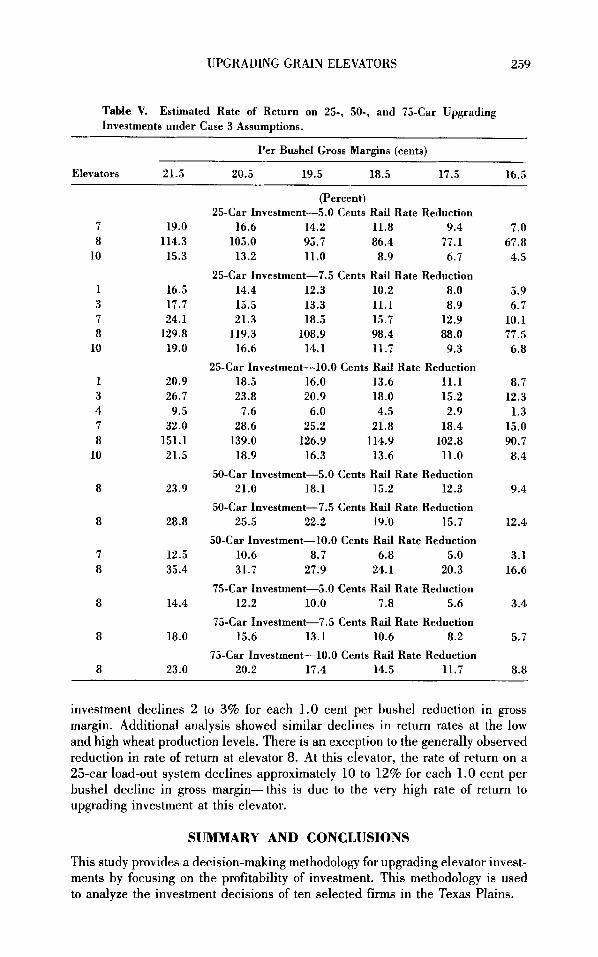
Table V shows the effect of a declining gross margin on returns to upgrading investment when wheat production approximates the historical average (28.4 million bushels). Results reveal the expected negative effect of a declining gross margin on upgrading elevator returns. In general, the rate of return to upgrading
Tab
le IV
. E
stim
ated
Rat
e of
Ret
urn
on 2
5-, 5
0-, a
nd 7
5-C
ar U
pgra
ding
Inv
estm
ents
und
er C
ase
2 A
ssum
ptio
ns.
25-C
ar I
nves
tmen
t 50
-Car
Inv
estm
ent
75-C
ar I
nves
tmen
t (c
ents
) (c
ents
) (c
ents
)
Ele
vato
rs
5.0
7.5
10.0
5.
0 7.
5 10
.0
5.0
7.5
10.0
(Per
cent
) L
ow S
tudy
Reg
ion
Whe
at P
rodu
ctio
n -
-
-
-
-
__
1 10
.4
13.8
3
10.7
18
.1
-
7 25
.4
31.9
35
.1
-
12.4
8
102.
6 12
2.5
141.
6 20
.3
26.5
32
.5
11.6
16
.3
20.8
-
-
-
-
-
-
-
-
-
-
-
-
-
-
-
10
13.8
17
.5
20.0
Hig
h St
udy
Reg
ion
Whe
at P
rodu
ctio
n -
-
-
-
11.1
-
-
13.4
1
11.2
22
.9
30.2
3
9.8
24.3
35
.5
-
4 15
.9
21.2
-
7 30
.6
35.9
44.0
11.7
14
.6
19.1
-
-
9.9
8 12
8.1
148.
0 16
9.1
28.3
34
.5
41.1
17
.6
22.3
27
.3
-
-
-
-
-
-
-
-
-
-
-
-
-
-
10
17.0
20
.6
23.1
-
UPGRADING GRAIN ELEVATORS 259
Table V. Investments under Case 3 Assumptions.
Estimated Rate of Return on 25-, 50-, and 75-Car Upgrading
Per Bushel Gross Margins (cents) ~~
EIevators 21.5 20.5 19.5 18.5 17.5 16.5
7 19.0 8 114.3
10 15.3
1 16.5 3 17.7 7 24.1 8 129.8
10 19.0
1 20.9 3 26.7 4 9.5 7 32.0 8 151.1
10 21.5
8 23.9
8 28.8
7 12.5 8 35.4
8 14.4
8 18.0
8 23.0
(Percent) 25-Car Investment-5.0 Cents Rail Rate Reduction
16.6 14.2 11.8 9.4 105.0 95.7 86.4 77.1 13.2 11.0 8.9 6.7
14.4 12.3 10.2 8.0 15.5 13.3 11.1 8.9 21.3 18.5 15.7 12.9
119.3 108.9 98.4 88.0 16.6 14.1 11.7 9.3
18.5 16.0 13.6 11.1 23.8 20.9 18.0 15.2 7.6 6.0 4.5 2.9
28.6 25.2 21.8 18.4 139.0 126.9 114.9 102.8 18.9 16.3 13.6 11.0
21.0 18.1 15.2 12.3
25-Car Investment-7.5 Cents Rail Rate Reduction
25-Car Investment-10.0 Cents Rail Rate Reduction
50-Car Investment-5.0 Cents Rail Rate Reduction
50-Car Investment-7.5 Cents Rail Rate Reduction 25.5 22.2 19.0 15.7
50-Car Investment-10.0 Cents Rail Rate Reduction 10.6 8.7 6.8 5.0 31.7 27.9 24.1 20.3
75-Car Investment-5.0 Cents Rail Rate Reduction 12.2 10.0 7.8 5.6
75-Car Investment-7.5 Cents Rail Rate Reduction 15.6 13.1 10.6 8.2
75-Car Investment-10.0 Cents Rail Rate Reduction 20.2 17.4 14.5 11.7
7.0 67.8 4.5
5.9 6.7
10.1 77.5 6.8
8.7 12.3 1.3
15.0 90.7 8.4
9.4
12.4
3.1 16.6
3.4
5.7
8.8
investment declines 2 to 3% for each 1.0 cent per bushel reduction in gross margin. Additional analysis showed similar declines in return rates at the low and high wheat production levels. There is an exception to the generally observed reduction in rate of return at elevator 8. At this elevator, the rate of return on a 25-car load-out system declines approximately 10 to 12% for each 1.0 cent per bushel decline in gross margin-this is due to the very high rate of return to upgrading investment at this elevator.
SUMMARY AND CONCLUSIONS
This study provides a decision-making methodology for upgrading elevator invest- ments by focusing on the profitability of investment. This methodology is used to analyze the investment decisions of ten selected firms in the Texas Plains.
260 FULLER ET AL.
The principal findings of this case study for selected elevators include: (1) Return to upgrading investment is greatest with large rate reductions (10.0
cents/bushel) and relatively small investments (25-car upgrading investments). Six of the elevators studied warrant 25-car upgrading investments when it is associated with a 10.0 cent per bushel rate reduction. Few elevators are likely candidates for upgrading to handle 25-car shipments with a 5.0 cent per bushel rate reduction. Similarly, few elevators warrant investment in 50- or 75-car grain handling systems with a 10.0 cent per bushel or less rate reduction.
(2) Return to upgrading investment is closely correlated with an elevator’s ability to increase annual volume with lowered rail rates. The six elevators with returns greater than lo%, associated with a 10.0 cent per bushel rail rate reduc- tion and 25-car upgrading investment, experience an average volume increase of 106%, whereas, remaining elevators have an average volume increase of only 25%. Density of nearby grain production and on-farm storage capacity appears to affect the ability of an elevator to increase revenues through lowered rail rates. Elevators with the highest return to upgrading investment are situated in that portion of the study region with the highest density of grain production (5000/ bu. /square mile) and on-farm storage capacity ( + 2700 bu. /sq. mile).
(3) Post-harvest receipts of wheat at upgraded elevators comes from on-farm storage; consequently, sufficient on-farm storage is a prerequisite for the success of a potential multicar grain shipper. Elevators considering investments must survey local farmers to be sure sufficient on-farm storage capacity is available. Based on parameters used in this analysis, there would not be a system of satellite elevators which ship to the upgraded facilities.
(4) Those elevators which generate sufficient returns to upgrading investment at the average production level, provide generally acceptable returns at low and high levels of wheat production. In general, increases in the region’s production level will increase return on upgrading investment; however, no additional ele- vator sites became likely candidates for upgrading at the high production level.
(5) Declining elevator margins unfavorably affect return on upgrading invest- ment. Generally, the rate of return declines 2 to 3 percentage points with each 1.0 cent per bushel reduction in margins.
APPENDIX A
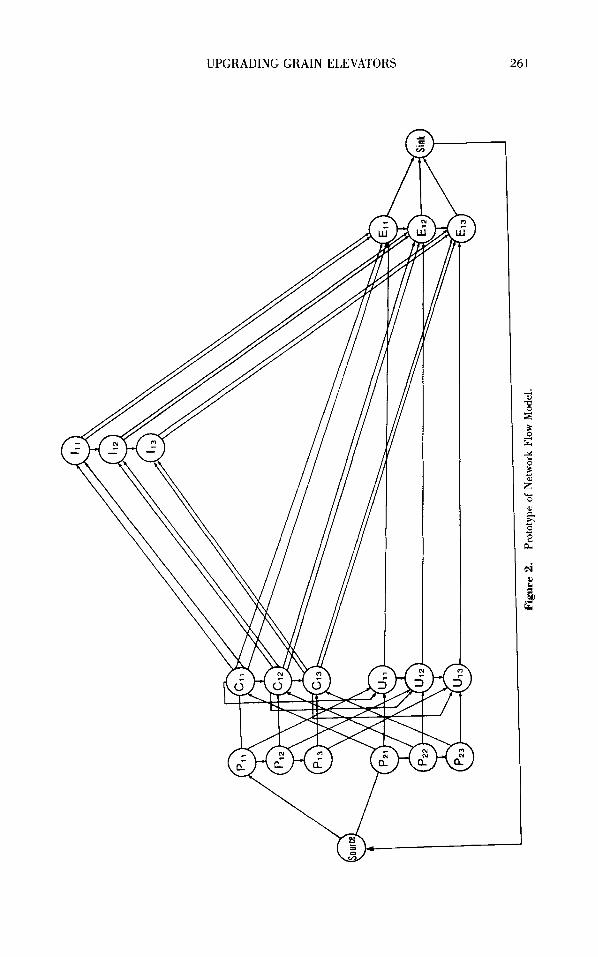
To provide insight into the structure of the network flow model, a prototype is presented. A network model is constructed of nodes representing elements of the system-these include production origins or farms, country elevators, upgraded country elevators, inland terminals, and port terminals. The arcs which connect nodes include information regarding upper and lower bounds on the arc flow and the unit cost of the flow.
The prototype model includes two production origins (P = 2), one country elevator (C = l), one upgraded elevator (17 = l), one inland terminal (I = l), and one port terminal ( E = 1). It also includes two time periods (T = 2) (Figure 2) which are represented through three points in time. The nodes of the network are defined as follows:
Pzk: represents production location i at point k in time
i = 1,2, . . . ,P
k = 1 , 2 , . . . ,T + 1
UPGRADING GRAIN ELEVATORS 261
262 FULLER ET AL.
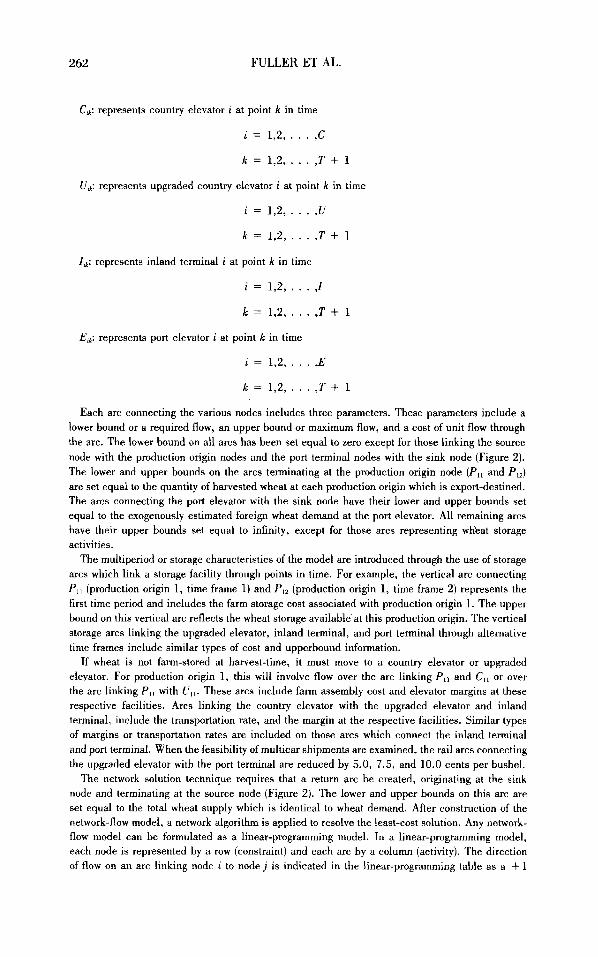
C,: represents country elevator i at point k in time
i = 1,2, . . . ,c k = 1 , 2 , . . . ,T + 1
Uk: represents upgraded country elevator i at point k in time
i = 1,2, . . . ,u
k = 1.2, . . . ,T + 1
I,: represents inland terminal i at point k in time
i = 1,2, * . . ,I
k = 1,2, . . . ,T + 1
E,k: represents port elevator i at point k in time
i = 1,2, . . . ,E
k = 1 , 2 , . . . ,T + 1
Each arc connecting the various nodes includes three parameters. These parameters include a lower bound or a required flow, an upper bound or maximum flow, and a cost of unit flow through the arc. The lower bound on all arcs has been set equal to zero except for those linking the source node with the production origin nodes and the port terminal nodes with the sink node (Figure 2). The lower and upper bounds on the arcs terminating at the production origin node (PI, and P12) are set equal to the quantity of harvested wheat at each production origin which is export-destined. The arcs connecting the port elevator with the sink node have their lower and upper bounds set equal to the exogenously estimated foreign wheat demand at the port elevator. All remaining arcs have their upper bounds set equal to infinity, except for those arcs representing wh'eat storage activities.
The multiperiod or storage characteristics of the model are introduced through the use of storage arcs which link a storage facility through points in time. For example, the vertical arc connecting P,, (production origin 1, time frame 1) and PI, (production origin 1, time frame 2) represents the first time period and includes the farm storage cost associated with production origin 1. The upper bound on this vertical arc reflects the wheat storage available at this production origin. The vertical storage arcs linking the upgraded elevator, inland terminal, and port terminal through alternative time frames include similar types of cost and upperbound information.
If wheat is not farm-stored at harvest-time, it must move to a country elevator or upgraded elevator. For production origin 1, this will involve flow over the arc linking Pll and C,, or over the arc linking P, , with Lrl1. These arcs include farm assembly cost and elevator margins at these respective facilities. Arcs linking the country elevator with the upgraded elevator and inland terminal, include the transportation rate, and the margin at the respective facilities. Similar types of margins or transportation rates are included on those arcs which connect the inland terminal and port terminal. When the feasibility of multicar shipments are examined, the rail arcs connecting the upgraded elevator with the port terminal are reduced by 5.0, 7.5, and 10.0 cents per bushel.
The network solution technique requires that a return arc be created, originating at the sink node and terminating at the source node (Figure 2). The lower and upper bounds on this arc are set equal to the total wheat supply which is identical to wheat demand. After construction of the network-flow model, a network algorithm is applied to resolve the least-cost solution. Any network- flow model can be formulated as a linear-programming model. In a linear-programming model, each node is represented by a row (constraint) and each arc by a column (activity). The direction of flow on an arc linking node i to node j is indicated in the linear-programming table as a + 1
UPGRADING GRAIN ELEVATORS 263
coefficient in the row for node i and a - 1 coefficient in the row for node j. Linear-programming and network-flow models yield identical least-cost solutions.
REFERENCES
1. M. A. Johnson, R. C. Brooks, and T. E. Nichols, Jr., Contracting Rail Freight Servicesfor Poultry Feed Ingredients Moving to the South. Economics Information Rep. No. 68, Department of Economics and Business, North Carolina State University, Raleigh, NC, November 1982.
2. M. A. Johnson and L. 0. Sorenson, Contracting for Railroad Freight Service, Western Rural Development Center, Rep. No. 17, January 1983.
3. S. Fuller, Contracting Rail Freight Services for Country Elevators in the Texas Panhandle, Texas Agricultural Experiment Station, B-1473, June 1984.
4. US Department of Agriculture, County Soil Suruey Maps, Soil Conservation Service and Texas Agricultural Experiment Station, 1970.
5. US Department of Agriculture, Grain Storage Capacity Survey, Agricultural Stabilization and Conservation Service, October 1978.
6. C. D. Davis and R. L. Oerhrtman, “The Costs of On-Farm Storage for Wheat in Oklahoma,” unpublished manuscript, Oklahoma State University, 1981.