updrs tracking using linear regression and neural network for parkinson’s disease prediction
TRANSCRIPT
7/26/2019 UPDRS tracking using linear regression and neural network for Parkinson’s disease prediction
http://slidepdf.com/reader/full/updrs-tracking-using-linear-regression-and-neural-network-for-parkinsons 1/5
International Journal of EmergingTrends & Technology in Computer Science(IJETTCS)Web Site: www.ijettcs.org Email: [email protected]
Volume 4, Issue 6, November - December 2015 ISSN 2278-6856
Volume 4, Issue 6, November – December 2015 Page 189
AbstractThe Unified Parkinson’s Disease Rating Scale (UPDRS) is
often used to track Parkinson's disease (PD) but it requires
costly and logistically inconvenient for patient and clinical
staff. In this work we present clinically useful accuracy
replication of UPDRS, so we can classify the disease’s severity
of the patients with, and predict the evolution of PD based on
those results. We map the features extracted from the speech
to UPDRS using Least-squares regression technique and
neural network. We applied our techniques on large database
of PD speech (~6,000 recordings from 42PD patients). And we
compare our results with state of the art.
Keywords: UPDRS tracking, Parkinson disease, linear
regression, neural network.
1. INTRODUCTION
Neurological disorders affect people and claim lives at
worldwide rate. Parkinson’s disease (PD) is the second
most common neurodegenerative disorder afterAlzheimer’s [1], because the population is growing older
we expected to increase [2]. PD prevalence in men is
greater than women and the lifetime risk [3] [4],
considering current global average life expectancy, is
estimated to be 4.4% (men) and 3.7% (women) [5]. Aging
is associated with a number of detrimental effects on a
person‘s health impinging on, amongst others, the
nervous system. In fact, all studies suggest age is the
single most important risk factor for the onset of PD,
which increases steeply after age 50.
Speech disorders have been linked to PD [6] [7] [8], and
with PD progression there is strong supporting evidence ofdegrading voice performance [9] [10]. Differentiating
PWP (People with Parkinson) from healthy controls using
speech has attracted interest in the research community
[9] [11] [12] [13]. In this study we extend this concept to
map the severity of voice-based PD symptoms to the
Unified Parkinson’s Disease Rating Scale (UPDRS).
Recent studies have raised the important topic of finding a
statistical mapping between speech properties and UPDRS
as an issue worthy of further investigation, but have not
addressed it explicitly [14] [15]. The first studies that uses
this concept to leads to clinically useful UPDRS
estimation, and demonstrate remote PD monitoring was
made by [16], which we took as reference to compare our
results.
2. METHODS
The At-Home Testing Device (AHTD) database was
described in [10], it is a novel telemonitoring device built
by Intel Corporation for collecting data from PWP. The
data [13] is collected at the patient’s home, transmittedover the internet, and processed appropriately in the clinic
to predict the UPDRS score. The description of the system
used for recording can be found detailed in [16].
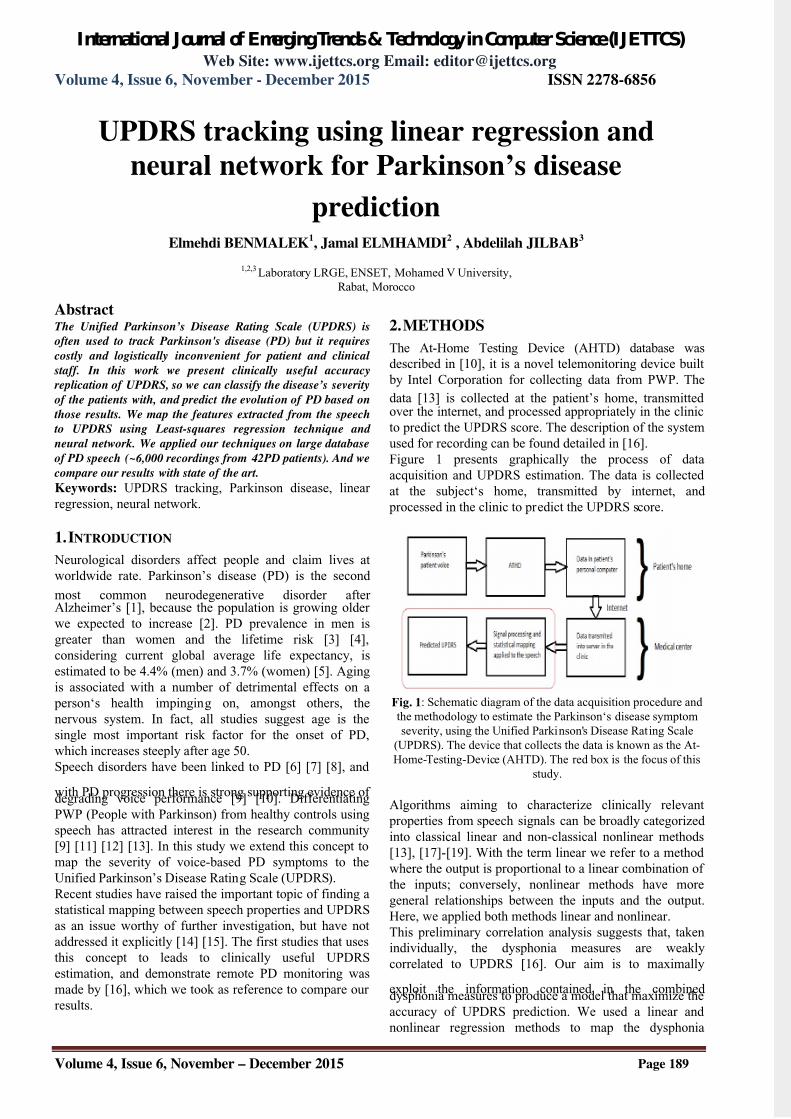
Figure 1 presents graphically the process of data
acquisition and UPDRS estimation. The data is collected
at the subject‘s home, transmitted by internet, and
processed in the clinic to predict the UPDRS score.
Fig. 1: Schematic diagram of the data acquisition procedure and
the methodology to estimate the Parkinson‘s disease symptom
severity, using the Unified Parkinson's Disease Rating Scale
(UPDRS). The device that collects the data is known as the At-
Home-Testing-Device (AHTD). The red box is the focus of this
study.
Algorithms aiming to characterize clinically relevant
properties from speech signals can be broadly categorized
into classical linear and non-classical nonlinear methods
[13], [17]-[19]. With the term linear we refer to a method
where the output is proportional to a linear combination of
the inputs; conversely, nonlinear methods have more
general relationships between the inputs and the output.
Here, we applied both methods linear and nonlinear.
This preliminary correlation analysis suggests that, taken
individually, the dysphonia measures are weakly
correlated to UPDRS [16]. Our aim is to maximally
exploit the information contained in the combineddysphonia measures to produce a model that maximize the
accuracy of UPDRS prediction. We used a linear and
nonlinear regression methods to map the dysphonia
UPDRS tracking using linear regression and
neural network for Parkinson’s disease
predictionElmehdi BENMALEK
1, Jamal ELMHAMDI
2 , Abdelilah JILBAB
3
1,2,3 Laboratory LRGE, ENSET, Mohamed V University,
Rabat, Morocco

7/26/2019 UPDRS tracking using linear regression and neural network for Parkinson’s disease prediction
http://slidepdf.com/reader/full/updrs-tracking-using-linear-regression-and-neural-network-for-parkinsons 2/5
International Journal of EmergingTrends & Technology in Computer Science(IJETTCS)Web Site: www.ijettcs.org Email: [email protected]
Volume 4, Issue 6, November - December 2015 ISSN 2278-6856
Volume 4, Issue 6, November – December 2015 Page 190
measures to interpolated UPDRS values, and compared
their predictive performance. Linear regression methods
assume that the regression function f(x) = y which maps
the dysphonia measures x=(x1….xM) where M is the
number of inputs to the UPDRS output y.
The linear techniques used were classical least squares(LS), and reduced model of input entries based on
correlation described later. LS determines the coefficients
b that minimize the residual sum of squares between the
actual UPDRS and the predicted one. A problem often
encountered in such regression methods when using a
large number of input variables (16 in this case) is the
curse of dimensionality: fewer input variables could
potentially lead to a simpler model with more accurate
prediction. Research has shown that many of the
dysphonia measures are highly correlated (Table 1), so we
can assume that taken together, highly correlated
measures contribute little additional information for
UPDRS prediction. Following the general principle of
parsimony, we would like to reduce the number of
measures in the analysis and still obtain accurate UPDRS
prediction. It may well be the case that the dysphonia
measures do not combine linearly to predict the UPDRS.
Thus, nonlinear regression may be required, where the
prediction function f(x) is a nonlinear combination of the
inputs x. To test this idea, we used a neural network that
updates weight and bias values according to Levenberg-
Marquardt optimization [20] [21]. Validation vectors are
used to stop training early if the network performance on
the validation vectors fails to improve or remains the samefor epochs in a row. Test vectors are used as a further
check that the network is generalizing well, but do not
have any effect on training.
3 RESULTS
The exploration of the data is done by computing the
relevance of speech features to UPDRS. Speech appears
explicitly in two sections of the UPDRS, which can be
combined to form the ‘speech-UPDRS’ quantity indicating
strong association between speech and UPDRS [22]
3.1
Linear regression
Table 1 presents the Spearman rank-correlation between
all the dysphonia measures. All measures were
significantly correlated. We used those results to test
linear regression with reduced entries.
Table 1: The correlation columns are the Spearman non- parametric correlation coefficients ρ between two measures.
Bold italic entries indicate high correlation between measures (Spearman ρ ≥ 0.95).
Jitter
(%)
Jitter
(Abs)
Jitter
RAP'
Jitter
PPQ
5
Jitter
DDP
Shim
mer
Shim
mer
(dB)
Shim
mer
(AP
Q3')
Shim
mer
(AP
Q5')
Shim
mer
(APQ
11')
Shim
mer
(DD
A')
NHR
'
HNR
'
RPD
E
DFA
Jitter
(Abs)
0.86
Jitter:
RAP'0.98 0.84
Jitter:
PPQ50.97 0.79 0.95
Jitter:
DDP'0.98 0.84 1.00 0.95
Shimmer' 0.71 0.65 0.68 0.73 0.68
17
Shimmer
(dB
0.72 0.65 0.68 0.73 0.69 0.99
Shimmer:APQ3' 0.66 0.62 0.65 0.68 0.65 0.98 0.97
Shimmer:
APQ5'
0.69 0.62 0.66 0.73 0.66 0.98 0.98 0.96
Shimmer:
APQ11'
0.64 0.59 0.60 0.67 0.60 0.93
55
0.93 0.88 0.94
Shimmer:
DDA'
0.66 0.62 0.65 0.68 0.65 0.98 0.97 1.00 0.96 0.88
NHR' 0.82 0.70 0.79 0.86 0.79 0.80 0.80 0.73 0.78 0.71 0.73
HNR' -0.67 -0.71 -0.64 -0.66 -0.64 -0.80 -0.80 -0.78 -0.79 -0.78 -0.78 -0.68
RPDE' 0.43 0.55 0.38 0.38 0.33 0.47 0.47 0.44 0.45 0.48 0.44 0.42 -0.76
DFA' 0.23 0.35 0.21 0.17 0.21 0.13 0.12 0.13 0.13 0.18 0.13 -0.02 -0.66 0.19
PPE' 0.72 0.79 0.67 0.66 0.67 0.61 0.63 0.58 0.59 0.62 0.58 0.56 -0.29 0.57 0.39
7/26/2019 UPDRS tracking using linear regression and neural network for Parkinson’s disease prediction
http://slidepdf.com/reader/full/updrs-tracking-using-linear-regression-and-neural-network-for-parkinsons 3/5
International Journal of EmergingTrends & Technology in Computer Science(IJETTCS)Web Site: www.ijettcs.org Email: [email protected]
Volume 4, Issue 6, November - December 2015 ISSN 2278-6856
Volume 4, Issue 6, November – December 2015 Page 191
Table 2 presents the regression coefficient values
calculated for the linear predictionof the all dysphonia
measures of one patient.
Table 2: the regression coefficient of the all dysphonia
measures of one patient.Features Coefficients de
regression
Jitter (%) -3634,28807802494
Jitter(Abs) 405670,165940963
Jitter:RAP’ -223528,509994944
Jitter:PPQ5 -3643,97032029276
Jitter:DDP’ 75818,6481002305
Shimmer’ -202,797380135604
Shimmer(dB -24,9750730850773
Shimmer:APQ3’ -181446,156909467
Shimmer:APQ5’ -348,077989534102Shimmer:APQ11
’
563,319185452980
Shimmer:DDA’ 60652,7486077727
NHR’ 78,1328439682353
HNR’ 0,398658012743896
RPDE’ -23,9436557355571
DFA’ 50,4107770136425
PPE’ 35,3679900585830
3.2Neural network
The type of the neural network used is a feedforward
neural network, which is an artificial neural
network where connections between the units do not forma directed cycle. This is different fromrecurrent neural
networks. In this network, the information moves in only
one direction, forward, from the input nodes, through the
hidden nodes and to the output nodes. There are no cycles
or loops in the network.For the prediction by neural
network the input vectors and target vectors will be
randomly divided into three sets as follows: 75% for
training, 15% will be used to validate that the network is
generalizing and to stop training before overfitting, the
last 10% will be used as a completely independent test of
network generalization, for the hidden neurons we used
25.
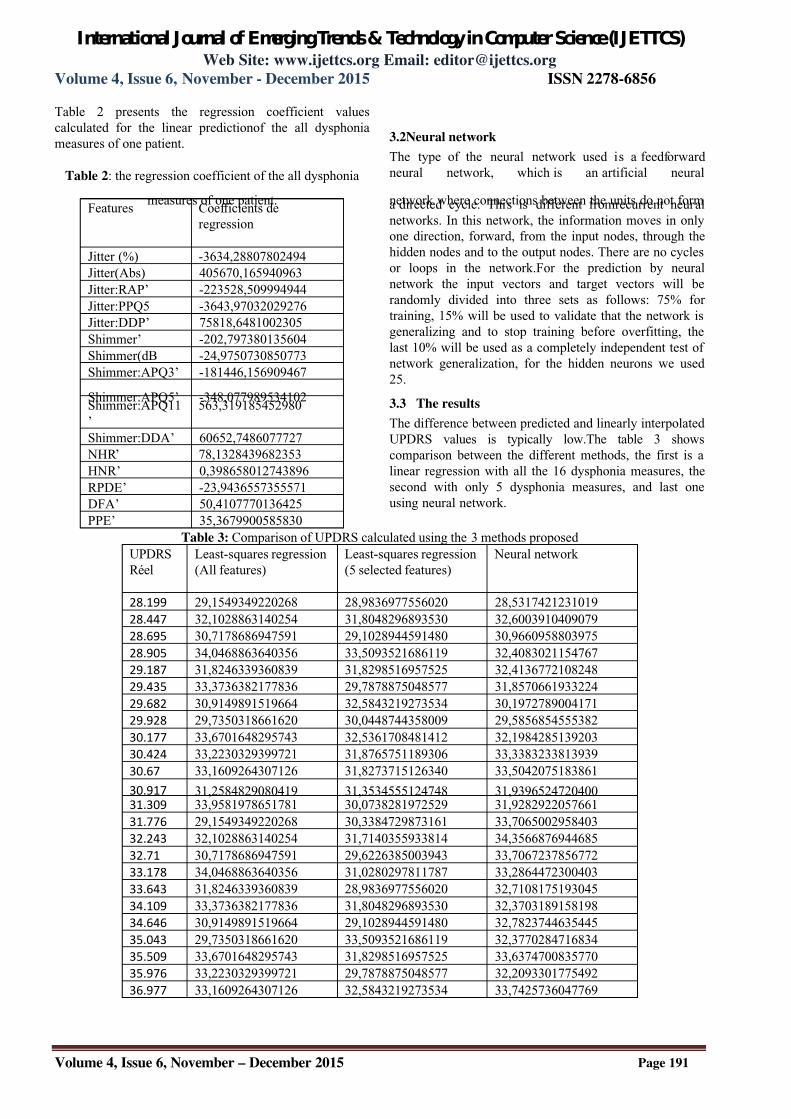
3.3 The results
The difference between predicted and linearly interpolated
UPDRS values is typically low.The table 3 shows
comparison between the different methods, the first is a
linear regression with all the 16 dysphonia measures, the
second with only 5 dysphonia measures, and last one
using neural network.
Table 3: Comparison of UPDRS calculated using the 3 methods proposed
UPDRS
Réel
Least-squares regression
(All features)
Least-squares regression
(5 selected features)
Neural network
28.199 29,1549349220268 28,9836977556020 28,5317421231019
28.447 32,1028863140254 31,8048296893530 32,6003910409079
28.695 30,7178686947591 29,1028944591480 30,9660958803975
28.905 34,0468863640356 33,5093521686119 32,4083021154767
29.187 31,8246339360839 31,8298516957525 32,4136772108248
29.435 33,3736382177836 29,7878875048577 31,8570661933224
29.682 30,9149891519664 32,5843219273534 30,1972789004171
29.928 29,7350318661620 30,0448744358009 29,5856854555382
30.177 33,6701648295743 32,5361708481412 32,1984285139203
30.424 33,2230329399721 31,8765751189306 33,3383233813939
30.67 33,1609264307126 31,8273715126340 33,5042075183861
30.917 31,2584829080419 31,3534555124748 31,939652472040031.309 33,9581978651781 30,0738281972529 31,9282922057661
31.776 29,1549349220268 30,3384729873161 33,7065002958403
32.243 32,1028863140254 31,7140355933814 34,3566876944685
32.71 30,7178686947591 29,6226385003943 33,7067237856772
33.178 34,0468863640356 31,0280297811787 33,2864472300403
33.643 31,8246339360839 28,9836977556020 32,7108175193045
34.109 33,3736382177836 31,8048296893530 32,3703189158198
34.646 30,9149891519664 29,1028944591480 32,7823744635445
35.043 29,7350318661620 33,5093521686119 32,3770284716834
35.509 33,6701648295743 31,8298516957525 33,6374700835770
35.976 33,2230329399721 29,7878875048577 32,2093301775492
36.977 33,1609264307126 32,5843219273534 33,7425736047769
7/26/2019 UPDRS tracking using linear regression and neural network for Parkinson’s disease prediction
http://slidepdf.com/reader/full/updrs-tracking-using-linear-regression-and-neural-network-for-parkinsons 4/5
International Journal of EmergingTrends & Technology in Computer Science(IJETTCS)Web Site: www.ijettcs.org Email: [email protected]
Volume 4, Issue 6, November - December 2015 ISSN 2278-6856
Volume 4, Issue 6, November – December 2015 Page 192
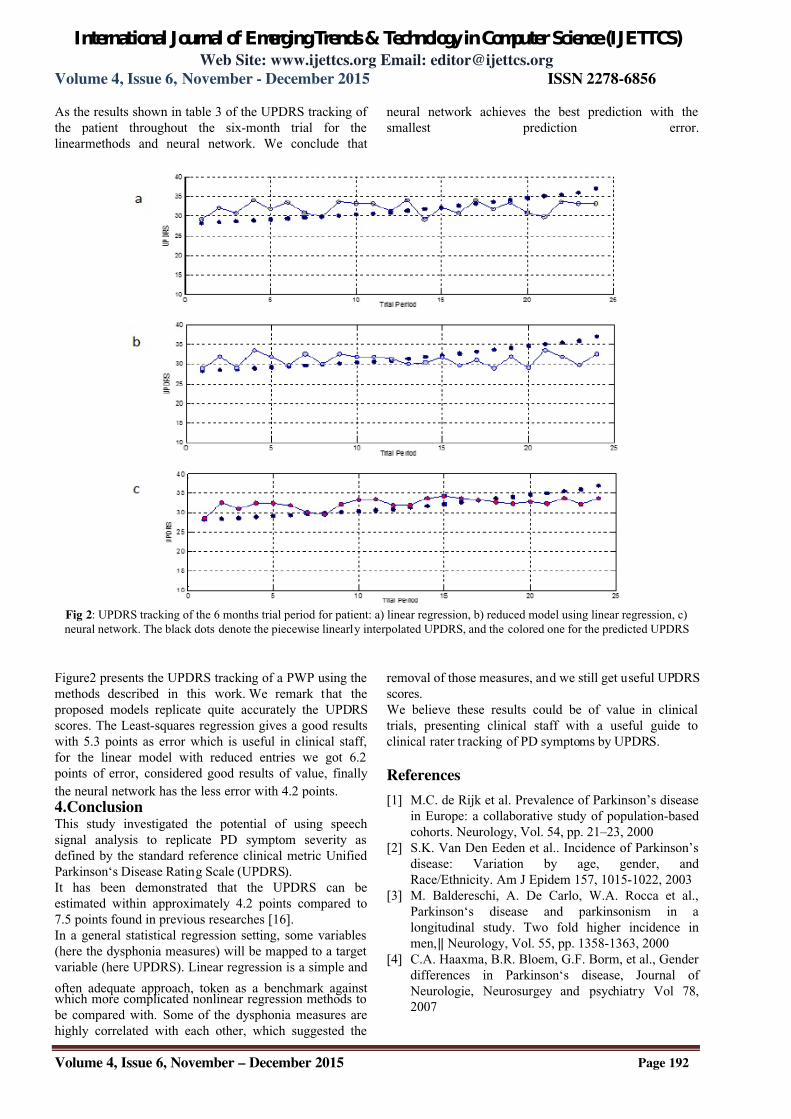
As the results shown in table 3 of the UPDRS tracking of
the patient throughout the six-month trial for the
linearmethods and neural network. We conclude that
neural network achieves the best prediction with the
smallest prediction error.
Fig 2: UPDRS tracking of the 6 months trial period for patient: a) linear regression, b) reduced model using linear regression, c)
neural network. The black dots denote the piecewise linearly interpolated UPDRS, and the colored one for the predicted UPDRS
Figure2 presents the UPDRS tracking of a PWP using the
methods described in this work. We remark that the
proposed models replicate quite accurately the UPDRS
scores. The Least-squares regression gives a good results
with 5.3 points as error which is useful in clinical staff,
for the linear model with reduced entries we got 6.2
points of error, considered good results of value, finally
the neural network has the less error with 4.2 points.
4.ConclusionThis study investigated the potential of using speech
signal analysis to replicate PD symptom severity as
defined by the standard reference clinical metric Unified
Parkinson‘s Disease Rating Scale (UPDRS).
It has been demonstrated that the UPDRS can be
estimated within approximately 4.2 points compared to
7.5 points found in previous researches [16].
In a general statistical regression setting, some variables
(here the dysphonia measures) will be mapped to a target
variable (here UPDRS). Linear regression is a simple and
often adequate approach, token as a benchmark againstwhich more complicated nonlinear regression methods to
be compared with. Some of the dysphonia measures are
highly correlated with each other, which suggested the
removal of those measures, and we still get useful UPDRS
scores.
We believe these results could be of value in clinical
trials, presenting clinical staff with a useful guide to
clinical rater tracking of PD symptoms by UPDRS.
References
[1] M.C. de Rijk et al. Prevalence of Parkinson’s disease
in Europe: a collaborative study of population-based
cohorts. Neurology, Vol. 54, pp. 21–23, 2000
[2] S.K. Van Den Eeden et al.. Incidence of Parkinson’s
disease: Variation by age, gender, and
Race/Ethnicity. Am J Epidem 157, 1015-1022, 2003
[3] M. Baldereschi, A. De Carlo, W.A. Rocca et al.,
Parkinson‘s disease and parkinsonism in a
longitudinal study. Two fold higher incidence in
men,‖ Neurology, Vol. 55, pp. 1358-1363, 2000
[4] C.A. Haaxma, B.R. Bloem, G.F. Borm, et al., Gender
differences in Parkinson‘s disease, Journal of
Neurologie, Neurosurgey and psychiatry Vol 78,
2007

7/26/2019 UPDRS tracking using linear regression and neural network for Parkinson’s disease prediction
http://slidepdf.com/reader/full/updrs-tracking-using-linear-regression-and-neural-network-for-parkinsons 5/5
International Journal of EmergingTrends & Technology in Computer Science(IJETTCS)Web Site: www.ijettcs.org Email: [email protected]
Volume 4, Issue 6, November - December 2015 ISSN 2278-6856
Volume 4, Issue 6, November – December 2015 Page 193
[5] Neurology,‖ Neurosurgery and Psychiatry, Vol. 78,
pp. 819-824, 2007
[6] A. Elbaz et al. Risk tables for Parkinsonism and
Parkinson’s disease. Journal of Clinical
Epidemiology. Vol. 55, pp. 25-31, 2002
[7] F.L. Darley, A. E. Aronson and J. R. Brown,―Differential diagnostic patterns of dysarthria,‖
Journal of Speech and Hearing Research, Vol. 12, pp.
246-269, 1969
[8] J. Gamboa, F.J. Jimenez-Jimenez, A. Nieto, J.
Montojo, M. Orti-Pareja, J.A. Molina, E. Garcia-
Albea, I. Cobeta, ―Acoustic voice analysis in
patients with Parkinson‘sdisease treated with
dopaminergic drugs,‖ Journal of Voice, Vol. 11, pp.
314-320, 1997
[9] A. Ho, R. Iansek, C. Marigliani, J. Bradshaw, S.
Gates. Speech impairment in a large sample of
patients with Parkinson’s disease. Behavioral
Neurology 11, 131-37, 1998
[10] B. Harel, M. Cannizzaro and P.J. Snyder. Variability
in fundamental frequency during speech in prodromal
and incipient Parkinson’s disease: A longitudinal case
study, Brain and Cognition 56, 24–29, 2004
[11] S. Skodda, H. Rinsche, U. Schlegel. Progression of
dysprosody in Parkinson’s disease over time – A
longitudinal study. Movement Disorders 24 (5), 716-
722, 2009
[12] S. Sapir, J. Spielman, L. Ramig, B. Story, C. Fox.
Effects of Intensive Voice Treatment (LSVT) on
Vowel Articulation in Dysarthric Individuals with
Idiopathic Parkinson Disease: Acoustic andPerceptual Findings. J. Speech, Lang. Hear Research ,
Vol.50, pp. 899-912, 2007
[13] L. Cnockaert et al. Low frequency vocal modulations
in vowels produced by Parkinsonian subjects, Speech
Comm 50, 288-300, 2008
[14] M.A. Little, P.E. McSharry, E.J. Hunter, J. Spielman,
L.O. Ramig. Suitability of dysphonia measurements
for telemonitoring of Parkinson’s disease, IEEE
Trans. Biomedical Engineering 56(4), 1015-1022,
2009
[15] C.G. Goetz. et al. Testing objective measures of motor
impairment in early Parkinson’s disease: Feasibilitystudy of an at-home testing device. Movement
Disorders 24 (4), 551-556, 2009
[16] C.G. Goetz, G.T. Stebbins, D. Wolff, W. DeLeeuw,
H. Bronte-Stewart, R. Elble, M. Hallett, J. Nutt, L.
Ramig, T. Sanger, A.D. Wu, P.H. Kraus, L.M.
Blasucci, E.A. Shamim, K.D. Sethi, J. Spielman, K.
Kubota, A.S. Grove, E. Dishman, C.B. Taylor,
―Testing objective measures of motor impairment in
early Parkinson‘s disease: Feasibility study of an at-
home testing device,‖ Movement Disorders, Vol. 24
(4), pp. 551-556, 2009
[17] Tsanas, A., Little, M., McSharry, P. E., & Ramig,
L. O. (2010). Accurate telemonitoring ofParkinson's disease progression by noninvasivespeech tests. Biomedical Engineering, IEEE
Transactions on, 57(4), 884-893
[18] P. Boersma and D. Weenink: Praat: doing phonetics
by computer [Computer program]. Retrieved from
http://www.praat.org/, 2009
[19] M.A. Little. Biomechanically Informed Nonlinear
Speech Signal Processing, DPhil Thesis, University of
Oxford, Oxford, UK, 2007[20] M.A. Little, P.E. McSharry, S.J. Roberts, D. Costello,
I.M. Moroz. Exploiting Nonlinear Recurrence and
Fractal Scaling Properties for Voice Disorder
Detection. Biomedical Engineering Online 6:23, 2007
[21] Levenberg, K. "A Method for the Solution of Certain
Problems in Least Squares." Quart. Appl. Math. 2,
164-168, 1944.
[22] Marquardt, D. "An Algorithm for Least-Squares
Estimation of Nonlinear Parameters." SIAM J. Appl.
Math. 11, 431-441, 1963
[23] Tsanas, A., Little, M. A., McSharry, P. E., & Ramig,
L. O. (2011). Nonlinear speech analysis algorithms
mapped to a standard metric achieve clinically useful
quantification of average Parkinson's disease
symptom severity. Journal of the Royal Society
Interface, 8(59), 842-855.