updated european hydraulic pedotransfer functions with
TRANSCRIPT

Geosci. Model Dev., 14, 151–175, 2021https://doi.org/10.5194/gmd-14-151-2021© Author(s) 2021. This work is distributed underthe Creative Commons Attribution 4.0 License.
Updated European hydraulic pedotransfer functions withcommunicated uncertainties in the predicted variables (euptfv2)Brigitta Szabó1, Melanie Weynants2, and Tobias K. D. Weber3
1Institute for Soil Sciences, Centre for Agricultural Research, Herman Ottó út 15, 1022 Budapest, Hungary2European Commission Joint Research Centre, via Enrico Fermi 2749, 21027 Ispra, Italy3Institute of Soil Science and Land Evaluation, University of Hohenheim, Emil-Wolff-Straße 27, 70593 Stuttgart, Germany
Correspondence: Brigitta Szabó ([email protected])
Received: 3 February 2020 – Discussion started: 5 May 2020Revised: 18 October 2020 – Accepted: 2 November 2020 – Published: 12 January 2021
Abstract. Soil hydraulic properties are often derived indi-rectly, i.e. computed from easily available soil propertieswith pedotransfer functions (PTFs), when those are neededfor catchment, regional or continental scale applications.When predicted soil hydraulic parameters are used for themodelling of the state and flux of water in soils, uncertaintyof the computed values can provide more detailed informa-tion when drawing conclusions. The aim of this study wasto update the previously published European PTFs (Tóth etal., 2015, euptf v1.4.0) by providing prediction uncertaintycalculation built into the transfer functions. The new set ofalgorithms was derived for point predictions of soil watercontent at saturation (0 cm matric potential head), field ca-pacity (both−100 and−330 cm matric potential head), wilt-ing point (−15 000 cm matric potential head), plant availablewater, and saturated hydraulic conductivity, as well as theMualem–van Genuchten model parameters of the moistureretention and hydraulic conductivity curve. The minimum setof input properties for the prediction is soil depth and sand,silt and clay content. The effect of including additional in-formation like soil organic carbon content, bulk density, cal-cium carbonate content, pH and cation exchange capacitywere extensively analysed. The PTFs were derived adoptingthe random forest method. The advantage of the new PTFsis that they (i) provide information about prediction uncer-tainty, (ii) are significantly more accurate than the euptfv1,(iii) can be applied for more predictor variable combinationsthan the euptfv1, 32 instead of 5, and (iv) are now also de-rived for the prediction of water content at −100 cm matricpotential head and plant available water content. A practicalguidance on how to use the derived PTFs is provided.
1 Introduction
Quantitative information on state and flux of water in thecritical zone is important for a wide range of environmen-tal process models and decision support systems related toland surface processes (Lin, 2010; Zhao et al., 2018). Per-formance of hydrologic, climate, crop and other models re-lated to soil hydrological processes depends on the qualityand resolution of soil hydraulic input parameters (Vereeckenet al., 2015). Simulations of flow through variably saturatedsoil media either rely on simple modelling approaches whichonly require few directly measurable input variables such asporosity, field capacity, and wilting point, or on the Richardsequation. While the former are simple and straightforwardto obtain, the Richards equation requires knowledge aboutthe soil hydraulic properties over the full moisture range. Inpractice, one of the most common approaches to describe thewater retention and hydraulic conductivity curves required tosolve the Richards equation is arguably (Weber et al., 2019)the Mualem–van Genuchten model (MVG) (van Genuchten,1980; Mualem, 1976). Since soil hydraulic measurements inthe laboratory or in the field are often time consuming, ex-pensive and difficult, indirect methods for estimating soil hy-draulic properties using widely available surrogate data havebeen developed (Schaap, 2006). To date, a large number ofpedotransfer functions have become popular to predict soilhydraulic properties and MVG model parameters (Van Looyet al., 2017).
Information on the uncertainty of the predicted soil hy-draulic properties is important for modelling the state andflux of water in soil. The source of prediction uncertainty
Published by Copernicus Publications on behalf of the European Geosciences Union.

152 B. Szabó et al.: Updated European hydraulic pedotransfer functions
can be threefold: it can stem from the (i) predictor (e.g. mea-surement uncertainty, non-representativeness of a sample),(ii) predicted variables (e.g. uncertainty in the estimated soilhydraulic model parameters), and the (iii) algorithm whichdescribes the relation between the two. Information on theuncertainty of the predictor variables is commonly not avail-able in PTFs derived before the 2000s, but has become amore intensively studied topic in the last decade. For exam-ple, Weynants et al. (2009) quantified uncertainty of derivedPTFs related to experimental, model and fitting errors withthe one-step inversion method. Deng et al. (2009) differenti-ated and quantified intrinsic and input uncertainty of PTFs.Tranter et al. (2010) developed an uncertainty estimationmethod using fuzzy k-means with extragrades classificationthat can be applied in any PTF prediction. Kotlar et al. (2019)presented uncertainty assessment of PTFs through derivingPTFs on tens of resamples for train and test sets. Román Do-barco et al. (2019) introduced prediction interval coverageprobability to assess prediction uncertainty in PTFs derivedon French soils. McNeill et al. (2018) provided estimation ofthe distribution and confidence intervals of the predicted soilhydraulic property (i.e. water content at 100 and 15 000 cmmatric potential head and total available water). In the fieldof soil mapping it is an even more extensively studied topicwhere different computational methods have been proposedto assess uncertainty of the mapped properties. Examples areestimation of the 90 % prediction intervals based on a tri-angular distribution (Odgers et al., 2014), quantification ofmapped soil properties uncertainties by quantile regressionforest (Vaysse and Lagacherie, 2017), and a detailed com-parison of uncertainties in mapped soil organic carbon con-tent by different geostatistical and machine learning methods(Szatmári and Pásztor, 2019).
Machine learning methods can be more robust to constructPTFs in comparison to previous approaches such as linear re-gression or simple decision trees if the relationship betweenthe predictors and response is highly non-linear (Araya andGhezzehei, 2019). The random forest algorithm (Breiman,2001) is able to outperform other machine learning methods(Olson et al., 2018), which was also shown for predictingsoil properties (Hengl et al., 2018; Nussbaum et al., 2018).Improvements in computing power, statistical methods andstatistical software provide the possibility to apply more eas-ily even complex models on large datasets. Therefore, com-plexity of a prediction algorithm is no longer a barrier in se-lecting a suitable algorithm to develop and apply PTFs. Mostof the recent machine learning algorithms have the built inpossibility to compute the uncertainty in the predicted vari-able, e.g. by quantile regression forest (Meinshausen, 2006)or generalized boosted regression (Ridgeway, 2017). If PTFsare derived with these algorithms, the uncertainty of the pre-dicted soil property can be directly estimated when applyingthe PTF (Szabó et al., 2019a), although this could also beachieved by applying the above mentioned uncertainty as-
sessment methods without using machine learning methods(e.g. Kotlar et al., 2019; Tranter et al., 2010).
Despite the above mentioned developments, the euptfv1(Tóth et al., 2015) and derived soil hydraulic property mapsfor Europe on a 1 km and 250 m grid (Tóth et al., 2017) donot include uncertainties in the prediction. Hence, the aim ofour study was to update the euptfv1 by deriving a new set ofsoil hydraulic PTFs (euptfv2) providing uncertainty calcula-tion built into the PTF model. For this, we rely heavily on thedatasets used in the construction of the euptfv1. Methodolog-ically, we constructed new soil hydraulic PTFs on the basisof the random forest method which facilitates quantificationof prediction-uncertainties. The predicted variables of inter-est included soil water content at saturation, field capacityand wilting point, plant available water content, saturated hy-draulic conductivity, MVG parameters of the moisture reten-tion and hydraulic conductivity curves. The predictions arebased on easily available soil properties. The predictor vari-ables were similar to those of euptfv1, except the topsoil andsubsoil distinction, which was replaced by mean soil depthof the sample, since it is typically known, anyway. Addition-ally, the improved performance of the euptfv2 was assessedagainst predictions using the earlier version. Moreover, wedetermined the minimum sufficient predictor variables for 32input variables combinations.
2 Materials and Methods
The construction of a pedotransfer function requires three el-ements: predictor variables, predicted variables as the prop-erty of interest, and a transfer method between the formertwo. The predicted variables are in this case directly mea-sured soil hydraulic properties on samples contained in alarge pan-European dataset, ensuring a representativeness ofthe PTF for Europe. Additionally, Tóth et al. (2015) had fittedMVG model parameters for each sample dataset individuallyby inverse modelling, the results of which we reused in thisstudy.
2.1 Dataset
The European Hydropedological Data Inventory (EU-HYDI)(Weynants et al., 2013) provided the basis for the preparationof the prediction algorithms. The dataset partitions for train-ing and testing the prediction algorithms were almost iden-tical to the ones used in Tóth et al. (2015), except that thesamples had to have information on soil depth as well. De-pending on the soil hydraulic property of interest, 76 %–99 %of the originally selected samples were used to derive the newPTFs. It enabled comparison of the performance between theEU-PTFs (Tóth et al., 2015) – built in the euptfv1 (Weynantsand Tóth, 2014) – and their improved version (euptfv2). Ta-ble 1 shows the number of samples in the training and testsets.
Geosci. Model Dev., 14, 151–175, 2021 https://doi.org/10.5194/gmd-14-151-2021

B. Szabó et al.: Updated European hydraulic pedotransfer functions 153
2.2 Predicted soil hydraulic properties
Prediction algorithms were derived for each of the followingsoil hydraulic properties:
– water content at saturation (THS): water content at 0 cmmatric potential head;
– water content at field capacity at
– −100 cm matric potential head (FC_2), and
– −330 cm matric potential head and (FC);
– water content at wilting point (WP): water content at−15 000 cm matric potential head;
– plant available water content (AWC) based on the fol-lowing equations:
AWC= FC−WP (1)AWC_2= FC_2−WP (2)
– saturated hydraulic conductivity (KS): hydraulic con-ductivity at 0 cm matric potential head;
– Mualem–van Genuchten model parameters (VG; for thewater retention model only, MVG; for the water reten-tion and hydraulic conductivity model).
Transformation of predicted variables, and explanation onhow (i) the water content at a certain matric potential headvalues were harmonized and (ii) the Mualem–van Genuchtenmodel parameters were fitted is provided in great detail in(Tóth et al., 2015). Similarly to euptfv1, for the descriptionof the moisture retention curve (MRC), we predicted the VGmodel parameters: the residual water content (θr), the satu-rated water content (θs), and shape parameters α and n. Forthe hydraulic conductivity curve, two additional parameters:the hydraulic conductivity acting as a matching point at sat-uration K0 and a shape parameter related to pore tortuosity(L) are estimated, too.
FC_2 was not predicted in euptfv1 and was determined inthis study as follows. In the EU-HYDI, 8231 samples haveat least one water content observation in the matric poten-tial head range −110 to −95 cm. 86 % of those have a mea-sured water retention value exactly at −100 cm matric po-tential head. In 10 % of the cases, FC_2 was set to the watercontent measured at the closest matric potential head in therange [−110, −95]. In the absence of a measured value at−100 cm, in 4 % of the cases, FC_2 was computed by linearinterpolation between the two closest matric potential headssmaller and greater than −100 cm. In the case of AWC andAWC_2 direct and indirect predictions were analysed, i.e.AWC was once predicted directly from the predictor vari-ables and once computed from the PTF predicted variablesWP, and FC and FC_2, respectively.
2.3 Predictor variables
As predictors we used the following easily available soilproperties: the particle size densities (PSD) characterisedby the mass-percentages of clay (< 2 µm), silt (2–50 µm)and sand (50–2000 µm), organic carbon content (OC; mass– %) , bulk density (DB; g cm−3), calcium carbonate con-tent (CACO3; mass – %), pH in water (PH_H2O; –), cationexchange capacity (CEC; cmol (+) kg−1), and replaced theformer topsoil and subsoil distinction in euptfv1 with meansoil depth (cm) (DEPTH). At minimum, the predictor vari-ables, clay, silt and sand content, as well as mean soil depthwere used regardless of predicted variable. In addition tothat, we tested every possible combination of the other abovementioned soil properties (predictor variables) to determinewhich combination significantly improves the performanceof the predictions. A total of 32 different combinations ofpredictor variables were studied in their respective ability topredict the nine different properties of interest; i.e. the set ofsoil hydraulic properties and model parameters.
Replacing the topsoil/subsoil distinction with depth for thenew PTFs was supported by the fact that this information iscommonly available, too, or can be based on expert knowl-edge. Introducing more accurate information on depth mightimprove the performance without using machine learning al-gorithms for the prediction. However, we did not test this hy-pothesis, because our aim was to provide uncertainty of thepredictions related to predictor variables of the PTFs. Testedpredictor variables are shown in Table 1 with number of sam-ples used to derive the PTFs and compute their performance.
2.4 The Random Forest algorithm to derive PTFs
We derived the PTFs adopting the random forest method(Breiman, 2001), implemented in the “ranger” R package(Wright and Ziegler, 2017). We selected this method, be-cause (i) it is among the best performing prediction al-gorithms if there is a complex interaction structure in thedataset (Boulesteix et al., 2012), (ii) it computes quantilesof the predicted values, (iii) parallel processing is supportedwhich saves significant computation time, and (iv) the ini-tially black-box type algorithm can be interpreted based oncomputing variable importance and analysing partial depen-dence plots implemented in the “pdp” R package (Greenwell,2017b).
In the case of a continuous response variable, a ran-dom forest is an ensemble of de-correlated regression trees(Breiman, 2001). The regression tree approach divides thepredictor space into non-overlapping regions through mini-mizing the residual sum of squares. The aim of the methodis to subset the data as homogeneously as possible at eachsplit. The observations can be assigned to the defined regionsin which the mean of the response variable is the predictedvalue. Single trees of the forest are noisy and limited in per-formance, but if many unbiased trees are derived and aver-
https://doi.org/10.5194/gmd-14-151-2021 Geosci. Model Dev., 14, 151–175, 2021

154 B. Szabó et al.: Updated European hydraulic pedotransfer functions
Table 1. Number of samples by predictor variable combinations used to derive the new European PTFs (euptfv2). Rows in italic font indicatePTFs with the same predictor variables as were tested in euptfv1 (Tóth et al., 2015).
Name Predictor variables1 Number of samples in TRAIN set2
THS FC_2 FC WP KS AWC_2 AWC VG MVG
PTF01 PSD + DEPTH 3354 5109 2196 5264 3157 3528 1863 4669 739PTF02 PSD + DEPTH + OC 2966 4131 1716 4802 2620 3208 1650 3708 407PTF03 PSD+DEPTH+BD 3305 5034 2176 5197 3146 3472 1849 4593 726PTF04 PSD+DEPTH+CACO3 678 1670 1537 1816 639 1548 1531 1671 273PTF05 PSD+DEPTH+PH_H2O 1203 2062 1278 2039 907 1849 1245 1897 230PTF06 PSD+DEPTH+CEC 895 1649 1097 1703 567 1550 1092 1488 141PTF07 PSD + DEPTH + OC + BD 2959 4117 1711 4786 2609 3197 1645 3695 404PTF08 PSD+DEPTH+OC+CACO3 673 1586 1340 1599 613 1464 1336 1589 250PTF09 PSD+DEPTH+OC+PH_H2O 1052 1808 1100 1678 862 1615 1074 1663 224PTF10 PSD+DEPTH+OC+CEC 744 1437 1001 1459 525 1358 998 1293 138PTF11 PSD+DEPTH+BD+CACO3 678 1666 1526 1806 639 1545 1522 1670 272PTF12 PSD+DEPTH+BD+PH_H2O 1156 2008 1267 1979 898 1796 1236 1847 229PTF13 PSD+DEPTH+BD+CEC 848 1596 1093 1648 558 1498 1088 1437 140PTF14 PSD+DEPTH+CACO3+PH_H2O 678 1314 1235 1375 620 1195 1230 1264 223PTF15 PSD+DEPTH+CACO3+CEC 373 770 793 831 405 726 791 758 136PTF16 PSD+DEPTH+PH_H2O+CEC 894 1350 744 1349 567 1255 739 1188 141PTF17 PSD+DEPTH+OC+BD+CACO3 673 1585 1338 1596 613 1464 1334 1588 249PTF18 PSD + DEPTH + OC + BD + PH_H2O 1047 1799 1098 1667 853 1607 1072 1655 223PTF19 PSD+DEPTH+OC+BD+CEC 739 1427 998 1447 516 1349 995 1284 137PTF20 PSD+DEPTH+OC+CACO3+PH_H2O 673 1249 1062 1183 613 1130 1059 1201 219PTF21 PSD+DEPTH+OC+CACO3+CEC 369 727 709 743 401 683 707 712 135PTF22 PSD+DEPTH+OC+PH_H2O+CEC 744 1142 663 1121 525 1067 660 996 138PTF23 PSD+DEPTH+BD+CACO3+PH_H2O 678 1310 1224 1365 620 1192 1221 1263 222PTF24 PSD+DEPTH+BD+CACO3+CEC 373 768 790 827 405 725 788 757 135PTF25 PSD+DEPTH+BD+PH_H2O+CEC 847 1298 741 1295 558 1204 736 1138 140PTF26 PSD+DEPTH+CACO3+PH_H2O+CEC 373 727 734 772 405 684 732 717 136PTF27 PSD+DEPTH+OC+BD+CACO3
+PH_H2O673 1248 1060 1180 613 1130 1057 1200 218
PTF28 PSD+DEPTH+OC+BD+CACO3+CEC 369 726 707 740 401 683 705 711 134PTF29 PSD+DEPTH+OC+BD+PH_H2O+CEC 739 1133 661 1110 516 1059 658 988 137PTF30 PSD + DEPTH + OC + CACO3 +
PH_H2O + CEC369 684 655 689 401 641 653 671 135
PTF31 PSD+DEPTH+BD+CACO3+PH_H2O+CEC
373 725 731 768 405 683 729 716 135
PTF32 PSD+DEPTH+OC+ BD+ CACO3+PH_H2O + CEC
369 683 653 686 401 641 651 670 134
Number of samples in TEST_BASIC set 1247 1762 801 2088 1117 1372 705 1591 176Number of samples in TEST_CHEM+set 156 296 280 294 169 274 279 288 57
1 PSD: particle size distribution (sand, 50–2000 µm; silt, 2–50 µm; clay, < 2 µm (mass %)); DEPTH: mean soil depth (cm); OC: organic carbon content (mass %); BD: bulkdensity (g cm−3); CACO3: calcium carbonate content (mass %); PH_H2O: pH in water (–); CEC: cation exchange capacity (cmol (+) kg−1). 2 THS: saturated water content(pF 0); FC_2: water content at −100 cm matric potential head (pF 2.0); FC: water content at −330 cm matric potential head (pF 2.5); AWC_2: plant available water contentbased on FC_2; AWC: plant available water content based on FC; WP: water content at wilting point (pF 4.2); KS: saturated hydraulic conductivity; VG: parameters of the vanGenuchten model; MVG: parameters of the Mualem – van Genuchten model; TEST_BASIC: samples with measured PSD, DEPTH, OC and BD; TEST_CHEM+: sampleswith measured PSD, DEPTH, OC, BD, CACO3, PH_H2O and CEC.
aged with bagging, the variance is reduced and performanceof the prediction improves (Hastie et al., 2009). Building ofde-correlated trees is achieved by randomization at two lev-els. Firstly, each tree of the forest is grown on a randomlyselected two thirds of the data with replacement, which iscalled bootstrap sample or in-bag fraction. Secondly, at eachnode of a single tree, randomly selected sets of predictors are
analysed to split the data. This feature of randomization al-lows correlation between the response variables (Ziegler andKönig, 2014), which is an important advantage in the caseof pedotransfer functions where predictors are often highlycorrelated.
Parameter tuning of the ranger was performed with the“caret” R package (Kuhn et al., 2017, 2018). With the im-
Geosci. Model Dev., 14, 151–175, 2021 https://doi.org/10.5194/gmd-14-151-2021

B. Szabó et al.: Updated European hydraulic pedotransfer functions 155
plemented train function, a fivefold cross-validation was re-peated 10 times to tune the number of randomly selected pre-dictor variables at each split (mtry) and find the best perform-ing splitting rule (splitrule) during training. We started thetuning by setting the number of randomly selected predictorvariables to two, then added one by one until the number ofall available predictors for each input variable combinationwas reached. All three built-in splitting rules in the rangerfunction were tuned, namely variance, extratrees and max-stat. The minimum node size was kept to 10. In addition tothe tuning options included in the train function of the caretpackage, we optimized the number of trees in the forest. Theabove described tuning was performed by discretely alteringthe number of trees in the forest in separate tuning steps to50, 100, 200, 500 and 1000, analysing the results and choos-ing the best number of trees for the random forest.
We analysed the relevance of predictors and their influenceon the response variable. The relevance of predictors was de-termined by computing the variable importance based on themean decrease in impurity (Hastie et al., 2009) in the rangerfunction. The relative importance was assessed by dividingthe variable importance of each predictor by the sum of theimportance of all the predictors after Kotlar et al. (2019). Themarginal effect of some selected predictors on the response –soil hydraulic parameters – was analysed with partial depen-dence plots (Greenwell, 2017a, b).
The final prediction algorithm was built on the whole train-ing set based on the result of the tuning. To quantify theprediction uncertainties, quantile regression was used (Mein-shausen, 2006). In random forest, as implemented in ranger,it is called quantile regression forest. For each node in eachtree, the quantile regression forest not only keeps the mean ofthe predicted target variable, but all observations that belongto that node from which the full conditional distribution ofthe predicted variable is estimated. The width of the predic-tion interval varies with the predictor variables. The smallerthe range of the prediction interval, the more accurate theprediction is. We analysed the 90 % prediction interval forall predictions, but the derived algorithms (PTFs) provide thepossibility to compute the individual predictions of each tree.
2.5 Evaluation of derived PTFs
The performance of the PTFs was calculated using the me-dian values predicted by the random forests. It was describedwith the root mean square error (RMSE) (Eq. 3.), and thecoefficient of determination (R2) (Eq. 4.) computed for thetraining and test sets.
RMSE=
√√√√ 1N
N∑i=1
(yi − yi
)2=√
MSE (3)
R2= 1−
N∑i=1
(yi − yi
)2N∑i=1(yi − y)
2(4)
where yi is the measured and yi the predicted soil water con-tent or log-transformed saturated or unsaturated hydraulicconductivity, yi is the average of yi , N is the number of yiand yi data pairs, and MSE is the mean square error. The dif-ferent data range of the dataset influences the performance ofthe PTFs when that is compared to the studies in the litera-ture. Therefore, normalized RMSE (NRMSE) was computed(Eq. 5), where ymax and ymin are the maximum and minimumvalue of variable.
NRMSE=RMSE
ymax− ymin(5)
For each predicted variable, there was an initial set of 32 pre-dictor combinations (Table 1), whose individual performancefor each of the predicted variables was assessed. Based on thetest results, we derived recommendations which PTF shouldbe used when certain sets of predictor variables are avail-able. We compared the performance of PTFs to quantify ifthere are significant differences between the predictions as aconsequence of adding certain soil properties to the predictorvariables. We also compared the performance of point andparameter estimations for those input combinations, whichreflect the most frequently available soil property combina-tion from a practical point of view. The aim of this compar-ison was to analyse whether point or parametric predictionperforms better when only THS and/or FC/FC_2 and/or WPare needed.
Additionally, the performance of the presented randomforest based PTFs was compared to that of the euptfv1 (Tóthet al., 2015). For comparison, those PTFs from euptfv2 wereselected which corresponded to the analysed input variablecombination of the euptfv1.
The comparison of PTFs was done using a non-parametricKruskal-Wallis test at the 5 % significance level appliedon the MSE values – computed on TEST_BASIC and/orTEST_CHEM+ sets (Table 1) – using the R package agri-colae (De Mendiburu, 2017). Recommendation of PTFs fora given set of predictor variables was based on the perfor-mance of euptfv2 on the test sets. If there was no significantdifference in performance, the PTF derived from the largestpopulation was selected.
All statistical analysis was performed in R [version 3.6.0](R Core Team, 2019).
3 Results and discussion
3.1 General performance
In the process of tuning the random forest parameters, thenumber of trees was found to be sufficient when set to 200
https://doi.org/10.5194/gmd-14-151-2021 Geosci. Model Dev., 14, 151–175, 2021

156 B. Szabó et al.: Updated European hydraulic pedotransfer functions
Figure 1. Results of parameter tuning of the random forest: optimization of (a) the number of randomly selected predictors at each split bynumber of available predictors and (b) splitting rule applied to build the trees in the random forest.
in all cases. The number of candidate predictors was foundto be higher than the recommended square root of the num-ber of available predictor variables (p) in most of the cases,especially when p was greater than 5 (Fig. 1). When optimiz-ing the splitting rules to build the trees in the forest, overall,the best performance was achieved by the extratrees rule in54 %, by the variance rule in 28 %, and by the maxstat rulein 18 % of the cases (Fig. 1).
The RMSE values were between 0.020 and0.068 cm3 cm−3 for THS (Table 2), 0.046 and0.055 cm3 cm−3 for FC (Table 3), 0.040 and 0.060 cm3 cm−3
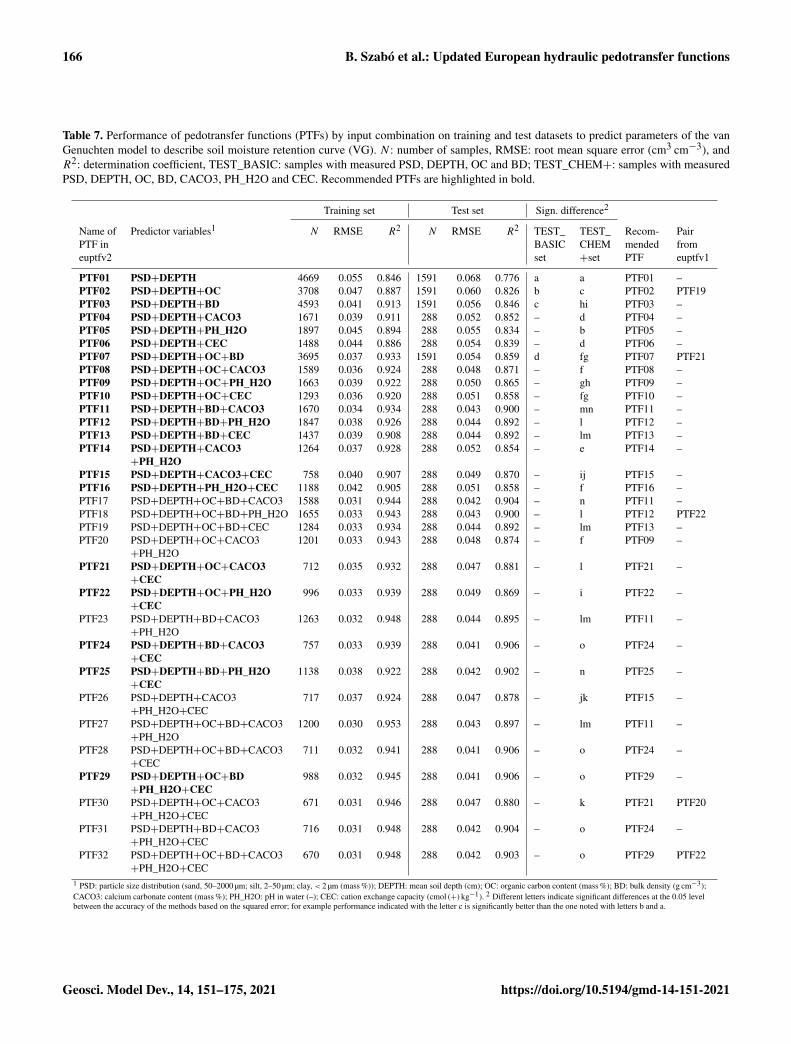
for FC_2 (Table 4), 0.037 and 0.048 cm3 cm−3 for WP (Ta-ble 5), 0.043 and 0.053 cm3 cm−3 for AWC (Table S1 inthe Supplement), 0.045 and 0.060 cm3 cm−3 for AWC_2(Table S2), and 0.09 and 1.18 log10 (cm d−1) for KS (Ta-ble 6) in the case of including different predictor variablescomputed on the test sets. Table S3 shows the NRMSE forthe point predictions computed for the TEST_BASIC andTEST_CHEM+ sets to provide possibility for comparisonwith other PTFs available from the literature. In the caseof VG and MVG, RMSE for the entire matric potentialhead range was between 0.041 and 0.068 cm3 cm−3 forthe moisture retention (Table 7) and 0.61 and 0.71 log10(cm d−1) for the hydraulic conductivity (Table 8). TheseRMSE values are within the range of recently publishedPTFs (McNeill et al., 2018; Nguyen et al., 2017; RománDobarco et al., 2019; Zhang and Schaap, 2017).
In the case of the point estimations, Figs. 2, S1 depict thescatterplots of measured and predicted soil hydraulic proper-ties/parameters with 90 % prediction interval computed onthe test sets. Performance of the worst to best PTFs areshown. The addition of predictors that significantly improvethe predictions also decreases the uncertainty. The largestreduction in the width of the inner 90 % of the predic-tion interval is visible for THS. Specifically this value de-creased from 0.21 to 0.10 cm3 cm−3 for THS, from 0.19to 0.14 cm3 cm−3 for FC_2, from 0.17 to 0.14 cm3 cm−3
for FC, from 0.15 to 0.14 cm3 cm−3 for WP, from 0.19 to0.17 cm3 cm−3 for AWC_2, from 4.1 to 3.2 log10 (cm d−1)
for KS. In the case of AWC the mean 90 % mean interval didnot change (0.15 cm3 cm−3).
Figures S2, S4, S6, S8, S10, S12, S14, S16, S19 showthe squared error of the derived PTFs computed on theTEST_BASIC and TEST_CHEM+ sets. The PTFs are or-dered based on their performance. Density plots of measuredand predicted soil hydraulic values are included in Figs. S3,S5, S7, S9, S11, S13, S15, S17, S20. Plots show the PTFsthat use the most frequently available predictors.
This study strengthens the importance of chemical soilproperties in the prediction. CEC was found to be animportant predictor by Pachepsky and Rawls (1999) forFC and WP, by Botula et al. (2013) for water retentionat several matric potential head values, and by Hodnettand Tomasella (2002) for the VG parameters. Hodnett andTomasella (2002) showed that pH influenced all four VG pa-rameters. The role of CACO3 was shown to be not signifi-cant in the study of Khodaverdiloo et al. (2011). They high-light that a possible influence of CACO3 might already havebeen indirectly included by bulk density. The role of PSD,BD and OC has been studied extensively by various authors,e.g. Nemes et al. (2003), Rawls et al. (2003), Vereeckenet al. (1989), Weynants et al. (2009), Wösten et al. (1999),which is in line with the general pattern of variable influencewe see in this study.
Table S3 summarizes the recommended PTF for eachcombination of available predictor variables. The importanceand influence of soil properties on the performance of hy-draulic PTFs and results of partial dependence plots are re-ported below by predicted soil hydraulic properties.
3.2 Point estimations
The performance of the PTFs was computed for the train-ing and test sets (Tables 2–8 and S1–2) indicating the pres-ence of significant differences. For each predictor variable,the recommended PTF number is indicated and its predictorvariables are highlighted in bold font in the respective ta-bles. For easier comparison with euptfv1, the corresponding
Geosci. Model Dev., 14, 151–175, 2021 https://doi.org/10.5194/gmd-14-151-2021

B. Szabó et al.: Updated European hydraulic pedotransfer functions 157
Table 2. Performance of pedotransfer functions (PTFs) by input combination on training and test datasets to predict water content at saturation(THS). N : number of samples, RMSE: root mean square error (cm3 cm−3), and R2: determination coefficient, TEST_BASIC: samples withmeasured PSD, DEPTH, OC and BD; TEST_CHEM+: samples with measured PSD, DEPTH, OC, BD, CACO3, PH_H2O and CEC.Recommended PTFs are highlighted in bold.
Training set Test set Sign. difference2
Name of Predictor variables1 N RMSE R2 N RMSE R2 TEST_ TEST_ Recom- PairPTF in BASIC CHEM mended fromeuptfv2 set +set PTF euptfv1
PTF01 PSD+DEPTH 3354 0.067 0.366 1274 0.068 0.344 a a PTF01 –PTF02 PSD+DEPTH+OC 2966 0.053 0.577 1274 0.056 0.552 b abc PTF02 PTF04PTF03 PSD+DEPTH+BD 3305 0.029 0.880 1274 0.031 0.862 c d PTF03 –PTF04 PSD+DEPTH+CACO3 678 0.046 0.187 156 0.057 0.053 – bc PTF04 –PTF05 PSD+DEPTH+PH_H2O 1203 0.056 0.298 156 0.053 0.193 – bc PTF05 –PTF06 PSD+DEPTH+CEC 895 0.055 0.401 156 0.057 0.048 – ab PTF01 –PTF07 PSD+DEPTH+OC+BD 2959 0.027 0.888 1274 0.030 0.869 c d PTF03 PTF05PTF08 PSD+DEPTH+OC+CACO3 673 0.044 0.209 156 0.055 0.118 – bc PTF02 –PTF09 PSD+DEPTH+OC+PH_H2O 1052 0.046 0.457 156 0.050 0.272 – c PTF02 –PTF10 PSD+DEPTH+OC+CEC 744 0.046 0.519 156 0.051 0.233 – abc PTF02 –PTF11 PSD+DEPTH+BD+CACO3 678 0.023 0.791 156 0.022 0.863 – d PTF03 –PTF12 PSD+DEPTH+BD+PH_H2O 1156 0.027 0.826 156 0.021 0.878 – d PTF03 –PTF13 PSD+DEPTH+BD+CEC 848 0.027 0.848 156 0.021 0.873 – d PTF03 –PTF14 PSD+DEPTH+CACO3+PH_H2O 678 0.045 0.231 156 0.050 0.265 – bc PTF05 –PTF15 PSD+DEPTH+CACO3+CEC 373 0.045 0.257 156 0.054 0.164 – abc PTF04 –PTF16 PSD+DEPTH+PH_H2O+CEC 894 0.052 0.459 156 0.055 0.132 – bc PTF05 –PTF17 PSD+DEPTH+OC+BD+CACO3 673 0.019 0.856 156 0.021 0.872 – d PTF03 –PTF18 PSD+DEPTH+OC+BD+PH_H2O 1047 0.024 0.848 156 0.021 0.871 – d PTF03 PTF06PTF19 PSD+DEPTH+OC+BD+CEC 739 0.027 0.837 156 0.021 0.874 – d PTF03 –PTF20 PSD+DEPTH+OC+CACO3
+PH_H2O673 0.043 0.251 156 0.050 0.285 – c PTF02 –
PTF21 PSD+DEPTH+OC+CACO3+CEC 369 0.043 0.309 156 0.051 0.242 – bc PTF02 –PTF22 PSD+DEPTH+OC+PH_H2O+CEC 744 0.046 0.531 156 0.050 0.280 – bc PTF02 –PTF23 PSD+DEPTH+BD+CACO3
+PH_H2O678 0.023 0.796 156 0.021 0.869 – d PTF03 –
PTF24 PSD+DEPTH+BD+CACO3+CEC 373 0.021 0.841 156 0.021 0.869 – d PTF03 –PTF25 PSD+DEPTH+BD+PH_H2O+CEC 847 0.027 0.850 156 0.020 0.883 – d PTF03 –PTF26 PSD+DEPTH+CACO3
+PH_H2O+CEC373 0.044 0.305 156 0.049 0.308 – abc PTF05 –
PTF27 PSD+DEPTH+OC+BD+CACO3+PH_H2O
673 0.019 0.858 156 0.022 0.865 – d PTF03 –
PTF28 PSD+DEPTH+OC+BD+CACO3+CEC
369 0.021 0.845 156 0.021 0.874 – d PTF03 –
PTF29 PSD+DEPTH+OC+BD+PH_H2O+CEC
739 0.026 0.843 156 0.020 0.880 – d PTF03 –
PTF30 PSD+DEPTH+OC+CACO3+PH_H2O+CEC
369 0.042 0.356 156 0.049 0.319 – bc PTF02 PTF04
PTF31 PSD+DEPTH+BD+CACO3+PH_H2O+CEC
373 0.021 0.843 156 0.021 0.871 – d PTF03 –
PTF32 PSD+DEPTH+OC+BD+CACO3+PH_H2O+CEC
369 0.021 0.844 156 0.021 0.876 – d PTF03 PTF06
1 PSD: particle size distribution (sand, 50–2000 µm; silt, 2–50 µm; clay, < 2 µm (mass %)); DEPTH: mean soil depth (cm); OC: organic carbon content (mass %); BD: bulk density (g cm−3);CACO3: calcium carbonate content (mass %); PH_H2O: pH in water (–); CEC: cation exchange capacity (cmol (+) kg−1). 2 Different letters indicate significant differences at the 0.05 levelbetween the accuracy of the methods based on the squared error; for example performance indicated with the letter c is significantly better than the one noted with letters b and a.
PTF number used in Tóth et al. (2015) is additionally pro-vided in each table. In the following, detailed results of theconstructed PTFs for the individual predicted variables arepresented and discussed.
3.2.1 Water content at saturation
Table 2, Figs. S2 and S3 show the performance of thePTFs predicting THS. The best performing random forest isPTF03. It is also the one trained on the largest population. Ituses PSD, DEPTH and BD as predictors. For the predictionof THS, the most important variable by far is BD (Fig. 3).When BD is not used for the computation of THS, values
https://doi.org/10.5194/gmd-14-151-2021 Geosci. Model Dev., 14, 151–175, 2021
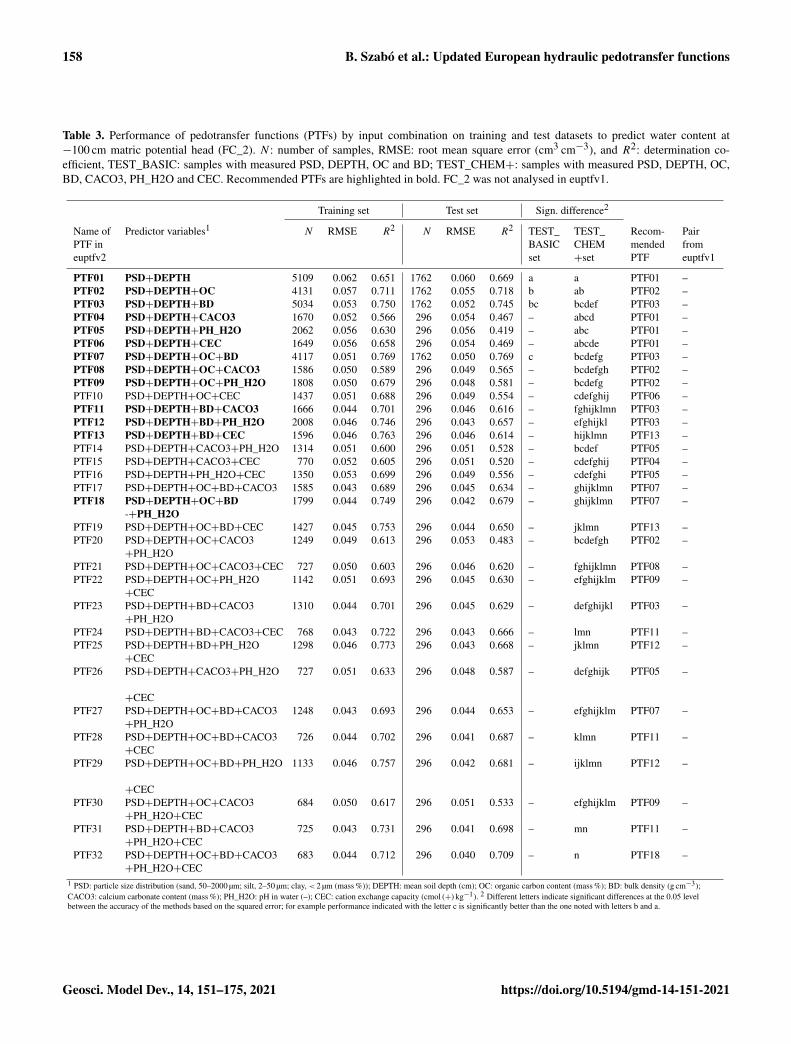
158 B. Szabó et al.: Updated European hydraulic pedotransfer functions
Table 3. Performance of pedotransfer functions (PTFs) by input combination on training and test datasets to predict water content at−100 cm matric potential head (FC_2). N : number of samples, RMSE: root mean square error (cm3 cm−3), and R2: determination co-efficient, TEST_BASIC: samples with measured PSD, DEPTH, OC and BD; TEST_CHEM+: samples with measured PSD, DEPTH, OC,BD, CACO3, PH_H2O and CEC. Recommended PTFs are highlighted in bold. FC_2 was not analysed in euptfv1.
Training set Test set Sign. difference2
Name of Predictor variables1 N RMSE R2 N RMSE R2 TEST_ TEST_ Recom- PairPTF in BASIC CHEM mended fromeuptfv2 set +set PTF euptfv1
PTF01 PSD+DEPTH 5109 0.062 0.651 1762 0.060 0.669 a a PTF01 –PTF02 PSD+DEPTH+OC 4131 0.057 0.711 1762 0.055 0.718 b ab PTF02 –PTF03 PSD+DEPTH+BD 5034 0.053 0.750 1762 0.052 0.745 bc bcdef PTF03 –PTF04 PSD+DEPTH+CACO3 1670 0.052 0.566 296 0.054 0.467 – abcd PTF01 –PTF05 PSD+DEPTH+PH_H2O 2062 0.056 0.630 296 0.056 0.419 – abc PTF01 –PTF06 PSD+DEPTH+CEC 1649 0.056 0.658 296 0.054 0.469 – abcde PTF01 –PTF07 PSD+DEPTH+OC+BD 4117 0.051 0.769 1762 0.050 0.769 c bcdefg PTF03 –PTF08 PSD+DEPTH+OC+CACO3 1586 0.050 0.589 296 0.049 0.565 – bcdefgh PTF02 –PTF09 PSD+DEPTH+OC+PH_H2O 1808 0.050 0.679 296 0.048 0.581 – bcdefg PTF02 –PTF10 PSD+DEPTH+OC+CEC 1437 0.051 0.688 296 0.049 0.554 – cdefghij PTF06 –PTF11 PSD+DEPTH+BD+CACO3 1666 0.044 0.701 296 0.046 0.616 – fghijklmn PTF03 –PTF12 PSD+DEPTH+BD+PH_H2O 2008 0.046 0.746 296 0.043 0.657 – efghijkl PTF03 –PTF13 PSD+DEPTH+BD+CEC 1596 0.046 0.763 296 0.046 0.614 – hijklmn PTF13 –PTF14 PSD+DEPTH+CACO3+PH_H2O 1314 0.051 0.600 296 0.051 0.528 – bcdef PTF05 –PTF15 PSD+DEPTH+CACO3+CEC 770 0.052 0.605 296 0.051 0.520 – cdefghij PTF04 –PTF16 PSD+DEPTH+PH_H2O+CEC 1350 0.053 0.699 296 0.049 0.556 – cdefghi PTF05 –PTF17 PSD+DEPTH+OC+BD+CACO3 1585 0.043 0.689 296 0.045 0.634 – ghijklmn PTF07 –PTF18 PSD+DEPTH+OC+BD
-+PH_H2O1799 0.044 0.749 296 0.042 0.679 – ghijklmn PTF07 –
PTF19 PSD+DEPTH+OC+BD+CEC 1427 0.045 0.753 296 0.044 0.650 – jklmn PTF13 –PTF20 PSD+DEPTH+OC+CACO3
+PH_H2O1249 0.049 0.613 296 0.053 0.483 – bcdefgh PTF02 –
PTF21 PSD+DEPTH+OC+CACO3+CEC 727 0.050 0.603 296 0.046 0.620 – fghijklmn PTF08 –PTF22 PSD+DEPTH+OC+PH_H2O
+CEC1142 0.051 0.693 296 0.045 0.630 – efghijklm PTF09 –
PTF23 PSD+DEPTH+BD+CACO3+PH_H2O
1310 0.044 0.701 296 0.045 0.629 – defghijkl PTF03 –
PTF24 PSD+DEPTH+BD+CACO3+CEC 768 0.043 0.722 296 0.043 0.666 – lmn PTF11 –PTF25 PSD+DEPTH+BD+PH_H2O
+CEC1298 0.046 0.773 296 0.043 0.668 – jklmn PTF12 –
PTF26 PSD+DEPTH+CACO3+PH_H2O
+CEC
727 0.051 0.633 296 0.048 0.587 – defghijk PTF05 –
PTF27 PSD+DEPTH+OC+BD+CACO3+PH_H2O
1248 0.043 0.693 296 0.044 0.653 – efghijklm PTF07 –
PTF28 PSD+DEPTH+OC+BD+CACO3+CEC
726 0.044 0.702 296 0.041 0.687 – klmn PTF11 –
PTF29 PSD+DEPTH+OC+BD+PH_H2O
+CEC
1133 0.046 0.757 296 0.042 0.681 – ijklmn PTF12 –
PTF30 PSD+DEPTH+OC+CACO3+PH_H2O+CEC
684 0.050 0.617 296 0.051 0.533 – efghijklm PTF09 –
PTF31 PSD+DEPTH+BD+CACO3+PH_H2O+CEC
725 0.043 0.731 296 0.041 0.698 – mn PTF11 –
PTF32 PSD+DEPTH+OC+BD+CACO3+PH_H2O+CEC
683 0.044 0.712 296 0.040 0.709 – n PTF18 –
1 PSD: particle size distribution (sand, 50–2000 µm; silt, 2–50 µm; clay, < 2 µm (mass %)); DEPTH: mean soil depth (cm); OC: organic carbon content (mass %); BD: bulk density (g cm−3);CACO3: calcium carbonate content (mass %); PH_H2O: pH in water (–); CEC: cation exchange capacity (cmol (+) kg−1). 2 Different letters indicate significant differences at the 0.05 levelbetween the accuracy of the methods based on the squared error; for example performance indicated with the letter c is significantly better than the one noted with letters b and a.
Geosci. Model Dev., 14, 151–175, 2021 https://doi.org/10.5194/gmd-14-151-2021
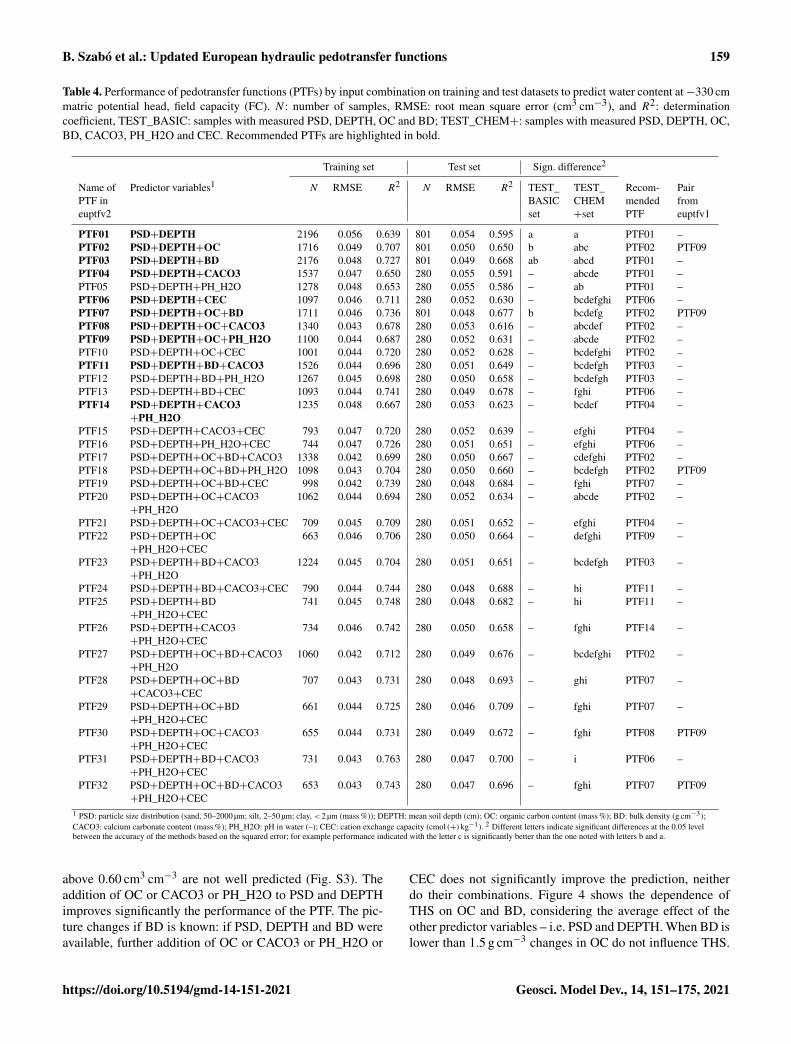
B. Szabó et al.: Updated European hydraulic pedotransfer functions 159
Table 4. Performance of pedotransfer functions (PTFs) by input combination on training and test datasets to predict water content at−330 cmmatric potential head, field capacity (FC). N : number of samples, RMSE: root mean square error (cm3 cm−3), and R2: determinationcoefficient, TEST_BASIC: samples with measured PSD, DEPTH, OC and BD; TEST_CHEM+: samples with measured PSD, DEPTH, OC,BD, CACO3, PH_H2O and CEC. Recommended PTFs are highlighted in bold.
Training set Test set Sign. difference2
Name of Predictor variables1 N RMSE R2 N RMSE R2 TEST_ TEST_ Recom- PairPTF in BASIC CHEM mended fromeuptfv2 set +set PTF euptfv1
PTF01 PSD+DEPTH 2196 0.056 0.639 801 0.054 0.595 a a PTF01 –PTF02 PSD+DEPTH+OC 1716 0.049 0.707 801 0.050 0.650 b abc PTF02 PTF09PTF03 PSD+DEPTH+BD 2176 0.048 0.727 801 0.049 0.668 ab abcd PTF01 –PTF04 PSD+DEPTH+CACO3 1537 0.047 0.650 280 0.055 0.591 – abcde PTF01 –PTF05 PSD+DEPTH+PH_H2O 1278 0.048 0.653 280 0.055 0.586 – ab PTF01 –PTF06 PSD+DEPTH+CEC 1097 0.046 0.711 280 0.052 0.630 – bcdefghi PTF06 –PTF07 PSD+DEPTH+OC+BD 1711 0.046 0.736 801 0.048 0.677 b bcdefg PTF02 PTF09PTF08 PSD+DEPTH+OC+CACO3 1340 0.043 0.678 280 0.053 0.616 – abcdef PTF02 –PTF09 PSD+DEPTH+OC+PH_H2O 1100 0.044 0.687 280 0.052 0.631 – abcde PTF02 –PTF10 PSD+DEPTH+OC+CEC 1001 0.044 0.720 280 0.052 0.628 – bcdefghi PTF02 –PTF11 PSD+DEPTH+BD+CACO3 1526 0.044 0.696 280 0.051 0.649 – bcdefgh PTF03 –PTF12 PSD+DEPTH+BD+PH_H2O 1267 0.045 0.698 280 0.050 0.658 – bcdefgh PTF03 –PTF13 PSD+DEPTH+BD+CEC 1093 0.044 0.741 280 0.049 0.678 – fghi PTF06 –PTF14 PSD+DEPTH+CACO3
+PH_H2O1235 0.048 0.667 280 0.053 0.623 – bcdef PTF04 –
PTF15 PSD+DEPTH+CACO3+CEC 793 0.047 0.720 280 0.052 0.639 – efghi PTF04 –PTF16 PSD+DEPTH+PH_H2O+CEC 744 0.047 0.726 280 0.051 0.651 – efghi PTF06 –PTF17 PSD+DEPTH+OC+BD+CACO3 1338 0.042 0.699 280 0.050 0.667 – cdefghi PTF02 –PTF18 PSD+DEPTH+OC+BD+PH_H2O 1098 0.043 0.704 280 0.050 0.660 – bcdefgh PTF02 PTF09PTF19 PSD+DEPTH+OC+BD+CEC 998 0.042 0.739 280 0.048 0.684 – fghi PTF07 –PTF20 PSD+DEPTH+OC+CACO3
+PH_H2O1062 0.044 0.694 280 0.052 0.634 – abcde PTF02 –
PTF21 PSD+DEPTH+OC+CACO3+CEC 709 0.045 0.709 280 0.051 0.652 – efghi PTF04 –PTF22 PSD+DEPTH+OC
+PH_H2O+CEC663 0.046 0.706 280 0.050 0.664 – defghi PTF09 –
PTF23 PSD+DEPTH+BD+CACO3+PH_H2O
1224 0.045 0.704 280 0.051 0.651 – bcdefgh PTF03 –
PTF24 PSD+DEPTH+BD+CACO3+CEC 790 0.044 0.744 280 0.048 0.688 – hi PTF11 –PTF25 PSD+DEPTH+BD
+PH_H2O+CEC741 0.045 0.748 280 0.048 0.682 – hi PTF11 –
PTF26 PSD+DEPTH+CACO3+PH_H2O+CEC
734 0.046 0.742 280 0.050 0.658 – fghi PTF14 –
PTF27 PSD+DEPTH+OC+BD+CACO3+PH_H2O
1060 0.042 0.712 280 0.049 0.676 – bcdefghi PTF02 –
PTF28 PSD+DEPTH+OC+BD+CACO3+CEC
707 0.043 0.731 280 0.048 0.693 – ghi PTF07 –
PTF29 PSD+DEPTH+OC+BD+PH_H2O+CEC
661 0.044 0.725 280 0.046 0.709 – fghi PTF07 –
PTF30 PSD+DEPTH+OC+CACO3+PH_H2O+CEC
655 0.044 0.731 280 0.049 0.672 – fghi PTF08 PTF09
PTF31 PSD+DEPTH+BD+CACO3+PH_H2O+CEC
731 0.043 0.763 280 0.047 0.700 – i PTF06 –
PTF32 PSD+DEPTH+OC+BD+CACO3+PH_H2O+CEC
653 0.043 0.743 280 0.047 0.696 – fghi PTF07 PTF09
1 PSD: particle size distribution (sand, 50–2000 µm; silt, 2–50 µm; clay, < 2 µm (mass %)); DEPTH: mean soil depth (cm); OC: organic carbon content (mass %); BD: bulk density (g cm−3);CACO3: calcium carbonate content (mass %); PH_H2O: pH in water (–); CEC: cation exchange capacity (cmol (+) kg−1). 2 Different letters indicate significant differences at the 0.05 levelbetween the accuracy of the methods based on the squared error; for example performance indicated with the letter c is significantly better than the one noted with letters b and a.
above 0.60 cm3 cm−3 are not well predicted (Fig. S3). Theaddition of OC or CACO3 or PH_H2O to PSD and DEPTHimproves significantly the performance of the PTF. The pic-ture changes if BD is known: if PSD, DEPTH and BD wereavailable, further addition of OC or CACO3 or PH_H2O or
CEC does not significantly improve the prediction, neitherdo their combinations. Figure 4 shows the dependence ofTHS on OC and BD, considering the average effect of theother predictor variables – i.e. PSD and DEPTH. When BD islower than 1.5 g cm−3 changes in OC do not influence THS.
https://doi.org/10.5194/gmd-14-151-2021 Geosci. Model Dev., 14, 151–175, 2021
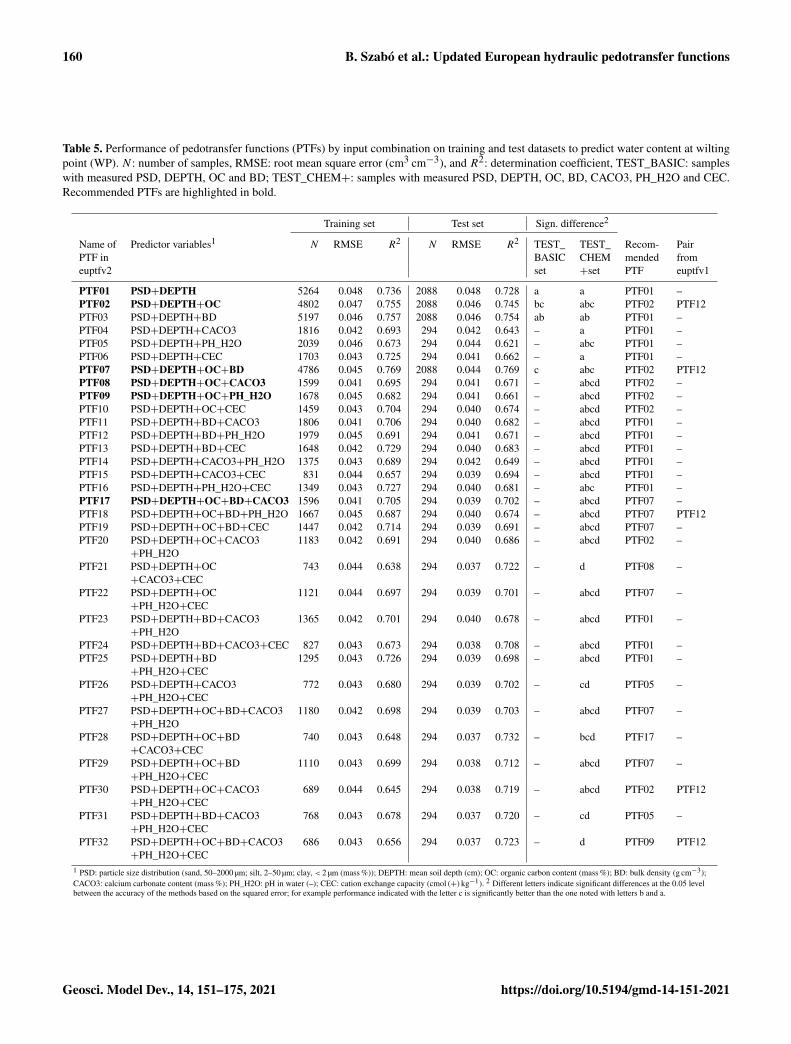
160 B. Szabó et al.: Updated European hydraulic pedotransfer functions
Table 5. Performance of pedotransfer functions (PTFs) by input combination on training and test datasets to predict water content at wiltingpoint (WP). N : number of samples, RMSE: root mean square error (cm3 cm−3), and R2: determination coefficient, TEST_BASIC: sampleswith measured PSD, DEPTH, OC and BD; TEST_CHEM+: samples with measured PSD, DEPTH, OC, BD, CACO3, PH_H2O and CEC.Recommended PTFs are highlighted in bold.
Training set Test set Sign. difference2
Name of Predictor variables1 N RMSE R2 N RMSE R2 TEST_ TEST_ Recom- PairPTF in BASIC CHEM mended fromeuptfv2 set +set PTF euptfv1
PTF01 PSD+DEPTH 5264 0.048 0.736 2088 0.048 0.728 a a PTF01 –PTF02 PSD+DEPTH+OC 4802 0.047 0.755 2088 0.046 0.745 bc abc PTF02 PTF12PTF03 PSD+DEPTH+BD 5197 0.046 0.757 2088 0.046 0.754 ab ab PTF01 –PTF04 PSD+DEPTH+CACO3 1816 0.042 0.693 294 0.042 0.643 – a PTF01 –PTF05 PSD+DEPTH+PH_H2O 2039 0.046 0.673 294 0.044 0.621 – abc PTF01 –PTF06 PSD+DEPTH+CEC 1703 0.043 0.725 294 0.041 0.662 – a PTF01 –PTF07 PSD+DEPTH+OC+BD 4786 0.045 0.769 2088 0.044 0.769 c abc PTF02 PTF12PTF08 PSD+DEPTH+OC+CACO3 1599 0.041 0.695 294 0.041 0.671 – abcd PTF02 –PTF09 PSD+DEPTH+OC+PH_H2O 1678 0.045 0.682 294 0.041 0.661 – abcd PTF02 –PTF10 PSD+DEPTH+OC+CEC 1459 0.043 0.704 294 0.040 0.674 – abcd PTF02 –PTF11 PSD+DEPTH+BD+CACO3 1806 0.041 0.706 294 0.040 0.682 – abcd PTF01 –PTF12 PSD+DEPTH+BD+PH_H2O 1979 0.045 0.691 294 0.041 0.671 – abcd PTF01 –PTF13 PSD+DEPTH+BD+CEC 1648 0.042 0.729 294 0.040 0.683 – abcd PTF01 –PTF14 PSD+DEPTH+CACO3+PH_H2O 1375 0.043 0.689 294 0.042 0.649 – abcd PTF01 –PTF15 PSD+DEPTH+CACO3+CEC 831 0.044 0.657 294 0.039 0.694 – abcd PTF01 –PTF16 PSD+DEPTH+PH_H2O+CEC 1349 0.043 0.727 294 0.040 0.681 – abc PTF01 –PTF17 PSD+DEPTH+OC+BD+CACO3 1596 0.041 0.705 294 0.039 0.702 – abcd PTF07 –PTF18 PSD+DEPTH+OC+BD+PH_H2O 1667 0.045 0.687 294 0.040 0.674 – abcd PTF07 PTF12PTF19 PSD+DEPTH+OC+BD+CEC 1447 0.042 0.714 294 0.039 0.691 – abcd PTF07 –PTF20 PSD+DEPTH+OC+CACO3
+PH_H2O1183 0.042 0.691 294 0.040 0.686 – abcd PTF02 –
PTF21 PSD+DEPTH+OC+CACO3+CEC
743 0.044 0.638 294 0.037 0.722 – d PTF08 –
PTF22 PSD+DEPTH+OC+PH_H2O+CEC
1121 0.044 0.697 294 0.039 0.701 – abcd PTF07 –
PTF23 PSD+DEPTH+BD+CACO3+PH_H2O
1365 0.042 0.701 294 0.040 0.678 – abcd PTF01 –
PTF24 PSD+DEPTH+BD+CACO3+CEC 827 0.043 0.673 294 0.038 0.708 – abcd PTF01 –PTF25 PSD+DEPTH+BD
+PH_H2O+CEC1295 0.043 0.726 294 0.039 0.698 – abcd PTF01 –
PTF26 PSD+DEPTH+CACO3+PH_H2O+CEC
772 0.043 0.680 294 0.039 0.702 – cd PTF05 –
PTF27 PSD+DEPTH+OC+BD+CACO3+PH_H2O
1180 0.042 0.698 294 0.039 0.703 – abcd PTF07 –
PTF28 PSD+DEPTH+OC+BD+CACO3+CEC
740 0.043 0.648 294 0.037 0.732 – bcd PTF17 –
PTF29 PSD+DEPTH+OC+BD+PH_H2O+CEC
1110 0.043 0.699 294 0.038 0.712 – abcd PTF07 –
PTF30 PSD+DEPTH+OC+CACO3+PH_H2O+CEC
689 0.044 0.645 294 0.038 0.719 – abcd PTF02 PTF12
PTF31 PSD+DEPTH+BD+CACO3+PH_H2O+CEC
768 0.043 0.678 294 0.037 0.720 – cd PTF05 –
PTF32 PSD+DEPTH+OC+BD+CACO3+PH_H2O+CEC
686 0.043 0.656 294 0.037 0.723 – d PTF09 PTF12
1 PSD: particle size distribution (sand, 50–2000 µm; silt, 2–50 µm; clay, < 2 µm (mass %)); DEPTH: mean soil depth (cm); OC: organic carbon content (mass %); BD: bulk density (g cm−3);CACO3: calcium carbonate content (mass %); PH_H2O: pH in water (–); CEC: cation exchange capacity (cmol (+) kg−1). 2 Different letters indicate significant differences at the 0.05 levelbetween the accuracy of the methods based on the squared error; for example performance indicated with the letter c is significantly better than the one noted with letters b and a.
Geosci. Model Dev., 14, 151–175, 2021 https://doi.org/10.5194/gmd-14-151-2021

B. Szabó et al.: Updated European hydraulic pedotransfer functions 161
Figure 2. Scatter plot of the measured versus median predicted wa-ter retention values of the worst and best performing PTF with 90 %prediction interval on test datasets. THS: saturated water content(PTF01 vs. PTF03); FC_2: water content at −100 cm matric poten-tial head (PTF01 vs. PTF18); FC: water content at −330 cm matricpotential head (PTF01 vs. PTF07); WP: water content at wiltingpoint (PTF01 vs. PTF09); log10KS: saturated hydraulic conductiv-ity (PTF01 vs. PTF02); PSD: particle size distribution (sand, 50–2000 µm; silt, 2–50 µm; clay, < 2 µm (mass %)); DEPTH_M: meansoil depth (cm); OC: organic carbon content (mass %); BD: bulkdensity (g cm−3); PH_H2O: pH in water (–); Count: the number ofcases in each rectangle.
If BD is larger than 1.5 g cm−3, samples with higher OC havehigher THS.
3.2.2 Water content at field capacity
The performance of the PTFs computed on training and testset are shown in Table 3, Figs. S4 and S5 for FC_2 and inTable 4, Figs. S6 and S7 for FC. The best performing PTFderived from the largest population is the one using (i) PSD,DEPTH, OC, BD and PH_H2O (PTF18) in the case of FC_2,and (ii) PSD, DEPTH, OC and BD (PTF07) for FC.
For FC_2, the two most important variables are USSANDand BD (Fig. 3). When BD and USSAND increase, FC_2decreases (Fig. 4). Adding OC or BD to PSD and DEPTHsignificantly improves the prediction of FC_2. If either ofCACO3, PH_H2O or CEC is added as a further predictor toPSD and DEPTH, the performance of the PTF does not sig-nificantly improve. If PSD, DEPTH and BD are available,adding OC or CACO3 or PH_H2O does not significantly im-prove the prediction. Including CEC as an additional predic-tor besides PSD, DEPTH and BD, significantly improves theestimation of FC_2.
USSAND and USCLAY are the two most important vari-ables for the prediction of FC (Fig. 3). Instead of analysingthese two soil properties, both characterizing the soil texture,we include OC next to USSAND in the partial dependenceplot analysis, because the amount of OC can be altered dueto change in climate, land use, soil and water management,cropping systems, etc. (Wiesmeier et al., 2019). Within therange of OC in the dataset FC increases with increasing OCregardless of USSAND content by up to 0.08 cm3 cm−3 evenwhen USSAND is greater than 60 % (Fig. 4). Adding OC orCEC to PSD and DEPTH significantly improves the predic-tion of FC. The effect of CEC on the prediction of FC wasalso shown by Pachepsky and Rawls (1999). BD or CaCO3or PH_H2O do not significantly improve the predictions ifPSD, DEPTH, or PSD, DEPTH and OC are available. Predic-tions significantly improve when both CaCO3 and PH_H2Oare added as predictors to PSD, DEPTH and OC.
3.2.3 Water content at wilting point
The performance of PTFs derived for WP prediction isshown in Table 5, Figs. S8 and S9. Among the best per-forming PTFs, PTF09 is derived on the largest training set.It uses PSD, DEPTH, OC and PH_H2O as predictors. Eventhough the most important variables for WP prediction wereUSCLAY and USSAND (Fig. 3), we included OC on thepartial dependence plot (Fig. 4) as in the FC analysis. US-CLAY had the strongest influence on WP. The influence ofOC on WP can be detected for soils with OC less than 4 %and USCLAY less than 50 %. Below 10 % USCLAY, the WPslightly increases with increasing OC. When USCLAY is be-tween 10 % and 50 % and OC is less than 4 %, increasing OCgenerally decreases WP.
https://doi.org/10.5194/gmd-14-151-2021 Geosci. Model Dev., 14, 151–175, 2021

162 B. Szabó et al.: Updated European hydraulic pedotransfer functions
OC significantly improves the prediction of WP if added toPSD and DEPTH. If BD or CACO3 or PH_H2O or CEC areadded to PSD and DEPTH, the performance of the predictiondoes not improve significantly. Adding CACO3 and CEC toPSD, DEPTH and OC significantly improves the prediction.
3.2.4 Plant available water content
Tables S1, S2 and Figs. S1, S10–13 show the performance ofAWC and AWC_2 predictions. Considering PSD, DEPTH,and BD as input, PTF03 is the best performing algorithm andin both case had the largest training data sets. For both AWCand AWC_2, BD is the most important predictor among theanalysed variables (Fig. 3). The second most important vari-able is USCLAY in the case of AWC_2 and USSILT forAWC. Increasing BD and USCLAY decreases AWC_2. Inthe case of AWC, increasing BD and decreasing USSILT de-creases the water content (Fig. 4).
OC and BD significantly improve the prediction ofAWC_2 when added as input variables next to PSD andDEPTH. If either BD or OC is already included, adding therespective other, does not significantly improve the predic-tion. Neither PH_H2O, CACO3 nor CEC improves the pre-diction.
For the prediction of AWC, further addition of only BDor OC or CACO3 or PH_H2O or CEC to PSD and DEPTHdoes not significantly improve the prediction. If both OC andBD are included as predictors next to PSD and DEPTH, theprediction significantly improves.
There is no significant difference between direct and in-direct predictions, neither for AWC nor for AWC_2. How-ever, the size of the test set used for the statistical analysis islimited. There were only 145 samples in the TEST_BASICset and 64 samples in TEST_CHEM+ set after mergingdatasets available for both direct and indirect predictionsfor analysing AWC, and 70 and 34 samples in the caseof AWC_2. Thus, if prediction of FC_2/FC and WP areneeded in addition to AWC_2/AWC, we recommend com-puting AWC from those to save on computing time. Variationin AWC could be explained less efficiently (Tables S1, S2)than the other studied water retention values but the perfor-mance of the prediction is comparable with that of publishedvalues in the literature (Li et al., 2016; Malone et al., 2009).
3.2.5 Saturated hydraulic conductivity
The performance of KS prediction is shown in Table 6,Figs. S14 and S15. The predictors of the best performingPTF derived on the largest training set are PSD, DEPTHand OC (PTF02). The prediction of KS significantly im-proves if OC is included among the predictor variables nextto PSD and DEPTH. No other predictors significantly im-prove the performance of the PTF. On the training dataset,when OC is greater than 2.5 %, the influence of clay con-tent on KS is more dominant than that of OC (Fig. 4). In
the case of KS prediction, the simplest best performing PTF– which was derived on a training dataset with KS rangingbetween −3.00 and 4.67 log10 (cm d−1) – has an RMSE of0.94 log10 (cm d−1) and NRMSE 0.14 log10 (cm d−1) (Ta-ble S3). PSD and CEC are the most important input variablesfor the prediction of KS when all nine variables are consid-ered as predictors (Fig. 3). In that case, OC is the fifth andBD is only the eighth most important variable. The predic-tion performance is influenced by the heterogeneity of mea-surement methods of KS in the EU-HYDI dataset. Whenthe methods are homogeneous, the RMSE value is usuallyaround 0.6–0.8 log10 (cm d−1) as reviewed by Zhang andSchaap (2019). ROSETTA3 PTF with PSD and BD predic-tors had an RMSE of 0.68 log10 (cm d−1) with an NRMSEof 0.11 log10 (cm d−1) (Zhang and Schaap, 2017). Arayaand Ghezzehei (2019) published PTF using PSD, BD andOC predictors with the highest accuracy in the literaturewith an RMSE of 0.34 log10 (cm d−1) and NRMSE of 0.06log10 (cm d−1). In Lilly et al. (2008), the performance of theKS predictions and findings were similar to this study. Theyreport an RMSE between 0.95 and 1.08 log10 (cm d−1) – withan NRMSE between 0.17 and 0.20 log10 (cm d−1) – for theKS prediction when analysed with several input combina-tions. Even when information on soil structure and crack ori-entation was considered – next to topsoil and subsoil distinc-tion, PSD, BD and OC – the RMSE was 0.97 log10 (cm d−1).BD would be among the most important variables, but also intheir analysis its influence was masked out. They derived thePTFs on the HYPRES dataset (Wösten et al., 1999), whichalso includes very diverse methods to determine the satu-rated hydraulic conductivity and part of which is also con-tained in the EU-HYDI. The uncertainty in the predictions(Fig. 2) could be decreased if the predictions would be dif-ferentiated according to the measurement methods, but thatmight decrease the applicability of the PTFs. On the contrary,this study indicates the necessity to include saturated hy-draulic conductivity values determined from many differentmeasurement techniques, otherwise, the PTFs are expectedto lose their generality.
3.3 Parameter estimations
The performance of parametric PTFs are shown in Tables 7and 8 and Figs. 5, 6, S16–S21. Figure 7 illustrates the impor-tance of variables for the prediction of VG and MVG parame-ters. The best performing PTF derived on the largest trainingset is PTF29 – with PSD, DEPTH, OC, BD, PH_H2O andCEC – for MRC and PTF27 – with PSD, DEPTH, OC, BD,CACO3, PH_H2O – for HCC.
For θr, overall, BD is the most important predictor whileall other predictors show similar variable importance (Fig. 7).Interpretation of this parameter is complex, but it wasdemonstrated that it is influenced by the soil specific surfacearea (Assouline and Or, 2013), and the measured data range(Weber et al., 2019). For θs, the most important predictor is
Geosci. Model Dev., 14, 151–175, 2021 https://doi.org/10.5194/gmd-14-151-2021

B. Szabó et al.: Updated European hydraulic pedotransfer functions 163
Figure 3. Relative variable importance computed with the random forest algorithm for the prediction of water content with PTF32 atsaturation (THS), at field capacity; −100 (FC_2) and −330 (FC) matric potential head, at wilting point (WP), of the plant available watercontent based on FC_2 (AWC_2) and FC (AWC), and the saturated hydraulic conductivity (KS). USSILT: silt content (2–50 µm (mass %));USSAND: sand content (50–2000 µm (mass %)); USCLAY: clay content (< 2 µm (mass %)); PH_H2O: pH in water (–); OC: organic carboncontent (mass %); DEPTH_M: mean soil depth (cm); OC: organic carbon content (mass %); CEC: cation exchange capacity (cmol (+) kg−1);CACO3: calcium carbonate content (mass %); BD: bulk density (g cm−3).
by far BD, similarly to THS. The importance of CEC has tobe noted for the prediction of parameters α, n and L. For theprediction of parameter n – which relates to the pore size dis-tribution – USCLAY and USSAND are the most importantvariables. K0 is influenced by several soil properties besidesthose included in the dataset used here, e.g. pore connectivity,tortuosity, primary pore orientation. These properties cannotbe directly inferred from other soil properties limiting the ex-planatory power of the available properties. The prediction ofK0 remains complex and challenging. Variable importance ofall studied predictors is greater than 70 %. Moreover, K0 isinfluenced by the data quality, and is correlated in parameterspace, which is not treated here.
Only a few studies have analysed the importance of CECfor MRC and HCC PTFs (Botula et al., 2013; Hodnett andTomasella, 2002; Pachepsky and Rawls, 1999) which mightbe linked to the fact that CEC is rarely available in soil hy-draulic datasets. It is noteworthy to highlight that all best per-forming MRC PTFs (PTF24, PTF28, PTF29, PTF30, PTF31)include CEC among the predictors (Table 7). In addition tothat, Hodnett and Tomasella (2002) found that CEC was im-portant for the prediction of θr and α parameters of the vanGenuchten model. This is because CEC provides indirect in-
formation on soil mineralogy and reflects soil specific surfacearea, charge density and pore size which influence soil waterretention (Lal and Shukla, 2004).
3.3.1 Moisture retention curve
If BD or OC or CACO3 or CEC or PH_H2O are added asa predictor to information on PSD and DEPTH, the perfor-mance of the PTF significantly improves (Table 7, Fig. S16).Adding BD next to PSD and DEPTH improves the predic-tions more than adding OC (Table 7, Fig. S17). BD and OCtogether significantly improve the prediction compared to us-ing PSD, DEPTH together with either BD or OC. AddingOC next to PSD, DEPTH, BD and chemical soil proper-ties (CACO3 and/or CEC and /or PH_H2O) does not sig-nificantly improve the prediction. If PSD, DEPTH, CACO3and CEC are available, further addition of PH_H2O does notimprove the prediction. The best performing PTF includesUSSAND, USSILT, USCLAY, DEPTH, BD, CACO3, CEC.Figure 5 shows a scatterplot of measured and predicted wa-ter content values, including the performance of the worstand the best performing PTF (PTF01 and PTF29). The im-portance of including chemical properties and most impor-
https://doi.org/10.5194/gmd-14-151-2021 Geosci. Model Dev., 14, 151–175, 2021

164 B. Szabó et al.: Updated European hydraulic pedotransfer functions
Figure 4. Partial dependence plot computed based on the random forest algorithm (PTF07) for the prediction of water content at saturation(THS), field capacity at−100 (FC_2) and−330 (FC) matric potential head, wilting point (WP), plant available water content computed withfield capacity at−100 and−330 cm matric potential head (AWC_2, AWC) and saturated hydraulic conductivity (KS) for selected predictors.
Geosci. Model Dev., 14, 151–175, 2021 https://doi.org/10.5194/gmd-14-151-2021
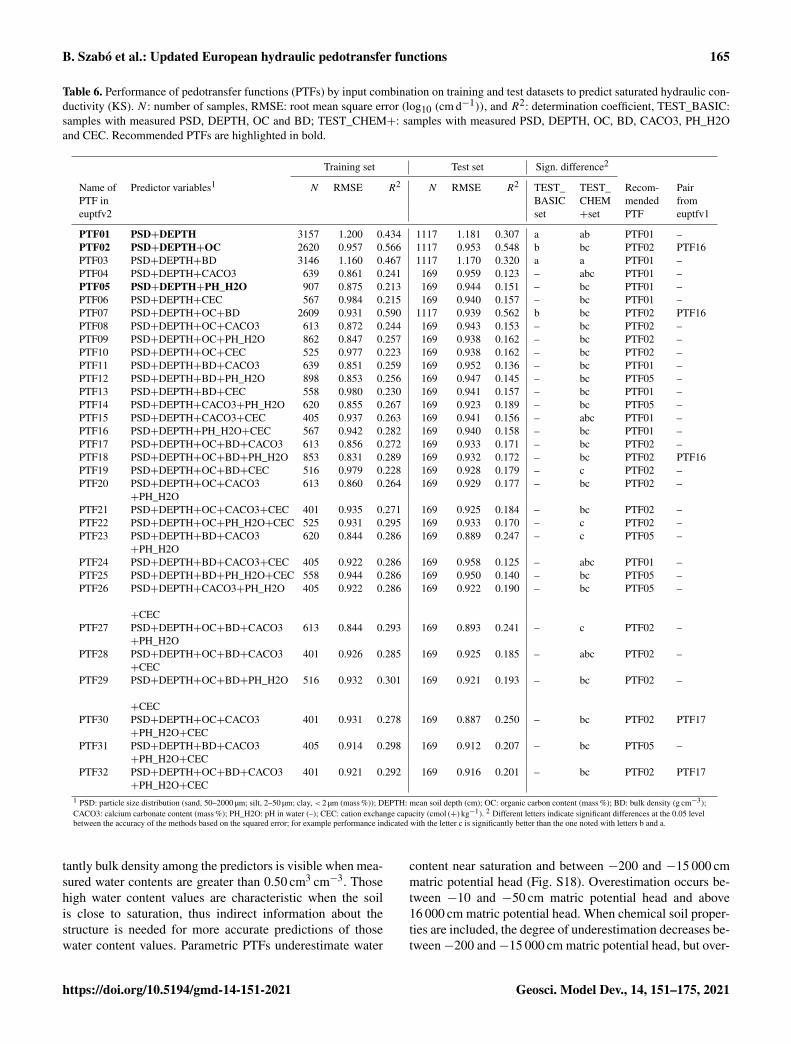
B. Szabó et al.: Updated European hydraulic pedotransfer functions 165
Table 6. Performance of pedotransfer functions (PTFs) by input combination on training and test datasets to predict saturated hydraulic con-ductivity (KS). N : number of samples, RMSE: root mean square error (log10 (cm d−1)), and R2: determination coefficient, TEST_BASIC:samples with measured PSD, DEPTH, OC and BD; TEST_CHEM+: samples with measured PSD, DEPTH, OC, BD, CACO3, PH_H2Oand CEC. Recommended PTFs are highlighted in bold.
Training set Test set Sign. difference2
Name of Predictor variables1 N RMSE R2 N RMSE R2 TEST_ TEST_ Recom- PairPTF in BASIC CHEM mended fromeuptfv2 set +set PTF euptfv1
PTF01 PSD+DEPTH 3157 1.200 0.434 1117 1.181 0.307 a ab PTF01 –PTF02 PSD+DEPTH+OC 2620 0.957 0.566 1117 0.953 0.548 b bc PTF02 PTF16PTF03 PSD+DEPTH+BD 3146 1.160 0.467 1117 1.170 0.320 a a PTF01 –PTF04 PSD+DEPTH+CACO3 639 0.861 0.241 169 0.959 0.123 – abc PTF01 –PTF05 PSD+DEPTH+PH_H2O 907 0.875 0.213 169 0.944 0.151 – bc PTF01 –PTF06 PSD+DEPTH+CEC 567 0.984 0.215 169 0.940 0.157 – bc PTF01 –PTF07 PSD+DEPTH+OC+BD 2609 0.931 0.590 1117 0.939 0.562 b bc PTF02 PTF16PTF08 PSD+DEPTH+OC+CACO3 613 0.872 0.244 169 0.943 0.153 – bc PTF02 –PTF09 PSD+DEPTH+OC+PH_H2O 862 0.847 0.257 169 0.938 0.162 – bc PTF02 –PTF10 PSD+DEPTH+OC+CEC 525 0.977 0.223 169 0.938 0.162 – bc PTF02 –PTF11 PSD+DEPTH+BD+CACO3 639 0.851 0.259 169 0.952 0.136 – bc PTF01 –PTF12 PSD+DEPTH+BD+PH_H2O 898 0.853 0.256 169 0.947 0.145 – bc PTF05 –PTF13 PSD+DEPTH+BD+CEC 558 0.980 0.230 169 0.941 0.157 – bc PTF01 –PTF14 PSD+DEPTH+CACO3+PH_H2O 620 0.855 0.267 169 0.923 0.189 – bc PTF05 –PTF15 PSD+DEPTH+CACO3+CEC 405 0.937 0.263 169 0.941 0.156 – abc PTF01 –PTF16 PSD+DEPTH+PH_H2O+CEC 567 0.942 0.282 169 0.940 0.158 – bc PTF01 –PTF17 PSD+DEPTH+OC+BD+CACO3 613 0.856 0.272 169 0.933 0.171 – bc PTF02 –PTF18 PSD+DEPTH+OC+BD+PH_H2O 853 0.831 0.289 169 0.932 0.172 – bc PTF02 PTF16PTF19 PSD+DEPTH+OC+BD+CEC 516 0.979 0.228 169 0.928 0.179 – c PTF02 –PTF20 PSD+DEPTH+OC+CACO3
+PH_H2O613 0.860 0.264 169 0.929 0.177 – bc PTF02 –
PTF21 PSD+DEPTH+OC+CACO3+CEC 401 0.935 0.271 169 0.925 0.184 – bc PTF02 –PTF22 PSD+DEPTH+OC+PH_H2O+CEC 525 0.931 0.295 169 0.933 0.170 – c PTF02 –PTF23 PSD+DEPTH+BD+CACO3
+PH_H2O620 0.844 0.286 169 0.889 0.247 – c PTF05 –
PTF24 PSD+DEPTH+BD+CACO3+CEC 405 0.922 0.286 169 0.958 0.125 – abc PTF01 –PTF25 PSD+DEPTH+BD+PH_H2O+CEC 558 0.944 0.286 169 0.950 0.140 – bc PTF05 –PTF26 PSD+DEPTH+CACO3+PH_H2O
+CEC
405 0.922 0.286 169 0.922 0.190 – bc PTF05 –
PTF27 PSD+DEPTH+OC+BD+CACO3+PH_H2O
613 0.844 0.293 169 0.893 0.241 – c PTF02 –
PTF28 PSD+DEPTH+OC+BD+CACO3+CEC
401 0.926 0.285 169 0.925 0.185 – abc PTF02 –
PTF29 PSD+DEPTH+OC+BD+PH_H2O
+CEC
516 0.932 0.301 169 0.921 0.193 – bc PTF02 –
PTF30 PSD+DEPTH+OC+CACO3+PH_H2O+CEC
401 0.931 0.278 169 0.887 0.250 – bc PTF02 PTF17
PTF31 PSD+DEPTH+BD+CACO3+PH_H2O+CEC
405 0.914 0.298 169 0.912 0.207 – bc PTF05 –
PTF32 PSD+DEPTH+OC+BD+CACO3+PH_H2O+CEC
401 0.921 0.292 169 0.916 0.201 – bc PTF02 PTF17
1 PSD: particle size distribution (sand, 50–2000 µm; silt, 2–50 µm; clay, < 2 µm (mass %)); DEPTH: mean soil depth (cm); OC: organic carbon content (mass %); BD: bulk density (g cm−3);CACO3: calcium carbonate content (mass %); PH_H2O: pH in water (–); CEC: cation exchange capacity (cmol (+) kg−1). 2 Different letters indicate significant differences at the 0.05 levelbetween the accuracy of the methods based on the squared error; for example performance indicated with the letter c is significantly better than the one noted with letters b and a.
tantly bulk density among the predictors is visible when mea-sured water contents are greater than 0.50 cm3 cm−3. Thosehigh water content values are characteristic when the soilis close to saturation, thus indirect information about thestructure is needed for more accurate predictions of thosewater content values. Parametric PTFs underestimate water
content near saturation and between −200 and −15 000 cmmatric potential head (Fig. S18). Overestimation occurs be-tween −10 and −50 cm matric potential head and above16 000 cm matric potential head. When chemical soil proper-ties are included, the degree of underestimation decreases be-tween−200 and−15 000 cm matric potential head, but over-
https://doi.org/10.5194/gmd-14-151-2021 Geosci. Model Dev., 14, 151–175, 2021
166 B. Szabó et al.: Updated European hydraulic pedotransfer functions
Table 7. Performance of pedotransfer functions (PTFs) by input combination on training and test datasets to predict parameters of the vanGenuchten model to describe soil moisture retention curve (VG). N : number of samples, RMSE: root mean square error (cm3 cm−3), andR2: determination coefficient, TEST_BASIC: samples with measured PSD, DEPTH, OC and BD; TEST_CHEM+: samples with measuredPSD, DEPTH, OC, BD, CACO3, PH_H2O and CEC. Recommended PTFs are highlighted in bold.
Training set Test set Sign. difference2
Name of Predictor variables1 N RMSE R2 N RMSE R2 TEST_ TEST_ Recom- PairPTF in BASIC CHEM mended fromeuptfv2 set +set PTF euptfv1
PTF01 PSD+DEPTH 4669 0.055 0.846 1591 0.068 0.776 a a PTF01 –PTF02 PSD+DEPTH+OC 3708 0.047 0.887 1591 0.060 0.826 b c PTF02 PTF19PTF03 PSD+DEPTH+BD 4593 0.041 0.913 1591 0.056 0.846 c hi PTF03 –PTF04 PSD+DEPTH+CACO3 1671 0.039 0.911 288 0.052 0.852 – d PTF04 –PTF05 PSD+DEPTH+PH_H2O 1897 0.045 0.894 288 0.055 0.834 – b PTF05 –PTF06 PSD+DEPTH+CEC 1488 0.044 0.886 288 0.054 0.839 – d PTF06 –PTF07 PSD+DEPTH+OC+BD 3695 0.037 0.933 1591 0.054 0.859 d fg PTF07 PTF21PTF08 PSD+DEPTH+OC+CACO3 1589 0.036 0.924 288 0.048 0.871 – f PTF08 –PTF09 PSD+DEPTH+OC+PH_H2O 1663 0.039 0.922 288 0.050 0.865 – gh PTF09 –PTF10 PSD+DEPTH+OC+CEC 1293 0.036 0.920 288 0.051 0.858 – fg PTF10 –PTF11 PSD+DEPTH+BD+CACO3 1670 0.034 0.934 288 0.043 0.900 – mn PTF11 –PTF12 PSD+DEPTH+BD+PH_H2O 1847 0.038 0.926 288 0.044 0.892 – l PTF12 –PTF13 PSD+DEPTH+BD+CEC 1437 0.039 0.908 288 0.044 0.892 – lm PTF13 –PTF14 PSD+DEPTH+CACO3
+PH_H2O1264 0.037 0.928 288 0.052 0.854 – e PTF14 –
PTF15 PSD+DEPTH+CACO3+CEC 758 0.040 0.907 288 0.049 0.870 – ij PTF15 –PTF16 PSD+DEPTH+PH_H2O+CEC 1188 0.042 0.905 288 0.051 0.858 – f PTF16 –PTF17 PSD+DEPTH+OC+BD+CACO3 1588 0.031 0.944 288 0.042 0.904 – n PTF11 –PTF18 PSD+DEPTH+OC+BD+PH_H2O 1655 0.033 0.943 288 0.043 0.900 – l PTF12 PTF22PTF19 PSD+DEPTH+OC+BD+CEC 1284 0.033 0.934 288 0.044 0.892 – lm PTF13 –PTF20 PSD+DEPTH+OC+CACO3
+PH_H2O1201 0.033 0.943 288 0.048 0.874 – f PTF09 –
PTF21 PSD+DEPTH+OC+CACO3+CEC
712 0.035 0.932 288 0.047 0.881 – l PTF21 –
PTF22 PSD+DEPTH+OC+PH_H2O+CEC
996 0.033 0.939 288 0.049 0.869 – i PTF22 –
PTF23 PSD+DEPTH+BD+CACO3+PH_H2O
1263 0.032 0.948 288 0.044 0.895 – lm PTF11 –
PTF24 PSD+DEPTH+BD+CACO3+CEC
757 0.033 0.939 288 0.041 0.906 – o PTF24 –
PTF25 PSD+DEPTH+BD+PH_H2O+CEC
1138 0.038 0.922 288 0.042 0.902 – n PTF25 –
PTF26 PSD+DEPTH+CACO3+PH_H2O+CEC
717 0.037 0.924 288 0.047 0.878 – jk PTF15 –
PTF27 PSD+DEPTH+OC+BD+CACO3+PH_H2O
1200 0.030 0.953 288 0.043 0.897 – lm PTF11 –
PTF28 PSD+DEPTH+OC+BD+CACO3+CEC
711 0.032 0.941 288 0.041 0.906 – o PTF24 –
PTF29 PSD+DEPTH+OC+BD+PH_H2O+CEC
988 0.032 0.945 288 0.041 0.906 – o PTF29 –
PTF30 PSD+DEPTH+OC+CACO3+PH_H2O+CEC
671 0.031 0.946 288 0.047 0.880 – k PTF21 PTF20
PTF31 PSD+DEPTH+BD+CACO3+PH_H2O+CEC
716 0.031 0.948 288 0.042 0.904 – o PTF24 –
PTF32 PSD+DEPTH+OC+BD+CACO3+PH_H2O+CEC
670 0.031 0.948 288 0.042 0.903 – o PTF29 PTF22
1 PSD: particle size distribution (sand, 50–2000 µm; silt, 2–50 µm; clay, < 2 µm (mass %)); DEPTH: mean soil depth (cm); OC: organic carbon content (mass %); BD: bulk density (g cm−3);CACO3: calcium carbonate content (mass %); PH_H2O: pH in water (–); CEC: cation exchange capacity (cmol (+) kg−1). 2 Different letters indicate significant differences at the 0.05 levelbetween the accuracy of the methods based on the squared error; for example performance indicated with the letter c is significantly better than the one noted with letters b and a.
Geosci. Model Dev., 14, 151–175, 2021 https://doi.org/10.5194/gmd-14-151-2021

B. Szabó et al.: Updated European hydraulic pedotransfer functions 167
Table 8. Performance of pedotransfer functions (PTFs) by input combination on training and test datasets to predict parameters of theMualem–van Genuchten model to describe soil moisture retention and hydraulic conductivity curve (MVG). N : number of samples, RMSE:root mean square error (log10 (cm d−1)), and R2: determination coefficient, TEST_BASIC: samples with measured PSD, DEPTH, OC andBD; TEST_CHEM+: samples with measured PSD, DEPTH, OC, BD, CACO3, PH_H2O and CEC. Recommended PTFs are highlighted inbold.
Training set Test set Sign. difference2
Name of Predictor variables1 N RMSE R2 N RMSE R2 TEST_ TEST_ Recom- PairPTF in BASIC CHEM mended fromeuptfv2 set +set PTF euptfv1
PTF01 PSD+DEPTH 739 0.604 0.804 176 0.708 0.796 a b PTF01 –PTF02 PSD+DEPTH+OC 407 0.619 0.829 176 0.676 0.814 b jkl PTF02 PTF19PTF03 PSD+DEPTH+BD 726 0.568 0.824 176 0.688 0.808 a ab PTF01 –PTF04 PSD+DEPTH+CACO3 273 0.587 0.878 57 0.644 0.863 – ijk PTF04 –PTF05 PSD+DEPTH+PH_H2O 230 0.578 0.889 57 0.663 0.855 – def PTF05 –PTF06 PSD+DEPTH+CEC 141 0.672 0.858 57 0.662 0.856 – fghij PTF06 –PTF07 PSD+DEPTH+OC+BD 404 0.529 0.873 176 0.659 0.824 b a PTF02 PTF19PTF08 PSD+DEPTH+OC+CACO3 250 0.587 0.880 57 0.699 0.839 – b PTF02 –PTF09 PSD+DEPTH+OC+PH_H2O 224 0.597 0.882 57 0.686 0.845 – fghi PTF02 –PTF10 PSD+DEPTH+OC+CEC 138 0.699 0.846 57 0.702 0.837 – cde PTF02 –PTF11 PSD+DEPTH+BD+CACO3 272 0.542 0.895 57 0.637 0.866 – defg PTF04 –PTF12 PSD+DEPTH+BD+PH_H2O 229 0.520 0.909 57 0.620 0.873 – jklm PTF12 –PTF13 PSD+DEPTH+BD+CEC 140 0.644 0.866 57 0.637 0.866 – lm PTF13 –PTF14 PSD+DEPTH+CACO3+PH_H2O 223 0.539 0.904 57 0.691 0.842 – c PTF04 –PTF15 PSD+DEPTH+CACO3+CEC 136 0.735 0.830 57 0.684 0.846 – c PTF04 –PTF16 PSD+DEPTH+PH_H2O+CEC 141 0.666 0.860 57 0.666 0.854 – hijk PTF06 –PTF17 PSD+DEPTH+OC+BD+CACO3 249 0.526 0.902 57 0.662 0.855 – ab PTF02 –PTF18 PSD+DEPTH+OC+BD+PH_H2O 223 0.553 0.897 57 0.642 0.864 – klm PTF02 PTF19PTF19 PSD+DEPTH+OC+BD+CEC 137 0.619 0.876 57 0.676 0.849 – b PTF02 –PTF20 PSD+DEPTH+OC+CACO3
+PH_H2O219 0.573 0.891 57 0.661 0.856 – n PTF20 –
PTF21 PSD+DEPTH+OC+CACO3+CEC
135 0.730 0.831 57 0.653 0.860 – m PTF21 –
PTF22 PSD+DEPTH+OC+PH_H2O+CEC
138 0.699 0.846 57 0.664 0.855 – lm PTF02 –
PTF23 PSD+DEPTH+BD+CACO3+PH_H2O
222 0.515 0.911 57 0.639 0.865 – lm PTF23 –
PTF24 PSD+DEPTH+BD+CACO3+CEC 135 0.678 0.852 57 0.656 0.858 – c PTF04 –PTF25 PSD+DEPTH+BD+PH_H2O
+CEC140 0.595 0.885 57 0.646 0.862 – ghijk PTF12 –
PTF26 PSD+DEPTH+CACO3+PH_H2O+CEC
136 0.712 0.841 57 0.669 0.852 – cd PTF04 –
PTF27 PSD+DEPTH+OC+BD+CACO3+PH_H2O
218 0.524 0.907 57 0.606 0.879 – o PTF27 –
PTF28 PSD+DEPTH+OC+BD+CACO3+CEC
134 0.656 0.860 57 0.639 0.865 – n PTF28 –
PTF29 PSD+DEPTH+OC+BD+PH_H2O+CEC
137 0.646 0.865 57 0.638 0.866 – n PTF29 –
PTF30 PSD+DEPTH+OC+CACO3+PH_H2O+CEC
135 0.726 0.833 57 0.680 0.847 – fghi PTF20 PTF19
PTF31 PSD+DEPTH+BD+CACO3+PH_H2O+CEC
135 0.679 0.851 57 0.668 0.853 – c PTF12 –
PTF32 PSD+DEPTH+OC+BD+CACO3+PH_H2O+CEC
134 0.645 0.864 57 0.678 0.848 – efgh PTF27 PTF19
1 PSD: particle size distribution (sand, 50–2000 µm; silt, 2–50 µm; clay, < 2 µm (mass %)); DEPTH: mean soil depth (cm); OC: organic carbon content (mass %); BD: bulk density (g cm−3);CACO3: calcium carbonate content (mass %); PH_H2O: pH in water (–); CEC: cation exchange capacity (cmol (+) kg−1). 2 Different letters indicate significant differences at the 0.05 levelbetween the accuracy of the methods based on the squared error; for example performance indicated with the letter c is significantly better than the one noted with letters b and a.
https://doi.org/10.5194/gmd-14-151-2021 Geosci. Model Dev., 14, 151–175, 2021

168 B. Szabó et al.: Updated European hydraulic pedotransfer functions
Figure 5. Scatter plot of the measured versus median predicted water retention values computed with the van Genuchten (VG) model(PTF01 vs. PTF29, i.e. the worst versus best performing PTF). PSD: particle size distribution (sand, 50–2000 µm; silt, 2–50 µm; clay,< 2 µm(mass %)); DEPTH_M: mean soil depth (cm); OC: organic carbon content (mass %); BD: bulk density (g cm−3); PH_H2O: pH in water (–);CEC: cation exchange capacity (cmol (+) kg−1); Count: the number of cases in each hexagon.
Figure 6. Scatter plot of the measured versus median predicted hydraulic conductivity values computed with the Mualem–van Genuchten(MVG) model (PTF01 vs. PTF27, i.e. the worst versus best performing PTF). PSD: particle size distribution (sand, 50–2000 µm; silt, 2–50 µm; clay, < 2 µm (mass %)); DEPTH_M: mean soil depth (cm); OC: organic carbon content (mass %); BD: bulk density (g cm−3);CACO3: calcium carbonate content (mass %); PH_H2O: pH in water (–); Count: the number of cases in each hexagon.
estimation increases between −5 and −10 cm with around0.02 cm3 cm−3.
3.3.2 Hydraulic conductivity curve
OC, CACO3, PH_H2O and CEC significantly improves theprediction of HCC when added to PSD and DEPTH. AddingBD next to PSD and DEPTH does not improve the predic-tions (Table 8, Figs. S19, S20). If PSD, DEPTH and OCare used as predictors, further addition of BD or CACO3 orPH_H2O or CEC does not significantly improve the perfor-mance of the PTFs. However, adding CaCO3 and CEC orPH_H2O significantly improve the prediction. The perfor-mance of the worst and the best performing PTF is shownon Fig. 6. The PTF with only PSD and DEPTH underesti-mate hydraulic conductivity values smaller than 0.01 cm d−1.When OC, BD, PH_H2O and CEC are included, the under-
estimation decreases. This could be explained by the fact thatthese predictors contain indirect information on soil particlesurface area and surface characteristics, which are some ofthe governing properties of low hydraulic conductivities.
When soil chemical properties are not used as predictors,hydraulic conductivity is underestimated close to saturationand at matric potential heads smaller than −500 cm; overes-timation occurs between −10 and −500 cm matric potentialhead (Fig. S21). If chemical properties are also considered,hydraulic conductivity is (i) underestimated at matric poten-tial head smaller than −5000 cm, and (ii) overestimated be-tween−5 and−5000 cm. With added information on chemi-cal properties, the degree of underprediction decreases closeto saturation and at the very dry end of the hydraulic con-ductivity curve. An increase in prediction performance forvalues lower than 0.1 cm d−1 is visible also on Fig. 6.
Geosci. Model Dev., 14, 151–175, 2021 https://doi.org/10.5194/gmd-14-151-2021

B. Szabó et al.: Updated European hydraulic pedotransfer functions 169
Figure 7. Relative variable importance computed with the random forest algorithm for the prediction of parameters of the van Genuchten andMualem–van Genuchten models based on PTF32. θr: residual water content (cm3 cm−3); θs: saturated water content (cm3 cm−3); α (cm−1),n (–): shape parameters;K0: the hydraulic conductivity acting as a matching point at saturation (cm d−1); L: shape parameter related to poretortuosity (–); USSILT: silt content (2–50 µm (mass %)); USSAND: sand content (50–2000 µm (mass %)); USCLAY: clay content (< 2 µm(mass %)); PH_H2O: pH in water (–); OC: organic carbon content (mass %); DEPTH_M: mean soil depth (cm); OC: organic carbon content(mass %); CEC: cation exchange capacity (cmol (+) kg−1); >CACO3: calcium carbonate content (mass %); BD: bulk density (g cm−3).
Samples with measurements of the HCC at pressure heads<−1000 cm are less frequent and are not as numerouswithin a dataset of a single sample, if it was measured. Sincethe dataset of estimated VG model parameters was identicalin this study and in Tóth et al. (2015), differences betweenthe two studies of the unsaturated HCC are related to the PTFmethods involved. However, at pressure heads <−1000 cm,the HCC is dominated by non-capillary conductivity (Streckand Weber, 2020; Weber et al., 2019), which is not includedin the MVG model. The considerable data mismatch observ-able for the dry range (Fig. 6) can only be overcome by a dif-ferent soil hydraulic property model and by a different PTF,because of compensatory effects in the MVG. With this, wemean that better data descriptions in the dry end will lead to alarger mismatch in the wet end, as a consequence of the rigidmodel structure in the MVG model, which only accounts forcapillary storage and conductivity. For better data descriptionat<−1000 cm other more comprehensive models need to beadopted (Weber et al., 2020a).
3.4 Comparison of point and parameter predictions
We compared the performance of the best point predictionmethods (Tables 2–5) with the best parameter estimations(Table 7) on the test sets. In 5 out of 20 cases, point predic-tions are significantly more accurate and for further 8 cases,RMSE was smaller. In all other cases, we have no signifi-cant difference between point and parametric PTFs (Table 9).The reason for higher RMSE in parameter estimation can bethat the MVG model does not always adequately describe themeasured MRC data (Weber et al., 2019). Therefore, when
THS, FC, FC_2 and WP are computed with parameter es-timation those are not only affected by the uncertainty ofthe prediction of VG parameters but by the goodness of VGmodel fit as well. We found similar results in the case of eu-ptfv1 (Tóth et al., 2015). Tomasella et al. (2003) and Børge-sen and Schaap (2005) had comparable findings regardingthe performance of point and parametric PTFs. For THS,point estimation performed better than parameter estimation.When the moisture retention curve is not needed, but onlyTHS and/or FC/FC_2 and/or WP, we recommend computingthose with the point PTFs, more detailed explanation on it isincluded in Tóth et al. (2015).
3.5 Comparison of euptfv1 and v2
The euptfv2 performs significantly better than euptfv1 in 14out of 19 cases. In the remaining 5 cases, there is no sig-nificant difference (Table 10). Predictions of FC and MRCimprove in all cases. The most important reason for it can bethat the interaction between the target variable and the pre-dictors is more complex for the cases of predicting FC orVG parameters, which can be untangled using random for-est. This may provide a reason the random forest algorithmperformed significantly better than the PTFs derived with lin-ear regression or a simple regression tree. For THS, WP, KS,and MVG only those PTFs did not improve significantly, forwhich comparisons on the TEST_CHEM+ set were possible– which includes a reduced number of samples. The RMSEof THS prediction was somewhat lower for euptfv1 than foreuptfv2, but the difference was not significant. It could be dueto the close to linear relationship between THS and BD and
https://doi.org/10.5194/gmd-14-151-2021 Geosci. Model Dev., 14, 151–175, 2021
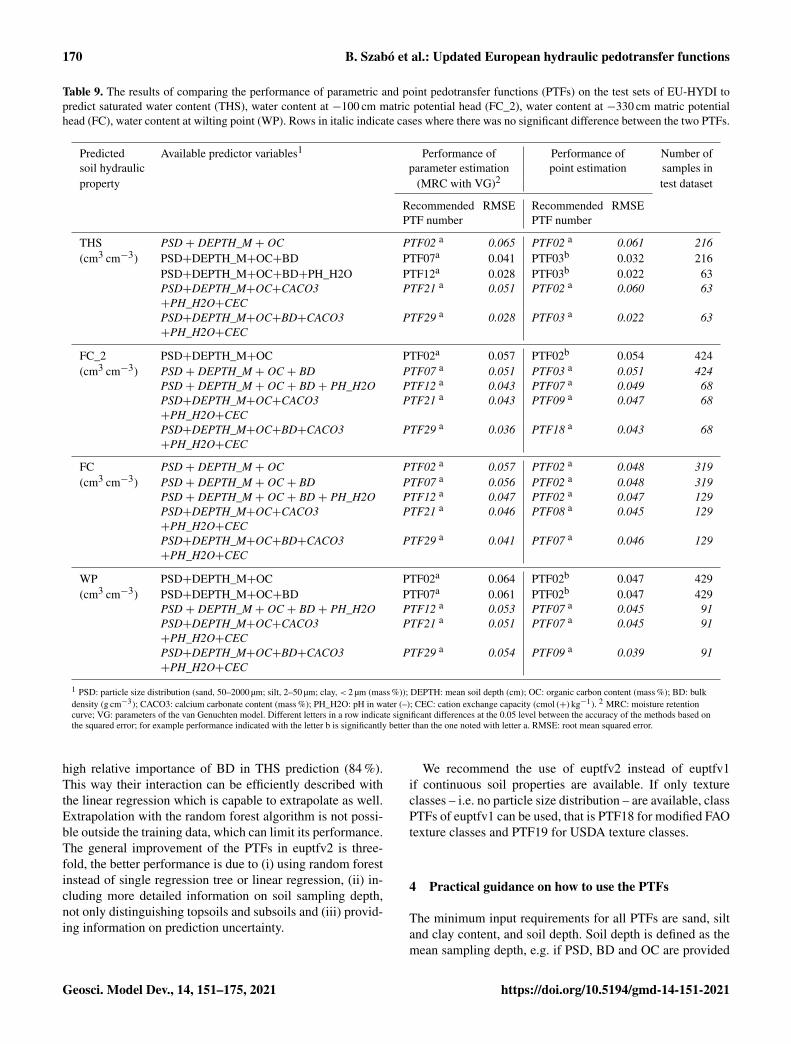
170 B. Szabó et al.: Updated European hydraulic pedotransfer functions
Table 9. The results of comparing the performance of parametric and point pedotransfer functions (PTFs) on the test sets of EU-HYDI topredict saturated water content (THS), water content at −100 cm matric potential head (FC_2), water content at −330 cm matric potentialhead (FC), water content at wilting point (WP). Rows in italic indicate cases where there was no significant difference between the two PTFs.
Predicted Available predictor variables1 Performance of Performance of Number ofsoil hydraulic parameter estimation point estimation samples inproperty (MRC with VG)2 test dataset
RecommendedPTF number
RMSE RecommendedPTF number
RMSE
THS PSD + DEPTH_M + OC PTF02 a 0.065 PTF02 a 0.061 216(cm3 cm−3) PSD+DEPTH_M+OC+BD PTF07a 0.041 PTF03b 0.032 216
PSD+DEPTH_M+OC+BD+PH_H2O PTF12a 0.028 PTF03b 0.022 63PSD+DEPTH_M+OC+CACO3+PH_H2O+CEC
PTF21 a 0.051 PTF02 a 0.060 63
PSD+DEPTH_M+OC+BD+CACO3+PH_H2O+CEC
PTF29 a 0.028 PTF03 a 0.022 63
FC_2 PSD+DEPTH_M+OC PTF02a 0.057 PTF02b 0.054 424(cm3 cm−3) PSD + DEPTH_M + OC + BD PTF07 a 0.051 PTF03 a 0.051 424
PSD + DEPTH_M + OC + BD + PH_H2O PTF12 a 0.043 PTF07 a 0.049 68PSD+DEPTH_M+OC+CACO3+PH_H2O+CEC
PTF21 a 0.043 PTF09 a 0.047 68
PSD+DEPTH_M+OC+BD+CACO3+PH_H2O+CEC
PTF29 a 0.036 PTF18 a 0.043 68
FC PSD + DEPTH_M + OC PTF02 a 0.057 PTF02 a 0.048 319(cm3 cm−3) PSD + DEPTH_M + OC + BD PTF07 a 0.056 PTF02 a 0.048 319
PSD + DEPTH_M + OC + BD + PH_H2O PTF12 a 0.047 PTF02 a 0.047 129PSD+DEPTH_M+OC+CACO3+PH_H2O+CEC
PTF21 a 0.046 PTF08 a 0.045 129
PSD+DEPTH_M+OC+BD+CACO3+PH_H2O+CEC
PTF29 a 0.041 PTF07 a 0.046 129
WP PSD+DEPTH_M+OC PTF02a 0.064 PTF02b 0.047 429(cm3 cm−3) PSD+DEPTH_M+OC+BD PTF07a 0.061 PTF02b 0.047 429
PSD + DEPTH_M + OC + BD + PH_H2O PTF12 a 0.053 PTF07 a 0.045 91PSD+DEPTH_M+OC+CACO3+PH_H2O+CEC
PTF21 a 0.051 PTF07 a 0.045 91
PSD+DEPTH_M+OC+BD+CACO3+PH_H2O+CEC
PTF29 a 0.054 PTF09 a 0.039 91
1 PSD: particle size distribution (sand, 50–2000 µm; silt, 2–50 µm; clay, < 2 µm (mass %)); DEPTH: mean soil depth (cm); OC: organic carbon content (mass %); BD: bulkdensity (g cm−3); CACO3: calcium carbonate content (mass %); PH_H2O: pH in water (–); CEC: cation exchange capacity (cmol (+) kg−1). 2 MRC: moisture retentioncurve; VG: parameters of the van Genuchten model. Different letters in a row indicate significant differences at the 0.05 level between the accuracy of the methods based onthe squared error; for example performance indicated with the letter b is significantly better than the one noted with letter a. RMSE: root mean squared error.
high relative importance of BD in THS prediction (84 %).This way their interaction can be efficiently described withthe linear regression which is capable to extrapolate as well.Extrapolation with the random forest algorithm is not possi-ble outside the training data, which can limit its performance.The general improvement of the PTFs in euptfv2 is three-fold, the better performance is due to (i) using random forestinstead of single regression tree or linear regression, (ii) in-cluding more detailed information on soil sampling depth,not only distinguishing topsoils and subsoils and (iii) provid-ing information on prediction uncertainty.
We recommend the use of euptfv2 instead of euptfv1if continuous soil properties are available. If only textureclasses – i.e. no particle size distribution – are available, classPTFs of euptfv1 can be used, that is PTF18 for modified FAOtexture classes and PTF19 for USDA texture classes.
4 Practical guidance on how to use the PTFs
The minimum input requirements for all PTFs are sand, siltand clay content, and soil depth. Soil depth is defined as themean sampling depth, e.g. if PSD, BD and OC are provided
Geosci. Model Dev., 14, 151–175, 2021 https://doi.org/10.5194/gmd-14-151-2021
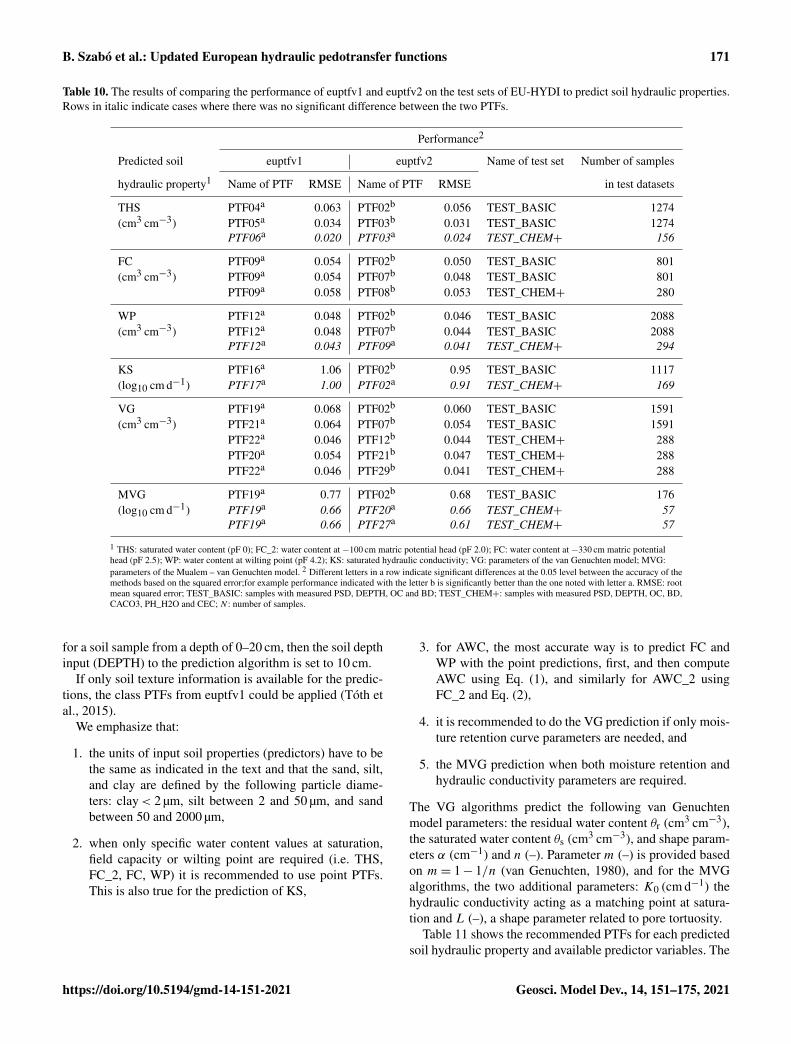
B. Szabó et al.: Updated European hydraulic pedotransfer functions 171
Table 10. The results of comparing the performance of euptfv1 and euptfv2 on the test sets of EU-HYDI to predict soil hydraulic properties.Rows in italic indicate cases where there was no significant difference between the two PTFs.
Performance2
Predicted soil euptfv1 euptfv2 Name of test set Number of samples
hydraulic property1 Name of PTF RMSE Name of PTF RMSE in test datasets
THS PTF04a 0.063 PTF02b 0.056 TEST_BASIC 1274(cm3 cm−3) PTF05a 0.034 PTF03b 0.031 TEST_BASIC 1274
PTF06a 0.020 PTF03a 0.024 TEST_CHEM+ 156
FC PTF09a 0.054 PTF02b 0.050 TEST_BASIC 801(cm3 cm−3) PTF09a 0.054 PTF07b 0.048 TEST_BASIC 801
PTF09a 0.058 PTF08b 0.053 TEST_CHEM+ 280
WP PTF12a 0.048 PTF02b 0.046 TEST_BASIC 2088(cm3 cm−3) PTF12a 0.048 PTF07b 0.044 TEST_BASIC 2088
PTF12a 0.043 PTF09a 0.041 TEST_CHEM+ 294
KS PTF16a 1.06 PTF02b 0.95 TEST_BASIC 1117(log10 cm d−1) PTF17a 1.00 PTF02a 0.91 TEST_CHEM+ 169
VG PTF19a 0.068 PTF02b 0.060 TEST_BASIC 1591(cm3 cm−3) PTF21a 0.064 PTF07b 0.054 TEST_BASIC 1591
PTF22a 0.046 PTF12b 0.044 TEST_CHEM+ 288PTF20a 0.054 PTF21b 0.047 TEST_CHEM+ 288PTF22a 0.046 PTF29b 0.041 TEST_CHEM+ 288
MVG PTF19a 0.77 PTF02b 0.68 TEST_BASIC 176(log10 cm d−1) PTF19a 0.66 PTF20a 0.66 TEST_CHEM+ 57
PTF19a 0.66 PTF27a 0.61 TEST_CHEM+ 57
1 THS: saturated water content (pF 0); FC_2: water content at −100 cm matric potential head (pF 2.0); FC: water content at −330 cm matric potentialhead (pF 2.5); WP: water content at wilting point (pF 4.2); KS: saturated hydraulic conductivity; VG: parameters of the van Genuchten model; MVG:parameters of the Mualem – van Genuchten model. 2 Different letters in a row indicate significant differences at the 0.05 level between the accuracy of themethods based on the squared error;for example performance indicated with the letter b is significantly better than the one noted with letter a. RMSE: rootmean squared error; TEST_BASIC: samples with measured PSD, DEPTH, OC and BD; TEST_CHEM+: samples with measured PSD, DEPTH, OC, BD,CACO3, PH_H2O and CEC; N : number of samples.
for a soil sample from a depth of 0–20 cm, then the soil depthinput (DEPTH) to the prediction algorithm is set to 10 cm.
If only soil texture information is available for the predic-tions, the class PTFs from euptfv1 could be applied (Tóth etal., 2015).
We emphasize that:
1. the units of input soil properties (predictors) have to bethe same as indicated in the text and that the sand, silt,and clay are defined by the following particle diame-ters: clay< 2 µm, silt between 2 and 50 µm, and sandbetween 50 and 2000 µm,
2. when only specific water content values at saturation,field capacity or wilting point are required (i.e. THS,FC_2, FC, WP) it is recommended to use point PTFs.This is also true for the prediction of KS,
3. for AWC, the most accurate way is to predict FC andWP with the point predictions, first, and then computeAWC using Eq. (1), and similarly for AWC_2 usingFC_2 and Eq. (2),
4. it is recommended to do the VG prediction if only mois-ture retention curve parameters are needed, and
5. the MVG prediction when both moisture retention andhydraulic conductivity parameters are required.
The VG algorithms predict the following van Genuchtenmodel parameters: the residual water content θr (cm3 cm−3),the saturated water content θs (cm3 cm−3), and shape param-eters α (cm−1) and n (–). Parameter m (–) is provided basedon m= 1− 1/n (van Genuchten, 1980), and for the MVGalgorithms, the two additional parameters: K0 (cm d−1) thehydraulic conductivity acting as a matching point at satura-tion and L (–), a shape parameter related to pore tortuosity.
Table 11 shows the recommended PTFs for each predictedsoil hydraulic property and available predictor variables. The
https://doi.org/10.5194/gmd-14-151-2021 Geosci. Model Dev., 14, 151–175, 2021
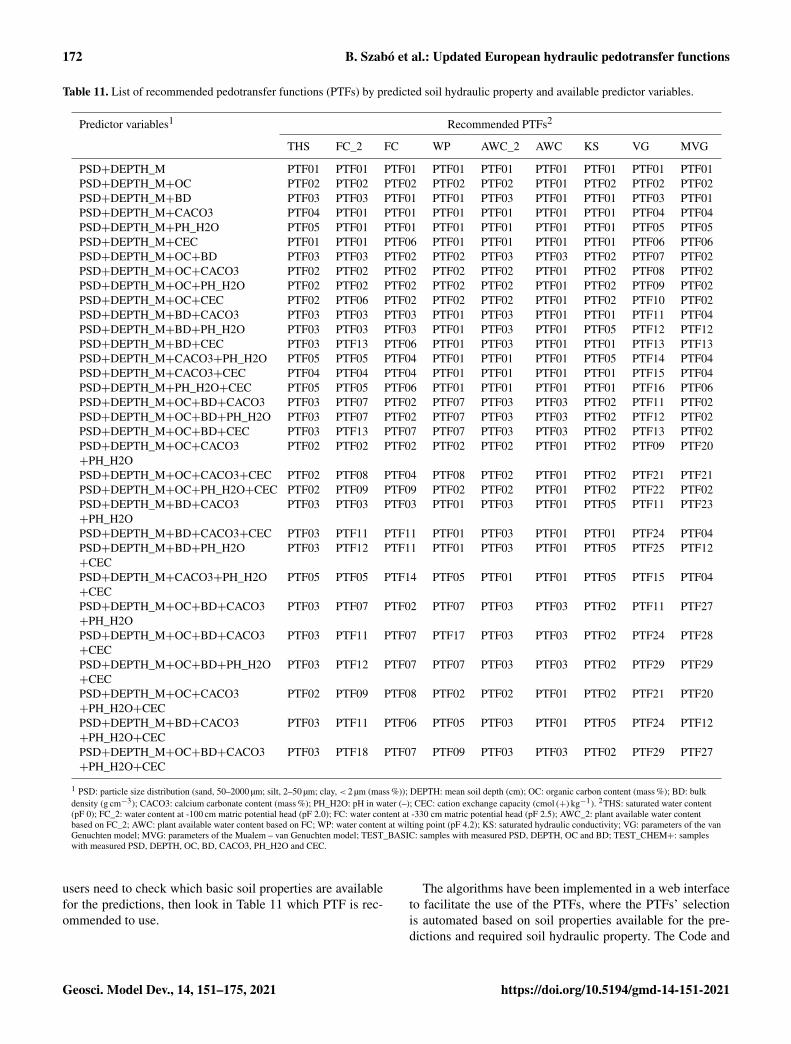
172 B. Szabó et al.: Updated European hydraulic pedotransfer functions
Table 11. List of recommended pedotransfer functions (PTFs) by predicted soil hydraulic property and available predictor variables.
Predictor variables1 Recommended PTFs2
THS FC_2 FC WP AWC_2 AWC KS VG MVG
PSD+DEPTH_M PTF01 PTF01 PTF01 PTF01 PTF01 PTF01 PTF01 PTF01 PTF01PSD+DEPTH_M+OC PTF02 PTF02 PTF02 PTF02 PTF02 PTF01 PTF02 PTF02 PTF02PSD+DEPTH_M+BD PTF03 PTF03 PTF01 PTF01 PTF03 PTF01 PTF01 PTF03 PTF01PSD+DEPTH_M+CACO3 PTF04 PTF01 PTF01 PTF01 PTF01 PTF01 PTF01 PTF04 PTF04PSD+DEPTH_M+PH_H2O PTF05 PTF01 PTF01 PTF01 PTF01 PTF01 PTF01 PTF05 PTF05PSD+DEPTH_M+CEC PTF01 PTF01 PTF06 PTF01 PTF01 PTF01 PTF01 PTF06 PTF06PSD+DEPTH_M+OC+BD PTF03 PTF03 PTF02 PTF02 PTF03 PTF03 PTF02 PTF07 PTF02PSD+DEPTH_M+OC+CACO3 PTF02 PTF02 PTF02 PTF02 PTF02 PTF01 PTF02 PTF08 PTF02PSD+DEPTH_M+OC+PH_H2O PTF02 PTF02 PTF02 PTF02 PTF02 PTF01 PTF02 PTF09 PTF02PSD+DEPTH_M+OC+CEC PTF02 PTF06 PTF02 PTF02 PTF02 PTF01 PTF02 PTF10 PTF02PSD+DEPTH_M+BD+CACO3 PTF03 PTF03 PTF03 PTF01 PTF03 PTF01 PTF01 PTF11 PTF04PSD+DEPTH_M+BD+PH_H2O PTF03 PTF03 PTF03 PTF01 PTF03 PTF01 PTF05 PTF12 PTF12PSD+DEPTH_M+BD+CEC PTF03 PTF13 PTF06 PTF01 PTF03 PTF01 PTF01 PTF13 PTF13PSD+DEPTH_M+CACO3+PH_H2O PTF05 PTF05 PTF04 PTF01 PTF01 PTF01 PTF05 PTF14 PTF04PSD+DEPTH_M+CACO3+CEC PTF04 PTF04 PTF04 PTF01 PTF01 PTF01 PTF01 PTF15 PTF04PSD+DEPTH_M+PH_H2O+CEC PTF05 PTF05 PTF06 PTF01 PTF01 PTF01 PTF01 PTF16 PTF06PSD+DEPTH_M+OC+BD+CACO3 PTF03 PTF07 PTF02 PTF07 PTF03 PTF03 PTF02 PTF11 PTF02PSD+DEPTH_M+OC+BD+PH_H2O PTF03 PTF07 PTF02 PTF07 PTF03 PTF03 PTF02 PTF12 PTF02PSD+DEPTH_M+OC+BD+CEC PTF03 PTF13 PTF07 PTF07 PTF03 PTF03 PTF02 PTF13 PTF02PSD+DEPTH_M+OC+CACO3+PH_H2O
PTF02 PTF02 PTF02 PTF02 PTF02 PTF01 PTF02 PTF09 PTF20
PSD+DEPTH_M+OC+CACO3+CEC PTF02 PTF08 PTF04 PTF08 PTF02 PTF01 PTF02 PTF21 PTF21PSD+DEPTH_M+OC+PH_H2O+CEC PTF02 PTF09 PTF09 PTF02 PTF02 PTF01 PTF02 PTF22 PTF02PSD+DEPTH_M+BD+CACO3+PH_H2O
PTF03 PTF03 PTF03 PTF01 PTF03 PTF01 PTF05 PTF11 PTF23
PSD+DEPTH_M+BD+CACO3+CEC PTF03 PTF11 PTF11 PTF01 PTF03 PTF01 PTF01 PTF24 PTF04PSD+DEPTH_M+BD+PH_H2O+CEC
PTF03 PTF12 PTF11 PTF01 PTF03 PTF01 PTF05 PTF25 PTF12
PSD+DEPTH_M+CACO3+PH_H2O+CEC
PTF05 PTF05 PTF14 PTF05 PTF01 PTF01 PTF05 PTF15 PTF04
PSD+DEPTH_M+OC+BD+CACO3+PH_H2O
PTF03 PTF07 PTF02 PTF07 PTF03 PTF03 PTF02 PTF11 PTF27
PSD+DEPTH_M+OC+BD+CACO3+CEC
PTF03 PTF11 PTF07 PTF17 PTF03 PTF03 PTF02 PTF24 PTF28
PSD+DEPTH_M+OC+BD+PH_H2O+CEC
PTF03 PTF12 PTF07 PTF07 PTF03 PTF03 PTF02 PTF29 PTF29
PSD+DEPTH_M+OC+CACO3+PH_H2O+CEC
PTF02 PTF09 PTF08 PTF02 PTF02 PTF01 PTF02 PTF21 PTF20
PSD+DEPTH_M+BD+CACO3+PH_H2O+CEC
PTF03 PTF11 PTF06 PTF05 PTF03 PTF01 PTF05 PTF24 PTF12
PSD+DEPTH_M+OC+BD+CACO3+PH_H2O+CEC
PTF03 PTF18 PTF07 PTF09 PTF03 PTF03 PTF02 PTF29 PTF27
1 PSD: particle size distribution (sand, 50–2000 µm; silt, 2–50 µm; clay, < 2 µm (mass %)); DEPTH: mean soil depth (cm); OC: organic carbon content (mass %); BD: bulkdensity (g cm−3); CACO3: calcium carbonate content (mass %); PH_H2O: pH in water (–); CEC: cation exchange capacity (cmol (+) kg−1). 2THS: saturated water content(pF 0); FC_2: water content at -100 cm matric potential head (pF 2.0); FC: water content at -330 cm matric potential head (pF 2.5); AWC_2: plant available water contentbased on FC_2; AWC: plant available water content based on FC; WP: water content at wilting point (pF 4.2); KS: saturated hydraulic conductivity; VG: parameters of the vanGenuchten model; MVG: parameters of the Mualem – van Genuchten model; TEST_BASIC: samples with measured PSD, DEPTH, OC and BD; TEST_CHEM+: sampleswith measured PSD, DEPTH, OC, BD, CACO3, PH_H2O and CEC.
users need to check which basic soil properties are availablefor the predictions, then look in Table 11 which PTF is rec-ommended to use.
The algorithms have been implemented in a web interfaceto facilitate the use of the PTFs, where the PTFs’ selectionis automated based on soil properties available for the pre-dictions and required soil hydraulic property. The Code and
Geosci. Model Dev., 14, 151–175, 2021 https://doi.org/10.5194/gmd-14-151-2021
B. Szabó et al.: Updated European hydraulic pedotransfer functions 173
data availability section provides information on how to ac-cess this resource.
5 Conclusions
The updated EU-PTFs – euptfv2 – perform significantly bet-ter than euptfv1 and are applicable for 32 predictor variablescombinations. Uncertainties of the predicted soil hydraulicproperties and model parameters can be computed. These un-certainties are, without further discrimination, related to theconsidered input data, predictors and the applied algorithm.The euptfv2 includes transfer functions to compute soil watercontent at saturation (0 cm matric potential head), field ca-pacity (both −100 and −330 cm matric potential head) andwilting point (−15 000 cm matric potential head), plant avail-able water content computed with field capacity at−100 and−330 cm matric potential head, saturated hydraulic conduc-tivity, and Mualem–van Genuchten parameters of the mois-ture retention and hydraulic conductivity curves. For analy-ses of the impact as well as the significance of the uncer-tainties on the predicted soil hydraulic properties and modelparameters, further studies are required.
Code and data availability. The current version of euptfv2 is avail-able from a user friendly web interface: https://ptfinterface.rissac.hu (last access: 4 January 2021, Szabó et al., 2019b) un-der the Creative Commons Attribution-NonCommercial 3.0 Un-ported License. The exact version of the model used to pro-duce the results used in this paper is archived on Zenodo(https://doi.org/10.5281/ZENODO.3759442, Szabó et al., 2020), asare the R scripts to develop the predictions and the derived pedo-transfer functions – in RData format – presented in this paper. Thetraining data set cannot be made publicly available due to legal re-strictions of the EU-HYDI dataset, thus only a test sample is pro-vided along with the model code. The R files are complied into anR package to use the pedotransfer functions, archived on Zenodo(https://doi.org/10.5281/zenodo.4281045, Weber et al., 2020b).
Supplement. The supplement related to this article is available on-line at: https://doi.org/10.5194/gmd-14-151-2021-supplement.
Author contributions. BS, TKDW and MW conceptualized thestudy and designed the methodology. BS supervised the research.MW cured the EU-HYDI dataset. BS, TKDW and MW preparedscripts for the statistical analysis, BS carried out the formal analy-sis, visualization and coordinated building of the PTF web interface.TKDW and BS built the R package with contributions of MW. BSand TKDW performed the validation. BS and TKDW wrote the pa-per with considerable input from MW.
Competing interests. The authors declare that they have no conflictof interest.
Acknowledgements. We are grateful to the individual scientists andtheir institutions in Europe who contributed to the establishment ofthe EU-HYDI database. We thank Gergely Tóth and Luca Mon-tanarella for supporting the initiative that led to the EU-HYDIdatabase. On behalf of the János Bolyai Research Scholarship weare grateful for the use of the MTA Cloud (https://cloud.mta.hu/, lastaccess: 4 January 2021), which significantly helped us achieve theresults published in this paper. We wish to thank Jeromos Rózsa fordefining the computing infrastructure. We also thank Dávid Gyurkófor building the web interface for the prediction algorithms.
Financial support. This research has been supported by the Hun-garian National Research, Development and Innovation Office(grant no. KH124765), the János Bolyai Research Scholarship ofthe Hungarian Academy of Sciences (grant no. BO/00088/18/4),and the German Research Foundation (grant no. SFB 1253/1 2017).
Review statement. This paper was edited by Wolfgang Kurtz andreviewed by three anonymous referees.
References
Araya, S. N. and Ghezzehei, T. A.: Using Machine Learning for Pre-diction of Saturated Hydraulic Conductivity and Its Sensitivityto Soil Structural Perturbations, Water Resour. Res., 55, 5715–5737, https://doi.org/10.1029/2018WR024357, 2019.
Assouline, S. and Or, D.: Conceptual and Parametric Representationof Soil Hydraulic Properties: A Review, Vadose Zone J., 12, 1–20, https://doi.org/10.2136/vzj2013.07.0121, 2013.
Børgesen, C. D. and Schaap, M. G.: Point and param-eter pedotransfer functions for water retention pre-dictions for Danish soils, Geoderma, 127, 154–167,https://doi.org/10.1016/j.geoderma.2004.11.025, 2005.
Botula, Y.-D., Nemes, A., Mafuka, P., Van Ranst, E., and Cornelis,W. M.: Prediction of Water Retention of Soils from the Hu-mid Tropics by the Nonparametric -Nearest Neighbor Approach,Vadose Zone J., 12, 1–17, https://doi.org/10.2136/vzj2012.0123,2013.
Boulesteix, A. L., Janitza, S., Kruppa, J., and König, I. R.: Overviewof random forest methodology and practical guidance with em-phasis on computational biology and bioinformatics, Wires. DataMin. Knowl., 2, 493–507, https://doi.org/10.1002/widm.1072,2012.
Breiman, L.: Random Forests, Mach. Learn., 45, 5–32, 2001.Deng, H., Ye, M., Schaap, M. G., and Khaleel, R.: Quantification of
uncertainty in pedotransfer function-based parameter estimationfor unsaturated flow modeling, Water Resour. Res., 45, W04409,https://doi.org/10.1029/2008WR007477, 2009.
van Genuchten, M. T.: A closed-form equation for predicting thehydraulic conductivity of unsaturated soils, Soil Sci. Soc. Am.J., 44, 892–898, 1980.
Greenwell, B.: Partial Dependence Plots, 15, available at: https://cran.r-project.org/web/packages/pdp/pdp.pdf (last access: 4 Jan-uary 2021), 2017a.
Greenwell, B. M.: pdp: An R Package for Constructing Partial De-pendence Plots, R J., 9, 421–436, available at: https://journal.
https://doi.org/10.5194/gmd-14-151-2021 Geosci. Model Dev., 14, 151–175, 2021

174 B. Szabó et al.: Updated European hydraulic pedotransfer functions
r-project.org/archive/2017/RJ-2017-016/RJ-2017-016.pdf (lastaccess: 4 January 2021), 2017b.
Hastie, T., Tibshirani, R., and Friedman, J.: The Elements of Sta-tistical Learning, Data Mining, Inference, and Prediction, 2ndEdn., Springer, available at: https://web.stanford.edu/~hastie/ElemStatLearn//printings/ESLII_print10.pdf (last access: 19November 2018), 2009.
Hengl, T., Nussbaum, M., Wright, M. N., and Heuvelink, B. M.:Random Forest as a Generic Framework for Predictive Modelingof Spatial and Spatio-temporal Variables, PeerJ Prepr., 6, e5518,https://doi.org/10.7287/peerj.preprints.26693v3, 2018.
Hodnett, M. G. and Tomasella, J.: Marked differences betweenvan Genuchten soil water-retention parameters for temperateand tropical soils: a new water-retention pedo-transfer func-tions developed for tropical soils, Geoderma, 108, 155–180,https://doi.org/10.1016/S0016-7061(02)00105-2, 2002.
Khodaverdiloo, H., Homaee, M., van Genuchten, M. T., andDashtaki, S. G.: Deriving and validating pedotransfer func-tions for some calcareous soils, J. Hydrol., 399, 93–99,https://doi.org/10.1016/j.jhydrol.2010.12.040, 2011.
Kotlar, A. M., Jong van Lier, Q., Barros, A. H. C., Iversen,B. V., and Vereecken, H.: Development and Uncertainty As-sessment of Pedotransfer Functions for Predicting Water Con-tents at Specific Pressure Heads, Vadose Zo.ne J., 18, 190063,https://doi.org/10.2136/vzj2019.06.0063, 2019.
Kuhn, M., Wing, J., Weston, S., Williams, A., Keefer, C., En-gelhardt, A., Cooper, T., Mayer, Z., Benesty, M., Lescarbeau,R., Ziem, A., Scrucca, L., Tang, Y., Candan, C., and Hunt, T.:Package “caret” Classification and Regression Training Descrip-tion Misc functions for training and plotting classification andregression models, available at: https://cran.r-project.org/web/packages/caret/caret.pdf (last access: 4 January 2021), 2017.
Kuhn, M., Wing, J., Weston, S., Keefer, C., Engelhardt, A., Cooper,T., Mayer, Z., Kenkel, B., Team, R. C., Benesty, M., Lescarbeau,R., Ziem, A., Scrucca, L., Tang, Y., Candan, C., and Hunt, T.:caret: Classification and Regression Training. R package version6.0-79, available at: https://github.com/topepo/caret/ (last access:4 January 2021), 2018.
Lal, R. and Shukla, M. K.: Principles of soil physics, MarcelDekker, Inc., New York, 2004.
Li, D., Gao, G., and Fu, B.: Predicting available water of soilfrom particle-size distribution and bulk density in an oasis –desert transect in northwestern China, J. Hydrol., 538, 539–550,https://doi.org/10.1016/j.jhydrol.2016.04.046, 2016.
Lilly, A., Nemes, A., Rawls, W. J., and Pachepsky, Y. A.: Proba-bilistic approach to the identification of input variables to esti-mate hydraulic conductivity, Soil Sci. Soc. Am. J., 72, 16–24,https://doi.org/10.2136/sssaj2006.0391, 2008.
Lin, H.: Earth’s Critical Zone and hydropedology: concepts, char-acteristics, and advances, Hydrol. Earth Syst. Sci., 14, 25–45,https://doi.org/10.5194/hess-14-25-2010, 2010.
Van Looy, K., Bouma, J., Herbst, M., Koestel, J., Minasny, B.,Mishra, U., Montzka, C., Nemes, A., Pachepsky, Y. A., Padar-ian, J., Schaap, M. G., Tóth, B., Verhoef, A., Vanderborght, J.,van der Ploeg, M. J., Weihermüller, L., Zacharias, S., Zhang,Y., and Vereecken, H.: Pedotransfer Functions in Earth SystemScience: Challenges and Perspectives, Rev. Geophys., 55, 1199–1256, https://doi.org/10.1002/2017RG000581, 2017.
Malone, B. P., McBratney, A. B., Minasny, B., and Laslett, G.M.: Mapping continuous depth functions of soil carbon stor-age and available water capacity, Geoderma, 154, 138–152,https://doi.org/10.1016/j.geoderma.2009.10.007, 2009.
McNeill, S. J., Lilburne, L. R., Carrick, S., Webb, T. H., and Cuthill,T.: Pedotransfer functions for the soil water characteristics ofNew Zealand soils using S-map information, Geoderma, 326,96–110, https://doi.org/10.1016/j.geoderma.2018.04.011, 2018.
Meinshausen, N.: Quantile Regression Forests, J. Mach. Learn.Res., 7, 983–999, 2006.
De Mendiburu, F.: agricolae: Statistical Procedures for AgriculturalResearch, R package version 1.2-8, available at: https://cran.r-project.org/package=agricolae (last access: 4 January 2021),2017.
Mualem, Y.: A new model for predicting the hydraulic conductivityof unsaturated porous media, Water Resour. Res., 12, 513–522,1976.
Nemes, A., Schaap, M., and Wösten, J.: Functional evaluation ofpedotransfer functions derived from different scales of data col-lection, Soil Sci. Soc. Am., 67, 1093–1102, 2003.
Nguyen, P. M., Haghverdi, A., Pue, J. De, Botula, Y., Le, K. V,Waegeman, W., and Cornelis, W. M.: Comparison of statisti-cal regression and data-mining techniques in estimating soil wa-ter retention of tropical delta soils, Biosyst. Eng., 153, 12–27,https://doi.org/10.1016/j.biosystemseng.2016.10.013, 2017.
Nussbaum, M., Spiess, K., Baltensweiler, A., Grob, U., Keller, A.,Greiner, L., Schaepman, M. E., and Papritz, A.: Evaluation ofdigital soil mapping approaches with large sets of environmentalcovariates, SOIL, 4, 1–22, https://doi.org/10.5194/soil-4-1-2018,2018.
Odgers, N. P., McBratney, A. B., and Minasny, B.: Digi-tal soil property mapping and uncertainty estimation us-ing soil class probability rasters, Geoderma, 237, 190–198,https://doi.org/10.1016/j.geoderma.2014.09.009, 2014.
Olson, R. S., La Cava, W., Mustahsan, Z., Varik, A., and Moore, J.H.: Data-driven advice for applying machine learning to bioin-formatics problems, in Biocomputing 2018, edited by: Altman,R. B., Dunker, A. K., Hunter, L., Ritchie, M. D., Murray, T. A.,and Klein, T. E., World Scientific, 192–203, 2018.
Pachepsky, Y. A. and Rawls, W. J.: Accuracy and Re-liability of Pedotransfer Functions as Affected byGrouping Soils, Soil Sci. Soc. Am. J., 63, 1748–1757,https://doi.org/10.2136/sssaj1999.6361748x, 1999.
R Core Team: R: A language and environment for statistical com-puting, available at: https://www.r-project.org (last access: 4 Jan-uary 2021), 2019.
Rawls, W., Pachepsky, Y., and Ritchie, J.: Effect of soil or-ganic carbon on soil water retention, Geoderma, 116, 61–76,https://doi.org/10.1016/S0016-7061(03)00094-6, 2003.
Ridgeway, G.: gbm: Generalized Boosted Regression Models, Rpackage version 2.1.3., 2017.
Román Dobarco, M., Cousin, I., Le Bas, C., and Mar-tin, M. P.: Pedotransfer functions for predicting avail-able water capacity in French soils, their applicability do-main and associated uncertainty, Geoderma, 336, 81–95,https://doi.org/10.1016/J.GEODERMA.2018.08.022, 2019.
Schaap, M. G.: Models for Indirect Estimation of Soil HydraulicProperties, in Encyclopedia of Hydrological Sciences, edited by:
Geosci. Model Dev., 14, 151–175, 2021 https://doi.org/10.5194/gmd-14-151-2021

B. Szabó et al.: Updated European hydraulic pedotransfer functions 175
Anderson, M. G. and McDonnell, J. J., John Wiley & Sons, Ltd,Chichester, UK, 2006.
Streck, T. and Weber, T. K. D.: Analytical expressionsfor noncapillary soil water retention based on popularcapillary retention models, Vadose Zone J., 19, e20042,https://doi.org/10.1002/vzj2.20042, 2020.
Szabó, B., Szatmári, G., Takács, K., Laborczi, A., Makó,A., Rajkai, K., and Pásztor, L.: Mapping soil hydraulicproperties using random-forest-based pedotransfer functionsand geostatistics, Hydrol. Earth Syst. Sci., 23, 2615–2635,https://doi.org/10.5194/hess-23-2615-2019, 2019a.
Szabó, B., Gyurkó, D., Weynants, M., and Weber, T. K. D.:Web interface for European hydraulic pedotransfer functions(euptfv2), Agártudományi Kutatóközpont, Talajtani Intézet,https://doi.org/10.34977/euptfv2.01, 2019b.
Szabó, B., Weynants, M., and Weber, T. K.: Scripts of updatedEuropean hydraulic pedotransfer functions (euptfv2), Zenodo,https://doi.org/10.5281/ZENODO.3759442, 2020.
Szatmári, G. and Pásztor, L.: Comparison of various un-certainty modelling approaches based on geostatistics andmachine learning algorithms, Geoderma, 337, 1329–1340,https://doi.org/10.1016/j.geoderma.2018.09.008, 2019.
Tomasella, J., Crestana, S. and Rawls, W. J.: Comparison of TwoTechniques to Develop Pedotransfer Functions for Water Reten-tion, Soil Sci. Soc. Am. J., 67, 1085–1092, 2003.
Tóth, B., Weynants, M., Nemes, A., Makó, A., Bilas, G.,and Tóth, G.: New generation of hydraulic pedotrans-fer functions for Europe, Eur. J. Soil Sci., 66, 226–238,https://doi.org/10.1111/ejss.12192, 2015.
Tóth, B., Weynants, M., Pásztor, L., and Hengl, T.: 3D soil hydraulicdatabase of Europe at 250 m resolution, Hydrol. Process., 31,2662–2666, https://doi.org/10.1002/hyp.11203, 2017.
Tranter, G., Minasny, B., and McBratney, A. B.: Estimating Pe-dotransfer Function Prediction Limits Using Fuzzy -Meanswith Extragrades, Soil Sci. Soc. Am. J., 74, 1967–1975,https://doi.org/10.2136/sssaj2009.0106, 2010.
Vaysse, K. and Lagacherie, P.: Using quantile regression forest toestimate uncertainty of digital soil mapping products, Geoderma,291, 55–64, https://doi.org/10.1016/j.geoderma.2016.12.017,2017.
Vereecken, H., Maes, J., Feyen, J., and Darius, P.: Estimat-ing the Soil Moisture Retention Characteristic From Texture,Bulk Density, and Carbon Content, Soil Sci., 148, 389–403,https://doi.org/10.1097/00010694-198912000-00001, 1989.
Vereecken, H., Huisman, J. A., Franssen Hendricks, H. J., Brügge-mann, N., Bogena, H. R., Kollet, S., Javaux, M., van der Kruk,J., and Vanderborght, J.: Soil hydrology: Recent methodologicaladvances, challenges, and perspectives, Water Resour. Res., 51,1–18, https://doi.org/10.1002/2014WR016852.Received, 2015.
Weber, T. K. D., Durner, W., Streck, T., and Diamantopoulos, E.: AModular Framework for Modeling Unsaturated Soil HydraulicProperties Over the Full Moisture Range, Water Resour. Res.,55, 4994–5011, https://doi.org/10.1029/2018WR024584, 2019.
Weber, T. K. D., Finkel, M., Conceição Gonçalves, M., Vereecken,H., and Diamantopoulos, E.: Pedotransfer function for theBrunswick soil hydraulic property model and comparisonto the van Genuchten-Mualem model, Water Resour. Res.,56, e2019WR026820, https://doi.org/10.1029/2019WR026820,2020a.
Weber, T. K. D., Weynants, M., and Szabó, B.: R package of up-dated European hydraulic pedotransfer functions (euptf2), Zen-odo, https://doi.org/10.5281/zenodo.4281045, 2020b.
Weynants, M. and Tóth, B.: The euptf package, Eur. Soil Portal, 5,available at: https://esdac.jrc.ec.europa.eu (last access: 19 May2019), 2014.
Weynants, M., Vereecken, H., and Javaux, M.: Revisit-ing Vereecken Pedotransfer Functions: Introducing aClosed-Form Hydraulic Model, Vadose Zone J., 8, 86,https://doi.org/10.2136/vzj2008.0062, 2009.
Weynants, M., Montanarella, L., Tóth, G., Arnoldussen, A., AnayaRomero, M., Bilas, G., Borresen, T., Cornelis, W., Daroussin, J.,Gonçalves, M. D. C., Haugen, L.-E., Hennings, V., Houskova,B., Iovino, M., Javaux, M., Keay, C. A., Kätterer, T., Kvaerno,S., Laktinova, T., Lamorski, K., Lilly, A., Mako, A., Matula, S.,Morari, F., Nemes, A., Patyka, N. V., Romano, N., Schindler, U.,Shein, E., Slawinski, C., Strauss, P., Tóth, B., and Woesten, H.:European HYdropedological Data Inventory (EU-HYDI), Scien-tific and Technical Research series, ISSN 1831-9424, Luxem-bourg, 2013.
Wiesmeier, M., Urbanski, L., Hobley, E., Lang, B., von Lützow,M., Marin-Spiotta, E., van Wesemael, B., Rabot, E., Ließ, M.,Garcia-Franco, N., Wollschläger, U., Vogel, H. J. and Kögel-Knabner, I.: Soil organic carbon storage as a key function of soils- A review of drivers and indicators at various scales, Geoderma,333, 149–162, https://doi.org/10.1016/j.geoderma.2018.07.026,2019.
Wösten, J. H. M., Lilly, A., Nemes, A., and Le Bas, C.: Develop-ment and use of a database of hydraulic properties of Europeansoils, Geoderma, 90, 169–185, 1999.
Wright, M. N. and Ziegler, A.: ranger: A Fast Implementation ofRandom Forests for High Dimensional Data in C++ and R,J. Stat. Softw., 77, 1–17, https://doi.org/10.18637/jss.v077.i01,2017.
Zhang, Y. and Schaap, M. G.: Weighted recalibration of the Rosettapedotransfer model with improved estimates of hydraulic param-eter distributions and summary statistics (Rosetta3), J. Hydrol.,547, 39–53, https://doi.org/10.1016/j.jhydrol.2017.01.004, 2017.
Zhang, Y. and Schaap, M. G.: Estimation of saturated hydraulic con-ductivity with pedotransfer functions: A review, J. Hydrol., 575,1011–1030, https://doi.org/10.1016/j.jhydrol.2019.05.058, 2019.
Zhao, H., Zeng, Y., Lv, S., and Su, Z.: Analysis of soil hy-draulic and thermal properties for land surface modeling overthe Tibetan Plateau, Earth Syst. Sci. Data, 10, 1031–1061,https://doi.org/10.5194/essd-10-1031-2018, 2018.
Ziegler, A. and König, I. R.: Mining data with random forests:Current options for real-world applications, Wires Data Min.Knowl., 4, 55–63, https://doi.org/10.1002/widm.1114, 2014.
https://doi.org/10.5194/gmd-14-151-2021 Geosci. Model Dev., 14, 151–175, 2021