updated energy and greenhouse gas emission results of fuel … · · 2008-01-22diesel fuel...
TRANSCRIPT
Updated Energy and Greenhouse Gas Emission Results of Fuel Ethanol
Michael Wang
Center for Transportation Research Argonne National Laboratory
9700 South Cass Avenue Argonne, IL 60439, USA (630) 252-2819 (phone) (630) 252-3443 (Fax)
The 15th International Symposium on Alcohol Fuels 26-28 September 2005 San Diego, CA, USA
Abstract In 2004, the U.S. used 3.4 billion gallons of fuel ethanol for blending with gasoline. Virtually all of it was produced from corn. The energy and environmental effects of use of corn-based ethanol has nonetheless been questioned. For example, a few researchers maintained that corn-based ethanol has a negative energy balance value (which means that more fossil energy is required to produce ethanol than the amount of energy in the produced ethanol) and results in increases in greenhouse gas (GHG) emissions relative to petroleum gasoline. Since 1997, the Center for Transportation Research of Argonne National Laboratory has been evaluating fuel ethanol’s energy and GHG emission impacts as part of its overall efforts of evaluating well-to-wheels energy and emission effects of various advanced vehicle technologies and transportation fuels. Argonne’s analysis, in agreement with many other recently completed studies, concludes that corn-based ethanol achieves energy and GHG emission reduction benefits, relative to gasoline. This is mainly because of 1) improved corn productivity in U.S. corn farms in the past 30 years; 2) reduced energy use in ethanol plants in the past 15 years; and 3) appropriately addressing of ethanol’s co-products. Furthermore, Argonne concludes that cellulosic ethanol to be produced from feedstocks such as woody or herbaceous biomass has much larger energy and GHG emission reduction benefits. This paper presents Argonne’s updated energy and GHG emission results of fuel ethanol in the U.S. Introduction After the second oil crisis in 1979, the U.S. government decided to promote use of ethanol in the U.S. transportation sector. Subsequently, in the 1990 Clean Air Act Amendments, Congress required use of ethanol in gasoline as an oxygenate to help reduce air pollutant emissions. Since 1980, use of fuel ethanol has increased from less than 200 million gallons in 1980 to 3.4 billion gallons in 2004 (Figure 1). Of the 3.4 billion gallons of ethanol used in 2004, the shares of

ethanol blends with gasoline are listed in Table 1. The recently adopted Energy Bill in the U.S. will require fuel ethanol use of 7.5 billion gallons a year by 2012.
0
1000
2000
3000
4000
5000
6000
7000
8000
1980
1981
1982
1983
1984
1985
1986
1987
1988
1989
1990
1991
1992
1993
1994
1995
1996
1997
1998
1999
2000
2001
2002
2003
2004
2005
2006
2007
2008
2009
2010
2011
2012
Mill
ions
of g
allo
ns
Actual ProductionEnergy Bill Requirement
0
1000
2000
3000
4000
5000
6000
7000
8000
1980
1981
1982
1983
1984
1985
1986
1987
1988
1989
1990
1991
1992
1993
1994
1995
1996
1997
1998
1999
2000
2001
2002
2003
2004
2005
2006
2007
2008
2009
2010
2011
2012
Mill
ions
of g
allo
ns
Actual ProductionEnergy Bill Requirement
0
1000
2000
3000
4000
5000
6000
7000
8000
1980
1981
1982
1983
1984
1985
1986
1987
1988
1989
1990
1991
1992
1993
1994
1995
1996
1997
1998
1999
2000
2001
2002
2003
2004
2005
2006
2007
2008
2009
2010
2011
2012
Mill
ions
of g
allo
ns
Actual ProductionEnergy Bill Requirement
Figure 1. Annual Fuel Ethanol Use in the U.S. (Historical data is from Renewable Fuels
Association [2005] and future use is the 2005 Energy Bill requirement)
Table 1. Ethanol Use in Different Ethanol Blends in 2004 (RFA, 2005)
Ethanol Use Million Gallons Share of Total Federal reformulated gasoline (RFG) 1,950 54.6% Conventional gasoline 1,050 29.4% Federal winter oxygenate fuels 290 8.2% Minnesota ethanol program 280 7.8% Total 3,570 100%
At present, virtually all U.S. fuel ethanol is produced from fermentation of corn in dry and wet milling plants, most of which are located in U.S. Midwest states. In 2004, two-thirds of U.S. total fuel ethanol was produced from dry mill plants and the remaining one-third from wet mill plants. For comparison, Brazil is World’s largest fuel ethanol producer. In 2004, Brazil produced about 4 billion gallons of ethanol. Its ethanol is produced from sugarcane. Besides corn-based and sugarcane-based ethanol, ethanol can be produced from cellulosic biomass through fermentation of cellulose and semi-cellulose. At present, cellulosic ethanol technology is at the research and development (R&D) stage. The U.S. Department of Energy (DOE) has extensive R&D efforts on cellulosic ethanol. The potentials of cellulosic ethanol in terms of resource supply and energy and environmental benefits are much greater than those of corn ethanol.

Energy and environmental effects of using fuel ethanol in the U.S. have been debated since the inception of the fuel ethanol program in 1980. Over the past 25 years, more than 20 studies were published on the so-called energy balance of corn ethanol. In those studies, energy balance is usually defined as the energy in a gallon of ethanol minus the total fossil energy input (including energy in petroleum, natural gas, and petroleum) consumed to make that gallon of ethanol. Through late 1970s to 1980s, several studies concluded that corn ethanol resulted in negative energy balance. But most recent studies concluded that corn ethanol indeed has positive energy balance, except for a few studies conducted by Pimentel and his co-authors which maintain that corn ethanol still has negative energy balance. Since 1980s, the Center for Transportation Research of Argonne National Laboratory has conducted life cycle analyses of energy and emission effects of transportation fuels for U.S. DOE. With DOE support, Argonne began to develop the GREET (Greenhouse gases, Regulated Emissions, and Energy use in Transportation) model in 1995. The GREET model is a life cycle model for transportation fuels and vehicle technologies. It contains more than 85 transportation fuel pathways. Among them, four are fuel ethanol pathways (corn dry mill ethanol, corn wet mill ethanol, woody cellulosic ethanol, and herbaceous cellulosic ethanol). The GREET model and its documentation are posted at Argonne’s GREET website at http:/greet.anl.gov. At present, there are more than 2,000 registered GREET users worldwide. Since 1997, Argonne has applied, updated, and upgraded the GREET model to evaluate fuel ethanol’s energy and emission efforts relative to petroleum gasoline. In 1997, Argonne published its findings of an ethanol analysis that was conducted for State of Illinois (Wang et al. 1997). Subsequently, with DOE support, Argonne continued its effort of analyzing fuel ethanol (Wang et al. 1999a, Wang et al. 1999b). In 2003, with support of Sate of Illinois, Argonne analyzed potential effects of blending ethanol into diesel (Wang et al., 2003). This paper presents updated energy and GHG emission results of fuel ethanol that are generated with the most current version of the GREET model. Energy Balance of Fuel Ethanol Energy balance for an energy product is defined as the energy content of a unit of the energy product minus fossil energy inputs to make it. Calculations of fossil energy inputs include all key activities in production of the energy product. The GREET model can estimate energy inputs to produce transportation fuels including ethanol. Although GREET does not explicitly present energy balance values of different transportation fuel products, its intermediate results do contain information of energy balance values. Figure 2 shows the key activities that are included in energy balance calculations for both corn-based ethanol and petroleum gasoline by the GREET model. For corn ethanol, GREET includes fertilizer production, fertilizer transportation from plants to farms, corn farming, corn transportation from farms to ethanol plants, ethanol production, and ethanol transportation from ethanol plants to refueling stations. For petroleum gasoline, GREET includes petroleum recovery, petroleum transportation from oil fields to petroleum refineries, gasoline production in refineries, and gasoline transportation from petroleum refineries to refueling stations.

As Figure 2 shows, GREET simulations conclude that 0.74 million Btu of fossil energy is consumed for each million Btu of ethanol available at refueling stations. Thus, Argonne’s GREET simulations show a positive energy balance value for corn ethanol. On the other hand, 1.23 million Btu of fossil energy is consumed for each million Btu of gasoline available at refueling stations. That is, production of gasoline has a negative energy balance value. Note that in GREET calculations, the energy used to produce a fuel as well as the energy contained in the fuel are taken into account. For example, for a kWh of electricity used, GREET takes into account the 3,412 Btu contained in that kWh and the energy loss in electric power plants to produce that kWh of electricity. The same applies for other energy products such as gasoline, diesel, natural gas, etc. One may wonder why corn has a positive energy balance while petroleum gasoline has a negative energy balance. The difference is primarily caused by the definition of energy balance calculations (energy in an energy product minus fossil energy use to produce that energy product). In the corn ethanol case, the feedstock of ethanol production is corn whose energy is from solar energy through photosynthesis. Solar energy is not considered in energy balance calculation. This is because solar energy is renewable and is not subject to resource depletion (as opposite to fossil energy). In the case of petroleum gasoline, the feedstock of gasoline production is petroleum whose Btu is taken into account in energy balance calculation.
Figure 2. Activities Included in Energy Balance Calculations for Corn Ethanol and Petroleum Gasoline

Figure 3 presents energy balance calculations for U.S. electricity generation. The U.S. generates 54% of its electricity from coal, 14% from natural gas, 1% from oil, 18% from nuclear energy, and the remaining 13% from other sources such as hydro-power. Figure 3 shows that for U.S. average electricity, 2.34 million of fossil energy is consumed for a million Btu of electricity available at wall outlet. Fossil fuel powered electric plants have an energy conversion efficiency of about 35%. Thus, fossil electric power plants in the U.S. may require 2.96 million Btu of fossil energy per 1 million Btu of electricity generated. The fossil energy requirement of 2.34 million Btu, instead of 2.96 million Btu, for U.S. average electricity generation is due to the fact that a significant amount of U.S. electricity is generated from nuclear energy and hydro-power, which are not taken into account in fossil energy requirement calculations.
Coal Mining
CoalTransportation
NGProcessing
NGTransmission
NGRecovery
Coal NG
Diesel FuelElectricity
NG
Diesel Fuel
NGElectricity
LPG, NGLs
NGElectricity
Electricity Generation
Electricity Transmissionand Distribution (8% loss)
1 mm Btu of Electricityat Wall Outlets
Uranium Ore Recovery Petroleum
Recovery
Uranium Petroleum
Uranium OreTransportation
PetroleumTransportation
OtherPetroleumProducts
Residual Oil
ElectricityDiesel Fuel
NG
Uranium Enrichment
Petroleum Refinery
Electricity
Refinery Gas
CoalNG
Uranium Fuel Transportation
Residual Oil TransportationDiesel Fuel
Residual Oil
ElectricityNG
Diesel FuelElectricity
NG
U.S. Electricity Generation:2.34 mm Btu Fossil Energy Input
Coal Mining
CoalTransportation
NGProcessing
NGTransmission
NGRecovery
Coal NG
Diesel FuelElectricity
NGDiesel FuelElectricity
NG
Diesel Fuel
NGElectricity
LPG, NGLs
NGElectricity
Electricity Generation
Electricity Transmissionand Distribution (8% loss)
1 mm Btu of Electricityat Wall Outlets
Uranium Ore Recovery Petroleum
Recovery
Uranium Petroleum
Uranium OreTransportation
PetroleumTransportation
OtherPetroleumProducts
Residual Oil
ElectricityDiesel Fuel
NGResidual Oil
ElectricityDiesel Fuel
NG
Uranium Enrichment
Petroleum Refinery
Electricity
Refinery Gas
CoalNG
Electricity
Refinery Gas
CoalNG
Uranium Fuel Transportation
Residual Oil TransportationDiesel Fuel
Residual Oil
ElectricityNG
Diesel FuelResidual Oil
ElectricityNG
Diesel FuelElectricity
NG
Diesel FuelElectricity
NG
U.S. Electricity Generation:2.34 mm Btu Fossil Energy Input
Figure 3. Calculation of Fossil Energy Balance of U.S. Electricity Generation The above discussion shows fossil energy balance results for corn ethanol, petroleum gasoline, and U.S. average electricity. Figure 4 further summarizes energy balance results for the three energy products plus cellulosic ethanol and coal. Among the five energy products, cellulosic and corn ethanol have positive energy balances, which are caused by the fact that solar energy is the ultimate energy feedstock for ethanol production. The huge positive energy balance for cellulosic ethanol is caused by little use of fertilizer for farming of cellulosic biomass and use of the unfermentable portion of biomass in cellulosic ethanol plants to generate steam and electricity.

-1.5
-1.0
-0.5
0.0
0.5
1.0
Cell. EtOH Corn EtOH Coal Gasoline U.S. Electricity
Net
Fos
sil E
nerg
y Va
lue
(mill
ion
Btu/
mill
ion
Btu
)
Figure 4. Fossil Energy Balance Values of Five Energy Products Estimated with GREET
One might conclude from Figure 4 that gasoline production and electricity generation, both of which have large negative fossil energy balance values, should be eliminated. This obvious wrong conclusion is caused by the deficiency of fossil energy balance values themselves. By adding all fossil Btus together, energy balance calculations fail to address the fact that different energy products have very different qualities. For example, while electricity suffers a large negative energy balance, it is a high-quality energy product that our daily life depends heavily on it. In practice, there is no substituting energy product for most of electricity uses. Similar, gasoline is a premium transportation fuel for internal combustion engine use. We cannot, and should not, make energy choice decisions based solely on energy balance values of individual energy products. Yet, energy balance values have been a focal, but misguided, point in ethanol policy debates. Key Technical Issues for Corn Ethanol An objective evaluation of corn ethanol’s energy and environmental effects should take into account key technical issues regarding improvements in energy efficiencies of key production activities and ethanol’s co-products. Among activities for corn ethanol production pathway, fertilizer production, corn farming, ethanol production, and co-products of ethanol plants are key activities and factors determining corn ethanol’s energy and emission results. Nitrogen Fertilizer Production

Corn farming requires intensive nitrogen fertilizer use. Wang et al. (2003) examined recent trend in energy intensity of nitrogen fertilizer production. Because of the dramatic increase in natural gas price in North America in recent years, many North American nitrogen fertilizer plants were shut down. Consequently, the U.S. has increased its nitrogen fertilizer import. Nitrogen fertilizer plants that have been recently built outside of North America are shown with improved energy efficiencies. GREET simulations take into account this recent trend of nitrogen fertilizer production. Corn Farming The U.S. has about 80 million acres of corn farms to produce more than 11 billion bushels of corn a year. Over the past 100 years, the U.S. corn yield per acre has increased nearly 8 times to above 140 bushels an acre (Perlack et al., 2005). However, the increase in per-acre corn yield in early years was resulted from increased inputs of chemicals, especially nitrogen fertilizer, to corn farms. While such increases through high chemical inputs helped per-acre corn production, they did not help corn yield per unit of fertilizer input, which is directly related to corn ethanol’s energy and emission effects. Figure 5 shows the change in corn productivity, defined as bushels of corn per pound of nitrogen, phosphate, and potassium fertilizer used. This index is a better representative of corn productivity’s effect on corn ethanol’s energy and emission effects. As the chart shows, since mid-1980s, corn productivity has gone up by about 70%. Because of efforts such as precision farming and better corn varieties from seeds companies, it is anticipated in the agricultural community that the uptrend in corn productivity will continue into future years.
0.30
0.35
0.40
0.45
0.50
0.55
0.60
0.65
1965 1970 1975 1980 1985 1990 1995 2000 2005
Bus
hels
/lb. F
ertil
izer
?
Precision farming, etc.?
0.30
0.35
0.40
0.45
0.50
0.55
0.60
0.65
1965 1970 1975 1980 1985 1990 1995 2000 2005
Bus
hels
/lb. F
ertil
izer
0.30
0.35
0.40
0.45
0.50
0.55
0.60
0.65
1965 1970 1975 1980 1985 1990 1995 2000 2005
Bus
hels
/lb. F
ertil
izer
?
Precision farming, etc.?
Figure 5. Historical Trend of Corn Productivity (based on USDA data, results are 3-year moving
averages in order to limit yield fluctuations in individual years caused by weather)

Energy Use in Ethanol Plants Both wet and dry milling ethanol plants produce fuel ethanol in the U.S. In wet milling ethanol plants, corn oil, gluten, and other high-value products are produced with ethanol. In dry milling plants, ethanol is produced from fermentation of starch, and the residues from fermentation become high-protein distillers’ dry grains and solubles (DDGS) as animal feeds. Wet milling plants are much larger than dry milling plants and require larger capital investments. Prior to 2000, more ethanol was produced from wet milling plants than from dry milling plants. But now more ethanol is produced from dry milling plants than from wet milling plants. Ethanol plants in operation in 1980s usually had high energy use per gallon of ethanol produced. Energy cost is the second largest cost item after corn feedstock cost for ethanol plant operation. For economic reasons, ethanol plant design engineering firms and plant operators have made efforts to reduce energy use in ethanol plants and to increase ethanol yield per bushel of corn. For example, ethanol yield has been increased from less than 2.5 gallons per bushel of corn in 1980s to 2.7 gallons now. As a result, energy use per gallon of ethanol produced has been reduced significantly. Figure 6 shows that in 20 years, per-gallon energy use has been reduced by more than 20% in wet milling plants and by more than 40% in dry milling plants. Efforts are continued to increase in ethanol yield in corn ethanol plants and there is new interest in use of crop residues in place of natural gas and coal in ethanol plants. These will continue to help corn ethanol’s energy and emission results.
0
10,000
20,000
30,000
40,000
50,000
60,000
70,000
80,000
Wet Mill Dry Mill
Btu
/Gal
lon
1980s2000s
Figure 6. Energy Use Per Gallon of Ethanol Produced in Corn Ethanol Plants (from Argonne’s
discussion with ethanol plant designers, recent USDA survey data, and other reported data) Co-Products in Ethanol Plants In a typical dry milling ethanol plant, of the total mass of corn kernels, one-third ends up in ethanol, one-third in DDGS, and one-third in CO2. Although CO2 is collected in some ethanol

plants as a commercial product for beverage use, in GREET simulations, Argonne has not considered CO2 as a co-product in ethanol plants. On the other hand, DDGS from ethanol plants is a commercial product sold in the animal feed market. In fact, many ethanol plants’ economics depends partly on sale of DDGS. Figure 7 shows the DDGS consumption in North America. It shows that dairy and beef farms are the two major markets for ethanol plants’ DDGS. Besides these, there is some amount of DDGS export, primarily to the European animal feed market.
Dairy: 46%
Beef: 39%
Poultry: 4%
Swine: 11%
Figure 7. 2003 North American Distillers’ Dry Grains and Solubles Consumption (RFA, 2005) Thus, in practice, animal feeds are a co-product with ethanol in ethanol plants and have market values. In evaluating ethanol’s energy and emission effects, animal feed co-products need to be taken into account. Table 2 shows five potential methods to address co-products of ethanol plants. The weight-based method splits total energy and emission burdens of corn farming and ethanol production between ethanol and animal feeds according to their weight output shares in ethanol plants. Similarly, the energy content-based method splits total energy and emission burdens according to energy output shares, and the market value-based method according to market value shares of products. The process energy-based method analyzes energy use of individual processes in ethanol plants. If a process is in place in ethanol plants for ethanol production, the energy use of this process is allocated to ethanol production. On the other hand, if a process (such as animal feed drying) is in place for animal feed production, its energy use is allocated to animal feed production. With the displacement method (also called the system boundary expansion method in the field of life cycle analysis), the product that is to be displaced by DDGS is determined first. Energy and emission burdens of producing the otherwise displaced product are then estimated. The estimated energy and emission burdens are credits that are subtracted from total energy and emission burdens of the ethanol production cycle.

Table 2. The Allocated Share of Total Energy Burdens for Production of Ethanol’s Co-Products
Method Dry Milling Plant Wet Milling Plant Weight-based 51% 52% Energy content-based 39% 43% Market value-based 24% 30% Energy use of individual processes 41% 36% Displacement 20% 16%
Table 2 presents the amount of energy that is allocated to animal feeds according to the five methods. Of the five methods, Argonne uses the displacement method, the most conservative one for estimating corn ethanol’s energy and emission benefits, in its analysis. This is because the displacement method is the most defensible and robust method in dealing with co-products in the situation where co-products have very different values and purposes (e.g., energy value for ethanol vs. nutrition value for animal feed). Note that studies by Pimentel generally dismiss co-products of ethanol plants. That is, those studies do not give any credits to commercial animal feeds that are produced in ethanol plants. GREET Comparative Energy and GHG Emission Results of Ethanol vs. Gasoline In a previous section, we alluded that the energy balance values per se cannot be used to make energy choice decisions. In this section, we present energy and GHG emission impacts of fuel ethanol relative to petroleum gasoline to show fuel ethanol’s relative energy and emission merits. In our analysis includes both corn and cellulosic ethanol. While corn ethanol is from fermentation of corn starch, cellulosic ethanol is from fermentation of cellulose and semi-cellulose of cellulosic biomass such as grass and trees that are grown in managed biomass farms. Other cellulosic biomass feedstocks such as crop residues (such as corn stover, wheat straw, and rice straw, etc.), forest residues, and municipal solid waste could also be used for cellulosic ethanol production. We have not evaluated energy and GHG emission effects of cellulosic ethanol from those feedstocks. Figure 8 presents a simplified schematic of cellulosic ethanol production. Cellulosic biomass is pretreated in ethanol plants and then goes through fermentation to produce ethanol from cellulose and semi-cellulose. The unfermentable portion of biomass is used to generate steam and electricity that are needed for ethanol plant operation. In fact, this plant design generates the amount of electricity exceeding the amount needed for plant operation, resulting in a net export of co-generated electricity from cellulosic ethanol plants to the electric grid. This plant design is currently under intensive R&D efforts by governments and industries. In contrary, a recent study by Pimentel and Patzek (2005) assumed that fossil fuels are to be used to generate steam and electricity needed for cellulosic ethanol plants. The authors did not discuss how the unfermentable portion of biomass in cellulosic ethanol plants is dealt with. Thanks to this assumption, the authors showed a negative energy balance of cellulosic ethanol that is larger than their estimated negative energy balance value for corn ethanol. But other studies, including Argonne’s studies, have consistently shown a huge positive energy balance of cellulosic ethanol.

Steam
Biomass Feedstock Pretreatment Fermentation Separation
Power Plant: Gas and/or Steam Turbine Electricity Effluent
Discharge
Emissions
Fuel Ethanol
Wastewater
Emissions Emissions
EmissionsSolid Residue and Methane Wastewater
Treatment
Steam
Biomass Feedstock Pretreatment Fermentation Separation
Power Plant: Gas and/or Steam Turbine Electricity Effluent
Discharge
Emissions
Fuel Ethanol
Wastewater
Emissions Emissions
EmissionsSolid Residue and Methane Wastewater
Treatment
Steam
Biomass Feedstock Pretreatment Fermentation Separation
Power Plant: Gas and/or Steam Turbine Electricity Effluent
Discharge
Emissions
Fuel Ethanol
Wastewater
Emissions Emissions
EmissionsSolid Residue and Methane Wastewater
Treatment
Figure 8. Schematic of Cellulosic Ethanol Plant Design Under Intensive R&D Efforts Figure 9 shows energy use per Btu of fuel available at refueling stations for petroleum-based reformulated gasoline (RFG), corn ethanol from dry milling plants, corn ethanol from wet milling plants, and cellulosic ethanol. The results are basically those of energy balance calculations. That is, the figure shows for a unit of energy product, how much energy is used. The figure presents energy effects for three energy types – total energy use, fossil energy use, and petroleum use. Total energy use includes both renewable Btus and fossil Btus. Fossil Btus include those in coal, natural gas, and petroleum. Of the three energy types in Figure 9, the type on the right is a subset of the immediate left type. The separation of energy use in these three types is intended to show that depending on the type of energy under evaluation, the results between ethanol and gasoline could be very different. For example, if one focuses on total energy results, all ethanol types are worse than RFG, and cellulosic ethanol has the highest total energy use. When one focuses on fossil energy results, corn ethanol shows moderate fossil energy reduction relative to RFG, and cellulosic ethanol has huge reduction. Furthermore, if one focuses on petroleum use, both corn and cellulosic ethanol have huge reductions relative to RFG. This is because while a significant amount of fossil energy is used to produce corn ethanol, most of the fossil energy use is coal and natural gas. This chart demonstrates the importance of the type of energy as well as the amount energy in comparing ethanol to gasoline.

0.0
0.5
1.0
1.5
2.0
2.5
RFG CornEtOH:
DM
CornEtOH:
WM
Cell.EtOH
RFG CornEtOH:
DM
CornEtOH:
WM
Cell.EtOH
RFG CornEtOH:
DM
CornEtOH:
WM
Cell.EtOH
Btu for Fuel ProductionBtu in Fuel
Figure 9. Total Btu Consumed for One Btu of Gasoline and Ethanol Available at Refueling
Stations In the context of fuel cycle analysis, Figure 9 presents results for the so-called well-to-pump activities. A more complete comparison is to use well-to-wheels results by taking into account fuel use in motor vehicles. Figure 10 presents relative changes in energy use by fuel ethanol relative to RFG for each mile driven on the well-to-wheels basis. At present, most fuel ethanol is used in blending with gasoline at lower blending levels (5.7-10% of ethanol by volume). On the other hand, it is estimated that there are 4-6 million flexible-fuel vehicles (FFVs) capable of using E85 (about 81% ethanol and 19% gasoline by volume). We thus include both E10 and E85 in Figure 10.

2.1% 4.7%
24.3%
52.3%
-3.2% -6.5%
-32.9%
-69.1%
-6.3% -6.3%
-69.5% -70.0%
-80%
-60%
-40%
-20%
0%
20%
40%
60%
E10 GV:CornEtOH
E10 GV:Cell.EtOH
E85FFV:CornEtOH
E85FFV:Cell.EtOH
E10 GV:CornEtOH
E10 GV:Cell.EtOH
E85FFV:CornEtOH
E85FFV:Cell.EtOH
E10 GV:CornEtOH
E10 GV:Cell.EtOH
E85FFV:CornEtOH
E85FFV:Cell.EtOH
Total Energy
Fossil Energy Petroleum Energy
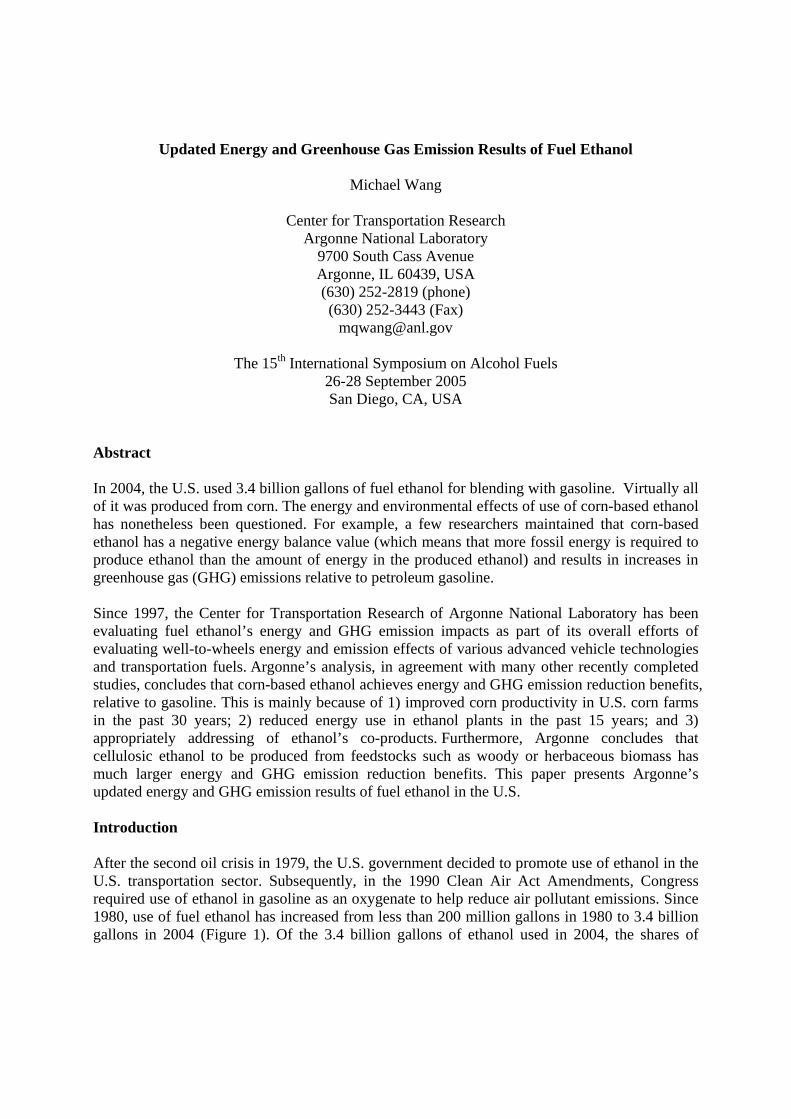
Figure 10. Change of Per-Mile Energy Use by Ethanol Blend to Displace Gasoline Figure 10 shows that use of E85 achieves much greater reductions in fossil energy and petroleum energy than use of E10 does for each mile driven. This is because E85 contains much less gasoline than E10 does. Furthermore, use of cellulosic ethanol achieves much greater reductions that use of corn ethanol does. Thus, move to cellulosic E85 from corn E10 in the future will help achieve larger energy benefits for fuel ethanol. Use of fuel ethanol may result in GHG emission reductions mainly because the carbon in fuel ethanol is carbon from the air during biological plant growth via photosynthesis (Figure 11). Of course, the activities of the carbon cycle with ethanol require fossil fuel use and generate GHG emissions. Thus, use of ethanol to displace gasoline does not result in 100% reduction in GHG emissions.
Ethanol plant
Carbon inethanol
Carbon incorn kernels
Carbonin soil
Carbonin cropresidue
CO2 viaphotosynthesis CO2 in the
atmosphere
CO2 emissionsfrom ethanolcombustion
CO2 emissionsduring
fermentation
Figure 11. Recycling of Carbon in Fuel Ethanol Production and Use Figure 12 shows GHG emission reductions of E10 and E85 vs. RFG for each mile driven on the well-to-wheels basis. The results are similar to those of fossil energy results in Figure 10. GHG emission results are CO2-equivalent emissions of CO2, methane (CH4), and nitrous oxide (N2O). Note that there is a large amount of N2O emissions associated with corn ethanol production that are caused from nitrification and denitrification of nitrogen fertilizer in cornfields, which are included in GREET simulations. Figure 12 shows that per mile driven, E85 achieves much greater GHG emission reductions than E10 does, and that cellulosic ethanol achieves much greater GHG emission reductions than corn ethanol does.

-2% -2%-6%
-23%-17%
-64%
-80%
-60%
-40%
-20%
0%
E10 GV: DMCorn EtOH
E10 GV: WMCorn EtOH
E10 GV: Cell.EtOH
E85 FFV: DMCorn EtOH
E85 FFV: WMCorn EtOH
E85 FFV:Cell. EtOH
Figure 12. Reductions in Per-Mile GHG Emissions by Ethanol Blend to Displace Gasoline Figure 12 presents GHG emission reductions on the per-mile basis. This is basically from individual drivers’ point of view. On the other hand, ethanol producers may be interested in GHG emission reductions for each gallon of ethanol used. Figure 13 shows GHG emission reductions of fuel ethanol relative to RFG for a gallon of ethanol used to displace an anergy equivalent amount of RFG. The chart shows that ethanol use in either E10 or E85 helps reduce GHG emissions. For corn ethanol, per-gallon GHG emission reductions range from 18% to 29%, depending on dry or wet milling ethanol plants and on use of E10 or E85. On the other hand, use of a gallon of cellulosic ethanol helps reduce GHG emissions by more than 85% relative to GHG emissions of RFG.

-26%-18%
-85%
-29%-21%
-86%
-100%
-80%
-60%
-40%
-20%
0%
E10 GV: DMCorn EtOH
E10 GV: WMCorn EtOH
E10 GV: Cell.EtOH
E85 FFV: DMCorn EtOH
E85 FFV: WMCorn EtOH
E85 FFV: Cell.EtOH
Figure 13. GHG Emission Reductions Per Gallon of Ethanol to Displace An Energy-Equivalent
Amount of Gasoline GREET results show that cellulosic ethanol can achieve much greater energy and GHG emission reduction benefits that corn ethanol does. From potential resource supply point of view, cellulosic ethanol also has a much larger supply basis than corn ethanol does. This is explained below. In 2004, the U.S. produced 3.4 billion gallons of corn ethanol, which consumed about 12% of total U.S. corn production in that year. On the other hand, the 3.4 billion gallons of ethanol are equivalent to 2.27 billion gallons of gasoline (a gallon of ethanol contains two-thirds of the energy of a gallon of gasoline). In 2003, the U.S. consumed 134 billion gallons of gasoline and 39 billion gallons of diesel fuels (EIA, 2005). With 12% of the U.S. corn consumed for ethanol production, the amount of ethanol accounted only for 1.7% of the U.S. gasoline market. If 7.5 billion gallons of ethanol (as required in the adopted Energy Bill) in 2012 is produced from corn, that may account for less than 4% of the U.S. gasoline market then. But production of 7.5 billion gallons of corn ethanol may already consume about 20% of U.S. corn production then. Thus, relative to the U.S. gasoline market size, corn ethanol’s role of transportation fuels will be limitged. In the past, the tradeoff between food and fuel for corn was debated. Though at the global scale, this debate may warrant some merit, within the U.S. content, the debate may be less relevant, since the U.S. produces too much corn, relative to its own consumption. In addition, the food vs. fuel debate failed to take into account the fact that even with ethanol production, the protein portion of the corn virtually ends in the food market via animal feeds.

On the other hand, Perlack et al. (2005) estimate that cellulosic biomass supply resources could be as much as 1.3 billion dry tons per year (Figure 14), which could produce more than 100 billion gallons of ethanol a year. Similarly, the Natural Resource Defense Council (Greene et al., 2005) recently reached a conclusion that the potential scale of cellulosic ethanol production from managed biomass farms such as switchgrass farms could be huge.
0
20
40
60
80
100
120
products industry
wastes
Forest growth
Fuel tre
atments (fo
restlands)
Logging and other res
idues
Urban wood residues
Fuelwood
Fore
st 0
100
200
300
400
Perennial crops
Corn stov er
Grains to biofuels
Whea t stra
w
Soybeans
Othe r crop re
s idues
Othe r residues
Manures
CRP biomass
Sma ll gra in re
sidues
Mil.
dry
tons
per
yea
r
0
20
40
60
80
100
120
products industry
wastes
Forest growth
Fuel tre
atments (fo
restlands)
Logging and other res
idues
Urban wood residues
Fuelwood
Fore
st 0
20
40
60
80
100
120
products industry
wastes
Forest growth
Fuel tre
atments (fo
restlands)
Logging and other res
idues
Urban wood residues
Fuelwood
Fore
st 0
100
200
300
400
Perennial crops
Corn stov er
Grains to biofuels
Whea t stra
w
Soybeans
Othe r crop re
s idues
Othe r residues
Manures
CRP biomass
Sma ll gra in re
sidues
Mil.
dry
tons
per
yea
r
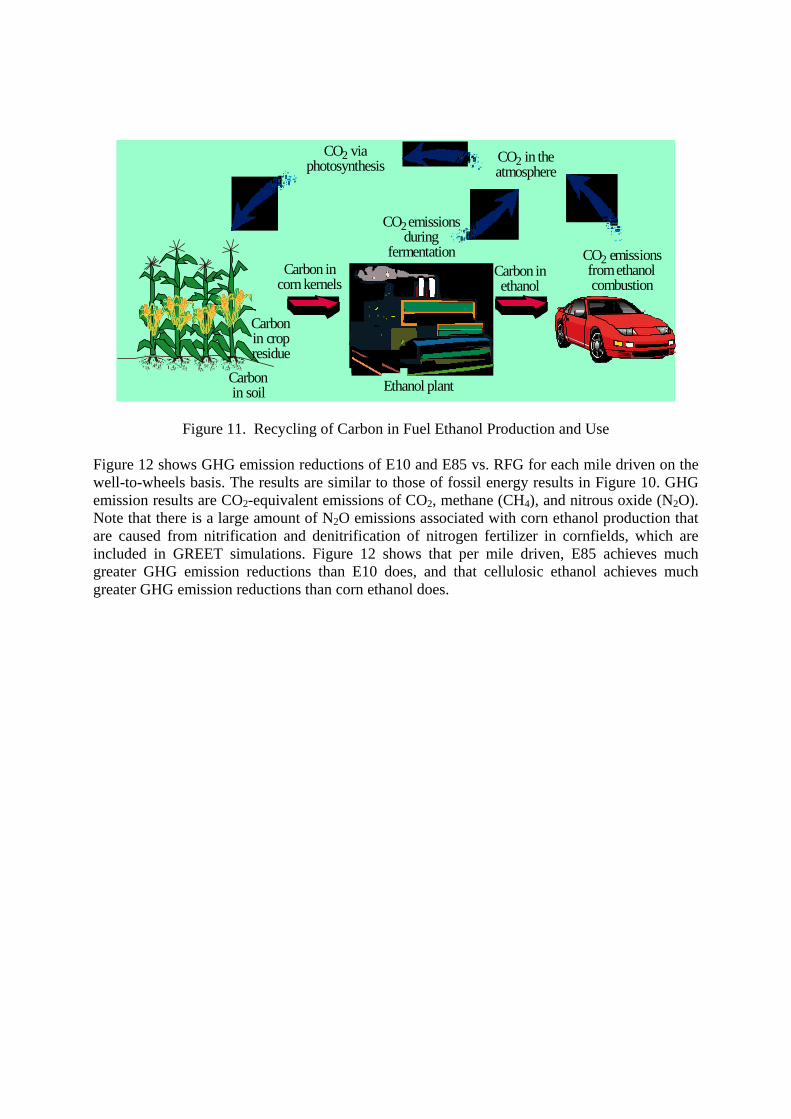
Figure 14. Potential Cellulosic Biomass Resource Supply in the U.S. (from Perlack et al. [2005]) The large energy and GHG emission benefits and the great potential of cellulosic ethanol supply are recognized in the recently adopted Energy Bill. Provisions are established in the Energy Bill to promote research, development, and deployment of cellulosic ethanol. In particular, the Energy Bill contains the following provisions to encourage production of cellulosic ethanol: 1) a credit trading system for biofuels in which a gallon of cellulosic ethanol is equal to 2.5 gallons of biofuel; 2) a program of producing 250 million gallon of cellulosic ethanol in 2013; 3) a loan guarantee program to provide up to $250 million per facility; 4) a $650 million grant program for cellulosic ethanol; and 5) a $550 million advanced biofuels technology program (RFA 2005b). Comparison of Completed Studies In above sections, we discussed key factors in determining energy and GHG emission effects of fuel ethanol. We further presented Argonne’s results for fuel ethanol simulated with the GREET model. In this section, we compare GREET results with those from many other studies. Figure 15 summarizes fossil energy balance values of corn ethanol from 22 completed studies between 1979 and 2005. Note that all studies except Patzek (2003) excluded solar energy embedded in ethanol. For the consistency purpose, Results of Patzek (2003) were adjusted here by taking out solar energy in Patzek’s calculations.
Figure 15 shows that most studies completed in 1980s concluded negative energy balance values for corn ethanol. However, since mid-1990s, most completed studies showed positive energy balances, except that Pimentel continued to show in several studies negative energy balance for corn ethanol. The uptrend in corn ethanol’s positive energy balance over time is supported by the improvement in corn productivity (Figure 5) and ethanol plant energy efficiency (Figure 6), among several other factors. Comparisons of past completed studies were conducted in two recent studies (Morris et al., 2005; Life Cycle Study Institute, 2005). These studies came into the conclusions similar to those presented in Figure 15. We conducted a sensitivity case with the GREET model by applying key assumptions of Pimentel and Patzek (2005) to GREET. The result is presented in Figure 15 (named GREET with Pimentel Assumption in the chart). With Pimentel’s assumptions, GREET estimated negative energy balance value even worse than that estimated by Pimentel. This sensitivity test demonstrates that assumptions are the key for differences in results among studies. Readers should be critical of the validity of assumptions in a given study rather than taking results of the study as a given. The sensitivity test also demonstrates reliability of the GREET model in estimating energy use of corn ethanol. GREET generates larger negative energy balance value for corn ethanol than Pimentel did for the same assumptions because GREET contains additional activities in estimating energy use for transportation fuel production.
-120,000
-100,000
-80,000
-60,000
-40,000
-20,000
0
20,000
40,000
60,000
1978 1980 1982 1984 1986 1988 1990 1992 1994 1996 1998 2000 2002 2004 2006
Net
Ene
rgy
Val
ue (B
tu/g
allo
n)
Ho
Marland&Turhollow
Pim ente l
Pim ente lKeeney&DeLuca
Lorenz&M orris
Shapouri e t al.
Wang et al.
Agri. Canada
Kim &DaleGrabosk i
Wang
Pim ente l
Shapouri e t al.
Pim ente l&Patzek
Weinblatt e t al.
NR Canada
Cham bers et al.
Patzek
DelucchiKim &Dale
Wan
g
GRE
ET
w/P
imen
tel
Assu
mpt
ions
-120,000
-100,000
-80,000
-60,000
-40,000
-20,000
0
20,000
40,000
60,000
1978 1980 1982 1984 1986 1988 1990 1992 1994 1996 1998 2000 2002 2004 2006
Net
Ene
rgy
Val
ue (B
tu/g
allo
n)
Ho
Marland&Turhollow
Pim ente l
Pim ente lKeeney&DeLuca
Lorenz&M orris
Shapouri e t al.
Wang et al.
Agri. Canada
Kim &DaleGrabosk i
Wang
Pim ente l
Shapouri e t al.
Pim ente l&Patzek
Weinblatt e t al.
NR Canada
Cham bers et al.
Patzek
DelucchiKim &Dale
Wan
g
GRE
ET
w/P
imen
tel
Assu
mpt
ions
Wan
g
GRE
ET
w/P
imen
tel
Assu
mpt
ions
Figure 15. Comparison of Fossil Energy Balance of Corn Ethanol Among Completed Studies
(This is an expanded chart from an earlier, similar chart developed by A. Lavigne and S. Powers of Clarkson University in June 2003)
Besides differences in key assumptions among the 22 studies in Figure 15, the system boundary defined in each study could be different as well. Figure 16 presents system boundaries used by

the completed studies. Most studies, including Argonne’s studies, define the system boundary as the inner circle of the chart. That is, these studies usually include the so-called operation related activities in their analyses. On the other hand, Pimentel defines the system boundary by including food intake by farmers, ethanol plant construction materials, and farming equipment materials and manufacture. Patzek further includes solar energy embedded in corn kernels. There is no definitive system boundary that all analysts may agree on. The studies by Pimentel over the last 14 years show that even for a single researcher, the system boundary could be expended. If one’s intention is to obtain negative energy balance for a given fuel product, one can achieve so by expanding system boundary for the fuel product. System boundary definition is a moving target and could be arbitrary.
Operation-Related Activities:Fertilizer, Farming,
Corn Transportation, EthanolProduction, Ethanol Transportation,
Energy Use for Producing Process Fuels
Farming Equipment Materials
and Manufacture
Ethanol Plant Materials
and ConstructionFood Intake by Farmers
Solar Energy Embedded
in Biomass
Operation-Related Activities:Fertilizer, Farming,
Corn Transportation, EthanolProduction, Ethanol Transportation,
Energy Use for Producing Process Fuels
Farming Equipment Materials
and Manufacture
Ethanol Plant Materials
and ConstructionFood Intake by Farmers
Solar Energy Embedded
in Biomass
Figure 16. Choices of System Boundary for Corn Ethanol Energy Balance Analyses One way to overcome effects of system boundary is to conduct comparative analyses of fuel products that are substitutes to each other (such as ethanol and gasoline). As long as system boundaries are defined for ethanol and gasoline on a consistent basis (for example, energy use related to infrastructure is excluded for production of both ethanol and gasoline), the relative difference in energy use between ethanol and gasoline can limit the effect of the system boundary definition to a large extent. Figure 17 presents relative changes in GHG emissions by corn ethanol vs. petroleum gasoline for use in light-duty vehicles among 17 completed studies. While Figure 16 presents results of energy balance values for ethanol itself, Figure 17 presents relative GHG emission changes of corn ethanol vs. gasoline. The system boundary effect is limited in Figure 17 because within each of the 17 studies, system boundary is consistent between corn ethanol and gasoline.

Furthermore, Figure 17 shows potential GHG changes when ethanol is used to displace gasoline, which have direct policy implications.
-80%
-60%
-40%
-20%
0%
20%
40%
60%
80%
100%
EPA (1990
): E100
EPA (1990
): E85
Ho (199
0): E10
0
Marland
(199
1): E10
0
Delucch
i (199
1): E10
0
Ahmed
(1994
): E100
Delucch
i (199
6): E95
Wang (1
996):
E100
Wang (1
996):
E85
Wang (1
997):
E85
Agri. C
an. (1
999):
E85
Delucch
i (200
1): E90
Wang (2
003):
E85
Deluchi (2
003):
E90
Wang (2
005):
E100
Kim&Dale
(2005):
E100
NR Can
ada (2
005):
E100
GH
G C
hang
es
Figure 16. Relative Changes in Per-Mile GHG Emissions of Use of Corn Ethanol to Displace Gasoline in Light-Duty Vehicles Among Completed Studies
Conclusions In this paper, we maintain that though self evaluation of a fuel’s energy balance is easy to understand, especially by news media, to do so for a fuel in isolation could be arbitrary and results may have little practical meaning. A complete, robust way of evaluating a fuel’s effects is to compare the fuel (e.g., ethanol) with those to be displaced (e.g., petroleum gasoline). All Btus are not created equal. The energy sector has been converting low-value Btus into high-value Btus with energy losses. This is simply dictated by thermodynamic laws. Society has not made energy choice decisions on the basis of energy balance values of individual energy products. Energy balance calculations are not useful in formulating energy policies. Energy balance calculations only offer limited values in shedding light on the efficiency of an energy system so that potential improvements of the system can been identified. To help formulate transportation fuel policies, the issues of concerns, such as petroleum consumption and GHG emissions of transportation fuels, should be analyzed directly for transportation fuel alternatives. This is because our analysis in this paper demonstrates that

energy balance values of corn ethanol may not be a good indicator of corn ethanol’s petroleum displacement and GHG emission reductions. Our comparative analysis of fuel ethanol and petroleum gasoline shows that both corn and cellulosic ethanol help substantially reduce fossil energy and petroleum use, relative to petroleum gasoline. For GHG emissions, while corn ethanol achieves moderate reductions, cellulosic ethanol can achieve much great reductions. Acknowledgements This work was sponsored by the U.S. Department of Energy, Office of Energy Efficiency and Renewable Energy. The submitted manuscript has been authored by a contractor of the U.S. Government, under Contract No. W-31-109-ENG-38. Accordingly, the U.S. Government retains a nonexclusive, royalty-free license to publish or reproduce the published form of this contribution, or allow others to do so, for U.S. Government purposes. References Agriculture and Agro-Food Canada, 1999, Assessment of Net Emissions of Greenhouse Gases from Ethanol-Gasoline Blends in Southern Ontario, prepared by Levelton Engineering Ltd. and (S&T)2 Consulting, Inc., Ottawa, Canada, Aug. Ahmed, I. and D. Morris, 1994, Ethanol, MTBE and Greenhouse Gas Emissions, Institute of Local Self-Reliance, Minneapolis, MN, June. Chambers, R.S., R.A. Herendeen, J.J. Joyce, and P.S. Penner, 1979, “Gasohol: Does It or Doesn’t It Produce Positive Net Energy?” Science, Vol.206: 789-795. Delucchi, M.D., 2003, A Lifecycle Emission Model(LEM): Lifecycle Emissions from Transportation Fuels, Motor Vehicles, Transportation Modes, Electricity Use, Heating and Cooking Fuels, and Materials, UCD-ITS-RR-03-17, University of California at Davis, Davis, CA, Dec. Delucchi,, M.D., 2001, “A life Cycle Emission Analysis: Urban Air Pollutants and Greenhouse-Gases from Petroleum, Natural Gas, LPG, and Other Fuels for Highway vehicles, Folklifts, and Household Heating in the U.S.,” World Resource Review, Vol.13, No.1. Delucchi, M.D., 1996, Summary of Results from the Revised Model of Emissions of Greenhouse Gases from the Use of Transportation Fuels and Electricity, Institute of Transportation Studies, University of California at Davis, Davis, CA, Nov. Delucchi, M.D., 1991, Emissions of Greenhouse Gases from the Use of Transportation Fuels and Electricity, ANL/ESD/TM-22, Center for Transportation Research, Argonne National Laboratory, Argonne, IL, Nov.
Energy Information Administration (EIA), 2005, Annual Energy Review 2004, U.S. Department of Energy, DOE/EIA-0384(2004), Washington, DC, Aug. Graboski, M.S., 2002, Fossil Energy Use in Manufacture of Corn Ethanol, prepared for National Corn Growers Association, Washington, DC, Aug. Greene, N. et al., 2004, Growing Energy: How Biofuels Can Help End America’s Dependence on Oil, Natural Resource Defense Council, New York, Dec. Ho, S.P. and T.A. Renner, 1990, “The Global Warming impact of Attainment Strategies Using Alternative Fuels,” SAE Technical Paper 901489. Ho, S.P., 1989, Ethanol Process Energy and Cogeneration Efficiency, Amoco Oil Company, Naperville, IL. Institute for Lifecycle Environmental Assessment, 2005, Ethanol’s Energy Return on Investment: A Survey of the Literature 1990-Present, Seattle, WA, Aug. Keeney and Deluca, 1992, “Biomass as an Energy Source for the Midwestern U.S.,” American Journal of Alternative Agriculture, Vol.7: 137-143. Kim, S. and B.E. Dale, 2005, “Environmental Aspects of Ethanol Derived from No-Tilled Corn Grain: Nonrenewable Energy Consumption and Greenhouse Gas Emissions,” Biomass and Bioenergy, Vol.28: 475-489. Kim, S. and B. Dale, 2002, “Allocation Procedure in Ethanol Production System from Corn Grain,” International Journal of Lifecycle Assessment, Vol. 7:237-243. Lorenz, D. and D. Morris, 1995, How Much Energy Does It Take to Make a Gallon of Ethanol?” Institute of Local Self-Reliance, Minneapolis, MN, Aug. Marland, G. and A. Turhollow, 1991, “CO2 Emissions from the Proction and Combustion of Fuel Ethanol from Corn,” Energy, Vol. 16:1307-1316. Morris, D., 2005, The Carbohydrate Economy, Biofuels and the Net Energy Debate, Institute of Local Self-Reliance, Minneapolis, MN, Aug. Natural Resources Canada, 2005, Ethanol GHG Emissions Using GHGenius: an Update, prepared by (S&T)2 Consulting, Inc., Ottawa, Canada, March. Patzek, T.W., S-M. Anti, K.W. Ha, J. Lee, B. Li, J. Padnick, and SA. Yee, 2003, “Ethanol from Corn: Clean Renewable Fuel for the Future, or Drain on Our Resources and Pockets?” submitted to Environment, Development and Sustainability. Perlack, R.D., L.L. Wright, A. Turhollow, R.L. Graham, B. Stokes, and D.C. Urbach, 2005, Biomass as Feedstock for Bioenergy and Bioproducts Industry: The Technical Feasibility of a

Billion-Ton Annual Supply, prepared for U.S. Department of Energy and U.S. Department of Agriculture, ORNL/TM-2005/66, Oak Ridge National Laboratory, Oak Ridge, TN, April. Pimentel, D. and T.W. Patzek, 2005, “Ethanol Production Using Corn, Switchgrass, and Wood; Biodiesel Production Using Soybean and Sunflower,” Natural Resources Research, Vol. 14: 65-76. Pimentel, D., 2003, “Ethanol Fuels: Energy Balance, Economics, and environmental Impacts Are Negative,” Natural Resources Research, Vol. 12: 127-134. Pimentel, D., 2001, “The Limitations of Biomass Energy,” in Encyclopedia on Physical Science and Technology, Academic Press, San Diego, CA, pp.159-171. Pimentel, D., 1991, “Ethanol Fuels: Energy Security, Economics, and the Environment,” Journal and Agriculture and Environmental Ethics, Vol.4: 1-13. Shapouri, H. et al., 2004, “The 2001 Net Energy Balance of Corn-Ethanol (Preliminary),” the 2004 Fuel Ethanol Workshop, Madison, WI, June 22-25.
Shapouri, H., J.A. Duffield, and M. Wang, 2002, The Energy Balance of Corn Ethanol: an Update, U.S. Department of Agriculture, Office of the Chief Economist, Agricultural Economic Report No. 814, Washington, D.C., July. Shapouri, H., J.A. Duffield, and M.S. Graboski, 1995, Estimating the New Energy Balance of Corn Ethanol, U.S. Department of Agriculture, Economic Research Service, Washington, DC, July. Renewable Fuels Association (RFA), 2005a, Homegrown for the Homeland: Ethanol Industry Outlook 2005, Washington, DC, Feb. Renewable Fuels Association (RFA), 2005b, Issue Brief: Summary RFS and Renewable Tax Provisions – The Energy Policy Act of 2005 - Conference Report – HR 6, Washington, DC, Aug. U.S. Environmental Protection Agency (EPA), 1990, Analysis of the Economic and Environmental Effects of Ethanol as an Automotive Fuel, Office of Mobile Sources, April.
Wang, M., C. Saricks, and H. Lee, 2003, Fuel-Cycle Energy and Emission Impacts of Ethanol-Diesel Blends in Urban Buses and Farming Tractors, prepared for Illinois Department of Commerce and Economic Opportunities, by Center for Transportation Research, Argonne National Laboratory, Argonne, IL, July. Wang, M.Q., C.L. Saricks, and M. Wu, 1999a, “Fuel Ethanol Produced from U.S. Midwest Corn: Help or Hindrance to the Vision of Kyoto?” Journal of the Air and Waste Management Association, 49:756-772.

Wang, M., C. Saricks, and D. Santini, 1999b, Effects of Fuel Ethanol Use on Fuel-Cycle Energy and Greenhouse Gas Emissions, ANL/ESD-38, Center for Transportation Research, Argonne National Laboratory, Argonne, IL, Jan.
Wang, M.Q., C. Saricks, and M. Wu, 1997, Fuel-Cycle Fossil Energy Use and Greenhouse Gas Emissions of Fuel Ethanol Produced from U.S. Midwest Corn, prepared for Illinois Department of Commerce and Community Affairs, Center for Transportation Research, Argonne National Laboratory, Argonne, IL, Dec.
Wang, M.Q., 1996, Development and Use of the GREET Model to Estimate Fuel-Cycle Energy Use and Emissions of Various Transportation Technologies and Fuels, Center for Transportation Research, Argonne National Laboratory, ANL/ESD-31, March. Weinblatt, H., T.S. Reddy, and A. Turhollow, 1982, Energy and Precious Fuels Requirements of Fuel Alcohol Production, prepared for U.S. Department of Energy, Washington, D.C., Dec.