update on the state of the power system - eskom.co.za · pdf fileupdate on the state of the...
TRANSCRIPT

Brian Dames Chief Executive, Eskom
Winter 2012
Update on the State of the
Power System
2
Overview
The maintenance challenge
Trends in demand and supply
Managing a tight power system
Supply and demand side levers
Future focus
Partner with us

Highlights
• As we have said since 2009, the power system will be tight for the next five years and particularly in in 2012 and 2013.
• We have kept the lights on since 2008 - but Eskom cannot do it alone.
• We cannot continue the strategy of shifting maintenance on our power stations to meet demand.
• We are doing unprecedented levels of maintenance as we go into winter, to address the backlog and improve the safety and reliability of our power stations. Much progress has been made: our target is to eliminate the backlog by the end of 2013.
• Eskom has contracted new supply and demand levers over the past quarter, helping us to keep the lights on. We are looking to put new initiatives in place during winter.
• The first unit of Medupi is on track to deliver first power to the grid in 2013
• We thank those customers who have partnered with us, and Government for its support and active campaign for energy efficiency.
• As winter begins, we are seeing demand increase over the evening peak from 5-9 pm. We urge South Africa to save at least 10% - and to “Switch it Off” over peak.
3

4
6
9
3
2
1
0 0 0
3
6
9
2011 2012 2013 2014 2015 2016 2017
TWh
Forecast annual energy supply gap
1 TWh is approximately equivalent
to the annual energy consumption
of 200 000 households
Note: This forecast assumed that all planned supply and demand levers were put in place
Source: Medium Term Risk Mitigation Plan (2009)
9 TWh is equivalent to ~ 1 000MW
of base load capacity

We took action to address the challenges
5
What we said What we did
We would improve coal handling and
coal quality to reduce load losses
We targeted to improve generation
output by 1% - 2% over three years
We would sign up about 400 MW of co-
generation and own generation by
April 2011
We needed to undertake significant
maintenance during summer
Demand-side management programme
in place to reduce demand and energy
savings
We would communicate with our
stakeholders on the state of the
system
Coal-related load losses have decreased over the past few months
but remain a concern at three power stations
In the last quarter, including the impact of Duvha unit 4, the
unplanned losses were 9.57% compared to 6.04% in the same
quarter last year
• 373MW Medium Term Power Purchase Program signed up
(320MW operational)
• 515MW of municipal generation contracted (160 MW reliable
performance).
• An additional 120MW of short term baseload contracts signed
up and operational.
The 12-month average for planned maintenance was 9.5% as of
April 2012 against a target of 10%. Average levels have been
consistently above 12% since January 2012, substantially higher
than in previous years. Backlog down from 36 to 26 units.
Realised energy savings of an annualised 1350 GWh between April
2011 and March 2012, with 125 MW of savings achieved through the
Residential Demand Management program. Demand response
aggregator project set to achieve 500MW by mid 2012. Short term
power buyback contracts for 963 MW secured from large customers
by April 2012, helping to create space for maintenance.
Extensive programme of engagement with stakeholders
1
2
3
4
5
6
1
2
3
4
5
6

Overview
6
Introduction
The maintenance challenge
Trends in demand and supply
Managing a tight power system
Supply and demand side levers
Future focus
Partner with us

7
The maintenance life cycle
Activity Cycle time (years) Duration (days)
General Overhaul (GO) 6 - 12 40 - 60
Interim Repairs (IR) 2 - 3 14 - 35
Mini – General Overhaul (MGO) 6 28
Boiler Inspection (BI) 1 – 1.5 7 - 14
Statutory inspection and test (ST) 6 35
Main steam pipe work 120
GO
BI
IR
MGO
BI + ST
IR
MGO
A typical coal fired generating unit requires certain necessary routine maintenance to ensure that it meets its technical performance requirements, is safe to operate and does not violate any environmental laws.
18
months 18
months 18
months
18
months 18
months 6
months

8
• Eskom does maintenance according to a schedule, to address safety, statutory, environmental and
performance issues
• We have to use all available capacity, including open cycle gas turbines, to meet requirements for
planned maintenance outages. Demand-side management becomes critical to provide adequate
reserves
The 2012 maintenance challenge
0
2000
4000
6000
8000
10000
26 Mar 23 Apr 21 May 18 Jun 16 Jul 13 Aug 10 Sep 08 Oct 05 Nov 03 Dec 31 Dec 28 Jan 25 Feb 25 Mar
MW 12-month maintenance requirements
Maintenance required

Reducing the backlog
9
• There are currently 26 units in the maintenance backlog
• Target to eliminate backlog by end 2013
36
12
1
5
18
23
13
0 2
26
0
5
10
15
20
25
30
35
40
45
Originalbacklog from
May 2011
Completed Underexecution
Scheduled To bescheduled
New backlogsince May
2011
Completed Underexecution
Scheduled Totaloutstanding
backlog (to bescheduled)
Units

High maintenance levels in 2012
10
In order to prevent the maintenance backlog from growing further a significant amount of maintenance
was done in the first quarter of 2012 compared to previous years. As we head into winter the high levels
of maintenance will continue and will place increased risk on the system for a few hours during the peak.
Planned Maintenance
% 2010 2011 2012
Jan 11.8 10.0 12.5
Feb 10.6 7.6 12.8
Mar 10.7 8.4 13.5
April 11.6 8.7 13.8
May 7.0 6.3 10.5
June 2.6 4.5 9.6*
Six-month average 9.1 7.6 12.11*
* Projected maintenance as of 30 May 2012
Overview
Introduction
The maintenance challenge
Trends in demand and supply
Managing a tight power system
Supply and demand side levers
Future focus
Partner with us
11

Winter is different
• Most planned maintenance is done in summer, when demand is lower, so that maximum capacity is available to meet
demand at winter peak.
• A colder-than-expected winter puts added pressure on the system: for every 1 degree Centigrade decrease in winter
temperature, electricity demand increases by 600 - 700 MW during the evening peak; a warmer than expected
summer increases air-conditioning load and demand can increase by up to 400 MW.
• All planning is done for average load and available generation over an hour. But load „spikes‟ for short periods and capacity must be made available just so that we can meet that demand
• This “ peak in the peak” can be 2 000 MW higher than the hourly average in the winter months
12
20,000
22,000
24,000
26,000
28,000
30,000
32,000
34,000
36,000
38,000
40,000
23:00 02:00 05:00 08:00 11:00 14:00 17:00 20:00 23:00 02:00
MW Summer & winter load profiles
Typical Winter Day
Winter peak is much
higher but for a
shorter duration:
forecast this winter is
just under 37 GW
Summer load profile is much flatter, peak
of 32 – 33 GW, so if there is a constraint,
the system is constrained for the entire day
34000
34500
350004
PM
4 P
M
5 P
M
5 P
M
6 P
M
7 P
M
7 P
M
8 P
M
8 P
M
9 P
M
Peak

25000
27000
29000
31000
33000
35000
37000
39000
1 3 5 7 9 11 13 15 17 19 21 23 25 27 29 31 33 35 37 39 41 43 45 47 49 51
MW
Week number
Weekly peak demand (Jan - Dec)
2012 Total 2011 Total
Demand has been below expectations
• Demand year to date has been below forecast due to weaker than expected economic growth, demand side management initiatives and contributions from Independent Power Producers.
• We are still seeing the residential customers increasing their demand during cold weather, causing a significant increase of between 2000 MW and 3000 MW during the evening peak. This is equivalent to the combined usage of our SADC neighbours.
• The expected peak demand for winter 2012 is just under 37 000 MW.
13
* The Total refers to the sum of Eskom and non - Eskom power generation

• Eskom uses 3 600MW allowance for unplanned outages and production losses in the generation fleet, to cushion the system
• Unplanned outages running at higher levels in May 2012 due to boiler tube leaks, poor coal quality at some stations and delays in returning units after lengthy maintenance outages.
• However the trend in March and April 2012 has been better than planned .
Predictable generation fleet performance still a challenge
0
1000
2000
3000
4000
5000
6000
7000
Jan 11 Feb 11 Mar 11 Apr 11 May 11 Jun 11 Jul 11 Aug 11 Sep 11 Oct 11 Nov 11 Dec 11 Jan 12 Feb 12 Mar 12 Apr 12 May 12
Load
loss
(M
W)
Full and partial generation output reductions (May 2011 - 17 May 2012)
Partial LL Full LL Target
SUMMER SUMMER WINTER

Primary energy – system coal stock days
15
15
• Average system coal stock days are lower than the expected 42 days, mainly due to under-performance of tied mines at Arnot, Matla and Tutuka between January and March 2012.
• Under-performance at tied collieries supplying Arnot and Tutuka power stations resulted in both stations‟ stock days being below their minimum levels - sourcing additional coal. Both stations‟ stock days have stabilised and increasing
• In support of road safety, trucking operations were halted during the peak periods over the Easter weekend and the long weekend at the end of April.
• Over the last 5 months, improvements in coal quality related output reductions have been recorded at the priority power stations, i.e. Arnot, Matla and Tutuka.
Actual Stock days 2008 - 2012 vs year to date 2013
24.9 24.6 22.0
19.8 19.3 18.4 17.2 17.9
14.9 12.2
13.3 12.8
40.3 39.1 39.2
36.3 37.9
41.1 41.4 43.5 42.5
40.7 38.8 38.8
38.1 39.0
0
5
10
15
20
25
30
35
40
45
50
APR MAY JUN JUL AUG SEP OCT NOV DEC JAN FEB MAR
Sto
ck
days
Months
2007/8 2011/12
2012/13

16
Review of first quarter system status
Capacity Surplus 0 MW to 1000 MW
Shortfall 1000 MW to 2000 MW
Shortfall 2000 MW to 4000 MW
Shortfall Greater than 4000 MW
shortfall
Week Starting
Assumes: unplanned losses 3600 MW, reserves of 1900 MW, 1300 MW from open cycle gas turbines
Demand Forecast (MW)
Expected system status
Actual system status
(02/01/2012) 29758
(09/01/2012) 30854
(16/01/2012) 31958
(23/01/2012) 32037
(30/01/2012) 31357
(06/02/2012) 31613
(13/02/2012) 29203
(20/02/2012) 32044
(27/02/2012) 31902
(05/03/2012) 30907
(12/03/2012) 31902
(19/03/2012) 30907
(26/03/2012) 29364
(02/04/2012) 31324
(09/04/2012) 32463
(16/04/2012) 32463
(23/04/2012) 32434
(30/04/2012) 31749
(07/05/2012) 33692
(14/05/2012) 32434
(21/05/2012) 34248

OCGTs help to keep the lights on
17
• Open cycle gas turbines designed as peaking power, emergency reserves
• Running OCGTs (diesel-fired) costs 10-15 times as much as coal-fired stations
• OCGT usage in 2011 and to date 2012 higher than previous years, created space for maintenance
0
50
100
150
200
250
Jan Feb Mar Apr May Jun Jul Aug Sep Oct Nov Dec
GW
h OCGT Monthy Usage
2010
2011
2012
Ending 7 May

Overview
Introduction
The maintenance challenge
Trends in demand and supply
Managing a tight power system
Supply and demand side levers
Future focus
Partner with us
18

Ensuring stable system operation
19
Ideally, 3 000MW of committed capacity from supply and demand initiatives is needed immediately to
keep the lights on and enable maintenance to continue. Reducing this target will require an adjustment
to the maintenance programme.
Between now and end-December 2013, the minimum targets set out in the table below need to be
achieved to prevent an emergency.
Immediate (MW) By July 2012 (MW) and sustained to
end December 2013
High load factor initiatives to bring
certainty to maintenance planning 1000 2000
Pre-Emergency/ Contingency/Peaking
initiatives 2000 1000

What has been done?
Signed power purchase agreements (PPAs) with two municipalities to secure baseload generation.
Secured available non-Eskom generation from customer base on a short-term basis.
Signed power buyback agreements, where we were able to remove base demand off the system, while some were deferred to the winter period.
Obtained voluntary co-operation over peak periods from large customers (at least 400MW)
Identified possible cross-border generation and signed PPA
Signed up a demand response aggregator that will ramp up to 500MW by July 2012.
Accelerating a mass rollout of technologies for residential customers to become more energy efficient.
20

Levers secured but more needed
Additional initiatives: Mandatory DMP, aggressive IDM initiatives, mobile diesel generation, coal quality improvement, state-owned company building efficiency
21
Short term initiatives
(Nov 2011 – Jun 2012)
Target
capacity (MW)
Secured
capacity (MW)
Operational
capacity (MW) Status
Su
pp
ly S
ide
Municipal Base Load
Power 515 515 160 Contract until 30 June 2012
MTPPPs (additional) 20 20 20 Contract until 30 June 2012
IPPs and short term
base load 100 100 100 Contract until 30 June 2012
Non-Eskom peaking
generation 120 40 40
80 MW falls outside pricing
mandate.
Cross border 85 0 0 Awaiting regulatory approval.
Committee on 29 May 2012.
De
ma
nd
Sid
e
Power buyback 1000 963 963 Contracts conclude 31 May
2012
Emergency DMP 200 50 50 Will increase once power buy
back conflicts are resolved.`
Pilot demand response
aggregator 500 38 38
Contracting customers to meet
ramp up target
Mandatory ECS - - - Long term initiative
Stand-by customer
generation 100 7 0
Process of signing up
customers
Residential Demand
Management 1000 125 125
Resource challenges. On track
to meet September 2012 target.

22
Verified demand savings (MW) per sector FY 2011 vs FY 2012
4 1
112
6
231
1
24
0.02
71
26
226
0
50
100
150
200
250
Agriculture Commercial & Corporates
Gov & SOB's Industrial & Mining
Residential - SWH
Residential & Munics
FY 2011 FY 2012
• Still significant scope for energy savings
• Incentive programmes in place

Supply and demand side initiatives to implement in the next quarter
23
0
500
1000
1500
2000
2500
Jul-12 Aug-12 Sep-12 Oct-12 Nov-12 Dec-12
MW
Municipal Generation STIPPs Cross Border DRAPP RDM
Lever Target
Municipal Generation 270 MW – extend contracts until December 2013
Short Term Base Load IPPs 120 MW - extend contracts until December 2012
Cross Border Project 93 MW by July 2012
Residential Demand Mass Roll Out Program 1000 MW by September 2012
Demand Response Aggregator Pilot 500 MW by end July 2012

Projected system outlook
24
3600 MW UCLF, 1300
MW OCGT 4500 MW UCLF, 1300
MW OCGT
NO additional Initiatives
Likely Initiatives
NO additional Initiatives
Likely Initiatives Date
Demand Forecast
Maintenance
Mon 28-May-12 34443 3855
Thu 07-Jun-12 34914 3967
Thu 14-Jun-12 35219 3529
Thu 21-Jun-12 35453 3767
Wed 27-Jun-12 35847 3272
Thu 05-Jul-12 35964 2972
Thu 12-Jul-12 36428 1624
Thu 19-Jul-12 36987 660
Tue 24-Jul-12 36653 660
Wed 01-Aug-12 35581 1362
Mon 06-Aug-12 35397 1482
Mon 13-Aug-12 35627 1636
Mon 20-Aug-12 34915 2989
Mon 27-Aug-12 33966 3873
Tue 04-Sep-12 33620 3829
Tue 11-Sep-12 33524 3609
Mon 17-Sep-12 33390 3894
Tue 25-Sep-12 33488 3894
Tue 02-Oct-12 33347 4074
Mon 08-Oct-12 33292 4264
Mon 15-Oct-12 33289 4412
Tue 23-Oct-12 32890 4811
Wed 31-Oct-12 32730 4415
Tue 06-Nov-12 33297 4215
Tue 13-Nov-12 33115 4595
Mon 19-Nov-12 32567 4788
Wed 28-Nov-12 32430 5351

Winter sees more local power outages
• During winter Eskom and municipal distribution networks experience increased interruptions, mainly due to illegal connections which cause network overload and equipment failure.
• This is not related to the tight power system nationally
• In Gauteng during winter, localised power outages on the distribution network increase by 50%.
• Eskom and municipalities are working to creating awareness of the impact of illegal connections on safety and on security of supply.
• Theft of pylons a growing challenge, compromising security of supply
25
Overview
Introduction
The maintenance challenge
Trends in demand and supply
Managing a tight power system
Supply and demand side levers
Future focus
Partner with us
26

Update on new build
27
Project
Year to 31
March
2013
Year to 31
March
2014
Year to 31
March
2015
Year to 31
March
2016
Year to 31
March
2017
Year to 31
March
2018
Year to 31
March
2019
Total
Grootvlei (return to service) 30 30
Komati (return to service) 200 200
Camden (return to service) 30 30
Medupi (coal fired) 794 794 1 588 794 794 4 764
Kusile (coal fired) 800 800 800 800 1 600 4 800
Ingula (pumped storage) 1 332 1 332
Sere wind farm (renewable) 100 100
Total (MW) 260 894 2 926 2 388 1 594 1 594 1 600 11 256
New build projects on track
28
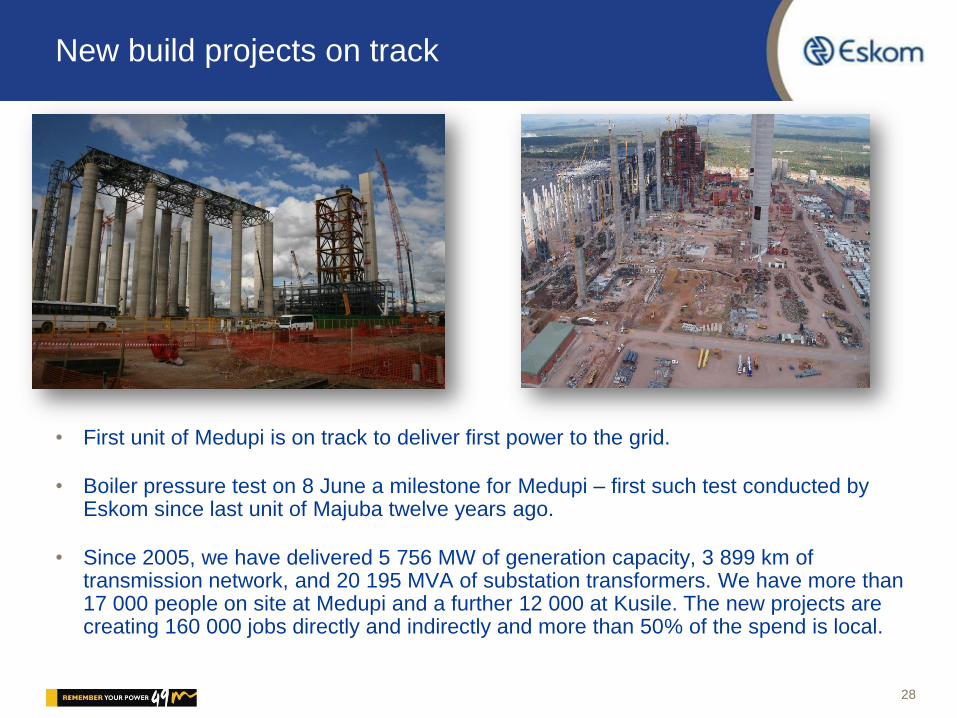
• First unit of Medupi is on track to deliver first power to the grid.
• Boiler pressure test on 8 June a milestone for Medupi – first such test conducted by Eskom since last unit of Majuba twelve years ago.
• Since 2005, we have delivered 5 756 MW of generation capacity, 3 899 km of transmission network, and 20 195 MVA of substation transformers. We have more than 17 000 people on site at Medupi and a further 12 000 at Kusile. The new projects are creating 160 000 jobs directly and indirectly and more than 50% of the spend is local.

Connecting Renewable IPPs : Quotation & Connection process
29
Obtain EIA for project
Request EIA for project
Submit Application
Form
Eskom
IPP
Process Application
Form
Provide Cost
Estimate Letter
2
1
3
Request Budget Quote.
4
Produce Prelim
Design & Cost project
5
Issue Budget Quote &
Connection Agreement
6
Accept Budget Quote &
Sign Connection Agreement
Perform (or Approve)
Detailed Design
8A
Perform Detailed Design
(Self Build Option)
7 8B
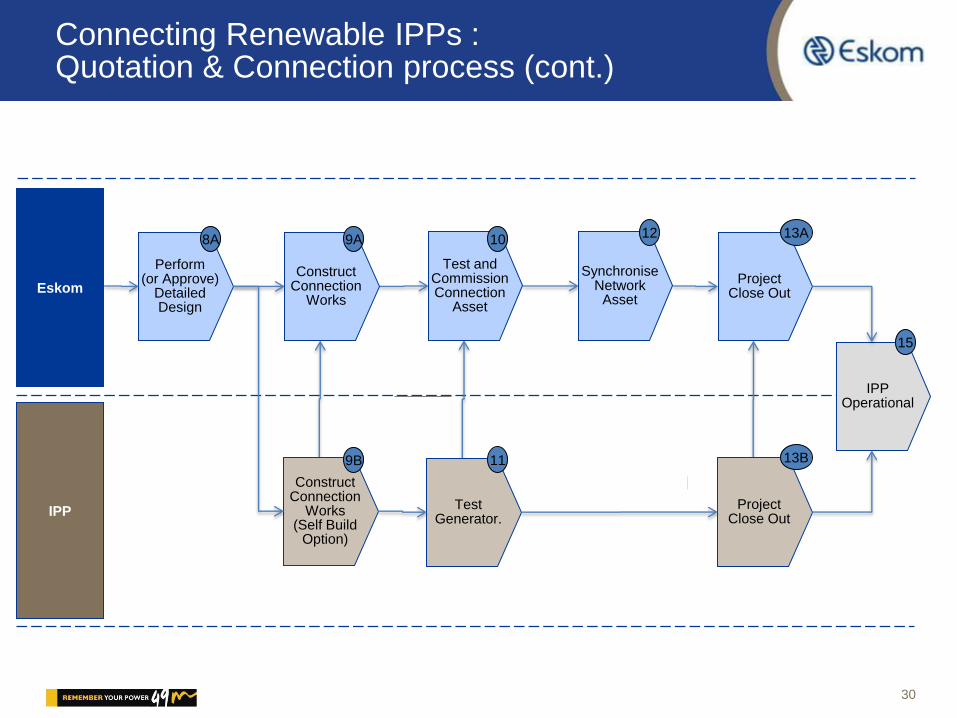
Connecting Renewable IPPs : Quotation & Connection process (cont.)
30
Eskom
IPP
Perform (or Approve)
Detailed Design
Construct Connection
Works
8A 9A
Test Generator.
Test and Commission Connection
Asset
10
Synchronise Network
Asset
12
Project Close Out
13A
Project Close Out
11
Construct Connection
Works (Self Build
Option)
9B
IPP Operational
13B
15

Overview
Introduction
The maintenance challenge
Trends in demand and supply
Managing a tight power system
Supply and demand side levers
Future focus
Partner with us
31
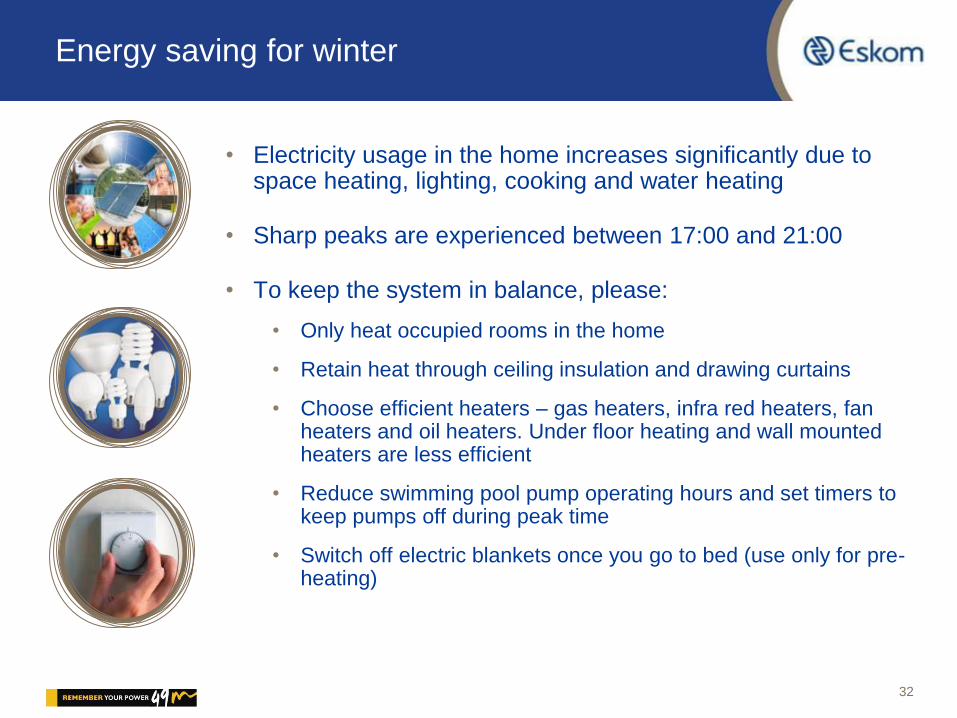
Energy saving for winter
• Electricity usage in the home increases significantly due to space heating, lighting, cooking and water heating
• Sharp peaks are experienced between 17:00 and 21:00
• To keep the system in balance, please:
• Only heat occupied rooms in the home
• Retain heat through ceiling insulation and drawing curtains
• Choose efficient heaters – gas heaters, infra red heaters, fan heaters and oil heaters. Under floor heating and wall mounted heaters are less efficient
• Reduce swimming pool pump operating hours and set timers to keep pumps off during peak time
• Switch off electric blankets once you go to bed (use only for pre-heating)
32

Partner with us
• 49M is an Eskom initiative, supported by Government, spurring an urgent need for all 49 million South Africans to embrace energy saving as a national culture, joining the global journey towards a sustainable future
• 49M campaign launched by Government and Eskom to create energy efficiency culture and calls for a 10% reduction in electricity usage
• Energy efficiency is not only a national concern, it is a global concern. Save power, save the planet and save your pocket!
33

Conclusion
• South Africa‟s power system will be tight for the next few years: the next two years are critical.
• Strategy of shifting maintenance can no longer be sustained. We are addressing the backlog but we need space to do this – reduced demand on the system creates this space
• As we go into winter the peak demand between 5-9 pm increases dramatically, putting strain on the system
• We need to save 10% of our current energy usage and remove 3 000MW from the demand urgently
• We need a partnership approach and need the support of all our citizens and customers.
34

Thank you