update on the 2015 special study june 29, 2015 arne olson, partner nick schlag, managing consultant...
TRANSCRIPT

Update on the 2015 Special Study
June 29, 2015
Arne Olson, Partner
Nick Schlag, Managing Consultant
Gabe Kwok, Senior Consultant

2
CPUC & CAISO Iterative Planning Process
Overview
CAISO’s Transmission Planning Process (TPP) has historically focused on current policy-preferred portfolio (a 33% RPS portfolio)
The idea for the 2015 Special Study was borne of the mutual desires of the CPUC and CAISO to begin investigating impacts of higher RPS targets upon transmission planning
2015 Special Study provides opportunity to conduct analysis to inform future TPP cycles without a direct impact on the current transmission plan
Policy-Driven Transmission
Lines
CAISO TPP
Special Study
Policy-preferred portfolios
Updated transmission inputs
Need Assessment
Study
CPUC RPS Calculator

3
Transmission Planning at Higher Renewable Penetrations
To reach 50% RPS goal, an additional 15,000 MW of renewables will be needed in CAISO
2015 Special Study provides an opportunity to explore challenges and issues that may be encountered at such higher penetrations prior to a formal planning process
Through workshops, stakeholder comments and RPS Calculator development, the question of what role energy-only resources could play in achieving higher renewable goals has emerged
Both questions have directed the scope of the 2015 Special Study to focus on a topic that has not been explored in the transmission planning process: the impacts of adding large quantities of energy-only resources to the system

4
Energy-Only Resources at Higher Renewable Penetrations
At higher penetrations, a number of factors make energy-only resources increasingly attractive relative to fully-deliverable resources:
• Marginal ELCC of renewable resources declines
• Avoided cost of generation capacity remains relatively low
• System-level curtailment/overgeneration issues limit need for transmission during high loads
• Marginal transmission investments become increasingly costly
In this paradigm, renewables are added to the system for their energy production
0
10
20
30
40
50
60
1 2 3 4 5 6 7 8 9 101112131415161718192021222324
Load
(GW
)
Hour
0
1
2
3
4
5
6
0 6 12 18
Peak
Loa
d Re
ducti
on (G
W)
Installed Solar PV Capacity (GW)
Solar PV
Wind
0%
10%
20%
30%
40%
50%
60%
70%
80%
0% 5% 10% 15% 20%Penetration (% of Energy)
Marginal ELCC (% of Nameplate)
Range at 33-40% RPS in CA
Source: RPS Calculator

5
Energy-Only Resources & Congestion-Related Curtailment
While energy-only resources will become more attractive at higher penetrations, the transmission system is limited in its ability to accommodate them
Continuing to add generation without upgrades to the transmission system will eventually lead to increases in congestion and congestion-related curtailment
Some resources may be added without transmission upgrades without major
impacts on congestion
Eventually, existing transmission system will
become saturated, leading to congestion and
curtailment
* Congestion and curtailment is not solely an issue for energy-only resources; fully deliverable resources may also contribute to congestion/curtailment

6
2015 Special Study: Combination of Energy Only & Fully Deliverable Resources
• No new transmission investments on behalf of energy only resources
• No capacity credit in RA for purchaser of energy-only resource
• Opportunities for ratepayer savings if avoided transmission investment outweighs foregone RA value and congestion costs
Historical Planning: All Resources Fully Deliverable
• Power flow studies conducted for all resources to ensure deliverability during peak periods
• Costs of delivery network upgrades are recovered through transmission access charge (TAC)
• Resources receive RA credit based on NQC
Deliverability Overview
FCDS
FCDS
FCDS
EO
Load
Load

7
Plan for 2015 Special Study
Purpose: provide useful information on transmission impacts of 50% RPS portfolios for use in subsequent planning cycles
Scope: analyze multiple portfolios achieving 50% RPS utilizing energy-only resources to meet the RNS
Results of 2015 Special Study will not:
• Support any policy-driven transmission lines
• Supplant resource portfolios used in CAISO TPP and CPUC LTPP
Develop “Rules of Thumb” for energy only planning (CAISO)
Use RPS Calculator v.6.1 to create portfolios for Special Study (CPUC)
Analyze impacts of portfolios in Special Study (CAISO)
Update RPS Calculator v.6.2 (CPUC)
2016-17 TPP & 2016 LTPP
Dec 2015
Feb 2015
June 2015

8
Limits to Energy Only-Resources
Prior versions (v.1 – v.6.0) of the RPS Calculator have assumed that all new renewable resources are made fully deliverable
Separate functionality to allow energy-only resources to compete to fill the RNS has been implemented in preparation for RPS Calculator v.6.1
CAISO has developed “rules of thumb” to limit energy only resources in various locations intended to capture the point at which congestion would become a significant issue
Rule of thumb limit used in
RPS Calculator (developed by
CAISO)

9
CAISO Energy-Only Rules of Thumb
CAISO’s rules of thumb indicate availability of >26,000 MW of capacity for energy-only resources on the existing system
2015 Special Study will focus on evaluating the appropriateness of rules of thumb for use in subsequent TPP cycles; possible outcomes:
1. Rules of thumb adequate for use
2. Rules of thumb require minor adjustment
3. Rules of thumb require major revisions
Northern California [3,404 MW]
Solano [1,101 MW]
Central Valley North & Los Banos [2,000 MW]
Westlands [2,900 MW]
Greater Carrizo [1,140 MW]
Greater Imperial [2,633 MW]
Mountain Pass & El Dorado [2,982 MW]
Riverside East & Palm Springs [4,917 MW]
Tehachapi [5,000 MW]

PORTFOLIOS

11
2015 Special Study Focus
RPS Calculator has been used to generate three 50% RPS portfolios:
1. California Fully Deliverable:
• RNS may be filled only by resources located in California
• All new resources must be fully deliverable, leading to the need for new transmission investment
2. California Energy Only:
• RNS may be filled only by resources located in California
• All resources are assumed to be connected to the existing transmission system
3. WECC Energy Only:
• RNS may be filled by resources throughout the Western Interconnection
• All resources are assumed to be connected to the existing transmission system
CAISO’s 2015 Special Study will analyze Portfolios 2 & 3
Generated for stakeholder reference
Generated as inputs for
Special Study

12
Updated Data and Functionality for RPS Calculator v.6.1
Based on stakeholder feedback from the February 2015 workshop, E3 and Black & Veatch made major updates for v.6.1, including:
• EO deliverability functionality added based on CAISO rules of thumb
• Energy storage functionality added
• Resource cost and potential update
• Solar PV capital costs reduced ~25%; geothermal capital costs increased ~20%
• New distribution generation potential
• Conceptual transmission cost and availability update
• Includes AC and DC options for OOS resources
• Existing and commercial project list update
• Reflects up-to-date PPAs approved and terminated
• Energy valuation
• Added new profiles for New Mexico, Rocky Mountain and Desert Southwest wind
RPS Calculator v.6.1 will be released at the end of July 2015

13
Scenario Comparison: Resources
Incremental resources selected above 33% include a mix of wind and solar PV:
4,000 MWof WY/NM
wind
13,000 MW of energy-
only resources
12,000 MW of new
transmission
Scenarios 2 & 3 for 2015 Special Study
14
New Fully Deliverable Resources New Energy Only Resources
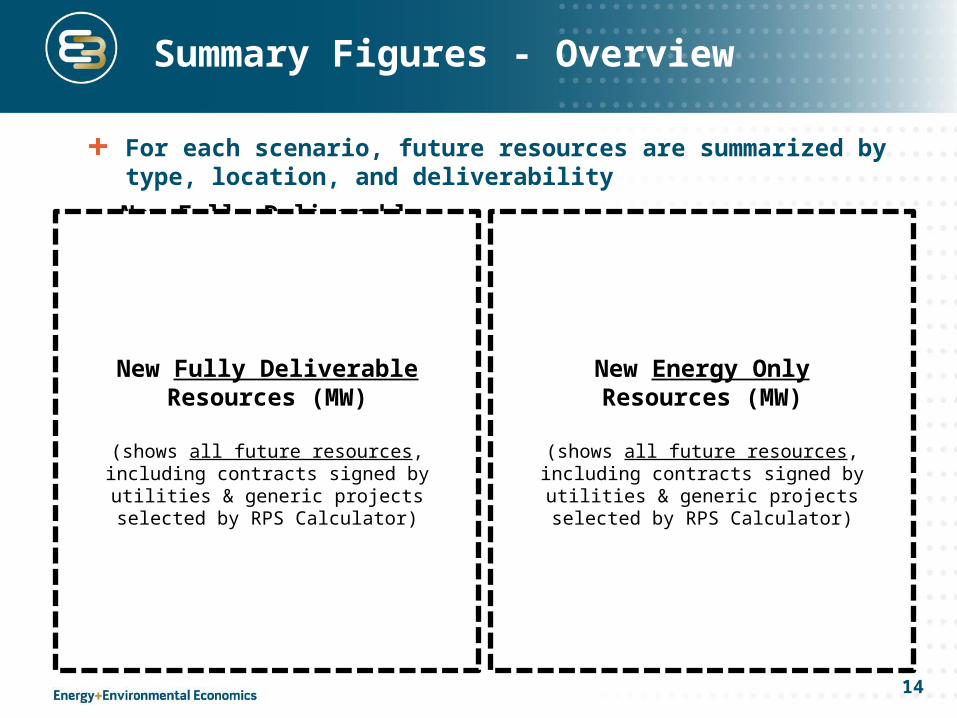
For each scenario, future resources are summarized by type, location, and deliverability
New Fully Deliverable Resources (MW)
(shows all future resources, including contracts signed by
utilities & generic projects selected by RPS Calculator)
Summary Figures - Overview
New Energy Only Resources (MW)
(shows all future resources, including contracts signed by
utilities & generic projects selected by RPS Calculator)

15
Scenario represents “business-as-usual” use of the RPS Calculator
Scenario 1: California Fully Deliverable
No energy-only resources
Significant FCDS resource buildouts in multiple areas implies need for
new transmission
New Fully Deliverable Resources New Energy Only Resources

16
Deployment of energy-only resources is geographically balanced
Scenario 2: California Energy Only
13,000 MW of energy-only resources
(wind & solar)
Existing FCDS transmission utilized
New Fully Deliverable Resources New Energy Only Resources
17
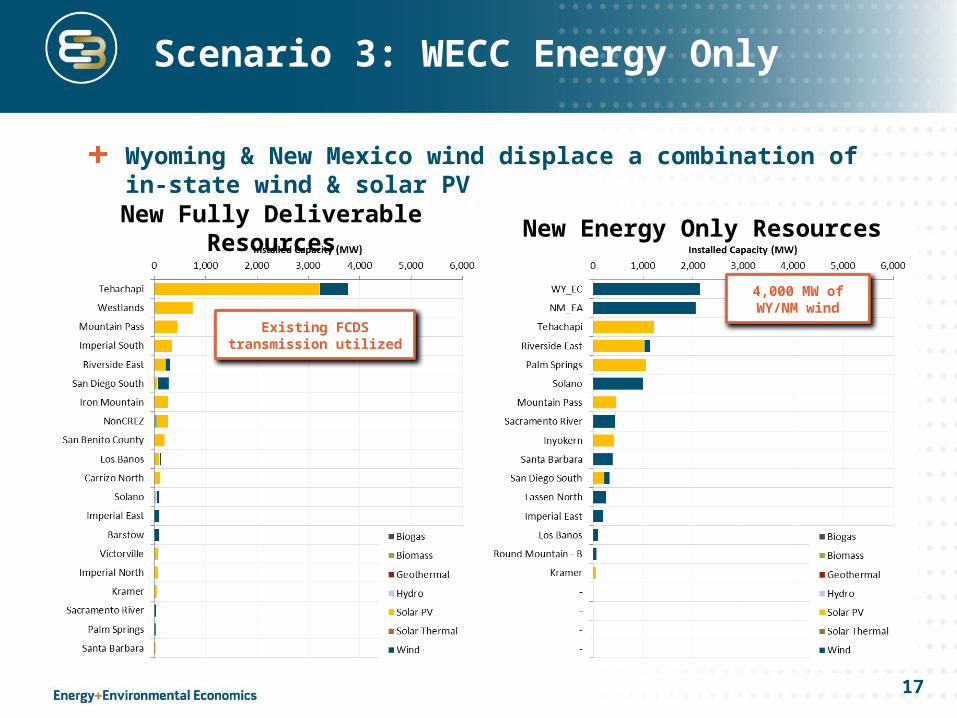
Scenario 3: WECC Energy Only
Wyoming & New Mexico wind displace a combination of in-state wind & solar PV
4,000 MW of WY/NM wind
Existing FCDS transmission utilized
New Fully Deliverable Resources New Energy Only Resources

18
Scenario Comparison: New Resources
Figure shows all future resources, including contracts signed by utilities & generic projects selected by RPS Calculator
Thank You!Energy and Environmental Economics, Inc. (E3)
101 Montgomery Street, Suite 1600
San Francisco, CA 94104
Tel 415-391-5100
Web http://www.ethree.com
Arne Olson, Partner [email protected]
Nick Schlag, Managing Consultant [email protected]
Gabe Kwok, Senior Consultant [email protected]