update on solid waste management in rhode island › wp-content › uploads › 2017 › 09 ›...
TRANSCRIPT
EBC Rhode Island Chapter Program:
Update on Solid Waste Management in
Rhode Island

Edward Summerly
Program Chair & Moderator
Principal, GZA GeoEnvironmental, Inc.
Program Introduction & Overview
Environmental Business Council of New England
Energy Environment Economy
Michael McGonagle
Director of Information Systems
and Business Analysis
Rhode Island Resource Recovery Corporation
Waste Generation and Potential
for Diversion
Environmental Business Council of New England
Energy Environment Economy
Resource Recovery | 65 Shun Pike | www.rirrc.org
Waste Generation and Potential for Diversion
Mike McGonagle, Interim Dir. Policy and Programs
Resource Recovery
September 12, 2017
Presented To: Environmental Business Council of New England
Resource Recovery | 65 Shun Pike | www.rirrc.org5
Rhode Island Waste Generation
• Resource Recovery manages about 1.2M tons of materials each year including wastes, recycling and alternate cover materials
• About 10% is sold to processors for recycling and the rest is destined for landfill disposal
• Almost half (520K tons) is mixed solid waste from residential and Institutional/Commercial/Industrial (ICI) sources typically collected in packer trucks and compactor roll-offs
Resource Recovery | 65 Shun Pike | www.rirrc.org6
Waste Generation (cont…)
• About 50K tons is bulky wastes typically collected in open roll-off containers or small trucks from household and bussiness cleanouts
• About 190K tons is unprocessed C&D
• The remaining 270K tons is primarily process residuals, soils, and ash

Resource Recovery | 65 Shun Pike | www.rirrc.org7
Waste Generation (cont…)
• About 100K tons of soils and other recovered aggregate materials are used as alternate daily landfill cover.
• Best guess is that another 250K to 350K tons of Rhode Island wastes are shipped directly out of state to disposal and recycling
Resource Recovery | 65 Shun Pike | www.rirrc.org
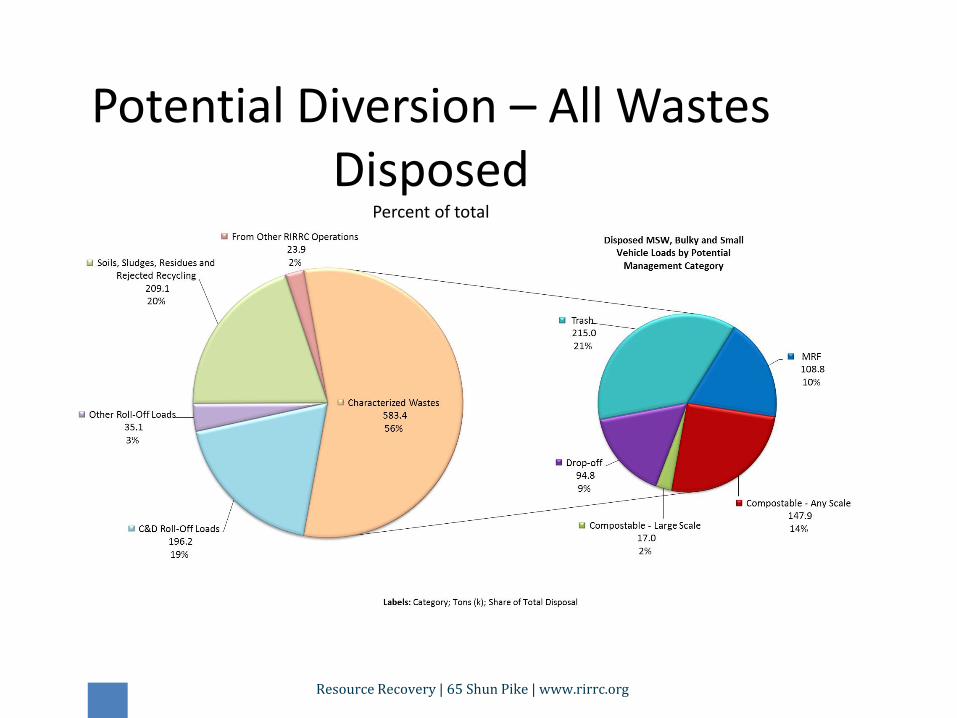
Potential Diversion – All Wastes Disposed
Percent of total
Resource Recovery | 65 Shun Pike | www.rirrc.org
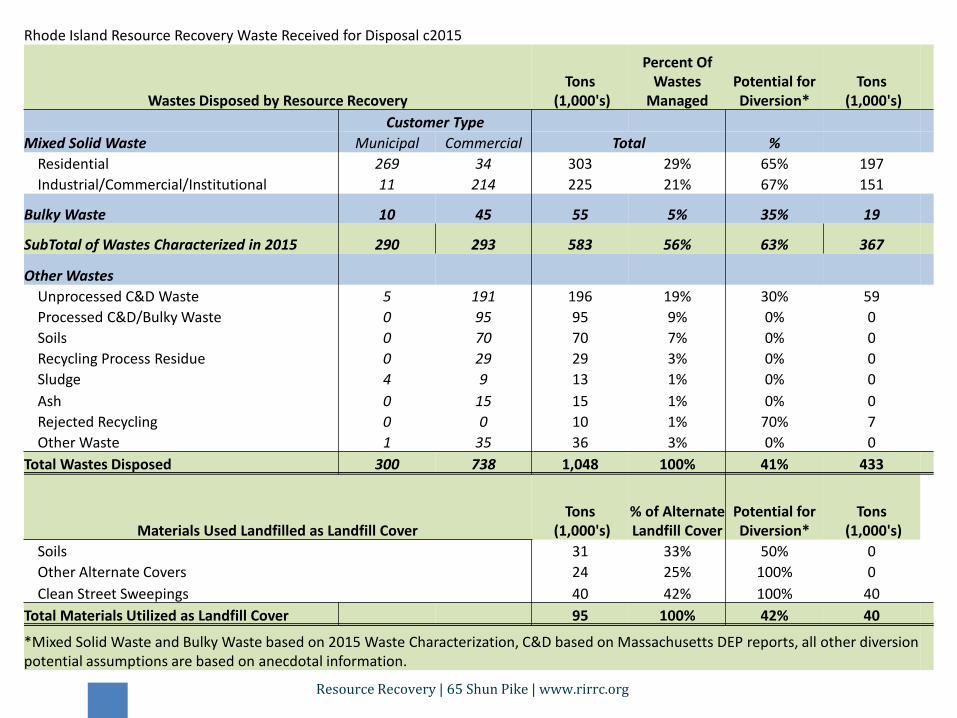
Rhode Island Resource Recovery Waste Received for Disposal c2015
Wastes Disposed by Resource RecoveryTons
(1,000's)
Percent Of Wastes
ManagedPotential for Diversion*
Tons(1,000's)
Customer Type
Mixed Solid Waste Municipal Commercial Total %
Residential 269 34 303 29% 65% 197
Industrial/Commercial/Institutional 11 214 225 21% 67% 151
Bulky Waste 10 45 55 5% 35% 19
SubTotal of Wastes Characterized in 2015 290 293 583 56% 63% 367
Other Wastes
Unprocessed C&D Waste 5 191 196 19% 30% 59
Processed C&D/Bulky Waste 0 95 95 9% 0% 0
Soils 0 70 70 7% 0% 0
Recycling Process Residue 0 29 29 3% 0% 0
Sludge 4 9 13 1% 0% 0
Ash 0 15 15 1% 0% 0
Rejected Recycling 0 0 10 1% 70% 7
Other Waste 1 35 36 3% 0% 0
Total Wastes Disposed 300 738 1,048 100% 41% 433
Materials Used Landfilled as Landfill CoverTons
(1,000's)% of Alternate Landfill Cover
Potential for Diversion*
Tons(1,000's)
Soils 31 33% 50% 0
Other Alternate Covers 24 25% 100% 0
Clean Street Sweepings 40 42% 100% 40
Total Materials Utilized as Landfill Cover 95 100% 42% 40
*Mixed Solid Waste and Bulky Waste based on 2015 Waste Characterization, C&D based on Massachusetts DEP reports, all other diversion potential assumptions are based on anecdotal information.

Resource Recovery | 65 Shun Pike | www.rirrc.org
ICI Residential
MRF28%
Compostable - Any Scale
22%Compostable - Large Scale
3%
Drop-Off15%
Trash32%
(Management Class; Tons (k);
Resource Recovery | 65 Shun Pike | www.rirrc.org11
Paper and Packaging
• The residential waste stream is about 15% (45K tons) materials currently targeted in the single stream recycling program
• Rejected recycling (7-9K ton targeted material)
• Commercial generators potential for Cardboard
• Processing and Collection considerations
• Markets – mixed plastics 3467; mixed paper

Resource Recovery | 65 Shun Pike | www.rirrc.org12
Recycled Commodity Market Stability
$103$113
$59
$103
$140
$107$101 $104
$81$87
Calendar2007
Calendar2008
Calendar2009
Calendar2010
Calendar2011
Calendar2012
Calendar2013
Calendar2014
Calendar2015
Calendar2016
RI Resource Recovery MRF Average Price Per Ton Output w/ Residue
Resource Recovery | 65 Shun Pike | www.rirrc.org13
Organics
• The mixed solid waste stream is almost 30% organic material that could be targeted for some form of decomposition process making it a prime target for diversion
• A significant portion of residential food waste could be readily composted at home
• Difference between digestion and composting
• End markets vary depending on source and process
Resource Recovery | 65 Shun Pike | www.rirrc.org14
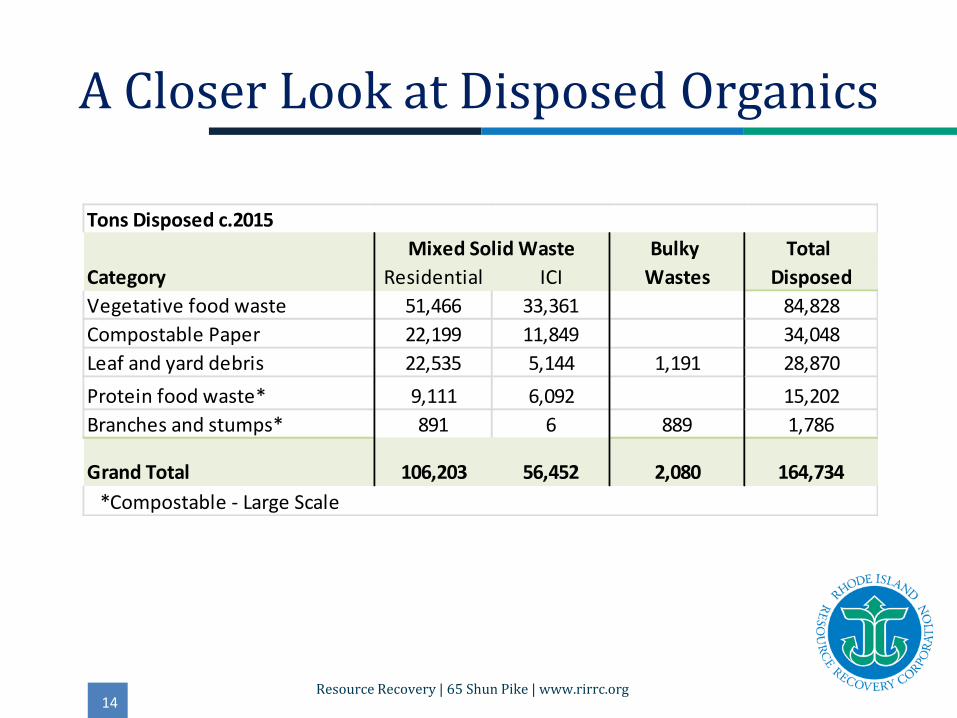
A Closer Look at Disposed Organics
Bulky Total
Category Residential ICI Wastes Disposed
Vegetative food waste 51,466 33,361 84,828
Compostable Paper 22,199 11,849 34,048
Leaf and yard debris 22,535 5,144 1,191 28,870
Protein food waste* 9,111 6,092 15,202
Branches and stumps* 891 6 889 1,786
Grand Total 106,203 56,452 2,080 164,734
Mixed Solid Waste
*Compostable - Large Scale
Tons Disposed c.2015

Resource Recovery | 65 Shun Pike | www.rirrc.org15
Construction and Demolition
• MA ban achieving 25-30%% recovery from disposal for building debris
– Wood
– Roofing shingles
– Gypsum
– Aggregates
– Cardboard
– Metal
Resource Recovery | 65 Shun Pike | www.rirrc.org16
Other Wastes
• Soils
• Sludge
• Street sweepings
• Process Residues
• Ash
Resource Recovery | 65 Shun Pike | www.rirrc.org17
Observations and Conclusions
• Only 56 % of the total waste delivered to the RIRRC landfill is mixed solid waste and bulky waste typically targeted in traditional recycling and composting programs
• Caution– There are no systems that divert 100% of available
materials– Many RI municipalities already have relatively high
diversion rates for those materials accepted in recycling programs.
– Organics processing systems, while showing promise, are constrained by the types of organics they can handle, and problems with contamination 17
Resource Recovery | 65 Shun Pike | www.rirrc.org18
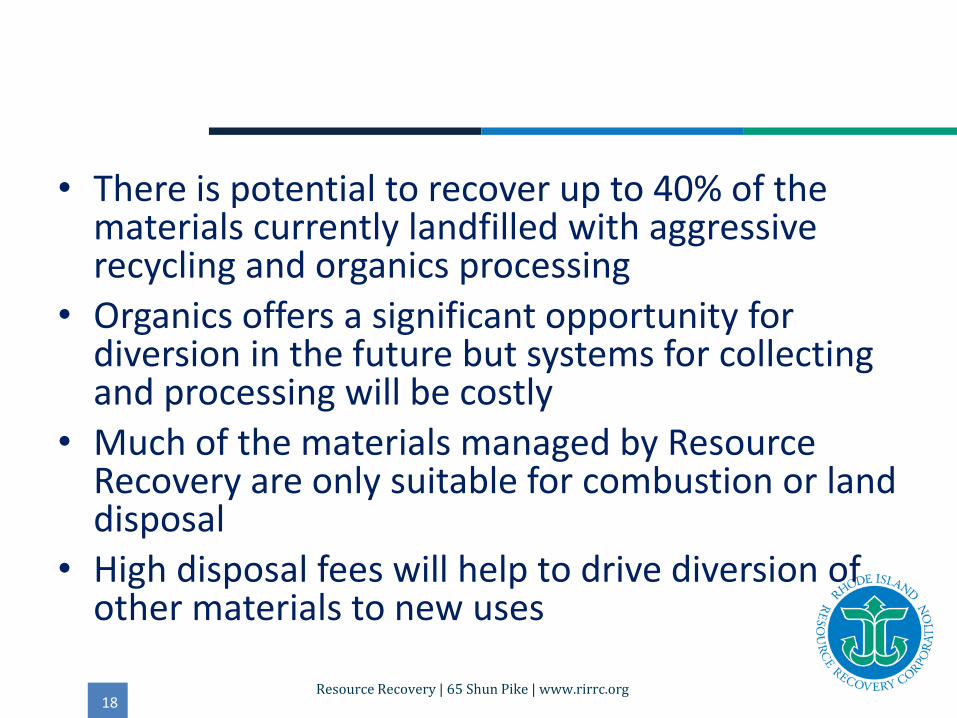
• There is potential to recover up to 40% of the materials currently landfilled with aggressive recycling and organics processing
• Organics offers a significant opportunity for diversion in the future but systems for collecting and processing will be costly
• Much of the materials managed by Resource Recovery are only suitable for combustion or land disposal
• High disposal fees will help to drive diversion of other materials to new uses
Brian Card
Director of Operations & Engineering
Rhode Island Resource Recovery Corporation
Disposal Capacity in Rhode Island
& Southern New England
Environmental Business Council of New England
Energy Environment Economy

Resource Recovery | 65 Shun Pike | www.rirrc.org
Disposal Capacity in RI and Southern New England
Brian N. Card, P.E., Director of Operations
RI Resource Recovery
September 12, 2017
Presented To: Environmental Business Council
Resource Recovery | 65 Shun Pike | www.rirrc.org21
RI Overview
• 2 Operating Landfills
• 5 Commercial Transfer Stations
• 1 C&D Processing Facility
• 3 Food Waste Composting Facilities
– 1 under construction, 1 proposed, 1 in operation
• 1 Proposed rail transfer station
• 1 Materials Recycling Facility
• Numerous Leaf & Yard composting operations of various sizes
Resource Recovery | 65 Shun Pike | www.rirrc.org22
RI Overview
• Municipal waste flow controlled to RIRRC –~25% of total waste generated in State
• Commercial sector waste open to market
• Out of State waste prohibited from disposal at Central Landfill
• RIRRC’s goal is to maximize disposal capacity for the residents of RI
Resource Recovery | 65 Shun Pike | www.rirrc.org23
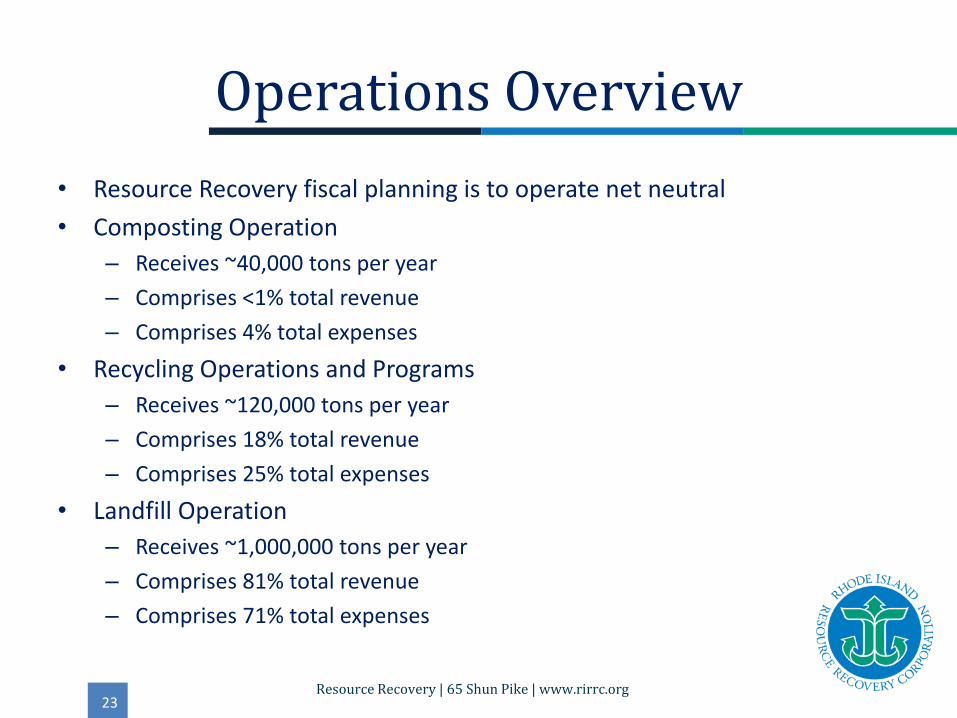
Operations Overview
• Resource Recovery fiscal planning is to operate net neutral
• Composting Operation
– Receives ~40,000 tons per year
– Comprises <1% total revenue
– Comprises 4% total expenses
• Recycling Operations and Programs
– Receives ~120,000 tons per year
– Comprises 18% total revenue
– Comprises 25% total expenses
• Landfill Operation
– Receives ~1,000,000 tons per year
– Comprises 81% total revenue
– Comprises 71% total expenses
Resource Recovery | 65 Shun Pike | www.rirrc.org24
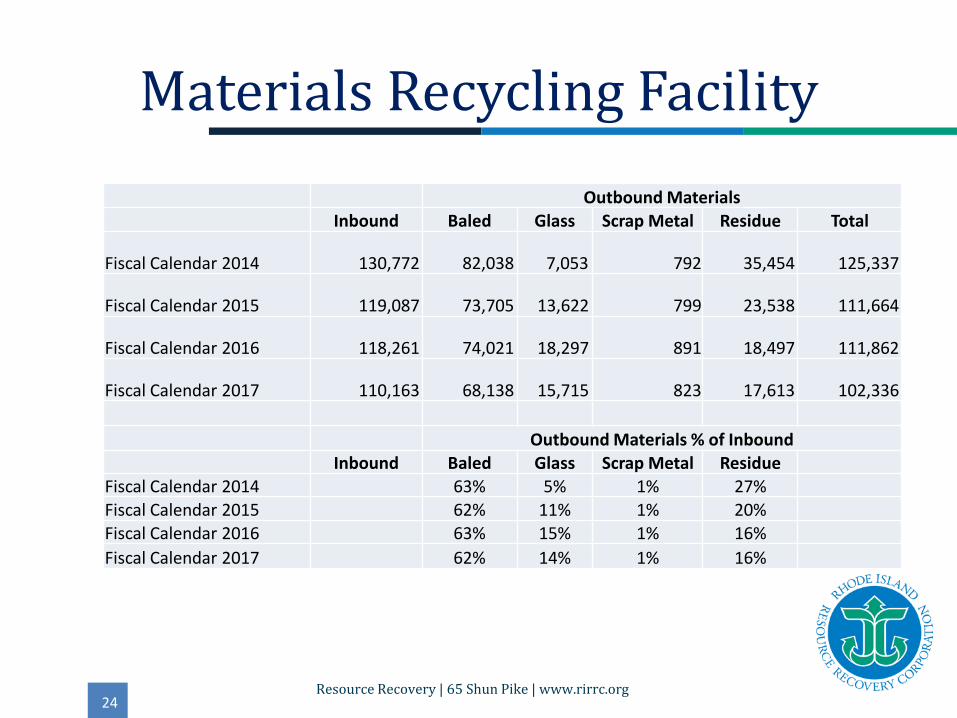
Materials Recycling Facility
Outbound Materials
Inbound Baled Glass Scrap Metal Residue Total
Fiscal Calendar 2014 130,772 82,038 7,053 792 35,454 125,337
Fiscal Calendar 2015 119,087 73,705 13,622 799 23,538 111,664
Fiscal Calendar 2016 118,261 74,021 18,297 891 18,497 111,862
Fiscal Calendar 2017 110,163 68,138 15,715 823 17,613 102,336
Outbound Materials % of Inbound
Inbound Baled Glass Scrap Metal Residue
Fiscal Calendar 2014 63% 5% 1% 27%
Fiscal Calendar 2015 62% 11% 1% 20%
Fiscal Calendar 2016 63% 15% 1% 16%
Fiscal Calendar 2017 62% 14% 1% 16%
Resource Recovery | 65 Shun Pike | www.rirrc.org25
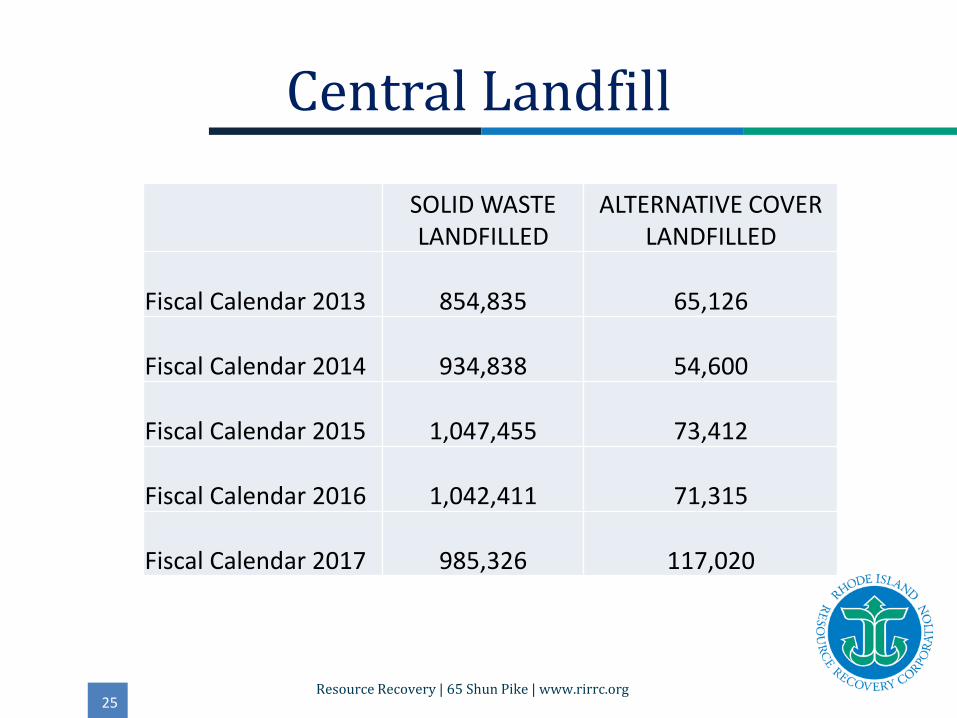
Central Landfill
SOLID WASTE LANDFILLED
ALTERNATIVE COVER LANDFILLED
Fiscal Calendar 2013 854,835 65,126
Fiscal Calendar 2014 934,838 54,600
Fiscal Calendar 2015 1,047,455 73,412
Fiscal Calendar 2016 1,042,411 71,315
Fiscal Calendar 2017 985,326 117,020
Resource Recovery | 65 Shun Pike | www.rirrc.org26
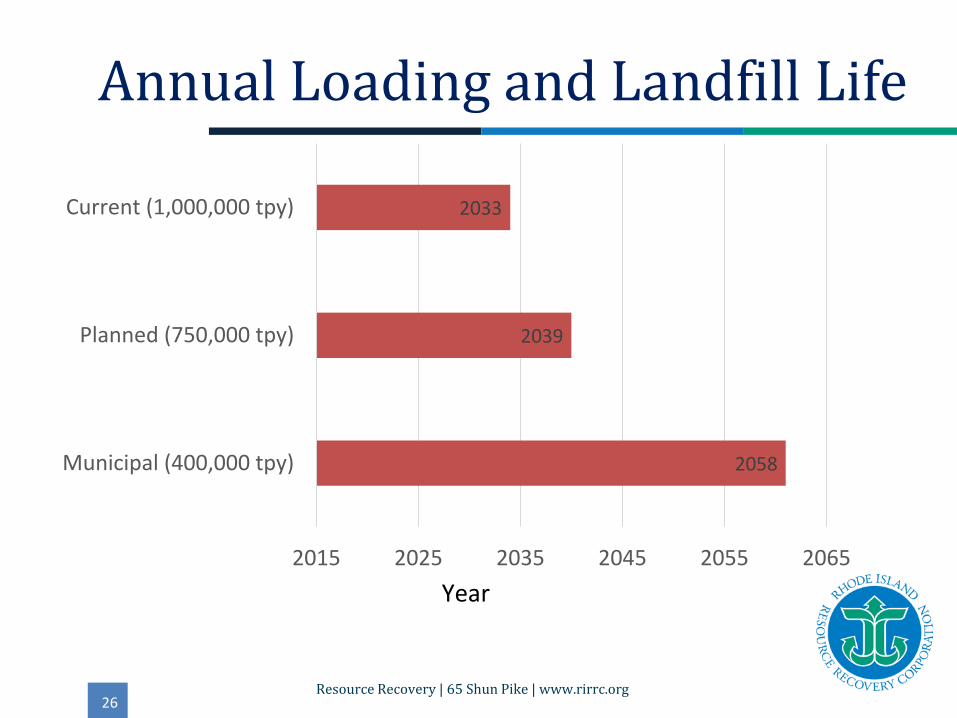
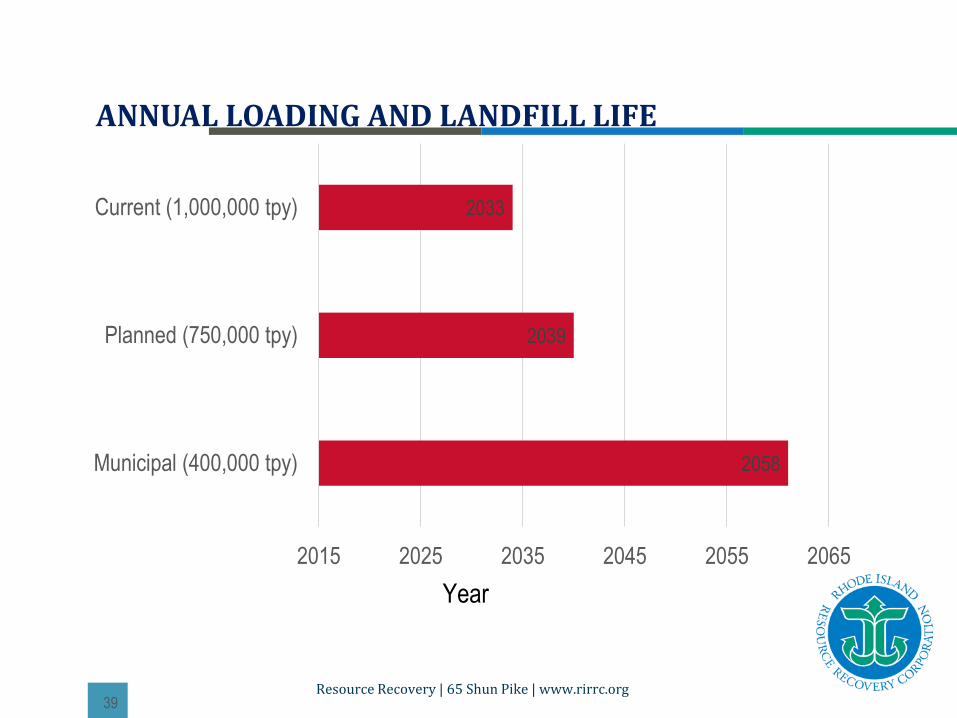
2058
2039
2033
2015 2025 2035 2045 2055 2065
Municipal (400,000 tpy)
Planned (750,000 tpy)
Current (1,000,000 tpy)
Year
Annual Loading and Landfill Life

Resource Recovery | 65 Shun Pike | www.rirrc.org27
Resource Recovery | 65 Shun Pike | www.rirrc.org28
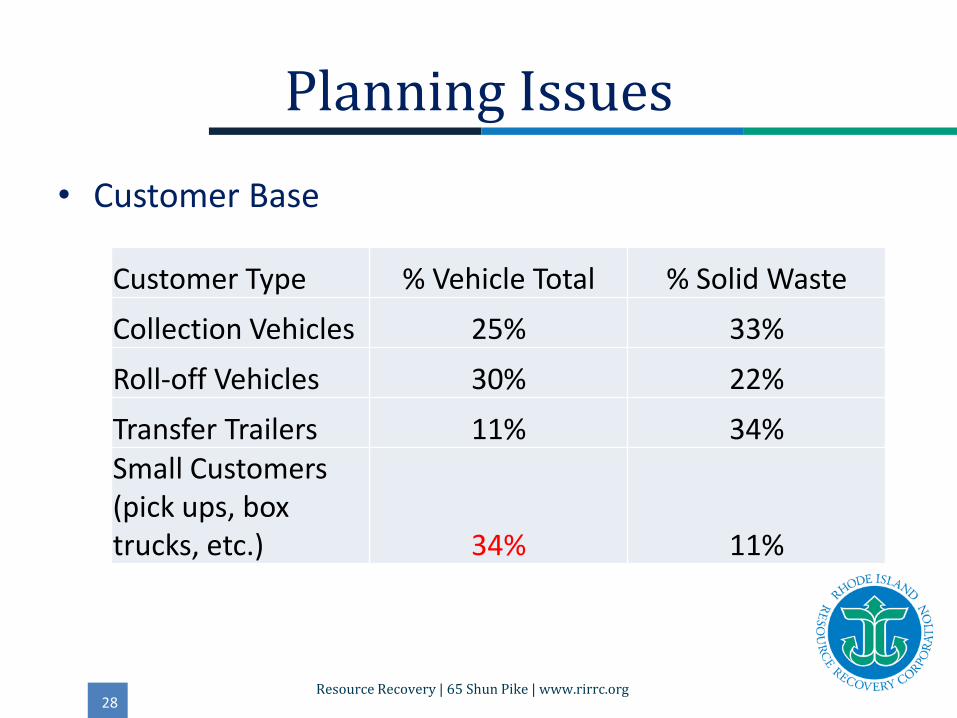
Planning Issues
• Customer Base
Customer Type % Vehicle Total % Solid Waste
Collection Vehicles 25% 33%
Roll-off Vehicles 30% 22%
Transfer Trailers 11% 34%Small Customers (pick ups, box trucks, etc.) 34% 11%

Resource Recovery | 65 Shun Pike | www.rirrc.org29
Planning Issues
• Legislative
– Changes needed to RIRRC statute to allow for full analysis of alternatives
– Volume controls?
• Regulatory
– Facility expansion
• Financial
– RIRRC self funded

Resource Recovery | 65 Shun Pike | www.rirrc.org30
Planning Strategy for Future
• 2017 through 2018 - Review of Technologies and Options
• 2019 - Engage stakeholder group to serve as Solid Waste Management Plan Advisory Committee and Recommend Future Course of Action
• 2020 - Prepare and approve a 20-Year System Development Plan
Christopher M. Koehler
Solid Waste Section Manager
HDR Engineering, Inc.
Disposal Capacity in Rhode Island
& Southern New England
Environmental Business Council of New England
Energy Environment Economy

Chris Koehler, PE, BCEE
Solid Waste Section Manager
• 20+ Years of Solid Waste Experience
• Landfill Closure Design, Transfer
Station/Drop-off Facility Design, Solid
Waste Management Plans, CCR
Impoundment Closures, Civil-Site Layout
and Design
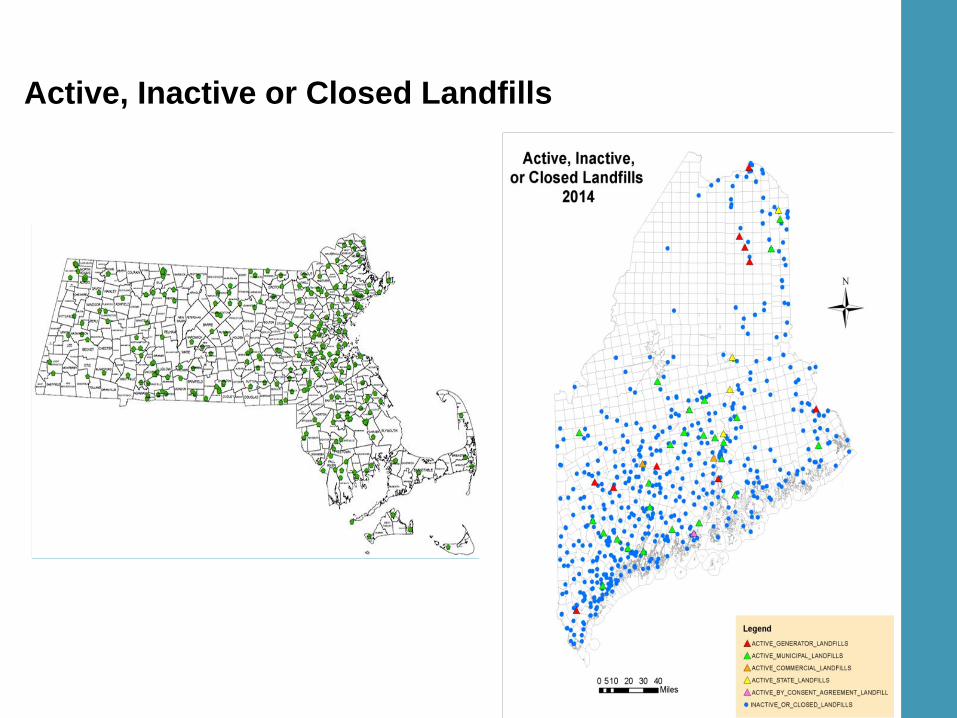
Active, Inactive or Closed Landfills
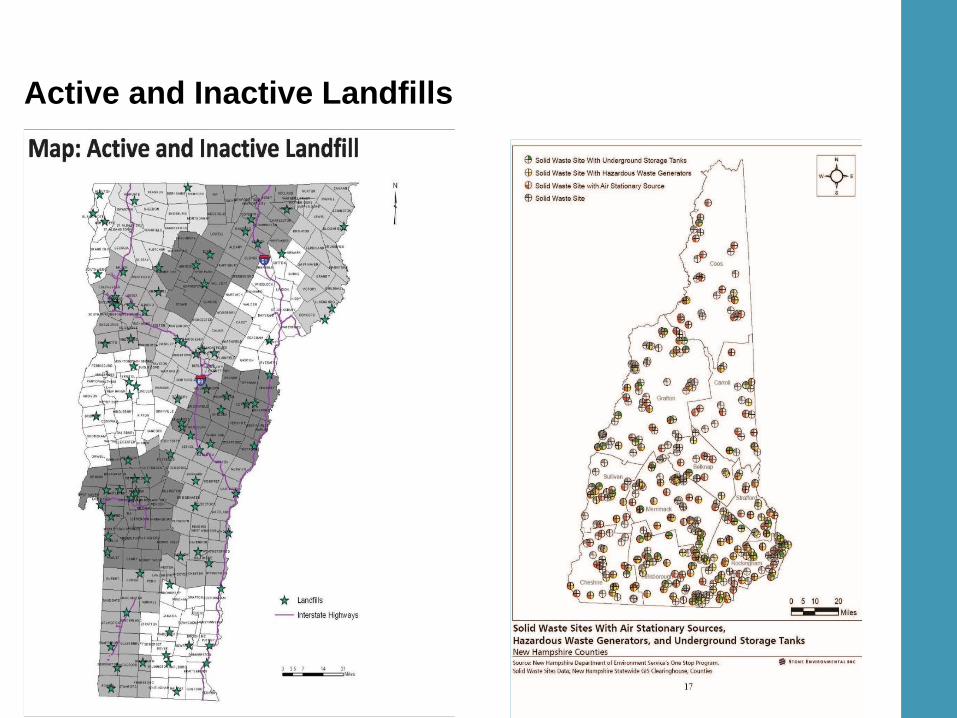
Active and Inactive Landfills
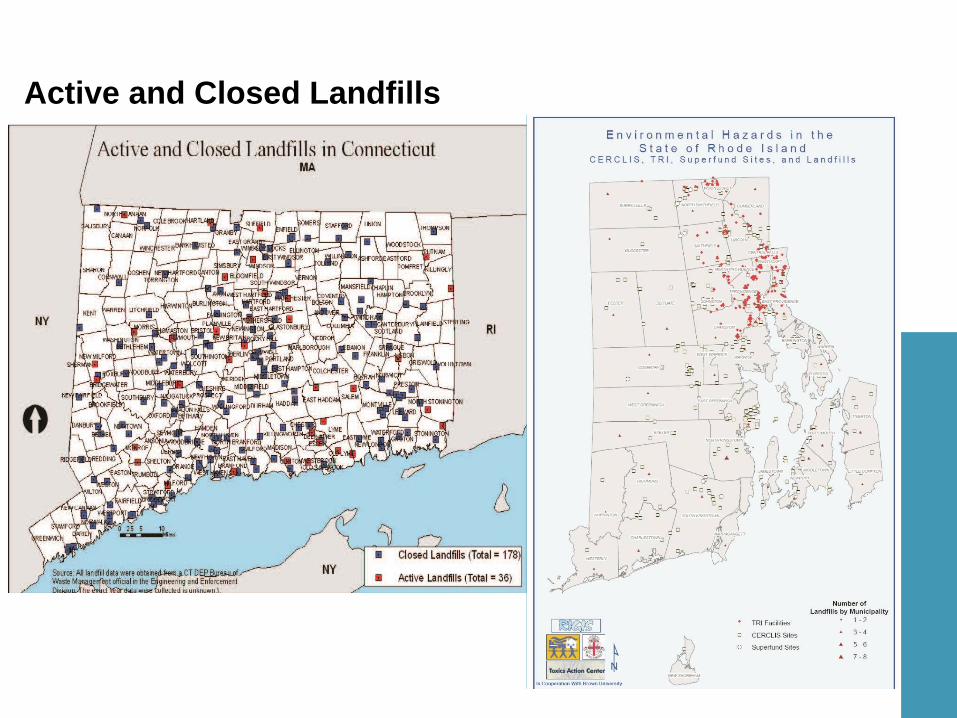
Active and Closed Landfills

The Numbers by State
MA – 6 Active MSW LF; 7 WTE
CT – 1 Active MSW; 5 WTE
RI – 2 Active MSW; 0 WTE
NH – 6 Active MSW; 1 WTE
VT – 1 Active MSW; 0 WTE
ME – 42 Active Sites; 3 WTE

Estimated Capacity in New England
Estimated Generation in New England

Estimated Generation/Capacity by State
State Capacity Generation
NH 1,569,819 970,279
ME 1,450,000 967,737
RI 850,000 767,865
VT 600,000 453,887
MA 4,593,825 4,950,967
CT 2,312,728 2,599,403
Resource Recovery | 65 Shun Pike | www.rirrc.org39
2058
2039
2033
2015 2025 2035 2045 2055 2065
Municipal (400,000 tpy)
Planned (750,000 tpy)
Current (1,000,000 tpy)
Year
ANNUAL LOADING AND LANDFILL LIFE
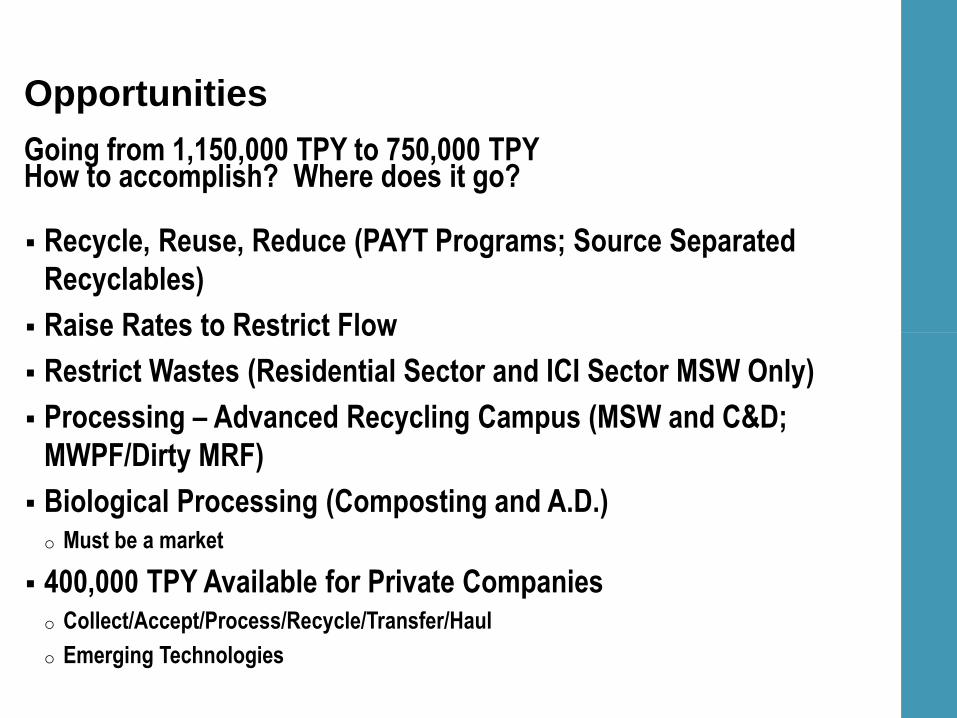
Recycle, Reuse, Reduce (PAYT Programs; Source Separated
Recyclables)
Raise Rates to Restrict Flow
Restrict Wastes (Residential Sector and ICI Sector MSW Only)
Processing – Advanced Recycling Campus (MSW and C&D;
MWPF/Dirty MRF)
Biological Processing (Composting and A.D.) o Must be a market
400,000 TPY Available for Private Companieso Collect/Accept/Process/Recycle/Transfer/Haul
o Emerging Technologies
Opportunities
Going from 1,150,000 TPY to 750,000 TPY How to accomplish? Where does it go?

What Happens after 2038?
Transfer Stations
oMSW and C&D
oRail and Truck
Continued Landfilling/ New
Landfill
Composting and A.D.
Waste-to-Energy
Emerging Technologies
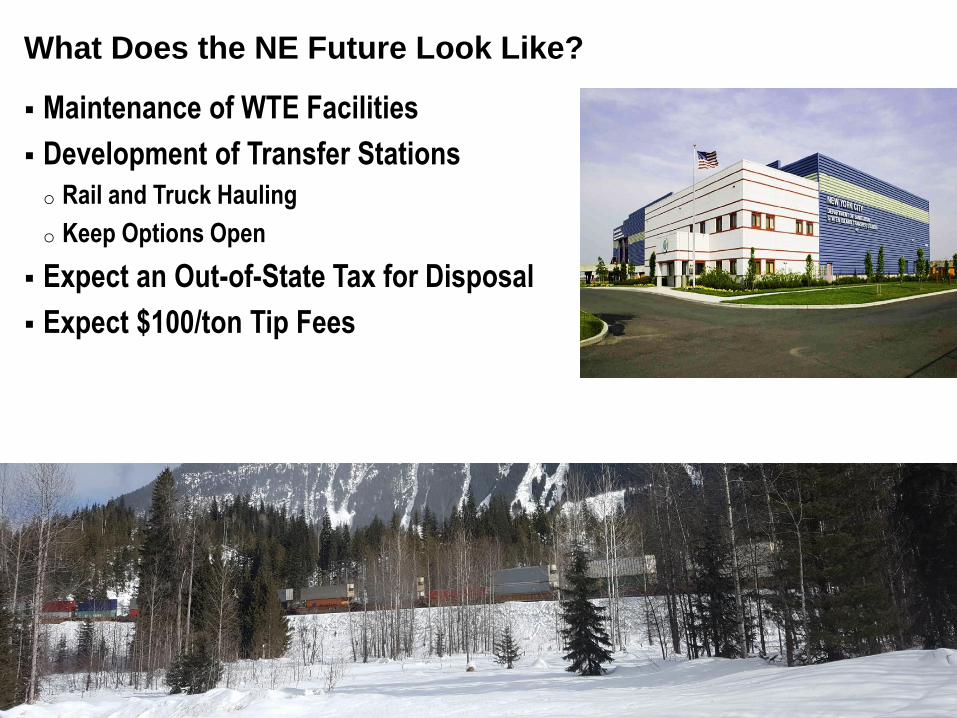
Maintenance of WTE Facilities
Development of Transfer Stations
o Rail and Truck Hauling
o Keep Options Open
Expect an Out-of-State Tax for Disposal
Expect $100/ton Tip Fees
What Does the NE Future Look Like?

In U.S. - average of $35/ton Landfill
Tipping Fee – 28 years of capacity.
In EU and Japan tipping fees $250/ton
More Scare Land; Higher Tip Fee
Oil is at $47.50/barrel
Must be a market for recyclables
China will ban 24 more items
NIMBY/NIMEY/NIMTO
Final Thoughts

Thank you.
Questions & Comments?
Chris Koehler, PE, BCEE
(617) 603-6363
Solid Waste Section Manager
Jamie Rhodes, Esq.
Program Director
Upstream Policy Institute
Can Producer Responsibility
Reduce the Green Waste?
Environmental Business Council of New England
Energy Environment Economy

Jamie RhodesProgram Director, UPSTREAM
EBC Rhode Island Program. September 12, 2017
Designing Extended Producer Responsibility (EPR) Program to Reduce Waste
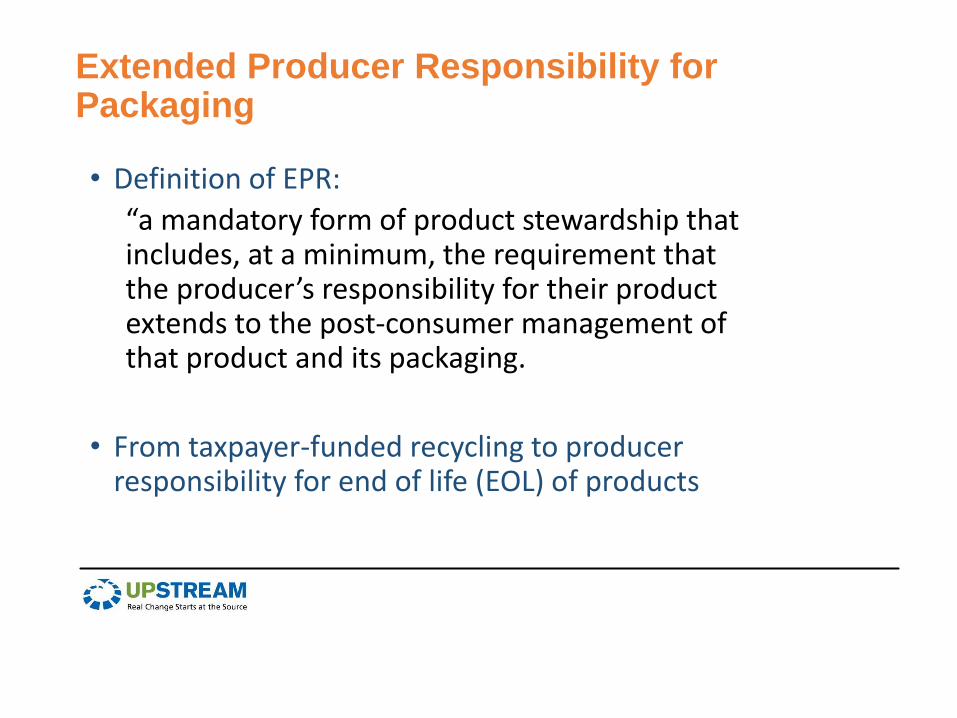
Extended Producer Responsibility for Packaging
• Definition of EPR:
“a mandatory form of product stewardship that includes, at a minimum, the requirement that the producer’s responsibility for their product extends to the post-consumer management of that product and its packaging.
• From taxpayer-funded recycling to producer responsibility for end of life (EOL) of products
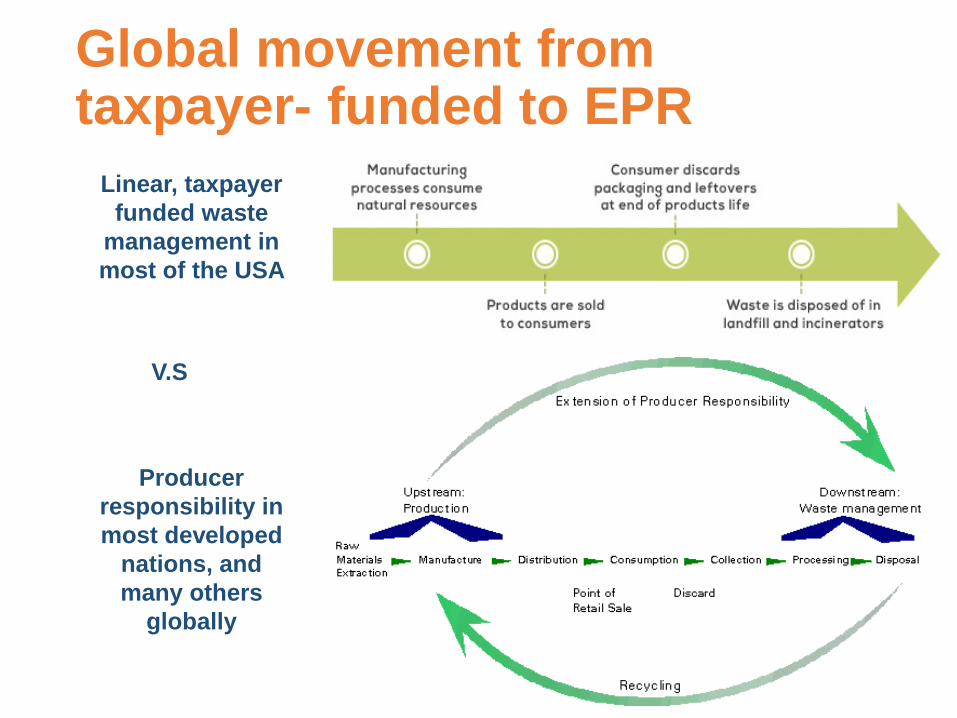
Global movement from taxpayer- funded to EPR
Linear, taxpayer
funded waste
management in
most of the USA
Producer
responsibility in
most developed
nations, and
many others
globally
V.S
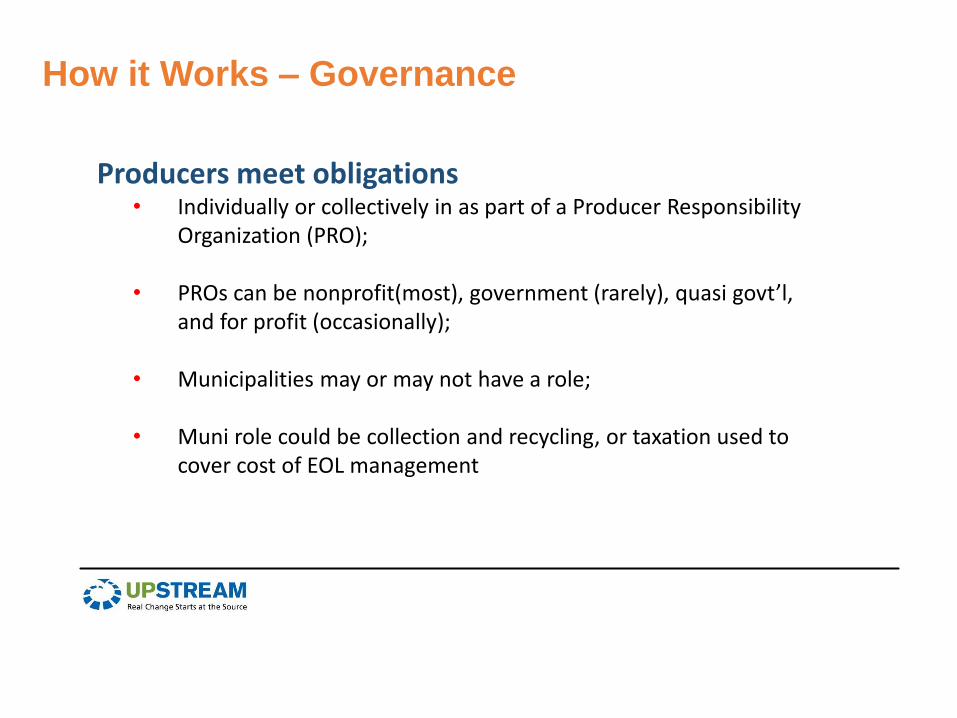
Producers meet obligations• Individually or collectively in as part of a Producer Responsibility
Organization (PRO);
• PROs can be nonprofit(most), government (rarely), quasi govt’l, and for profit (occasionally);
• Municipalities may or may not have a role;
• Muni role could be collection and recycling, or taxation used to cover cost of EOL management
How it Works – Governance

Some Updated EPR Schemes have Targeted Prevention (Too recent to evaluate impact)
by 2020, based on 2010: 5 % reduction in the ratio of municipal
solid waste (MSW) to gross domestic product unit (GDP);
Focus on amount of MSW produced per household
Promote sale of bulk products Encourage consumption of tap water
10 % reduction below 2010 waste generated annually (tonnes) by 2020. Focuses on a reduction in marine litter from terrestrial sources by:
reducing the quantity of waste; reusing products and extending their life; reducing harmful substances in materials and
products; and reducing the environmental and human
health impacts of waste.
limits amount of empty space and number of layers
bans laminated packaging components, press packaged or coated with PVC, also PVC shrink-wrap
banned PVC wrapping of certain foods

• Design for durability and reuse
• Eliminate excessive packaging
With Target Rates Set- Producers have Options for Compliance

With Target Rates Set- Producers have Options for Compliance
• Change dimensions, volume or composition of the packaging• Reduce void space/ filler/ material use• Packing in bulk• Refill packaging• Reusable transport packaging

Can EPR be a Solution for Marine Plastic Pollution?
• Typically EPR for packaging designed to increase recycling;• If it could reduce packaging -i.e. prevention- it could reduce littered
products;• NRDC model suggested financing cleanup;• State-wide storm water regulations for trash are complimentary;• Ongoing local efforts for product bans (straws, for example);• Looking at fees on take out packaging, and no disposables for dine-in
food service
Networking Break
Mark Dennen
Supervising Environmental Scientist
Rhode Island Department of Environmental
Management
Regulatory Challenges
and Changes
Environmental Business Council of New England
Energy Environment Economy

WASTE UPDATES FOR
Rhode Island
Mark Dennen, CPG-
Supervising Environmental Scientist
RIDEM/ Office of
Waste Management
235 Promenade St.
Providence, RI 02908
tel. 401.222.2797 ext. 7502
fax 401.222.3812
e-mail: [email protected]

Solid Waste Topics
Solid Waste
Re-promulgation of all RI Regulations
Climate Change and its effect on Closed Landfills
Solar Development at Landfills
E-Waste
Food Waste
Hazardous Waste
Pharmaceutical Rule
Federal E-manifest
Generator Improvement Rule
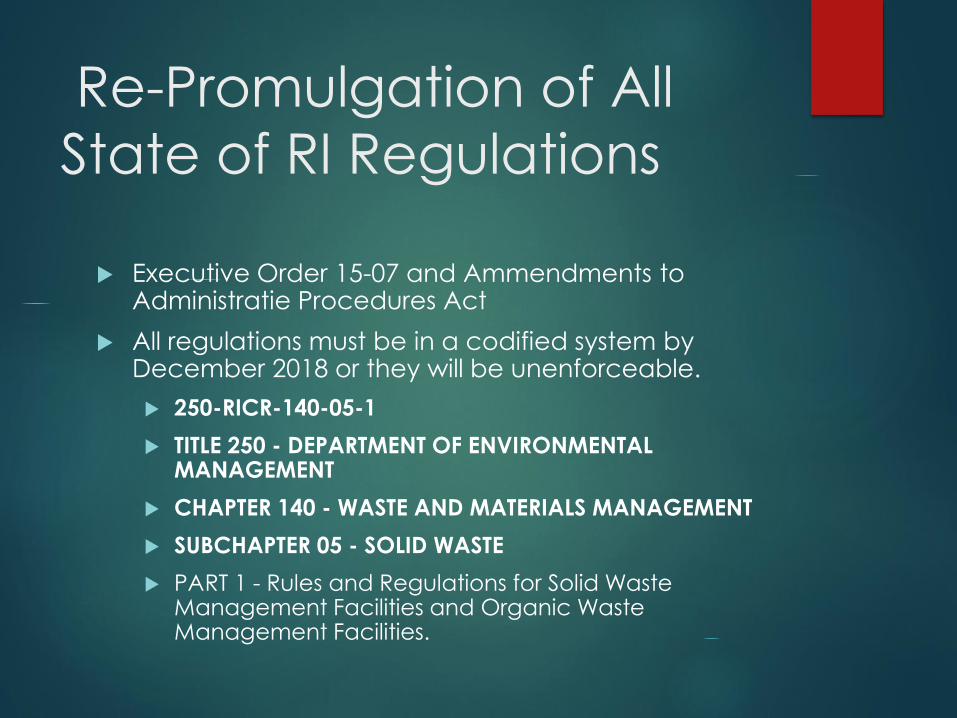
Re-Promulgation of All
State of RI Regulations
Executive Order 15-07 and Ammendments to Administratie Procedures Act
All regulations must be in a codified system by December 2018 or they will be unenforceable.
250-RICR-140-05-1
TITLE 250 - DEPARTMENT OF ENVIRONMENTAL MANAGEMENT
CHAPTER 140 - WASTE AND MATERIALS MANAGEMENT
SUBCHAPTER 05 - SOLID WASTE
PART 1 - Rules and Regulations for Solid Waste Management Facilities and Organic Waste Management Facilities.

Climate Change and
Closed Landfills
Landfills built near the coast are being subjected
to submersion by rising sea levels as well as increased frequency of severe storms.

BLOCK ISLAND LANDFILL
Site was threatened by erosion caused by starving
of sand due to dredging of salt pond
Erosion accelerated by Superstorm Sandy and
Winter Storms in 2013
Slope collapsed sending solid waste across
beaches north of the site.
Temporary volunteer cleanup while remedy was
being designed.

Block Island Landfill
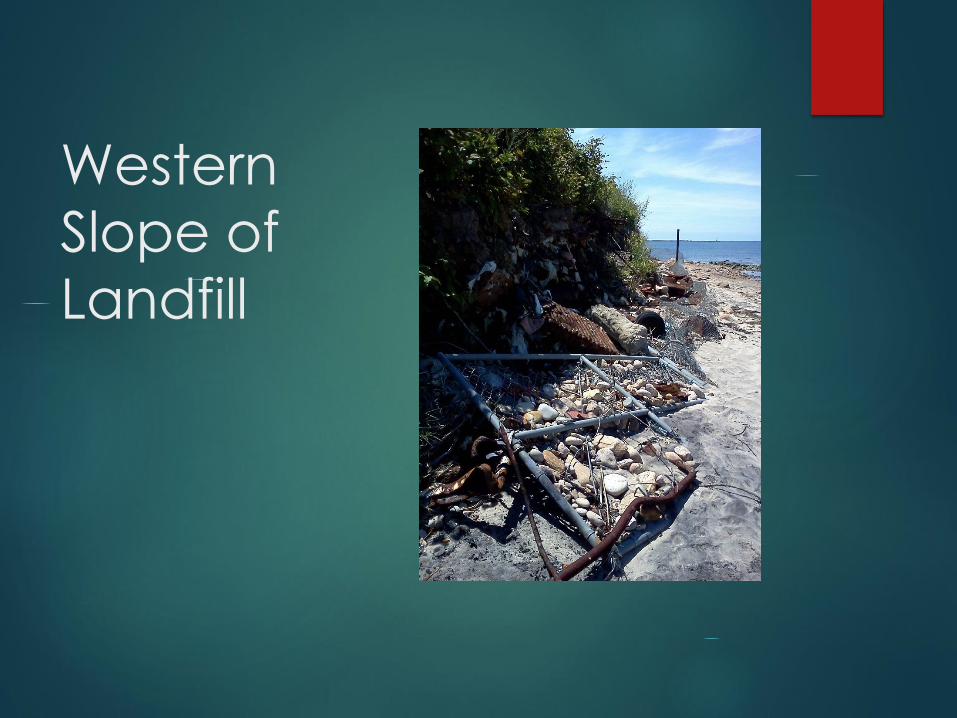
Western
Slope of
Landfill
Status of Site
Approved Remedy funded by US HUD grant to
build revetment
Remedy was abandoned due to cost/uncertainty
of addressing archaeological concerns
May proposed more limited slope work without
revetment
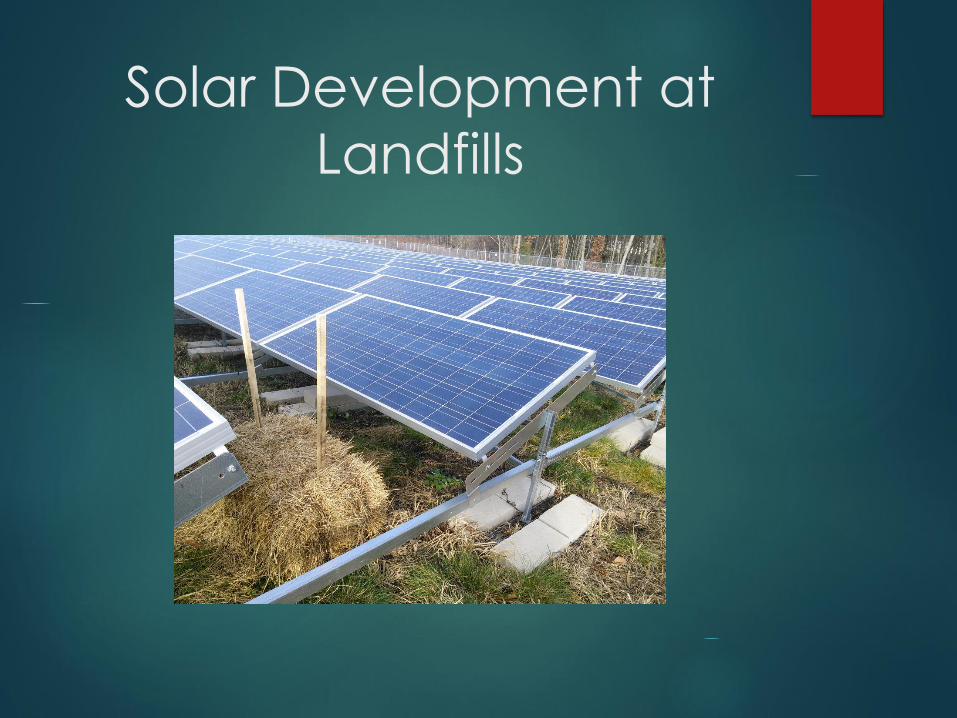
Solar Development at
Landfills

SOLAR ENERGY AT SITES THAT HAVE
NOT UNDERGONE CLOSURE
Environmental Investigation to characterize risk
and propose a remedy
Landfill Gas- may affect buried lines, structures
Impervious Area may raise storm water issues as
well as wetland permitting
Investigative work and remedy selection can
be concurrent with Solar Studies
The Department has not yet created
specific guidance such as MA DEP.

E-Waste in RI

Cost /Weight
Allocation
• EACH MANUFACTURER MUST:
• Register and pay $5,000 fee/year to sell electronics
• Must have a program to collect e-waste or pay
RIRRC to join state program
• May do program on their own to may band
together
• RIRRC Estimates total e-waste generated for state
and assigns target weights:
• Based on % of market/collected share
• Currently 6 lbs./ person
67
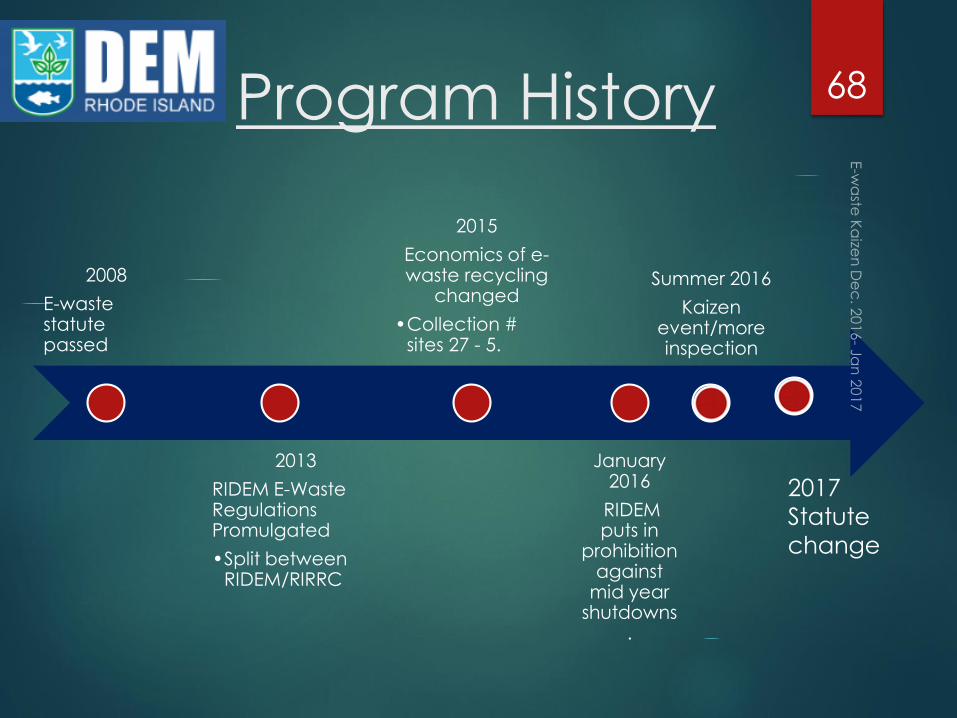
Program History
2008
E-waste statute passed
2013
RIDEM E-Waste Regulations Promulgated
•Split between RIDEM/RIRRC
2015
Economics of e-waste recycling
changed
•Collection # sites 27 - 5.
January 2016
RIDEM puts in
prohibition against
mid year shutdowns
.
Summer 2016
Kaizen event/more inspection
68
2017
Statute
change

Inspected collections and found
Discrepancies in quantities collected (over 1 million lbs)
Highly suspicious mid-year reporting (many manufacturers
were at exactly ½ required quantity)
Major deviations from plan (charging consumers for
televisions)
Some questionable quantities at collection facilities
Need for better reporting and oversight
69
Results of Joint Agency Kaizen Event
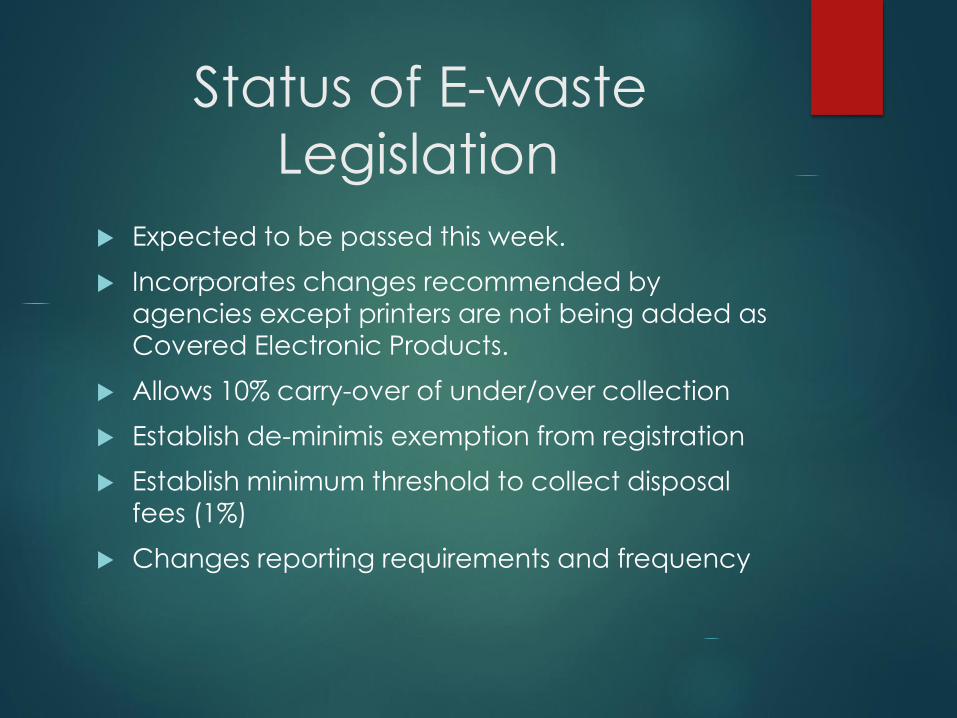
Status of E-waste
Legislation
Expected to be passed this week.
Incorporates changes recommended by
agencies except printers are not being added as
Covered Electronic Products.
Allows 10% carry-over of under/over collection
Establish de-minimis exemption from registration
Establish minimum threshold to collect disposal
fees (1%)
Changes reporting requirements and frequency
EPA Generator
Improvements Rule
Allowing a hazardous waste generator to avoid
increased burden of a higher generator status when generating episodic waste provided the
episodic waste is properly managed, and
Allowing a very small quantity generator (VSQG)
to send its hazardous waste to a large quantity
generator under control of the same person.
Source: USEPA

USEPA Pharmaceutical
Draft Proposal
Expected in Spring 2018
Major re-write of 2008 proposal that used Universal Waste Rule
Trying to address Pharmaceutical issues especially:
Reverse distribution
LQG status relative to nicotine gum
RCRA/DEA controlled substances overlaps
Creates New Framework as subpart P in RCRA under 266
Recognizes reverse distribution as allowable but says it is a waste

Additional Items in Pharm
Proposal
Does not add any new Pharmaceuticals Waste as
Hazardous Waste
In spite of 2012 IG report
Does not change P075 status of nicotine gum or
patch
More data needed
Prohibits Sewer Disposal of Pharmaceuticals
EPA would join other jurisdictions with sewer bans for
pharmaceuticals, including IL, NJ, DC, WA and CT
(proposed)

E-Manifest Rule and
related changes
MY RCRA ID, in new version of RCRA Info, allows
regulated entities to maintain their own data
Biennial reports will be produced online and
transmitted to states and USEPA
E-manifest will go live in June 2018
Generators, Transporters and Facilities will sign
manifest electronically
USEPA will be warehouse for all manifest data
Handlers will register via Central Data Exchange
(CDX). Test.epacdx.net

Composting
STAY TUNED!
Mark Dennen
Supervising Environmental Scientist
Rhode Island Department of Environmental
Management
Organics Management & Recycling –
Rhode Island Requirements
Environmental Business Council of New England
Energy Environment Economy
Organic Waste
Management in
Rhode IslandMARK DENNEN, SUPERVISING ENVIRONMENTAL SCIENTIST
RIDEM/OFFICE OF WASTE MANAGEMENT
401-222-2797 EXT. 7112 [email protected] OR 401-222-2797 EXT. 7511 [email protected]
Expansion of Organic Waste
Management
Small Scale Composting Facilities
Medium Scale Composting Facilities
Anaerobic Digestion Facilities
Modification of Existing Composting Facilities Regulations
Leaf and Yard Waste (large scale)
Putrescible Waste (large scale)
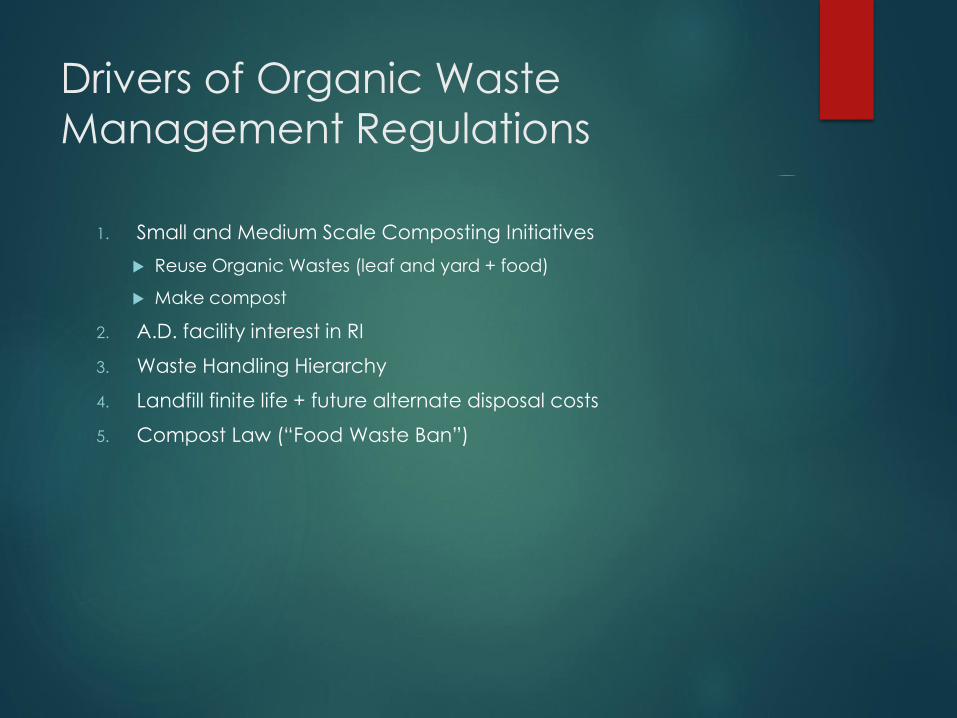
Drivers of Organic Waste
Management Regulations
1. Small and Medium Scale Composting Initiatives
Reuse Organic Wastes (leaf and yard + food)
Make compost
2. A.D. facility interest in RI
3. Waste Handling Hierarchy
4. Landfill finite life + future alternate disposal costs
5. Compost Law (“Food Waste Ban”)

Food Waste Ban RIGL 23-
19.9-17 Effective 1/1/2016
Commercial and Various Institutional Organic Waste
Generators
>104 tons/yr organic waste
Food scraps
Food processing waste
Soiled paper
Non-recyclable paper
>52 tons/yr in 2018
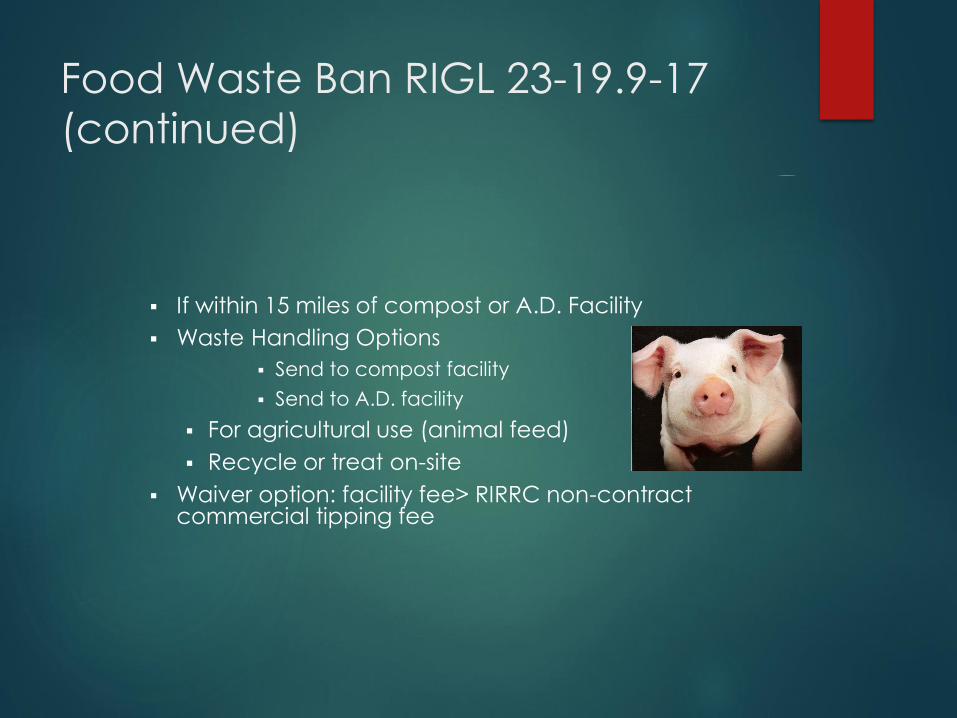
Food Waste Ban RIGL 23-19.9-17
(continued)
If within 15 miles of compost or A.D. Facility
Waste Handling Options
Send to compost facility
Send to A.D. facility
For agricultural use (animal feed)
Recycle or treat on-site
Waiver option: facility fee> RIRRC non-contract commercial tipping fee
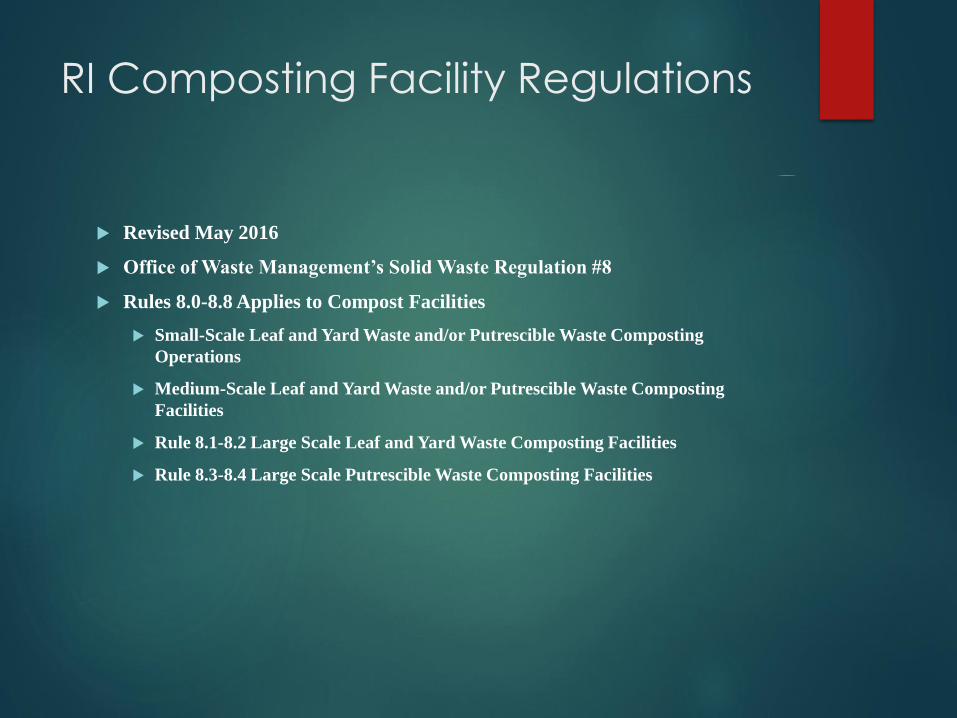
RI Composting Facility Regulations
Revised May 2016
Office of Waste Management’s Solid Waste Regulation #8
Rules 8.0-8.8 Applies to Compost Facilities
Small-Scale Leaf and Yard Waste and/or Putrescible Waste Composting
Operations
Medium-Scale Leaf and Yard Waste and/or Putrescible Waste Composting
Facilities
Rule 8.1-8.2 Large Scale Leaf and Yard Waste Composting Facilities
Rule 8.3-8.4 Large Scale Putrescible Waste Composting Facilities

Composting Facility Comparison
Small-scale Medium-scale Large-scale
Waste Quantity (yds3) 0-25 25-600 >600
Waste Types
Leaf and Yard Waste? Yes Yes Yes
Putrescible Wastes Limited types More types (pilot
program)
Extensive types
Buffer zone requirements No No Yes
Operating standards No* No* Yes
Finished compost quality Class A Class A Class A, B or C per defined markets
*no adverse effects- surface groundwater, wetlands, odors, vectors, dust, litter
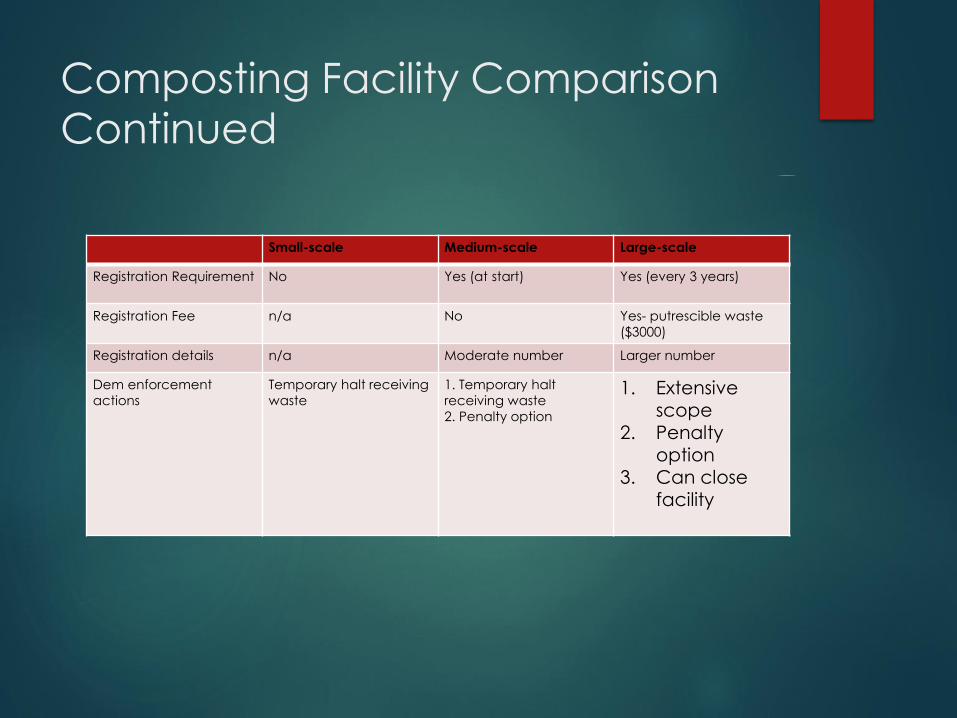
Composting Facility Comparison
Continued
Small-scale Medium-scale Large-scale
Registration Requirement No Yes (at start) Yes (every 3 years)
Registration Fee n/a No Yes- putrescible waste
($3000)
Registration details n/a Moderate number Larger number
Dem enforcement
actions
Temporary halt receiving
waste
1. Temporary halt
receiving waste
2. Penalty option
1. Extensive scope
2. Penalty option
3. Can close facility

RI A.D. Facilities Regulations
Effective May 2016
Office of Waste Management’s Solid Waste Regulation #8
Rules 8.9-8.11 A.D. Facilities (all size facilities)
No size subsets
Applies to A.D. Facilities accepting solid and liquid organics
Typically Food Waste and animal manure
No biosolids- OWR digestion facility regulations

A.D. Regulation Rule 8.9
$10,000 license fee
License application
License process:
Approval of license application
Public information workshop- per state law
Public comment hearing- per state law

A.D. Licensing application
1. Radius plan
2. Site plan
3. Construction and engineering
plans
4. Summary description facility
design and operations
5. Odor/aesthetics consideration
6. Operating plan
7. Product storage and marketing
plan
8. Facility closure plan

A.D. Regulation Details Basis:
1. Concepts employed in RI composting regulations
2. Review/adoption of appropriate portions of other states AD
regulations
3. Input from Regulated Community and State Food Policy Council
1. AD applicant commented on draft regulations
2. Provisional approval given under old regulations as Compost Facility

New Digester- Orbit Energy-
Johnston, RI

History of A.D. Facility Regulation
Usage
1. One facility is in licensing process
Currently preparing license application
2. No operating facilities, past or current
3. Current applicant:
Approx. 200 tons/day organic input
Wet digestion process
Methane- 3.2 MW combined with power production
Solid digestate- compost facility input
Currently ramping up for full scale operation
Catherine Conley
Microbiologist
Auspark, LLC
Organics Management & Recycling –
Rhode Island Requirements
Environmental Business Council of New England
Energy Environment Economy

ORBIT ENERGY RHODE ISLAND
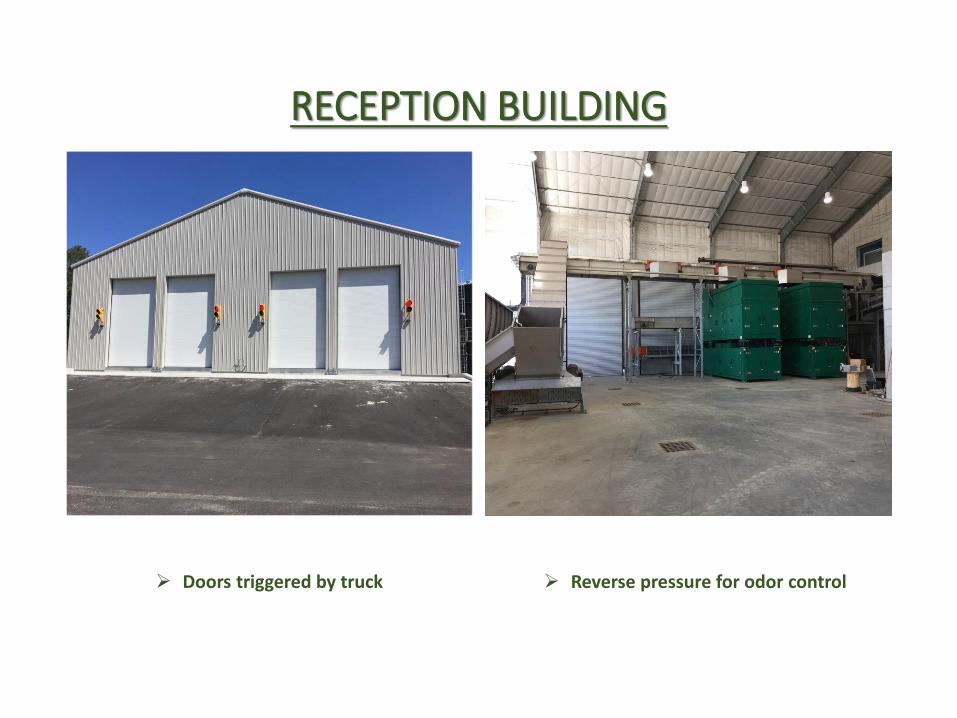
RECEPTION BUILDING
Doors triggered by truck Reverse pressure for odor control
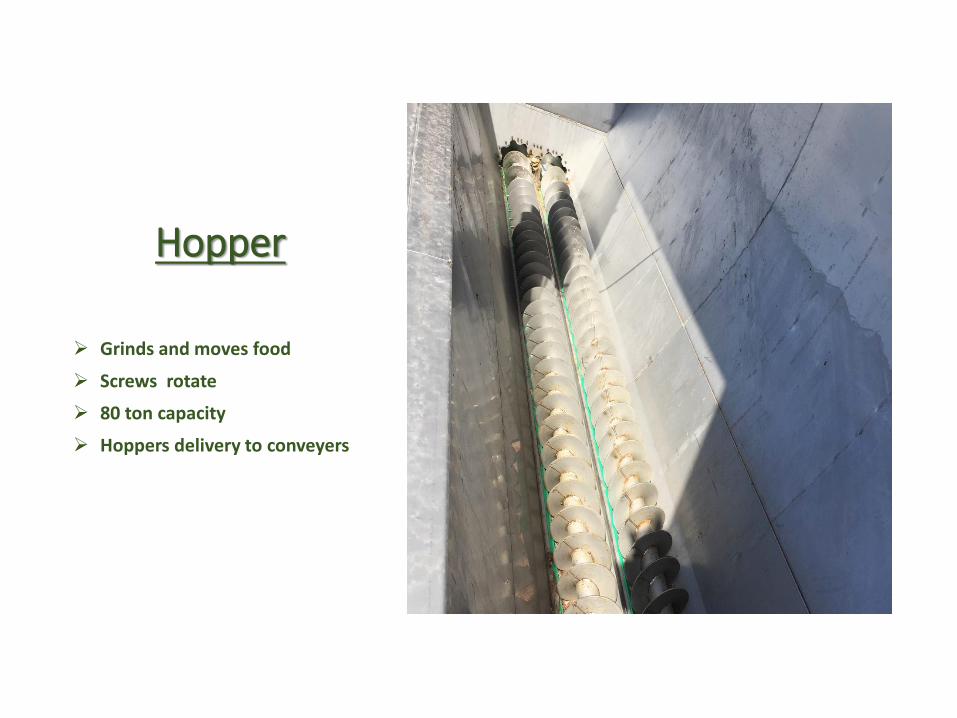
Hopper
Grinds and moves food
Screws rotate
80 ton capacity
Hoppers delivery to conveyers

Tornados Washing machine effect
separates non organic waste from organic

Bio Filter
870 feet long x 210 feet wide
8 feet deep
Different size wood chips
Organic odor control

BIO PUPLER Stomach of the system
Holds 225,000 gallons
Central transfer to digesters
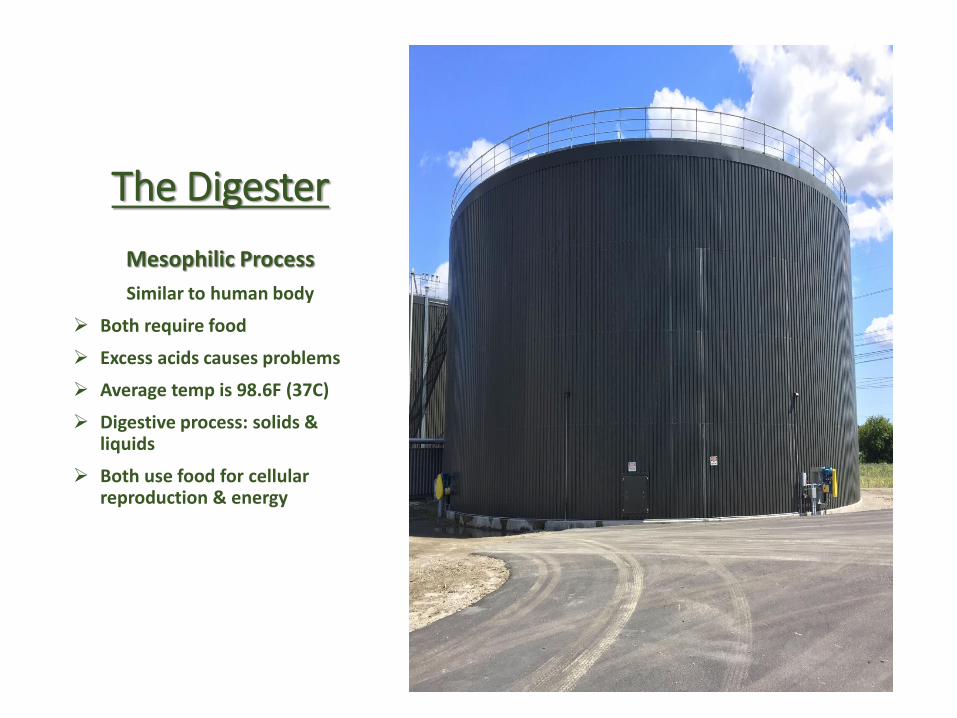
The Digester
Mesophilic Process
Similar to human body
Both require food
Excess acids causes problems
Average temp is 98.6F (37C)
Digestive process: solids & liquids
Both use food for cellular reproduction & energy

COLD DIGESTOR
Gas collection as digestate cools gas is collected
Gas collected in low pressure, water sealed membrane
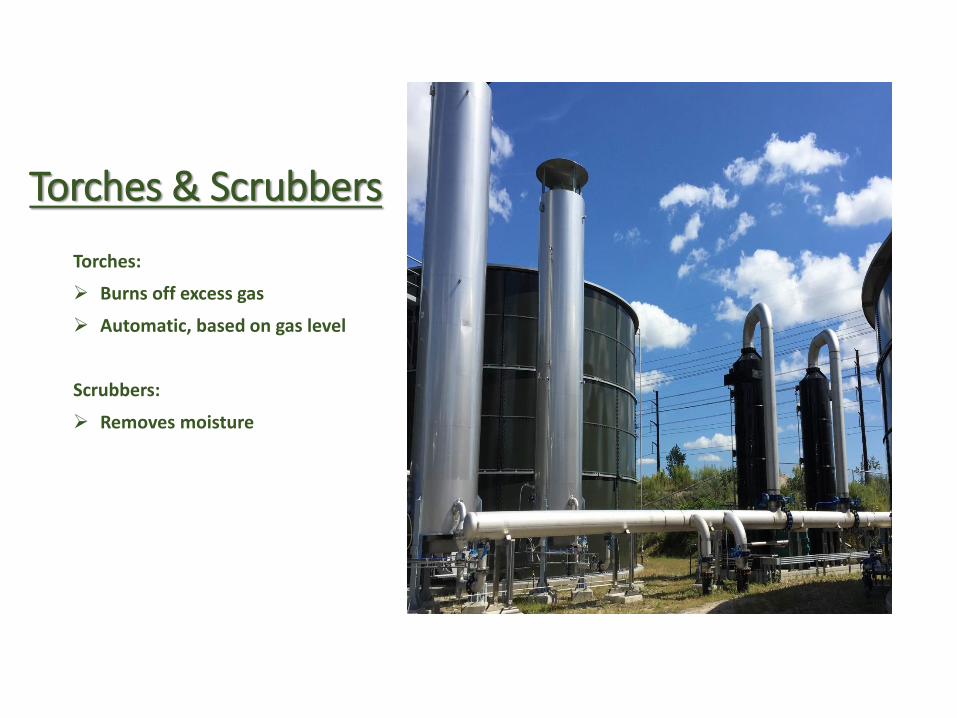
Torches & Scrubbers
Torches:
Burns off excess gas
Automatic, based on gas level
Scrubbers:
Removes moisture
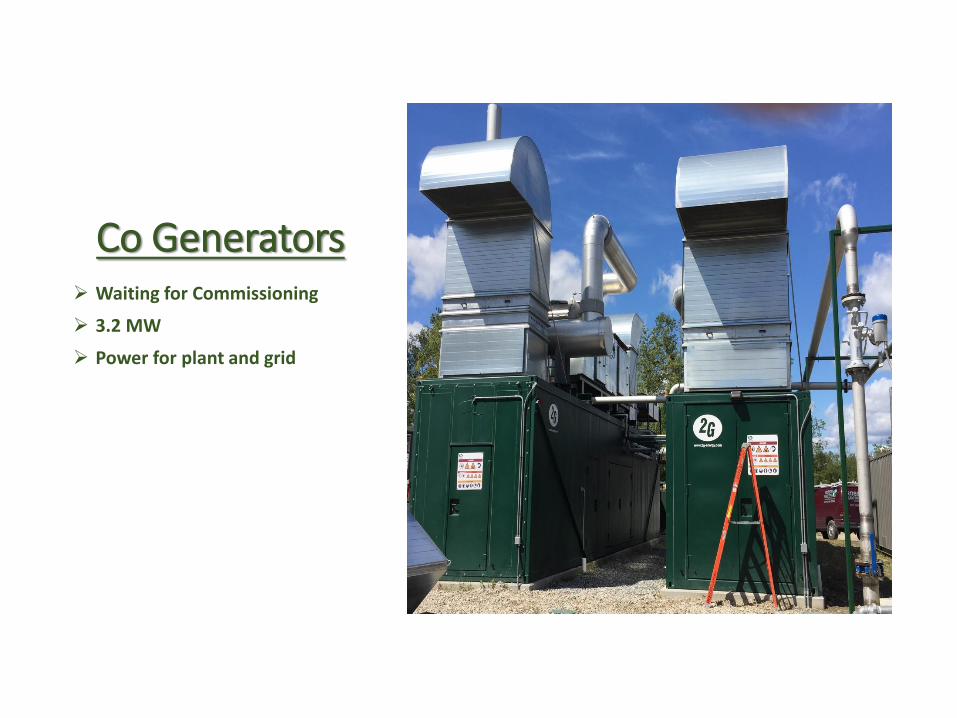
Co Generators Waiting for Commissioning
3.2 MW
Power for plant and grid

On Going Construction…
Finish Waste Water Treatment Area Complete installation of Centrifuge and Dryer Commissioning Hand off from Construction to Operations Finalization of Permits
Panel Discussion
Moderators: Ed Summerly, GZA
Panelists:
• Brian Card, RIRRC
• Catherine Conley, Auspark, LLC
• Mark Dennen, RIDEM
• Michael McGonagle, RIRRC
• Jamie Rhodes, Upstream Policy Institute
Environmental Business Council of New England
Energy Environment Economy