update on modis de-trending and x-calibration analysis · pdf fileupdate on modis de-trending...
TRANSCRIPT

Update on MODIS De-Trending and X-Calibration Analysis
A. Lyapustin, Y. Wang, S. Korkin.
June 6, 2016

MODIS De-trending and X-calibration
1. MCST: Trending Moon (1 angle) and Earth Targets (EV views - Deserts) to get changing RVS;
2. OBPG - Polarization Correction: use Aqua L3 retrievals (as true) to compute expected TOA radiances for Terra view geometry (over open Ocean);
Based on that, compute M11, m12, m13;
Lm/M11 = Lt + m12*Q + m13*U
Lm: measured TOA radiance (Terra)
Lt: expected TOA radiance (from L3 Aqua)
Q, U : linear Stokes vector components, modeled from Rayleigh and glint
M11, m12, m13 : fitted instrument characterization parameters (depend on band, MS, detector, scan angle)
3. LWK: Apply PC and do residual de-trending and X-cal (gain adjustment).
MODIS de-trending
y = -8.6188E-04x + 4.5052E-01
0.4
0.42
0.44
0.46
0.48
0.5
0.000 2.000 4.000 6.000 8.000 10.000 12.000
Terra TOA refl. (Rn), Egypt1, B1
Year Since 2003
y = -1.2520E-04x + 4.5058E-01
0.4
0.42
0.44
0.46
0.48
0.5
0.000 2.000 4.000 6.000 8.000 10.000 12.000
De-trended Terra TOA refl. (Rn), Egypt1, B1
Year Since 2003
y = 4.1676E-04x + 5.5985E-01
0.52
0.54
0.56
0.58
0.6
0.000 2.000 4.000 6.000 8.000 10.000 12.000
Terra TOA refl. (Rn), Egypt1, B2
Year Since 2003
y = -2.4803E-05x + 5.5988E-01
0.5
0.52
0.54
0.56
0.58
0.6
0.000 2.000 4.000 6.000 8.000 10.000 12.000
De-trended Terra TOA refl. (Rn), Egypt1, B2
Year Since 2003
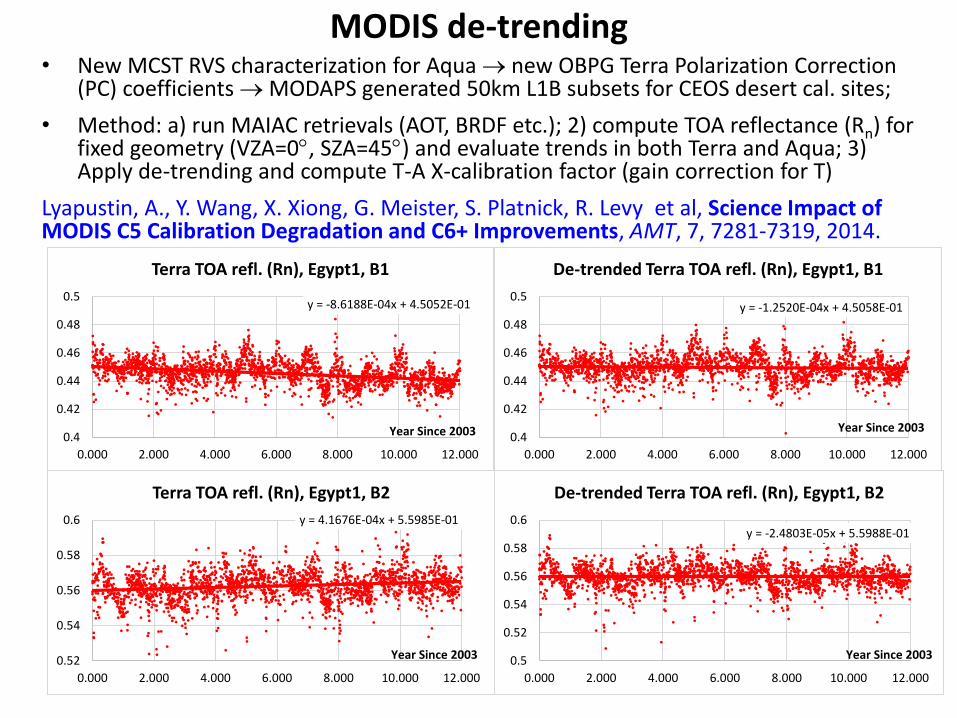
• New MCST RVS characterization for Aqua new OBPG Terra Polarization Correction (PC) coefficients MODAPS generated 50km L1B subsets for CEOS desert cal. sites;
• Method: a) run MAIAC retrievals (AOT, BRDF etc.); 2) compute TOA reflectance (Rn) for fixed geometry (VZA=0, SZA=45) and evaluate trends in both Terra and Aqua; 3) Apply de-trending and compute T-A X-calibration factor (gain correction for T)
Lyapustin, A., Y. Wang, X. Xiong, G. Meister, S. Platnick, R. Levy et al, Science Impact of MODIS C5 Calibration Degradation and C6+ Improvements, AMT, 7, 7281-7319, 2014.

MODIS de-trending (cont.)
y = -9.6275E-05x + 4.5891E-01 0.43
0.44
0.45
0.46
0.47
0.48
0 2 4 6 8 10 12
Aqua TOA Refl.(Rn), Egypt1, B1
Year Since 2003
y = -9.3208E-05x + 4.5901E-01
0.43
0.44
0.45
0.46
0.47
0.48
0.000 2.000 4.000 6.000 8.000 10.000 12.000
De-trended Aqua Refl.(Rn), Egypt1, B1
y = -6.9660E-05x + 5.6028E-01
0.5
0.52
0.54
0.56
0.58
0.6
0 2 4 6 8 10 12
Aqua TOA Refl.(Rn), Egypt1, B2
y = -2.1004E-05x + 5.6029E-01
0.5
0.52
0.54
0.56
0.58
0.6
0.000 2.000 4.000 6.000 8.000 10.000 12.000
De-trended Aqua Refl.(Rn), Egypt1, B2

MODIS X-calibration
y = -9.3208E-05x + 4.5901E-01
y = -1.2520E-04x + 4.5058E-01
0.4
0.42
0.44
0.46
0.48
0.5
0.000 2.000 4.000 6.000 8.000 10.000 12.000
de-trended Aqua & Terra Rn (Egypt1, B1)
Year Since 2003
y = -9.3208E-05x + 4.5901E-01
y = -1.1410E-04x + 4.5888E-01
0.4
0.42
0.44
0.46
0.48
0.5
0.000 2.000 4.000 6.000 8.000 10.000 12.000
x-calibrated Aqua & Terra Rn (Egypt1, B1)
Year Since 2003
y = -7.7859E-05x + 2.4027E-01
y = -2.5492E-04x + 2.3801E-01
0.2
0.21
0.22
0.23
0.24
0.25
0.26
0.000 2.000 4.000 6.000 8.000 10.000 12.000
de-trended Aqua & Terra Rn (Egypt1, B10)
Year Since 2003
y = -7.7859E-05x + 2.4027E-01
y = -2.2676E-04x + 2.4096E-01
0.2
0.21
0.22
0.23
0.24
0.25
0.26
0.000 2.000 4.000 6.000 8.000 10.000 12.000
x-calibrated Aqua & Terra Rn (Egypt1, B10)
Year Since 2003
After MCST RVS de-trending for Aqua, we see trend reduction (a factor of 12 in B1 and a factor of 2 in B3) compared to our previous analysis.

Summary
ΔTerra σTerra ΔAqua σAqua
TOA_B01 -1.6884E-03 2.6114E-04 1.5848E-06 3.9377E-04
TOA_B02 7.7780E-04 2.4303E-04 -6.5120E-05 3.5583E-04
TOA_B03 -8.8922E-04 4.5314E-04 -3.1763E-04 2.8486E-04
TOA_B04 -5.6629E-04 3.2829E-04 -3.9831E-05 5.0202E-04
TOA_B05 1.9477E-04 3.3019E-04 4.5784E-06 3.3528E-04
TOA_B06 -3.9516E-04 3.0211E-04 -3.1194E-04 2.8191E-04
TOA_B07 2.0259E-04 2.4491E-04 -5.8419E-04 3.2705E-04
TOA_B08 -1.2627E-03 1.0018E-03 -5.5178E-04 1.0915E-04
TOA_B09 -3.9874E-04 5.2176E-04 1.3724E-04 2.1120E-04
TOA_B10 -7.2800E-04 8.2601E-04 -3.0632E-04 7.1498E-04
Average trend/year/unit_refl.
Average Stdev
TOA_B01 1.018776 0.000949
TOA_B02 1.000523 0.001054
TOA_B03 0.989436 0.001268
TOA_B04 1.00109 0.001448
TOA_B05 0.98862 0.001855
TOA_B06 0.997128 0.000898
TOA_B07 0.999368 0.000373
TOA_B08 1.003774 0.000948
TOA_B09 1.0014 0.001488
TOA_B10 1.014141 0.002077
Average X-gain for Terra
Conclusions
o Largest residual trends in Terra B1 and B8 (>0.01 per decade);
o Largest Terra gain adjustment in B1 (~2%);
o Expanded analysis and added B5-B7 and B9-B10 (unsaturated).