update on fracture analyses and literature review for...
TRANSCRIPT

Update on Fracture Analyses and
Literature Review for
Ferromagnetic Loads
Jake Blanchard
July 2011

Outline
3-D Analysis of Flat Plate Divertor
◦ High stress areas
◦ Crack locations
◦ Thermal stress included
◦ Consider full power and cool-down
Literature Review of Ferromagnetic Loads
in Tokamaks
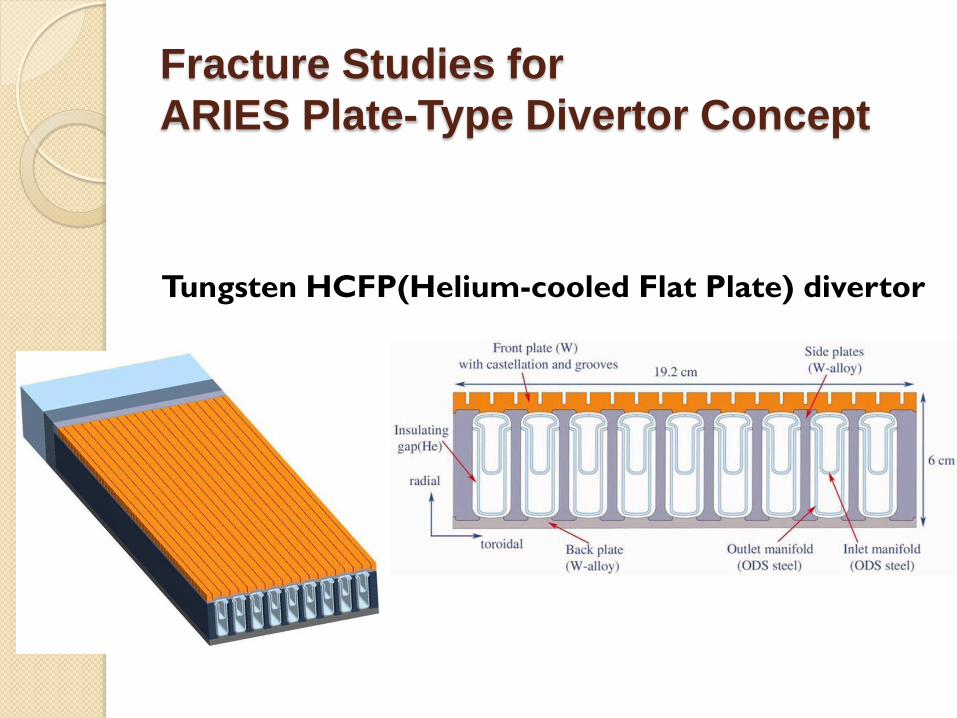
Fracture Studies for
ARIES Plate-Type Divertor Concept
Tungsten HCFP(Helium-cooled Flat Plate) divertor

3-D Model Geometry and Crack
Location
Symmetry planes
Crack Face

Finite Element Mesh
Crack Face
Nodes . . . . . . . . . . . 553787
Elements. . . . . . . . . 387972

Temperature Distributions Simulated Using ARIES
Design Loads with Simplified Convection Cooling
q”=11 MW/m2
q’’’=17.5 MW/m3
P=10 MPa
Tcoolant=600 ᵒC
Max. Tarmor= 2000 ᵒC
Max. Tstructure=1310 ᵒC
Min. Tstructure=725 ᵒC
oC

Structural Boundary Conditions Adjusted
to Not Over-Constrain Model
Planar rotations in x and z
direction simulate panel bow
Surfaces must remain
planar but may rotate
Free surface displacements
X-displacement Z-displacement
x z

Stresses in Uncracked
Structure
MPa MPa
X-Direction Stresses Z-Direction Stresses
z x
• X stresses are similar to 2-D model results
• Z stresses are ~ 100 MPa near crack vs highly compressive for plane
strain and zero for plane stress 2-D assumptions

2c
a
Stress Intensities for 3-D Models
Significantly Lower then 2-D Results
0
2
4
6
8
10
12
14
16
0 0.1 0.2 0.3 0.4 0.5 0.6
Str
ess
In
ten
sity
(M
Pa-m
1/2)
Crack Depth (mm)
c/a=2
c/a=6
c/a=10
0
5
10
15
20
25
30
35
0 0.1 0.2 0.3 0.4 0.5 0.6
Str
ess
in
ten
sity
(M
Pa-m
1/2)
Crack Depth (mm)
Plane strain
Plain Stress
2-D Stress Intensities

Conclusions
As expected, 3-D results indicate lower
stress intensity factors due to finite crack
length and more realistic stresses
We still have to do some convergence
studies to verify the results

Ferromagnetic Loads in Tokamaks
Ferritic steels structures will experience
magnetic loads in tokamaks
Previous work focused on static fields
There has been very little work since
Questions remain regarding transient
fields
References
H. Attaya, G.L. Kulcinski, and W.G. Wolfer, “Analysis of Forces on Ferromagnetic Components Used in Magnetic Fusion Reactors,” J Nuc Mat, 122&123 (1984) 96
T. A. Lechtenberg and C. F. Dahms, “Magnetically-Induced Forces on a Ferromagnetic HT-9 First Wall/Blanket Module,” J Nuc Mat 122&123 (1984) 140
L.R. Turner, “Electromagnetic Computations for Fusion Devices,” COMPUMAG-Tokyo Conference, 1989

Ferromagnetic Effects
Toroidal field ripple is reduced
Forces in the presence of field gradients
Temperature gradients can be an issue
due to the temperature dependence of
saturation magnetization

Starfire
ANSYS Capabilities
Field ripple effects (ferromagnetic inserts)
Forces

ITER-Like Magnetic Analysis
Coil modeled with SOURC36 Elements
6 elements
Coil modeled with SOLID96 Elements
1207 elements
13 m
r=6.5 m
r=1.7 m
Coil
0.65m x 0.65m cross-section
Current: 9.13 MA
• First modeling strategy use SOLID96 tetrahedral elements connected with the
3-D tetrahedral mesh. Current density is solved for in first load step.
• Second strategy used SOURC36 primitive used to supply current source data
to magnetic field problems. Identical simplified coil D-shape geometry created
with only 6 elements not connected to rest of mesh.
Small break for load
and b.c application

Methods Produce Nearly Identical Results
Magnetic Flux Density (B)
Results using SOLID96 Elements Results using SOURC36 Elements
ITER Field Specifications
Max Field in coils – 11.8 T
Field at r = 6.2m – 5.3 T
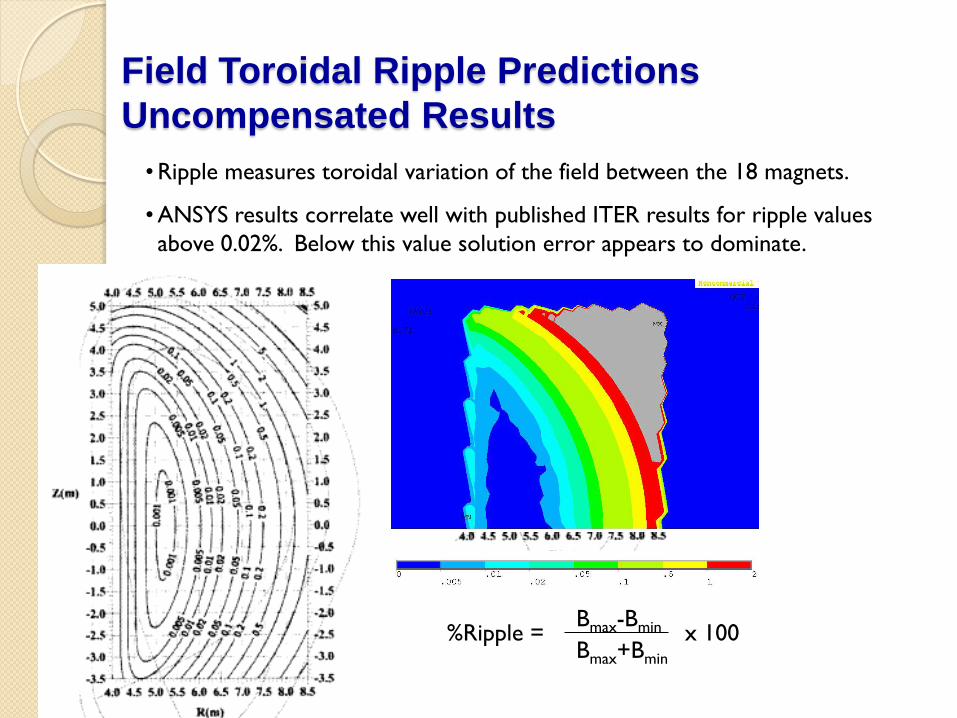
Field Toroidal Ripple Predictions
Uncompensated Results
• Ripple measures toroidal variation of the field between the 18 magnets.
• ANSYS results correlate well with published ITER results for ripple values
above 0.02%. Below this value solution error appears to dominate.
%Ripple = x 100 Bmax-Bmin
Bmax+Bmin

Field Toroidal Ripple Predictions
Ripple Reduced using Ferromagnetic Inserts
%Ripple = x 100 Bmax-Bmin
Bmax+Bmin
• Simplified representation of ferromagnetic inserts reduces ripple to similar
proportions as the optimized ITER design.

Magnetic Forces on the Ferromagnetic Inserts
• Inwall shield blocks are typically 0.4m x 0.3m. The ferromagnetic shield blocks
will be subject to magnetic forces from the field coils.
• The published maximum forces due to magnetization acting on a ferromagnetic
insert block are 18.2 kN in the poloidal direction and 7.1 kN in the outward
direction normal to the block surface.
• Forces calculated by ANSYS are significantly higher.
Block 1
Block 2
Block 3
Block 4
Block 5
Block 1 Block 2 Block 3
Fx (kN) -94.9 -18.1 68.2
Fy (kN) 59.9 -111.1 0.0
Fz (kN) -19.0 6.4 36.3
Fsum (kN) 113.8 112.7 77.2
ANSYS Magnetic Force Results
Due to symmetry, forces in Blocks 4 and 5 are
equivalent to forces in 2 and 1

Variation of Magnetic Force with Coil Current
0.00E+00
2.00E+04
4.00E+04
6.00E+04
8.00E+04
1.00E+05
1.20E+05
0 20 40 60 80 100
% Coil Current
To
tal M
ag
neti
c F
orce (
N)
Block1
Block2
Block3
B-H Curve for SS430 Total Magnetic Force on
Blocks vs Coil Current
• B-H curve for SS430 used in ANSYS analyses is highly nonlinear shows
saturation around 1.5T
• Magnetic forces vary nearly linearly with coil current (and magnetic field)

Magnetic Flux Density (B) in
Ferromagnetic Inserts

Conclusions
Ferromagnetic loads are generally found
to be non-negligible, but manageable
We can do ferromagnetic calculations
with ANSYS, though more benchmarks
would be required
This includes ripple and force calculations
We have not tried transient calculations