update of market assessment for capturing water conservation
TRANSCRIPT

PNNL-15320
Update of Market Assessment for Capturing Water Conservation Opportunities in the Federal Sector
K L McMordie Stoughton A E Solana D B Elliott G P Sullivan G B Parker
August 2005
Prepared for the US Department of Energy Federal Energy Management Program under Contract DE-AC05-76RL01830
DISCLAIMER
This report was prepared as an account of work sponsored by an agency of the United States Government Neither the United States Government nor any agency thereof nor Battelle Memorial Institute nor any of their employees makes any warranty express or implied or assumes any legal liability or responsibility for the accuracy completeness or usefulness of any information apparatus product or process disclosed or represents that its use would not infringe privately owned rights Reference herein to any specific commercial product process or service by trade name trademark manufacturer or otherwise does not necessarily constitute or imply its endorsement recommendation or favoring by the United States Government or any agency thereof or Battelle Memorial Institute The views and opinions of authors expressed herein do not necessarily state or reflect those of the United States Government or any agency thereof
PACIFIC NORTHWEST NATIONAL LABORATORY operated by BATTELLE
for the UNITED STATES DEPARTMENT OF ENERGY
under Contract DE-AC05-76RL01830
Printed in the United States of America
Available to DOE and DOE contractors from the Office of Scientific and Technical Information
PO Box 62 Oak Ridge TN 37831-0062ph (865) 576-8401 fax (865) 576-5728
email reportsadonisostigov
Available to the public from the National Technical Information Service US Department of Commerce 5285 Port Royal Rd Springfield VA 22161
ph (800) 553-6847 fax (703) 605-6900
email ordersntisfedworldgov online ordering httpwwwntisgovorderinghtm
This document was printed on recycled paper (800)
Update of Market Assessment for Capturing Water Conservation Opportunities in the Federal Sector
K L McMordie Stoughton A E Solana D B Elliott G P Sullivan G B Parker
August 2005
Prepared for the US Department of Energy Federal Energy Management Program under Contract DE-AC05-76RL01830
Pacific Northwest National Laboratory Richland Washington 99352
Summary
The Department of Energyrsquos (DOE) Federal Energy Management Program (FEMP) requested an update of the original market assessment done by Pacific Northwest National Laboratory (PNNL) in 2001 [Parker etal 2001] This original analysis evaluated water conservation opportunities and answered key questions necessary for FEMP to make recommendations on whether or not to proceed with strategies for water conservation primarily through the development of water conservation Energy Savings Performance Contracts The updatersquos intent is to reevaluate the cost-effective water savings potential in the Federal sector which incorporates new technologies and recent available data on Federal water use and also to make recommendations on strategies that will assist FEMP in developing a path forward to assist Federal agencies in effective water management
This updated assessment is based on a new analytical approach that utilizes newly available data and technologies The new approach fine-tunes the original assessment by using actual Federal water use which is now tracked by DOE (as compared to using estimated water use) Federal building inventory data is also used to disseminate water use by end-use technology in the Federal sector In addition this analysis also examines the current issues and obstacles that face performance contracting of water efficiency projects at Federal sites
A summary table of the cost-effective savings potential results of this updated evaluation is found below in Table S1 The following bullets are key findings and recommendations
Key Findings
bull The total life-cycle cost-effective water conservation potential today in the Federal sector assuming 100 penetration of efficient technology based on appropriate ldquooff the shelfrdquo1 domestic water technologies is estimated to be between 35 and 50 billion gallonsyear This represents approximately 17 to 24 of the total Federal water use The original analysis estimated this savings to be between 33 and 49 billion gallons annually or between 27 and 40 of the total Federal water use2
1 ldquoOff the shelfrdquo technologies analyzed in this assessment are toilets urinals faucets showerheads and clothes washers ndash these technologies are considered domestic water technologies (used by humans for sanitary purposes) easily purchased and installed and are non-engineered Engineered retrofit technologies (eg for process water use cooling towers steam systems and leak detection) are not analyzed in this assessment because of their site specific nature Please see Section 3 and Appendix E for a detailed description of these technologies 2 The large discrepancy between the percentage savings between the original and updated assessment is a result of the following 1) the original assessment used an underestimated Federal water use while the updated assessment uses actual Federal water use as reported by Federal agencies to the Department of Energy 2) the original assessment overestimated the percentage of water consumed by off-the-shelf fixtures while updated assessment revised these assumptions that resulted in more accurate estimates (See Section 1 for more information)
iii
bull A number of new ldquooff the shelfrdquo technologies have emerged on the market since the original assessment These include dual flush toilets 10 gallon per flush toilets 05 gallon per flush urinals hydro-powered sensored faucets and solar-powered sensored faucets These technologies were analyzed in this updated assessment For more information on each technology go to Section 3
bull Half of the total Federal water use is consumed by these ldquooff the shelfrdquo fixtures ndash or domestic water consuming equipment The remaining water consumption is used by engineered process water using equipment such as cooling towers steam systems and irrigation Typically these process oriented technologies are very site specific in nature therefore savings have a wide variance among sites These engineered technologies are not analyzed in this report but should not be discounted as large water savings opportunities in the Federal sector
bull Energy savings potential from reduction in hot water use in showers and faucets is estimated to be in the range of 602 to 1550 billion British thermal units (Btus)
bull If all these savings were captured under todayrsquos rates for water and energy savings the dollar savings potential would be between $166 and $236 million annually
bull The majority of the water conservation technology retrofits (domestic water fixtures) analyzed in this assessment are found to be life-cycle cost-effective at a combined marginal1 watersewer cost of about $41000 gallons or greater The measures that are not cost-effective at this rate are certain faucet and toilet options but only under certain scenarios ndash please see all results of the life-cycle cost (LCC) analysis in Section 4 in Tables 43 through 46
bull The energy savings from the hot-water-using fixtures (showers and faucets) drives the life-cycle cost-effectiveness such that in many cases water savings are not even necessary to render the retrofit cost-effective
bull Based on the draft fiscal year 2003 Report on Federal Agency Activities Under Executive Order 13123 little progress has been made towards the Executive Order 13123 water efficiency goals by Federal agencies Out of the 49000 Federal sites less than 4 have reported developing water management plans and less than 3 have reported implementing the required four FEMP Water Efficiency Best Management Practices2
1 Marginal cost of water and sewer is the volumetric charge for water and sewer only (typically expressed as cost per thousand gallons) and does not include fixed or flat charges such as meter charges or taxes 2 Information obtained from draft report US Department of Energy 2005 Report on Federal Agency Activities Under Executive Order 13123 Efficiency Energy Management Fiscal Year 2003 Draft Office of Energy Efficiency and Renewable Energy Washington DC
iv
bull Since 2000 total water use in the Federal government has decreased almost 5 [US DOE 2005] It is unclear whether this decrease in water use is the result of efficiency improvements reporting methodology or changes in staffing or building inventory Water is tracked by the Department of Energy in total million gallons consumed annually as reported by each Federal agency Because water is not tracked on a per unit basis like energy (on a Btu per square foot basis) it is difficult to truly measure how well the Federal government is performing in terms of water efficiency improvements It would be a better indicator of water consumption trends or metrics if water consumption were tracked ideally by population or building occupancy or more realistically by square footage rather than total gallons consumed
bull Although a considerable number of energy savings performance contract (ESPC) projects at Federal installations now include water conservation measures many opportunities for cost-effective water savings - particularly opportunities in engineered projects - are not being captured This is because most of the water projects are undertaken by water service providers through subcontracts to the energy service companies (ESCOs) and are focused on standard water-savings technology retrofits
bull The current industry standards for measurement and verification (MampV) for water measures as part of an ESPC were researched For basic water consuming fixtures (such as toilets urinals showers and faucets) water savings are typically stipulated where savings are determined based on calculated pre- and post-retrofit water consumption agreed to by the facility For water processes such as a cooling tower or single-pass cooling equipment MampV is typically based on short term pre- and post-retrofit field measurement of the specific equipment These are reasonable approaches to MampV for water efficiency retrofits given the dearth of building-level water meters and confidence and experience in technology performance
bull The institutional barriers and cost structure created by using water services as subcontractors to a performance contract tends to stifle innovation reduces the cost-effectiveness of some technologies minimizes the number of engineered projects and slows down the implementation process This results in considerable savings not captured A standalone water technology-specific performance contracting would virtually eliminate all of these issues and result in more cost-effective water and associated energy savings for the Federal sector
v
Table S1 Summary Results of the Range1 of Total Federal Annual Cost-Effective Savings
Federal Sector
Low End Water
Savings (million
gallonsyr)
High End Water
Savings (million
gallonsyr)
Low End Energy Savings (million Btuyr)
High End Energy Savings (million Btuyr)
Low End Total Cost Savings
($millionyr)
High End Total Cost Savings
($millionyr)
DoD 27595 37895 346495 1000549 $12328 $17093 Civilian Agencies 7796 12347 255174 549578 $4231 $6535 Grand Total 35391 50242 601669 1550128 $16559 $23628
Key Recommendations
The following are key recommendations uncovered during this analysis that will provide FEMP direction on developing an effective water program to help Federal agencies manage water resources more effectively
FEMP should
bull Reevaluate the water efficiency policies that are set in the Executive Order (EO) 13123 It is currently unclear whether the existing EO water efficiency goals are effectively motivating Federal sites to implement water savings measures and is properly tracking water consumption in the Federal sector These polices are expected to be reviewed in FY 2005 as stated in FEMPrsquos water efficiency website ldquoThe Department of Energy will review agencies progress in 2005 and may revise the water efficiency improvement goal at that timerdquo (httpwwweereenergygovfemptechnologieswater_goalscfm)
bull Update and revise water efficiency related documents and resources that are have become out of date these include website materials the section titled ldquoMampV for Water Projectsrdquo in the FEMPrsquos MampV Guidelines Measurement and Verification for Federal Energy Management Projects and energywater cost calculator for water consuming fixtures among other water related documents (httpwwweereenergygovfemptechnologieswater_efficiencycfm)
bull Consider partnering with other Federal agencies such as Environmental Protection Agency General Services Administration and Department of Defense to develop a broad and effective water efficiency program for Federal agencies FEMP could potentially act as the technical support arm of this partnership providing technical information such as ldquofact sheetsrdquo case studies and technical bulletins particularly
1 The savings presented in Table S1 represent a range of efficient technologies and penetration of these technologies in the Federal sector Find detailed information on the analysis in Section 4 and 5
vi
relevant to the Federal sector In addition this partnership could draw on and develop the link between energy and water efficiency to further raise FEMPrsquos visibility in a comprehensive program of water resource management
bull Consider developing a standalone water technology-specific performance contract as a solution to many of the barriers that are currently faced by the Federal sites implementing water efficiency projects Allowing water service companies to work directly with Federal customers as part of a performance contract would result in reduced costs and enhance innovation of water efficiency measures allowing more cost-effective water and energy savings
bull Provide support for and encourage the use of specific MampV plans for water measures in ESPCs Water efficiency measures have unique characteristics (compared to energy measures) and therefore require different verification methods The water service contractor performing the work should be engaged in this process by the ESCO With this approach the water services contractor will also share with the ESCO the responsibility for the savings guarantee
bull Consider developing a detailed examination of current Department of Defense (DoD) water and sewer rates This could provide important insight to cost-effectiveness of water efficiency projects for DoD sites that generate water on site Normally these sites undervalue water which makes producing cost-effective water projects difficult Ancillary savings such as energy operations and maintenance and chemical savings will most likely be the drivers for cost-effectiveness at these sites
bull Develop a component of the program focused on engineered-solutions to water efficiency These would target large water-using activities and may include demonstrations of technologies focused on leak detection steam systems cooling towers and irrigation systems Successful demonstrations would serve as case study material for further promotion across the Federal sector
vii
viii
Acknowledgements
The authors of this report would like to acknowledge the following people for their assistance in making this project possible Thanks to Joan Glickman of the Federal Energy Management Program for providing oversight for the analysis Thanks also to Bill Sandusky of Pacific Northwest National Laboratory for managerial oversight In addition thanks are warranted to a variety of industry experts too many to name for providing information and data that supported the analysis Lastly thanks goes to Sue Arey of Pacific Northwest National Laboratory for editorial review
ix
x
Contents
Summary iii
Acknowledgements ix
10 Introduction 11
20 Federal Legislation Rulings Interpretations and Action Toward Water Conservation Goals 21
21 Water Efficiency Goal Executive Order Update 21
22 Alternative Financing for Water Efficiency Projects 22
30 Appropriate Water Conservation Technologies Savings and Applications 31
31 Assessment Data 31
32 ldquoOff the Shelfrdquo Technologies 31
321 Toilets 32
322 Urinals 34
323 Showerheads 36
324 Faucets 37
325 Clothes Washers 310
33 Engineered Site-Specific Water Consuming Processes 311
40 Cost-Effectiveness of Implementing Water Conservation 41
41 Introduction to Life-Cycle Cost Analysis Methodology 41
42 Federal WaterSewer Rates 42
43 Federal Energy Rates 43
44 Life-Cycle Cost Analysis Results 44
50 Cost-Effective Savings Potential in the Federal Sector 51
xi
51 Water Consumption Estimates in the Federal Sector 51
52 Energy Consumption Estimates in the Federal Sector 53
54 Cost-Effective Savings Potential Results 54
60 Needs and Recommended Requirements for Successful Performance Contracting 61
61 Project Design 61
62 Project Implementation 63
63 Savings Verification 63
70 References 71
Appendix A ndash Federal Inventory Data to Estimate Federal Water Use by Building Types A1
Appendix B ndash Federal Water Use Estimate Assumptions B1
Appendix C ndash Building Characteristics and Use Profile for Life-cycle Cost Analysis C1
Appendix D ndash Methodology Used to Estimate Federal Energy Use D1
Appendix E ndash Conservation Opportunities with Site Specific Water Process E1
E1 Cooling Towers E1
E2 Boiler and Steam Systems E1
E3 Efficient Irrigation E2
E4 Ozonated Laundry E4
E5 Leak Detection and Repair E4
E6 Single-Pass Cooling E5
Appendix F ndash Water and Sewer Rate Historical Rate Data at DoD Sites F1
xii
Figures
Figure A1 Breakout of DoD Square Footage by Building Category A2
Figure A2 Breakout of Civilian Square Footage by Building Category A2
Figure A3 Breakout of DoD Daily Water Use by Building Category A3
Figure A4 Breakout of Civilian Daily Water Use by Building Category A4
xiii
Tables
Table S1 Summary Results of the Range of Federal Total Cost-Effective Savings vi
Table 31 Toilet Data Used in the Analysis 34
Table 32 Urinal Data Used in the Analysis 36
Table 33 Showerhead Data Used in the Analysis 37
Table 34 Faucet Data Used in the Analysis 39
Table 35 Clothes Washer Data Used in the Analysis 311
Table 41 Mean DoD and Civilian Marginal Water Rates 43
Table 42 Base Year Energy Rate for LCC Analysis 44
Table 43 Toilet and Urinal LCC Analysis Results 46
Table 44 Showerhead LCC Analysis Results 46
Table 45 Faucet LCC Analysis Results 47
Table 46 Clothes Washer LCC Analysis Results 48
Table 51 Total Water Use and Cost in the Federal Government 51
Table 52 Estimate Water Use for Off the Shelf Technologies in the Federal Government 52
Table 53 Estimated Energy Requirements for Domestic Hot Water in the Federal Sector 54
Table 54 LCC Effective Fixtures Used to Estimate Savings Potential 55
Table 55 Penetration Rates of Efficient Fixtures in the Federal Government 56
Table 56 Total Cost-Effective Range of Savings in the Federal Government 57
Table B1 Federal Water Use Indices used in the Analysis B1
Table B2 Occupancy Densities for Building Categories B3
xiv
Table B3 Building Occupancy Hours B4
Table B4 Penetration Rates of Efficient Fixtures in the Federal Government B8
Table C1 Building Characteristics Office and Barracks C1
Table C2 Fixture Count for Office and Barracks C2
Table C3 Water Use Pattern C2
Table D1 FEDS Building Types Used to Represent Federal Building Types D2
Table D2a Percent of Fuel Use for Water Heating by Building Type used in the Analysis D3
Table D2b Percent of Fuel Use for Water Heating by Building Type from CBECS AEO D3
Table F1 FORSCOM Average Water and Sewer Rates F1
xv
xvi
10 Introduction
In March 2001 Pacific Northwest National Laboratory (PNNL) performed a market assessment for the Federal Energy Management Program (FEMP) titled Market Assessment for Capturing Water Conservation Opportunities in the Federal Sector [Parker et al 2001] This assessment provided information to FEMP on whether there was a demand for a technology-specific water conservation performance contract Specifically the report identified the critical needs requirements and factors affecting successful implementation via an ESPC-type contract Also the analysis estimated the life-cycle cost-effectiveness of water-efficient technologies and also estimated the cost-effective potential for water savings in the Federal sector for domestic related water technologies (water consumed by humans for sanitary purposes) that are ldquooff the shelfrdquo fixtures (toilets urinals showerheads faucets and clothes washers)
FEMP requested that PNNL update this original assessment to reevaluate the cost-effective water savings potential in the Federal sector and the life-cycle cost-effectiveness of domestic fixtures The original analysis findings show that the life-cycle cost-effective water conservation potential in the Federal sector based on appropriate off the shelf technologies was estimated to be 33 to 49 billion gallons annually or between 27 and 40 of the total Federal water use The findings of this update show a potential Federal water savings of off the shelf technologies to range between 35 and 50 billion gallons annually or between 17 and 24 of the total Federal water use
The range in gallons saved is nearly the same between the original and updated analysis while the percent savings is quite different This is because the Federal water consumption used in the original analysis was significantly underestimated while the percentage of water used by the ldquooff the shelfrdquo water technologies was overestimated The original assessment used estimated Federal water use of about 122 billion gallons annually [Lombardo Associates 1997] while this assessment uses actual data on agency water use reported to the Department of Energy for fiscal year 2003 209 billion gallons annually [US DOE 2005] Savings calculations in the original assessment assumed that 80 of total water use was consumed by domestic fixtures while the updated assessment estimates this to be 51 based on the revised analysis (as described in Section 5)
The cost savings potential of the original analysis was estimated to be $132 to $196 million annually (if all savings were captured at the time of the original analysis at the average Federal watersewer cost of $41000 gallons) This represents water cost savings only (energy cost savings was not included in the original assessment) For the updated analysis a water cost savings between $152 and $216 million annually is estimated using an average combined watersewer cost for DoD and civilian agencies of $4251000 gallons and $4471000 gallons
11
respectively For the updated assessment the energy cost savings is estimated to range from $13 to $20 million For a complete description of these savings and costs see Sections 4 and 5
This updated assessment is based on a new analytical approach that utilizes newly available data and technologies This new approach fine-tunes the original assessment by estimating total water use by end-use technology in the Federal sector The assessment also analyzes two different settings office and barracks to determine the life-cycle cost-effectiveness of various technologies Office and barracks have different water use patterns for domestic fixtures therefore will have different life-cycle cost results
The differences between the original and updated analyses are as follows
bull New types of ldquooff the shelfrdquo equipment have emerged on the market since the original assessment which are included in this analysis
bull New price information is obtained for all technologies
bull Energy savings is included in the update and not incorporated into the original
bull Updated and more specific penetration rates of efficient technology in the Federal sector are used for this update
bull Annual water consumption data was obtained from the Department of Energy (DOE) The original analysis used an estimate of Federal water consumption
bull This updated assessment uses a new analytical approach that segregates water use between DoD and civilian agencies based on Federal inventory data and also further breaks water use down by end-use The original analysis did not break out water use to this level of detail
bull An updated Federal discount rate was used
12
20 Federal Legislation Rulings Interpretations and Action Toward Water Conservation Goals
21 Water Efficiency Goal Executive Order Overview
Executive Order 13123 encourages Federal agencies to reduce costs and implement cost-effective water efficiency improvements at Federal facilities [Executive Order 13123 1999] The Department of Energy provided guidance to assist each agency to determine a baseline water consumption for FY 2000 track water consumption by Federal agency and establish water conservation goals for Federal agencies as required by the EO The water conservation goal is not a numerical reduction but rather the development of a water management plan and implementation of at least four of the FEMP Water Efficiency Improvement Best Management Practices (BMPs) [FEMP Website 2005] The BMPs represent typical areas within the Federal government appropriate for efficiency improvements The ten BMPs are as follows
1 Public Information and Education
2 Distribution System Audits Leak Detection and Repair
3 Water Efficient Landscape
4 Toilets and Urinals
5 Faucets and Showerheads
6 BoilerSteam Systems
7 Single-Pass Cooling
8 Cooling Tower Systems
9 Miscellaneous High Water-Using Equipment
10 Water Reuse and Recycling
Find a full description of each BMP on the FEMP website at httpwwweereenergygovfemptechnologieswater_fedrequirecfm
As reported in the FY 2003 Report on Federal Agency Activities Under Executive Order 13123 the Federal government baseline water use (FY 2000) was 219114 million gallons As of FY 2003 the Federal government reported consuming 209055 million gallons This is an overall drop of 5 Because water is not tracked on a per unit basis like energy (Btu per square foot of building inventory) it is difficult to ascertain if this drop in water use is caused by efficiency improvements inventory or staffing changes
21
The draft FY 2003 Report on Federal Agency Activities Under Executive Order 13123 also reports there has been a total of 1669 water management plans developed and 1154 BMPs implemented at Federal sites 1 Progress towards the EO 13123 water efficiency goals has been very slight These numbers represent that only 34 of sites that are required to implement water management plans have done so and only 23 of the required BMPs have been implemented
22 Alternative Financing for Water Efficiency Projects
There are two main methods that Federal sites can utilize to obtain alternative financing for water projects ndash energy savings performance contracts (ESPCs) and utility energy service contracts (UESCs) UESCs can be used to implement water efficiency measures as part of the energy project These are typically contracted through an areawide agreement basic order agreement (BOA) or model agreement with the local servicing utility
There are two distinct types of ESPCs ndash the Department of Defense (DoD) ESPC and the DOE Super ESPC DoD services can achieve water efficiency goals by including water conservation projects as part of additional ESPC strategy offered through DoD Under DoD contracts the ESPC approach can and does include water (only) conservation projects Within its ESPC DoD also allows bundling of water conservation projects with energy conservation projects to achieve an overall payback that falls within ESPC contract parameters
Prior to October 2004 civilian agencies were not able to develop ESPC projects that were primarily driven by water conservation measures The DOE Super ESPC did not allow water efficiency projects because of a legal opinion rendered by the Assistant General Counsel for Procurement and Financial Assistance The opinion stated that water conservation projects can only be included in the DOE Super ESPC ldquohellip as long as the energy conservation or energy savings is the primary purpose of the contract reduction in costs attributable to water conservation may be included as part of energy savings for purposes of calculating the contractor payment where such water conservation savings are integral parts of the energy projectrdquo [Masterson 2000]2
However on October 28 2004 National Defense Authorization Act for Fiscal Year 2005 (Act) was signed into law extending the authority for Federal agencies to use the DOE Super ESPC contracts until September 30 2006 Included in this provision is language that now allows
1 Information obtained from draft report US Department of Energy 2005 Report on Federal Agency Activities Under Executive Order 13123 Efficiency Energy Management Fiscal Year 2003 Draft Office of Energy Efficiency and Renewable Energy Washington DC 2 Masterson MA Assistance General Counsel for Procurement and Financial Assistance US Department of Energy to James J Cavanagh Director Office of Headquarters Procurement Services February 11 2000
22
projects that are dominated by water conservation measures The Act establishes that water projects can be performed as a standalone project as stated in the Act ldquoa water conservation measure that improves the efficiency of water use is life-cycle cost-effective and involves water conservation water recycling or reuse more efficient treatment of waste water or storm water improvements in operation or maintenance efficiencies retrofit activities or other related activities not at a Federal hydroelectric facilityrdquo [httpwwweereenergygovfempnewseventsdetailcfmnews_id=8301]
It is fortunate and beneficial to have these contracts in place but many suggested improvements in the ESPC contracting approach could be made as detailed in Section 6
23
24
30 Appropriate Water Conservation Technologies Savings and Applications
This updatersquos intent includes reevaluation of ldquooff the shelfrdquo technologiesrsquo life-cycle cost-effectiveness The off the shelf technologies or domestic water consuming fixtures that are assessed are toilets urinals showerheads faucets and clothes washers The data used in the assessment for each fixture is described in this section
It should be noted that kitchen water use is not examined in the analysis including dishwashers1 and faucet use Kitchen faucet water use is very site specific difficult to estimate and is commonly ldquovolume drivenrdquo (used for filling pots) instead of flow rate driven There is significant opportunity for water and energy savings in kitchens from efficiency improvements in rinsing and dishwashing but this is not examined in this update
In addition engineered technologies applicable to water use such as cooling towers steam systems irrigation and leak detection may also present significant water savings opportunities in the Federal sector These technologies are generally site-specific and their application can result in significant cost-effective water savings However because of their site-specific nature the potential savings are not easily quantified and thus are not included in this determination of water saving potential in the Federal sector Thus the savings potential determined below is conservative significantly more water savings could be achieved by incorporating site-specificprocess-oriented technologies Please find information on these process water uses and efficiency improvements at the end of this section and in Appendix E
31 Assessment Data
The information provided below describes the technologies analyzed in this assessment and provides data that was used to calculate the life-cycle cost-effectiveness of the different fixture options This data includes
bull Fixture cost bull Installation cost bull Operation and maintenance (OampM) costs different from normal operations
Fixture cost data comes primarily from the General Services Administration (GSA) Advantage (found at wwwgsaadvantagegov) The GSA Advantage is a centralized on-line catalog of supplies by which Federal government facilities can purchase goods and services Included in the GSA Advantage are many of the plumbing fixtures analyzed in this assessment
1 Energy use for hot water use in dishwashers is estimated in this analysis The software tool utilized estimates hot water use for showers faucets dishwashers and clothes washers Go to Section 52 for a detailed explanation
31
When fixtures were not available on the GSA Advantage wholesale or bulk purchase prices were obtained directly from the manufacturer
Also included for each fixture is the estimated cost to install the piece of equipment Multiplying the time it takes to install the equipment by the hourly rate for a plumber results in the installation cost A typical plumberrsquos hourly rate is $43 which is obtained from RS Means Residential Cost Data for 2003 [Reed Construction Data 2004] The installation time was obtained by inquiring two different sources on typical installation times of these fixtures1
Operations and maintenance costs were also researched for each type of fixture For the majority of the fixtures there are no significant differences in the operations and maintenance The only exception to this is with battery-powered sensored faucets which require periodic battery changes
32 ldquoOff the Shelfrdquo Technologies
The following section describes each off the shelf technology that is analyzed in this assessment General information is provided on the standard technology available on the market high efficiency versions fixture cost installation cost and operation and maintenance information
321 Toilets
Toilets are typically the largest water consumer of indoor water use at most facilities [Vickers 2001] The Energy Policy Act (EPAct) of 1992 mandated that all toilets meet or exceed the standard of 16 gallons per flush (gpf) Technologies have since emerged on the market that have lower flush rates than this EPAct requirement and are also examined in this analysis
The basic types of toilets available on the market are tank toilets typical in residential and light commercial applications and flush valve toilets typically found in commercial applications An option for increasing efficiency of an existing toilet at a lower cost is a flush valve retrofit kit This entails replacing the older valve with a high efficiency valve (not replacing the entire plumbing of the unit) and replacing the toilet bowl This option is available on the GSA Advantage
Another style of toilet on the market is a pressure-assisted toilet which contains a chamber inside of the toilet tank that traps air Once the chamber begins to fill with water the trapped air becomes compressed stored as ldquopotential energyrdquo When the toilet is flushed the compressed air pushes out the water at a very high velocity providing a powerful flush and very good
1 Obtained information on installation time from personal communications with Mr Andrew Perrin Water Engineer of H2O Applied Technologies in January and February 2005 and Mr Lonnie Burke Water Conservation Specialist and Master Plumber with Resource Wise on January 13 2005
32
flushing performance This high velocity water in pressure-assisted toilets creates a louder flush than traditional tank toilets They may not be suitable for residential settings but are acceptable for commercial buildings and barracks A 10 gpf pressure-assisted toilet is now available on the market
In addition there is a relatively new type of tank toilet called a dual flush toilet This toilet provides two flushing options a full flush at 16 gpf and a partial flush option which ranges from 08 gpf to 10 gpf depending on the brand There are two brands that were analyzed Caromatrade and Mansfield EcoQuantumtrade The results from the analysis for these two toilets are averaged It should be noted that the dual flush toilet in this analysis is only analyzed for womenrsquos use Dual flush toilets would not be practical in a menrsquos restroom because in the Federal setting men typically use urinals
Table 31 summarizes the toilets that were studied in the analysis along with the cost information used in the life-cycle cost analysis presented in Section 4 of this document For installation costs it typically takes about 1 hour to install any type of toilet totaling $43 per installation [Reed Construction Data 2004] Also there are no major differences in operations and maintenance between these efficient toilets compared with older toilets1 For existing flush rates of toilets this analysis considers 35 gallons per flush typical This is because in 1980 all toilets were required not to exceed 35 gallons per flush Because toilets have on average about a 20-year life1 it is assumed that most toilets have been retrofitted at least once since 1980 This assumption is considered conservative
1 Obtained information on maintenance costs and typical toilet life through personal communications with Mr Lonnie Burke Water Conservation Specialist and Master Plumber with Resource Wise on January 13 2005
33
Table 31 Toilet Data Used in the Analysis
Toilet Type Flush Rate (gpf)
Water Savings Potential per
use Fixture Cost Cost Data Source
Gravity Fed Tank 16 54 $225 Average of typical price from GSA Advantage
Pressure-Assist 16 54 $265 Average of typical price from GSA Advantage
Pressure-Assist 10 71 $300 Wholesale price from manufacturer [Mansfield 2005]
Flush Valve 16 54 $180 Average of typical price from GSA Advantage
Flush Valve Retrofit Kit 16 54 $127
Average of typical price from GSA Advantage (includes cost of bowl)
Dual Flush
Range 12 ndash 14 (average use) [Koeller
2003 and Veritec 2002]
60 - 64 $200 - $246
Wholesale price from manufacturers1
[Mansfield 2005]
322 Urinals
Urinals are typically only used in commercial applications Similar to toilets all current urinals must meet the EPAct 1992 standards of not exceeding 10 gpf There are two basic types of urinals flush valve toilets and no-water urinals ndashurinals that do not have a flushing system and therefore use no water For flush valve urinals there are 10 gpf and 05 gpf models on the market The 05 gpf flush is relatively new The no-water urinal was analyzed in the original market assessment however there are new brands that are now available and are considered in this analysis
1 Obtained typical cost range for Caroma dual flush toilet through personal communications with Mr John Karas Business Development Manager of Caroma USA Inc on January 18 2005
34
The no-water urinal is distinctly different from the flush valve urinal As the name implies no-water urinals do not use water for flushing These urinals use a trap in the drain that contains a sealing liquid that is less dense than urine This liquid floats on top of any urine in the trap sealing the trap and preventing sewer vapors from escaping back into the restroom Urine passes through the sealing liquid in the trap and into the drain line
There are currently three major models of the no-water urinals on the market available to the Federal government the Falcon Waterfreetrade urinal the Waterless No-Flushtrade urinal and from a European company the Uridanreg Non-Water Urinal No-water urinals come in different sizes and styles made with high-tech composites and fiberglass or traditional porcelain The Waterfree and Waterless urinals have removable traps while the Uridan uses a permanent trap
For this analysis maintenance of no-water urinals was investigated through a variety of sources because maintenance costs are different than flush valve urinals1 [Uridan 2005 Waterless 2005 McMordie Stoughton and Chvala 2004] No-water urinals have no valves to repair or replace but do have other routine maintenance tasks The sealant must be replaced in all no-water brands For the Waterless and Falcon Waterfree urinals traps need to be periodically replaced There are other maintenance differences that are very hard to quantify Some evidence points to maintenance savings with no-water urinals because there is a decrease in sewer line calcification Other evidence points to the opposite that no-water urinals can possibly cause line stoppage So after careful consideration and research operation and maintenance costs of urinals is not considered in the analysis because reliable data on cost differences between flush urinals and no-water urinals was not obtained
Installation time for replacing a flush valve urinal is typically about 1 hour2 No-water urinals can take longer because some adjustments are necessary to get the urinal to mount on the wall properly Therefore an installation time of 15 hours was used in the analysis2 For existing flush rates of urinals 15 gallons per flush is considered typical for this analysis as a conservative assumption This is because in 1980 all urinals were required not to exceed 15 gallons per flush Because urinals like toilets have on average about a 20 year life3 it is assumed that most urinals have been retrofitted since 1980
The table below summarizes the data on urinals that was used in the analysis
1 Obtained information on maintenance of flush urinals and no-water urinals through personal communications with three sources Mr Lonnie Burke Water Conservation Specialist and Master Plumber with Resource Wise on January 13 2005 Mr Bill Slaughter Federal Account Representative with Falcon Water Free Urinals on January 12 2005 and Mr Joe Romero with Uridan-USA Division of GDK International Inc on January 28 2005 2 Obtained information on installation time for flush urinals and no-water urinals from Mr Bill Slaughter Federal Account Representative with Falcon Water Free Urinals on January 12 2005 3 Obtained information on typical urinal life through personal communications with Mr Lonnie Burke Water Conservation Specialist and Master Plumber with Resource Wise on January 13 2005
35
Table 32 Urinal Data Used in the Analysis
Urinal TypeBrand
Flush Rate (gpf)
Water Savings Potential per
use
Estimated Cost per Fixture
Cost Data Source
Flush Valve 10 33 $125
Average of typical price from GSA Advantage
Flush Valve 05 67 $125
Average of typical price from GSA Advantage
Falcon Waterfree 0 100 $186 - $235
GSA Advantage GS-07F-0294L
Uridan 0 100 $395 Wholesale price from manufacturer1
Waterless 0 100 $393 - $429
GSA Advantage GS-O7F-0124J
323 Showerheads
Showers are typically used in Federal facilities in housing barracks hospitals and prisons The current maximum flow rate for showerheads set by EPAct is 25 gallons per minute (gpm) at a pressure of 80 pounds per square inch (psi) There are showerheads that go below this flow rate However for this analysis the two types of showerheads analyzed are 25 gpm and 20 gpm (Find information on energy use for showerheads in Section 4)
1 Obtained information on typical Uridan costs from Mr Joe Romero with Uridan-USA Division of GDK International Inc on January 28 2005
36
Installation time for replacing a typical showerhead is considered to be about 15 minutes1 There are no major operation and maintenance differences between the efficient fixtures and existing fixtures The typical existing flow rate of showerheads was estimated to be approximately 275 gallons per minute for the purposes of this analysis This is based on water audits performed [Solana and McMordie 2004 Chvala et al 2004] 2 and the Handbook of Water Conservation [Vickers 2001] Information that was used in the analysis for showerheads is in the table below
Table 33 Showerhead Data Used in the Analysis
Showerhead Flow Rate (gpm)
Savings Potential per
use
Estimated Cost per Fixture
Cost Data Source
Standard EPAct Low
Flow Showerhead
25 9 $11
Average of typical price from GSA Advantage
High Efficiency
Showerhead 20 24 $11
Average of typical price from GSA Advantage
324 Faucets
Faucets are required to have a flow rate that does not exceed 22 gpm (at 60 psi) under the EPAct requirements High efficiency faucets range from about 10 gpm to 05 gpm both of which are considered in the assessment Faucets that were analyzed for this report are for domestic use only hand washing after restroom use and general hygiene (face washing and teeth brushing) Kitchen use was not analyzed The types of faucets evaluated in this analysis are described below
1 Obtained information on showerhead installation time from Mr Andrew Perrin Water Engineer with H2O Applied Technologies on January and February of 2005 2 Also Chvala WD GP Sullivan and KL McMordie 2004 Water Management Plan for Pacific Northwest National Laboratory PNNL-Letter Report Pacific Northwest National Laboratory Richland Washington (not publicly available)
37
bull Low flow faucet aerator Retrofit of an existing faucet with a low flow faucet aerator An EPAct standard aerator (22 gpm) and a high efficiency aerator (10 gpm) were analyzed
bull Pedal activated faucet Retrofit to an existing faucet that allows the faucet to be turned on and off with a foot pedal This was analyzed for the standard (22 gpm) and high efficiency aerators (10 gpm) because this is a retrofit of an existing faucet not a replacement of the entire unit
bull Self closing faucet Replacement of an existing faucet with a faucet that automatically shuts off after valve is compressed Both single and double self closing faucets were analyzed It was found that typically self closing faucets come at the EPAct standard flow rate of 22 gpm
bull Sensored faucet Replacement of an existing faucet with a faucet that is operated by a sensor ndash either electronic or infrared ndash that turns on and off automatically when a person approaches the faucet A battery-operated and hard-wired version of this faucet was included in the analysis It was found that sensored faucets typically are standard at 05 gpm
bull Hydro-powered sensored faucet Replacement of an existing faucet with a sensored faucet that is operated by a battery that is charged by a hydro-powered generator The battery is charged from each use ndash flowing supply water causes a turbine to spin that creates a current which is stored in the rechargeable battery The battery is charged in as little as five uses per day so it is considered applicable for most Federal applications This faucet comes standard at 11 gpm (Find more information at httpwwwtotousacomtotopagecontentviewasppageid=56ampshowimage=eco )
bull Solar- powered sensored faucet Replacement of an existing faucet by a sensored faucet that is powered by a small solar panel which turns any ambient light source into electricity (similar to the way a solar-powered calculator works) This electricity is used to operate an infrared sensor which automatically controls the faucet This faucet comes standard at 05 gpm
As described above both manual and automatic faucets were analyzed Because the water automatically shuts off with automatic and sensored faucets there is additional water and energy savings associated with reduced time the faucet is on The typical savings from these automatic faucets is about 20 compared to traditional manual faucets [USGBC 2003] This reduction was used in estimating the water and energy savings of the pedal activated self closing and sensored faucets Typically the operations and maintenance between the different types of faucets are similar The only faucet that was found to have additional maintenance requirements was the battery-operated sensor faucet because the battery must be replaced approximately every 2 years [Sloan Valve 2005] The increased annual maintenance cost of the battery-operated sensored faucet was estimated at $1119 (This is based on an estimated labor time of 10 minutes labor cost of $43hour and a battery cost of $15)
38
The typical existing flow rate of faucets was estimated to be approximately 275 gallons per minute for the purposes of this analysis This is based on water audits performed [Solana and McMordie 2004 Chvala et al 20041 and the Handbook of Water Conservation [Vickers 2001] (Find information on energy use in faucets in Section 4)
Table 34 describes the data that was used in the analysis to estimate the life-cycle cost-effectiveness of these faucets The flow rates are based on the standard flow rate that was available for the particular type of faucet Because labor time varies among these different faucets a column was added to this table to detail this information
Table 34 Faucet Data Used in the Analysis
Faucet Flow Rate (gpm)
Savings Potential per
use
Estimated Cost per Fixture
Estimated Installation Labor Time
(min)
Cost Data Source
Standard EPAct Low Flow Aerator Retrofit
22 20 $320 5 Average of typical price from GSA Advantage
High Efficiency Low Flow Aerator Retrofit
10 64
$320 5 Average of typical price from GSA Advantage
Pedal Activated Retrofit
22 and 10 36 - 71
138 60 Average of typical price from GSA Advantage
Self Closing ndash Single Replacement
22 36
$7150 60 Average of typical price from GSA Advantage
Self Closing ndash Double Replacement
22 36
$17350 60 Average of typical price from GSA Advantage
1 Also Chvala WD GP Sullivan and KL McMordie 2004 Water Management Plan for Pacific Northwest National Laboratory PNNL-Letter Report Pacific Northwest National Laboratory Richland Washington (not publicly available)
39
Table 34 Faucet Data Used in the Analysis (cont)
Faucet Flow Rate (gpm)
Savings Potential per
use
Estimated Cost per Fixture
Estimated Installation Labor Time
(min)
Cost Data Source
Sensored ndash Battery-operated Replacement
05 85
$248 60
Average of typical price from GSA Advantage
Sensored ndash Hard Wired Replacement
05 85
$248 120 Average of typical price from GSA Advantage
Hydro-Powered Sensored Replacement
11 71
$500 90
Wholesale price from manufacturer [Toto USA 2005]
Solar-Powered Sensored Replacement
05 85
$475 90
Wholesale price from manufacturer [Sloan Valve 2005]
325 Clothes Washers
The clothes washers in this study are a commercial-quality soft-mount family-sized high performance Energy Star clothes washers (see httpwwwenergystargovindexcfmfuseaction=clotheswashdisplay_commercial_cw) These washers save considerable water and energy over standard family-sized soft-mount commercial washers Because most of a clothes washerrsquos energy use is tied to hot water use any savings in hot water translates to energy savings Additional energy savings are reported as a result of higher-efficiency motors and the high spin speeds achieved in the H-axis designs
The assessment only examines retrofits of high performance washers for DoD barracks There are other Federal applications for laundry in hospitals and prisons however these equipment are considered large process water use which is not appropriate for soft-mount family-size high performance washer retrofits
The typical existing clothes washer in a barracks setting at a DoD installation is estimated to consume 38 gallons per cycle while high performance washers use typically ~15 gallons per cycle saving 61 of laundry water consumption Typically a clothes washer can be replaced in about 1 hour There are no operations and maintenance savings between these two types of washers Table 35 provides the data used in the LCC analysis for clothes washers
310
Table 35 Clothes Washer Data Used in the Analysis
Clothes Washer
Water Consumption
per cycle (Gallons)
Savings Water
Potential per Cycle
Estimated Installed Cost per Fixture
Cost Data Source
High Performance 15 61 $1500 [Sullivan et
al 2004]
33 Engineered Site-Specific Water Processes and Equipment
There are significant water savings opportunities from equipment and processes beyond the ldquooff the shelfrdquo technologies that are being examined in this assessment These engineered solutions are significant water users in the Federal sector and offer large water efficiency improvements Typically these technologies are site-specific in nature therefore savings have a wide variance among sites These engineered technologies are not analyzed in this report but should not be discounted as large water savings opportunities in the Federal sector These technologies can be applied to
bull Cooling towers
bull Boiler and steam systems
bull Irrigation
bull Industrial laundry
bull Leak detection and repair
bull Single-pass cooling
A description of each technology and efficiency opportunities is included in Appendix E of this report
311
312
40 Cost-Effectiveness of Implementing Water Conservation
A life-cycle cost (LCC) analysis was used to determine the cost-effectiveness of implementing the ldquooff the shelfrdquo technologies described in Section 3 at Federal facilities This LCC analysis is consistent with the methodology outlined in the National Institute of Standards and Technology Manual 135 Life-Cycle Costing Manual for the Federal Energy Management Program [Fuller and Peterson 1995] The results of the LCC analysis were used in two ways 1) determined which fixtures were LCC effective and most appropriate for Federal applications and 2) determined the total cost-effective savings potential in the Federal government (see Section 5)
It should be noted that while engineered solutions (ie efficiency measures designed for a specific application or water-using process at a specific site) are acknowledged to hold significant potential for water savings in the Federal sector their site-specific nature makes it difficult to analyze and quantify savings Therefore these were excluded from this analysis
41 Introduction to Life-Cycle Cost Analysis Methodology
To determine at what marginal watersewer rate the fixtures become LCC effective the positive net present value (NPV) was calculated NPV is the total net discounted dollar savings of owning operating and maintaining one piece of equipment as compared to another So the LCC results show at what marginal watersewer rate the fixture becomes economical to replace the fixture as compared to existing equipment This information is helpful because it can point to which technologies have the best opportunities for application in Federal facilities The results of the LCC analysis are presented in the tables at the end of this section
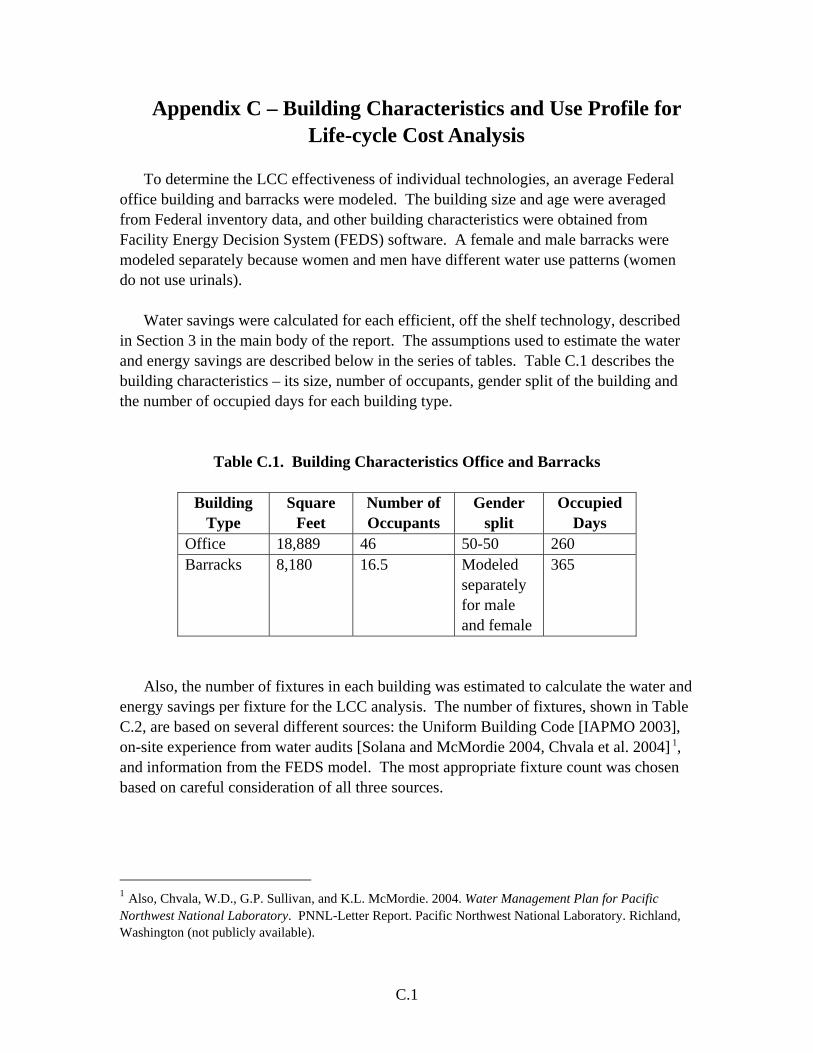
The LCC analysis assesses two different water use scenarios ndash water use patterns for office and barracks This is because ldquooff the shelfrdquo fixtures in the Federal sector typically match an office setting or barracks setting In other words people typically use domestic fixtures at work and at their place of residence It is considered that civilian agencies typically only use water in the office setting while DoD services use water both in the office and the barracks setting DoD also has family housing which closely matches the barracks use pattern with the exception of urinal use
To do the LCC analysis an estimate of the installed and operations and maintenance costs of the water conservation technologies were developed along with the annual water and energy consumption of the existing and replacement equipment as described in Section 3 With that information and with assumptions on the remaining life of the current technology and the current discount rate the cost-effectiveness range of watersewer rates was determined The primary assumptions used in the LCC analysis are shown in the following list For a full description of the assumptions used in the LCC analysis see Appendices C and D
41
bull Typical water use for office and barracks scenarios were modeled using the Facility Energy Decision System (see methodology in Appendices C and D) for all ldquooff the shelfrdquo fixtures described in Section 3
bull Replacement of fixtures are assumed to be installed immediately
bull Federal real discount rate of 30 is used [Schultz et al 2004]
bull Existing technologies are assumed to have a 50 remaining life This assumes a normal distribution of building and equipment ages across the entire Federal sector
bull The cost of replacing the equipment is annualized over the life of the replacement
bull The LCC analysis determines at which combined marginal watersewer rate the fixture has a positive NPV
bull Future water and sewer rates are not escalated
bull Future energy rates are escalated
The rest of this section details the data that was used in the LCC analysis and the detailed results are shown in the tables at the end of this section
42 Federal WaterSewer Rates
The average Federal marginal water and sewer rates for both DoD and civilian agencies were determined so that the LCC results could be compared against these average marginal Federal rates The cost-effective combined water and sewer cost for each fixture can be compared to the average rates in the Federal sector to determine if the technology is cost-effective at Federal sites for both DoD and civilian
Actual water rates across the Federal sector vary widely and the variance is heavily influenced by whether water is purchased (most likely from a municipal supplier) or generated on site (common for DoD installations) Water rates are also influenced by geographic location and agency contracting mechanism To estimate the typical marginal cost of water in the Federal government the Raftelis 2002 Water and Wastewater Rate Survey was used [Raftelis 2004] This water rate survey is a detailed investigation of water and sewer rates from water utilities across the continental US serving both Federal and non-Federal sites The water rate survey collected and analyzed data on residential commercial and industrial customers for varying meter sizes including the marginal and fixed costs for water and sewer This survey is a comprehensive examination of water and sewer rates across the Continental US so it is considered a good representation of typical water rates that Federal facilities incur if water is
42
purchased from a local municipality1 It is assumed that civilian agencies are typically charged commercial water and sewer rates by the serving municipalities and DoD installations are typically charged industrial water and sewer rates by the serving municipalities
All data collected in the Raftelis Water and Wastewater Rate Survey for commercial marginal rates (the water costs that only represent the volumetric charge for water and not fixed costs and fees) were averaged which represents a mean watersewer rate for civilian sites All data collected in the water rate survey was also averaged for industrial marginal rates to represent the mean water rate for DoD installations
Table 41 shows the marginal water and sewer rates that are considered average for the Federal government
Table 41 Mean DoD and Civilian Marginal Water Rates
Sector 2003 Marginal Water Cost
($1000 gallons)
2003 Marginal Sewer Cost
($1000 gallons)
2003 Marginal Total Water Cost ($1000 gallons)
DoD $179 $246 $425 Civilian $193 $254 $447
It should be noted that a significant number of DoD installations do not purchase water from a local municipality and pump and treat water on-site Where this is the case the cost of water may be significantly lower than the average marginal industrial rate that is reported in the Raftelis survey described above This is because DoD installations that produce and treat their own water typically estimate water costs based on pumping treatment and chemical costs only excluding capital amortization and labor costs in rate calculation [Lombardo 1997] A detailed examination of current DoD watersewer rates was not performed for this updated analysis (significant effort is required and therefore it was beyond the scope of this assessment) More information on actual DoD rates could provide important insight to cost-effectiveness of water efficiency projects for DoD Historical water rate information on a select number of Army sites can be found in Appendix F
43 Federal Energy Rates
For base year energy prices the LCC analysis used 2004 national average energy rates obtained from a file ENCOST04TXT created in support of the document Energy Price Indices and Discount Factors for Life-Cycle Cost Analysis ndash April 2004 [Schultz et al 2004] While these EIA-based average rates were not Federal-specific industrial prices were used as a proxy for prices paid by DoD and commercial prices for those borne by the rest of the Federal sector
1 Federal water rates outside the US were not investigated
43
Prices for subsequent years in the analysis period were escalated using fuel and sector-specific escalation rates provided in the same document
While marginal rates are preferable for an LCC analysis such national-level estimates for the Federal sector are not easily obtained In the case of commercial and industrial rates the impacts of using average rates as a proxy may be relatively minimal because fixed costs may represent a relatively small portion of the total energy bill To provide the option of a truly conservative view of the savings potential of the analyzed equipment the LCC results are presented both with and without energy savings Table 42 provides the energy rates for electricity and natural gas for civilian and DoD
Table 42 Base Year Energy Rate for LCC analysis
Sector 2004 Electricity Rate ($kWh)
2004 Natural Gas Rate ($therm)
Industrial (DoD) $00469 $04750 Commercial (Civilian) $00742 $07690
44 Life-Cycle Cost Analysis Results
The results of the LCC analysis show that most of the fixtures are cost-effective at the average combined marginal watersewer cost for the Federal government $4251000 gallons for DoD sites and $4471000 gallons for civilian sites The most cost-effective fixtures were manual faucets and showerheads It was found that the cost-effectiveness of these fixtures is greatly enhanced when incorporating energy savings from hot water savings For some of these options the LCC results calculated a negative watersewer cost at which the fixture becomes cost-effective In other words a site could have free water and yet still find it LCC effective to install the particular water-efficient fixture by only including energy savings This means that energy savings alone creates enough cost savings to render the fixture LCC effective
Generally toilets and urinals are cost-effective at average Federal watersewer marginal rates However the results show that toilets used in menrsquos restrooms are often not cost-effective at a water rate at or below the average Federal rates This is because men typically use urinals more often than toilets in the Federal setting so water savings is minimal for male toilets
There are a number of scenarios where automatic and sensored faucets require a high watersewer rate to become cost-effective In these cases the installation is expensive and water savings is not significant enough to overcome the high installed cost For example a pedal activated faucet with a flow rate of 22 gpm does not generate enough savings over the life of the
44
fixture to have good return on investment Note that hot water generated by electric water heaters is cost-effective at lower watersewer rates than compared to natural gas water heaters This is because electricity is typically more expensive on a Btu basis than natural gas
High performance (Energy Star) commercial clothes washers were cost-effective at the average Federal watersewer rate Similar to showers and faucets electric water heaters results in the best LCC effectiveness for clothes washers Where only water savings were considered clothes washers are still cost-effective at average Federal marginal watersewer rate
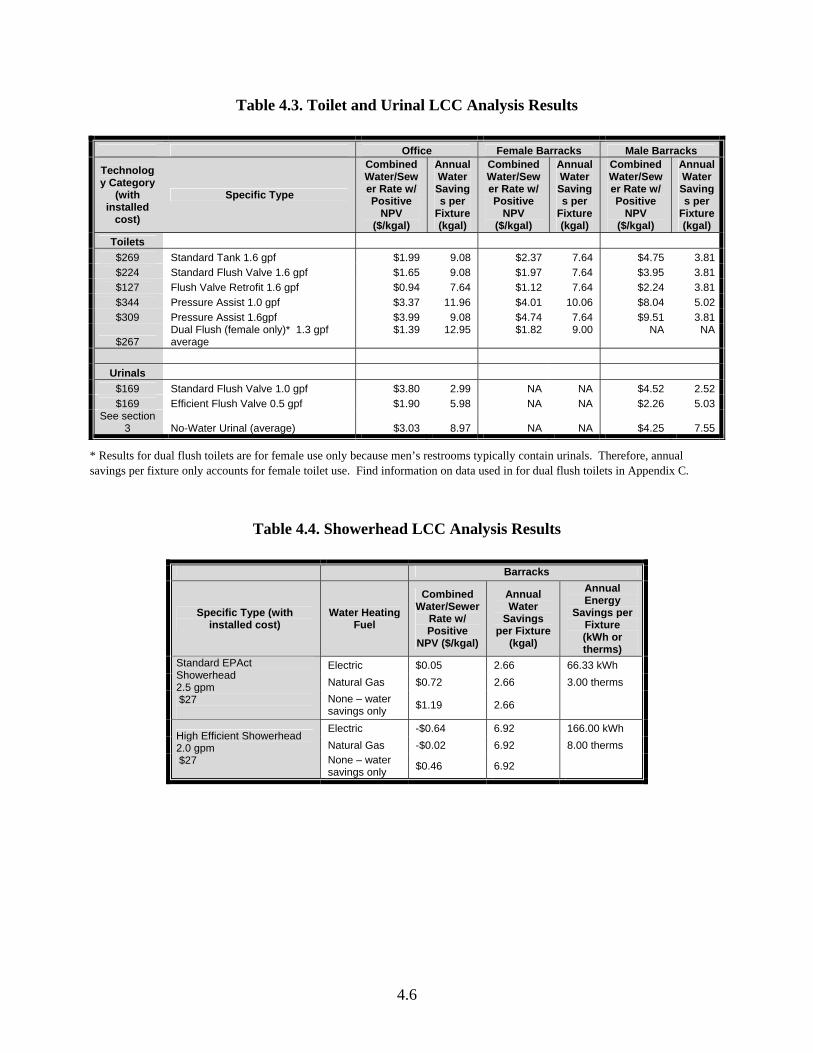
A summary of the results of this analysis is presented in Tables 43 to 46 below These results show the marginal rate of water where the technology has a positive NPV In other words it is the water rate at which the fixture will become LCC effective These tables provide a convenient way to determine if a fixture is LCC effective at a given combined watersewer marginal rate for different scenarios The tables are broken out by the two water use scenarios that were modeled ndash office and barracks
The results for toilets and urinals in Table 43 are shown for both female and male barracks Because water use is different between these two facility types the LCC results are different The results for dual flush toilets are provided for female toilets only This is because dual flush toilets in menrsquos restrooms are not considered practical because men typically use urinals in the Federal setting The results for both dual flush toilets and no-water urinals are an average across the brands that were analyzed
For technologies that use hot water (showers faucets and clothes washers) there are three different scenarios provided in Tables 44 45 and 46 below
bull Water savings and electricity savings from an electric water heater
bull Water savings and natural gas savings from a natural gas water heater
bull Water savings only with energy savings not included
In addition to these components the results for faucets in Table 45 show the cost-effective water rate at the DoD and civilian energy rates for both electricity and natural gas (as described in Table 42) Because showerheads are primarily in DoD facilities only DoD energy rates are used
45
Table 43 Toilet and Urinal LCC Analysis Results
Office Female Barracks Male Barracks
Technolog y Category
(with installed
cost)
Specific Type
Combined WaterSew er Rate w Positive
NPV ($kgal)
Annual Water Saving s per
Fixture (kgal)
Combined WaterSew er Rate w Positive
NPV ($kgal)
Annual Water Saving s per
Fixture (kgal)
Combined WaterSew er Rate w Positive
NPV ($kgal)
Annual Water Saving s per
Fixture (kgal)
Toilets $269 Standard Tank 16 gpf $199 908 $237 764 $475 381 $224 Standard Flush Valve 16 gpf $165 908 $197 764 $395 381 $127 Flush Valve Retrofit 16 gpf $094 764 $112 764 $224 381 $344 Pressure Assist 10 gpf $337 1196 $401 1006 $804 502 $309 Pressure Assist 16gpf $399 908 $474 764 $951 381
$267 Dual Flush (female only) 13 gpf average
$139 1295 $182 900 NA NA
Urinals $169 Standard Flush Valve 10 gpf $380 299 NA NA $452 252 $169 Efficient Flush Valve 05 gpf $190 598 NA NA $226 503
See section 3 No-Water Urinal (average) $303 897 NA NA $425 755
Results for dual flush toilets are for female use only because menrsquos restrooms typically contain urinals Therefore annual savings per fixture only accounts for female toilet use Find information on data used in for dual flush toilets in Appendix C
Table 44 Showerhead LCC Analysis Results
Barracks
Specific Type (with installed cost)
Water Heating Fuel
Combined WaterSewer
Rate w Positive
NPV ($kgal)
Annual Water
Savings per Fixture
(kgal)
Annual Energy
Savings per Fixture (kWh or therms)
Electric $005 266 6633 kWh Natural Gas $072 266 300 therms
Standard EPAct Showerhead 25 gpm $27 None ndash water
savings only $119 266
Electric -$064 692 16600 kWh Natural Gas -$002 692 800 therms
High Efficient Showerhead 20 gpm $27 None ndash water
savings only $046 692
46
Table 45 Faucet LCC Analysis Results
Office Barracks
Faucet Specific
Type (with installed
cost)
Federal Sector
(DoD and Civilian)
Water Heating Fuel
Combined WaterSewer
Rate w Positive NPV
($kgal)
Annual Water
Savings per
Fixture (kgal)
Annual Energy Savings
per Fixture (kWh or therms)
Combined WaterSewer
Rate w Positive
NPV ($kgal)
Annual Water
Savings per Fixture
(kgal)
Annual Energy Savings
per Fixture (kWh or therms)
Standard EPAct Faucet
DoD Electric -$466 110 12420 kWh -$037 099 2063 kWh
22 gpm Natural Gas -$157 110 550 therms $016 099 100 therms
$689 None ndash water savings only $053 110 NA $059 099 NA
Civilian Electric -$742 110 12420 kWh NA NA NA Natural Gas -$294 110 550 therms NA NA NA None ndash water savings only $053 110 NA NA NA NA
High Efficient Faucet
DoD Electric -$385 349 30600 kWh -$126 314 9925 kWh
10 gpm Natural Gas -$147 349 1367 therms -$045 314 475 therms
$689 None ndash water savings only $017 349 NA $018 314 NA
Civilian Electric -$598 349 30600 kWh NA NA NA
Natural Gas -$254 349 1367 therms NA NA NA
None ndash water savings only $017 349 NA NA NA NA
Self Closing Single DoD Electric $303 110 13950 kWh $876 099 2317 kWh
22 gpm Natural Gas $650 110 618 therms $936 099 112 therms
$11580 None ndash water savings only $885 110 NA $984 099 NA
Civilian Electric -$007 110 13950 kWh NA NA NA Natural Gas $495 110 618 therms NA NA NA None ndash water savings only $885 110 NA NA NA NA
Self Closing Double DoD Electric $1078 110 13950 kWh $1738 099 2317 kWh
22 gpm Natural Gas $1425 110 618 therms $1798 099 112 therms
$21730 None ndash water savings only $1660 110 NA $1846 099 NA
Civilian Electric $768 110 13950 kWh NA NA NA Natural Gas $1270 110 618 therms NA NA NA None ndash water savings only $1660 110 NA NA NA NA
47
Table 45 Faucet LCC Analysis Results (cont)
Office Barracks
Faucet Specific
Type (with installed
cost)
Federal Sector
(DoD and Civilian)
Water Heating
Fuel
Combined WaterSewer
Rate w Positive
NPV ($kgal)
Annual Water
Savings per
Fixture (kgal)
Annual Energy
Savings per Fixture (kWh or therms)
Combined WaterSewer
Rate w Positive
NPV ($kgal)
Annual Water
Savings per
Fixture (kgal)
Annual Energy Savings
per Fixture (kWh or therms)
Pedal Activated Standard
DoD Electric $450 197 13950 kWh $801 177 2317 kWh
22 gpm Natural Gas $643 197 618 therms $834 177 112 therms
$18230
None ndash water savings only
$774 197 NA $860 177 NA
Civilian Electric $278 197 13950 kWh NA NA NA Natural Gas $557 197 618 therms NA NA NA None ndash water savings only
$774 197 NA NA NA NA
Pedal Activated High Efficient
DoD Electric -$012 389 34380 kWh $291 350 11152 kWh
10 gpm Natural Gas $228 389 1536 therms $373 350 534 therms
$18230
None ndash water savings only
$393 389 NA $437 350 NA
Civilian Electric -$227 389 34380 kWh NA NA NA Natural Gas $120 389 1536 therms NA NA NA None ndash water savings only
$393 389 NA NA NA NA
Sensor -battery DoD Electric $344 468 42740 kWh $687 421 14768 kWh
05 gpm Natural Gas $592 468 1910 therms $777 421 709 therms
$29230
None ndash water savings only
$762 468 NA $847 421 NA
Civilian Electric $122 468 42740 kWh NA NA NA Natural Gas $480 468 1910 therms NA NA NA None ndash water savings only
$762 468 NA NA NA NA
Sensor -hardwired DoD Electric $185 468 42740 kWh $509 421 14768 kWh
05 gpm Natural Gas $432 468 1910 therms $599 421 709 therms
$33660
None ndash water savings only
$602 468 NA $669 421 NA
Civilian Electric -$038 468 42740 kWh NA NA NA Natural Gas $320 468 1910 therms NA NA NA None ndash water savings only
$602 468 NA NA NA NA
48
Table 45 Faucet LCC Analysis Results (cont)
Office Barracks Faucet
Specific Type (with
installed cost)
Federal Sector (DoD and
Civilian)
Water Heating
Fuel
Combined WaterSewer
Rate w Positive NPV
($kgal)
Annual Water
Savings per
Fixture (kgal)
Annual Energy
Savings per Fixture (kWh or therms)
Combined WaterSewer
Rate w Positive
NPV ($kgal)
Annual Water
Savings per
Fixture (kgal)
Annual Energy Savings per
Fixture (kWh or therms)
Hydro Powered DoD Electric $837 379 34380 kWh $1242 341 11152 kWh
10 gpm Natural Gas $1083 379 1536 therms $1326 341 534 therms
$56645
None ndash water savings only
$1252 379 NA $1391 341 NA
Civilian Electric $616 379 34380 kWh NA NA NA Natural Gas $971 379 1536 therms NA NA NA None ndash water savings only
$1252 379 NA NA NA NA
Solar Powered DoD Electric $551 468 42740 kWh $916 421 14768 kWh
05 gpm Natural Gas $798 468 1910 therms $1006 421 709 therms
$54132
None ndash water savings only
$968 468 NA $1076 421 NA
Civilian Electric $328 468 42740 kWh NA NA NA Natural Gas $686 468 1910 therms NA NA NA None ndash water savings only
$968 468 NA NA NA NA
Table 46 Clothes Washer LCC Analysis Results
Barracks
Specific Type
Water Heating Fuel (Electric Natural Gas None ndash water savings only)
Combined WaterSewer
Price w Positive
NPV ($kgal)
Annual Water
Savings per Fixture
(kgal)
Annual Energy
Savings per Fixture (kWh
therms) Electric $156 419 24072 kWh Natural Gas $302 419 134 kWh
1035 therms
High Performance Commercial (Energy Star) Clothes Washer $1500 None ndash water
savings only $419 419 NA
Electric savings for water heated by natural gas result from to motor efficiency improvements
49
410
50 Cost-Effective Savings Potential in the Federal Sector
The cost-effective savings potential in the Federal sector was determined by first estimating the amount of water currently used by domestic fixtures Next the cost-effective savings percentage (of the total water use) was calculated for each fixture to determine what percentage could be saved cost-effectively This was done by identifying the fixtures that were determined to be LCC effective at the Federal average combined marginal water and sewer rate as described in Section 4 The methodology used to determine the water consumption in the Federal government and cost-effective savings potential is described below
51 Water Consumption Estimates in the Federal Sector
To ascertain the cost-effective water conservation potential in the Federal sector the first step is to determine the total water use in the Federal sector that is available for water savings for each ldquooff the shelfrdquo technology as described in Section 3
The total Federal water use was obtained from the FY 2003 DOE Report on Federal Agency Activities Under Executive Order 13123 [Executive Order 13123 1999] All Federal agencies are required to report total annual water use and cost of water to DOE These annual totals are summed for DoD and civilian agencies The reported water use and cost is presented in Table 51 below
Table 51 Total Water Use and Cost in the Federal Government [US DOE 2005]
Sector FY 2003 Water Use (million gallons)
of Total Use Water Cost ($ million)
DoD Civilian Agencies Total
162096 46959 209056
78 22 100
$292 $135 $427
The approach in this updated assessment examines water use in the Federal sector at the end-use level for each ldquooff the shelfrdquo domestic technology ndash toilets urinals showerheads faucets and clothes washers This was accomplished by applying the Federal water use indices for specific building types to the Federal inventory data obtained from the General Service Administration 1999 Federal real property database [GSA 1999]
The GSA real property database provides square footage for each major building type in the Federal sector for all DoD and civilian agencies However water use is typically driven not by how big the building is but rather by how many people occupy the building Therefore it is more accurate to base water use by occupancy level instead of by square footage The total occupancy of each building type was estimated by multiplying the total square footage by an estimated occupancy density (occupantsqft) The occupancy densities were obtained from
51
Facility Energy Decision System (FEDS) software [FEDS 2002] A complete description of Federal inventory building types and occupancy densities used in the analysis are listed in Appendices A and B
The estimated occupancy for each building type was then multiplied by the associated Federal water use indices (WUI) The Federal WUI obtained from the American Water Works Association (AWWA) is an estimate of the typical daily water use per occupant in gallons per person per day (gpd) [AWWA 1996] See Appendix B for a full explanation on how WUIs were chosen and estimated for each building type in the GSA real property database Also a detailed methodology and breakout of water use in the Federal sector by building type is included in Appendices A and B
The total water use for each building category was further broken down by end-use This is done by applying the typical end-use profiles for each building type A percent breakout of water use by end-use technology was obtained from two main sources Handbook for Water Use and Conservation by Amy Vickers [Vickers 2001] and A Water Conservation Guide for Commercial Institutional and Industrial Users developed by the New Mexico State Engineers Office [NMOSE 1999] A detailed explanation of how each building typersquos end-use profile was estimated can be found in Appendix B
These water use percentages for ldquooff the shelfrdquo technologies for each building type were then multiplied by the total Federal water use obtained from the FY 2003 Report on Federal Agency Activities Under Executive Order 13123 DoD domestic water consumption was estimated to be 78193 million gallons and civilian domestic water consumption was estimated at 27862 million gallons which totals 106055 million gallons or approximately 51 of all Federal water use Detailed data is provided in Table 52 below
Table 52 Estimated Water Use for Off the Shelf Technologies in the Federal Government
Technology
Annual DoD Water Use
(million gallons)
Annual Civilian
Water Use (million gallons)
Annual Total Federal Water
Use (million gallons)
Percent Total
Federal Water Use
Toilets 32614 12214 44828 21 Urinals 6824 1859 8683 4 Showers 12162 7920 20082 10 Faucets 13081 3488 16569 8 Clothes Washers 13512 2381 15893 8 Domestic Fixture Total 78193 27862 106055 51 Total Water Consumption 162096 46959 209055 of Total Use 48 59 51
52
52 Energy Consumption Estimate in the Federal Sector
The energy used to heat water in the Federal government was estimated using the Facility Energy Decision System (FEDS) a building energy modeling tool [FEDS 2002] The building inventory data from the GSA Real Property database that was used to estimate the water use in the Federal government was input into the FEDS software to model the amount of energy required to heat water in the Federal sector for domestic fixtures showerheads faucets clothes washers and dishwashers FEDS accounts for energy consumed by standby losses1 which are included in the total energy use but are not accounted for in energy reduction as a result of efficiency improvements
FEDS only accommodates efficiency improvements for faucets and showerheads Therefore the energy reduction potential for clothes washers and dishwashers in the Federal sector is not estimated in this assessment However it should be noted that there is significant opportunity for energy reduction from high performance clothes washers as discussed above There is approximately a 76 in energy reduction from high performance clothes washers compared to traditional equipment This includes both hot water reduction and higher motor efficiency
FEDS calculates energy requirements to heat tap water based on the difference between the groundwater temperature and the desired hot water temperature The Federal inventory data was broken out by DOE Region enabling buildings to be modeled by region to account for groundwater temperature differences throughout different parts of the country
To estimate energy savings as a result of reduction in hot water for showers and faucets varying flow rates for fixtures were modeled in FEDS to determine the amount of energy used by each It was assumed that all water was heated using distributed water heaters Water heated by steam or hot water from a central boiler and distributed system(common in DoD facilities) is not examined in this analysis Because central boilers are typically less efficient than distributed water heaters as a result of distribution losses the energy use and savings estimate in this analysis is conservative
All water was assumed to be heated by either electricity or natural gas Aside from central boiler hot water a small percentage of water is heated in distributed systems using fuel oil propane gas or other fuels and thus assumed to be negligible for the purposes of this assessment The amount of water assumed to be heated using electricity versus natural gas was
1 Standby losses occur through the walls of the hot water tank as well as through pipes during transmission to the end-use When hot water is not being used it tends to cool to the ambient temperature more energy is therefore needed to keep the stored water at the desired temperature although water may not have been drawn from the tank This wasted energy lost to the surroundings instead of providing useful work is called standby loss
53
based on Commercial Buildings Energy Consumption Survey 1999 (CBECS) [CBECS 2005] Annual Energy Outlook 2003 (AEO) data [EIA 2005] and data collected on Federal sites for other analyses conducted by PNNL [Parker et al 2005] For more information on these assumptions go to Appendix C
The results from the FEDS analysis of the total required energy to heat water for domestic uses (faucets showers clothes washers and dishwashers) in the Federal government is approximately 20900 billion Btu or about 2 of the total energy requirement of the Federal government [EIA 2005]1 The amount of energy required to heat water for showers and faucets is estimated to be about 4900 billion Btu or about 05 of the total energy requirement in the Federal sector Detailed results are presented in the Table 53
Table 53 Estimated Energy Requirements for Domestic Hot Water in the Federal Sector
Federal Sector Annual
Electricity Use (MWh)
Annual Natural Gas Use
(million Btu)
Total Annual Energy Use (million Btu)
DoD Faucets and Showers 469033 2212825 3813166 Civilian Faucets and Showers 137044 635550 1103145 Total Faucets and Showers 606077 2848376 4916312
DoD Total Hot Water 1674525 9500118 15213597 Civilian Total Hot Water 644868 3468931 5669220 Total Federal Hot Water 2319393 12969049 20882817
Conversion from MWh to MMBtu is 3412
See Appendix D for a detailed explanation of the methodology used in estimating the energy use and savings in the Federal sector
53 Cost-Effective Savings Potential Results
The water consumption and energy use estimated (presented in Tables 52 and 53) and the results of the LCC analysis (presented in Section 4) were used to estimate the cost-effective savings potential from the ldquooff the shelfrdquo fixtures in the Federal sector This analysis was done at a very high level encompassing the entire Federal sector so the results are not specific to any given site or Federal agency Rather they are general findings estimating total savings potential across the DoD and civilian sectors This savings potential represents 100 penetration of cost-effective efficient technologies in the Federal sector to show the true savings potential
1 The Federal government as reported by Energy Information Administration (EIA) in 2003 used 10516 trillion Btus
54
Because of the complexity of the Federal sector certain simplifying assumptions were mademdashthese are discussed below Note that the savings potential for any given site should be looked at given that sitersquos specific situation including specific equipment use and age as well as the marginal watersewer cost and environmental issues for example
To estimate the cost-effective savings potential in the Federal sector appropriate domestic fixtures were chosen from each category (toilets urinals showerheads faucets and clothes washers) that were determined to be LCC effective at or below the Federal average combined watersewer marginal cost (4251000 gal for DoD and 4471000 gal for civilian) Two technologies were chosen from each category ndash a standard fixture that meets the current EPAct requirements and a high efficiency option that exceeds EPAct but is still LCC effective at the average Federal water rate See Table 54 for a list of the fixtures chosen
Table 54 LCC Effective Fixtures Used to Estimate Savings Potential
Technology Standard EPAct Technology
High Efficiency Technology
Toilet 16 gpf flush valve 10 gpf pressure assisted Urinal 05 gpf No-water urinal Showerhead 25 gpm 20 gpm Faucet 22 gpm 05 gpm Clothes Washer High Performance NA
Urinal EPAct standard is 10 gpf However 05 gpf was cost-effective below the average Federal rates therefore was used as the ldquostandardrdquo
The savings for each of the fixtures in Table 54 was calculated based on the difference between the average water consumption of current water-using equipment in the Federal sector and the more efficient retrofit water consumption (as described in Section 3)
The Federal government has already implemented some degree of water-efficient technologies therefore a range of penetration rates of efficient technologies was assumed This was based on previous work at Federal sites [Solana and McMordie 2004 Chvala et al 2004] 1 which estimates the percentage of efficient fixtures that meet EPAct standards and highly efficient fixtures currently installed at Federal sites as described above Penetration of high efficiency fixtures was considered to be much lower than standard EPAct fixtures The
1 Also Chvala WD GP Sullivan and KL McMordie 2004 Water Management Plan for Pacific Northwest National Laboratory PNNL-Letter Report Pacific Northwest National Laboratory Richland Washington (not publicly available)
55
penetration rates used in this analysis are in Table 55 and more details are provided in Appendix B
Table 55 Penetration Rates of Efficient Technologies in the Federal Government
Fixture EPAct
Standard Technology
Penetration Rate in Federal Sector
High Efficiency
Technology
Penetration Rate in Federal Sector
Toilets 16 gpf 20 10 gpf
pressure assist
0
Urinals 10 gpf 50 0 gpf 2 Showerheads 25 gpm 70 20 gpm 10
Faucets 22 gpm 70 05 gpm sensored 10
Clothes Washer
High Performance (or use Energy Star) 4 NA NA
These penetration rates were multiplied by the corresponding cost-effective water and energy use savings These values arrive at the realistic cost-effective water and energy savings that is currently available for water savings for each technology
The final results of the cost-effective water savings potential in the Federal sector is estimated to be between 35000 and 50000 million gallons per year representing about 17 to 24 of total Federal water consumption The corresponding cost savings due to water savings is between $152 and $216 million annually (based on water rates presented in Table 41) The energy savings potential from reduced hot water consumption in showers and faucets is estimated to range from approximately 601700 to 1550000 million Btus The corresponding energy cost savings represents between $13 and $20 million annually (based on energy rates presented in Table 42) Breakouts by end-use of these results are shown below in Table 56 Low-end savings represent retrofits using the EPAct standard fixtures high-end savings represent installation of the high-efficiency technologies
56
Table 56 Total Cost-Effective Range of Savings in the Federal Government
Federal Sector Fixture
Low End
Water Savings (million
gal)
High End
Water Savings (million
gal)
Low End Water Cost
Savings ($million)
High End Water Cost
Savings ($million)
Low End
Energy Savings (million
Btu)
High End Energy Savings (million
Btu)
Low End Energy
Cost Savings
($million)
High End Energy
Cost Savings
($million)
DoD Faucet 3351 7893 $1424 $3355 322267 821044 $515 $775 Clothes Washer 6510 6510 $2767 $2767 NA NA NA NA
Showerhead 131 1034 $056 $439 24228 179506 $085 $212 Toilet 13684 16212 $5816 $6890 NA NA NA NA Urinal 3919 6247 $1666 $2655 NA NA NA NA
DoD Total 27595 37895 $11728 $16106 346495 1000549 $600 $987 Civilian Faucet 1203 2139 $538 $956 250886 519224 $610 $789 Showerhead 213 1606 $095 $718 4288 30354 $136 $227
Toilet 5270 6814 $2356 $3046 NA NA NA NA Urinal 1111 1788 $496 $799 NA NA NA NA
Civilian Total 7796 12347 $3485 $5519 255174 549578 $746 $1016
Grand Total 35391 50242 $15213 $21625 601669 1550128 $1346 $2003
57
58
60 Needs and Recommended Requirements for Successful Performance Contracting
Water conservation and efficiency measures have been incorporated into performance contracting of energy-efficiency projects as part of the Department of Defense ESPC and Super ESPC contracts Thus there is a considerable base of experience in water efficiency performance contracting at Federal sites The majority of the water conservation projects have been developed and implemented through second-tier contractors to energy service companies (ESCOs) For these ESCOs the water conservation projects are generally implemented through a water management specialist as a subcontractor andor a technology supplier who has expertise in implementation There are a few ESCOs that maintain staff with water conservation project development expertise but this is not typical
A number of challenges observations or recommendations have been made by the providers of water conservation services who have designed and implemented a significant number of water conservation projects and verified the savings under ESPC for the Federal sector1 These observations and recommendations are described in this section under the subheadings ldquoProject Designrdquo ldquoProject Implementationrdquo and ldquoSavings Verificationrdquo
61 Project Design
The following bullets describe key findings that impact the design of water projects These observations show limitations and barriers to designing effective water conservation projects
bull Given the requirements of the Super ESPC water services (only) firms must be used as subcontractors A water services subcontractor to an ESCO generally increases the cost of a water efficiency project and thus causes some technologies to no longer be cost-effective A standalone water savings performance contract with a water services (only) firm would likely reduce the overall cost of a water project while at the same time allow more water projects to be cost-effective
bull Many ESCOs consider water projects to be primarily domestic or ldquooff the shelfrdquo technology retrofits (eg low flush toilets and urinals) and very often do not incorporate more complex or engineered water projectsmdashparticularly projects in industrial processes or facilities such as single-pass cooling or steam system
1 Information obtained on impacts of performance contracting for water efficiency projects from personal communications with the following Mr James Horner President of Water Management Inc on February 28 2005 Mr Tom Horner Vice President of Water Management Inc on February 28 2005 and Mr Andrew Perrin Water Engineer with H2O Applied Technologies on February 2005
61
efficiency improvements This creates a significant number of missed opportunities especially if water conservation can be readily included in an energy conservation retrofit (eg retrofit of chillers or cooling towers)
bull Water efficiency opportunities are many times the last set of projects or technologies identified in a more complete and comprehensive set of energy projects ESCOs should bring in the water efficiency experts (if subcontracted) early in the identification of all utility savings project opportunities Also given most ESCOs do not maintain in-house expertise in water efficiency bringing in a water services firm early in the process can help ldquosellrdquo a cost-effective water efficiency project to an otherwise reluctant Federal agency
bull Water audits can generally identify equipment vintage and rated performance In some cases (as with energy consuming equipment) the stated or manufacturerrsquos (label) performance is incorrect because of aging andor improper maintenance For example a labeled 16 gpf toilet may have a worn or replaced valve that is allowing over 3 gpf In many cases the toilet cannot be included in a retrofit project because of the rating on the label Allowance needs to be made for including retrofit projects in these types of situations
bull Currently most water management projectsrsquo economic analyses use an average (rather than marginal) watersewer rate based on the water billndashwithout an escalation factorndashfor LCC analysis This approach is flawed There is a need for development of a method for determining the appropriate baseline rate to use for a water project cost-effectiveness assessment as well as the escalation of that rate similar to the way energy rates are determined and escalated in LCC analysis1
bull Some water services companies as subcontractors to an ESCO may not be willing to reveal proprietary measures or projects without a guarantee or some other certainty of being selected as part of the ESCO team of a Federal ESPC project Water project opportunities that could be included as part of the ESCO bid and selection process are often missed because of proprietary nature of some technologies
bull Because many ESCOs do not have experience and expertise in water efficiency particularly in those projects that are engineered they often limit the developmentidentification of projects to those that are standard or proven retrofits and do not include potential projects that are small or more complicatedmdasheven if economic Significant savings opportunities are thus lost
1 Note the Department of Housing and Urban Development (HUD) has established a 3year escalation rate for watersewer rates in all performance-based water conservation projects under HUD
62
62 Project Implementation
The way that ESPCs are currently structured has an influence on how water projects can be implemented The following bullets describe these major impacts on implementation of water projects
bull Water conservation measuresprojects are almost always a part of a larger set of task or delivery orders that include energy conservation measures (ECMs) Generally the ECMs take longer to design and implement than water conservation measures Though in most cases the water conservation measures can be more quickly implemented than the ECMs they are staged with the ECMs thus unnecessarily delaying the more immediate capture of water savings
bull ESCOs often limit communication and interaction by water services subcontractors directly with the Federal client during design and implementation Direct communication by the water subcontractor with the Federal client will generally lead to identification of additional opportunities minimal disruptions and increased client satisfaction
bull An ongoing or long-term water management maintenance program as part of a water conservation project is crucial to assure savings are sustained over the long term Operations and maintenance is often included in energy conservation projects but neglected in water conservation projects when in fact the water savings are just as dependent upon proper equipment maintenance as in energy projects
63 Savings Verification
ESPCs require a guaranteed savings and thus require measurement and verification (MampV) to assure that savings are being met The following list summarizes the issues revolving around savings verification for water projects and some recommendations for improvements
bull The current industry standard for measurement and verification (MampV) for water measures as part of an ESPC was researched For basic water consuming fixtures (such as toilets urinals showers and faucets) water savings are typically stipulated where savings are determined based on calculated pre- and post-retrofit water consumption agreed to by the facility For water processes MampV is typically based on short term pre- and post-retrofit field measurement of the specific equipment
bull It is vital to have a reasonable and appropriate level of savings verification protocol commensurate with the type of project or type of retrofit As stated in the above
63
bullet stipulated (calculated rather than measured) water savings is a common approach in the Federal sector however stipulated water savings should be applied to technologies only with well established water savings Most domestic-related fixtures have reliable performance and stipulated MampV is most likely adequate For process-related measures such as cooling towers or single-pass cooling the favorable MampV approach is short term and spot measurement because savings is dependent on the site specific nature of the measure
bull The ESCO should strive to engage the water services subcontractor in the development of the savings verification approach for the water conservation measures Even if the water conservation retrofits are a small portion of the task or delivery order and thus a small portion of the savings a responsible savings verification plan needs to be developed and implemented proportionate to the MampV plan With this approach the water services contractor will also share the responsibility for the savings guarantee with the ESCO
bull All servicing utility (water sewer and energy) incentives for water saving (and waterenergy saving) technologies and strategies should be allowed to be captured by the contractor and included in the cost-effectiveness analysis
Overall the most important issue is to create the contract requirements and a process that will be attractive to all potential water service providers in a highly competitive environment This environment should allow the water service providers a wide and flexible range of water-related conservation and cost saving opportunities that bring innovation and creativity to the Federal sector customers
64
70 References
American Water Works Association (AWWA) 1996 Federal Water Use Indices Obtained from FEMP Website at httpwwweereenergygovfemptechnologieswater_useindicescfm
Chvala WD GP Sullivan and KL McMordie 2004 Water Management Plan for Fort Buchanan Puerto Rico PNNL-14533 Pacific Northwest National Laboratory Richland Washington
Commercial Buildings Energy Consumption Survey (CBECS) Website 2005 Accessed February 2005 Website can be found at httpwwweiadoegovemeucbecscontentshtml
Energy Information Administration (EIA) Annual Energy Outlook Website 2005 Accessed February 2005 Website can be found at httpwwweiadoegovoiafaeo
The Energy Policy Act of 1992 (EPACT) 1992 Public Law 102-486 Washington DC
Executive Order 13123 Greening the Government Through Efficient Energy Management 1999 Federal Register 30851 Volume 64 Number 109 Washington DC
Facility Energy Decision System (FEDS) software Release 502 2002 Pacific Northwest National Laboratory Richland Washington
Federal Energy Management Program News and Events Website Accessed on January 26 2005 Summary of the National Defense Authorization Act of Fiscal Year 2005 Website can be found at httpwwweereenergygovfempnewseventsdetailcfmnews_id=8301
Federal Energy Management Program Water Efficiency ndash Federal Requirements Website httpwwweereenergygovfemptechnologieswater_fedrequirecfm Accessed on January 26 2005
Federal Energy Management Program Water Efficiency ndash Water Goals Website (httpwwweereenergygovfemptechnologieswater_goalscfm)
Federal Energy Management Program Water Efficiency Website (httpwwweereenergygovfemptechnologieswater_efficiencycfm)
71
Fitzpatrick QK KL McMordie FV Di Massa and DR Dixon 1995 FORSCOM Installation Characterization and Ranking for Water Efficiency Improvement PNNLshy10541 Pacific Northwest National Laboratory Richland Washington
Fuller SK and SR Petersen 1995 Life-Cycle Costing Manual for the Federal Energy Management Program NIST Handbook 135 National Institute of Standards and Technology Gaithersburg MD
General Service Administration (GSA) Advantage Website 2005 Accessed January 2005 Website used to estimate average fixture costs Website can be found at wwwgsaadvantagegov
General Services Administration 1999 Summary Report of Real Property Owned by the United States Throughout the World as of September 30 1998 General Services Administration Washington DC
Harrison H and J Beck 2004 Prisoners in 2003 Bureau of Justice Statistics Bulletin US Department of Justice Washington DC
International Association of Plumbing and Mechanical Officials (IAPMO) 2003 Uniform Plumbing Code IAPMOANSI UPC 1-2003 Ontario CA
Koeller J 2003 Dual-Flush Toilet Fixtures ndash Field Studies and Water Savings Koeller and Company Yorba Linda California
Lombardo Associates 1997 Federal Facilities Water Use and WaterEnergy Conservation Potential Final Report Prepared for the National Renewable Energy Laboratory Newton Massachusetts
Mansfield Plumbing Products 2005 ldquoWholesale Price Listrdquo Perrysville Ohio
McMordie Stoughton KL and WD Chvala 2004 Southeast Region Energy Program Technical Bulletin Water Saving Toilets and Urinals PNNL-SA-40945 Pacific Northwest National Laboratory Richland Washington
New Mexico Office of the State Engineer (NMOSE) 1999 A Water Conservation Guide for Commercial Institutional and Industrial Users Santa Fe New Mexico
Parker GB KL McMordie GP Sullivan and DB Elliott 2001 Market Assessment for Capturing Water Conservation Opportunities in the Federal Sector PNNL-13511 Pacific Northwest National Laboratory Richland Washington
Parker GB AE Solana and DR Dixon 2005 Facility Energy Decision System (FEDS) Assessment Report for Blue Grass Army Depot Kentucky PNNL-15075 Pacific Northwest National Laboratory Richland Washington
72
Raftelis Financial Consulting PA 2004 Water and Wastewater Rate Survey Charlotte North Carolina
Reed Construction Data Incorporated 2004 RS Means Residential Cost Data - 2005 Kingston Massachusetts [plumbing labor costs]
Service Employees International Union Website Accessed on February 15 2005 Obtained nurse to patient ratio Website can be found at wwwSEIUorg
Schultz LI AS Rushing and SK Fuller 2004 Energy Price Indices and Discount Factors for Life-Cycle Cost Analysis - April 2004 NISTIR 85-3273-19 National Institute of Standards and Technology Gaithersburg MD
Sloanreg Valve Company Sensor Faucets Website 2005 Accessed January 2005 Website can be found at httpwwwsloanvalvecomindex_2450htm
Solana AE and McMordie KL 2004 Water Management Plan for Blue Grass Army Depot PNNL-14880 Pacific Northwest National Laboratory Richland Washington
Sullivan GP GB Parker and J W Currie 2004 Wisconsin Focus on Energy Resource-Efficient Laundry (REL) Room Demonstration Final Report PNDW-3445 Battelle - Pacific Northwest Division Richland Washington
Toto Plumbing USA 2005 ldquoWholesale Price Listrdquo Morrow Georgia Website can be found at httpwwwtotousacomtotopagecontentviewasppageid=56ampshowimage=eco
United States Green Building Council (USGBC) 2003 Leadership in Energy and Environmental Designtrade Reference Guide for New Construction and Major Renovations Version 21 Second Edition Washington DC
Uridanreg Non Water System Website 2005 Accessed in January of 2005 Website can be found at httpuridancom
Veritec Consulting Inc 2002 Dual Flush Toilet Project Canada Mortgage and Housing Corporation Canada
Vickers A 2001 Handbook of Water Use and Water Conservation Amy Vickers and Associates WaterPlow Press Amherst Massachusetts
Waterlessreg No-Flushtrade Urinal Website 2005 Accessed in January of 2005 Website can be found at httpwaterlesscom
73
74
Appendix A
Federal Inventory Data to Estimate Federal Water Use by Building Types
Appendix A ndash Federal Inventory Data to Estimate Federal Water Use by Building Types
To analyze water use in the Federal government it is important to understand which building types are the predominant water users in civilian and Department of Defense (DoD) facilities Federal inventory data was obtained from the General Service Administration 1999 Federal real property database [GSA 1999] This data is broken down by agency square footage and building type The building categories are as follows
bull Hospital medical clinics and hospitals bull Housing barracks and Federal housing bull Industrial process related facilities bull Office administrative buildings bull Other Institutional research oriented space with no laboratories bull Post Office postal facilities bull Prison detention and prisons bull RampD (Research and Development) laboratory bull School training facilities bull Service maintenance shops bull Storage warehouse bull All Other miscellaneous buildings that do not fit into the above categories
The predominant building types by square footage in DoD and civilian facilities based on the GSA real property data are shown below in Figures A1 and A2 Housing service and storage take up the most floor space in the DoD while offices hospitals and storage dominate civilian floor space
A1
All Other 14
School6
Office 9
17
Housing 32
Service 22
Storage
Figure A1 Breakout of DoD Square Footage by Building Category
All Other Service 13
5 Office
Storage 9
Industrial 42 6
Housing 6
RampD 8 Hospital
11
Figure A2 Breakout of Civilian Square Footage by Building Category
However water use is typically driven by how many people occupy a building and not by the square footage of a building Therefore it will be more accurate to base the Federal inventory by occupancy level instead of by floor space
The total occupancy of each facility category can be estimated by multiplying the total square footage (as stated above) by the occupancy density (occupantsqft) which is obtained from Facility Energy Decision System (FEDS) software [FEDS 2002] (Find occupancy density factors in Appendix B) It should be noted that not all of the facility
A2
categories in FEDS match perfectly with the facility categories provided in the Federal inventory Therefore the closest corresponding category was used (see Appendix D for details on building categories)
The estimated occupancy for each facility type was then multiplied by the associated Federal water use indices (WUI) The Federal WUI obtained from the American Water Works Association (AWWA) is an estimate of the typical daily water use per person in the units of gallons per person per day (gpd) [AWWA 1996] See Appendix B for a full explanation on how WUIs were chosen and estimated for each building type
By multiplying the occupancy of each facility type by the corresponding WUI a daily water use for each building type was estimated These values were used to estimate the predominant water using building categories for DoD and civilian facilities shown in the pie charts below These charts are significantly different than the previous pie charts showing a breakout of Federal floor space (by square footage) For DoD the top water users are housing schools and hospitals For civilian agencies the predominant water users are hospitals offices and prisons as shown in Figures A3 and A4
All OtherOffice 11
5 Housing RampD 37 12
10 Hospital
11School 14
Service
Figure A3 Breakout of DoD Daily Water Use by Building Category
A3
All Other 14
Industrial 6 34
RampD15
Prison 16
Hospital
Office 15
Figure A4 Breakout of Civilian Daily Water Use by Building Category
Appendix B shows the next steps of assumptions used in the analysis to further estimate the Federal water use by these Federal building types and end-use fixtures
A4
APPENDIX B
Federal Water Use Estimate Assumptions
Appendix B ndash Federal Water Use Estimate Assumptions
This appendix describes the assumptions used to estimate the Federal water consumption by building type and end-use described in Section 5 of this document
Water Use Indices
Federal water use indices (WUI) were used to estimate water use by building type in the Federal sector Table B1 below describes the WUI used in this assessment Some are found on the FEMP website at httpwwweereenergygovfemptechnologieswater_useindicescfm and the rest are based on FEMPrsquos WUI as explained below
Table B1 Federal Water Use Indices used in the Analysis
Building Type WUI ndash gallon per person per day
Data Source
Hospital 834 Adjusted from Federal WUI Office 150 Federal WUI Prison 120 Federal WUI RampD 80 PNNL Water Plan Industrial 80 Based on RampD WUI HousingBarracks 350 Federal WUI for dormitory School 167 Average of Federal School
WUI Service 150 Based on Federal Office
WUI Other Institutional 167 Based on Federal School
WUI Storage 100 Adjusted based on Federal
Office WUI Post Office 150 Based on Federal Office
WUI All Other 150 Based on Federal Office
WUI
The methodology below explains how WUI were estimated where no Federal WUI was provided for the given category or it was adjusted to provide a better estimate
B1
RampD The RampD WUI was estimated by using data from the Pacific Northwest National Laboratory Water Plan1 Individual laboratory facilities at PNNL are metered for water consumption and square footage and occupancy numbers are known for these facilities The WUI used in this analysis is based on the average WUI for these laboratory facilities
Industrial Because reliable data was not obtained for industrial facilities WUI it was assumed that RampD has a fairly similar use pattern with relatively low occupancy and intensive process water use
Hospital Hospital WUIs are provided in water use per bed and water use per employee The typical employee to patient ratio for hospitals is 6 to 1 [SEUI 2005] This is based on an average ratio of current mandated standards for nurse to patient ratios in hospitals that was found in the Service Employees International Union Website So this ratio was used to ldquoproraterdquo the WUI for patients and employees The WUI was also adjusted based on an 80 occupancy rate because it is based on the number of beds not patients So the WUI of 120 gallons per bed per day and the WUI of 10 per employee was adjusted to equal 83 gallons per occupant per day
Housing It is assumed that the majority of the housing for both civilian and DoD are predominantly barracks type facilities The WUI that best matched the barracks use pattern is assumed to be the Dormitory WUI
Service Post Office and All Other These categories are assumed to have a similar use pattern as the Office category
Storage Storage was adjusted to 10 gallons per person per day This was based on the Office WUI of 15 galpersonday but reduced because typically storage has decreased heating and cooling requirements and no irrigation
Occupancy
The occupancy densities which were used to calculate the daily water use of Federal buildings based on building type were obtained from the Facility Energy Decision System (FEDS) with the exception of prisons The FEDS building categories do not match exactly with the Federal inventory categories See Table D1 (in Appendix D) for an explanation of how the FEDS categories were matched to the Federal inventory categories
1 Also Chvala WD GP Sullivan and KL McMordie 2004 Water Management Plan for Pacific Northwest National Laboratory PNNL-Letter Report Pacific Northwest National Laboratory Richland Washington (not publicly available)
B2
The Federal occupancy densities do not have a category for prison nor does it have a category with a close fit Therefore occupancy of Federal prisons was obtained from a Bureau of Prisons document that provides the total number of Federal inmates in 2003 [Harrison and Beck 2004] Table B2 lists the occupancy densities for each building type
Table B2 Occupancy Densities for Building Categories
Building Type Occupancy Densities (occksf)
Hospital 52129 Office 31156 Prison 4600 RampD 31156 Industrial 17086 Housing 25216 School 103796 Service 24326 Other Institutional 103796 Storage 11726 Post Office 24326 All Other 31153
FEDS uses a typical number of occupants for individual building types Table B3 shows the occupied hours assumed for each building type Occupancy hours are necessary inputs for FEDS to model water consumption because the longer a person occupies a building the more times they will use the facilities
B3
Table B3 Building Occupancy Hours
Building Type Weekdays Saturdays Sundays Start End Start End Start End
CIVILIAN Office 700 1800 0 0 0 0 Health Care 0 2300 0 2300 0 2300 Public Order 0 2300 0 2300 0 2300 Education 700 1700 0 0 0 0 Single Family Attached Housing 1400 2300 700 2300 700 2300 Lodging 1500 2300 700 2300 700 2300 Warehouse Storage 600 1800 0 0 0 0 Other 600 1800 0 0 0 0 Mercantile and Service 800 2100 900 1600 0 0 Assembly 1100 2200 1400 2300 1400 2000
DOD Office 700 1800 0 0 0 0 Hospital 0 2300 0 2300 0 2300 Schools andor Training 700 1700 0 0 0 0 Duplex Federal housing 1400 2300 700 2300 700 2300 Barracks 1500 2300 700 2300 700 2300 Storage 600 1800 0 0 0 0 Production andor Process 600 1800 0 0 0 0 Exchange Facilities 800 2100 900 2000 0 0 Lab 700 1800 0 0 0 0 Morale Welfare and Recreation 1100 2200 1400 2300 1400 2000 Security 700 2100 700 2100 700 2100
End-Use Breakouts
The sources for end-use breakouts were obtained from Water Use and Conservation by Amy Vickers and A Water Conservation Guide for Commercial Institutional and Industrial Users developed by the New Mexico State Engineers Office [NMOSE 1999] However these two sources do not have the water use breakout for all facility types that are characterized in this analysis Also these end-use breakouts do not distribute the water use by technology but rather by generic category such as ldquorestroomrdquo use (instead of toilet urinal faucet and shower) Therefore some assumptions were made to help characterize Federal water use by end-use based on these two sources
B4
Office Office breakout is from the New Mexico Water Conservation guide [New Mexico Office of the State Engineer 1999] which breaks out the water use in the following manner
bull Restrooms 40 bull CoolingHeating 28 bull Landscape 22 bull Other 9 bull Kitchen 1
For the restroom category toilet urinal and faucet use was broken out by characterizing the typical use patterns for females and males in an office setting (Shower water use was assumed to be zero) Typically people use the restrooms three times per day women use toilets for all three uses and men use the urinal twice and toilet once [Vickers 2001] Both men and women wash their hands after each use and it is assumed that it takes 20 seconds for each hand washing This use pattern gives the following breakout of total restroom use assuming that there are 50 women and 50 men in the building
bull Toilets 61 bull Urinals 17 bull Faucets 22
These percentages were applied to the 40 restroom use to give the following breakout for each ldquooff the shelfrdquo technology for the office category
bull Toilets 24 bull Urinals 7 bull Faucets 9
Service and All Other The ldquoservicerdquo and ldquoall otherrdquo categories were assumed to have the use pattern similar to office buildings Therefore the same end-use breakouts were used for these types of buildings
Hospital End-use breakout for hospitals is from the New Mexico Water Conservation guide The split is the following
bull Restrooms 40 bull CoolingHeating 13 bull Laundry 10 bull Sterilizers 10 bull Kitchen 8 bull Other 8 bull X-ray 6 bull Landscape 5
B5
For the restroom category in Hospital building types toilet urinal showerhead and faucet use was broken out by characterizing the typical use patterns hospitals Patient ldquorestroomrdquo water use was estimated based on 51 toilet and faucet uses per day [Vickers 2001] and one shower per day Employee water use was estimated based on comparing the Federal WUI for hospital employees and patients Patient WUI is typically 120 gallons per patient per day For employees the typical WUI is 10 gallons per employee per day [AWWA 1996] So employee use is about 8 of the patient use This gives the following breakout for restroom fixtures
bull Toilets 49 bull Urinals 0 (very small water use for only male employees assuming that
patient rooms do not have urinals) bull Showers 41 bull Faucets 10
Housing It is assumed that the majority of the housing building type is barracks Therefore the end-use breakout for housing is estimated based on data from hotel and motel water use patterns because this more closely matches water use patterns in barracks than residential style housing The following split of water use for hotelsmotels is from A Water Conservation Guide for Commercial Institutional and Industrial Users prepared by the New Mexico Office of the State Engineer
bull Guestrooms 30 bull Kitchen 25 bull Laundry 20 bull CoolingHeating 15 bull Landscape 10
To split the guestroom water use by fixture end-use residential water use was obtained from the Handbook of Water Use and Conservation [Vickers 2001] This breakout shows water use by bathroom fixtures
bull Toilets 45 bull Showers 26 bull Faucets 26 bull Baths 3 (baths were not analyzed for this study because this is minimal and
not an area of efficiency improvements)
These percentages were multiplied by the guestroom percentage to get the breakout of water use for bathroom fixtures for housing
bull Toilets 13 bull Showers 8 bull Faucets 8
B6
School School breakout is assumed to have a similar use pattern as Office buildings Therefore the split is from the New Mexico Water Conservation guide The split is the following
bull Restrooms 40 bull CoolingHeating 28 bull Landscape 22 bull Other 9 bull Kitchen 1
The bathroom fixture usage is broken down accordingly as described for Office buildings
bull Toilets 24 bull Urinals 7 bull Faucets 9
Prison Prison end-use breakout was estimated based on the hospital end-use breakout because the operating hours are similar and there are other major water users (like kitchen among other processes) It was assumed that 40 of the water use in prisons is from bathroom fixtures ndash same as hospital use To further divide this restroom use by each fixture ndash it was assumed that inmates have the same use patterns as the general public of 51 restroom uses per day and one shower per day [Vickers 2001] There are an estimated number of 170000 inmates in Federal prisons and 7 of these are women [Harrison and Beck 2004] This percentage was used to estimate urinal use of the male inmates assuming male inmates have 4 urinals uses per day and 11 toilet uses per day The end-use split of the 40 restroom use is as follows
bull Toilets 7 bull Urinals 10 bull Showers 17 bull Faucets 6
RampD and Industrial Under the scope of this analysis there was no sound data found for RampD and Industrial type facility water use patterns Therefore restroom water use was estimated based on assuming that restroom use pattern among staff in an RampD and industrial facility will be the same as an office setting The total restroom use in an office facility based on information described above for Office WUI is 6 gallons per person per day (gpd) Therefore the percentage of restroom use in an RampD facility is 75 (6 gpd dived by 80 gpd) The restroom breakout for RampD is as follows
bull Toilets 5 bull Urinals 1 bull Faucets 2
B7
Penetration Rates of Existing Efficient Technology
The penetration rates in the Federal sector of existing efficient water using equipment was estimated based on a range of rates The penetration rates are based on field experience [Solana and McMordie 2004 Chvala et al 2004] 1 and life of the equipment The highest level of penetration of efficient technology in the Federal sector was based on the implementation of water using fixtures that meet EPAct flow rate standards shown in Table B4 below Many showerheads have been replaced with EPAct standard fixtures because the life of showerheads is generally 5 years Starting in about 1994 most showerheads were rated at 25 gpm Therefore the majority of existing showerheads have been replaced since 1994 For faucets it is very easy and inexpensive to retrofit faucets with low flow aerators Based on field experience it is assumed that the majority of faucet aerators meet the EPAct standard flow rate
EPAct standard 16 gpf toilets have been required since 1994 Toilets last about 20 years Therefore it is assumed that the majority of these fixtures have not been replaced and do not meet EPAct flush rates Urinals are easy to retrofit to use about 10 gpf by replacing the older higher consuming flush valve with a 10 gpf flush valve It is assumed that about half of all urinals have been replaced with a 10 gpf flush valve2
For high efficiency fixtures as described in Section 3 it is assumed that the penetration rate is very low This is because they are recent to the market and field experience verified the low penetration [Solana and McMordie 2004 Chvala et al 2004]1 Table B4 shows the penetration rates that were used in the analysis
Table B4 Penetration Rates of Efficient Fixtures in the Federal Government
Fixture EPACT Standard
FlowFlush Rate
Penetration Rate in Federal Sector
High Efficiency FlowFlush
Rate
Penetration Rate in Federal Sector
Toilets 16 gpf 20 10 gpf 0 Urinals 10 gpf 50 No-water
urinal 2
Showerheads 25 gpm 70 21 gpm 10 Faucets 22 gpm 70 05 gpm 10
1 Also Chvala WD GP Sullivan and KL McMordie 2004 Water Management Plan for Pacific Northwest National Laboratory PNNL-Letter Report Pacific Northwest National Laboratory Richland Washington (not publicly available)
2 Obtained information on penetration rate of urinals from personal communications with Mr Bill Slaughter Federal Account Representative with Falcon Water Free Urinals on January 12 2005
B8
APPENDIX C
Building Characteristics and Use Profile for Life-cycle Cost Analysis
Appendix C ndash Building Characteristics and Use Profile for Life-cycle Cost Analysis
To determine the LCC effectiveness of individual technologies an average Federal office building and barracks were modeled The building size and age were averaged from Federal inventory data and other building characteristics were obtained from Facility Energy Decision System (FEDS) software A female and male barracks were modeled separately because women and men have different water use patterns (women do not use urinals)
Water savings were calculated for each efficient off the shelf technology described in Section 3 in the main body of the report The assumptions used to estimate the water and energy savings are described below in the series of tables Table C1 describes the building characteristics ndash its size number of occupants gender split of the building and the number of occupied days for each building type
Table C1 Building Characteristics Office and Barracks
Building Type
Square Feet
Number of Occupants
Gender split
Occupied Days
Office 18889 46 50-50 260 Barracks 8180 165 Modeled
separately for male and female
365
Also the number of fixtures in each building was estimated to calculate the water and energy savings per fixture for the LCC analysis The number of fixtures shown in Table C2 are based on several different sources the Uniform Building Code [IAPMO 2003] on-site experience from water audits [Solana and McMordie 2004 Chvala et al 2004] 1 and information from the FEDS model The most appropriate fixture count was chosen based on careful consideration of all three sources
1 Also Chvala WD GP Sullivan and KL McMordie 2004 Water Management Plan for Pacific Northwest National Laboratory PNNL-Letter Report Pacific Northwest National Laboratory Richland Washington (not publicly available)
C1
Table C2 Fixture Count for Office and Barracks
Building Type Number of Female Toilets
Number of Male Toilets
Number of
Urinals
Number of Faucets
Number of Showers
Office 3 2 2 6 0 Barracks 4 3 2 8 3
Average use of fixtures in an office building was based on 3 restroom visits per day For barracks it was assumed that 5 days per week there were 21 restroom uses and 2 days per week there were 41 restrooms uses to average out to 267 uses per day [Vickers 2001] To calculate the water use for showerheads it was assumed that showers are 53 minutes long Typical hand washing after a toilet use was assumed to be 20 seconds Barracks water use assumed one face wash and 2 teeth brushings per person per day which last 30 seconds each Therefore the total faucet water use in barracks each day is approximately 238 minutes This data is shown in Table C3
Table C3 Water Use Pattern
Average Uses per Person per Day Building
Type Gender Toilets Urinals Faucets Showers
Office Female 3 0 3 0 Office Male 1 2 3 0 Barracks Female 267 0 238
min total
1
Barracks Male 1 167 238 min total
1
Source Vickers 2001
C2
APPENDIX D
Methodology Used to Estimate Federal Energy Use
Appendix D - Methodology Used to Estimate Federal Energy Use
Energy savings from reduced hot water use was calculated using the Facility Energy Decision System (FEDS) a building energy modeling tool [FEDS 2002] For the entire Federal sector varying flow rates for faucets and showerheads were modeled in FEDS to determine the amount of energy used (Other domestic hot water consumers dishwashers and clothes washers do not have retrofit options in FEDS) The Federal sector was represented by the GSA real property data [GSA 1999] which contains Federal building inventory floor space described above
FEDS calculates energy requirements to heat tap water based on the difference between the groundwater temperature and the desired hot water temperature The Federal inventory data was broken out by DOE Region enabling buildings to be modeled by region to account for groundwater temperature differences throughout different parts of the country
Federal buildings were also modeled according to building type in order to allow FEDS to make assumptions for water consumption fixture count and water heating equipment based on building type and size The building type categories in FEDS do not exactly correlate with the Federal inventory building categories Table D1 below shows which FEDS categories were used to represent the Federal categories These were chosen based on the most similar water use pattern of the particular building type which depends on occupancy numbers and hours
D1
Table D1 FEDS Building Types Used to Represent Federal Building Types
Federal Inventory Building Type FEDS Building Type CIVILIAN
Office Administration Post Office Mercantile and Service Hospital Health Care Prison Public Order School Education Other Institutional Education Housing Lodging Single Family Attached Storage Warehouse Storage Industrial Other Service Mercantile and Service RampD Office All Other Assembly
DOD Office Administration Post Office Exchange Facilities Hospital Hospital Prison Security School Schools andor Training Other Institutional Schools andor Training Housing Barracks Duplex Federal housing Storage Storage Industrial Production andor Process Service Exchange Facilities RampD Labs All Other Morale Welfare and Recreation
It was assumed that all water was heated using either electricity or natural gas Small percentages of water are heated using fuel oil propane gas or other fuels but these were assumed to be negligible for the purposes of this assessment Additionally many DoD sites use central systems to heat water which typically use natural gas or fuel oil to heat water to very high temperatures or to steam which then exchange heat with potable water for building use This is generally less efficient than standalone water heaters in each building therefore the projected savings in this assessment are conservative The amount of water assumed to be heated using electricity versus natural gas was based on Commercial Buildings Energy Consumption Survey 1999 (CBECS) [CBECS 2005] and Annual Energy Outlook 2003 (AEO) data [EIA 2005] Both of these sources are not Federal-specific Therefore adjustments were made to these values according to field experience specifically in the Federal sector The values used for this assessment according to building and fuel type are listed below in Table D2a The values gathered from CBECS and AEO are shown for comparison in Table D2b Please note that the
D2
data in Table D2b does not accurately represent the Federal sector electrical use is extremely low and so the values were adjusted appropriately for this analysis
Table D2a Percent of Fuel Use for Water Heating by Building Type used in the Analysis
Building Type Electricity Natural Gas Total with Hot Water
Education 49 49 98 Health Care 46 54 100 Lodging 47 53 100 Mercantile amp Service 55 40 95 Office 60 40 100 Warehouse 50 36 86 Other 45 41 86 All Others 50 50 100
Table D2b Percent of Fuel Use for Water Heating by Building Type from CBECS AEO
Building Type Electricity Natural Gas Total with Hot Water
Education 34 51 94 Health Care 36 54 100 Lodging 36 53 98 Mercantile amp Service 30 44 82 Office 33 50 91 Warehouse 24 36 67 Other 30 44 82 All Others 32 50 57
To determine the amount of annual Federal energy savings potential for a given retrofit fixture energy consumption was determined for a base case scenario as well as for each retrofit scenario The base case represented the average current flow rate in the Federal sector which was estimated at 275 gpm for both faucets and showerheads [Vickers 2001] Each retrofit scenario reduced this flow rate to represent a hypothetical situation where every fixture in the Federal sector was replaced with 25 or 20 gpm for showerheads and 22 10 or 05 gpm for faucets The difference in energy use between each of these scenarios and the base case approximates the total potential for energy savings in the Federal sector
D3
D4
APPENDIX E
Conservation Opportunities with Site-Specific Water Process
Appendix E - Conservation Opportunities with Site-Specific Water Process
E1 Cooling Towers
Cooling towers are often one of the largest water users for large office buildings hospitals and industrial-type facilities Water is lost in a cooling tower through evaporation bleed-off and drift As water is evaporated through the tower dissolved solids remain in the system and build up over time To maintain proper water quality the water must be purged through the ldquobleed-offrdquo Drift is water lost through large water droplets that are carried by wind Several technologies and techniques can be used to maintain proper water quality and reduce bleed-off These are briefly described below
bull Chemical Treatment sulfuric acid or absorbic acid adjusts the pH of the system limiting scale build-up thus reducing bleed-off
bull Side Stream Filtration filters out sediment and returns filtered water back to tower to reduce the amount of bleed-off needed
bull Copper Silver Ionization and Zeolite Media an alternative to chemical treatmentmdashcoppersilver ions kill bio-matter to reduce scale build-up and also act as seed crystals for the formation of scale (calcite) crystallization is completed in the zeolite media and backwashed out of system daily
bull Ozonation System an alternative to chemical treatmentmdashozone disinfects water supplies to reduce bleed-off (reduced chemical cost is an added benefit to the ozone method)
E2 Boilers and Steam Systems
Large Federal facilities often use boilers and steam systems in central plants hospitals large office buildings barracks research and development facilities and industrial and process plants The amount of water that is consumed by the system depends on the size and water quality and whether a condensate return is installed and maintained properly The following bullets briefly describe the techniques that can be used to save water in boilers and steam systems
bull Proper Maintenance Routinely inspect and maintain steam traps steam lines and condensate pumps
E1
bull Leak Detection and Repair Routinely inspect for leaks in condensate return line and steam lines
bull Condensate Return Properly maintain condensate return which recycles condensate for reuse in the system thus reducing water and chemical consumption and cost
bull Blow-down Minimize blow-down by maintaining adequate water quality through routine inspection and maintenance of boiler water and fire tubes (reducing scale build-up) continuous monitoring and skimming of the blow-down and automatic chemical treatment to control water quality of makeup water
bull Steam Tracers Shut off steam tracers in the summer (Steam tracers are used for freeze protection in the winter)
bull Boiler Efficiency and Size Replace boilers that are inefficient or over-sized to reduce water requirements
E3 Efficient Irrigation
Many Federal facilities have irrigated landscapemdashoffice buildings and hospitals usually have peripheral turf or landscaped beds and military bases commonly have recreation fields and golf courses These irrigated areas are often sources of large water consumption and are prime targets for efficiency measures Following is a list of typical technologies and techniques that can help to significantly decrease water irrigation consumption This is commonly undertaken through Xeriscapingtrade
The seven principles of Xeriscaping are
1 Appropriate Design Use a design that considers soil types and drainage limits turf area etc so that landscaping requires limited irrigation
2 Soil Improvements Apply appropriate nutrients to soil to help maintain healthy plants which results in more resilient and drought resistant plants
3 Reduced Turf Area Limit turf to areas for recreation purposes only
4 Mulching Beds Mulch reduces moisture evaporation off surface of beds and controls weed growth
5 Efficient Irrigation (also see retrofit options below)
E2
Early morning or late evening watering reduces evaporation Automatic irrigation controls Appropriate watering schedule to fit plant need and climate Deep watering less often Soil moisture sensor (tensiometer) or rain sensor connected to controls to
avoid over-watering
6 Climate-appropriate plants Native and other low-water-demand plants that are specifically geared for the particular region reduce both water requirements and maintenance
7 Maintenance
Proper maintenance and adjustments of sprinkler heads ensures appropriate watering
Routine inspection of irrigation system for leaks and broken heads Maintain weeds fertilize properly and prune as recommended
Efficient Irrigation Retrofit Options
bull Low-Volume Drip System Applies water at a constant rate directly to the root zone of the plant eliminating runoff and over-spray and limiting evaporation
bull Sub-Surface Drip System Delivers water to root zone of the plant through underground piping eliminating runoff over-spray evaporation and reducing maintenance requirements
bull Weather Based Irrigation System Control system that irrigates based on the evapotranspiration rate requirement of the landscape by downloading this information from a local weather station This type of system can be fine tuned to deliver the exact water needs of the plant
bull Reuse System Reuses water from other applications such as cooling tower bleed-off or other reclaimed water to irrigate recreational fields or golf courses (For example Fort Carson Army Base uses treated water from the sewer treatment plant to irrigate the Basersquos golf course)
E3
E4 Ozonated Laundering
Ozone acts as a biocide destroying bacteria by rupturing cell membranes In this way ozonated laundering systems act as a bleaching agent that disinfects fabric Ozonated laundering systems are most appropriate for applications where laundry does not get overly soiled and where disinfection is an important feature that is needed such as hospitals Also ozone laundering is appropriate for facilities that launder large amounts of towels and sheets such as barracks and other lodging type buildings
Key benefits to ozonated laundering are
bull Water Savings Ozone process requires no rinsing
bull Energy Savings Heated water is not required in the ozone process because cold water absorbs more ozone
bull Elimination of Detergent Ozone replaces the need for detergent (except in heavily soiled clothing where detergent is combined with ozone)
E5 Leak Detection and Repair
Water distribution systems often are huge sources of water loss especially in the case of military bases that have old (pre-1940s) systems Leaks often occur from loose joints or service connections in the system and corrosion splits and cracks along the piping wall Typically leak detection is done as part of a comprehensive water audit to help determine the source of unaccounted-for water consumption at the site Leak detection is often done by outside contractors because determining the exact location of a leak requires training and appropriate tools Sample leak detection technology includes listening devices (sonic for metal piping or ultrasonic for PVC piping) aerial thermal imaging and sub-floor water leak alarm systems
Some of the key benefits to regular system audits leak detection and repair programs are as follows
bull Reduced water loss
bull Lowered cost for high-quality water (pumping treating etc)
bull Reduced operating costs
bull Increased knowledge of the system
E4
bull Reduced legal liability and potential property damage caused by leaks thus lowering insurance costs
bull Safer and more reliable system (less likely to have contaminated water supply increased reliability of fire protection systems)
bull Better use of resources that ensure more reliable supply for the future
E6 Single-Pass Cooling
Single-pass or once-through cooling systems provide an opportunity for significant water savings In these systems water is circulated once through a piece of equipment and then disposed to drain By comparison to remove the same heat load single-pass systems use 40 times more water than a cooling tower operated at 5 cycles of concentration
Operations and Maintenance Improvements
bull Ensure that procedures are in place to turn off the water supply when the single-pass cooling equipment is not in operation Some equipment both old and new allows water to constantly run even when the equipment is turned off
bull Check entering and leaving water temperatures and flow rates to ensure they are within manufacturerrsquos recommendations For maximum water savings the flow rate should be near the minimum allowed by the manufacturer This can produce significant water savings
bull Balancing valves are sometimes not installed or they are not properly adjusted and left in the wide open position Once the valves are properly set they should be marked (or fixed) in position to avoid future adjustment
bull Ensure that all appropriate employees are trained in OampM procedures
RetrofitReplacement Options
bull Modify equipment to operate on a closed loop that recirculates the water instead of discharging it
bull When the opportunity arises replace the water-cooled equipment with more efficient air-cooled equipment
bull Find another use for single-pass effluent such as boiler make-up cooling tower make-up supply or landscape irrigation Savings for this reuse include both the associated water procurement costs as well as the sewer charges
E5
bull Be aware that some effluent may be contaminated (such as that coming from degreasers hydraulic equipment or cooling systems) and not fit for reuse Contaminated effluent should never be used in boilers because of the potential to hamper proper boiler operation
E6
APPENDIX F
Water and Sewer Historical Rate Data at DoD Sites
Appendix F - Water and Sewer Historical Rate Data at DoD Sites
A study of DoD rates [Fitzpatrick et al 1995] in the US Army Forces Command (FORSCOM) sites found combined water and sewer rates at 10 Army bases vary between a low of $0551000 gal to a high of $4341000 gal The study found the variance to be more a function of inconsistencies in rate calculation from site to site than in actual cost of water The weighted (by daily water consumption) average combined cost from these 10 FORSCOM sites is $1291000 gal Table F1 shows the findings of this study It should be noted that rates provided in this study are not current and further investigation into varying water rates among military installations should be examined because it greatly affects the cost-effectiveness of water efficiency technologies However this investigation is out of the scope of this report
Table F1 FORSCOM Average Water and Sewer Rates
Installation
Average Water Use
(million galday) Water Rates ($1000 gal)
Sewer Rates ($1000 gal)
Combined Water Sewer Rates
($1000 gal) Fort Bragg 606 $034 $021 $055 Fort Campbell 467 $043 $054 $097 Fort Carson 284 $182 $142 $324 Fort Dix 192 $181 $253 $434 Fort Drum 202 $034 $112 $147 Fort Hood 622 $027 $032 $059 Fort Lewis 601 $023 $045 $068 Fort Polk 502 $092 $091 $183 Fort Sam Houston 340 $034 $142 $176 Fort Stewart 311 $014 $044 $058 Weighted Average $055 $074 $129
F1
F2
Electronic Distribution
OFFSITE PNSO
Environmental Protection Agency B Edwards Attn John Flowers williamedwardspnlgov flowersjohnepagov
Pacific Northwest National Environmental Protection Agency LaboratoryAttn Stephanie Tanner
tannerstephanieepagov B Chvala J Dirks
Resource Wise D Elliott Attn Lonnie Burke A Nicholls lrburkewansnet G Parker
S Parker US Department of Energy W Sandusky Federal Energy Management Prog S Shankle Attn Joan Glickman R Skaggs joanglickmaneedoegov A Solana
G Sullivan US Department of Energy Federal Energy Management Prog Attn Tatiana Strajnic tatianastraijniceedoegov
Water Management Inc Attn Russ Horner
russ_hornerwatermgmtcom
Water Management Inc Attn Tom Horner
tom_hornerwatermgmtcom
Distr1
- Summary
- Acknowledgements
- Table of Contents
- 10 Introduction
- 20 Federal Legislation Rulings Intrpretations and Action Toward Water Conservation Goals
- 30 Appropriate Water Conservation Technologies Savings and Applications
- 40 Cost-Effectiveness of Implementing Water Conservation
- 50 Cost-Effective Savings Potential in the Federal Sector
- 60 Needs and Recommended Requirements for Successful Performance Contracting
- 70 References
- Appendix A
- Appendix B
- Appendix C
- Appendix D
- Appendix E
- Appendix F
-

DISCLAIMER
This report was prepared as an account of work sponsored by an agency of the United States Government Neither the United States Government nor any agency thereof nor Battelle Memorial Institute nor any of their employees makes any warranty express or implied or assumes any legal liability or responsibility for the accuracy completeness or usefulness of any information apparatus product or process disclosed or represents that its use would not infringe privately owned rights Reference herein to any specific commercial product process or service by trade name trademark manufacturer or otherwise does not necessarily constitute or imply its endorsement recommendation or favoring by the United States Government or any agency thereof or Battelle Memorial Institute The views and opinions of authors expressed herein do not necessarily state or reflect those of the United States Government or any agency thereof
PACIFIC NORTHWEST NATIONAL LABORATORY operated by BATTELLE
for the UNITED STATES DEPARTMENT OF ENERGY
under Contract DE-AC05-76RL01830
Printed in the United States of America
Available to DOE and DOE contractors from the Office of Scientific and Technical Information
PO Box 62 Oak Ridge TN 37831-0062ph (865) 576-8401 fax (865) 576-5728
email reportsadonisostigov
Available to the public from the National Technical Information Service US Department of Commerce 5285 Port Royal Rd Springfield VA 22161
ph (800) 553-6847 fax (703) 605-6900
email ordersntisfedworldgov online ordering httpwwwntisgovorderinghtm
This document was printed on recycled paper (800)
Update of Market Assessment for Capturing Water Conservation Opportunities in the Federal Sector
K L McMordie Stoughton A E Solana D B Elliott G P Sullivan G B Parker
August 2005
Prepared for the US Department of Energy Federal Energy Management Program under Contract DE-AC05-76RL01830
Pacific Northwest National Laboratory Richland Washington 99352
Summary
The Department of Energyrsquos (DOE) Federal Energy Management Program (FEMP) requested an update of the original market assessment done by Pacific Northwest National Laboratory (PNNL) in 2001 [Parker etal 2001] This original analysis evaluated water conservation opportunities and answered key questions necessary for FEMP to make recommendations on whether or not to proceed with strategies for water conservation primarily through the development of water conservation Energy Savings Performance Contracts The updatersquos intent is to reevaluate the cost-effective water savings potential in the Federal sector which incorporates new technologies and recent available data on Federal water use and also to make recommendations on strategies that will assist FEMP in developing a path forward to assist Federal agencies in effective water management
This updated assessment is based on a new analytical approach that utilizes newly available data and technologies The new approach fine-tunes the original assessment by using actual Federal water use which is now tracked by DOE (as compared to using estimated water use) Federal building inventory data is also used to disseminate water use by end-use technology in the Federal sector In addition this analysis also examines the current issues and obstacles that face performance contracting of water efficiency projects at Federal sites
A summary table of the cost-effective savings potential results of this updated evaluation is found below in Table S1 The following bullets are key findings and recommendations
Key Findings
bull The total life-cycle cost-effective water conservation potential today in the Federal sector assuming 100 penetration of efficient technology based on appropriate ldquooff the shelfrdquo1 domestic water technologies is estimated to be between 35 and 50 billion gallonsyear This represents approximately 17 to 24 of the total Federal water use The original analysis estimated this savings to be between 33 and 49 billion gallons annually or between 27 and 40 of the total Federal water use2
1 ldquoOff the shelfrdquo technologies analyzed in this assessment are toilets urinals faucets showerheads and clothes washers ndash these technologies are considered domestic water technologies (used by humans for sanitary purposes) easily purchased and installed and are non-engineered Engineered retrofit technologies (eg for process water use cooling towers steam systems and leak detection) are not analyzed in this assessment because of their site specific nature Please see Section 3 and Appendix E for a detailed description of these technologies 2 The large discrepancy between the percentage savings between the original and updated assessment is a result of the following 1) the original assessment used an underestimated Federal water use while the updated assessment uses actual Federal water use as reported by Federal agencies to the Department of Energy 2) the original assessment overestimated the percentage of water consumed by off-the-shelf fixtures while updated assessment revised these assumptions that resulted in more accurate estimates (See Section 1 for more information)
iii
bull A number of new ldquooff the shelfrdquo technologies have emerged on the market since the original assessment These include dual flush toilets 10 gallon per flush toilets 05 gallon per flush urinals hydro-powered sensored faucets and solar-powered sensored faucets These technologies were analyzed in this updated assessment For more information on each technology go to Section 3
bull Half of the total Federal water use is consumed by these ldquooff the shelfrdquo fixtures ndash or domestic water consuming equipment The remaining water consumption is used by engineered process water using equipment such as cooling towers steam systems and irrigation Typically these process oriented technologies are very site specific in nature therefore savings have a wide variance among sites These engineered technologies are not analyzed in this report but should not be discounted as large water savings opportunities in the Federal sector
bull Energy savings potential from reduction in hot water use in showers and faucets is estimated to be in the range of 602 to 1550 billion British thermal units (Btus)
bull If all these savings were captured under todayrsquos rates for water and energy savings the dollar savings potential would be between $166 and $236 million annually
bull The majority of the water conservation technology retrofits (domestic water fixtures) analyzed in this assessment are found to be life-cycle cost-effective at a combined marginal1 watersewer cost of about $41000 gallons or greater The measures that are not cost-effective at this rate are certain faucet and toilet options but only under certain scenarios ndash please see all results of the life-cycle cost (LCC) analysis in Section 4 in Tables 43 through 46
bull The energy savings from the hot-water-using fixtures (showers and faucets) drives the life-cycle cost-effectiveness such that in many cases water savings are not even necessary to render the retrofit cost-effective
bull Based on the draft fiscal year 2003 Report on Federal Agency Activities Under Executive Order 13123 little progress has been made towards the Executive Order 13123 water efficiency goals by Federal agencies Out of the 49000 Federal sites less than 4 have reported developing water management plans and less than 3 have reported implementing the required four FEMP Water Efficiency Best Management Practices2
1 Marginal cost of water and sewer is the volumetric charge for water and sewer only (typically expressed as cost per thousand gallons) and does not include fixed or flat charges such as meter charges or taxes 2 Information obtained from draft report US Department of Energy 2005 Report on Federal Agency Activities Under Executive Order 13123 Efficiency Energy Management Fiscal Year 2003 Draft Office of Energy Efficiency and Renewable Energy Washington DC
iv
bull Since 2000 total water use in the Federal government has decreased almost 5 [US DOE 2005] It is unclear whether this decrease in water use is the result of efficiency improvements reporting methodology or changes in staffing or building inventory Water is tracked by the Department of Energy in total million gallons consumed annually as reported by each Federal agency Because water is not tracked on a per unit basis like energy (on a Btu per square foot basis) it is difficult to truly measure how well the Federal government is performing in terms of water efficiency improvements It would be a better indicator of water consumption trends or metrics if water consumption were tracked ideally by population or building occupancy or more realistically by square footage rather than total gallons consumed
bull Although a considerable number of energy savings performance contract (ESPC) projects at Federal installations now include water conservation measures many opportunities for cost-effective water savings - particularly opportunities in engineered projects - are not being captured This is because most of the water projects are undertaken by water service providers through subcontracts to the energy service companies (ESCOs) and are focused on standard water-savings technology retrofits
bull The current industry standards for measurement and verification (MampV) for water measures as part of an ESPC were researched For basic water consuming fixtures (such as toilets urinals showers and faucets) water savings are typically stipulated where savings are determined based on calculated pre- and post-retrofit water consumption agreed to by the facility For water processes such as a cooling tower or single-pass cooling equipment MampV is typically based on short term pre- and post-retrofit field measurement of the specific equipment These are reasonable approaches to MampV for water efficiency retrofits given the dearth of building-level water meters and confidence and experience in technology performance
bull The institutional barriers and cost structure created by using water services as subcontractors to a performance contract tends to stifle innovation reduces the cost-effectiveness of some technologies minimizes the number of engineered projects and slows down the implementation process This results in considerable savings not captured A standalone water technology-specific performance contracting would virtually eliminate all of these issues and result in more cost-effective water and associated energy savings for the Federal sector
v
Table S1 Summary Results of the Range1 of Total Federal Annual Cost-Effective Savings
Federal Sector
Low End Water
Savings (million
gallonsyr)
High End Water
Savings (million
gallonsyr)
Low End Energy Savings (million Btuyr)
High End Energy Savings (million Btuyr)
Low End Total Cost Savings
($millionyr)
High End Total Cost Savings
($millionyr)
DoD 27595 37895 346495 1000549 $12328 $17093 Civilian Agencies 7796 12347 255174 549578 $4231 $6535 Grand Total 35391 50242 601669 1550128 $16559 $23628
Key Recommendations
The following are key recommendations uncovered during this analysis that will provide FEMP direction on developing an effective water program to help Federal agencies manage water resources more effectively
FEMP should
bull Reevaluate the water efficiency policies that are set in the Executive Order (EO) 13123 It is currently unclear whether the existing EO water efficiency goals are effectively motivating Federal sites to implement water savings measures and is properly tracking water consumption in the Federal sector These polices are expected to be reviewed in FY 2005 as stated in FEMPrsquos water efficiency website ldquoThe Department of Energy will review agencies progress in 2005 and may revise the water efficiency improvement goal at that timerdquo (httpwwweereenergygovfemptechnologieswater_goalscfm)
bull Update and revise water efficiency related documents and resources that are have become out of date these include website materials the section titled ldquoMampV for Water Projectsrdquo in the FEMPrsquos MampV Guidelines Measurement and Verification for Federal Energy Management Projects and energywater cost calculator for water consuming fixtures among other water related documents (httpwwweereenergygovfemptechnologieswater_efficiencycfm)
bull Consider partnering with other Federal agencies such as Environmental Protection Agency General Services Administration and Department of Defense to develop a broad and effective water efficiency program for Federal agencies FEMP could potentially act as the technical support arm of this partnership providing technical information such as ldquofact sheetsrdquo case studies and technical bulletins particularly
1 The savings presented in Table S1 represent a range of efficient technologies and penetration of these technologies in the Federal sector Find detailed information on the analysis in Section 4 and 5
vi
relevant to the Federal sector In addition this partnership could draw on and develop the link between energy and water efficiency to further raise FEMPrsquos visibility in a comprehensive program of water resource management
bull Consider developing a standalone water technology-specific performance contract as a solution to many of the barriers that are currently faced by the Federal sites implementing water efficiency projects Allowing water service companies to work directly with Federal customers as part of a performance contract would result in reduced costs and enhance innovation of water efficiency measures allowing more cost-effective water and energy savings
bull Provide support for and encourage the use of specific MampV plans for water measures in ESPCs Water efficiency measures have unique characteristics (compared to energy measures) and therefore require different verification methods The water service contractor performing the work should be engaged in this process by the ESCO With this approach the water services contractor will also share with the ESCO the responsibility for the savings guarantee
bull Consider developing a detailed examination of current Department of Defense (DoD) water and sewer rates This could provide important insight to cost-effectiveness of water efficiency projects for DoD sites that generate water on site Normally these sites undervalue water which makes producing cost-effective water projects difficult Ancillary savings such as energy operations and maintenance and chemical savings will most likely be the drivers for cost-effectiveness at these sites
bull Develop a component of the program focused on engineered-solutions to water efficiency These would target large water-using activities and may include demonstrations of technologies focused on leak detection steam systems cooling towers and irrigation systems Successful demonstrations would serve as case study material for further promotion across the Federal sector
vii
viii
Acknowledgements
The authors of this report would like to acknowledge the following people for their assistance in making this project possible Thanks to Joan Glickman of the Federal Energy Management Program for providing oversight for the analysis Thanks also to Bill Sandusky of Pacific Northwest National Laboratory for managerial oversight In addition thanks are warranted to a variety of industry experts too many to name for providing information and data that supported the analysis Lastly thanks goes to Sue Arey of Pacific Northwest National Laboratory for editorial review
ix
x
Contents
Summary iii
Acknowledgements ix
10 Introduction 11
20 Federal Legislation Rulings Interpretations and Action Toward Water Conservation Goals 21
21 Water Efficiency Goal Executive Order Update 21
22 Alternative Financing for Water Efficiency Projects 22
30 Appropriate Water Conservation Technologies Savings and Applications 31
31 Assessment Data 31
32 ldquoOff the Shelfrdquo Technologies 31
321 Toilets 32
322 Urinals 34
323 Showerheads 36
324 Faucets 37
325 Clothes Washers 310
33 Engineered Site-Specific Water Consuming Processes 311
40 Cost-Effectiveness of Implementing Water Conservation 41
41 Introduction to Life-Cycle Cost Analysis Methodology 41
42 Federal WaterSewer Rates 42
43 Federal Energy Rates 43
44 Life-Cycle Cost Analysis Results 44
50 Cost-Effective Savings Potential in the Federal Sector 51
xi
51 Water Consumption Estimates in the Federal Sector 51
52 Energy Consumption Estimates in the Federal Sector 53
54 Cost-Effective Savings Potential Results 54
60 Needs and Recommended Requirements for Successful Performance Contracting 61
61 Project Design 61
62 Project Implementation 63
63 Savings Verification 63
70 References 71
Appendix A ndash Federal Inventory Data to Estimate Federal Water Use by Building Types A1
Appendix B ndash Federal Water Use Estimate Assumptions B1
Appendix C ndash Building Characteristics and Use Profile for Life-cycle Cost Analysis C1
Appendix D ndash Methodology Used to Estimate Federal Energy Use D1
Appendix E ndash Conservation Opportunities with Site Specific Water Process E1
E1 Cooling Towers E1
E2 Boiler and Steam Systems E1
E3 Efficient Irrigation E2
E4 Ozonated Laundry E4
E5 Leak Detection and Repair E4
E6 Single-Pass Cooling E5
Appendix F ndash Water and Sewer Rate Historical Rate Data at DoD Sites F1
xii
Figures
Figure A1 Breakout of DoD Square Footage by Building Category A2
Figure A2 Breakout of Civilian Square Footage by Building Category A2
Figure A3 Breakout of DoD Daily Water Use by Building Category A3
Figure A4 Breakout of Civilian Daily Water Use by Building Category A4
xiii
Tables
Table S1 Summary Results of the Range of Federal Total Cost-Effective Savings vi
Table 31 Toilet Data Used in the Analysis 34
Table 32 Urinal Data Used in the Analysis 36
Table 33 Showerhead Data Used in the Analysis 37
Table 34 Faucet Data Used in the Analysis 39
Table 35 Clothes Washer Data Used in the Analysis 311
Table 41 Mean DoD and Civilian Marginal Water Rates 43
Table 42 Base Year Energy Rate for LCC Analysis 44
Table 43 Toilet and Urinal LCC Analysis Results 46
Table 44 Showerhead LCC Analysis Results 46
Table 45 Faucet LCC Analysis Results 47
Table 46 Clothes Washer LCC Analysis Results 48
Table 51 Total Water Use and Cost in the Federal Government 51
Table 52 Estimate Water Use for Off the Shelf Technologies in the Federal Government 52
Table 53 Estimated Energy Requirements for Domestic Hot Water in the Federal Sector 54
Table 54 LCC Effective Fixtures Used to Estimate Savings Potential 55
Table 55 Penetration Rates of Efficient Fixtures in the Federal Government 56
Table 56 Total Cost-Effective Range of Savings in the Federal Government 57
Table B1 Federal Water Use Indices used in the Analysis B1
Table B2 Occupancy Densities for Building Categories B3
xiv
Table B3 Building Occupancy Hours B4
Table B4 Penetration Rates of Efficient Fixtures in the Federal Government B8
Table C1 Building Characteristics Office and Barracks C1
Table C2 Fixture Count for Office and Barracks C2
Table C3 Water Use Pattern C2
Table D1 FEDS Building Types Used to Represent Federal Building Types D2
Table D2a Percent of Fuel Use for Water Heating by Building Type used in the Analysis D3
Table D2b Percent of Fuel Use for Water Heating by Building Type from CBECS AEO D3
Table F1 FORSCOM Average Water and Sewer Rates F1
xv
xvi
10 Introduction
In March 2001 Pacific Northwest National Laboratory (PNNL) performed a market assessment for the Federal Energy Management Program (FEMP) titled Market Assessment for Capturing Water Conservation Opportunities in the Federal Sector [Parker et al 2001] This assessment provided information to FEMP on whether there was a demand for a technology-specific water conservation performance contract Specifically the report identified the critical needs requirements and factors affecting successful implementation via an ESPC-type contract Also the analysis estimated the life-cycle cost-effectiveness of water-efficient technologies and also estimated the cost-effective potential for water savings in the Federal sector for domestic related water technologies (water consumed by humans for sanitary purposes) that are ldquooff the shelfrdquo fixtures (toilets urinals showerheads faucets and clothes washers)
FEMP requested that PNNL update this original assessment to reevaluate the cost-effective water savings potential in the Federal sector and the life-cycle cost-effectiveness of domestic fixtures The original analysis findings show that the life-cycle cost-effective water conservation potential in the Federal sector based on appropriate off the shelf technologies was estimated to be 33 to 49 billion gallons annually or between 27 and 40 of the total Federal water use The findings of this update show a potential Federal water savings of off the shelf technologies to range between 35 and 50 billion gallons annually or between 17 and 24 of the total Federal water use
The range in gallons saved is nearly the same between the original and updated analysis while the percent savings is quite different This is because the Federal water consumption used in the original analysis was significantly underestimated while the percentage of water used by the ldquooff the shelfrdquo water technologies was overestimated The original assessment used estimated Federal water use of about 122 billion gallons annually [Lombardo Associates 1997] while this assessment uses actual data on agency water use reported to the Department of Energy for fiscal year 2003 209 billion gallons annually [US DOE 2005] Savings calculations in the original assessment assumed that 80 of total water use was consumed by domestic fixtures while the updated assessment estimates this to be 51 based on the revised analysis (as described in Section 5)
The cost savings potential of the original analysis was estimated to be $132 to $196 million annually (if all savings were captured at the time of the original analysis at the average Federal watersewer cost of $41000 gallons) This represents water cost savings only (energy cost savings was not included in the original assessment) For the updated analysis a water cost savings between $152 and $216 million annually is estimated using an average combined watersewer cost for DoD and civilian agencies of $4251000 gallons and $4471000 gallons
11
respectively For the updated assessment the energy cost savings is estimated to range from $13 to $20 million For a complete description of these savings and costs see Sections 4 and 5
This updated assessment is based on a new analytical approach that utilizes newly available data and technologies This new approach fine-tunes the original assessment by estimating total water use by end-use technology in the Federal sector The assessment also analyzes two different settings office and barracks to determine the life-cycle cost-effectiveness of various technologies Office and barracks have different water use patterns for domestic fixtures therefore will have different life-cycle cost results
The differences between the original and updated analyses are as follows
bull New types of ldquooff the shelfrdquo equipment have emerged on the market since the original assessment which are included in this analysis
bull New price information is obtained for all technologies
bull Energy savings is included in the update and not incorporated into the original
bull Updated and more specific penetration rates of efficient technology in the Federal sector are used for this update
bull Annual water consumption data was obtained from the Department of Energy (DOE) The original analysis used an estimate of Federal water consumption
bull This updated assessment uses a new analytical approach that segregates water use between DoD and civilian agencies based on Federal inventory data and also further breaks water use down by end-use The original analysis did not break out water use to this level of detail
bull An updated Federal discount rate was used
12
20 Federal Legislation Rulings Interpretations and Action Toward Water Conservation Goals
21 Water Efficiency Goal Executive Order Overview
Executive Order 13123 encourages Federal agencies to reduce costs and implement cost-effective water efficiency improvements at Federal facilities [Executive Order 13123 1999] The Department of Energy provided guidance to assist each agency to determine a baseline water consumption for FY 2000 track water consumption by Federal agency and establish water conservation goals for Federal agencies as required by the EO The water conservation goal is not a numerical reduction but rather the development of a water management plan and implementation of at least four of the FEMP Water Efficiency Improvement Best Management Practices (BMPs) [FEMP Website 2005] The BMPs represent typical areas within the Federal government appropriate for efficiency improvements The ten BMPs are as follows
1 Public Information and Education
2 Distribution System Audits Leak Detection and Repair
3 Water Efficient Landscape
4 Toilets and Urinals
5 Faucets and Showerheads
6 BoilerSteam Systems
7 Single-Pass Cooling
8 Cooling Tower Systems
9 Miscellaneous High Water-Using Equipment
10 Water Reuse and Recycling
Find a full description of each BMP on the FEMP website at httpwwweereenergygovfemptechnologieswater_fedrequirecfm
As reported in the FY 2003 Report on Federal Agency Activities Under Executive Order 13123 the Federal government baseline water use (FY 2000) was 219114 million gallons As of FY 2003 the Federal government reported consuming 209055 million gallons This is an overall drop of 5 Because water is not tracked on a per unit basis like energy (Btu per square foot of building inventory) it is difficult to ascertain if this drop in water use is caused by efficiency improvements inventory or staffing changes
21
The draft FY 2003 Report on Federal Agency Activities Under Executive Order 13123 also reports there has been a total of 1669 water management plans developed and 1154 BMPs implemented at Federal sites 1 Progress towards the EO 13123 water efficiency goals has been very slight These numbers represent that only 34 of sites that are required to implement water management plans have done so and only 23 of the required BMPs have been implemented
22 Alternative Financing for Water Efficiency Projects
There are two main methods that Federal sites can utilize to obtain alternative financing for water projects ndash energy savings performance contracts (ESPCs) and utility energy service contracts (UESCs) UESCs can be used to implement water efficiency measures as part of the energy project These are typically contracted through an areawide agreement basic order agreement (BOA) or model agreement with the local servicing utility
There are two distinct types of ESPCs ndash the Department of Defense (DoD) ESPC and the DOE Super ESPC DoD services can achieve water efficiency goals by including water conservation projects as part of additional ESPC strategy offered through DoD Under DoD contracts the ESPC approach can and does include water (only) conservation projects Within its ESPC DoD also allows bundling of water conservation projects with energy conservation projects to achieve an overall payback that falls within ESPC contract parameters
Prior to October 2004 civilian agencies were not able to develop ESPC projects that were primarily driven by water conservation measures The DOE Super ESPC did not allow water efficiency projects because of a legal opinion rendered by the Assistant General Counsel for Procurement and Financial Assistance The opinion stated that water conservation projects can only be included in the DOE Super ESPC ldquohellip as long as the energy conservation or energy savings is the primary purpose of the contract reduction in costs attributable to water conservation may be included as part of energy savings for purposes of calculating the contractor payment where such water conservation savings are integral parts of the energy projectrdquo [Masterson 2000]2
However on October 28 2004 National Defense Authorization Act for Fiscal Year 2005 (Act) was signed into law extending the authority for Federal agencies to use the DOE Super ESPC contracts until September 30 2006 Included in this provision is language that now allows
1 Information obtained from draft report US Department of Energy 2005 Report on Federal Agency Activities Under Executive Order 13123 Efficiency Energy Management Fiscal Year 2003 Draft Office of Energy Efficiency and Renewable Energy Washington DC 2 Masterson MA Assistance General Counsel for Procurement and Financial Assistance US Department of Energy to James J Cavanagh Director Office of Headquarters Procurement Services February 11 2000
22
projects that are dominated by water conservation measures The Act establishes that water projects can be performed as a standalone project as stated in the Act ldquoa water conservation measure that improves the efficiency of water use is life-cycle cost-effective and involves water conservation water recycling or reuse more efficient treatment of waste water or storm water improvements in operation or maintenance efficiencies retrofit activities or other related activities not at a Federal hydroelectric facilityrdquo [httpwwweereenergygovfempnewseventsdetailcfmnews_id=8301]
It is fortunate and beneficial to have these contracts in place but many suggested improvements in the ESPC contracting approach could be made as detailed in Section 6
23
24
30 Appropriate Water Conservation Technologies Savings and Applications
This updatersquos intent includes reevaluation of ldquooff the shelfrdquo technologiesrsquo life-cycle cost-effectiveness The off the shelf technologies or domestic water consuming fixtures that are assessed are toilets urinals showerheads faucets and clothes washers The data used in the assessment for each fixture is described in this section
It should be noted that kitchen water use is not examined in the analysis including dishwashers1 and faucet use Kitchen faucet water use is very site specific difficult to estimate and is commonly ldquovolume drivenrdquo (used for filling pots) instead of flow rate driven There is significant opportunity for water and energy savings in kitchens from efficiency improvements in rinsing and dishwashing but this is not examined in this update
In addition engineered technologies applicable to water use such as cooling towers steam systems irrigation and leak detection may also present significant water savings opportunities in the Federal sector These technologies are generally site-specific and their application can result in significant cost-effective water savings However because of their site-specific nature the potential savings are not easily quantified and thus are not included in this determination of water saving potential in the Federal sector Thus the savings potential determined below is conservative significantly more water savings could be achieved by incorporating site-specificprocess-oriented technologies Please find information on these process water uses and efficiency improvements at the end of this section and in Appendix E
31 Assessment Data
The information provided below describes the technologies analyzed in this assessment and provides data that was used to calculate the life-cycle cost-effectiveness of the different fixture options This data includes
bull Fixture cost bull Installation cost bull Operation and maintenance (OampM) costs different from normal operations
Fixture cost data comes primarily from the General Services Administration (GSA) Advantage (found at wwwgsaadvantagegov) The GSA Advantage is a centralized on-line catalog of supplies by which Federal government facilities can purchase goods and services Included in the GSA Advantage are many of the plumbing fixtures analyzed in this assessment
1 Energy use for hot water use in dishwashers is estimated in this analysis The software tool utilized estimates hot water use for showers faucets dishwashers and clothes washers Go to Section 52 for a detailed explanation
31
When fixtures were not available on the GSA Advantage wholesale or bulk purchase prices were obtained directly from the manufacturer
Also included for each fixture is the estimated cost to install the piece of equipment Multiplying the time it takes to install the equipment by the hourly rate for a plumber results in the installation cost A typical plumberrsquos hourly rate is $43 which is obtained from RS Means Residential Cost Data for 2003 [Reed Construction Data 2004] The installation time was obtained by inquiring two different sources on typical installation times of these fixtures1
Operations and maintenance costs were also researched for each type of fixture For the majority of the fixtures there are no significant differences in the operations and maintenance The only exception to this is with battery-powered sensored faucets which require periodic battery changes
32 ldquoOff the Shelfrdquo Technologies
The following section describes each off the shelf technology that is analyzed in this assessment General information is provided on the standard technology available on the market high efficiency versions fixture cost installation cost and operation and maintenance information
321 Toilets
Toilets are typically the largest water consumer of indoor water use at most facilities [Vickers 2001] The Energy Policy Act (EPAct) of 1992 mandated that all toilets meet or exceed the standard of 16 gallons per flush (gpf) Technologies have since emerged on the market that have lower flush rates than this EPAct requirement and are also examined in this analysis
The basic types of toilets available on the market are tank toilets typical in residential and light commercial applications and flush valve toilets typically found in commercial applications An option for increasing efficiency of an existing toilet at a lower cost is a flush valve retrofit kit This entails replacing the older valve with a high efficiency valve (not replacing the entire plumbing of the unit) and replacing the toilet bowl This option is available on the GSA Advantage
Another style of toilet on the market is a pressure-assisted toilet which contains a chamber inside of the toilet tank that traps air Once the chamber begins to fill with water the trapped air becomes compressed stored as ldquopotential energyrdquo When the toilet is flushed the compressed air pushes out the water at a very high velocity providing a powerful flush and very good
1 Obtained information on installation time from personal communications with Mr Andrew Perrin Water Engineer of H2O Applied Technologies in January and February 2005 and Mr Lonnie Burke Water Conservation Specialist and Master Plumber with Resource Wise on January 13 2005
32
flushing performance This high velocity water in pressure-assisted toilets creates a louder flush than traditional tank toilets They may not be suitable for residential settings but are acceptable for commercial buildings and barracks A 10 gpf pressure-assisted toilet is now available on the market
In addition there is a relatively new type of tank toilet called a dual flush toilet This toilet provides two flushing options a full flush at 16 gpf and a partial flush option which ranges from 08 gpf to 10 gpf depending on the brand There are two brands that were analyzed Caromatrade and Mansfield EcoQuantumtrade The results from the analysis for these two toilets are averaged It should be noted that the dual flush toilet in this analysis is only analyzed for womenrsquos use Dual flush toilets would not be practical in a menrsquos restroom because in the Federal setting men typically use urinals
Table 31 summarizes the toilets that were studied in the analysis along with the cost information used in the life-cycle cost analysis presented in Section 4 of this document For installation costs it typically takes about 1 hour to install any type of toilet totaling $43 per installation [Reed Construction Data 2004] Also there are no major differences in operations and maintenance between these efficient toilets compared with older toilets1 For existing flush rates of toilets this analysis considers 35 gallons per flush typical This is because in 1980 all toilets were required not to exceed 35 gallons per flush Because toilets have on average about a 20-year life1 it is assumed that most toilets have been retrofitted at least once since 1980 This assumption is considered conservative
1 Obtained information on maintenance costs and typical toilet life through personal communications with Mr Lonnie Burke Water Conservation Specialist and Master Plumber with Resource Wise on January 13 2005
33
Table 31 Toilet Data Used in the Analysis
Toilet Type Flush Rate (gpf)
Water Savings Potential per
use Fixture Cost Cost Data Source
Gravity Fed Tank 16 54 $225 Average of typical price from GSA Advantage
Pressure-Assist 16 54 $265 Average of typical price from GSA Advantage
Pressure-Assist 10 71 $300 Wholesale price from manufacturer [Mansfield 2005]
Flush Valve 16 54 $180 Average of typical price from GSA Advantage
Flush Valve Retrofit Kit 16 54 $127
Average of typical price from GSA Advantage (includes cost of bowl)
Dual Flush
Range 12 ndash 14 (average use) [Koeller
2003 and Veritec 2002]
60 - 64 $200 - $246
Wholesale price from manufacturers1
[Mansfield 2005]
322 Urinals
Urinals are typically only used in commercial applications Similar to toilets all current urinals must meet the EPAct 1992 standards of not exceeding 10 gpf There are two basic types of urinals flush valve toilets and no-water urinals ndashurinals that do not have a flushing system and therefore use no water For flush valve urinals there are 10 gpf and 05 gpf models on the market The 05 gpf flush is relatively new The no-water urinal was analyzed in the original market assessment however there are new brands that are now available and are considered in this analysis
1 Obtained typical cost range for Caroma dual flush toilet through personal communications with Mr John Karas Business Development Manager of Caroma USA Inc on January 18 2005
34
The no-water urinal is distinctly different from the flush valve urinal As the name implies no-water urinals do not use water for flushing These urinals use a trap in the drain that contains a sealing liquid that is less dense than urine This liquid floats on top of any urine in the trap sealing the trap and preventing sewer vapors from escaping back into the restroom Urine passes through the sealing liquid in the trap and into the drain line
There are currently three major models of the no-water urinals on the market available to the Federal government the Falcon Waterfreetrade urinal the Waterless No-Flushtrade urinal and from a European company the Uridanreg Non-Water Urinal No-water urinals come in different sizes and styles made with high-tech composites and fiberglass or traditional porcelain The Waterfree and Waterless urinals have removable traps while the Uridan uses a permanent trap
For this analysis maintenance of no-water urinals was investigated through a variety of sources because maintenance costs are different than flush valve urinals1 [Uridan 2005 Waterless 2005 McMordie Stoughton and Chvala 2004] No-water urinals have no valves to repair or replace but do have other routine maintenance tasks The sealant must be replaced in all no-water brands For the Waterless and Falcon Waterfree urinals traps need to be periodically replaced There are other maintenance differences that are very hard to quantify Some evidence points to maintenance savings with no-water urinals because there is a decrease in sewer line calcification Other evidence points to the opposite that no-water urinals can possibly cause line stoppage So after careful consideration and research operation and maintenance costs of urinals is not considered in the analysis because reliable data on cost differences between flush urinals and no-water urinals was not obtained
Installation time for replacing a flush valve urinal is typically about 1 hour2 No-water urinals can take longer because some adjustments are necessary to get the urinal to mount on the wall properly Therefore an installation time of 15 hours was used in the analysis2 For existing flush rates of urinals 15 gallons per flush is considered typical for this analysis as a conservative assumption This is because in 1980 all urinals were required not to exceed 15 gallons per flush Because urinals like toilets have on average about a 20 year life3 it is assumed that most urinals have been retrofitted since 1980
The table below summarizes the data on urinals that was used in the analysis
1 Obtained information on maintenance of flush urinals and no-water urinals through personal communications with three sources Mr Lonnie Burke Water Conservation Specialist and Master Plumber with Resource Wise on January 13 2005 Mr Bill Slaughter Federal Account Representative with Falcon Water Free Urinals on January 12 2005 and Mr Joe Romero with Uridan-USA Division of GDK International Inc on January 28 2005 2 Obtained information on installation time for flush urinals and no-water urinals from Mr Bill Slaughter Federal Account Representative with Falcon Water Free Urinals on January 12 2005 3 Obtained information on typical urinal life through personal communications with Mr Lonnie Burke Water Conservation Specialist and Master Plumber with Resource Wise on January 13 2005
35
Table 32 Urinal Data Used in the Analysis
Urinal TypeBrand
Flush Rate (gpf)
Water Savings Potential per
use
Estimated Cost per Fixture
Cost Data Source
Flush Valve 10 33 $125
Average of typical price from GSA Advantage
Flush Valve 05 67 $125
Average of typical price from GSA Advantage
Falcon Waterfree 0 100 $186 - $235
GSA Advantage GS-07F-0294L
Uridan 0 100 $395 Wholesale price from manufacturer1
Waterless 0 100 $393 - $429
GSA Advantage GS-O7F-0124J
323 Showerheads
Showers are typically used in Federal facilities in housing barracks hospitals and prisons The current maximum flow rate for showerheads set by EPAct is 25 gallons per minute (gpm) at a pressure of 80 pounds per square inch (psi) There are showerheads that go below this flow rate However for this analysis the two types of showerheads analyzed are 25 gpm and 20 gpm (Find information on energy use for showerheads in Section 4)
1 Obtained information on typical Uridan costs from Mr Joe Romero with Uridan-USA Division of GDK International Inc on January 28 2005
36
Installation time for replacing a typical showerhead is considered to be about 15 minutes1 There are no major operation and maintenance differences between the efficient fixtures and existing fixtures The typical existing flow rate of showerheads was estimated to be approximately 275 gallons per minute for the purposes of this analysis This is based on water audits performed [Solana and McMordie 2004 Chvala et al 2004] 2 and the Handbook of Water Conservation [Vickers 2001] Information that was used in the analysis for showerheads is in the table below
Table 33 Showerhead Data Used in the Analysis
Showerhead Flow Rate (gpm)
Savings Potential per
use
Estimated Cost per Fixture
Cost Data Source
Standard EPAct Low
Flow Showerhead
25 9 $11
Average of typical price from GSA Advantage
High Efficiency
Showerhead 20 24 $11
Average of typical price from GSA Advantage
324 Faucets
Faucets are required to have a flow rate that does not exceed 22 gpm (at 60 psi) under the EPAct requirements High efficiency faucets range from about 10 gpm to 05 gpm both of which are considered in the assessment Faucets that were analyzed for this report are for domestic use only hand washing after restroom use and general hygiene (face washing and teeth brushing) Kitchen use was not analyzed The types of faucets evaluated in this analysis are described below
1 Obtained information on showerhead installation time from Mr Andrew Perrin Water Engineer with H2O Applied Technologies on January and February of 2005 2 Also Chvala WD GP Sullivan and KL McMordie 2004 Water Management Plan for Pacific Northwest National Laboratory PNNL-Letter Report Pacific Northwest National Laboratory Richland Washington (not publicly available)
37
bull Low flow faucet aerator Retrofit of an existing faucet with a low flow faucet aerator An EPAct standard aerator (22 gpm) and a high efficiency aerator (10 gpm) were analyzed
bull Pedal activated faucet Retrofit to an existing faucet that allows the faucet to be turned on and off with a foot pedal This was analyzed for the standard (22 gpm) and high efficiency aerators (10 gpm) because this is a retrofit of an existing faucet not a replacement of the entire unit
bull Self closing faucet Replacement of an existing faucet with a faucet that automatically shuts off after valve is compressed Both single and double self closing faucets were analyzed It was found that typically self closing faucets come at the EPAct standard flow rate of 22 gpm
bull Sensored faucet Replacement of an existing faucet with a faucet that is operated by a sensor ndash either electronic or infrared ndash that turns on and off automatically when a person approaches the faucet A battery-operated and hard-wired version of this faucet was included in the analysis It was found that sensored faucets typically are standard at 05 gpm
bull Hydro-powered sensored faucet Replacement of an existing faucet with a sensored faucet that is operated by a battery that is charged by a hydro-powered generator The battery is charged from each use ndash flowing supply water causes a turbine to spin that creates a current which is stored in the rechargeable battery The battery is charged in as little as five uses per day so it is considered applicable for most Federal applications This faucet comes standard at 11 gpm (Find more information at httpwwwtotousacomtotopagecontentviewasppageid=56ampshowimage=eco )
bull Solar- powered sensored faucet Replacement of an existing faucet by a sensored faucet that is powered by a small solar panel which turns any ambient light source into electricity (similar to the way a solar-powered calculator works) This electricity is used to operate an infrared sensor which automatically controls the faucet This faucet comes standard at 05 gpm
As described above both manual and automatic faucets were analyzed Because the water automatically shuts off with automatic and sensored faucets there is additional water and energy savings associated with reduced time the faucet is on The typical savings from these automatic faucets is about 20 compared to traditional manual faucets [USGBC 2003] This reduction was used in estimating the water and energy savings of the pedal activated self closing and sensored faucets Typically the operations and maintenance between the different types of faucets are similar The only faucet that was found to have additional maintenance requirements was the battery-operated sensor faucet because the battery must be replaced approximately every 2 years [Sloan Valve 2005] The increased annual maintenance cost of the battery-operated sensored faucet was estimated at $1119 (This is based on an estimated labor time of 10 minutes labor cost of $43hour and a battery cost of $15)
38
The typical existing flow rate of faucets was estimated to be approximately 275 gallons per minute for the purposes of this analysis This is based on water audits performed [Solana and McMordie 2004 Chvala et al 20041 and the Handbook of Water Conservation [Vickers 2001] (Find information on energy use in faucets in Section 4)
Table 34 describes the data that was used in the analysis to estimate the life-cycle cost-effectiveness of these faucets The flow rates are based on the standard flow rate that was available for the particular type of faucet Because labor time varies among these different faucets a column was added to this table to detail this information
Table 34 Faucet Data Used in the Analysis
Faucet Flow Rate (gpm)
Savings Potential per
use
Estimated Cost per Fixture
Estimated Installation Labor Time
(min)
Cost Data Source
Standard EPAct Low Flow Aerator Retrofit
22 20 $320 5 Average of typical price from GSA Advantage
High Efficiency Low Flow Aerator Retrofit
10 64
$320 5 Average of typical price from GSA Advantage
Pedal Activated Retrofit
22 and 10 36 - 71
138 60 Average of typical price from GSA Advantage
Self Closing ndash Single Replacement
22 36
$7150 60 Average of typical price from GSA Advantage
Self Closing ndash Double Replacement
22 36
$17350 60 Average of typical price from GSA Advantage
1 Also Chvala WD GP Sullivan and KL McMordie 2004 Water Management Plan for Pacific Northwest National Laboratory PNNL-Letter Report Pacific Northwest National Laboratory Richland Washington (not publicly available)
39
Table 34 Faucet Data Used in the Analysis (cont)
Faucet Flow Rate (gpm)
Savings Potential per
use
Estimated Cost per Fixture
Estimated Installation Labor Time
(min)
Cost Data Source
Sensored ndash Battery-operated Replacement
05 85
$248 60
Average of typical price from GSA Advantage
Sensored ndash Hard Wired Replacement
05 85
$248 120 Average of typical price from GSA Advantage
Hydro-Powered Sensored Replacement
11 71
$500 90
Wholesale price from manufacturer [Toto USA 2005]
Solar-Powered Sensored Replacement
05 85
$475 90
Wholesale price from manufacturer [Sloan Valve 2005]
325 Clothes Washers
The clothes washers in this study are a commercial-quality soft-mount family-sized high performance Energy Star clothes washers (see httpwwwenergystargovindexcfmfuseaction=clotheswashdisplay_commercial_cw) These washers save considerable water and energy over standard family-sized soft-mount commercial washers Because most of a clothes washerrsquos energy use is tied to hot water use any savings in hot water translates to energy savings Additional energy savings are reported as a result of higher-efficiency motors and the high spin speeds achieved in the H-axis designs
The assessment only examines retrofits of high performance washers for DoD barracks There are other Federal applications for laundry in hospitals and prisons however these equipment are considered large process water use which is not appropriate for soft-mount family-size high performance washer retrofits
The typical existing clothes washer in a barracks setting at a DoD installation is estimated to consume 38 gallons per cycle while high performance washers use typically ~15 gallons per cycle saving 61 of laundry water consumption Typically a clothes washer can be replaced in about 1 hour There are no operations and maintenance savings between these two types of washers Table 35 provides the data used in the LCC analysis for clothes washers
310
Table 35 Clothes Washer Data Used in the Analysis
Clothes Washer
Water Consumption
per cycle (Gallons)
Savings Water
Potential per Cycle
Estimated Installed Cost per Fixture
Cost Data Source
High Performance 15 61 $1500 [Sullivan et
al 2004]
33 Engineered Site-Specific Water Processes and Equipment
There are significant water savings opportunities from equipment and processes beyond the ldquooff the shelfrdquo technologies that are being examined in this assessment These engineered solutions are significant water users in the Federal sector and offer large water efficiency improvements Typically these technologies are site-specific in nature therefore savings have a wide variance among sites These engineered technologies are not analyzed in this report but should not be discounted as large water savings opportunities in the Federal sector These technologies can be applied to
bull Cooling towers
bull Boiler and steam systems
bull Irrigation
bull Industrial laundry
bull Leak detection and repair
bull Single-pass cooling
A description of each technology and efficiency opportunities is included in Appendix E of this report
311
312
40 Cost-Effectiveness of Implementing Water Conservation
A life-cycle cost (LCC) analysis was used to determine the cost-effectiveness of implementing the ldquooff the shelfrdquo technologies described in Section 3 at Federal facilities This LCC analysis is consistent with the methodology outlined in the National Institute of Standards and Technology Manual 135 Life-Cycle Costing Manual for the Federal Energy Management Program [Fuller and Peterson 1995] The results of the LCC analysis were used in two ways 1) determined which fixtures were LCC effective and most appropriate for Federal applications and 2) determined the total cost-effective savings potential in the Federal government (see Section 5)
It should be noted that while engineered solutions (ie efficiency measures designed for a specific application or water-using process at a specific site) are acknowledged to hold significant potential for water savings in the Federal sector their site-specific nature makes it difficult to analyze and quantify savings Therefore these were excluded from this analysis
41 Introduction to Life-Cycle Cost Analysis Methodology
To determine at what marginal watersewer rate the fixtures become LCC effective the positive net present value (NPV) was calculated NPV is the total net discounted dollar savings of owning operating and maintaining one piece of equipment as compared to another So the LCC results show at what marginal watersewer rate the fixture becomes economical to replace the fixture as compared to existing equipment This information is helpful because it can point to which technologies have the best opportunities for application in Federal facilities The results of the LCC analysis are presented in the tables at the end of this section
The LCC analysis assesses two different water use scenarios ndash water use patterns for office and barracks This is because ldquooff the shelfrdquo fixtures in the Federal sector typically match an office setting or barracks setting In other words people typically use domestic fixtures at work and at their place of residence It is considered that civilian agencies typically only use water in the office setting while DoD services use water both in the office and the barracks setting DoD also has family housing which closely matches the barracks use pattern with the exception of urinal use
To do the LCC analysis an estimate of the installed and operations and maintenance costs of the water conservation technologies were developed along with the annual water and energy consumption of the existing and replacement equipment as described in Section 3 With that information and with assumptions on the remaining life of the current technology and the current discount rate the cost-effectiveness range of watersewer rates was determined The primary assumptions used in the LCC analysis are shown in the following list For a full description of the assumptions used in the LCC analysis see Appendices C and D
41
bull Typical water use for office and barracks scenarios were modeled using the Facility Energy Decision System (see methodology in Appendices C and D) for all ldquooff the shelfrdquo fixtures described in Section 3
bull Replacement of fixtures are assumed to be installed immediately
bull Federal real discount rate of 30 is used [Schultz et al 2004]
bull Existing technologies are assumed to have a 50 remaining life This assumes a normal distribution of building and equipment ages across the entire Federal sector
bull The cost of replacing the equipment is annualized over the life of the replacement
bull The LCC analysis determines at which combined marginal watersewer rate the fixture has a positive NPV
bull Future water and sewer rates are not escalated
bull Future energy rates are escalated
The rest of this section details the data that was used in the LCC analysis and the detailed results are shown in the tables at the end of this section
42 Federal WaterSewer Rates
The average Federal marginal water and sewer rates for both DoD and civilian agencies were determined so that the LCC results could be compared against these average marginal Federal rates The cost-effective combined water and sewer cost for each fixture can be compared to the average rates in the Federal sector to determine if the technology is cost-effective at Federal sites for both DoD and civilian
Actual water rates across the Federal sector vary widely and the variance is heavily influenced by whether water is purchased (most likely from a municipal supplier) or generated on site (common for DoD installations) Water rates are also influenced by geographic location and agency contracting mechanism To estimate the typical marginal cost of water in the Federal government the Raftelis 2002 Water and Wastewater Rate Survey was used [Raftelis 2004] This water rate survey is a detailed investigation of water and sewer rates from water utilities across the continental US serving both Federal and non-Federal sites The water rate survey collected and analyzed data on residential commercial and industrial customers for varying meter sizes including the marginal and fixed costs for water and sewer This survey is a comprehensive examination of water and sewer rates across the Continental US so it is considered a good representation of typical water rates that Federal facilities incur if water is
42
purchased from a local municipality1 It is assumed that civilian agencies are typically charged commercial water and sewer rates by the serving municipalities and DoD installations are typically charged industrial water and sewer rates by the serving municipalities
All data collected in the Raftelis Water and Wastewater Rate Survey for commercial marginal rates (the water costs that only represent the volumetric charge for water and not fixed costs and fees) were averaged which represents a mean watersewer rate for civilian sites All data collected in the water rate survey was also averaged for industrial marginal rates to represent the mean water rate for DoD installations
Table 41 shows the marginal water and sewer rates that are considered average for the Federal government
Table 41 Mean DoD and Civilian Marginal Water Rates
Sector 2003 Marginal Water Cost
($1000 gallons)
2003 Marginal Sewer Cost
($1000 gallons)
2003 Marginal Total Water Cost ($1000 gallons)
DoD $179 $246 $425 Civilian $193 $254 $447
It should be noted that a significant number of DoD installations do not purchase water from a local municipality and pump and treat water on-site Where this is the case the cost of water may be significantly lower than the average marginal industrial rate that is reported in the Raftelis survey described above This is because DoD installations that produce and treat their own water typically estimate water costs based on pumping treatment and chemical costs only excluding capital amortization and labor costs in rate calculation [Lombardo 1997] A detailed examination of current DoD watersewer rates was not performed for this updated analysis (significant effort is required and therefore it was beyond the scope of this assessment) More information on actual DoD rates could provide important insight to cost-effectiveness of water efficiency projects for DoD Historical water rate information on a select number of Army sites can be found in Appendix F
43 Federal Energy Rates
For base year energy prices the LCC analysis used 2004 national average energy rates obtained from a file ENCOST04TXT created in support of the document Energy Price Indices and Discount Factors for Life-Cycle Cost Analysis ndash April 2004 [Schultz et al 2004] While these EIA-based average rates were not Federal-specific industrial prices were used as a proxy for prices paid by DoD and commercial prices for those borne by the rest of the Federal sector
1 Federal water rates outside the US were not investigated
43
Prices for subsequent years in the analysis period were escalated using fuel and sector-specific escalation rates provided in the same document
While marginal rates are preferable for an LCC analysis such national-level estimates for the Federal sector are not easily obtained In the case of commercial and industrial rates the impacts of using average rates as a proxy may be relatively minimal because fixed costs may represent a relatively small portion of the total energy bill To provide the option of a truly conservative view of the savings potential of the analyzed equipment the LCC results are presented both with and without energy savings Table 42 provides the energy rates for electricity and natural gas for civilian and DoD
Table 42 Base Year Energy Rate for LCC analysis
Sector 2004 Electricity Rate ($kWh)
2004 Natural Gas Rate ($therm)
Industrial (DoD) $00469 $04750 Commercial (Civilian) $00742 $07690
44 Life-Cycle Cost Analysis Results
The results of the LCC analysis show that most of the fixtures are cost-effective at the average combined marginal watersewer cost for the Federal government $4251000 gallons for DoD sites and $4471000 gallons for civilian sites The most cost-effective fixtures were manual faucets and showerheads It was found that the cost-effectiveness of these fixtures is greatly enhanced when incorporating energy savings from hot water savings For some of these options the LCC results calculated a negative watersewer cost at which the fixture becomes cost-effective In other words a site could have free water and yet still find it LCC effective to install the particular water-efficient fixture by only including energy savings This means that energy savings alone creates enough cost savings to render the fixture LCC effective
Generally toilets and urinals are cost-effective at average Federal watersewer marginal rates However the results show that toilets used in menrsquos restrooms are often not cost-effective at a water rate at or below the average Federal rates This is because men typically use urinals more often than toilets in the Federal setting so water savings is minimal for male toilets
There are a number of scenarios where automatic and sensored faucets require a high watersewer rate to become cost-effective In these cases the installation is expensive and water savings is not significant enough to overcome the high installed cost For example a pedal activated faucet with a flow rate of 22 gpm does not generate enough savings over the life of the
44
fixture to have good return on investment Note that hot water generated by electric water heaters is cost-effective at lower watersewer rates than compared to natural gas water heaters This is because electricity is typically more expensive on a Btu basis than natural gas
High performance (Energy Star) commercial clothes washers were cost-effective at the average Federal watersewer rate Similar to showers and faucets electric water heaters results in the best LCC effectiveness for clothes washers Where only water savings were considered clothes washers are still cost-effective at average Federal marginal watersewer rate
A summary of the results of this analysis is presented in Tables 43 to 46 below These results show the marginal rate of water where the technology has a positive NPV In other words it is the water rate at which the fixture will become LCC effective These tables provide a convenient way to determine if a fixture is LCC effective at a given combined watersewer marginal rate for different scenarios The tables are broken out by the two water use scenarios that were modeled ndash office and barracks
The results for toilets and urinals in Table 43 are shown for both female and male barracks Because water use is different between these two facility types the LCC results are different The results for dual flush toilets are provided for female toilets only This is because dual flush toilets in menrsquos restrooms are not considered practical because men typically use urinals in the Federal setting The results for both dual flush toilets and no-water urinals are an average across the brands that were analyzed
For technologies that use hot water (showers faucets and clothes washers) there are three different scenarios provided in Tables 44 45 and 46 below
bull Water savings and electricity savings from an electric water heater
bull Water savings and natural gas savings from a natural gas water heater
bull Water savings only with energy savings not included
In addition to these components the results for faucets in Table 45 show the cost-effective water rate at the DoD and civilian energy rates for both electricity and natural gas (as described in Table 42) Because showerheads are primarily in DoD facilities only DoD energy rates are used
45
Table 43 Toilet and Urinal LCC Analysis Results
Office Female Barracks Male Barracks
Technolog y Category
(with installed
cost)
Specific Type
Combined WaterSew er Rate w Positive
NPV ($kgal)
Annual Water Saving s per
Fixture (kgal)
Combined WaterSew er Rate w Positive
NPV ($kgal)
Annual Water Saving s per
Fixture (kgal)
Combined WaterSew er Rate w Positive
NPV ($kgal)
Annual Water Saving s per
Fixture (kgal)
Toilets $269 Standard Tank 16 gpf $199 908 $237 764 $475 381 $224 Standard Flush Valve 16 gpf $165 908 $197 764 $395 381 $127 Flush Valve Retrofit 16 gpf $094 764 $112 764 $224 381 $344 Pressure Assist 10 gpf $337 1196 $401 1006 $804 502 $309 Pressure Assist 16gpf $399 908 $474 764 $951 381
$267 Dual Flush (female only) 13 gpf average
$139 1295 $182 900 NA NA
Urinals $169 Standard Flush Valve 10 gpf $380 299 NA NA $452 252 $169 Efficient Flush Valve 05 gpf $190 598 NA NA $226 503
See section 3 No-Water Urinal (average) $303 897 NA NA $425 755
Results for dual flush toilets are for female use only because menrsquos restrooms typically contain urinals Therefore annual savings per fixture only accounts for female toilet use Find information on data used in for dual flush toilets in Appendix C
Table 44 Showerhead LCC Analysis Results
Barracks
Specific Type (with installed cost)
Water Heating Fuel
Combined WaterSewer
Rate w Positive
NPV ($kgal)
Annual Water
Savings per Fixture
(kgal)
Annual Energy
Savings per Fixture (kWh or therms)
Electric $005 266 6633 kWh Natural Gas $072 266 300 therms
Standard EPAct Showerhead 25 gpm $27 None ndash water
savings only $119 266
Electric -$064 692 16600 kWh Natural Gas -$002 692 800 therms
High Efficient Showerhead 20 gpm $27 None ndash water
savings only $046 692
46
Table 45 Faucet LCC Analysis Results
Office Barracks
Faucet Specific
Type (with installed
cost)
Federal Sector
(DoD and Civilian)
Water Heating Fuel
Combined WaterSewer
Rate w Positive NPV
($kgal)
Annual Water
Savings per
Fixture (kgal)
Annual Energy Savings
per Fixture (kWh or therms)
Combined WaterSewer
Rate w Positive
NPV ($kgal)
Annual Water
Savings per Fixture
(kgal)
Annual Energy Savings
per Fixture (kWh or therms)
Standard EPAct Faucet
DoD Electric -$466 110 12420 kWh -$037 099 2063 kWh
22 gpm Natural Gas -$157 110 550 therms $016 099 100 therms
$689 None ndash water savings only $053 110 NA $059 099 NA
Civilian Electric -$742 110 12420 kWh NA NA NA Natural Gas -$294 110 550 therms NA NA NA None ndash water savings only $053 110 NA NA NA NA
High Efficient Faucet
DoD Electric -$385 349 30600 kWh -$126 314 9925 kWh
10 gpm Natural Gas -$147 349 1367 therms -$045 314 475 therms
$689 None ndash water savings only $017 349 NA $018 314 NA
Civilian Electric -$598 349 30600 kWh NA NA NA
Natural Gas -$254 349 1367 therms NA NA NA
None ndash water savings only $017 349 NA NA NA NA
Self Closing Single DoD Electric $303 110 13950 kWh $876 099 2317 kWh
22 gpm Natural Gas $650 110 618 therms $936 099 112 therms
$11580 None ndash water savings only $885 110 NA $984 099 NA
Civilian Electric -$007 110 13950 kWh NA NA NA Natural Gas $495 110 618 therms NA NA NA None ndash water savings only $885 110 NA NA NA NA
Self Closing Double DoD Electric $1078 110 13950 kWh $1738 099 2317 kWh
22 gpm Natural Gas $1425 110 618 therms $1798 099 112 therms
$21730 None ndash water savings only $1660 110 NA $1846 099 NA
Civilian Electric $768 110 13950 kWh NA NA NA Natural Gas $1270 110 618 therms NA NA NA None ndash water savings only $1660 110 NA NA NA NA
47
Table 45 Faucet LCC Analysis Results (cont)
Office Barracks
Faucet Specific
Type (with installed
cost)
Federal Sector
(DoD and Civilian)
Water Heating
Fuel
Combined WaterSewer
Rate w Positive
NPV ($kgal)
Annual Water
Savings per
Fixture (kgal)
Annual Energy
Savings per Fixture (kWh or therms)
Combined WaterSewer
Rate w Positive
NPV ($kgal)
Annual Water
Savings per
Fixture (kgal)
Annual Energy Savings
per Fixture (kWh or therms)
Pedal Activated Standard
DoD Electric $450 197 13950 kWh $801 177 2317 kWh
22 gpm Natural Gas $643 197 618 therms $834 177 112 therms
$18230
None ndash water savings only
$774 197 NA $860 177 NA
Civilian Electric $278 197 13950 kWh NA NA NA Natural Gas $557 197 618 therms NA NA NA None ndash water savings only
$774 197 NA NA NA NA
Pedal Activated High Efficient
DoD Electric -$012 389 34380 kWh $291 350 11152 kWh
10 gpm Natural Gas $228 389 1536 therms $373 350 534 therms
$18230
None ndash water savings only
$393 389 NA $437 350 NA
Civilian Electric -$227 389 34380 kWh NA NA NA Natural Gas $120 389 1536 therms NA NA NA None ndash water savings only
$393 389 NA NA NA NA
Sensor -battery DoD Electric $344 468 42740 kWh $687 421 14768 kWh
05 gpm Natural Gas $592 468 1910 therms $777 421 709 therms
$29230
None ndash water savings only
$762 468 NA $847 421 NA
Civilian Electric $122 468 42740 kWh NA NA NA Natural Gas $480 468 1910 therms NA NA NA None ndash water savings only
$762 468 NA NA NA NA
Sensor -hardwired DoD Electric $185 468 42740 kWh $509 421 14768 kWh
05 gpm Natural Gas $432 468 1910 therms $599 421 709 therms
$33660
None ndash water savings only
$602 468 NA $669 421 NA
Civilian Electric -$038 468 42740 kWh NA NA NA Natural Gas $320 468 1910 therms NA NA NA None ndash water savings only
$602 468 NA NA NA NA
48
Table 45 Faucet LCC Analysis Results (cont)
Office Barracks Faucet
Specific Type (with
installed cost)
Federal Sector (DoD and
Civilian)
Water Heating
Fuel
Combined WaterSewer
Rate w Positive NPV
($kgal)
Annual Water
Savings per
Fixture (kgal)
Annual Energy
Savings per Fixture (kWh or therms)
Combined WaterSewer
Rate w Positive
NPV ($kgal)
Annual Water
Savings per
Fixture (kgal)
Annual Energy Savings per
Fixture (kWh or therms)
Hydro Powered DoD Electric $837 379 34380 kWh $1242 341 11152 kWh
10 gpm Natural Gas $1083 379 1536 therms $1326 341 534 therms
$56645
None ndash water savings only
$1252 379 NA $1391 341 NA
Civilian Electric $616 379 34380 kWh NA NA NA Natural Gas $971 379 1536 therms NA NA NA None ndash water savings only
$1252 379 NA NA NA NA
Solar Powered DoD Electric $551 468 42740 kWh $916 421 14768 kWh
05 gpm Natural Gas $798 468 1910 therms $1006 421 709 therms
$54132
None ndash water savings only
$968 468 NA $1076 421 NA
Civilian Electric $328 468 42740 kWh NA NA NA Natural Gas $686 468 1910 therms NA NA NA None ndash water savings only
$968 468 NA NA NA NA
Table 46 Clothes Washer LCC Analysis Results
Barracks
Specific Type
Water Heating Fuel (Electric Natural Gas None ndash water savings only)
Combined WaterSewer
Price w Positive
NPV ($kgal)
Annual Water
Savings per Fixture
(kgal)
Annual Energy
Savings per Fixture (kWh
therms) Electric $156 419 24072 kWh Natural Gas $302 419 134 kWh
1035 therms
High Performance Commercial (Energy Star) Clothes Washer $1500 None ndash water
savings only $419 419 NA
Electric savings for water heated by natural gas result from to motor efficiency improvements
49
410
50 Cost-Effective Savings Potential in the Federal Sector
The cost-effective savings potential in the Federal sector was determined by first estimating the amount of water currently used by domestic fixtures Next the cost-effective savings percentage (of the total water use) was calculated for each fixture to determine what percentage could be saved cost-effectively This was done by identifying the fixtures that were determined to be LCC effective at the Federal average combined marginal water and sewer rate as described in Section 4 The methodology used to determine the water consumption in the Federal government and cost-effective savings potential is described below
51 Water Consumption Estimates in the Federal Sector
To ascertain the cost-effective water conservation potential in the Federal sector the first step is to determine the total water use in the Federal sector that is available for water savings for each ldquooff the shelfrdquo technology as described in Section 3
The total Federal water use was obtained from the FY 2003 DOE Report on Federal Agency Activities Under Executive Order 13123 [Executive Order 13123 1999] All Federal agencies are required to report total annual water use and cost of water to DOE These annual totals are summed for DoD and civilian agencies The reported water use and cost is presented in Table 51 below
Table 51 Total Water Use and Cost in the Federal Government [US DOE 2005]
Sector FY 2003 Water Use (million gallons)
of Total Use Water Cost ($ million)
DoD Civilian Agencies Total
162096 46959 209056
78 22 100
$292 $135 $427
The approach in this updated assessment examines water use in the Federal sector at the end-use level for each ldquooff the shelfrdquo domestic technology ndash toilets urinals showerheads faucets and clothes washers This was accomplished by applying the Federal water use indices for specific building types to the Federal inventory data obtained from the General Service Administration 1999 Federal real property database [GSA 1999]
The GSA real property database provides square footage for each major building type in the Federal sector for all DoD and civilian agencies However water use is typically driven not by how big the building is but rather by how many people occupy the building Therefore it is more accurate to base water use by occupancy level instead of by square footage The total occupancy of each building type was estimated by multiplying the total square footage by an estimated occupancy density (occupantsqft) The occupancy densities were obtained from
51
Facility Energy Decision System (FEDS) software [FEDS 2002] A complete description of Federal inventory building types and occupancy densities used in the analysis are listed in Appendices A and B
The estimated occupancy for each building type was then multiplied by the associated Federal water use indices (WUI) The Federal WUI obtained from the American Water Works Association (AWWA) is an estimate of the typical daily water use per occupant in gallons per person per day (gpd) [AWWA 1996] See Appendix B for a full explanation on how WUIs were chosen and estimated for each building type in the GSA real property database Also a detailed methodology and breakout of water use in the Federal sector by building type is included in Appendices A and B
The total water use for each building category was further broken down by end-use This is done by applying the typical end-use profiles for each building type A percent breakout of water use by end-use technology was obtained from two main sources Handbook for Water Use and Conservation by Amy Vickers [Vickers 2001] and A Water Conservation Guide for Commercial Institutional and Industrial Users developed by the New Mexico State Engineers Office [NMOSE 1999] A detailed explanation of how each building typersquos end-use profile was estimated can be found in Appendix B
These water use percentages for ldquooff the shelfrdquo technologies for each building type were then multiplied by the total Federal water use obtained from the FY 2003 Report on Federal Agency Activities Under Executive Order 13123 DoD domestic water consumption was estimated to be 78193 million gallons and civilian domestic water consumption was estimated at 27862 million gallons which totals 106055 million gallons or approximately 51 of all Federal water use Detailed data is provided in Table 52 below
Table 52 Estimated Water Use for Off the Shelf Technologies in the Federal Government
Technology
Annual DoD Water Use
(million gallons)
Annual Civilian
Water Use (million gallons)
Annual Total Federal Water
Use (million gallons)
Percent Total
Federal Water Use
Toilets 32614 12214 44828 21 Urinals 6824 1859 8683 4 Showers 12162 7920 20082 10 Faucets 13081 3488 16569 8 Clothes Washers 13512 2381 15893 8 Domestic Fixture Total 78193 27862 106055 51 Total Water Consumption 162096 46959 209055 of Total Use 48 59 51
52
52 Energy Consumption Estimate in the Federal Sector
The energy used to heat water in the Federal government was estimated using the Facility Energy Decision System (FEDS) a building energy modeling tool [FEDS 2002] The building inventory data from the GSA Real Property database that was used to estimate the water use in the Federal government was input into the FEDS software to model the amount of energy required to heat water in the Federal sector for domestic fixtures showerheads faucets clothes washers and dishwashers FEDS accounts for energy consumed by standby losses1 which are included in the total energy use but are not accounted for in energy reduction as a result of efficiency improvements
FEDS only accommodates efficiency improvements for faucets and showerheads Therefore the energy reduction potential for clothes washers and dishwashers in the Federal sector is not estimated in this assessment However it should be noted that there is significant opportunity for energy reduction from high performance clothes washers as discussed above There is approximately a 76 in energy reduction from high performance clothes washers compared to traditional equipment This includes both hot water reduction and higher motor efficiency
FEDS calculates energy requirements to heat tap water based on the difference between the groundwater temperature and the desired hot water temperature The Federal inventory data was broken out by DOE Region enabling buildings to be modeled by region to account for groundwater temperature differences throughout different parts of the country
To estimate energy savings as a result of reduction in hot water for showers and faucets varying flow rates for fixtures were modeled in FEDS to determine the amount of energy used by each It was assumed that all water was heated using distributed water heaters Water heated by steam or hot water from a central boiler and distributed system(common in DoD facilities) is not examined in this analysis Because central boilers are typically less efficient than distributed water heaters as a result of distribution losses the energy use and savings estimate in this analysis is conservative
All water was assumed to be heated by either electricity or natural gas Aside from central boiler hot water a small percentage of water is heated in distributed systems using fuel oil propane gas or other fuels and thus assumed to be negligible for the purposes of this assessment The amount of water assumed to be heated using electricity versus natural gas was
1 Standby losses occur through the walls of the hot water tank as well as through pipes during transmission to the end-use When hot water is not being used it tends to cool to the ambient temperature more energy is therefore needed to keep the stored water at the desired temperature although water may not have been drawn from the tank This wasted energy lost to the surroundings instead of providing useful work is called standby loss
53
based on Commercial Buildings Energy Consumption Survey 1999 (CBECS) [CBECS 2005] Annual Energy Outlook 2003 (AEO) data [EIA 2005] and data collected on Federal sites for other analyses conducted by PNNL [Parker et al 2005] For more information on these assumptions go to Appendix C
The results from the FEDS analysis of the total required energy to heat water for domestic uses (faucets showers clothes washers and dishwashers) in the Federal government is approximately 20900 billion Btu or about 2 of the total energy requirement of the Federal government [EIA 2005]1 The amount of energy required to heat water for showers and faucets is estimated to be about 4900 billion Btu or about 05 of the total energy requirement in the Federal sector Detailed results are presented in the Table 53
Table 53 Estimated Energy Requirements for Domestic Hot Water in the Federal Sector
Federal Sector Annual
Electricity Use (MWh)
Annual Natural Gas Use
(million Btu)
Total Annual Energy Use (million Btu)
DoD Faucets and Showers 469033 2212825 3813166 Civilian Faucets and Showers 137044 635550 1103145 Total Faucets and Showers 606077 2848376 4916312
DoD Total Hot Water 1674525 9500118 15213597 Civilian Total Hot Water 644868 3468931 5669220 Total Federal Hot Water 2319393 12969049 20882817
Conversion from MWh to MMBtu is 3412
See Appendix D for a detailed explanation of the methodology used in estimating the energy use and savings in the Federal sector
53 Cost-Effective Savings Potential Results
The water consumption and energy use estimated (presented in Tables 52 and 53) and the results of the LCC analysis (presented in Section 4) were used to estimate the cost-effective savings potential from the ldquooff the shelfrdquo fixtures in the Federal sector This analysis was done at a very high level encompassing the entire Federal sector so the results are not specific to any given site or Federal agency Rather they are general findings estimating total savings potential across the DoD and civilian sectors This savings potential represents 100 penetration of cost-effective efficient technologies in the Federal sector to show the true savings potential
1 The Federal government as reported by Energy Information Administration (EIA) in 2003 used 10516 trillion Btus
54
Because of the complexity of the Federal sector certain simplifying assumptions were mademdashthese are discussed below Note that the savings potential for any given site should be looked at given that sitersquos specific situation including specific equipment use and age as well as the marginal watersewer cost and environmental issues for example
To estimate the cost-effective savings potential in the Federal sector appropriate domestic fixtures were chosen from each category (toilets urinals showerheads faucets and clothes washers) that were determined to be LCC effective at or below the Federal average combined watersewer marginal cost (4251000 gal for DoD and 4471000 gal for civilian) Two technologies were chosen from each category ndash a standard fixture that meets the current EPAct requirements and a high efficiency option that exceeds EPAct but is still LCC effective at the average Federal water rate See Table 54 for a list of the fixtures chosen
Table 54 LCC Effective Fixtures Used to Estimate Savings Potential
Technology Standard EPAct Technology
High Efficiency Technology
Toilet 16 gpf flush valve 10 gpf pressure assisted Urinal 05 gpf No-water urinal Showerhead 25 gpm 20 gpm Faucet 22 gpm 05 gpm Clothes Washer High Performance NA
Urinal EPAct standard is 10 gpf However 05 gpf was cost-effective below the average Federal rates therefore was used as the ldquostandardrdquo
The savings for each of the fixtures in Table 54 was calculated based on the difference between the average water consumption of current water-using equipment in the Federal sector and the more efficient retrofit water consumption (as described in Section 3)
The Federal government has already implemented some degree of water-efficient technologies therefore a range of penetration rates of efficient technologies was assumed This was based on previous work at Federal sites [Solana and McMordie 2004 Chvala et al 2004] 1 which estimates the percentage of efficient fixtures that meet EPAct standards and highly efficient fixtures currently installed at Federal sites as described above Penetration of high efficiency fixtures was considered to be much lower than standard EPAct fixtures The
1 Also Chvala WD GP Sullivan and KL McMordie 2004 Water Management Plan for Pacific Northwest National Laboratory PNNL-Letter Report Pacific Northwest National Laboratory Richland Washington (not publicly available)
55
penetration rates used in this analysis are in Table 55 and more details are provided in Appendix B
Table 55 Penetration Rates of Efficient Technologies in the Federal Government
Fixture EPAct
Standard Technology
Penetration Rate in Federal Sector
High Efficiency
Technology
Penetration Rate in Federal Sector
Toilets 16 gpf 20 10 gpf
pressure assist
0
Urinals 10 gpf 50 0 gpf 2 Showerheads 25 gpm 70 20 gpm 10
Faucets 22 gpm 70 05 gpm sensored 10
Clothes Washer
High Performance (or use Energy Star) 4 NA NA
These penetration rates were multiplied by the corresponding cost-effective water and energy use savings These values arrive at the realistic cost-effective water and energy savings that is currently available for water savings for each technology
The final results of the cost-effective water savings potential in the Federal sector is estimated to be between 35000 and 50000 million gallons per year representing about 17 to 24 of total Federal water consumption The corresponding cost savings due to water savings is between $152 and $216 million annually (based on water rates presented in Table 41) The energy savings potential from reduced hot water consumption in showers and faucets is estimated to range from approximately 601700 to 1550000 million Btus The corresponding energy cost savings represents between $13 and $20 million annually (based on energy rates presented in Table 42) Breakouts by end-use of these results are shown below in Table 56 Low-end savings represent retrofits using the EPAct standard fixtures high-end savings represent installation of the high-efficiency technologies
56
Table 56 Total Cost-Effective Range of Savings in the Federal Government
Federal Sector Fixture
Low End
Water Savings (million
gal)
High End
Water Savings (million
gal)
Low End Water Cost
Savings ($million)
High End Water Cost
Savings ($million)
Low End
Energy Savings (million
Btu)
High End Energy Savings (million
Btu)
Low End Energy
Cost Savings
($million)
High End Energy
Cost Savings
($million)
DoD Faucet 3351 7893 $1424 $3355 322267 821044 $515 $775 Clothes Washer 6510 6510 $2767 $2767 NA NA NA NA
Showerhead 131 1034 $056 $439 24228 179506 $085 $212 Toilet 13684 16212 $5816 $6890 NA NA NA NA Urinal 3919 6247 $1666 $2655 NA NA NA NA
DoD Total 27595 37895 $11728 $16106 346495 1000549 $600 $987 Civilian Faucet 1203 2139 $538 $956 250886 519224 $610 $789 Showerhead 213 1606 $095 $718 4288 30354 $136 $227
Toilet 5270 6814 $2356 $3046 NA NA NA NA Urinal 1111 1788 $496 $799 NA NA NA NA
Civilian Total 7796 12347 $3485 $5519 255174 549578 $746 $1016
Grand Total 35391 50242 $15213 $21625 601669 1550128 $1346 $2003
57
58
60 Needs and Recommended Requirements for Successful Performance Contracting
Water conservation and efficiency measures have been incorporated into performance contracting of energy-efficiency projects as part of the Department of Defense ESPC and Super ESPC contracts Thus there is a considerable base of experience in water efficiency performance contracting at Federal sites The majority of the water conservation projects have been developed and implemented through second-tier contractors to energy service companies (ESCOs) For these ESCOs the water conservation projects are generally implemented through a water management specialist as a subcontractor andor a technology supplier who has expertise in implementation There are a few ESCOs that maintain staff with water conservation project development expertise but this is not typical
A number of challenges observations or recommendations have been made by the providers of water conservation services who have designed and implemented a significant number of water conservation projects and verified the savings under ESPC for the Federal sector1 These observations and recommendations are described in this section under the subheadings ldquoProject Designrdquo ldquoProject Implementationrdquo and ldquoSavings Verificationrdquo
61 Project Design
The following bullets describe key findings that impact the design of water projects These observations show limitations and barriers to designing effective water conservation projects
bull Given the requirements of the Super ESPC water services (only) firms must be used as subcontractors A water services subcontractor to an ESCO generally increases the cost of a water efficiency project and thus causes some technologies to no longer be cost-effective A standalone water savings performance contract with a water services (only) firm would likely reduce the overall cost of a water project while at the same time allow more water projects to be cost-effective
bull Many ESCOs consider water projects to be primarily domestic or ldquooff the shelfrdquo technology retrofits (eg low flush toilets and urinals) and very often do not incorporate more complex or engineered water projectsmdashparticularly projects in industrial processes or facilities such as single-pass cooling or steam system
1 Information obtained on impacts of performance contracting for water efficiency projects from personal communications with the following Mr James Horner President of Water Management Inc on February 28 2005 Mr Tom Horner Vice President of Water Management Inc on February 28 2005 and Mr Andrew Perrin Water Engineer with H2O Applied Technologies on February 2005
61
efficiency improvements This creates a significant number of missed opportunities especially if water conservation can be readily included in an energy conservation retrofit (eg retrofit of chillers or cooling towers)
bull Water efficiency opportunities are many times the last set of projects or technologies identified in a more complete and comprehensive set of energy projects ESCOs should bring in the water efficiency experts (if subcontracted) early in the identification of all utility savings project opportunities Also given most ESCOs do not maintain in-house expertise in water efficiency bringing in a water services firm early in the process can help ldquosellrdquo a cost-effective water efficiency project to an otherwise reluctant Federal agency
bull Water audits can generally identify equipment vintage and rated performance In some cases (as with energy consuming equipment) the stated or manufacturerrsquos (label) performance is incorrect because of aging andor improper maintenance For example a labeled 16 gpf toilet may have a worn or replaced valve that is allowing over 3 gpf In many cases the toilet cannot be included in a retrofit project because of the rating on the label Allowance needs to be made for including retrofit projects in these types of situations
bull Currently most water management projectsrsquo economic analyses use an average (rather than marginal) watersewer rate based on the water billndashwithout an escalation factorndashfor LCC analysis This approach is flawed There is a need for development of a method for determining the appropriate baseline rate to use for a water project cost-effectiveness assessment as well as the escalation of that rate similar to the way energy rates are determined and escalated in LCC analysis1
bull Some water services companies as subcontractors to an ESCO may not be willing to reveal proprietary measures or projects without a guarantee or some other certainty of being selected as part of the ESCO team of a Federal ESPC project Water project opportunities that could be included as part of the ESCO bid and selection process are often missed because of proprietary nature of some technologies
bull Because many ESCOs do not have experience and expertise in water efficiency particularly in those projects that are engineered they often limit the developmentidentification of projects to those that are standard or proven retrofits and do not include potential projects that are small or more complicatedmdasheven if economic Significant savings opportunities are thus lost
1 Note the Department of Housing and Urban Development (HUD) has established a 3year escalation rate for watersewer rates in all performance-based water conservation projects under HUD
62
62 Project Implementation
The way that ESPCs are currently structured has an influence on how water projects can be implemented The following bullets describe these major impacts on implementation of water projects
bull Water conservation measuresprojects are almost always a part of a larger set of task or delivery orders that include energy conservation measures (ECMs) Generally the ECMs take longer to design and implement than water conservation measures Though in most cases the water conservation measures can be more quickly implemented than the ECMs they are staged with the ECMs thus unnecessarily delaying the more immediate capture of water savings
bull ESCOs often limit communication and interaction by water services subcontractors directly with the Federal client during design and implementation Direct communication by the water subcontractor with the Federal client will generally lead to identification of additional opportunities minimal disruptions and increased client satisfaction
bull An ongoing or long-term water management maintenance program as part of a water conservation project is crucial to assure savings are sustained over the long term Operations and maintenance is often included in energy conservation projects but neglected in water conservation projects when in fact the water savings are just as dependent upon proper equipment maintenance as in energy projects
63 Savings Verification
ESPCs require a guaranteed savings and thus require measurement and verification (MampV) to assure that savings are being met The following list summarizes the issues revolving around savings verification for water projects and some recommendations for improvements
bull The current industry standard for measurement and verification (MampV) for water measures as part of an ESPC was researched For basic water consuming fixtures (such as toilets urinals showers and faucets) water savings are typically stipulated where savings are determined based on calculated pre- and post-retrofit water consumption agreed to by the facility For water processes MampV is typically based on short term pre- and post-retrofit field measurement of the specific equipment
bull It is vital to have a reasonable and appropriate level of savings verification protocol commensurate with the type of project or type of retrofit As stated in the above
63
bullet stipulated (calculated rather than measured) water savings is a common approach in the Federal sector however stipulated water savings should be applied to technologies only with well established water savings Most domestic-related fixtures have reliable performance and stipulated MampV is most likely adequate For process-related measures such as cooling towers or single-pass cooling the favorable MampV approach is short term and spot measurement because savings is dependent on the site specific nature of the measure
bull The ESCO should strive to engage the water services subcontractor in the development of the savings verification approach for the water conservation measures Even if the water conservation retrofits are a small portion of the task or delivery order and thus a small portion of the savings a responsible savings verification plan needs to be developed and implemented proportionate to the MampV plan With this approach the water services contractor will also share the responsibility for the savings guarantee with the ESCO
bull All servicing utility (water sewer and energy) incentives for water saving (and waterenergy saving) technologies and strategies should be allowed to be captured by the contractor and included in the cost-effectiveness analysis
Overall the most important issue is to create the contract requirements and a process that will be attractive to all potential water service providers in a highly competitive environment This environment should allow the water service providers a wide and flexible range of water-related conservation and cost saving opportunities that bring innovation and creativity to the Federal sector customers
64
70 References
American Water Works Association (AWWA) 1996 Federal Water Use Indices Obtained from FEMP Website at httpwwweereenergygovfemptechnologieswater_useindicescfm
Chvala WD GP Sullivan and KL McMordie 2004 Water Management Plan for Fort Buchanan Puerto Rico PNNL-14533 Pacific Northwest National Laboratory Richland Washington
Commercial Buildings Energy Consumption Survey (CBECS) Website 2005 Accessed February 2005 Website can be found at httpwwweiadoegovemeucbecscontentshtml
Energy Information Administration (EIA) Annual Energy Outlook Website 2005 Accessed February 2005 Website can be found at httpwwweiadoegovoiafaeo
The Energy Policy Act of 1992 (EPACT) 1992 Public Law 102-486 Washington DC
Executive Order 13123 Greening the Government Through Efficient Energy Management 1999 Federal Register 30851 Volume 64 Number 109 Washington DC
Facility Energy Decision System (FEDS) software Release 502 2002 Pacific Northwest National Laboratory Richland Washington
Federal Energy Management Program News and Events Website Accessed on January 26 2005 Summary of the National Defense Authorization Act of Fiscal Year 2005 Website can be found at httpwwweereenergygovfempnewseventsdetailcfmnews_id=8301
Federal Energy Management Program Water Efficiency ndash Federal Requirements Website httpwwweereenergygovfemptechnologieswater_fedrequirecfm Accessed on January 26 2005
Federal Energy Management Program Water Efficiency ndash Water Goals Website (httpwwweereenergygovfemptechnologieswater_goalscfm)
Federal Energy Management Program Water Efficiency Website (httpwwweereenergygovfemptechnologieswater_efficiencycfm)
71
Fitzpatrick QK KL McMordie FV Di Massa and DR Dixon 1995 FORSCOM Installation Characterization and Ranking for Water Efficiency Improvement PNNLshy10541 Pacific Northwest National Laboratory Richland Washington
Fuller SK and SR Petersen 1995 Life-Cycle Costing Manual for the Federal Energy Management Program NIST Handbook 135 National Institute of Standards and Technology Gaithersburg MD
General Service Administration (GSA) Advantage Website 2005 Accessed January 2005 Website used to estimate average fixture costs Website can be found at wwwgsaadvantagegov
General Services Administration 1999 Summary Report of Real Property Owned by the United States Throughout the World as of September 30 1998 General Services Administration Washington DC
Harrison H and J Beck 2004 Prisoners in 2003 Bureau of Justice Statistics Bulletin US Department of Justice Washington DC
International Association of Plumbing and Mechanical Officials (IAPMO) 2003 Uniform Plumbing Code IAPMOANSI UPC 1-2003 Ontario CA
Koeller J 2003 Dual-Flush Toilet Fixtures ndash Field Studies and Water Savings Koeller and Company Yorba Linda California
Lombardo Associates 1997 Federal Facilities Water Use and WaterEnergy Conservation Potential Final Report Prepared for the National Renewable Energy Laboratory Newton Massachusetts
Mansfield Plumbing Products 2005 ldquoWholesale Price Listrdquo Perrysville Ohio
McMordie Stoughton KL and WD Chvala 2004 Southeast Region Energy Program Technical Bulletin Water Saving Toilets and Urinals PNNL-SA-40945 Pacific Northwest National Laboratory Richland Washington
New Mexico Office of the State Engineer (NMOSE) 1999 A Water Conservation Guide for Commercial Institutional and Industrial Users Santa Fe New Mexico
Parker GB KL McMordie GP Sullivan and DB Elliott 2001 Market Assessment for Capturing Water Conservation Opportunities in the Federal Sector PNNL-13511 Pacific Northwest National Laboratory Richland Washington
Parker GB AE Solana and DR Dixon 2005 Facility Energy Decision System (FEDS) Assessment Report for Blue Grass Army Depot Kentucky PNNL-15075 Pacific Northwest National Laboratory Richland Washington
72
Raftelis Financial Consulting PA 2004 Water and Wastewater Rate Survey Charlotte North Carolina
Reed Construction Data Incorporated 2004 RS Means Residential Cost Data - 2005 Kingston Massachusetts [plumbing labor costs]
Service Employees International Union Website Accessed on February 15 2005 Obtained nurse to patient ratio Website can be found at wwwSEIUorg
Schultz LI AS Rushing and SK Fuller 2004 Energy Price Indices and Discount Factors for Life-Cycle Cost Analysis - April 2004 NISTIR 85-3273-19 National Institute of Standards and Technology Gaithersburg MD
Sloanreg Valve Company Sensor Faucets Website 2005 Accessed January 2005 Website can be found at httpwwwsloanvalvecomindex_2450htm
Solana AE and McMordie KL 2004 Water Management Plan for Blue Grass Army Depot PNNL-14880 Pacific Northwest National Laboratory Richland Washington
Sullivan GP GB Parker and J W Currie 2004 Wisconsin Focus on Energy Resource-Efficient Laundry (REL) Room Demonstration Final Report PNDW-3445 Battelle - Pacific Northwest Division Richland Washington
Toto Plumbing USA 2005 ldquoWholesale Price Listrdquo Morrow Georgia Website can be found at httpwwwtotousacomtotopagecontentviewasppageid=56ampshowimage=eco
United States Green Building Council (USGBC) 2003 Leadership in Energy and Environmental Designtrade Reference Guide for New Construction and Major Renovations Version 21 Second Edition Washington DC
Uridanreg Non Water System Website 2005 Accessed in January of 2005 Website can be found at httpuridancom
Veritec Consulting Inc 2002 Dual Flush Toilet Project Canada Mortgage and Housing Corporation Canada
Vickers A 2001 Handbook of Water Use and Water Conservation Amy Vickers and Associates WaterPlow Press Amherst Massachusetts
Waterlessreg No-Flushtrade Urinal Website 2005 Accessed in January of 2005 Website can be found at httpwaterlesscom
73
74
Appendix A
Federal Inventory Data to Estimate Federal Water Use by Building Types
Appendix A ndash Federal Inventory Data to Estimate Federal Water Use by Building Types
To analyze water use in the Federal government it is important to understand which building types are the predominant water users in civilian and Department of Defense (DoD) facilities Federal inventory data was obtained from the General Service Administration 1999 Federal real property database [GSA 1999] This data is broken down by agency square footage and building type The building categories are as follows
bull Hospital medical clinics and hospitals bull Housing barracks and Federal housing bull Industrial process related facilities bull Office administrative buildings bull Other Institutional research oriented space with no laboratories bull Post Office postal facilities bull Prison detention and prisons bull RampD (Research and Development) laboratory bull School training facilities bull Service maintenance shops bull Storage warehouse bull All Other miscellaneous buildings that do not fit into the above categories
The predominant building types by square footage in DoD and civilian facilities based on the GSA real property data are shown below in Figures A1 and A2 Housing service and storage take up the most floor space in the DoD while offices hospitals and storage dominate civilian floor space
A1
All Other 14
School6
Office 9
17
Housing 32
Service 22
Storage
Figure A1 Breakout of DoD Square Footage by Building Category
All Other Service 13
5 Office
Storage 9
Industrial 42 6
Housing 6
RampD 8 Hospital
11
Figure A2 Breakout of Civilian Square Footage by Building Category
However water use is typically driven by how many people occupy a building and not by the square footage of a building Therefore it will be more accurate to base the Federal inventory by occupancy level instead of by floor space
The total occupancy of each facility category can be estimated by multiplying the total square footage (as stated above) by the occupancy density (occupantsqft) which is obtained from Facility Energy Decision System (FEDS) software [FEDS 2002] (Find occupancy density factors in Appendix B) It should be noted that not all of the facility
A2
categories in FEDS match perfectly with the facility categories provided in the Federal inventory Therefore the closest corresponding category was used (see Appendix D for details on building categories)
The estimated occupancy for each facility type was then multiplied by the associated Federal water use indices (WUI) The Federal WUI obtained from the American Water Works Association (AWWA) is an estimate of the typical daily water use per person in the units of gallons per person per day (gpd) [AWWA 1996] See Appendix B for a full explanation on how WUIs were chosen and estimated for each building type
By multiplying the occupancy of each facility type by the corresponding WUI a daily water use for each building type was estimated These values were used to estimate the predominant water using building categories for DoD and civilian facilities shown in the pie charts below These charts are significantly different than the previous pie charts showing a breakout of Federal floor space (by square footage) For DoD the top water users are housing schools and hospitals For civilian agencies the predominant water users are hospitals offices and prisons as shown in Figures A3 and A4
All OtherOffice 11
5 Housing RampD 37 12
10 Hospital
11School 14
Service
Figure A3 Breakout of DoD Daily Water Use by Building Category
A3
All Other 14
Industrial 6 34
RampD15
Prison 16
Hospital
Office 15
Figure A4 Breakout of Civilian Daily Water Use by Building Category
Appendix B shows the next steps of assumptions used in the analysis to further estimate the Federal water use by these Federal building types and end-use fixtures
A4
APPENDIX B
Federal Water Use Estimate Assumptions
Appendix B ndash Federal Water Use Estimate Assumptions
This appendix describes the assumptions used to estimate the Federal water consumption by building type and end-use described in Section 5 of this document
Water Use Indices
Federal water use indices (WUI) were used to estimate water use by building type in the Federal sector Table B1 below describes the WUI used in this assessment Some are found on the FEMP website at httpwwweereenergygovfemptechnologieswater_useindicescfm and the rest are based on FEMPrsquos WUI as explained below
Table B1 Federal Water Use Indices used in the Analysis
Building Type WUI ndash gallon per person per day
Data Source
Hospital 834 Adjusted from Federal WUI Office 150 Federal WUI Prison 120 Federal WUI RampD 80 PNNL Water Plan Industrial 80 Based on RampD WUI HousingBarracks 350 Federal WUI for dormitory School 167 Average of Federal School
WUI Service 150 Based on Federal Office
WUI Other Institutional 167 Based on Federal School
WUI Storage 100 Adjusted based on Federal
Office WUI Post Office 150 Based on Federal Office
WUI All Other 150 Based on Federal Office
WUI
The methodology below explains how WUI were estimated where no Federal WUI was provided for the given category or it was adjusted to provide a better estimate
B1
RampD The RampD WUI was estimated by using data from the Pacific Northwest National Laboratory Water Plan1 Individual laboratory facilities at PNNL are metered for water consumption and square footage and occupancy numbers are known for these facilities The WUI used in this analysis is based on the average WUI for these laboratory facilities
Industrial Because reliable data was not obtained for industrial facilities WUI it was assumed that RampD has a fairly similar use pattern with relatively low occupancy and intensive process water use
Hospital Hospital WUIs are provided in water use per bed and water use per employee The typical employee to patient ratio for hospitals is 6 to 1 [SEUI 2005] This is based on an average ratio of current mandated standards for nurse to patient ratios in hospitals that was found in the Service Employees International Union Website So this ratio was used to ldquoproraterdquo the WUI for patients and employees The WUI was also adjusted based on an 80 occupancy rate because it is based on the number of beds not patients So the WUI of 120 gallons per bed per day and the WUI of 10 per employee was adjusted to equal 83 gallons per occupant per day
Housing It is assumed that the majority of the housing for both civilian and DoD are predominantly barracks type facilities The WUI that best matched the barracks use pattern is assumed to be the Dormitory WUI
Service Post Office and All Other These categories are assumed to have a similar use pattern as the Office category
Storage Storage was adjusted to 10 gallons per person per day This was based on the Office WUI of 15 galpersonday but reduced because typically storage has decreased heating and cooling requirements and no irrigation
Occupancy
The occupancy densities which were used to calculate the daily water use of Federal buildings based on building type were obtained from the Facility Energy Decision System (FEDS) with the exception of prisons The FEDS building categories do not match exactly with the Federal inventory categories See Table D1 (in Appendix D) for an explanation of how the FEDS categories were matched to the Federal inventory categories
1 Also Chvala WD GP Sullivan and KL McMordie 2004 Water Management Plan for Pacific Northwest National Laboratory PNNL-Letter Report Pacific Northwest National Laboratory Richland Washington (not publicly available)
B2
The Federal occupancy densities do not have a category for prison nor does it have a category with a close fit Therefore occupancy of Federal prisons was obtained from a Bureau of Prisons document that provides the total number of Federal inmates in 2003 [Harrison and Beck 2004] Table B2 lists the occupancy densities for each building type
Table B2 Occupancy Densities for Building Categories
Building Type Occupancy Densities (occksf)
Hospital 52129 Office 31156 Prison 4600 RampD 31156 Industrial 17086 Housing 25216 School 103796 Service 24326 Other Institutional 103796 Storage 11726 Post Office 24326 All Other 31153
FEDS uses a typical number of occupants for individual building types Table B3 shows the occupied hours assumed for each building type Occupancy hours are necessary inputs for FEDS to model water consumption because the longer a person occupies a building the more times they will use the facilities
B3
Table B3 Building Occupancy Hours
Building Type Weekdays Saturdays Sundays Start End Start End Start End
CIVILIAN Office 700 1800 0 0 0 0 Health Care 0 2300 0 2300 0 2300 Public Order 0 2300 0 2300 0 2300 Education 700 1700 0 0 0 0 Single Family Attached Housing 1400 2300 700 2300 700 2300 Lodging 1500 2300 700 2300 700 2300 Warehouse Storage 600 1800 0 0 0 0 Other 600 1800 0 0 0 0 Mercantile and Service 800 2100 900 1600 0 0 Assembly 1100 2200 1400 2300 1400 2000
DOD Office 700 1800 0 0 0 0 Hospital 0 2300 0 2300 0 2300 Schools andor Training 700 1700 0 0 0 0 Duplex Federal housing 1400 2300 700 2300 700 2300 Barracks 1500 2300 700 2300 700 2300 Storage 600 1800 0 0 0 0 Production andor Process 600 1800 0 0 0 0 Exchange Facilities 800 2100 900 2000 0 0 Lab 700 1800 0 0 0 0 Morale Welfare and Recreation 1100 2200 1400 2300 1400 2000 Security 700 2100 700 2100 700 2100
End-Use Breakouts
The sources for end-use breakouts were obtained from Water Use and Conservation by Amy Vickers and A Water Conservation Guide for Commercial Institutional and Industrial Users developed by the New Mexico State Engineers Office [NMOSE 1999] However these two sources do not have the water use breakout for all facility types that are characterized in this analysis Also these end-use breakouts do not distribute the water use by technology but rather by generic category such as ldquorestroomrdquo use (instead of toilet urinal faucet and shower) Therefore some assumptions were made to help characterize Federal water use by end-use based on these two sources
B4
Office Office breakout is from the New Mexico Water Conservation guide [New Mexico Office of the State Engineer 1999] which breaks out the water use in the following manner
bull Restrooms 40 bull CoolingHeating 28 bull Landscape 22 bull Other 9 bull Kitchen 1
For the restroom category toilet urinal and faucet use was broken out by characterizing the typical use patterns for females and males in an office setting (Shower water use was assumed to be zero) Typically people use the restrooms three times per day women use toilets for all three uses and men use the urinal twice and toilet once [Vickers 2001] Both men and women wash their hands after each use and it is assumed that it takes 20 seconds for each hand washing This use pattern gives the following breakout of total restroom use assuming that there are 50 women and 50 men in the building
bull Toilets 61 bull Urinals 17 bull Faucets 22
These percentages were applied to the 40 restroom use to give the following breakout for each ldquooff the shelfrdquo technology for the office category
bull Toilets 24 bull Urinals 7 bull Faucets 9
Service and All Other The ldquoservicerdquo and ldquoall otherrdquo categories were assumed to have the use pattern similar to office buildings Therefore the same end-use breakouts were used for these types of buildings
Hospital End-use breakout for hospitals is from the New Mexico Water Conservation guide The split is the following
bull Restrooms 40 bull CoolingHeating 13 bull Laundry 10 bull Sterilizers 10 bull Kitchen 8 bull Other 8 bull X-ray 6 bull Landscape 5
B5
For the restroom category in Hospital building types toilet urinal showerhead and faucet use was broken out by characterizing the typical use patterns hospitals Patient ldquorestroomrdquo water use was estimated based on 51 toilet and faucet uses per day [Vickers 2001] and one shower per day Employee water use was estimated based on comparing the Federal WUI for hospital employees and patients Patient WUI is typically 120 gallons per patient per day For employees the typical WUI is 10 gallons per employee per day [AWWA 1996] So employee use is about 8 of the patient use This gives the following breakout for restroom fixtures
bull Toilets 49 bull Urinals 0 (very small water use for only male employees assuming that
patient rooms do not have urinals) bull Showers 41 bull Faucets 10
Housing It is assumed that the majority of the housing building type is barracks Therefore the end-use breakout for housing is estimated based on data from hotel and motel water use patterns because this more closely matches water use patterns in barracks than residential style housing The following split of water use for hotelsmotels is from A Water Conservation Guide for Commercial Institutional and Industrial Users prepared by the New Mexico Office of the State Engineer
bull Guestrooms 30 bull Kitchen 25 bull Laundry 20 bull CoolingHeating 15 bull Landscape 10
To split the guestroom water use by fixture end-use residential water use was obtained from the Handbook of Water Use and Conservation [Vickers 2001] This breakout shows water use by bathroom fixtures
bull Toilets 45 bull Showers 26 bull Faucets 26 bull Baths 3 (baths were not analyzed for this study because this is minimal and
not an area of efficiency improvements)
These percentages were multiplied by the guestroom percentage to get the breakout of water use for bathroom fixtures for housing
bull Toilets 13 bull Showers 8 bull Faucets 8
B6
School School breakout is assumed to have a similar use pattern as Office buildings Therefore the split is from the New Mexico Water Conservation guide The split is the following
bull Restrooms 40 bull CoolingHeating 28 bull Landscape 22 bull Other 9 bull Kitchen 1
The bathroom fixture usage is broken down accordingly as described for Office buildings
bull Toilets 24 bull Urinals 7 bull Faucets 9
Prison Prison end-use breakout was estimated based on the hospital end-use breakout because the operating hours are similar and there are other major water users (like kitchen among other processes) It was assumed that 40 of the water use in prisons is from bathroom fixtures ndash same as hospital use To further divide this restroom use by each fixture ndash it was assumed that inmates have the same use patterns as the general public of 51 restroom uses per day and one shower per day [Vickers 2001] There are an estimated number of 170000 inmates in Federal prisons and 7 of these are women [Harrison and Beck 2004] This percentage was used to estimate urinal use of the male inmates assuming male inmates have 4 urinals uses per day and 11 toilet uses per day The end-use split of the 40 restroom use is as follows
bull Toilets 7 bull Urinals 10 bull Showers 17 bull Faucets 6
RampD and Industrial Under the scope of this analysis there was no sound data found for RampD and Industrial type facility water use patterns Therefore restroom water use was estimated based on assuming that restroom use pattern among staff in an RampD and industrial facility will be the same as an office setting The total restroom use in an office facility based on information described above for Office WUI is 6 gallons per person per day (gpd) Therefore the percentage of restroom use in an RampD facility is 75 (6 gpd dived by 80 gpd) The restroom breakout for RampD is as follows
bull Toilets 5 bull Urinals 1 bull Faucets 2
B7
Penetration Rates of Existing Efficient Technology
The penetration rates in the Federal sector of existing efficient water using equipment was estimated based on a range of rates The penetration rates are based on field experience [Solana and McMordie 2004 Chvala et al 2004] 1 and life of the equipment The highest level of penetration of efficient technology in the Federal sector was based on the implementation of water using fixtures that meet EPAct flow rate standards shown in Table B4 below Many showerheads have been replaced with EPAct standard fixtures because the life of showerheads is generally 5 years Starting in about 1994 most showerheads were rated at 25 gpm Therefore the majority of existing showerheads have been replaced since 1994 For faucets it is very easy and inexpensive to retrofit faucets with low flow aerators Based on field experience it is assumed that the majority of faucet aerators meet the EPAct standard flow rate
EPAct standard 16 gpf toilets have been required since 1994 Toilets last about 20 years Therefore it is assumed that the majority of these fixtures have not been replaced and do not meet EPAct flush rates Urinals are easy to retrofit to use about 10 gpf by replacing the older higher consuming flush valve with a 10 gpf flush valve It is assumed that about half of all urinals have been replaced with a 10 gpf flush valve2
For high efficiency fixtures as described in Section 3 it is assumed that the penetration rate is very low This is because they are recent to the market and field experience verified the low penetration [Solana and McMordie 2004 Chvala et al 2004]1 Table B4 shows the penetration rates that were used in the analysis
Table B4 Penetration Rates of Efficient Fixtures in the Federal Government
Fixture EPACT Standard
FlowFlush Rate
Penetration Rate in Federal Sector
High Efficiency FlowFlush
Rate
Penetration Rate in Federal Sector
Toilets 16 gpf 20 10 gpf 0 Urinals 10 gpf 50 No-water
urinal 2
Showerheads 25 gpm 70 21 gpm 10 Faucets 22 gpm 70 05 gpm 10
1 Also Chvala WD GP Sullivan and KL McMordie 2004 Water Management Plan for Pacific Northwest National Laboratory PNNL-Letter Report Pacific Northwest National Laboratory Richland Washington (not publicly available)
2 Obtained information on penetration rate of urinals from personal communications with Mr Bill Slaughter Federal Account Representative with Falcon Water Free Urinals on January 12 2005
B8
APPENDIX C
Building Characteristics and Use Profile for Life-cycle Cost Analysis
Appendix C ndash Building Characteristics and Use Profile for Life-cycle Cost Analysis
To determine the LCC effectiveness of individual technologies an average Federal office building and barracks were modeled The building size and age were averaged from Federal inventory data and other building characteristics were obtained from Facility Energy Decision System (FEDS) software A female and male barracks were modeled separately because women and men have different water use patterns (women do not use urinals)
Water savings were calculated for each efficient off the shelf technology described in Section 3 in the main body of the report The assumptions used to estimate the water and energy savings are described below in the series of tables Table C1 describes the building characteristics ndash its size number of occupants gender split of the building and the number of occupied days for each building type
Table C1 Building Characteristics Office and Barracks
Building Type
Square Feet
Number of Occupants
Gender split
Occupied Days
Office 18889 46 50-50 260 Barracks 8180 165 Modeled
separately for male and female
365
Also the number of fixtures in each building was estimated to calculate the water and energy savings per fixture for the LCC analysis The number of fixtures shown in Table C2 are based on several different sources the Uniform Building Code [IAPMO 2003] on-site experience from water audits [Solana and McMordie 2004 Chvala et al 2004] 1 and information from the FEDS model The most appropriate fixture count was chosen based on careful consideration of all three sources
1 Also Chvala WD GP Sullivan and KL McMordie 2004 Water Management Plan for Pacific Northwest National Laboratory PNNL-Letter Report Pacific Northwest National Laboratory Richland Washington (not publicly available)
C1
Table C2 Fixture Count for Office and Barracks
Building Type Number of Female Toilets
Number of Male Toilets
Number of
Urinals
Number of Faucets
Number of Showers
Office 3 2 2 6 0 Barracks 4 3 2 8 3
Average use of fixtures in an office building was based on 3 restroom visits per day For barracks it was assumed that 5 days per week there were 21 restroom uses and 2 days per week there were 41 restrooms uses to average out to 267 uses per day [Vickers 2001] To calculate the water use for showerheads it was assumed that showers are 53 minutes long Typical hand washing after a toilet use was assumed to be 20 seconds Barracks water use assumed one face wash and 2 teeth brushings per person per day which last 30 seconds each Therefore the total faucet water use in barracks each day is approximately 238 minutes This data is shown in Table C3
Table C3 Water Use Pattern
Average Uses per Person per Day Building
Type Gender Toilets Urinals Faucets Showers
Office Female 3 0 3 0 Office Male 1 2 3 0 Barracks Female 267 0 238
min total
1
Barracks Male 1 167 238 min total
1
Source Vickers 2001
C2
APPENDIX D
Methodology Used to Estimate Federal Energy Use
Appendix D - Methodology Used to Estimate Federal Energy Use
Energy savings from reduced hot water use was calculated using the Facility Energy Decision System (FEDS) a building energy modeling tool [FEDS 2002] For the entire Federal sector varying flow rates for faucets and showerheads were modeled in FEDS to determine the amount of energy used (Other domestic hot water consumers dishwashers and clothes washers do not have retrofit options in FEDS) The Federal sector was represented by the GSA real property data [GSA 1999] which contains Federal building inventory floor space described above
FEDS calculates energy requirements to heat tap water based on the difference between the groundwater temperature and the desired hot water temperature The Federal inventory data was broken out by DOE Region enabling buildings to be modeled by region to account for groundwater temperature differences throughout different parts of the country
Federal buildings were also modeled according to building type in order to allow FEDS to make assumptions for water consumption fixture count and water heating equipment based on building type and size The building type categories in FEDS do not exactly correlate with the Federal inventory building categories Table D1 below shows which FEDS categories were used to represent the Federal categories These were chosen based on the most similar water use pattern of the particular building type which depends on occupancy numbers and hours
D1
Table D1 FEDS Building Types Used to Represent Federal Building Types
Federal Inventory Building Type FEDS Building Type CIVILIAN
Office Administration Post Office Mercantile and Service Hospital Health Care Prison Public Order School Education Other Institutional Education Housing Lodging Single Family Attached Storage Warehouse Storage Industrial Other Service Mercantile and Service RampD Office All Other Assembly
DOD Office Administration Post Office Exchange Facilities Hospital Hospital Prison Security School Schools andor Training Other Institutional Schools andor Training Housing Barracks Duplex Federal housing Storage Storage Industrial Production andor Process Service Exchange Facilities RampD Labs All Other Morale Welfare and Recreation
It was assumed that all water was heated using either electricity or natural gas Small percentages of water are heated using fuel oil propane gas or other fuels but these were assumed to be negligible for the purposes of this assessment Additionally many DoD sites use central systems to heat water which typically use natural gas or fuel oil to heat water to very high temperatures or to steam which then exchange heat with potable water for building use This is generally less efficient than standalone water heaters in each building therefore the projected savings in this assessment are conservative The amount of water assumed to be heated using electricity versus natural gas was based on Commercial Buildings Energy Consumption Survey 1999 (CBECS) [CBECS 2005] and Annual Energy Outlook 2003 (AEO) data [EIA 2005] Both of these sources are not Federal-specific Therefore adjustments were made to these values according to field experience specifically in the Federal sector The values used for this assessment according to building and fuel type are listed below in Table D2a The values gathered from CBECS and AEO are shown for comparison in Table D2b Please note that the
D2
data in Table D2b does not accurately represent the Federal sector electrical use is extremely low and so the values were adjusted appropriately for this analysis
Table D2a Percent of Fuel Use for Water Heating by Building Type used in the Analysis
Building Type Electricity Natural Gas Total with Hot Water
Education 49 49 98 Health Care 46 54 100 Lodging 47 53 100 Mercantile amp Service 55 40 95 Office 60 40 100 Warehouse 50 36 86 Other 45 41 86 All Others 50 50 100
Table D2b Percent of Fuel Use for Water Heating by Building Type from CBECS AEO
Building Type Electricity Natural Gas Total with Hot Water
Education 34 51 94 Health Care 36 54 100 Lodging 36 53 98 Mercantile amp Service 30 44 82 Office 33 50 91 Warehouse 24 36 67 Other 30 44 82 All Others 32 50 57
To determine the amount of annual Federal energy savings potential for a given retrofit fixture energy consumption was determined for a base case scenario as well as for each retrofit scenario The base case represented the average current flow rate in the Federal sector which was estimated at 275 gpm for both faucets and showerheads [Vickers 2001] Each retrofit scenario reduced this flow rate to represent a hypothetical situation where every fixture in the Federal sector was replaced with 25 or 20 gpm for showerheads and 22 10 or 05 gpm for faucets The difference in energy use between each of these scenarios and the base case approximates the total potential for energy savings in the Federal sector
D3
D4
APPENDIX E
Conservation Opportunities with Site-Specific Water Process
Appendix E - Conservation Opportunities with Site-Specific Water Process
E1 Cooling Towers
Cooling towers are often one of the largest water users for large office buildings hospitals and industrial-type facilities Water is lost in a cooling tower through evaporation bleed-off and drift As water is evaporated through the tower dissolved solids remain in the system and build up over time To maintain proper water quality the water must be purged through the ldquobleed-offrdquo Drift is water lost through large water droplets that are carried by wind Several technologies and techniques can be used to maintain proper water quality and reduce bleed-off These are briefly described below
bull Chemical Treatment sulfuric acid or absorbic acid adjusts the pH of the system limiting scale build-up thus reducing bleed-off
bull Side Stream Filtration filters out sediment and returns filtered water back to tower to reduce the amount of bleed-off needed
bull Copper Silver Ionization and Zeolite Media an alternative to chemical treatmentmdashcoppersilver ions kill bio-matter to reduce scale build-up and also act as seed crystals for the formation of scale (calcite) crystallization is completed in the zeolite media and backwashed out of system daily
bull Ozonation System an alternative to chemical treatmentmdashozone disinfects water supplies to reduce bleed-off (reduced chemical cost is an added benefit to the ozone method)
E2 Boilers and Steam Systems
Large Federal facilities often use boilers and steam systems in central plants hospitals large office buildings barracks research and development facilities and industrial and process plants The amount of water that is consumed by the system depends on the size and water quality and whether a condensate return is installed and maintained properly The following bullets briefly describe the techniques that can be used to save water in boilers and steam systems
bull Proper Maintenance Routinely inspect and maintain steam traps steam lines and condensate pumps
E1
bull Leak Detection and Repair Routinely inspect for leaks in condensate return line and steam lines
bull Condensate Return Properly maintain condensate return which recycles condensate for reuse in the system thus reducing water and chemical consumption and cost
bull Blow-down Minimize blow-down by maintaining adequate water quality through routine inspection and maintenance of boiler water and fire tubes (reducing scale build-up) continuous monitoring and skimming of the blow-down and automatic chemical treatment to control water quality of makeup water
bull Steam Tracers Shut off steam tracers in the summer (Steam tracers are used for freeze protection in the winter)
bull Boiler Efficiency and Size Replace boilers that are inefficient or over-sized to reduce water requirements
E3 Efficient Irrigation
Many Federal facilities have irrigated landscapemdashoffice buildings and hospitals usually have peripheral turf or landscaped beds and military bases commonly have recreation fields and golf courses These irrigated areas are often sources of large water consumption and are prime targets for efficiency measures Following is a list of typical technologies and techniques that can help to significantly decrease water irrigation consumption This is commonly undertaken through Xeriscapingtrade
The seven principles of Xeriscaping are
1 Appropriate Design Use a design that considers soil types and drainage limits turf area etc so that landscaping requires limited irrigation
2 Soil Improvements Apply appropriate nutrients to soil to help maintain healthy plants which results in more resilient and drought resistant plants
3 Reduced Turf Area Limit turf to areas for recreation purposes only
4 Mulching Beds Mulch reduces moisture evaporation off surface of beds and controls weed growth
5 Efficient Irrigation (also see retrofit options below)
E2
Early morning or late evening watering reduces evaporation Automatic irrigation controls Appropriate watering schedule to fit plant need and climate Deep watering less often Soil moisture sensor (tensiometer) or rain sensor connected to controls to
avoid over-watering
6 Climate-appropriate plants Native and other low-water-demand plants that are specifically geared for the particular region reduce both water requirements and maintenance
7 Maintenance
Proper maintenance and adjustments of sprinkler heads ensures appropriate watering
Routine inspection of irrigation system for leaks and broken heads Maintain weeds fertilize properly and prune as recommended
Efficient Irrigation Retrofit Options
bull Low-Volume Drip System Applies water at a constant rate directly to the root zone of the plant eliminating runoff and over-spray and limiting evaporation
bull Sub-Surface Drip System Delivers water to root zone of the plant through underground piping eliminating runoff over-spray evaporation and reducing maintenance requirements
bull Weather Based Irrigation System Control system that irrigates based on the evapotranspiration rate requirement of the landscape by downloading this information from a local weather station This type of system can be fine tuned to deliver the exact water needs of the plant
bull Reuse System Reuses water from other applications such as cooling tower bleed-off or other reclaimed water to irrigate recreational fields or golf courses (For example Fort Carson Army Base uses treated water from the sewer treatment plant to irrigate the Basersquos golf course)
E3
E4 Ozonated Laundering
Ozone acts as a biocide destroying bacteria by rupturing cell membranes In this way ozonated laundering systems act as a bleaching agent that disinfects fabric Ozonated laundering systems are most appropriate for applications where laundry does not get overly soiled and where disinfection is an important feature that is needed such as hospitals Also ozone laundering is appropriate for facilities that launder large amounts of towels and sheets such as barracks and other lodging type buildings
Key benefits to ozonated laundering are
bull Water Savings Ozone process requires no rinsing
bull Energy Savings Heated water is not required in the ozone process because cold water absorbs more ozone
bull Elimination of Detergent Ozone replaces the need for detergent (except in heavily soiled clothing where detergent is combined with ozone)
E5 Leak Detection and Repair
Water distribution systems often are huge sources of water loss especially in the case of military bases that have old (pre-1940s) systems Leaks often occur from loose joints or service connections in the system and corrosion splits and cracks along the piping wall Typically leak detection is done as part of a comprehensive water audit to help determine the source of unaccounted-for water consumption at the site Leak detection is often done by outside contractors because determining the exact location of a leak requires training and appropriate tools Sample leak detection technology includes listening devices (sonic for metal piping or ultrasonic for PVC piping) aerial thermal imaging and sub-floor water leak alarm systems
Some of the key benefits to regular system audits leak detection and repair programs are as follows
bull Reduced water loss
bull Lowered cost for high-quality water (pumping treating etc)
bull Reduced operating costs
bull Increased knowledge of the system
E4
bull Reduced legal liability and potential property damage caused by leaks thus lowering insurance costs
bull Safer and more reliable system (less likely to have contaminated water supply increased reliability of fire protection systems)
bull Better use of resources that ensure more reliable supply for the future
E6 Single-Pass Cooling
Single-pass or once-through cooling systems provide an opportunity for significant water savings In these systems water is circulated once through a piece of equipment and then disposed to drain By comparison to remove the same heat load single-pass systems use 40 times more water than a cooling tower operated at 5 cycles of concentration
Operations and Maintenance Improvements
bull Ensure that procedures are in place to turn off the water supply when the single-pass cooling equipment is not in operation Some equipment both old and new allows water to constantly run even when the equipment is turned off
bull Check entering and leaving water temperatures and flow rates to ensure they are within manufacturerrsquos recommendations For maximum water savings the flow rate should be near the minimum allowed by the manufacturer This can produce significant water savings
bull Balancing valves are sometimes not installed or they are not properly adjusted and left in the wide open position Once the valves are properly set they should be marked (or fixed) in position to avoid future adjustment
bull Ensure that all appropriate employees are trained in OampM procedures
RetrofitReplacement Options
bull Modify equipment to operate on a closed loop that recirculates the water instead of discharging it
bull When the opportunity arises replace the water-cooled equipment with more efficient air-cooled equipment
bull Find another use for single-pass effluent such as boiler make-up cooling tower make-up supply or landscape irrigation Savings for this reuse include both the associated water procurement costs as well as the sewer charges
E5
bull Be aware that some effluent may be contaminated (such as that coming from degreasers hydraulic equipment or cooling systems) and not fit for reuse Contaminated effluent should never be used in boilers because of the potential to hamper proper boiler operation
E6
APPENDIX F
Water and Sewer Historical Rate Data at DoD Sites
Appendix F - Water and Sewer Historical Rate Data at DoD Sites
A study of DoD rates [Fitzpatrick et al 1995] in the US Army Forces Command (FORSCOM) sites found combined water and sewer rates at 10 Army bases vary between a low of $0551000 gal to a high of $4341000 gal The study found the variance to be more a function of inconsistencies in rate calculation from site to site than in actual cost of water The weighted (by daily water consumption) average combined cost from these 10 FORSCOM sites is $1291000 gal Table F1 shows the findings of this study It should be noted that rates provided in this study are not current and further investigation into varying water rates among military installations should be examined because it greatly affects the cost-effectiveness of water efficiency technologies However this investigation is out of the scope of this report
Table F1 FORSCOM Average Water and Sewer Rates
Installation
Average Water Use
(million galday) Water Rates ($1000 gal)
Sewer Rates ($1000 gal)
Combined Water Sewer Rates
($1000 gal) Fort Bragg 606 $034 $021 $055 Fort Campbell 467 $043 $054 $097 Fort Carson 284 $182 $142 $324 Fort Dix 192 $181 $253 $434 Fort Drum 202 $034 $112 $147 Fort Hood 622 $027 $032 $059 Fort Lewis 601 $023 $045 $068 Fort Polk 502 $092 $091 $183 Fort Sam Houston 340 $034 $142 $176 Fort Stewart 311 $014 $044 $058 Weighted Average $055 $074 $129
F1
F2
Electronic Distribution
OFFSITE PNSO
Environmental Protection Agency B Edwards Attn John Flowers williamedwardspnlgov flowersjohnepagov
Pacific Northwest National Environmental Protection Agency LaboratoryAttn Stephanie Tanner
tannerstephanieepagov B Chvala J Dirks
Resource Wise D Elliott Attn Lonnie Burke A Nicholls lrburkewansnet G Parker
S Parker US Department of Energy W Sandusky Federal Energy Management Prog S Shankle Attn Joan Glickman R Skaggs joanglickmaneedoegov A Solana
G Sullivan US Department of Energy Federal Energy Management Prog Attn Tatiana Strajnic tatianastraijniceedoegov
Water Management Inc Attn Russ Horner
russ_hornerwatermgmtcom
Water Management Inc Attn Tom Horner
tom_hornerwatermgmtcom
Distr1
- Summary
- Acknowledgements
- Table of Contents
- 10 Introduction
- 20 Federal Legislation Rulings Intrpretations and Action Toward Water Conservation Goals
- 30 Appropriate Water Conservation Technologies Savings and Applications
- 40 Cost-Effectiveness of Implementing Water Conservation
- 50 Cost-Effective Savings Potential in the Federal Sector
- 60 Needs and Recommended Requirements for Successful Performance Contracting
- 70 References
- Appendix A
- Appendix B
- Appendix C
- Appendix D
- Appendix E
- Appendix F
-
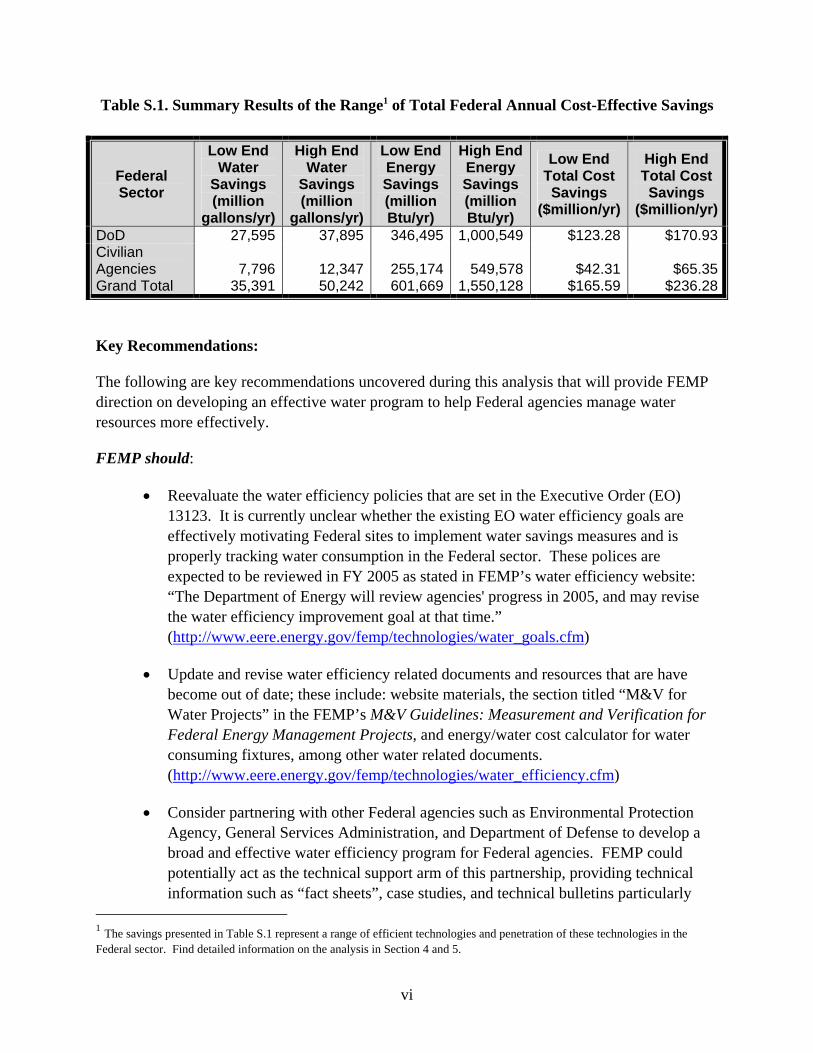