update of a rapid prototyping capability experiment to evaluate cris / atms observations for a...
Post on 20-Dec-2015
219 views
TRANSCRIPT
Update of A Rapid Prototyping Capability Experiment to
Evaluate CrIS / ATMS Observations fora Mesoscale Weather Event
Valentine G. Anantharaj Xingang FanChristopher M. Hill Patrick J. Fitzpatrick Yongzuo Li
Michiko Masutani Lars-Peter Riishojgaard
February 24, 2009
1
General Overview• National Polar-orbiting Operational Environmental Satellite System
(NPOESS) to be launched in 2013
• preceding NPOESS Preparatory Project (NPP) to be launched in 2010
• component sensors of NPOESS and NPP to include:
– Advanced Technology Microwave Sounder (ATMS)• across track scanning microwave radiometer• cross-track resolution: 15.0 km
– Cross-track Infrared Sounder (CrIS)• Fourier transform spectrometer • cross-track resolution: 14.0 km• vertical resolution: ~ 3.0 km
• Combination of ATMS / CrIS should improve profiles of T and q
• Mesoscale OSSE needed to assess the impact of ATMS / CrIS
222
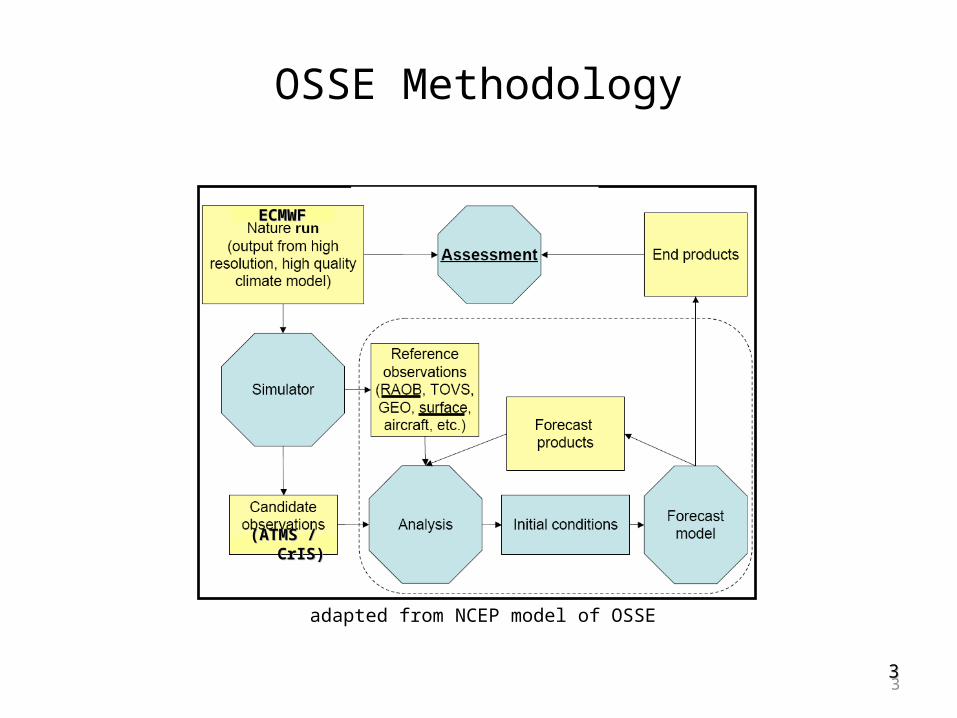
OSSE Methodology
33
(ATMS / CrIS)(ATMS / CrIS)
ECMWFECMWF
adapted from NCEP model of OSSE
3
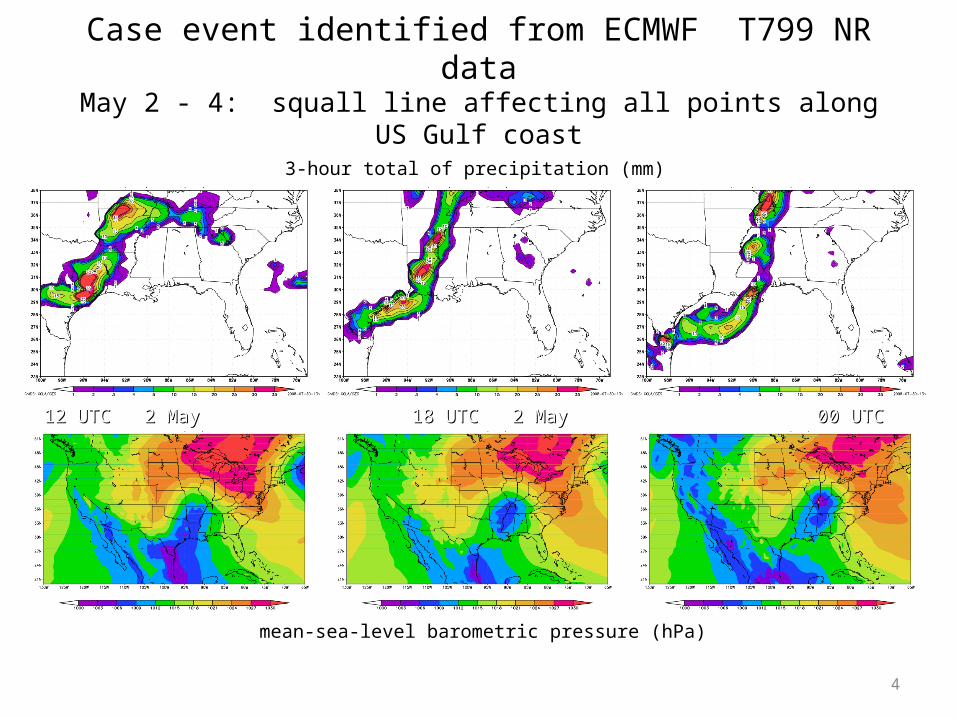
Case event identified from ECMWF T799 NR dataMay 2 - 4: squall line affecting all points along US Gulf coast
mean-sea-level barometric pressure (hPa)
3-hour total of precipitation (mm)
12 UTC 2 May12 UTC 2 May 18 UTC 2 May 18 UTC 2 May 00 UTC 3 May 00 UTC 3 May
4
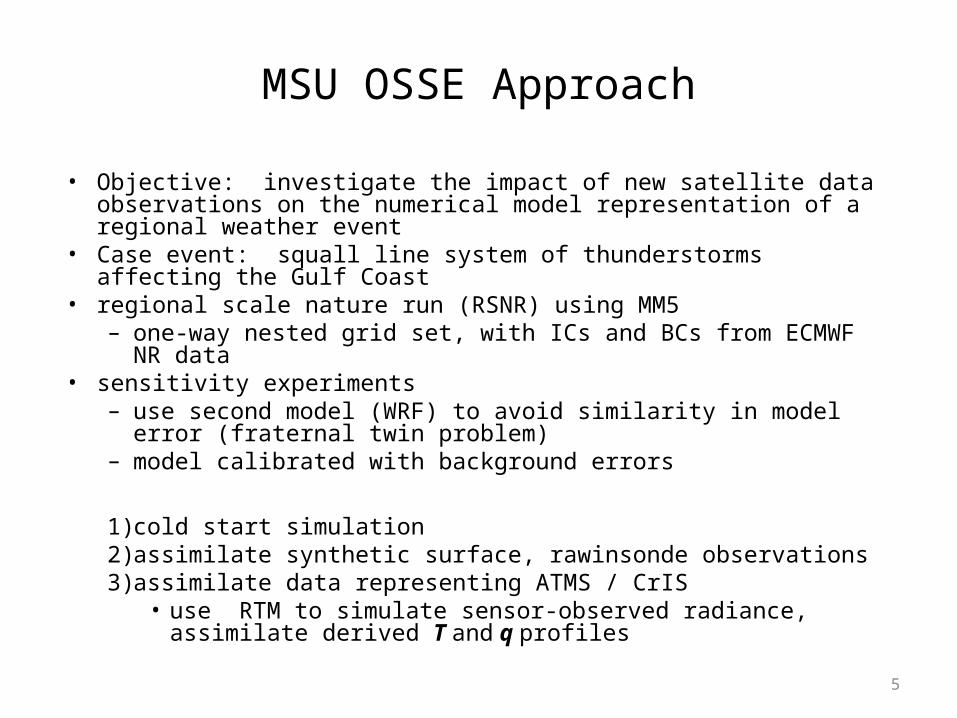
MSU OSSE Approach
• Objective: investigate the impact of new satellite data observations on the numerical model representation of a regional weather event
• Case event: squall line system of thunderstorms affecting the Gulf Coast
• regional scale nature run (RSNR) using MM5– one-way nested grid set, with ICs and BCs from ECMWF NR data
• sensitivity experiments– use second model (WRF) to avoid similarity in model error
(fraternal twin problem)– model calibrated with background errors
1) cold start simulation2) assimilate synthetic surface, rawinsonde observations3) assimilate data representing ATMS / CrIS
• use RTM to simulate sensor-observed radiance, assimilate derived T and q profiles
5
Regional scale nature run (RSNR)
Map image adopted from Shuttle Radar Topography MissionMap image adopted from Shuttle Radar Topography Mission
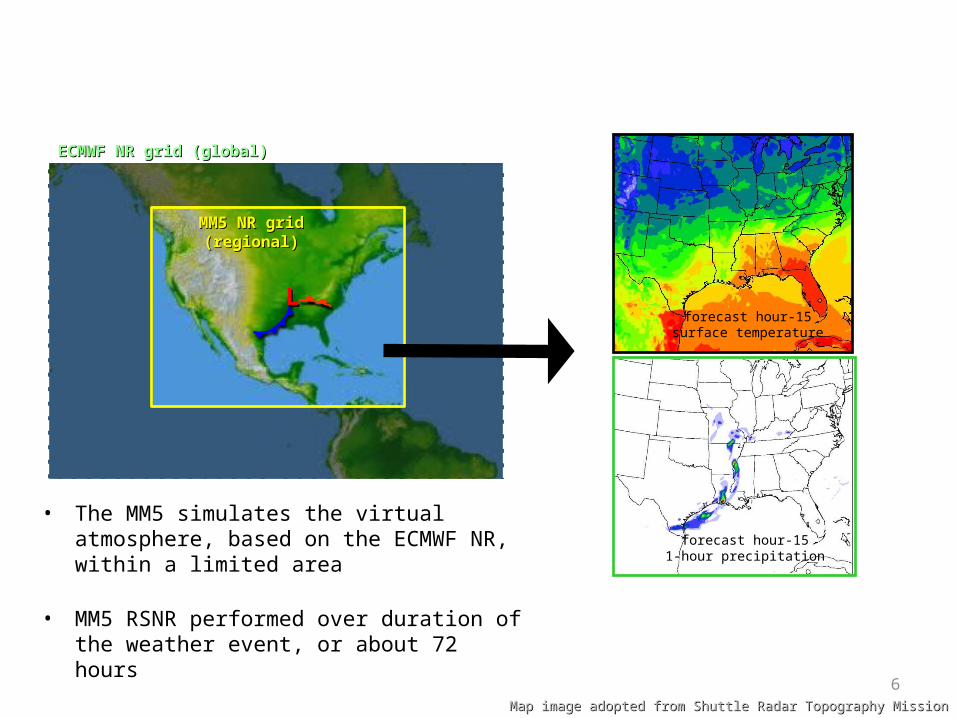
• The MM5 simulates the virtual atmosphere, based on the ECMWF NR, within a limited area
• MM5 RSNR performed over duration of the weather event, or about 72 hours
ECMWF NR grid (global)ECMWF NR grid (global)
MM5 NR grid (regional)MM5 NR grid (regional)
LLforecast hour-15
surface temperature
forecast hour-151-hour precipitation
6
ECMWF NR grid (global)ECMWF NR grid (global)
WRF nest gridWRF nest grid
MM5 NR grid (regional)MM5 NR grid (regional)
MM5 nest gridMM5 nest grid
LL
Data assimilation experiments
Map image adopted from Shuttle Radar Topography MissionMap image adopted from Shuttle Radar Topography Mission
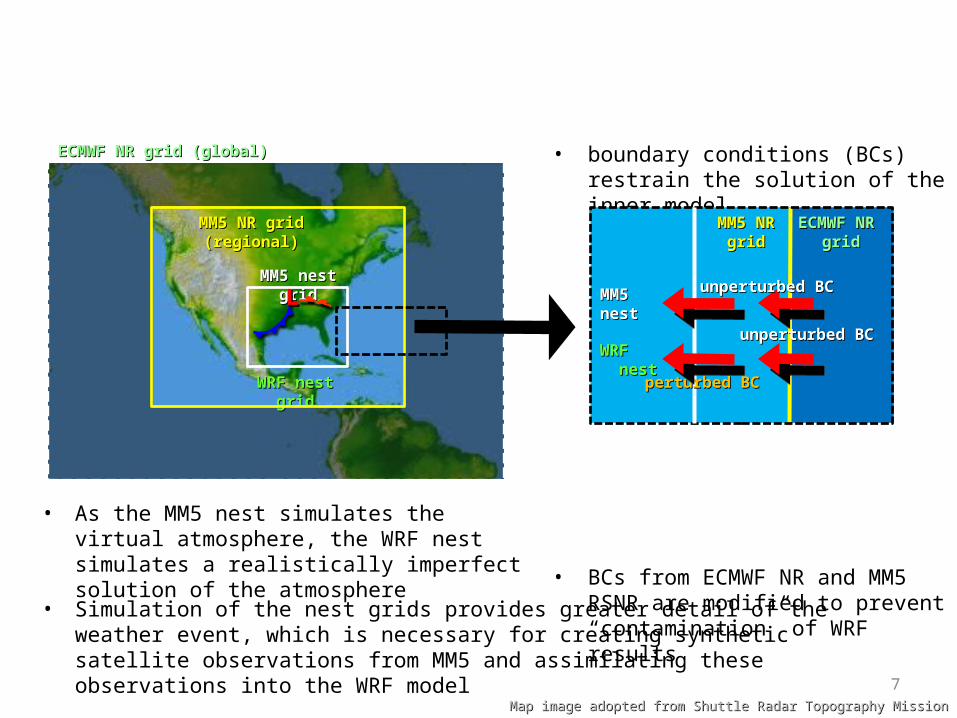
• As the MM5 nest simulates the virtual atmosphere, the WRF nest simulates a realistically imperfect solution of the atmosphere
• boundary conditions (BCs) restrain the solution of the inner model
• BCs from ECMWF NR and MM5 RSNR are modified to prevent “contamination” of WRF results
MM5MM5nestnest
MM5 NRMM5 NRgridgrid
ECMWF NR ECMWF NR grid grid
WRF WRF nestnest
perturbed BCperturbed BC
unperturbed BCunperturbed BC
unperturbed BCunperturbed BC
• Simulation of the nest grids provides greater detail of the weather event, which is necessary for creating synthetic satellite observations from MM5 and assimilating these observations into the WRF model
7
ECMWF NR grid (global)ECMWF NR grid (global)
WRF nest gridWRF nest grid
MM5 NR grid (regional)MM5 NR grid (regional)
MM5 nest gridMM5 nest grid
LL
Data assimilation experiments
Map image adopted from Shuttle Radar Topography MissionMap image adopted from Shuttle Radar Topography Mission
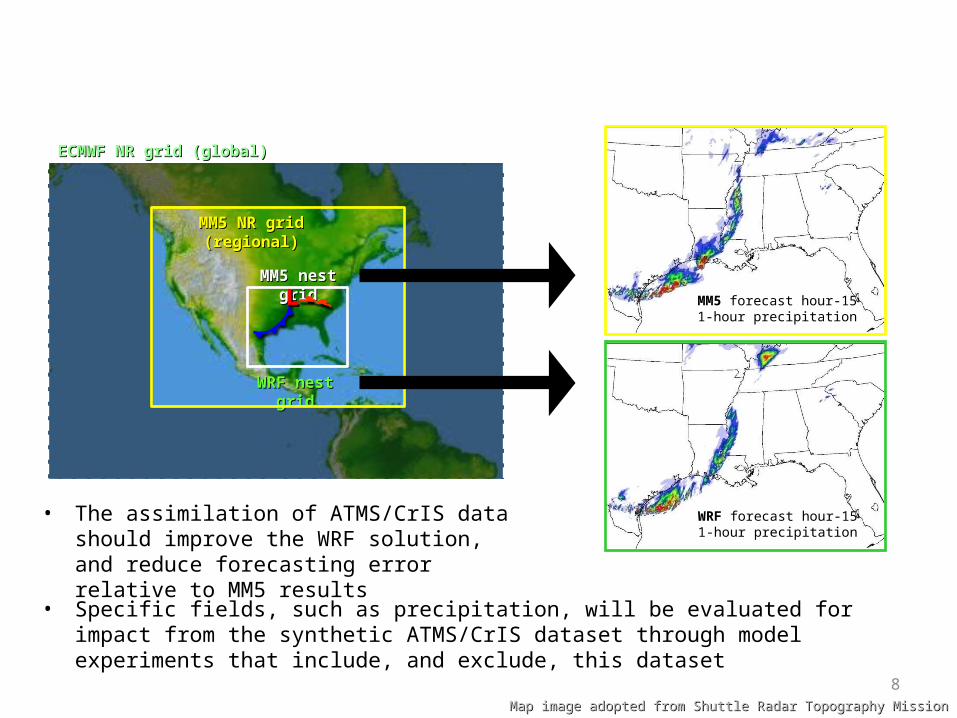
• The assimilation of ATMS/CrIS data should improve the WRF solution, and reduce forecasting error relative to MM5 results
MM5 forecast hour-151-hour precipitation
WRF forecast hour-151-hour precipitation
• Specific fields, such as precipitation, will be evaluated for impact from the synthetic ATMS/CrIS dataset through model experiments that include, and exclude, this dataset
8
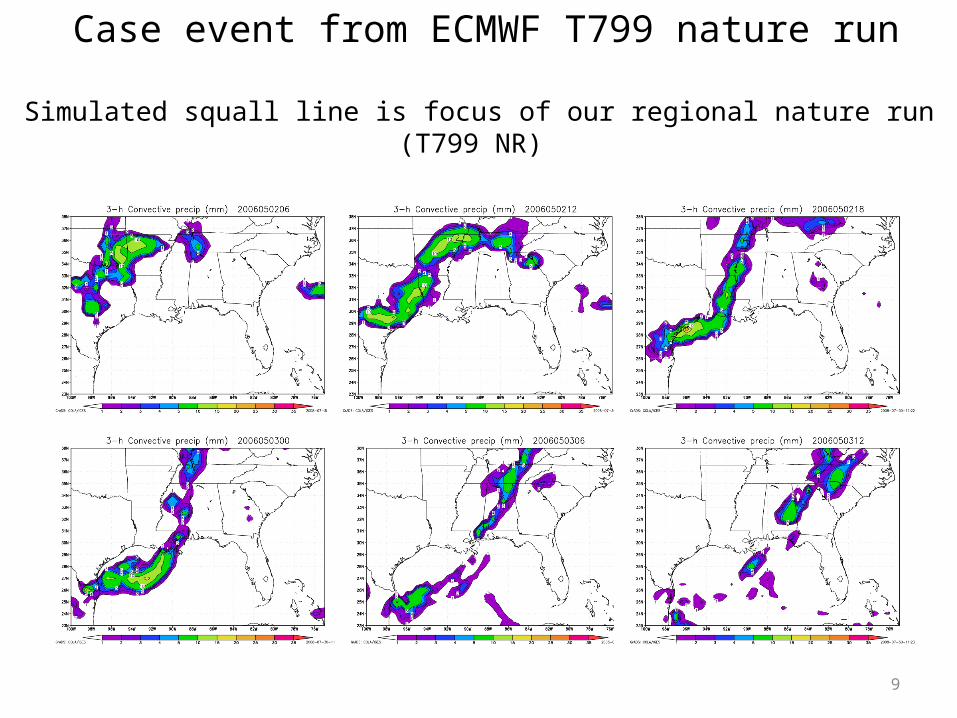
Case event from ECMWF T799 nature run
Simulated squall line is focus of our regional nature run(T799 NR)
9
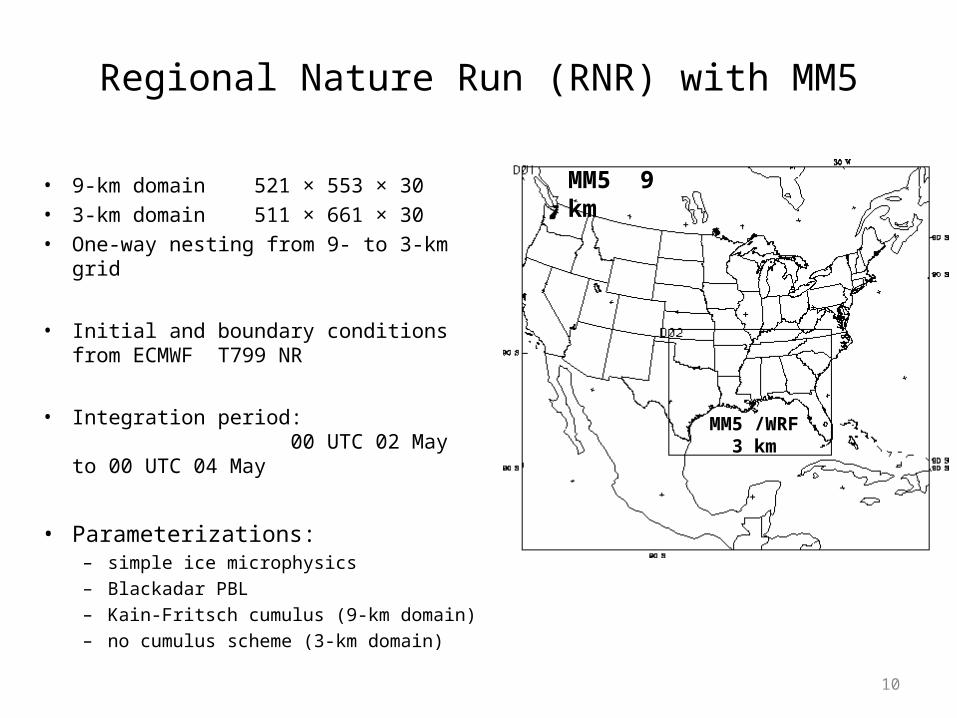
Regional Nature Run (RNR) with MM5
• 9-km domain 521 × 553 × 30
• 3-km domain 511 × 661 × 30
• One-way nesting from 9- to 3-km grid
• Initial and boundary conditions from ECMWF T799 NR
• Integration period: 00 UTC 02 May to 00 UTC 04 May
• Parameterizations:– simple ice microphysics
– Blackadar PBL
– Kain-Fritsch cumulus (9-km domain)
– no cumulus scheme (3-km domain)
MM5 /WRF3 km
MM5 9 km
10
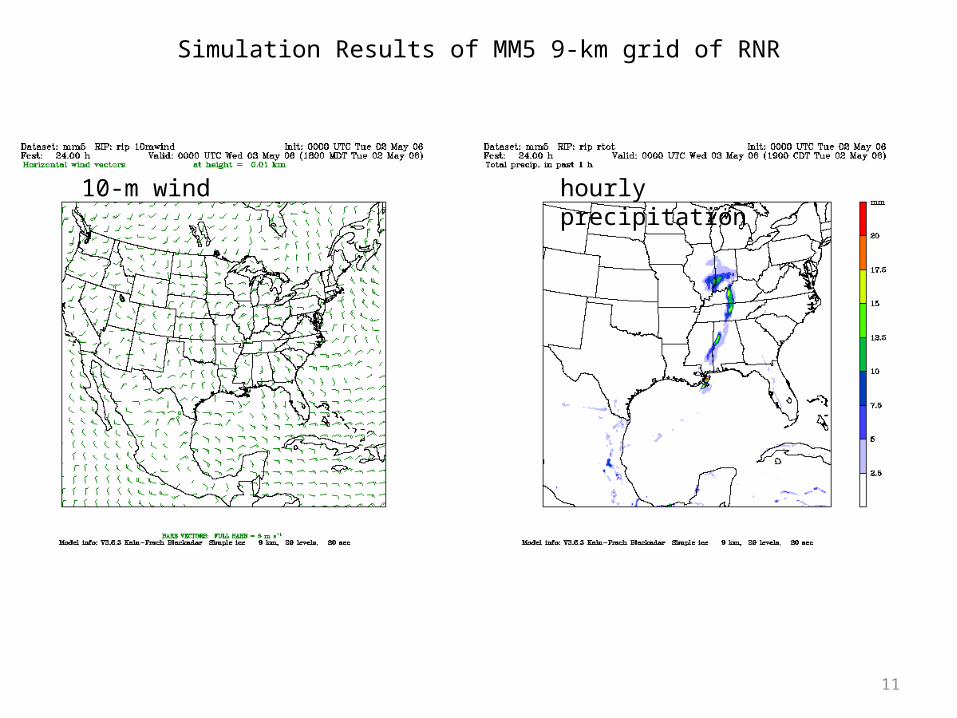
Simulation Results of MM5 9-km grid of RNR
10-m wind hourly precipitation
11
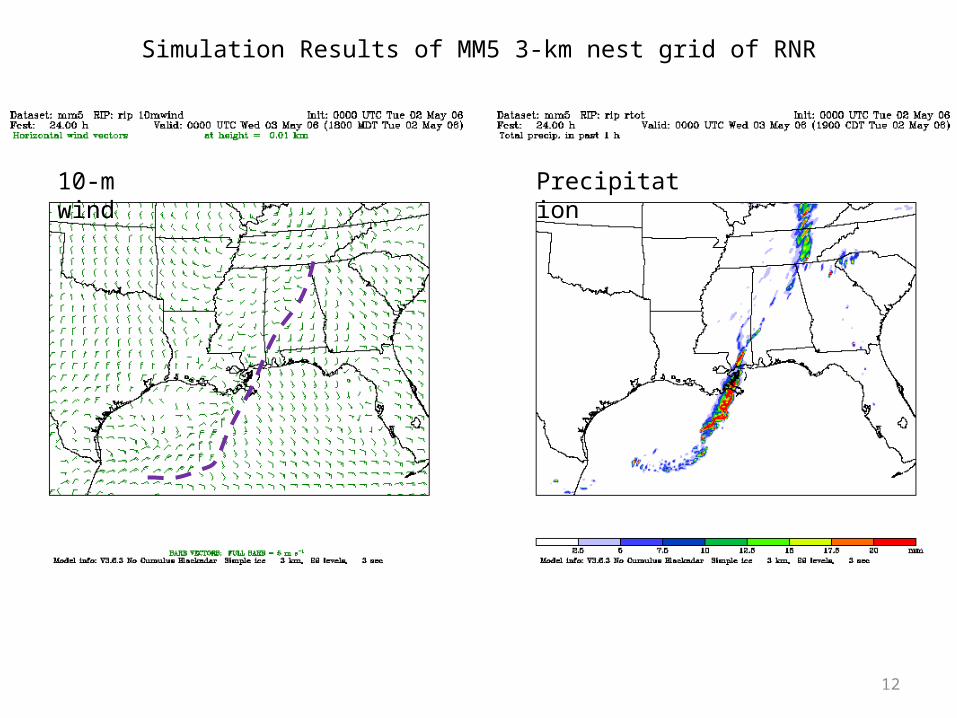
Simulation Results of MM5 3-km nest grid of RNR
10-m wind Precipitation
12
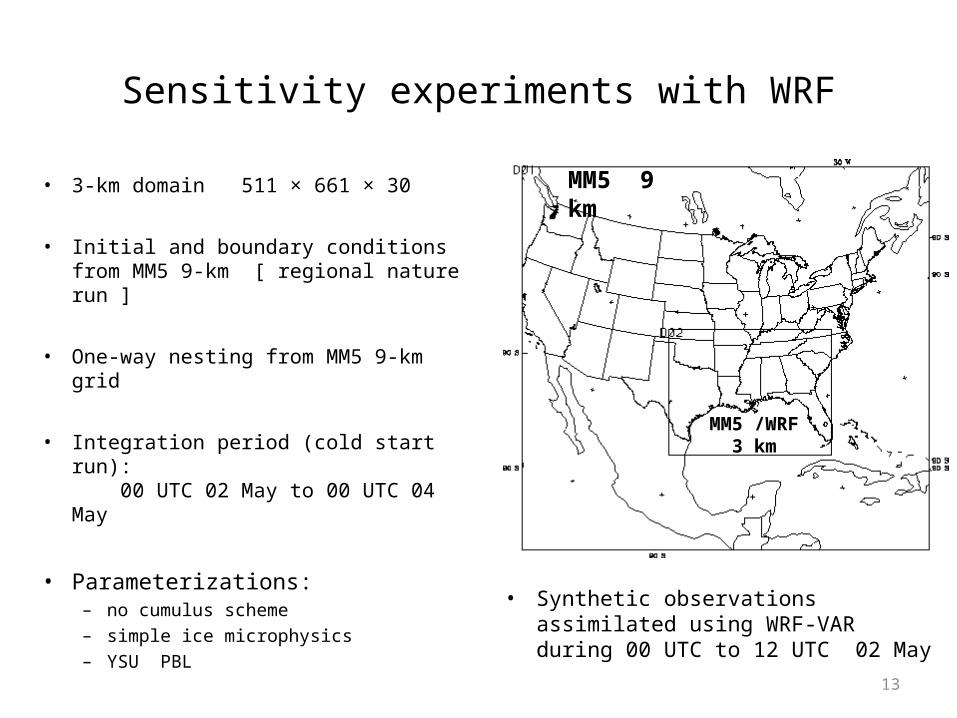
Sensitivity experiments with WRF
• 3-km domain 511 × 661 × 30
• Initial and boundary conditions from MM5 9-km [ regional nature run ]
• One-way nesting from MM5 9-km grid
• Integration period (cold start run): 00 UTC 02 May to 00 UTC 04 May
• Parameterizations:– no cumulus scheme
– simple ice microphysics
– YSU PBL
MM5 /WRF3 km
MM5 9 km
• Synthetic observations assimilated using WRF-VAR during 00 UTC to 12 UTC 02 May
13
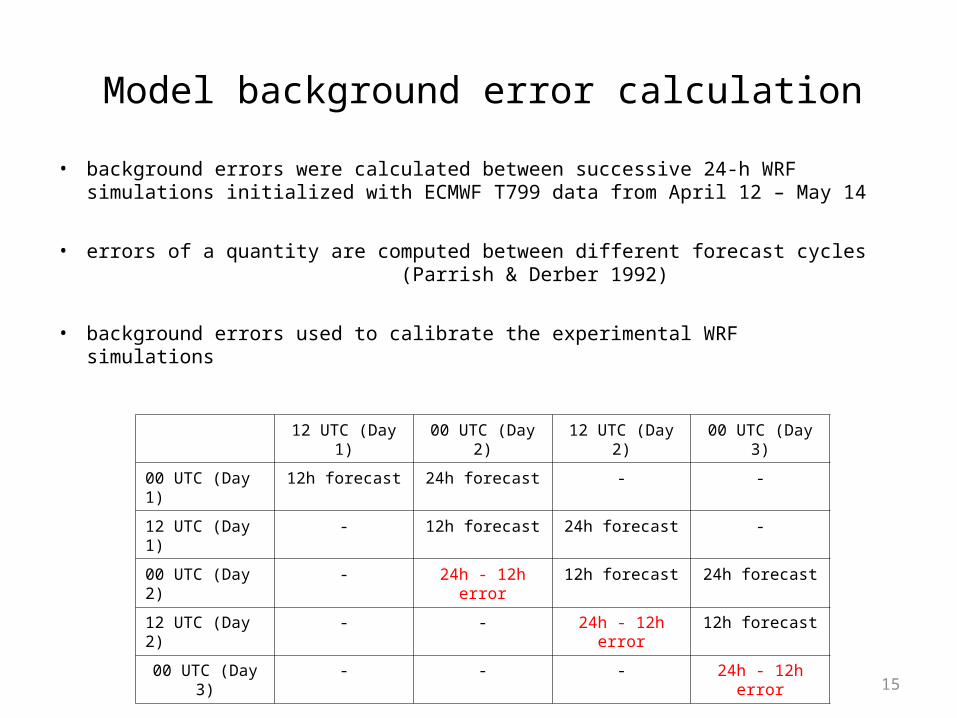
Model background error calculation
• background errors were calculated between successive 24-h WRF simulations initialized with ECMWF T799 data from April 12 – May 14
• errors of a quantity are computed between different forecast cycles (Parrish & Derber 1992)
• background errors used to calibrate the experimental WRF simulations
12 UTC (Day 1) 00 UTC (Day 2) 12 UTC (Day 2) 00 UTC (Day 3)
00 UTC (Day 1) 12h forecast 24h forecast - -
12 UTC (Day 1) - 12h forecast 24h forecast -
00 UTC (Day 2) - 24h - 12h error 12h forecast 24h forecast
12 UTC (Day 2) - - 24h - 12h error 12h forecast
00 UTC (Day 3) - - - 24h - 12h error
15
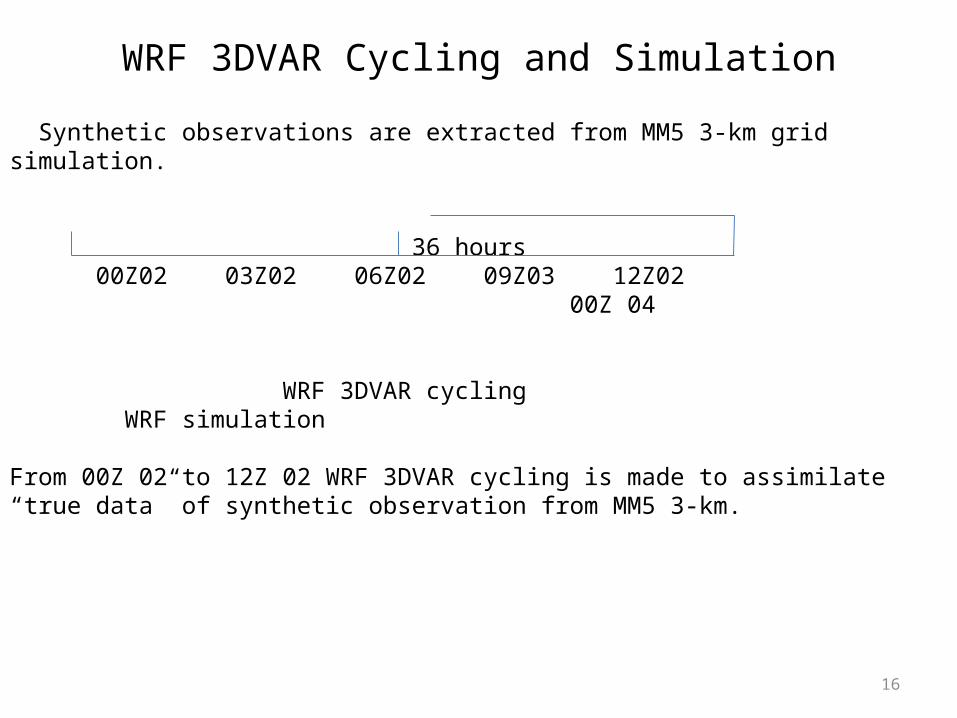
WRF 3DVAR Cycling and Simulation
Synthetic observations are extracted from MM5 3-km grid simulation. 36 hours 00Z02 03Z02 06Z02 09Z03 12Z02 00Z 04 WRF 3DVAR cycling WRF simulation
From 00Z 02 to 12Z 02 WRF 3DVAR cycling is made to assimilate “true data” of synthetic observation from MM5 3-km.
16
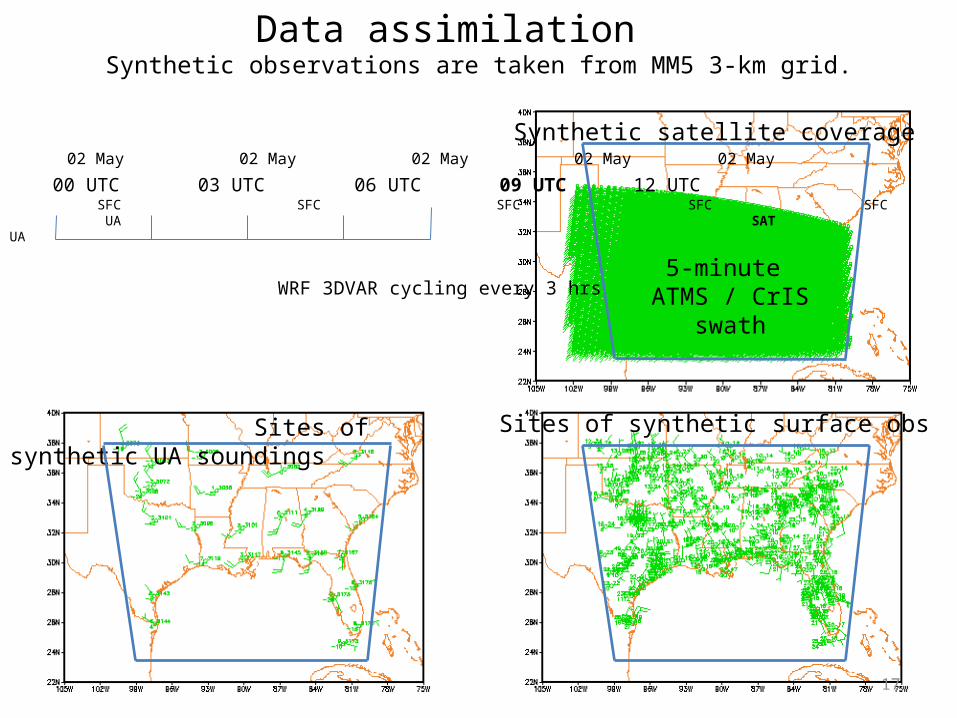
Data assimilation Synthetic observations are taken from MM5 3-km grid.
02 May 02 May 02 May 02 May 02 May
00 UTC 03 UTC 06 UTC 09 UTC 12 UTC SFC SFC SFC SFC SFC UA SAT UA
WRF 3DVAR cycling every 3 hrs
Sites of synthetic UA soundings
5-minute ATMS / CrIS swath
Sites of synthetic surface obs
Synthetic satellite coverage
17
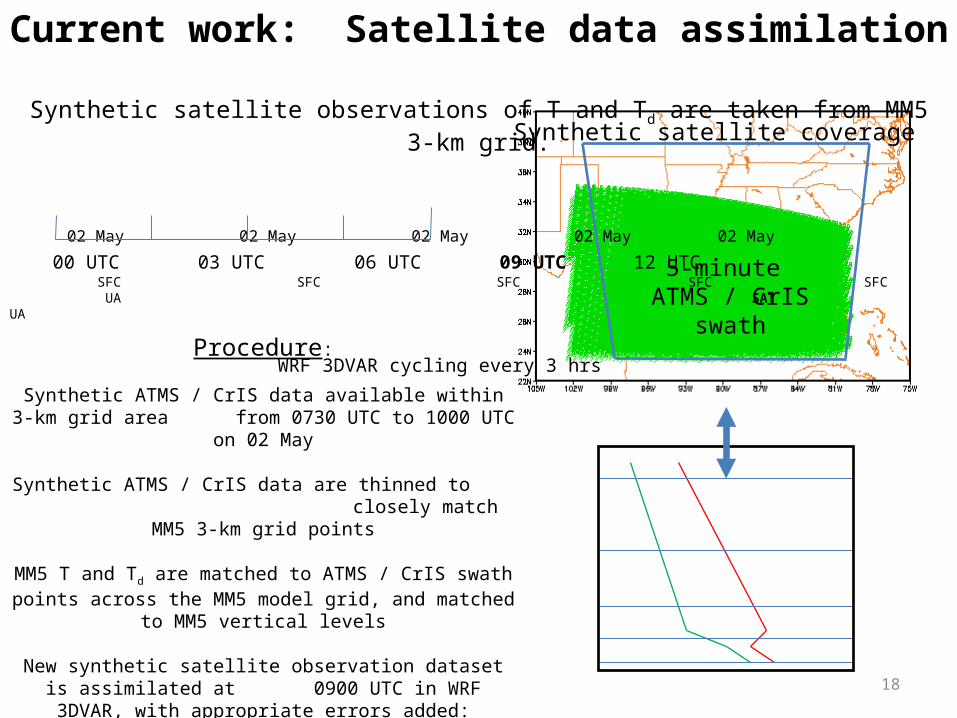
Current work: Satellite data assimilation Synthetic satellite observations of T and Td are taken from MM5 3-km grid.
02 May 02 May 02 May 02 May 02 May
00 UTC 03 UTC 06 UTC 09 UTC 12 UTC SFC SFC SFC SFC SFC UA SAT UA
WRF 3DVAR cycling every 3 hrs 5-minute ATMS / CrIS swath
Synthetic satellite coverage
Procedure:
Synthetic ATMS / CrIS data available within 3-km grid area from 0730 UTC to 1000 UTC on 02 May
Synthetic ATMS / CrIS data are thinned to closely match MM5 3-km grid points
MM5 T and Td are matched to ATMS / CrIS swath points across the MM5 model grid, and matched to MM5 vertical levels
New synthetic satellite observation dataset is assimilated at 0900 UTC in WRF 3DVAR, with appropriate errors added:
T (± 1K) Td (± 2K)
18
Comparison of MM5 and WRF Simulations
A comparison of simulation results from MM5, WRF with no data assimilation (cold start), and WRF with assimilation of synthetic surface and upper-air observations is made in this section. Only subtle differences are seen between the MM5 and WRF results.
Hourly precipitation, sea level pressure, and 2-meter dew point temperature are compared in following slides.
19
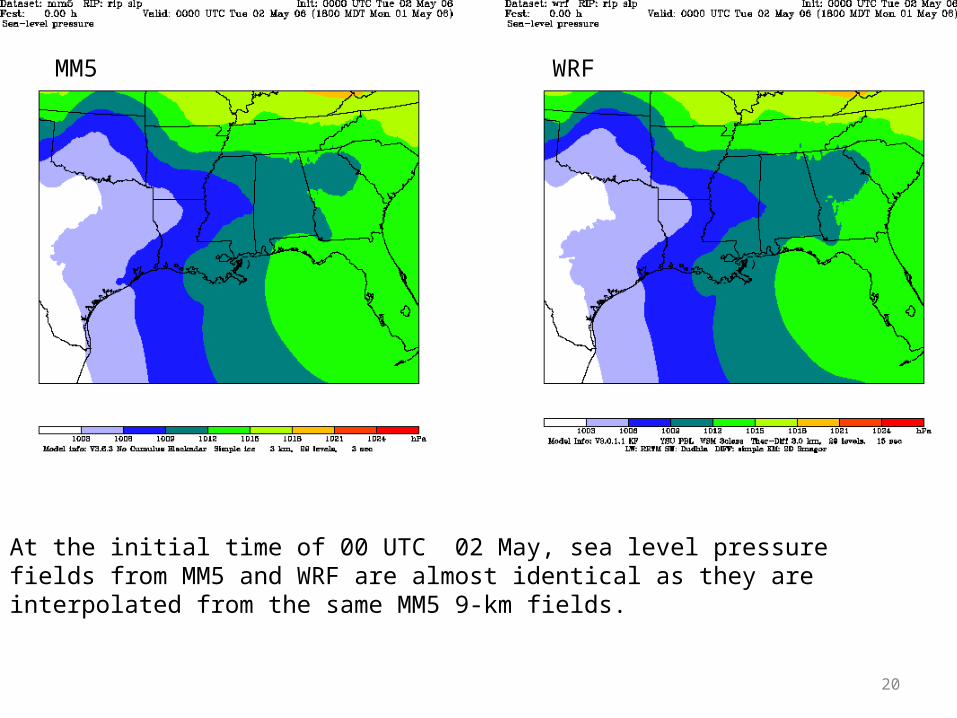
At the initial time of 00 UTC 02 May, sea level pressure fields from MM5 and WRF are almost identical as they are interpolated from the same MM5 9-km fields.
MM5 WRF
20
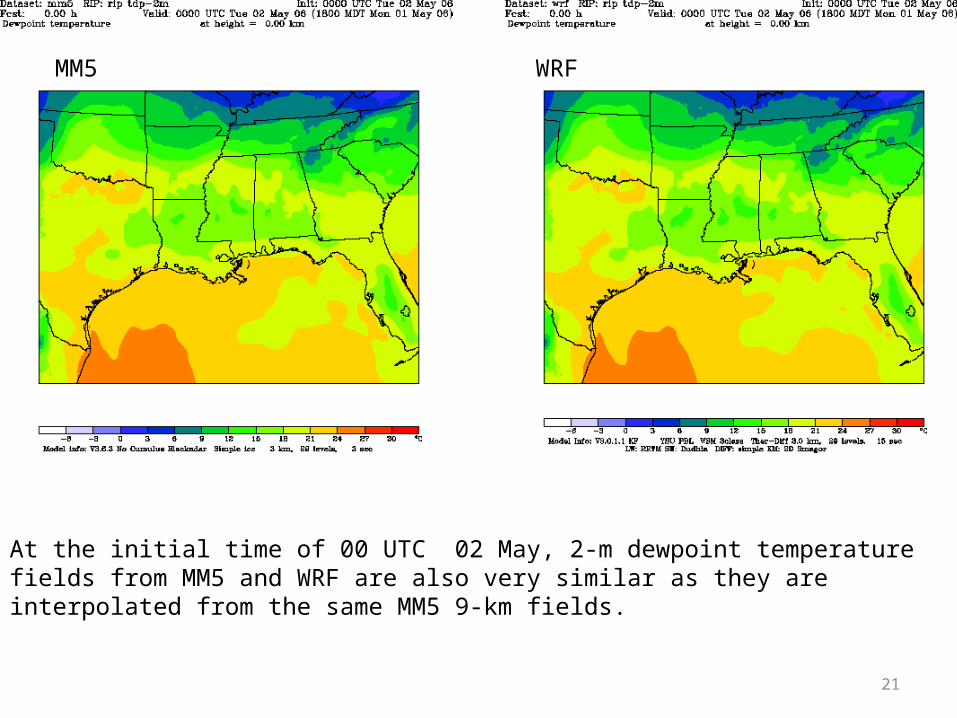
At the initial time of 00 UTC 02 May, 2-m dewpoint temperature fields from MM5 and WRF are also very similar as they are interpolated from the same MM5 9-km fields.
MM5 WRF
21
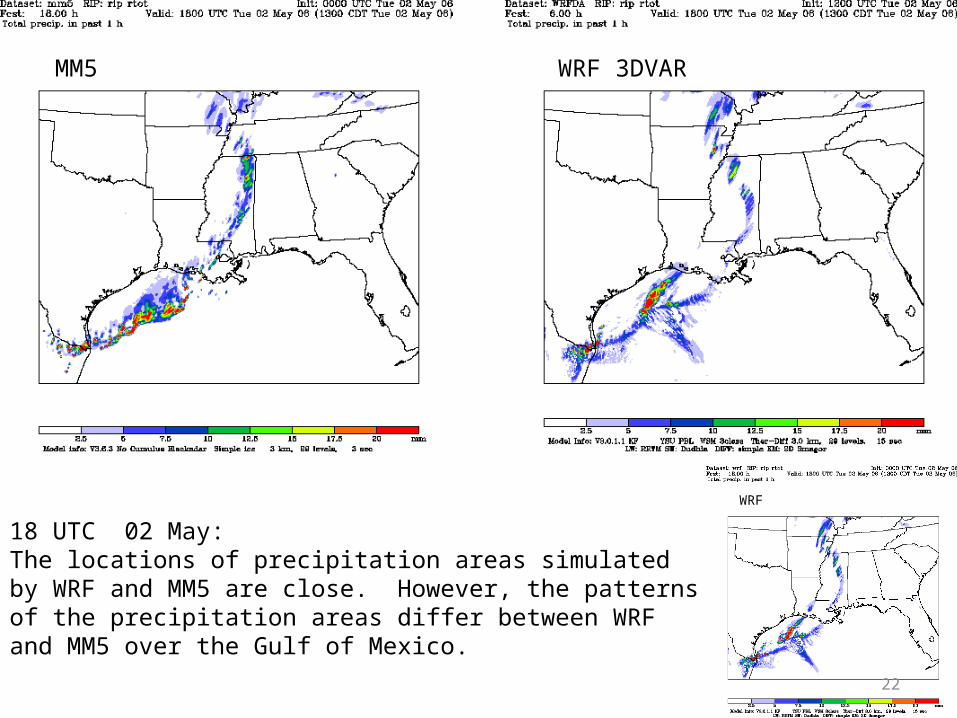
18 UTC 02 May:The locations of precipitation areas simulated by WRF and MM5 are close. However, the patterns of the precipitation areas differ between WRF and MM5 over the Gulf of Mexico.
MM5 WRF 3DVAR
WRF
22
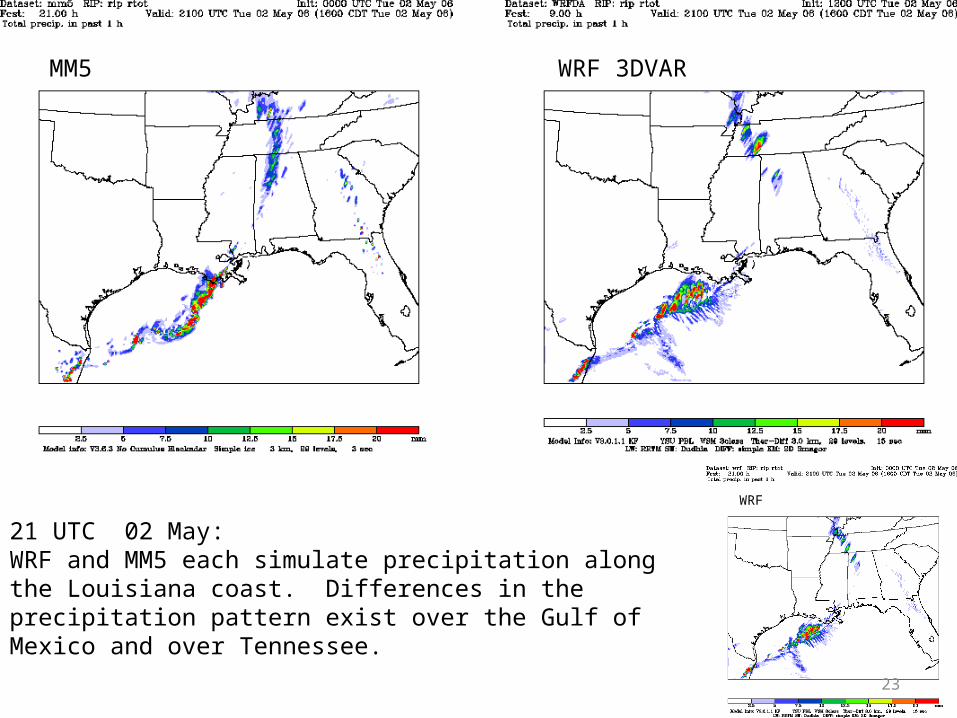
21 UTC 02 May:WRF and MM5 each simulate precipitation along the Louisiana coast. Differences in the precipitation pattern exist over the Gulf of Mexico and over Tennessee.
MM5 WRF 3DVAR
WRF
23
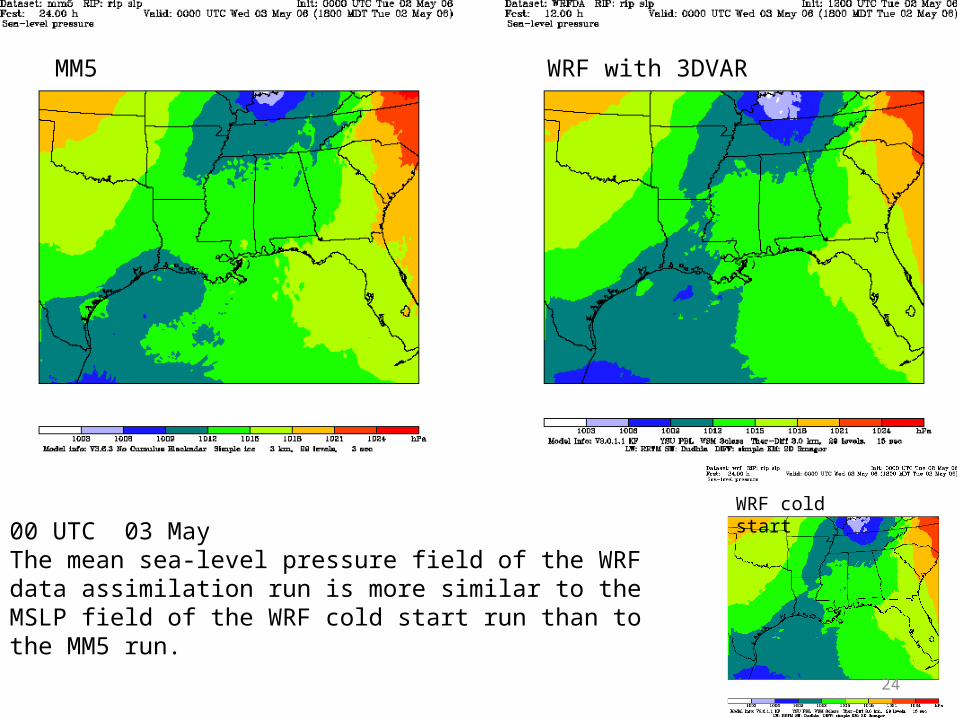
00 UTC 03 MayThe mean sea-level pressure field of the WRF data assimilation run is more similar to the MSLP field of the WRF cold start run than to the MM5 run.
MM5 WRF with 3DVAR
WRF cold start
24
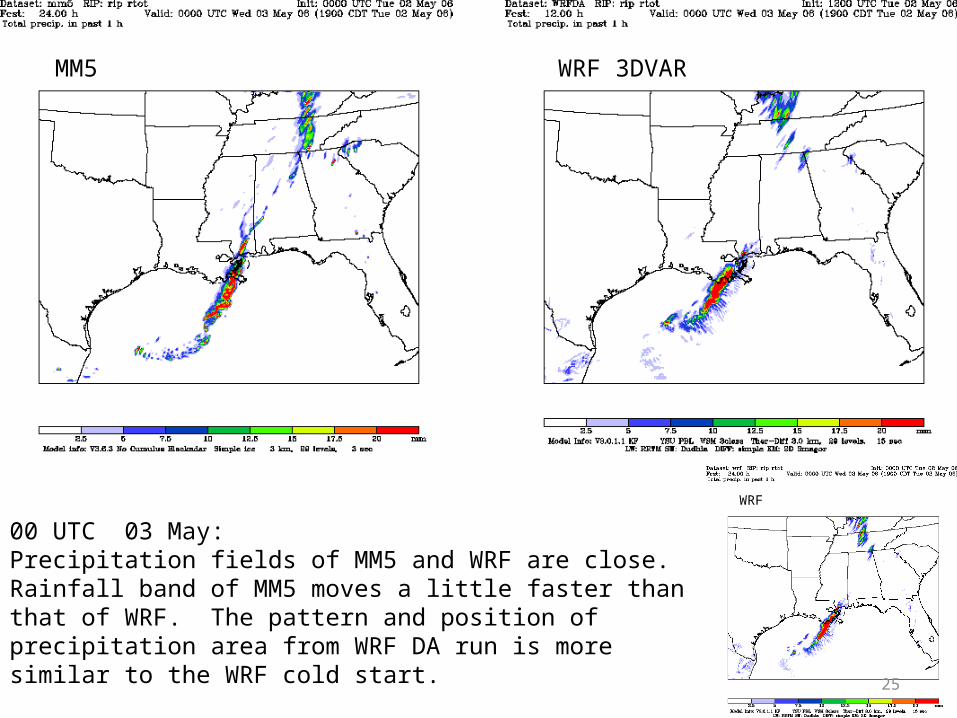
00 UTC 03 May:Precipitation fields of MM5 and WRF are close. Rainfall band of MM5 moves a little faster than that of WRF. The pattern and position of precipitation area from WRF DA run is more similar to the WRF cold start.
MM5 WRF 3DVAR
WRF
25

03 UTC 03 May:Precipitation fields of MM5 and WRF are close. Rainfall band of MM5 still moves a little faster than that of WRF. The pattern and position of precipitation area from WRF DA run is more similar to the WRF cold start.
MM5 WRF 3DVAR
WRF
26
Future Plans
• WRF data assimilation experiments• Evaluation
27