update and progress report on higher education joint meeting of house and senate education...
TRANSCRIPT

Update and Progress Report on Higher Education
Joint Meeting of House and Senate Education Committees
January 22, 2014

Board of Regents Nine Member Board Appointed by the Governor and
Confirmed by the Senate Current Board Members
• Shane Bangerter – Dodge City, 2013• Ann Brandau-Murguia – Kansas City, 2013• Mildred Edwards – Wichita, 2010• Tim Emert – Independence, 2010• Fred Logan (Chair) – Leawood, 2011• Ed McKechnie – Arcadia, 2010• Robba Moran – Hays, 2011• Helen Van Etten – Topeka, 2013• Kenny Wilk (Vice-Chair) – Lansing, 2011

Board of Regents Responsibilities Govern six state universities and Coordinate 32 public institutions
• 6 State Universities and 1 Municipal University• 19 Community Colleges• 6 Technical Colleges
Administer• State Student Financial Aid• Adult Education Programs• GED • Career Technical Education Programs• Kan-ed Distance Learning Program
Regulate• Private & Out-of-State Institutions
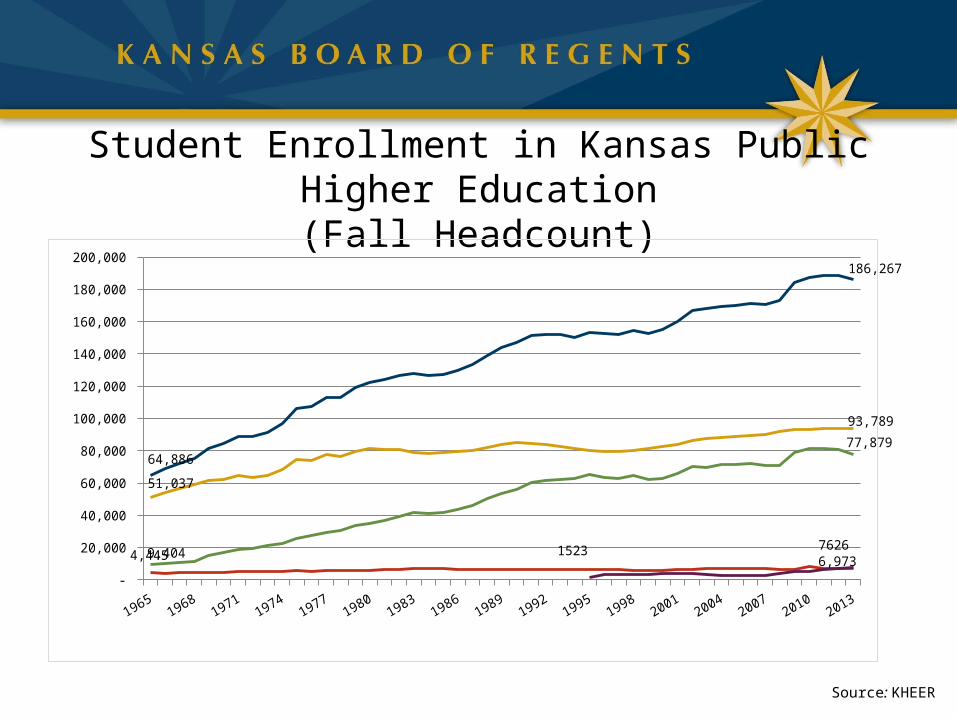
Student Enrollment in Kansas Public Higher Education(Fall Headcount)
Source: KHEER
-
20,000
40,000
60,000
80,000
100,000
120,000
140,000
160,000
180,000
200,000
64,886
186,267
51,037
93,789
4,445 6,973 9,404
77,879
1523 7626
Total State Universities Washburn Community Colleges Technical Colleges

Academic Year Enrollment
'04-'05 '05-'06 '06-'07 '07-'08 '08-'09 '09-'10 '10-'11 '11-'12 '12-'13
Head-count
243470 244591 243726 241173 249087 258296 258822 258952 258934
FTE
127688.80999969
129865.67083373
130852.1499999
131027.98666724
134095.59249956
141441.70750055
144271.0141659
144615.74666707
143513
206,000
218,000
230,000
242,000
254,000
266,000
123,000
129,000
135,000
141,000
147,000
153,000
System Wide, Public
To
tal
Nu
mb
er
of
Stu
de
nts F
ull-tim
e E
qu
iva
len
cy
Source: KHEDS Academic Year Collection 5

State Appropriations for Higher Education
Source: Governor's Budget Office
2007 2008 2009 2010 2011 2012 2013 2014
State Univer-sities
611.28294 638.541355999999
657.411536 574.466689999999
579.112613999999
569.775999000001
579.850535 561.566826999999
Wash-burn Univer-sity
11.467516 12.085745 12.512731 11.058258 11.087963 10.95592 11.13092 10.961222
Two-Year Col-leges
128.449092 140.756976 145.283509 128.395834 128.740737 127.26735 147.01735 144.01735
Other Higher Educa-tion Pro-grams
25.805279 31.455279 31.180748 26.452649 32.495296 32.049022 34.594612 33.735875
Board Office Opera-tions
5.304313 6.390953 6.267306 4.036182 4.11294499999999
3.899616 4.057833 3.982338
Total 782.30914 829.230309 852.65583 744.409613 755.549555 743.947906999999
776.651249999999
754.263612
$50
$150
$250
$350
$450
$550
$650
$750
$850
In M
illi
on
s


2012 Educational DebtPublic University Graduates
Source: College InSight
Kansas Colorado Oklahoma Missouri Nebraska Nation 2011-12 2011-12 2011-12 2011-12 2011-12 2011-120%
10%
20%
30%
40%
50%
60%
70%
80%
90%
100%
$15,000
$17,000
$19,000
$21,000
$23,000
$25,000
$27,000
$29,000
$31,000
$33,000
Percent of graduates with debt Average debt of graduates

2014 Legislative Issues Authority To Enter A MHEC Interstate Reciprocity
Agreement for Online Education Authority to Participate in MHEC Property Insurance
Program Authority to Utilize Education Building Fund for Short
Term Debt Service Proposal to Streamline Procurement Process for
Architectural and Engineering Services Resolution in Support of Board Regents’ Strategic Plan Carryover Bill - ESU Apartment Sale and
Land Exchange – KU/KU Endowment (HB 2396)9

Foresight 2020KBOR Strategic Goals
Increase higher education attainment – 60% percent of adult population with a postsecondary certificate/credential, associate, or bachelor degree by 2020
Improve alignment of higher education with needs of the economy
Ensure state university excellence
10

Board Initiatives to AdvanceForesight 2020
Accelerating Opportunities for Kansans Retention and Graduation Rates Focus on Numbers of Graduates Attract Adults Near Completion Transfer and Articulation Increased Emphasis on Technical Education Collaboration with Commerce and Labor Focus on University Research
11

Number of adult education participants and percentage of participants transitioning
Enrollment in Adult Education Programs
Trend Reversed: the number of Kansans enrolled in adult education is the highest it has been since 2004, due to the introduction of enrollment targets, updated performance-based funding policies, and a new vision focused on college and career readiness.
Adult Education Students Transitioning to Postsecondary Within Three Years

Retention Rates
Graduation Rates

Higher Education in Kansas 32 public higher education institutions In 2013, 258,934 students enrolled Awarded 42,130 degrees (AY2013)
• 10,595 certificates system wide• 9,283 associate degrees system wide• 15,970 bachelor’s degrees• 4,934 master’s degrees• 1,348 doctoral degrees
Source: KHEDS AY2013

Number of certificates and degrees awarded
In AY2013, the Kansas postsecondary system awarded 42,130 credentials – putting the state above goal projections which outline the number that will need to be awarded annually to increase to 60 percent the number of Kansas adults who have a certificate, associate or bachelor’s degree by 2020.
AY2013 Certificate and Degree Production

Attainment Model Pathway

Number of adults returning to college to complete a certificate or degree
Improvement: While there was a decrease in AY2013, there has been a 37.4 percent increase since AY2010 in this student population at the state universities, a 47.5 percent increase at the technical colleges, and a 10.8 percent increase at the community colleges.
Adults with Some College Credit but No Degree Returning

University Engineering Initiative Act
Goal: increase the combined number of engineering graduates at the three research universities to 1,365 annually by 2021 (from a baseline of 875 in 2008).
19% increase in engineering enrollments (since 2008) $15M in scholarships for engineering students (AY2013) Last year, there were a total of 1,017 engineering
graduates:
Kansas State University: 471University of Kansas: 338
Wichita State University: 208

Kansas Nursing Initiative
Goal: Established in 2006, the higher education system was charged with increasing the number of nursing students by 250 per year
The state’s nursing programs now admit a combined annual average of 437 additional students, surpassing the Legislature’s intended goal by 75 percent.
Improvements to facilities has resulted in a strong nursing education infrastructure:
• 218 new full-time faculty and 217 new part-time faculty• 27 new human patient simulators

Percent of graduates employed in Kansas and Average wages earned by graduates
Research conducted Donna Ginther, Professor of Economics and the Director of the Center for Science Technology & Economic Policy at the Institute for Policy & Social Research at the University of Kansas, links Kansas postsecondary data with current labor data, provided by the Kansas Department of Labor.

Increase in proportion of federal research dollars awarded
Federal Research & Development Dollars Awarded, Percent of Total, and Percent Rate of Change

Study of Freshmen Admitted As Exceptions To Qualified Admissions
Retention Rates of Those Meeting QA • 2010 to 2011 = 6072 of 7609 (80%) Resident
1422 of 1851 (77%) Non-Res• 2011 to 2012 = 6124 of 7647 (80%) Resident
1439 of 1871 (77%) Non-Res• 2012 to 2013 = 6403 of 8019 (80%) Resident
1517 of 2015 (75%) Non-Res22

Study of Freshmen Admitted As Exceptions To Qualified Admissions
Retention Rates of Exceptions to QA• 2010 to 2011 = 256 of 457 (56%) Resident• 2011 to 2012 = 226 of 447 (51%) Resident• 2012 to 2013 = 271 of 488 (56%) Resident
148 of 259 (57%) Non-Res
23

Study of Transfers Admitted As Exceptions To Qualified Admissions
Retention Rates of Transfers Who Met QA• 2011 to 2012 = 4469 of 6186 (72%) Resident
2368 of 2937 (81%) Non-Res• 2012 to 2013 = 4470 of 5900 (76%) Resident
2150 of 2743 (78%) Non-Res
24
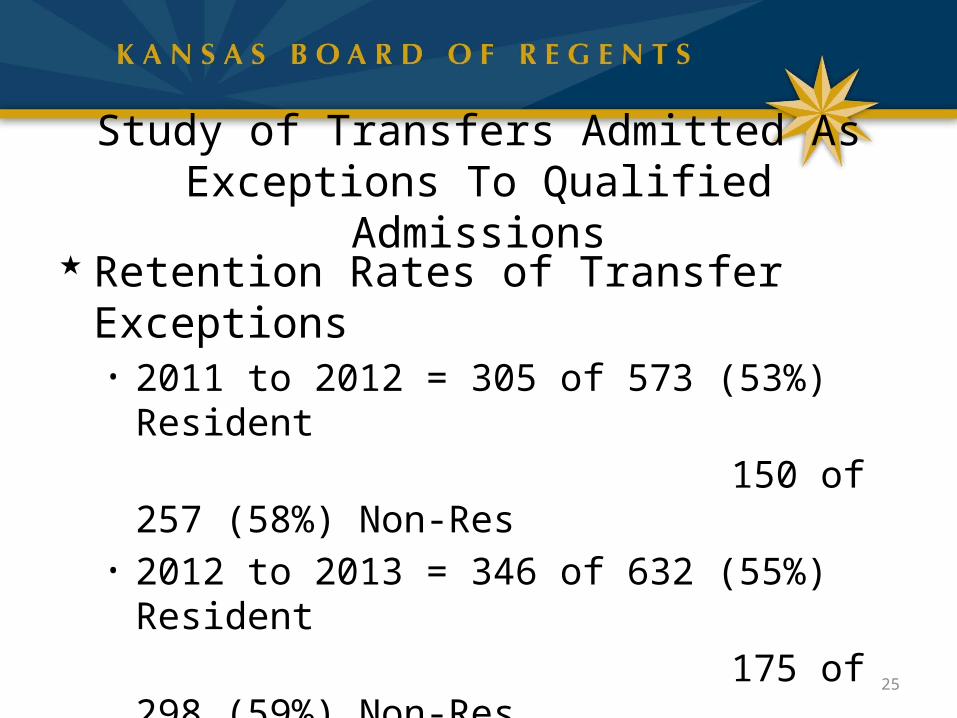
Study of Transfers Admitted As Exceptions To Qualified Admissions
Retention Rates of Transfer Exceptions• 2011 to 2012 = 305 of 573 (53%) Resident
150 of 257 (58%) Non-Res• 2012 to 2013 = 346 of 632 (55%) Resident
175 of 298 (59%) Non-Res
25

Study of Students Admitted As Exceptions To Qualified Admissions
Graduation Rates of Those Meeting QA • 2011 (2005) = 4790 of 8150 (59%) Resident• 2012 (2006) = 4661 of 8148 (57%) Resident• 2013 (2007) = 4851 of 8195 (59%) Resident
Graduation Rates of Exceptions• 2011 (2005) = 116 of 462 (25%) Resident• 2012 (2006) = 108 of 515 (21%) Resident• 2013 (2007) = 131 of 497 (26%) Resident 26

Study of Students Admitted As Exceptions To Qualified Admissions
Credit Hours Passed in AY 13• Freshmen Meeting QA = 91%• Freshmen Exceptions = 72%• Transfer Meeting QA = 87%• Transfer Exceptions = 71%
27