up-regulation of cathepsin b expression and enhanced secretion in mitochondrial dna-depleted...
TRANSCRIPT

Biol. Cell (2009) 101, 31–41 (Printed in Great Britain) doi:10.1042/BC20080043 Research article
Up-regulation of cathepsin Bexpression and enhanced secretionin mitochondrial DNA-depletedosteosarcoma cellsIsabelle Hamer*1, Edouard Delaive†, Marc Dieu†, Fadi Abdel-Sater*†2, Ludovic Mercy†, Michel Jadot* andThierry Arnould†*URPhyM, Unite de Recherche en Physiologie Moleculaire, Laboratoire de Chimie Physiologique, Facultes Universitaires N-D de la Paix, Rue
de Bruxelles, 61, 5000 Namur, Belgium, and †Laboratoire de Biochimie et Biologie Cellulaire, Facultes Universitaires N-D de la Paix, Rue de
Bruxelles, 61, 5000 Namur, Belgium
Background information. mtDNA (mitochondrial DNA) mutations that impair oxidative phosphorylation can con-tribute to carcinogenesis through the increased production of reactive oxygen species and through the release ofproteins involved in cell motility and invasion. On the other hand, many human cancers are associated with both theup-regulation and the increased secretion of several proteases and heparanase. In the present study, we tried todetermine whether the depletion in mtDNA could modulate the expression and/or the secretion of some lysosomalhydrolases in the 143B osteosarcoma cells, as these mtDNA-depleted cells are characterized by a higher degreeof invasiveness than the parental cells.
Results. In comparison with the parental cells, we measured a higher amount of procathepsin B in the conditionedculture medium of the 143B cells lacking mtDNA (ρ0 143B cells), as well as a rise in the specific activity ofintracellular cathepsin B. In addition, we observed an activation of the transcription factor NF-κB (nuclear factorκB) in the cells devoid of functional mitochondria. Finally, we demonstrated that the down-regulation of the NF-κBp65 subunit by RNA interference led to a reduction in cathepsin B expression in ρ0 143B cells.
Conclusions. The up-regulation of cathepsin B by NF-κB, followed by its secretion into the extracellular environment,might be partly responsible for the previously reported invasiveness of the mtDNA-depleted 143B osteosarcomacells.
1To whom correspondence should be addressed ([email protected]).2Present address: Universite Libre de Bruxelles, Laboratoire deBioinformatique des Genomes et des Reseaux (BiGRe) B-1050 Bruxelles,Belgium.Key words: invasiveness, lysosomal protease, mitochondrial dysfunction,nuclear factor κB (NF-κB).Abbreviations used: AMC, 7-amino-4-methylcoumarin; CMV,cytomegalovirus; Cy3, indocarbocyanine; 2D-DIGE, two-dimensionaldifference gel electrophoresis; DMEM, Dulbecco’s modified Eagle’s medium;ECL, enhanced chemiluminescence; EMSA, electrophoretic mobility-shiftassay; Ets, E26 transformation-specific sequence; FCS, fetal calf serum; IκB,inhibitor of nuclear factor κB; IL, interleukin; mtDNA, mitochondrial DNA; M6P,mannose 6-phosphate; nDNA, nuclear DNA; NF-κB, nuclear factor κB; PPIE,peptidyl-prolyl cis-trans isomerase E; RISC, RNA-induced silencing complex;ROS, reactive oxygen species; siRNA, small interfering RNA; Sp1, specificityprotein-1; USF, upstream stimulatory factor.
IntroductionThe mitochondria are assembled from products ofboth nDNA (nuclear DNA) and mtDNA (mito-chondrial DNA) genes. While the nDNA encodesmost of the mitochondrial proteins, the mtDNAonly encodes a 12S and 16S rRNA, 22 tRNAs and13 essential components of oxidative phosphoryla-tion. The mtDNA also contains a control region thatencompasses the heavy-strand origin of replication,the heavy-strand and the light-strand promoters, themitochondrial transcription-factor-binding sites,three conserved sequence boxes and the termin-ation-associated sequence (Brandon et al., 2006).
www.biolcell.org | Volume 101 (1) | Pages 31–41 31
I. Hamer and others
Numerous somatic mutations in both the codingand the control regions of the mtDNA can func-tionally contribute to the tumorigenesis of cancercells (Amuthan et al., 2001; Petros et al., 2005). Thistumorigenicity could be due to an increased produc-tion of ROS (reactive oxygen species) in the electrontransport chain (Petros et al., 2005). Additionally,mtDNA mutations could contribute to tumorigeni-city by triggering a signalling cascade ending up bythe release of proteases capable of degrading extracel-lular matrix components (Amuthan et al., 2001; vanWaveren et al., 2006). In support of this hypothesis,it has been shown that several tumoral cell lines de-pleted in mtDNA were significantly more invasivethan the parental cells (Amuthan et al., 2001; Petroset al., 2005; van Waveren et al., 2006).
It is widely accepted that during cancer develop-ment, invasion of tumour cells into surrounding tis-sue is facilitated by various proteases such as matrixmetalloproteinases and serine proteases (Deryuginaand Quigley, 2006; Mohamed and Sloane, 2006; Dasset al., 2008). Moreover, many breast and colorectalcancer cells are associated with an increased secre-tion of cathepsins into the extracellular environment(Rochefort et al., 2000; Kokkonen et al., 2004;Mohamed and Sloane, 2006). Functional evidencethat some cathepsins are able to promote cellular inva-sion came from in vitro assays using several cancer celllines (Krueger et al., 1999; Kirschke et al., 2000),and also from in vivo studies using human tumourxenografts growing in immunodeficient mice ( Joyceet al., 2004; Gocheva et al., 2006). In many humancancers, there is an up-regulated expression of somecysteine proteases, especially of cathepsins B and L( Joyce et al., 2004; Mohamed and Sloane, 2006) andof heparanase, a lysosomal endo-β-D-glucuronidase(Ogishima et al., 2005; Baraz et al., 2006). Extracel-lular proteases may stimulate invasion through sev-eral different mechanisms, including the degradationof components of the extracellular matrix, the re-lease of growth factors embedded in the matrix, theactivation of other proteases and the alteration of cell–cell contacts ( Joyce et al., 2004; Gocheva et al., 2006;Mohamed and Sloane, 2006).
In the present study, we wondered whether thereported increased invasiveness of the 143B osteo-sarcoma cells devoid of mtDNA relative to the par-ental 143B cells (van Waveren et al., 2006) could beassociated with an increased secretion of some lyso-
somal hydrolases. To address this question, we com-pared, by two-dimensional gel analysis, the relativeabundance of lysosomal precursor enzymes releasedinto conditioned culture medium by 143B cells andmtDNA-depleted 143B cells, incubated in the pres-ence of ammonium chloride. We observed a higheramount of procathepsin B in the conditioned culturemedium from mtDNA-depleted cells. This was con-firmed in cells incubated in the absence of ammoniumchloride. This increased secretion seems to be linkedto the up-regulation of cathepsin B gene expression,resulting, at least in part, from the activation of thetranscription factor NF-κB (nuclear factor κB).
ResultsProteomics analysis of M6P (mannose6-phosphate)-tagged lysosomal enzymessecreted into the culture mediumThe present study was aimed at determiningwhether the observed invasiveness of mtDNA-depleted 143B cells compared with 143B cells (vanWaveren et al., 2006) could be associated with anincrease in the expression level of some lysosomal hy-drolases. In order to determine this, we compared theabundance of lysosomal hydrolase precursors releasedinto the culture medium by 143B cells and ρ0 143Bcells in response to ammonium chloride, a treatmentknown to stimulate their secretion over the basal rate(Gonzalez-Noriega et al., 1980). We took advantageof the presence of M6P residues on most of the lyso-somal hydrolase precursors to purify these proteinsby affinity chromatography (Sleat et al., 1997). Itis noteworthy that the abundance of glycoproteinscontaining M6P is increased in human carcinomas(Sleat et al., 1995). After purification, the relativeabundance of M6P proteins secreted by the 143B cellsand the ρ0 143B cells was determined by 2D-DIGE(two-dimensional difference gel electrophoresis; Fig-ure 1A). Among the seven protein spots that dis-played a significantly increased intensity in the ρ0
143B cells relative to the 143B cells (P < 0.05),five spots containing 5–11 peptides were identifiedby MS as being cathepsin B (Figure 1A and Sup-plementary Table S1 at http://www.biolcell.org/boc/101/boc1010031add.htm). They consisted of multi-ple forms ranging from a pI of 5.5 to a pI of 5.9. Thisis in agreement with the isoelectric points obtainedfor the recombinant human procathepsin B expressed
32 C© The Authors Journal compilation C© 2009 Portland Press Ltd

Cathepsin B expression in cells lacking mtDNA Research article
Figure 1 Comparative analysis of M6P proteins secretedinto the culture medium by 143B and ρ0 143B cells(A) Precursors of lysosomal hydrolases, secreted by 143B and
ρ0 143B cells in response to a 24 h incubation with 10 mM am-
monium chloride, were purified by immobilized M6PR affinity
chromatography and analysed by 2D-DIGE. Five spots, iden-
tified by MS as cathepsin B forms, displayed a higher level
of secretion in the ρ0 143B cells when compared with the
parental 143B cells (see arrows). (B) Aliquots of purified M6P
proteins were run on SDS/PAGE (10% polyacrylamide one-di-
mensional gel in denaturing conditions). After electrophoretic
transfer on to a PVDF-Hybond LFP membrane, procathepsin
B was detected with a mouse monoclonal anti-cathepsin B
antibody and an ECL Plex goat anti-mouse IgG (Cy3-labelled),
using a TyphoonTM scanner. The molecular mass in kDa is in-
dicated on the left-hand side of the gel.
in HeLa cells (Ren et al., 1996). The spot intens-ity was at least 2.3-fold higher in the conditionedculture medium from ρ0 143B cells than in thosefrom 143B cells (Supplementary Table S1). In orderto verify this increase in the ammonium-chloride-induced procathepsin B secretion, we carried outWestern blot analysis using the same samples asthose used for the 2D-DIGE and used the ECL (en-hanced chemiluminescence) Plex fluorescent system(GE Healthcare). We observed a single band witha molecular mass of approx. 39 kDa (Figure 1B).
Quantitative analysis revealed a small, but signific-ant, average increase of 1.6-fold (P < 0.05) in theρ0 143B cells when compared with the parental143B cells. The number of pixels were 50.2 × 10⁶
(+−10.4 × 10⁶) and 80.6 × 10⁶ (+−10.9 × 10⁶), forthe 143B and the ρ0 143B cells respectively.Hence, the immunoblotting confirmed the resultsfrom the 2D-DIGE, indicating that procathepsin Bsecretion is increased in mtDNA-depleted cells in-cubated in the presence of ammonium chloride.
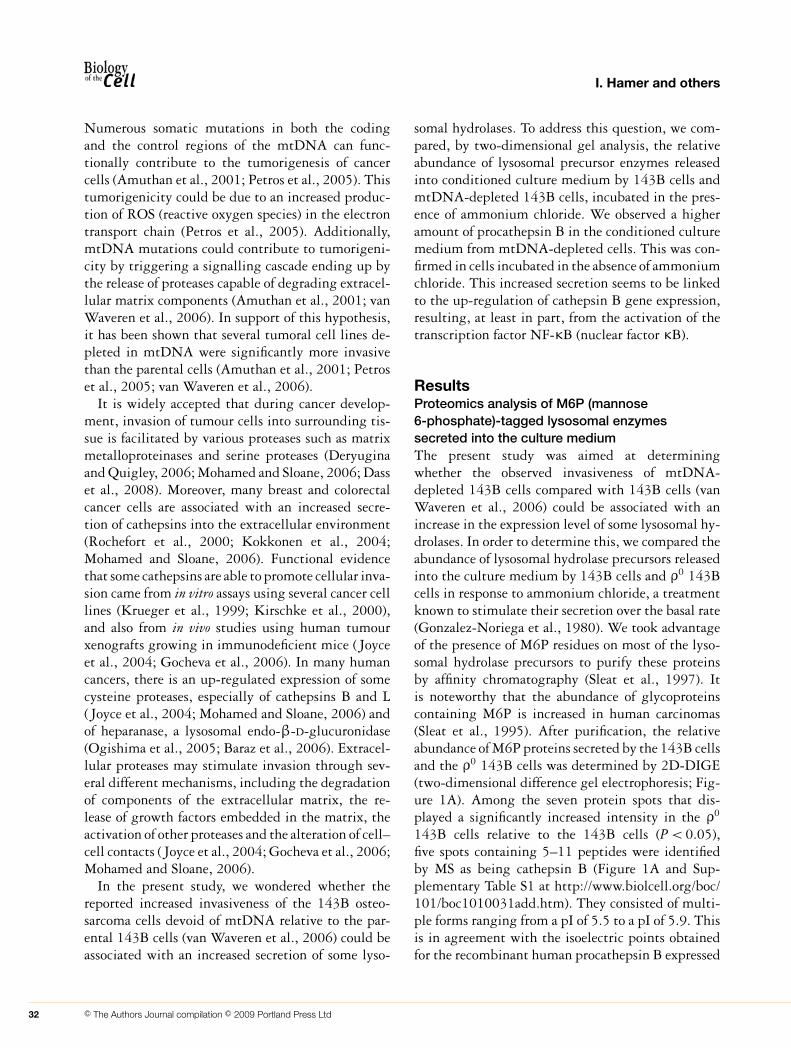
Activity of cathepsin B in conditioned culturemedium after pepsin activationIn cultured cells, cathepsin B is secreted as an inactiveprecursor form (Hanewinkel et al., 1987; Mach et al.,1992); however, it is possible to activate procathep-sin B by incubating culture medium with pepsinat acidic pH (Mach et al., 1992; Cavallo-Medvedet al., 2005). We applied this protocol to culture me-dium from 143B and ρ0 143B cells, collected after a24 h-incubation in the absence of ammonium chlor-ide. Cathepsin B activity was then normalized to theDNA content of the corresponding cell monolayer. Inthese conditions, we observed a 3-fold increase in thepepsin-activated cathepsin B activity in the culturemedium from ρ0 143B cells when compared withthat measured in the culture medium from 143Bcells (Figure 2). The enhanced release of procathepsinB is really due to the absence of mtDNA (and notto a clonal effect) as it can be reversed by the intro-duction of wild-type mtDNA. Indeed, the activityof cathepsin B measured in the presence of pepsinnearly returned to control values in ρ0 143B cellsrepopulated with mitochondria from a healthy indi-vidual (wild-type cybrids) (King and Attardi, 1989)(Figure 2).
Intracellular expression of cathepsin BNext, we measured the specific intracellular cathep-sin B activity in cell homogenates. We observed astatistically significant increase (P < 0.01) in intra-cellular cathepsin B activity in the ρ0 143B cells(17.50 +− 1.82 μ-units/μg of protein) compared withthe parental cells (12.76 +− 1.64 μ-units/μg of pro-tein). In both 143B and ρ0 143B cell lines, immuno-blotting revealed that cathepsin B appeared as a mix-ture of precursor (39 kDa), intermediate single-chain(30/31 kDa) and mature double-chain (24/25 kDa)forms; the latter being the most predominant form,
www.biolcell.org | Volume 101 (1) | Pages 31–41 33
I. Hamer and others
Figure 2 Measurement of cathepsin B activity in culturemedium after pepsin activationCulture media from 143B, ρ0 143B and wild-type cybrids were
first incubated for 30 min in the presence of 107 μg/ml pep-
sin at pH 3.5, then for 10 min with 184 mM acetate buffer,
pH 6.8, containing 1 mM EDTA and 1 mM 2-aminoethanethiol
prior to the addition of 0.1 mM Z-Arg-Arg-AMC. After fixation
with cold glycine buffer (pH 10.5), the fluorescence intensity
was determined. The DNA content was measured with the
Quant-iTTM PicoGreen DNA probe. Values represent the aver-
age cathepsin B activity (in nmol of AMC produced per min
and per μg of DNA) +−1 S.D. (n = 5). *P < 0.05, **P < 0.01 and
***P < 0.001.
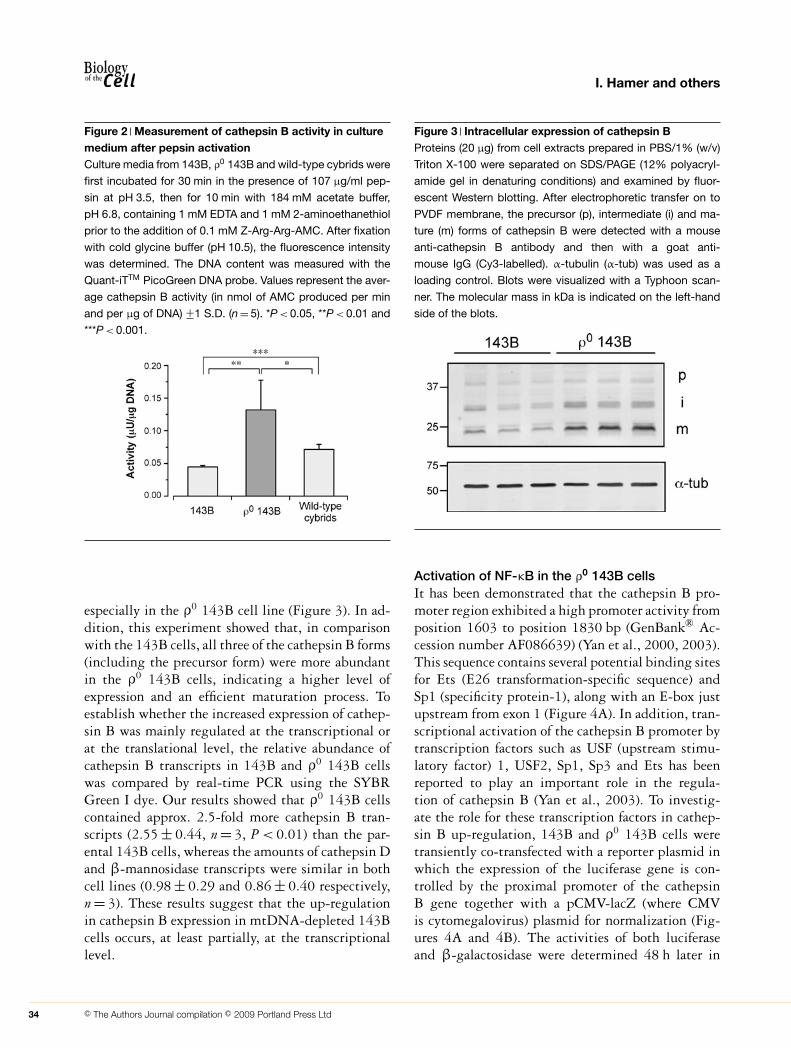
especially in the ρ0 143B cell line (Figure 3). In ad-dition, this experiment showed that, in comparisonwith the 143B cells, all three of the cathepsin B forms(including the precursor form) were more abundantin the ρ0 143B cells, indicating a higher level ofexpression and an efficient maturation process. Toestablish whether the increased expression of cathep-sin B was mainly regulated at the transcriptional orat the translational level, the relative abundance ofcathepsin B transcripts in 143B and ρ0 143B cellswas compared by real-time PCR using the SYBRGreen I dye. Our results showed that ρ0 143B cellscontained approx. 2.5-fold more cathepsin B tran-scripts (2.55 +− 0.44, n = 3, P < 0.01) than the par-ental 143B cells, whereas the amounts of cathepsin Dand β-mannosidase transcripts were similar in bothcell lines (0.98 +− 0.29 and 0.86 +− 0.40 respectively,n = 3). These results suggest that the up-regulationin cathepsin B expression in mtDNA-depleted 143Bcells occurs, at least partially, at the transcriptionallevel.
Figure 3 Intracellular expression of cathepsin BProteins (20 μg) from cell extracts prepared in PBS/1% (w/v)
Triton X-100 were separated on SDS/PAGE (12% polyacryl-
amide gel in denaturing conditions) and examined by fluor-
escent Western blotting. After electrophoretic transfer on to
PVDF membrane, the precursor (p), intermediate (i) and ma-
ture (m) forms of cathepsin B were detected with a mouse
anti-cathepsin B antibody and then with a goat anti-
mouse IgG (Cy3-labelled). α-tubulin (α-tub) was used as a
loading control. Blots were visualized with a Typhoon scan-
ner. The molecular mass in kDa is indicated on the left-hand
side of the blots.
Activation of NF-κB in the ρ0 143B cellsIt has been demonstrated that the cathepsin B pro-moter region exhibited a high promoter activity fromposition 1603 to position 1830 bp (GenBank® Ac-cession number AF086639) (Yan et al., 2000, 2003).This sequence contains several potential binding sitesfor Ets (E26 transformation-specific sequence) andSp1 (specificity protein-1), along with an E-box justupstream from exon 1 (Figure 4A). In addition, tran-scriptional activation of the cathepsin B promoter bytranscription factors such as USF (upstream stimu-latory factor) 1, USF2, Sp1, Sp3 and Ets has beenreported to play an important role in the regula-tion of cathepsin B (Yan et al., 2003). To investig-ate the role for these transcription factors in cathep-sin B up-regulation, 143B and ρ0 143B cells weretransiently co-transfected with a reporter plasmid inwhich the expression of the luciferase gene is con-trolled by the proximal promoter of the cathepsinB gene together with a pCMV-lacZ (where CMVis cytomegalovirus) plasmid for normalization (Fig-ures 4A and 4B). The activities of both luciferaseand β-galactosidase were determined 48 h later in
34 C© The Authors Journal compilation C© 2009 Portland Press Ltd
Cathepsin B expression in cells lacking mtDNA Research article
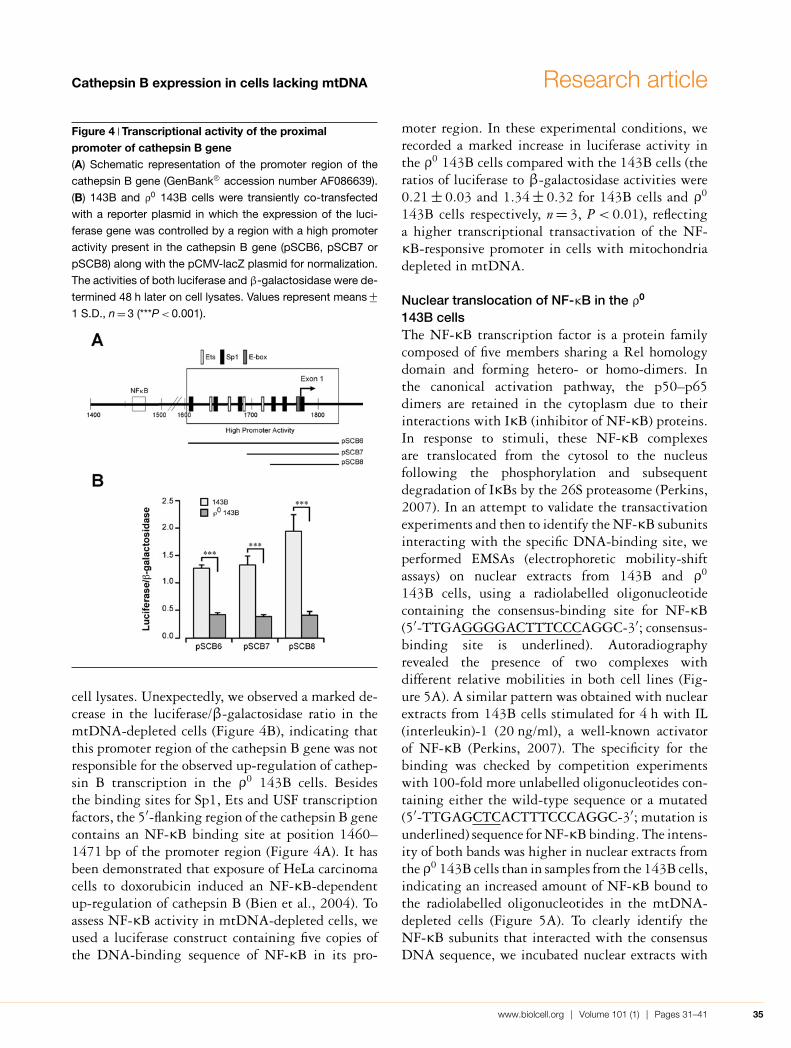
Figure 4 Transcriptional activity of the proximalpromoter of cathepsin B gene(A) Schematic representation of the promoter region of the
cathepsin B gene (GenBank® accession number AF086639).
(B) 143B and ρ0 143B cells were transiently co-transfected
with a reporter plasmid in which the expression of the luci-
ferase gene was controlled by a region with a high promoter
activity present in the cathepsin B gene (pSCB6, pSCB7 or
pSCB8) along with the pCMV-lacZ plasmid for normalization.
The activities of both luciferase and β-galactosidase were de-
termined 48 h later on cell lysates. Values represent means +−1 S.D., n = 3 (***P < 0.001).
cell lysates. Unexpectedly, we observed a marked de-crease in the luciferase/β-galactosidase ratio in themtDNA-depleted cells (Figure 4B), indicating thatthis promoter region of the cathepsin B gene was notresponsible for the observed up-regulation of cathep-sin B transcription in the ρ0 143B cells. Besidesthe binding sites for Sp1, Ets and USF transcriptionfactors, the 5′-flanking region of the cathepsin B genecontains an NF-κB binding site at position 1460–1471 bp of the promoter region (Figure 4A). It hasbeen demonstrated that exposure of HeLa carcinomacells to doxorubicin induced an NF-κB-dependentup-regulation of cathepsin B (Bien et al., 2004). Toassess NF-κB activity in mtDNA-depleted cells, weused a luciferase construct containing five copies ofthe DNA-binding sequence of NF-κB in its pro-
moter region. In these experimental conditions, werecorded a marked increase in luciferase activity inthe ρ0 143B cells compared with the 143B cells (theratios of luciferase to β-galactosidase activities were0.21 +− 0.03 and 1.34 +− 0.32 for 143B cells and ρ0
143B cells respectively, n = 3, P < 0.01), reflectinga higher transcriptional transactivation of the NF-κB-responsive promoter in cells with mitochondriadepleted in mtDNA.
Nuclear translocation of NF-κB in the ρ0
143B cellsThe NF-κB transcription factor is a protein familycomposed of five members sharing a Rel homologydomain and forming hetero- or homo-dimers. Inthe canonical activation pathway, the p50–p65dimers are retained in the cytoplasm due to theirinteractions with IκB (inhibitor of NF-κB) proteins.In response to stimuli, these NF-κB complexesare translocated from the cytosol to the nucleusfollowing the phosphorylation and subsequentdegradation of IκBs by the 26S proteasome (Perkins,2007). In an attempt to validate the transactivationexperiments and then to identify the NF-κB subunitsinteracting with the specific DNA-binding site, weperformed EMSAs (electrophoretic mobility-shiftassays) on nuclear extracts from 143B and ρ0
143B cells, using a radiolabelled oligonucleotidecontaining the consensus-binding site for NF-κB(5′-TTGAGGGGACTTTCCCAGGC-3′; consensus-binding site is underlined). Autoradiographyrevealed the presence of two complexes withdifferent relative mobilities in both cell lines (Fig-ure 5A). A similar pattern was obtained with nuclearextracts from 143B cells stimulated for 4 h with IL(interleukin)-1 (20 ng/ml), a well-known activatorof NF-κB (Perkins, 2007). The specificity for thebinding was checked by competition experimentswith 100-fold more unlabelled oligonucleotides con-taining either the wild-type sequence or a mutated(5′-TTGAGCTCACTTTCCCAGGC-3′; mutation isunderlined) sequence for NF-κB binding. The intens-ity of both bands was higher in nuclear extracts fromthe ρ0 143B cells than in samples from the 143B cells,indicating an increased amount of NF-κB bound tothe radiolabelled oligonucleotides in the mtDNA-depleted cells (Figure 5A). To clearly identify theNF-κB subunits that interacted with the consensusDNA sequence, we incubated nuclear extracts with
www.biolcell.org | Volume 101 (1) | Pages 31–41 35
I. Hamer and others
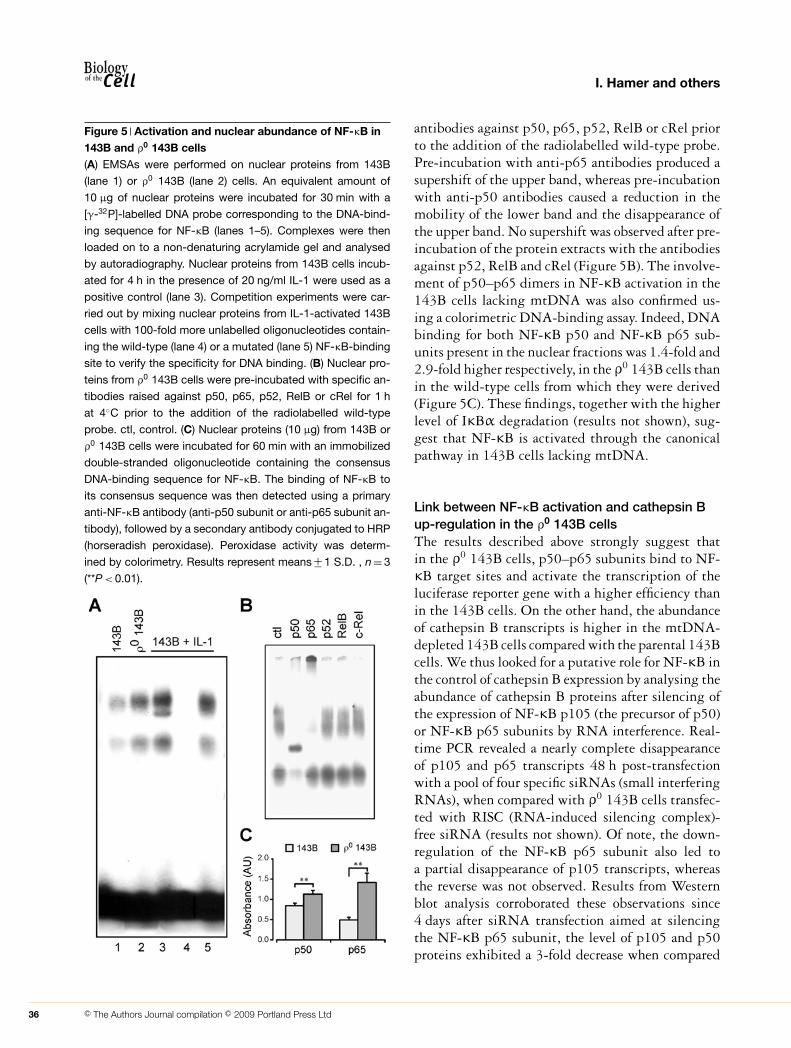
Figure 5 Activation and nuclear abundance of NF-κB in143B and ρ0 143B cells(A) EMSAs were performed on nuclear proteins from 143B
(lane 1) or ρ0 143B (lane 2) cells. An equivalent amount of
10 μg of nuclear proteins were incubated for 30 min with a
[γ-32P]-labelled DNA probe corresponding to the DNA-bind-
ing sequence for NF-κB (lanes 1–5). Complexes were then
loaded on to a non-denaturing acrylamide gel and analysed
by autoradiography. Nuclear proteins from 143B cells incub-
ated for 4 h in the presence of 20 ng/ml IL-1 were used as a
positive control (lane 3). Competition experiments were car-
ried out by mixing nuclear proteins from IL-1-activated 143B
cells with 100-fold more unlabelled oligonucleotides contain-
ing the wild-type (lane 4) or a mutated (lane 5) NF-κB-binding
site to verify the specificity for DNA binding. (B) Nuclear pro-
teins from ρ0 143B cells were pre-incubated with specific an-
tibodies raised against p50, p65, p52, RelB or cRel for 1 h
at 4◦C prior to the addition of the radiolabelled wild-type
probe. ctl, control. (C) Nuclear proteins (10 μg) from 143B or
ρ0 143B cells were incubated for 60 min with an immobilized
double-stranded oligonucleotide containing the consensus
DNA-binding sequence for NF-κB. The binding of NF-κB to
its consensus sequence was then detected using a primary
anti-NF-κB antibody (anti-p50 subunit or anti-p65 subunit an-
tibody), followed by a secondary antibody conjugated to HRP
(horseradish peroxidase). Peroxidase activity was determ-
ined by colorimetry. Results represent means +− 1 S.D. , n = 3
(**P < 0.01).
antibodies against p50, p65, p52, RelB or cRel priorto the addition of the radiolabelled wild-type probe.Pre-incubation with anti-p65 antibodies produced asupershift of the upper band, whereas pre-incubationwith anti-p50 antibodies caused a reduction in themobility of the lower band and the disappearance ofthe upper band. No supershift was observed after pre-incubation of the protein extracts with the antibodiesagainst p52, RelB and cRel (Figure 5B). The involve-ment of p50–p65 dimers in NF-κB activation in the143B cells lacking mtDNA was also confirmed us-ing a colorimetric DNA-binding assay. Indeed, DNAbinding for both NF-κB p50 and NF-κB p65 sub-units present in the nuclear fractions was 1.4-fold and2.9-fold higher respectively, in the ρ0 143B cells thanin the wild-type cells from which they were derived(Figure 5C). These findings, together with the higherlevel of IκBα degradation (results not shown), sug-gest that NF-κB is activated through the canonicalpathway in 143B cells lacking mtDNA.
Link between NF-κB activation and cathepsin Bup-regulation in the ρ0 143B cellsThe results described above strongly suggest thatin the ρ0 143B cells, p50–p65 subunits bind to NF-κB target sites and activate the transcription of theluciferase reporter gene with a higher efficiency thanin the 143B cells. On the other hand, the abundanceof cathepsin B transcripts is higher in the mtDNA-depleted 143B cells compared with the parental 143Bcells. We thus looked for a putative role for NF-κB inthe control of cathepsin B expression by analysing theabundance of cathepsin B proteins after silencing ofthe expression of NF-κB p105 (the precursor of p50)or NF-κB p65 subunits by RNA interference. Real-time PCR revealed a nearly complete disappearanceof p105 and p65 transcripts 48 h post-transfectionwith a pool of four specific siRNAs (small interferingRNAs), when compared with ρ0 143B cells transfec-ted with RISC (RNA-induced silencing complex)-free siRNA (results not shown). Of note, the down-regulation of the NF-κB p65 subunit also led toa partial disappearance of p105 transcripts, whereasthe reverse was not observed. Results from Westernblot analysis corroborated these observations since4 days after siRNA transfection aimed at silencingthe NF-κB p65 subunit, the level of p105 and p50proteins exhibited a 3-fold decrease when compared
36 C© The Authors Journal compilation C© 2009 Portland Press Ltd
Cathepsin B expression in cells lacking mtDNA Research article
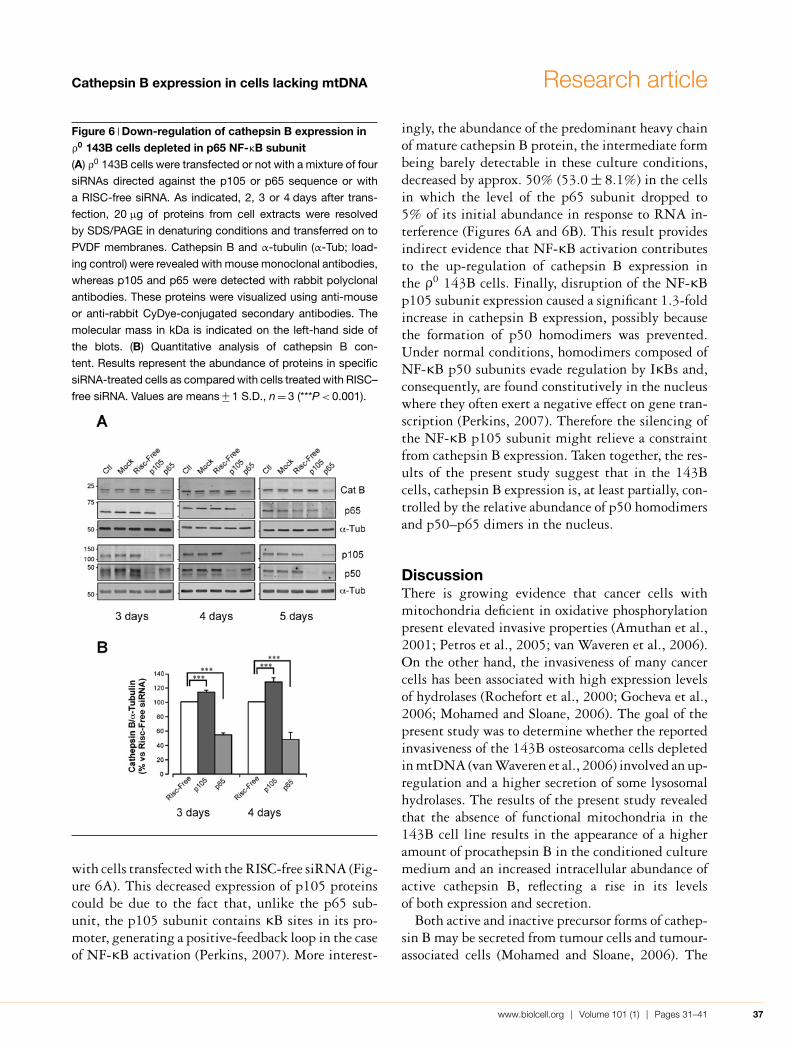
Figure 6 Down-regulation of cathepsin B expression inρ0 143B cells depleted in p65 NF-κB subunit(A) ρ0 143B cells were transfected or not with a mixture of four
siRNAs directed against the p105 or p65 sequence or with
a RISC-free siRNA. As indicated, 2, 3 or 4 days after trans-
fection, 20 μg of proteins from cell extracts were resolved
by SDS/PAGE in denaturing conditions and transferred on to
PVDF membranes. Cathepsin B and α-tubulin (α-Tub; load-
ing control) were revealed with mouse monoclonal antibodies,
whereas p105 and p65 were detected with rabbit polyclonal
antibodies. These proteins were visualized using anti-mouse
or anti-rabbit CyDye-conjugated secondary antibodies. The
molecular mass in kDa is indicated on the left-hand side of
the blots. (B) Quantitative analysis of cathepsin B con-
tent. Results represent the abundance of proteins in specific
siRNA-treated cells as compared with cells treated with RISC–
free siRNA. Values are means +− 1 S.D., n = 3 (***P < 0.001).
with cells transfected with the RISC-free siRNA (Fig-ure 6A). This decreased expression of p105 proteinscould be due to the fact that, unlike the p65 sub-unit, the p105 subunit contains κB sites in its pro-moter, generating a positive-feedback loop in the caseof NF-κB activation (Perkins, 2007). More interest-
ingly, the abundance of the predominant heavy chainof mature cathepsin B protein, the intermediate formbeing barely detectable in these culture conditions,decreased by approx. 50% (53.0 +− 8.1%) in the cellsin which the level of the p65 subunit dropped to5% of its initial abundance in response to RNA in-terference (Figures 6A and 6B). This result providesindirect evidence that NF-κB activation contributesto the up-regulation of cathepsin B expression inthe ρ0 143B cells. Finally, disruption of the NF-κBp105 subunit expression caused a significant 1.3-foldincrease in cathepsin B expression, possibly becausethe formation of p50 homodimers was prevented.Under normal conditions, homodimers composed ofNF-κB p50 subunits evade regulation by IκBs and,consequently, are found constitutively in the nucleuswhere they often exert a negative effect on gene tran-scription (Perkins, 2007). Therefore the silencing ofthe NF-κB p105 subunit might relieve a constraintfrom cathepsin B expression. Taken together, the res-ults of the present study suggest that in the 143Bcells, cathepsin B expression is, at least partially, con-trolled by the relative abundance of p50 homodimersand p50–p65 dimers in the nucleus.
DiscussionThere is growing evidence that cancer cells withmitochondria deficient in oxidative phosphorylationpresent elevated invasive properties (Amuthan et al.,2001; Petros et al., 2005; van Waveren et al., 2006).On the other hand, the invasiveness of many cancercells has been associated with high expression levelsof hydrolases (Rochefort et al., 2000; Gocheva et al.,2006; Mohamed and Sloane, 2006). The goal of thepresent study was to determine whether the reportedinvasiveness of the 143B osteosarcoma cells depletedin mtDNA (van Waveren et al., 2006) involved an up-regulation and a higher secretion of some lysosomalhydrolases. The results of the present study revealedthat the absence of functional mitochondria in the143B cell line results in the appearance of a higheramount of procathepsin B in the conditioned culturemedium and an increased intracellular abundance ofactive cathepsin B, reflecting a rise in its levelsof both expression and secretion.
Both active and inactive precursor forms of cathep-sin B may be secreted from tumour cells and tumour-associated cells (Mohamed and Sloane, 2006). The
www.biolcell.org | Volume 101 (1) | Pages 31–41 37

I. Hamer and others
mechanisms underlying the activation of precursorforms extracellularly are not clear but might requireinteractions with extracellular matrix components.On the other hand, the active forms might be stim-ulated by slight acidification of the extracellular en-vironment or by the presence of pro-inflammatoryfactors (Mohamed and Sloane, 2006). Once activ-ated, cathepsin B could degrade extracellular matrixproteins such as collagen, laminin and fibronectin, al-lowing cellular motility and invasion (Krueger et al.,1999).
The present study also provides several lines ofevidence that this higher abundance of procathepsinB extracellularly is due, at least in part, to the up-regulation of cathepsin B gene expression by thetranscription factor NF-κB. First, DNA-binding ex-periments carried out on nuclear extracts showedan increase in NF-κB DNA binding in mtDNA-depleted cells compared with the parental 143B cells.Secondly, transfection with the luciferase reportergene whose expression is driven by a promoter con-taining five copies of DNA-binding sites for NF-κBled to an enhanced luciferase activity in cells lack-ing mtDNA. Our results suggest that the NF-κB-induced up-regulation of cathepsin B in the ρ0 143Bcells implies the canonical activation pathway of NF-κB, as we observed a higher level of degradation ofIκBα, as well as an increase in DNA binding, bythe NF-κB p50 and p65 subunits in cells lackingmtDNA. In addition, silencing of the NF-κB p65subunit by RNA interference caused a 50% reductionin cathepsin B expression; however, we cannot ruleout the possibility of a non-canonical transcriptionalactivation by NF-κB p65 homodimers (Hoffmannet al., 2006).
The activation of NF-κB in mtDNA-depleted cellscould be triggered by the rise in cytosolic calciumconcentration already observed in these cells (Biswaset al., 1999; Arnould et al., 2002) and the subsequentactivation of calcium-dependent kinases (Arnouldet al., 2002; Butow and Avadhani, 2004). Alternat-ively, NF-κB activation could result from the actionof mitochondrial H2O2 in the cytosol (Brandon et al.,2006; Gloire et al., 2006); however, the mechan-isms responsible for ROS-mediated activation of NF-κB signalling remain to be unequivocally elucidated(Bubici et al., 2006). Activation of NF-κB has alsobeen reported in C2C12 rhabdomyoblast cells de-pleted in mtDNA (Biswas et al., 1999); however, in
this case, the activation of NF-κB would not fol-low the classical pathway, but an alternative pathwayimplying the nuclear translocation of p50-cRel di-mers (Biswas et al., 1999; Amuthan et al., 2001;Biswas et al., 2003). In addition, the authors ob-served a marked increase in the abundance of cathep-sin L transcripts in C2C12 cells depleted in mtDNA,but not in that of cathepsin B transcripts (Amuthanet al., 2001). Although unexplained, those discrep-ancies might be related to the cell type and/or theseverity of the mitochondrial dysfunction.
For years, it has become clear that NF-κB sig-nalling plays a critical role in cancer development andprogression, mainly because it ensures cell survivalby activating anti-apoptotic gene expression (Karin,2006). In addition, activation of NF-κB results inelevated expression of proteases (such as cathepsinL and matrix metalloproteinase-9) that promote theinvasive phenotype (Amuthan et al., 2001; Karin,2006). The results of the present study showing anincrease in cathepsin B expression and the ensuing re-lease of procathepsin B could explain why the 143Bcells devoid of mtDNA are more invasive than theparental 143B cells (van Waveren et al., 2006). Ex-tracellularly released cathepsin B could act alone or inconcert with some matrix metalloproteinases, as pre-viously reported (Kostoulas et al., 1999; Podgorskiet al., 2005).
In summary, the results of the present study showthat the depletion of mtDNA in the ρ0 143B cells in-duces an up-regulation of cathepsin B gene expressionthat is associated with an increased abundance of theproenzyme in the conditioned culture medium. Wealso provide indirect evidence that this up-regulationof cathepsin B expression in mtDNA-depleted 143Bcells involves the activation of the NF-κB transcrip-tion factor. Therefore it suggests that the NF-κB-mediated up-regulation of cathepsin B genes couldcontribute to the invasive property of the 143B cellslacking mtDNA.
Materials and MethodsCell culturesThe 143B and the ρ0 143B cell lines, as well as the wild-typecybrids, were kindly provided by Professor G. Attardi (Cal-tech, Pasadena, CA, U.S.A.) (King and Attardi, 1989, 1996).Wild-type cybrids are ρ0 143B cells repopulated with normalmitochondrial apparatus (King and Attardi, 1989). All of thesecells were grown in high glucose (4.5 g/l) DMEM (Dulbecco’s
38 C© The Authors Journal compilation C© 2009 Portland Press Ltd

Cathepsin B expression in cells lacking mtDNA Research article
modified Eagle’s medium) supplemented with 10% (v/v) FCS(fetal calf serum) in a 5% CO2 incubator. ρ0 143B cells weregrown in the presence of 50 μg/ml uridine.
Purification and identification of M6P proteins secretedinto the culture medium143B and ρ0 143B cells [∼(7–10) × 109 cells] were incubated inDMEM supplemented with 0.5% FCS and 10 mM ammoniumchloride. Culture medium was collected after a 24 h incubationand proteins were precipitated at 4◦C with ammonium sulfate.Then they were resuspended and dialysed overnight against100 vol. of PBS containing 5 mM β-glycerophosphate and 5 mMEDTA. After a high-speed centrifugation at 19000 rev./min for15 min (Type 30 rotor, Beckman), soluble proteins were con-centrated on Amicon Ultra-15 centrifugal filter devices (Mil-lipore; cut-off 10 kDa). Afterwards, lysosomal hydrolase pre-cursors were purified on columns with immobilized M6P re-ceptors, provided by Dr P. Lobel (Center for Advanced Bio-technology and Medicine, Piscataway, NJ, U.S.A.) (Sleat et al.,1997). Following elution with 10 mM M6P, M6P proteinswere concentrated, precipitated and resuspended in a 30 mMTris/HCl (pH 8.5) buffer supplemented with 7 M urea, 2 Mthiourea and 4% CHAPS. The protein content was determ-ined using the Bradford protein assay (Bio-Rad). The analysis ofdifferences in secreted M6P proteins between 143B cells andρ0 143B cells in response to ammonium chloride was per-formed by 2D-DIGE according to the manufacturer’s protocol(GE Healthcare; see the Supplementary Materials and meth-ods at http://www.biolcell.org/boc/101/boc1010031add.htm).Spots of interest were picked up and digested in-gel withtrypsin. Peptides were analysed by MS using a MALDI–TOF(matrix-assisted laser-desorption ionization–time-of-flight) ap-paratus (MALDI MX, Waters).
ECL Plex Western blottingProteins were loaded on to SDS/PAGE (10% polyacrylamidegel) in denaturing conditions. After electrophoretic transfer,PVDF membranes (Hybond-LFP; GE Healthcare) were satur-ated with 2% ECL Advance blocking agent prepared in PBScontaining 0.1% Tween 20 and then incubated for 2 h in thepresence of a mouse monoclonal anti-cathepsin B antibody (CA-20; Calbiochem). Following this, membranes were incubatedfor 1 h in darkness with an ECL Plex goat anti-mouse IgG[Cy3 (indocarbocyanine)-labelled; GE Healthcare], extensivelywashed and scanned with a Typhoon 9400 Imager (GE Health-care). Quantitative analysis of band intensities was carried outwith the ImageQuant TL software after having checked that theintensities were in a linear range.
Activation of procathepsin B and enzymatic assaysProcathepsin B was activated with pepsin essentially as describedin Cavallo-Medved et al. (2005). Briefly, 40 μl of cell mediumwas incubated for 30 min at 37◦C in the presence of 30 μl ofpepsin (250 μg/ml) prepared in 0.1 M sodium citrate buffer(pH 3.5). Then, 230 μl of 0.4 M sodium acetate buffer (pH 6.8),supplemented with 2.17 mM EDTA and 2.17 mM aminoeth-anethiol were added to activate cathepsin B activity. The reactionwas started 10 min later by the addition of 200 μl of 0.25 mMZ-Arg-Arg-AMC (AMC is 7-amino-4-methylcoumarin; Sigma–Aldrich), a specific substrate for cathepsin B. After fixation with
1.2 ml of 50 mM glycine buffer (pH 10.5), supplemented with5 mM EDTA and 0.05% Triton X-100, the fluorescence intens-ity was determined with an SLM Amincon spectrofluorimeter(λEx = 360 nm and λEm = 460 nm). The cleavage specificity waschecked using 10 μM CA074. Cathepsin B activity was normal-ized to the total DNA content that was determined on thecorresponding cell lysates with Quant-iTTM PicoGreen dsDNA(double-stranded DNA) reagent (Molecular Probes) using sal-mon sperm DNA as a standard. For the calculations, we tookinto account the relative abundance of total DNA per cell in thedifferent cell types. Under the conditions of the present study, wefound that the total DNA content in the ρ0 143B cells and thewild-type cybrids represented 98.1% and 116.0% respectively,of the total DNA content measured in the 143B cells.
Reverse transcription and real-time PCRTotal RNA was extracted from three independent cultures us-ing the Total RNAgent extraction kit (Promega). Total RNA(2 μg) was reversed transcribed into cDNA using oligo(dT)12−18and SuperScript II Reverse Transcriptase (Invitrogen). Spe-cific primers for cathepsin B, cathepsin D, β-mannosidase,NF-κB p105 subunit, NF-κB p65 subunit (RelA) and PPIE(peptidyl-prolyl cis-trans isomerase E) were designed withPrimer Express 1.5 software (Applied Biosystems) and areshown in Supplementary Table S2 (at http//www.biolcell.org/boc/101/boc1010031add.htm). PPIE served as an internalcontrol gene. Amplification reaction assays contained 1 × SYBRGreen PCR Mastermix and primers at optimal concentration(Applied Biosystems). A hot start at 95◦C for 10 min was fol-lowed by 40 cycles for 15 s and 60◦C for 1 min using the ABIPrism 7000 SDS thermal cycler (Applied Biosystems). Fluor-escence emission was detected for each PCR cycle and the Ct(threshold cycle) values were determined.
Transient transfection and luciferase reporter gene assay143B and ρ0 143B cells were grown on 12-well plates and transi-ently co-transfected using the Superfect reagent (Qiagen) for 6 hat a 1:5 ratio, with a luciferase reporter construct (0.75 μg/well)together with an expression plasmid encoding Escherichia coliβ-galactosidase (0.25 μg/well) under the control of a CMVpromoter (pCMV-LacZ; PlasmidFactory). To investigate for thetranscription factor(s) responsible for the transcriptional activa-tion of cathepsin B, we used a series of constructs (provided byProfessor B. Sloane, Department of Pharmacology, Wayne StateUniversity, Detroit, MI, U.S.A.) in which the expression of theluciferase gene was driven by a region of high-promoter activ-ity from the cathepsin B gene (pSCB6, pSCB7 or pSCB8) (Yanet al., 2000). We also used a pNFκB-Luc cis-reporter plasmid(Stratagene) containing five copies of the NF-κB-binding site.Cells were lysed 24 h post-transfection and the luciferase activ-ity was determined using a luciferase reporter assay (Promega).β-Galactosidase activity was determined by fluorimetry. Briefly,10 μl of cell lysates were incubated for 30 min at 37◦C in 190 μlof reaction mixture containing 21 mM Tris/HCl (pH 7.5),105 mM NaCl, 1.7 mM MgCl2, 10 mM 2-mercaptoethanol and0.5 mM 4-methylumbelliferyl β-D-galactopyranoside (Sigma–Aldrich). The reaction was stopped by the addition of 1.2 mlof 50 mM glycine buffer (pH 10.5), supplemented with 5 mMEDTA and 0.05% Triton X-100 prior to measuring the fluores-cence intensity (λEx = 365 nm and λEm = 450 mM).
www.biolcell.org | Volume 101 (1) | Pages 31–41 39
I. Hamer and others
Extraction of nuclear proteins and DNA-binding assaysEMSAs and the colorimetric DNA-binding assay were per-formed on nuclear extracts as described previously (Renard et al.,2001; Badran et al., 2002).
Silencing of NF-κB by RNA interferencesiRNA transfection experiments were performed using double-stranded RNA (siGENOME SMARTpool, Dharmacon). SiCon-trol RISC-free siRNA (Dharmacon) was used as a control. ρ0
143B cells were grown on six-well plates and then transfectedwith 25 nM siRNA for the NF-κB p105 subunit or for theNF-κB p65 subunit (RelA) and with DharmaFECT 1 trans-fection reagent (4.4 μl/well), according to the manufacturer’sinstructions. Non-transfected cells and cells incubated with thetransfection reagent alone were used in parallel. Silencing waschecked 24 h and 48 h post-transfection by reverse transcriptionof total extracted RNA followed by real-time PCR. For Westernblotting experiments, cells were lysed 3–5 days post-transfectionin PBS containing 1% (w/v) Triton X-100 and a cocktail of pro-tease inhibitors (Complete, Mini; Roche Applied Science) andphosphatase inhibitors (1 mM sodium orthovanadate, 10 mM p-nitrophenyl phosphate, 10 mM β-glycerophosphate and 5 mMsodium fluoride). The protein content was determined using theBCA (bicinchoninic acid) method (Pierce).
Statistical analysisStatistical significance was evaluated by using the Student’s t test.A P value of less than 0.05 was considered significant (∗P < 0.05,∗∗P < 0.01 and ∗∗∗P < 0.001).
AcknowledgementsWe thank Dr P. Lobel (Center for Advanced Bio-technology and Medicine, Piscataway, NJ, U.S.A.)for providing us the M6PR affinity columns andProfessor B. Sloane (Department of Pharmacology,Wayne State University, Detroit, MI, U.S.A.) for thegift of several luciferase gene plasmids containingthe proximal promoter of cathepsin B. We also thankM. Savels for help with the Figure layout.
FundingThis work was supported by the Actions deRecherches Concertees-Communaute Francaisede Belgique [grant number ARC#326]; and theFonds National de la Recherche Scientifique [grantnumber 2.4650.06].
ReferencesAmuthan, G., Biswas, G., Zhang, S.Y., Klein-Szanto, A.,
Vijayasarathy, C. and Avadhani, N.G. (2001) Mitochondria-to-nucleus stress signaling induces phenotypic changes, tumorprogression and cell invasion. EMBO J. 20, 1910–1920
Arnould, T., Vankoningsloo, S., Renard, P., Houbion, A., Ninane, N.,Demazy, C., Remacle, J. and Raes, M. (2002) CREB activationinduced by mitochondrial dysfunction is a new signaling pathwaythat impairs cell proliferation. EMBO J. 21, 53–63
Badran, B.M., Wolinsky, S.M., Burny, A. and Willard-Gallo, K.E. (2002)Identification of three NFAT binding motifs in the 5′-upstreamregion of the human CD3γ gene that differentially bind NFATc1,NFATc2, and NF-κB p50. J. Biol. Chem. 277, 47136–47148
Baraz, L., Haupt, Y., Elkin, M., Peretz, T. and Vlodavsky, I. (2006)Tumor suppressor p53 regulates heparanase gene expression.Oncogene 25, 3939–3947
Bien, S., Ritter, C.A., Gratz, M., Sperker, B., Sonnemann, J., Beck,J.F. and Kroemer, H.K. (2004) Nuclear factor-κB mediatesup-regulation of cathepsin B by doxorubicin in tumor cells.Mol. Pharmacol. 65, 1092–1102
Biswas, G., Adebanjo, O.A., Freedman, B.D., Anandatheerthavarada,H.K., Vijayasarathy, C., Zaidi, M., Kotlikoff, M. and Avadhani, N.G.(1999) Retrograde Ca2+ signaling in C2C12 skeletal myocytes inresponse to mitochondrial genetic and metabolic stress: a novelmode of inter-organelle crosstalk. EMBO J. 18, 522–533
Biswas, G., Anandatheerthavarada, H.K., Zaidi, M. and Avadhani,N.G. (2003) Mitochondria to nucleus stress signaling: a distinctivemechanism of NFκB/Rel activation through calcineurin-mediatedinactivation of IκBβ. J. Cell Biol. 161, 507–519
Brandon, M., Baldi, P. and Wallace, D.C. (2006) Mitochondrialmutations in cancer. Oncogene 25, 4647–4662
Bubici, C., Papa, S., Dean, K. and Franzoso, G. (2006) Mutualcross-talk between reactive oxygen species and nuclear factor-κB:molecular basis and biological significance. Oncogene 25,6731–6748
Butow, R.A. and Avadhani, N.G. (2004) Mitochondrial signaling:the retrograde response. Mol. Cell 14, 1–15
Cavallo-Medved, D., Mai, J., Dosescu, J., Sameni, M. and Sloane,B.F. (2005) Caveolin-1 mediates the expression and localization ofcathepsin B, pro-urokinase plasminogen activator and theircell-surface receptors in human colorectal carcinoma cells.J. Cell Sci. 118, 1493–1503
Dass, K., Ahmad, A., Azmi, A.S., Sarkar, S.H. and Sarkar, F.H. (2008)Evolving role of uPA/uPAR system in human cancers. Cancer Treat.Rev. 34, 122–136
Deryugina, E.I. and Quigley, J.P. (2006) Matrix metalloproteinases andtumor metastasis. Cancer Metastasis Rev. 25, 9–34
Gloire, G., Legrand-Poels, S. and Piette, J. (2006) NF-κB activationby reactive oxygen species: fifteen years later. Biochem.Pharmacol. 72, 1493–1505
Gocheva, V., Zeng, W., Ke, D., Klimstra, D., Reinheckel, T., Peters, C.,Hanahan, D. and Joyce, J.A. (2006) Distinct roles for cysteinecathepsin genes in multistage tumorigenesis. Genes Dev. 20,543–556
Gonzalez-Noriega, A., Grubb, J.H., Talkad, V. and Sly, W.S. (1980)Chloroquine inhibits lysosomal enzyme pinocytosis and enhanceslysosomal enzyme secretion by impairing receptor recycling.J. Cell Biol. 85, 839–852
Hanewinkel, H., Glossl, J. and Kresse, H. (1987) Biosynthesis ofcathepsin B in cultured normal and I-cell fibroblasts. J. Biol. Chem.262, 12351–12355
Hoffmann, A., Natoli, G. and Ghosh, G. (2006) Transcriptionalregulation via the NF-κB signaling module. Oncogene 25,6706–6716
Joyce, J.A., Baruch, A., Chehade, K., Meyer-Morse, N., Giraudo, E.,Tsai, F.Y., Greenbaum, D.C., Hager, J.H., Bogyo, M. and Hanahan,D. (2004) Cathepsin cysteine proteases are effectors of invasivegrowth and angiogenesis during multistage tumorigenesis.Cancer Cell 5, 443–453
40 C© The Authors Journal compilation C© 2009 Portland Press Ltd

Cathepsin B expression in cells lacking mtDNA Research article
Karin, M. (2006) Nuclear factor-κB in cancer development andprogression. Nature 441, 431–436
King, M.P. and Attardi, G. (1989) Human cells lacking mtDNA:repopulation with exogenous mitochondria by complementation.Science 246, 500–503
King, M.P. and Attardi, G. (1996) Isolation of human cell lines lackingmitochondrial DNA. Methods Enzymol. 264, 304–313
Kirschke, H., Eerola, R., Hopsu-Havu, V.K., Bromme, D. and Vuorio,E. (2000) Antisense RNA inhibition of cathepsin L expressionreduces tumorigenicity of malignant cells. Eur. J. Cancer 36,787–795
Kokkonen, N., Rivinoja, A., Kauppila, A., Suokas, M., Kellokumpu, I.and Kellokumpu, S. (2004) Defective acidification of intracellularorganelles results in aberrant secretion of cathepsin D in cancercells. J. Biol. Chem. 279, 39982–39988
Kostoulas, G., Lang, A., Nagase, H. and Baici, A. (1999) Stimulationof angiogenesis through cathepsin B inactivation of the tissueinhibitors of matrix metalloproteinases. FEBS Lett. 455, 286–290
Krueger, S., Haeckel, C., Buehling, F. and Roessner, A. (1999)Inhibitory effects of antisense cathepsin B cDNA transfection oninvasion and motility in a human osteosarcoma cell line.Cancer Res. 59, 6010–6014
Mach, L., Stuwe, K., Hagen, A., Ballaun, C. and Glossl, J. (1992)Proteolytic processing and glycosylation of cathepsin B. The roleof the primary structure of the latent precursor and of thecarbohydrate moiety for cell-type-specific molecular forms of theenzyme. Biochem. J. 282, 577–582
Mohamed, M.M. and Sloane, B.F. (2006) Cysteine cathepsins:multifunctional enzymes in cancer. Nat. Rev. Cancer 6, 764–775
Ogishima, T., Shiina, H., Breault, J.E., Terashima, M., Honda, S.,Enokida, H., Urakami, S., Tokizane, T., Kawakami, T., Ribeiro-Filho,L.A. et al. (2005) Promoter CpG hypomethylation and transcriptionfactor EGR1 hyperactivate heparanase expression in bladdercancer. Oncogene 24, 6765–6772
Perkins, N.D. (2007) Integrating cell-signalling pathways with NF-κBand IKK function. Nat. Rev. Mol. Cell Biol. 8, 49–62
Petros, J.A., Baumann, A.K., Ruiz-Pesini, E., Amin, M.B., Sun, C.Q.,Hall, J., Lim, S., Issa, M.M., Flanders, W.D., Hosseini, S.H. et al.(2005) mtDNA mutations increase tumorigenicity in prostatecancer. Proc. Natl. Acad. Sci. U.S.A. 102, 719–724
Podgorski, I., Linebaugh, B.E., Sameni, M., Jedeszko, C., Bhagat, S.,Cher, M.L. and Sloane, B.F. (2005) Bone microenvironmentmodulates expression and activity of cathepsin B in prostatecancer. Neoplasia 7, 207–223
Ren, W.P., Fridman, R., Zabrecky, J.R., Morris, L.D., Day, N.A. andSloane, B.F. (1996) Expression of functional recombinant humanprocathepsin B in mammalian cells. Biochem. J. 319, 793–800
Renard, P., Ernest, I., Houbion, A., Art, M., Le Calvez, H., Raes, M.and Remacle, J. (2001) Development of a sensitive multi-wellcolorimetric assay for active NFκB. Nucleic Acids Res. 29, E21
Rochefort, H., Garcia, M., Glondu, M., Laurent, V., Liaudet, E., Rey,J.M. and Roger, P. (2000) Cathepsin D in breast cancer:mechanisms and clinical applications, a 1999 overview.Clin. Chim. Acta 291, 157–170
Sleat, D.E., Chen, T.L., Raska, Jr, K. and Lobel, P. (1995) Increasedlevels of glycoproteins containing mannose 6-phosphate in humanbreast carcinomas. Cancer Res. 55, 3424–3430
Sleat, D.E., Donnelly, R.J., Lackland, H., Liu, C.G., Sohar, I., Pullarkat,R.K. and Lobel, P. (1997) Association of mutations in a lysosomalprotein with classical late-infantile neuronal ceroid lipofuscinosis.Science 277, 1802–1805
van Waveren, C., Sun, Y., Cheung, H.S. and Moraes, C.T. (2006)Oxidative phosphorylation dysfunction modulates expression ofextracellular matrix-remodeling genes and invasion.Carcinogenesis 27, 409–418
Yan, S., Berquin, I.M., Troen, B.R. and Sloane, B.F. (2000)Transcription of human cathepsin B is mediated by Sp1 and Etsfamily factors in glioma. DNA Cell Biol. 19, 79–91
Yan, S., Jane, D.T., Dufresne, M.J. and Sloane, B.F. (2003)Transcription of cathepsin B in glioma cells: regulation by an E-boxadjacent to the transcription initiation site. Biol. Chem. 384,1421–1427
Received 17 March 2008/12 June 2008; accepted 3 July 2008
Published as Immediate Publication 3 July 2008, doi:10.1042/BC20080043
www.biolcell.org | Volume 101 (1) | Pages 31–41 41
Biol. Cell (2009) 101, 31–41 (Printed in Great Britain) doi:10.1042/BC20080043
Supplementary online data
Up-regulation of cathepsin B expression and enhancedsecretion in mitochondrial DNA-depleted osteosarcoma cells
Isabelle Hamer*1, Edouard Delaive†, Marc Dieu†, Fadi Abdel-Sater*†2, Ludovic Mercy†, Michel Jadot* andThierry Arnould†*UR�M, Unite de Recherche en Physiologie Moleculaire, Laboratoire de Chimie Physiologique, Facultes Universitaires N-D de la Paix, Rue
de Bruxelles, 61, 5000 Namur, Belgium, and †Laboratoire de Biochimie et Biologie Cellulaire, Facultes Universitaires N-D de la Paix, Rue de
Bruxelles, 61, 5000 Namur, Belgium
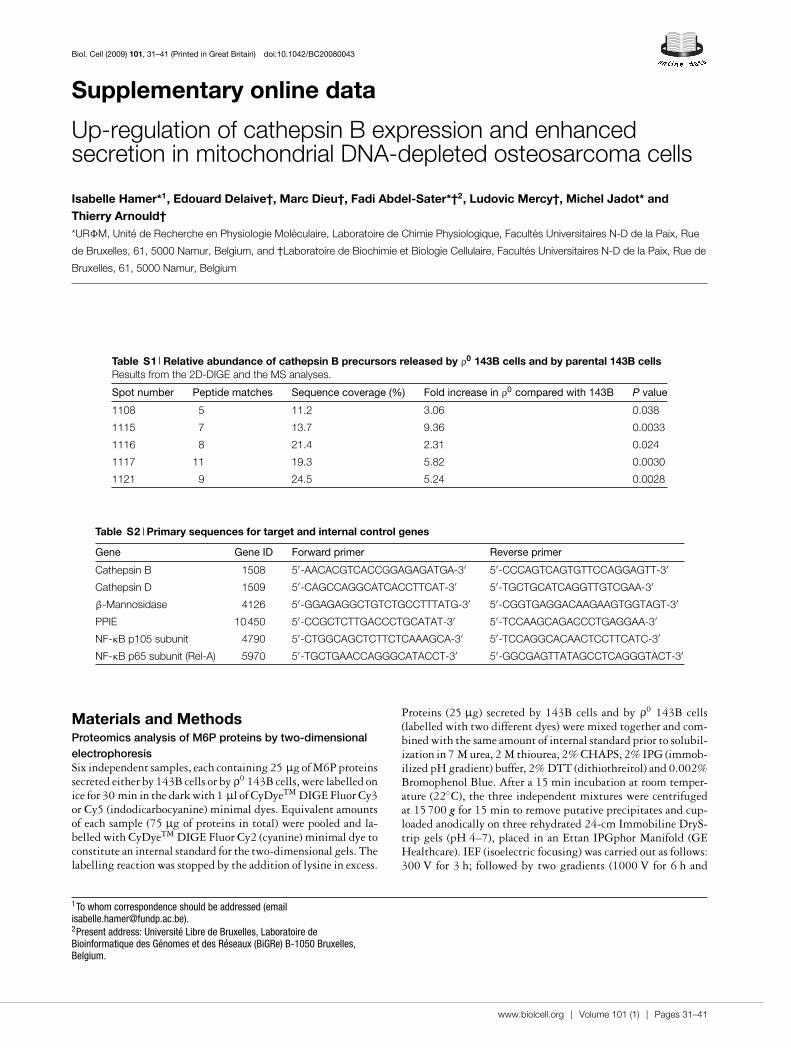
Table S1 Relative abundance of cathepsin B precursors released by ρ0 143B cells and by parental 143B cellsResults from the 2D-DIGE and the MS analyses.
Spot number Peptide matches Sequence coverage (%) Fold increase in ρ0 compared with 143B P value
1108 5 11.2 3.06 0.038
1115 7 13.7 9.36 0.0033
1116 8 21.4 2.31 0.024
1117 11 19.3 5.82 0.0030
1121 9 24.5 5.24 0.0028
Table S2 Primary sequences for target and internal control genes
Gene Gene ID Forward primer Reverse primer
Cathepsin B 1508 5′-AACACGTCACCGGAGAGATGA-3′ 5′-CCCAGTCAGTGTTCCAGGAGTT-3′
Cathepsin D 1509 5′-CAGCCAGGCATCACCTTCAT-3′ 5′-TGCTGCATCAGGTTGTCGAA-3′
β-Mannosidase 4126 5′-GGAGAGGCTGTCTGCCTTTATG-3′ 5′-CGGTGAGGACAAGAAGTGGTAGT-3′
PPIE 10450 5′-CCGCTCTTGACCCTGCATAT-3′ 5′-TCCAAGCAGACCCTGAGGAA-3′
NF-κB p105 subunit 4790 5′-CTGGCAGCTCTTCTCAAAGCA-3′ 5′-TCCAGGCACAACTCCTTCATC-3′
NF-κB p65 subunit (Rel-A) 5970 5′-TGCTGAACCAGGGCATACCT-3′ 5′-GGCGAGTTATAGCCTCAGGGTACT-3′
Materials and MethodsProteomics analysis of M6P proteins by two-dimensionalelectrophoresisSix independent samples, each containing 25 μg of M6P proteinssecreted either by 143B cells or by ρ0 143B cells, were labelled onice for 30 min in the dark with 1 μl of CyDyeTM DIGE Fluor Cy3or Cy5 (indodicarbocyanine) minimal dyes. Equivalent amountsof each sample (75 μg of proteins in total) were pooled and la-belled with CyDyeTM DIGE Fluor Cy2 (cyanine) minimal dye toconstitute an internal standard for the two-dimensional gels. Thelabelling reaction was stopped by the addition of lysine in excess.
1To whom correspondence should be addressed ([email protected]).2Present address: Universite Libre de Bruxelles, Laboratoire deBioinformatique des Genomes et des Reseaux (BiGRe) B-1050 Bruxelles,Belgium.
Proteins (25 μg) secreted by 143B cells and by ρ0 143B cells(labelled with two different dyes) were mixed together and com-bined with the same amount of internal standard prior to solubil-ization in 7 M urea, 2 M thiourea, 2% CHAPS, 2% IPG (immob-ilized pH gradient) buffer, 2% DTT (dithiothreitol) and 0.002%Bromophenol Blue. After a 15 min incubation at room temper-ature (22◦C), the three independent mixtures were centrifugedat 15700 g for 15 min to remove putative precipitates and cup-loaded anodically on three rehydrated 24-cm Immobiline DryS-trip gels (pH 4–7), placed in an Ettan IPGphor Manifold (GEHealthcare). IEF (isoelectric focusing) was carried out as follows:300 V for 3 h; followed by two gradients (1000 V for 6 h and
www.biolcell.org | Volume 101 (1) | Pages 31–41
I. Hamer and others
8000 V for 3 h) and then 8000 V up to 50000 Vhr (Volt-hours).After IEF, strip gels were equilibrated for 15 min first in 50 mMTris/HCl (pH 8.8), 6 M urea, 30% glycerol and 2% SDS, sup-plemented with 1% DTT, and then in the same buffer but sup-plemented with 2.5% iodoacetamide. Finally, they were placedon top of a 10% acrylamide gel in the presence of 0.1% SDSfor electrophoresis in an Ettan DALT six system (GE Health-care). Following two-dimensional electrophoresis, the three gelswere scanned with a Typhoon 9400 Variable Mode Imager atthree different wavelengths to detect Cy2, Cy3 and Cy5 sig-nals respectively. Images were then analysed with the DeCy-
der two-dimensional differential software (GE Healthcare). Thissoftware enabled us to generate a list of spots for which in-tensity was significantly increased by at least 2-fold in the ρ0
143B cells when compared with the 143B cells (Student’s ttest, P < 0.05). These protein spots were automatically pickedwith an Ettan Spot Picker (GE Healthcare), digested in-gel withtrypsin and peptides were analysed by MS using a MALDI–TOF(matrix-assisted laser-desorption ionization–time-of-flight) ap-paratus (MALDI MX, Waters). Proteins of interest were identi-fied thanks to the MASCOT program (Matrix science) connectedto the NCBI human protein data bank.
Received 17 March 2008/12 June 2008; accepted 3 July 2008
Published as Immediate Publication 3 July 2008, doi:10.1042/BC20080043
C© The Authors Journal compilation C© 2009 Portland Press Ltd