unveiling protectionism: regional responses to … report/08 unveiling... · regional responses to...
TRANSCRIPT
PLA
NNING PROSPERRITYPLA
NNING PROSPE
ITY
TOGETHERTOGETHER
Regional ResponsesRegional Responsesto Remaining Barriersto Remaining Barriersin the Textiles andin the Textiles andClothing TradeClothing Trade
UNVEILINGUNVEILINGPROTECTIONISM:PROTECTIONISM:
UN
VE
ILING
PR
OTE
CTIO
NIS
M:
Reg
ion
al Resp
on
ses to R
emain
ing
Barriers in
the T
extiles and
Clo
thin
g T
rade
The secretariat of the Economic and Social Commission for Asia and the Pacific(ESCAP) is the regional development arm of the United Nations and serves as the maineconomic and social development centre for the United Nations in Asia and the Pacific.Its mandate is to foster cooperation between its 53 members and 9 associate members.It provides the strategic link between global and country-level programmes and issues.It supports Governments of countries in the region in consolidating regional positionsand advocates regional approaches to meeting the region’s unique socio-economicchallenges in a globalizing world. The ESCAP secretariat is located in Bangkok,Thailand. Please visit the ESCAP website at <www.unescap.org> for further information.
The shaded areas of the map indicate ESCAP members and associate members.

i
UNVEILING PROTECTIONISM:
REGIONAL RESPONSES TO REMAINING BARRIERS INTHE TEXTILES AND CLOTHING TRADE
ECONOMIC AND SOCIAL COMMISSION FOR ASIA AND THE PACIFIC
COLOMBO PLAN SECRETARIAT
New York, 2008
ii
UNVEILING PROTECTIONISM: REGIONAL RESPONSES TO REMAININGBARRIERS IN THE TEXTILES AND CLOTHING TRADE
The opinions, figures and estimates set forth in this publication are the responsi-bility of the authors and should not necessarily be considered as reflecting the views orcarrying the endorsement of the United Nations, the Colombo Plan Secretariat or theirmembers, or that of the institutions with which the authors are affiliated. Some papers inthis publication were presented at the “Regional Dialogue on Restrictive Policies andMeasures in Textile and Clothing Trade”, held in Shanghai, China, on 9 and 10 April2007. Financial support for the workshop provided by the Government of China and theColombo Plan Secretariat under a project entitled “Weaving the Fabric of RegionalCooperation for Competitive Garment Exports: A Post-Quota Trading Environment(Phase 2)” is gratefully acknowledged. Printing of this publication was made possible bygenerous funding from the Colombo Plan.
Mention of firm names and commercial products does not imply the endorsementof the United Nations.
All material in this publication may be freely quoted or reprinted, butacknowledgement is required, together with a copy of the publication containing thequotation or reprint.
The use of this publication for any commercial purpose, including resale, isprohibited unless permission is first obtained from the Secretary of the PublicationsBoard, United Nations, New York. Requests for permission should state the purposeand the extent of reproduction.
This publication has been issued without formal editing.
United Nations publicationSales No. E.08.II.F.17Copyright © United Nations 2008All rights reservedManufactured in ThailandISBN: 978-92-1-120550-3ST/ESCAP/2500

iii
Contents
Page
Abbreviations and acronyms ................................................................................ xii
Acknowledgements ................................................................................................ xiv
List of contributors ................................................................................................ xv
Overview .................................................................................................................. xviii
PART ONE
Chapter
I. Textile and clothing industry: Adjusting to the post-quota world
Ratnakar Adhikari and Yumiko Yamamoto, UNDP RegionalCentre, Colombo ............................................................................................. 3
II. Economic impacts of the phase-out in 2005 of quantitativerestrictions under the Agreement on Textiles and Clothing
Margit Molnar and Przemyslaw Kowalski, OECD ......................................... 49
III. Status of protection facing exporters of textiles and clothing from
Asia and the Pacific in the North and South markets
William E. James, Centre for Strategic and InternationalStudies, Jakarta .............................................................................................. 85
IV. Does China have a competitive advantage in the low-endgarment industry? A case study approach
Bala Ramasamy and Matthew Yeung, China-Europe InternationalBusiness School, Shanghai ........................................................................... 111
V. Indian textile and apparel sector: An analysis of aspectsrelated to domestic supply and demand
Badri Narayanan G. Centre for Global Trade Analysis,Purdue University ........................................................................................... 129
VI. Indian textile and clothing sector poised for a leap
J.N. Singh, Textile Commissioner, India ........................................................ 157
VII. Textiles and clothing trade post-ATC: Can trade facilitation help?
Noordin Azhari, ESCAP ................................................................................ 171

iv
Page
PART TWO
COUNTRY REPORTS ON COPING WITH RESTRICTIVE POLICIESAND MAINTAINING COMPETITIVENESS
I. Bangladesh
Towfique G. K .M. Hassan, Bangladesh Textile Mills Association .............. 187
II. China
Hongwei Ma, Ministry of Commerce ............................................................. 199
III. Indonesia
Usman Ade Sudradjat, Indonesian Textile Association ................................ 204
IV. Kazakhstan
Tatyana Zhdanova, Chamber of Commerce and Industry ........................... 213
V. Mongolia
Chuluunbat Tsetsegmaa, Textile and Garment Industry Councily .............. 220
VI. Myanmar
Myint Soe, Myanmar Garment Manufacturers Association .......................... 226
VII. Nepal
Kiran P. Saakha, Garment Association Nepal ............................................... 232
VIII. Thailand
Virat Tandaechanurat, Thailand Textile Institute ............................................ 239
Contents (continued)

v
Contents (continued)
LIST OF TABLES
PART ONE
Page
Chapter I
1. Textile exports of selected economies, 1990 and 2004-2005 .............. 6
2. Clothing exports of selected economies, 1990 and 2004-2005 ........... 7
3. Share of the value of European Union imports of textileand clothing products, 2004-2006 .......................................................... 9
4. Share of the value of United States imports of textileand clothing products, 2004-2006 .......................................................... 10
5. Top five trade and clothing products imported by theUnited States from Mongolia, 2004-2005 .............................................. 13
6. Top five Nepalese export products to the European Unionand United States markets, 2004-2005 ................................................. 15
7. Discriminatory tariffs charged by the United States onapparel imports ....................................................................................... 20
8. Trading across borders ........................................................................... 25
9. Sri Lankan exports of women’s undergarments .................................... 37
Chapter II
1. Cost structure of firms in the textiles and wearingapparel sectors ........................................................................................ 51
2. World exports of textiles and clothing 2003-2005 ................................ 51
3. Textiles exports as a percentage of total merchandiseexports, 2005 ........................................................................................... 52
4. Pace of quota abolition ........................................................................... 55
5. Top 10 destinations of Honduran apparel exports ................................ 72
Chapter III
1. ASEAN Textile and Clothing Shipments to the US Market(value in Million US$) ............................................................................. 95
2. ASEAN Textile and Clothing Shipments to the US Market(volume in million square meter equivalents) ........................................ 96
3. SAARC Members Textile and Clothing Shipments to the US Market(Value in Million US$) ............................................................................. 97
4. SAARC Members Textile and Clothing Shipments to the US Market(Volume in Million Square Meter equivalents) ....................................... 98
vi
Contents (continued)
Page
5. World Textile and Clothing Shipments to the US Market(value in Million US$) ............................................................................. 99
6. World Textile and Clothing Shipments to the US market(volume in million square meter equivalents) ........................................ 100
7. China Textile and Clothing Shipments to the US(value in Million US$) ............................................................................. 101
8. China Textile and Clothing Shipments to the US(volume in million square meter equivalents) ........................................ 102
9. ASEAN Textile and Clothing market Sharesin the US Market in Value (%) ............................................................... 103
10. ASEAN Textile and Clothing Market Sharesin the US market in Volume (%) ............................................................ 103
11. SAARC Textile and Clothing Market Sharesin the US Market in Value (%) ............................................................... 104
12. SAARC Textile and Clothing Market Sharesin the US Market in Volume (%) ............................................................ 104
13. Major Preferential Suppliers Performance in China RestrictedItems in the US Market (Value in Million US$) .................................... 105
14. Major Preferential Suppliers Performance in China Restricted Itemsin the US Market (Volume in Million Square Meter Equivalents) ........ 106
15. Major Preferential Suppliers Textile and Clothing Market Sharesin the US Market in Value (%) ............................................................... 107
16. Major Preferential Suppliers Textile and Clothing Market Sharesin the US Market in Volume (%) ............................................................ 107
17. China Textile and Clothing Market Sharesin the US Market in Value (%) ............................................................... 108
18. China Textile and Clothing Market Sharesin the US Market in Volume (%) ............................................................ 108
Chapter IV
1. China’s leading industries by gross industrial output,1999 and 2005 ........................................................................................ 114
2. China’s garment exports, 1996 and 2006: selected items ................... 115
3. Ownership composition of China’s textile and garment industries ...... 117
4. Leading Provinces in the textile industry in China ............................... 118
5. Chinese regional contributions to textile and garmentexports and imports, 2005 ..................................................................... 118
6. Exports of shirts by China to the United States .................................. 125

vii
Page
Chapter V
1. Average annual growth rates in the organised textile and apparelsector in India (1993/94 prices) ............................................................. 132
2. Trends in some ratios of capital (K), output (Y)and employment (N) ............................................................................... 132
3. Trends in effective protection rates for differentsubsectors in the Indian textile sector ................................................... 133
4. Salient features of the organised textile and apparelsector in India: Recent trends ................................................................ 137
5. Shares of various subsectors in different sectors for 2000/01(current prices) ........................................................................................ 139
6. Annual average growth rates in the unorganized textile sector(based on 1993/94 prices) ..................................................................... 141
7. Trends in partial productivity measures in the unorganizedtextile sector in India .............................................................................. 142
8. Growth trends in partial productivity measures in the unorganizedtextile sector of India .............................................................................. 143
9. Trends in per capita consumption expenditures and shares onclothing in rural India (current prices) ................................................... 148
10. Trends in per capita consumption expenditures and share of clothingin urban India (current prices) ............................................................... 148
11. Indian textile and apparel subsectors – trends in growth ofsupply and demand ................................................................................ 149
12. Trends in excise structure of various textile staple fibresin India, 1992-2005 ................................................................................. 150
13. Trends in excise structure of various textile yarns based on filamentsand staple fibres in India, 1992-2005 (percentage ad valorem) .......... 151
14. Trends in excise structure of various textile fabrics inIndia, 1992-2005 ..................................................................................... 152
15. Elasticities of various textile commodity groups with regard toprices and textile expenditure ................................................................ 153
16. Credit applications that were received and disbursed underTUFS, 2004/05 ........................................................................................ 155
Chapter VI
1. India’s position in the world textile economy......................................... 158
2. Transaction cost in Indian industries ..................................................... 169
Chapter VII
Procedural hurdles in trading in selected regions ................................ 173
Contents (continued)

viii
Bangladesh
1. Growth pattern of primary textile mills in Bangladesh ......................... 188
2. Structure of Bangladesh textiles and clothing sector, 2006 ................. 188
3. Ownership and size of mills ................................................................... 189
4. Annual production of yarn and fabrics .................................................. 189
5. Exports of textile products ...................................................................... 190
6. Export trend of woven garments ............................................................ 190
7. Export trends for knitwear ...................................................................... 191
8. Knitwear exports by destination ............................................................. 191
9. Woven garment exports by destination ................................................. 192
10. Home textiles export trends ................................................................... 192
11. Textile fabric exports trends ................................................................... 192
12. Total demand-production gap between fabrics for domesticand export-oriented RMG Units ............................................................. 194
13. Projected demand for fabrics for domestic and export-orientedRMG units, 2004/05 to 2008/09 ............................................................. 195
14. Yarn demand-production gap .................................................................. 195
15. Estimated Investment Requirements in Primary TextileSector by 2008/09 ................................................................................... 196
China
Production of main T&C categories in 2006 ......................................... 199
Indonesia
1. Net textile industry export earnings and growth rates comparedwith im port expenditures, 1996-2005 ................................................... 205
2. Labour absorption by the textile industry .............................................. 206
3. Indonesian textile and clothing industry highlights ................................ 207
4. Indonesian fibre industry highlights ........................................................ 207
5. Polyester filament yarn ........................................................................... 208
6. Indonesian weaving, knitting and finishing subsectors ......................... 209
7. Machinery up to 20 years old ................................................................ 210
8. Indonesian spinning/yarn subsector highlights ...................................... 211
9. Spinning machinery, Asia-Oceania ......................................................... 211
10. Profile of other textile industry ............................................................... 212
PART TWO
Contents (continued)

ix
Contents (continued)
Page
Kazakhstan
Production output in Kazakhstan ........................................................... 214
Mongolia
1. Total number of T&C product exporters ................................................ 221
2. Total value of T&C products by CMP price .......................................... 221
Myanmar
1. Number of operational garment firms in Myanmar,1997-2004 ................................................................................................ 227
2. Major importers of Myanmar garments ................................................. 228
3. Productivity of garment firms in Myanmar, 2004 .................................. 229
4. Competitiveness of garment firms in Myanmar .................................... 229
5. Share of China and India in the global T&C market, 2004 ................. 230
Nepal
1. Apparel exports from Nepal to international marketsand India .................................................................................................. 233
2. Share of apparel in overseas export and total nationalexport of Nepal ....................................................................................... 234
3. Share of Nepalese garment exports to the Quad countries ................ 234
Thailand
1. Number of registered factories in operation .......................................... 239
2. Number of employees by subsector ...................................................... 240
x
Contents (continued)
LIST OF FIGURES
PART ONE
Page
Chapter II
I. EU25 imports of textiles by country and region, 2005 and 2006 ........ 59
II. EU25 imports of apparel by country and region, 2005 and 2006 ....... 60
III. United States imports of textiles by country and region,2005 and 2006 ........................................................................................ 61
IV. United States imports of apparel by country and region,2005 and 2006 ........................................................................................ 62
V. Positioning strategies of selected major competitors of Chinain the United States market, 1997-2006 ............................................... 65
VI. Polarization of necktie prices ................................................................. 66
VII. Textile trade specialization of China vis-à-vis itstop 10 competitors .................................................................................. 73
VIII. Clothing trade specialization of China vis-à-vis itstop 10 competitors .................................................................................. 74
IX. Producers previously restricted by quotas consolidatetheir export markets ................................................................................ 75
X. Top 10 destinations for exports by Madagascar in 2005 ..................... 78
Chapter IV
Export value of China’s textile and garment industry, 1996-2005 ....... 115
Chapter V
I. Employment trends in non-mill textile sector ........................................ 135
II. Employment trends in different subsectors of the textilewet processing sector ............................................................................. 135
III. Employment trends in textile wet processing sector ............................ 136
IV. Employment trends in subsectors of the textile sector ........................ 136
Chapter VI
I. Sanctioned investments in India's textile and clothing sector .............. 159
II. Production of spun yarn in India ........................................................... 160
III. Production of cloth in India .................................................................... 161
IV. Growth in Indian textile and clothing exports ........................................ 162
V. Direction of exports, 1995 and 2005 ..................................................... 163
Chapter VII
Data repetition in trade documentation .................................................. 173
xi
Contents (continued)
PART TWO
Page
China
Textile and apparel exports from China ................................................. 200
Indonesia
I. World’s 15 leading textile exporters, 2004 ............................................ 206
II. World production of man-made fibres ................................................... 209
Mongolia
I. Share of foreign investment in the Mongolian T&C sector .................. 220
II. Percentage of textile products in total export ....................................... 222
III. Total value of textile and garment products by FOB price .................. 222
Myanmar
I. Number of operational garment firms in Myanmar, 1997-2004 ........... 227
II. Major importers of garments from Myanmar in terms ofvalue (US$ million) .................................................................................. 228
III. Garment export value, 1995-2005 ......................................................... 230
Thailand
Textile and garment production and consumption, 2003-2006 ............. 241

xii
Abbreviations and acronyms
ACP African, Caribbean and Pacific group
ADB Asian Development Bank
AEC ASEAN Economic Community
AGOA African Growth and Opportunity Act
ASEAN Association of Southeast Asian Nations
ATC Agreement on Textiles and Clothing
BIMSTEC Bay of Bengal Initiatives for Multi-Sectoral Technical and EconomicCooperation
CAFTA Central American Free Trade Agreement
CEPT Common Effective Preferential Tariff
CITA United States Committee on the Implementation of theTextile Agreement
CMP cutting, making and packing
DMEs directory manufacturing establishments
EBA Everything but Arms
EPZ export processing zones
ESCAP Economic and Social Commission for Asia and the Pacific
EU25 European Union 25 group of member States
FDI foreign direct investment
FTA free trade agreement
FTZ free trade zone
GATT General Agreement on Tariffs and Trade
GDP gross domestic product
GPZ Garment Processing Zone
GTAP Global Trade Analysis Project
ITCB International Textiles and Clothing Bureau
LDCs least developed countries
LTA Long-Term Agreement Regarding International Trade in Cotton Textiles
xiii
MFA Multi-Fibre Arrangement
MFN most favoured nation
MNE multi-national enterprise
NAFTA North American Free Trade Agreement
NIC newly industrialized country
NDMEs non-directory manufacturing establishments
NSSO National Sample Survey Organisation
NTMs non-tariff measures
OAMEs own account manufacturing enterprises
OECD Organisation for Economic Co-operation and Development
OPAs outward processing arrangements
OPT outward processing trade
PTA preferential trade agreement
REACH Registration, Evaluation and Authorisation of Chemicals System
RMG ready-made garments
SAARC South Asian Association for Regional Cooperation
SABF South Asian Business Forum
SAFTA South Asian Free Trade Area
TLP Tariff Liberation Programme
TMB Textile Monitoring Body of the World Trade Organization
TPA Trade Promotion Act
TUFS Technology Upgrading Fund Scheme
UNDP United Nations Development Programme
UNIDO United Nations Industrial Development Organization
VER voluntary export restraint
WRAP Worldwide Responsible Apparel Production
WTO World Trade Organization
Abbreviations and acronyms (continued)

xiv
The collection of papers and country reports in this volume results from a projectentitled “Weaving the Fabric of Regional Cooperation for Competitive Garment Exports:A Post-Quota Trading Environment (Phase 2)” generously sponsored by the Governmentof China. The project has also benefited in various ways from the financial contributionof the Colombo Plan Secretariat and collaboration with other partners – the China-Europe International Business School in Shanghai, the United Nations DevelopmentProgramme Regional Centre in Colombo, and the Organisation for Economic Co-operation and Development.
The project is being implemented by Ms. Mia Mikic, under the overall supervisionof Mr. Xuan Zengpei, Director, Trade and Investment Division, and Ms. TizianaBonapace, Chief, Trade Policy Section, of ESCAP. The support received from Ms.Patricia Yoon-Moi Chia, current Secretary-General, and Mr. Kittipan Kanjanapipatkul,former Secretary-General, of the Colombo Plan secretariat are deeply appreciated. Theediting of this volume, done by Mr. Robert Oliver, and the formatting of the volume byMs. Tavitra Ruyaphorn of ESCAP, are also much appreciated.
Profound gratitude is due to the authors who contributed the papers and countryreports, and who patiently revised them in order to meet editorial consistency require-ments. Although much care was taken in removing obvious differences in the style andpresentation of contributions, the volume was not edited with the aim of presenting thepapers as a homogeneous manuscript. Therefore, the secretariat offers its apologies tothe readers who may find it necessary, when proceeding from chapter to chapter, toadapt to any variations in presentation.
ACKNOWLEDGEMENTS
xv
Part I – Chapters:
Ratnakar Adhikari is the Executive Chairman of South Asia Watch on Trade,Economics and Environment (SAWTEE), Kathmandu and a Senior Advisor at theNational Planning Commission of Nepal. Until recently, he was working with the UNDPAsia-Pacific Regional Centre in Colombo in the capacity of Programme Specialist. Hewas previously associated with the banking and academic areas. Mr. Adhikari haswritten/edited 18 books /monographs/discussion papers/research reports; published ar-ticles in national, regional and international newspapers and journals. He has alsocontributed chapters to some major international publications on trade policy andcompetition issues, among others. E-mail: [email protected].
Noordin Azhari is the Deputy Chief of Party for the ASEAN-United StatesTechnical Assistance and Training Facility, where he leads technical assistance activitiesin trade facilitation and other areas. During 2006-2007, he headed the Trade Efficiencyand Facilitation Section at the United Nations Economic and Social Commission for Asiaand the Pacific (ESCAP). Before joining ESCAP, Mr. Azhari held the positions ofassistant director and director at the ASEAN Secretariat for more than 16 years. Thislong affiliation with the ASEAN Secretariat has helped Mr. Azhari develop an in-depthknowledge and understanding of regional economic integration and intergovernmentalmatters, particularly regarding ASEAN. Before joining the ASEAN Secretariat, Mr. Azhariwas a member of the Malaysian Administrative and Diplomatic Service and held variouspositions in the Ministry of Trade and Industry of Malaysia. He holds a Masters inInternational Studies from the University of Birmingham, United Kingdom. Email:[email protected]
William E James has worked extensively in Asia for multilateral and bilateraldonors such as USAID, the Asia Development Bank and the World Bank. He has alsoheld several prestigious posts in academia including the East-West Center, the Univer-sity of Hawaii, the University of the Philippines at Diliman Quezon, the AustralianNational University and Kobe University in Japan. He is an Assistant Editor of the AsianEconomic Journal and is a member of the international advisory board of the Bulletin ofIndonesian Economic Studies. He is Principal Economist, Macroeconomics and FinanceResearch Division, Asian Development Bank. Email: [email protected]
Yumiko Yamamoto is a Gender and Trade Programme Advisor at the Asia-Pacific Trade and Investment Initiative, UNDP Asia-Pacific Regional Centre. She iscurrently working in the areas of trade, gender and human development, includinghuman development impact assessment of the expiry of quotas in textiles and clothing,and Trade-Related Intellectual Property Rights and its impacts on women’ health. She isa PhD candidate in economics. E-mail: [email protected].
Przemyslaw Kowalski is an economist at the Organisation for Economic Co-operation and Development (OECD) and a visiting lecturer at the Institut d’EtudesPolitiques de Paris, Sciences Po in Paris. He graduated with a D.Phil. in economics fromthe University of Sussex, United Kingdom, and holds an MA and MSc in economicsfrom the University of Sussex and the University of Warsaw, respectively. His past andcurrent work includes issues in international trade theory and policy, applied trade policyanalysis and international finance. E-mail: [email protected].
LIST OF CONTRIBUTORS

xvi
Mia Mikic is an Economic Affairs Officer in the Trade and Investment Division,ESCAP. Previously, she was Professor of International Economics at the University ofZagreb, Senior Lecturer at the University of Auckland, Research Associate at theUniversity of Canterbury and a visiting fellow at the Universite Lumiere, Lyon, andOxford University. She is the author of International Trade (Macmillan, 1998), hascontributed chapters to several edited volumes and has published a number of papers.Her current work focuses on the impacts of preferential and multilateral trade liberaliza-tion. E-mail: [email protected].
Margit Molnar is a Senior Economist at the Organisation for Economic Co-operation and Development (OECD). Prior to joining OECD, she consulted for theGovernment of Japan project, “The Asian Financial Crisis and Response of Macro-economy”, and conducted research for the Institute for World Economics of theHungarian Academy of Sciences. She is the author of many articles, book chapters andbook-length reports, including Challenges for China’s Public Spending (2006, mainauthor), Governance in China (2006), OECD economic surveys, Going for Growth andOECD economic outlooks. She received her B.A. from Renmin University of China, herMaster’s from Budapest Economics University and Ritsumeikan University, and her Ph.D.from the Graduate School of Economics, Keio University in Japan. She publishes andholds seminars in English, Chinese and Japanese, and uses French and Russian in herwork as well as her native Hungarian. E-mail: [email protected]
Badri Narayanan G. is a Research Economist at the Centre for Global TradeAnalysis, Purdue University. Prior to joining Purdue University, he was a Fellow at theIndian Council for Research on International Economic Relations (ICRIER), New Delhi.He completed his PhD in Development Studies on the Indian textile and apparel sectorfrom Indira Gandhi Institute of Development Research (IGIDR), Mumbai. He has alsoworked in the garment export industry in Tirupur, India, after obtaining a Bachelorsdegree in Textile Technology from PSG College of Technology, Coimbatore, India. Hehas had several papers published in international journals and has contributed chaptersto several edited books. E-mail: [email protected].
Bala Ramasamy is Professor of Economics at the China Europe InternationalBusiness School in Shanghai, China. Previously, he was Professor of Economics andInternational Business at the University of Nottingham, Malaysia Campus. He has alsotaught at universities in Malaysia, New Zealand and Macao, China. His researchinterests are in foreign direct investment, international trade and corporate socialresponsibility with a special focus on East Asia. His research has been published inmany international journals and practitioner magazines. E-mail:[email protected]
J. N. Singh is currently working as Textile Commissioner, Government of India.He is responsible for overseeing the growth and development of the textile and apparelsector in the country, especially investment in the sector, external trade and technicaltextiles. Previously, he worked with the Government of Gujarat in various capacitiesincluding chief executive of several public sector enterprises and as Secretary in theInformation Technology Department. He is a management graduate from the AsianInstitute of Management, Manila and holds a PhD in political science. E-mail:[email protected]
Matthew Yeung is Lecturer in marketing at the Open University of Hong Kong,China. He holds a PhD in marketing from the University of Nottingham. His areas ofresearch are international marketing, foreign direct investment and corporate socialresponsibility in Asia. His work has been published in many international journalsworldwide. E-mail: [email protected]

xvii
Part II – Country Reports:
Towfiques GKM Hassan, Secretary-General, Bangladesh Textile Mills Association,Bangladesh. E-mail: [email protected].
Hongwei Ma, Deputy Division Director, Department of Foreign Trade, Ministry ofCommerce, China. E-mail: [email protected].
Usman Ade Sudradjat, Vice-Chairman, Indonesian Textile and Association (API),Indonesia. E-mail: [email protected].
Tatyana Zhdanova, Vice-President, Kazakhstan Chamber of Commerce andIndustry, Kazakhstan. E-mail: [email protected].
Chuluunbat Tsetsegmaa, Head of Foreign Trade Documentation and Secretary ofthe Textile and Garment Industry Council, Mongolian National Chamber of Commerceand Industry, Mongolia. E-mail: [email protected]; [email protected].
Myint Soe, Chairman, Myanmar Garment Manufacturers Association, Myanmar.E-mail: [email protected].
Kiran P. Saakha, President, Garment Association of Nepal, Nepal. E-mail:[email protected], [email protected].
Virat Tandaechanurat, Executive Director, Thailand Textile Institute, Ministry ofIndustry, Thailand. Email: [email protected].

xviii
OVERVIEWBy Mia Mikic
Introduction
On 1 January 2005, international trade in textiles and clothing finally becamepart of the multilateral trading system, but producers/exporters are not breathing anyeasier. The trading environment for this sector has since been changing more rapidlythan ever. Competitive pressures have intensified in the largest importing markets, andexporters of textiles and clothing face heavy pressure to cut prices. For countries wherethis sector generates employment and foreign exchange revenues, this has spelledfurther difficulties for development prospects. These are typically least developed coun-tries with a lack of financial, technological and other resources for absorbing a large,unskilled and predominantly female labour force employed by textiles and clothing.
There are also clear signs that other forms of protectionism may be on the risein some developed countries, which are the major imprting markes.. Therefore, tosustain previous trends of production and exports of textile and clothing from developingcountries of the region, recourse should be found in alternative but complementarystrategies through regional cooperation. The creation of regional supply chains throughthe integration of markets, and gender-differentiated trade adjustment financing tocompensate losers (most of whom would be women) should be pursued. This wouldenable key stakeholders to formulate appropriate policy responses, including gender-differentiated responses, and to more effectively participate in negotiations on futurepolicy frameworks relevant to this sector.
Given the relevance of the textile and clothing sector to its member countries,the ESCAP secretariat undertook the implementation of a project under the theme,“Weaving the fabric of regional cooperation for a competitive garment exprots: A post-quota trading environment”, which was supported financially by the Government ofChina and the Colombo Plan secretariat. The overall project objective has been toimprove the effectiveness of responses by participating ESCAP member country govern-ments to the changing trading environment in the textile and clothing sector, byformulating policies for improved intraregional trade and investment flows.
Phase 1 of the project brought together multi-stakeholders from the region aswell as from outside the region for a workshop at the Guanghua Business School inBeijing in 2005 to discuss the early impact of elimination of the Multi-Fibre Arrangement(MFA) and the changes in the patterns of supply, demand and trade. That dialoguesuggested a follow-up seminar with emphasis on the development of a vertical andhorizontal sectoral integration within the region. Thus, the focus of Phase 2 of theproject was on exploring deeper regional cooperation in trade, investment and produc-tion in the textiles and clothing sector. Towards that end, two research studies wereproduced (and are included in this publication chapters III and IV) and the “RegionalDialogue on Restrictive Policies and Measures in the Textile and Clothing Trade” wasorganized in 2007 at the China-Europe International Business School in Shanghai. Someof the papers and most of the country reports presented in that meeting have beenintegrated into this volume.
While China remains the focus of any analysis of the textile and clothing sector,it is important to note that since 2006, China has been diversifying its export structurein order to reduce the dependence on textiles and clothing. As discussed in this
xix
publication, many developing countries in the region have recognized this as anopportunity to defend, if not increase, their own market share, particularly throughintraregional cooperation in investment and production in this sector. However, someeconomies – as is evident from the country reports in the Part Two of this publication –still consider China to be a tough competitor.
Chapter content
As stated in chapter I by Ratnakar Adhikari and Yumiko Yamamoto, and woveninto other chapters and country reports, textiles and clothing have been the instrumentalsector in the industrialization of many developing countries. Textiles and clothingproduction provided all the main features necessary to boosting industrialization in thosecountries:
(a) A technology level that was not too demanding;
(b) Reliance on an unskilled or semi-skilled workforce and able to absorbextensive female labour;
(c) No other significant entry barriers such as high capital outlays; and
(d) While remaining one of the most protected industries in the developedmarkets, it also allowed for the formation of vertical supply chains.
Adhikari and Yamamoto illustrate this last point nicely by saying “…entrepreneursin countries restricted by quotas found ways to exploit the [quota] system. Theyestablished factories in countries with low levels of quota utilization and in someinstances even helped in the industrialization process of those countries.” Unfortunately,in many of these countries, the increased capacity to export did not translate intohigher-paid employment or better working conditions. In a number of countries, thehuman development aspect of the expansion of the textile and clothing sector has notbeen very encouraging. Nevertheless, many Asia-Pacific countries based their industrial-ization and exports on this sector, and had high expectations from the replacement ofthe quota-based MFA system with the GATT-consistent regime in the form of theAgreement on Textiles and Clothing in 2005.
The three years that have elapsed since the passing of the MFA is still too shorta period for drawing definite conclusions. However, as discussed in chapter II by MargitMolnar and Przemyslaw Kowalski, some reshaping of the global textile and clothingproduction and investment is already starting to take place. “Exporters with low costsand high productivity – such as China, India and Viet Nam – have succeeded inbenefiting from enlarged markets, while the phase-out has brought about challenges forOECD and small country producers”.
Even with special contingent protection, the changes in the European Union andthe United States markets that were brought about by demise of the MFA have beensignificant. In addition to increased imports, the geographical structure of imports ischanging in favour of China, Viet Nam and, to a lesser degree, Bangladesh, Cambodiaand Sri Lanka at the expense of Mediterranean partners for Europe, and NAFTA orCAFTA for the United States. Increasing quotas on Chinese imports put increasingpressure on other suppliers. Strategies adopted by countries to deal with these shockswere different, and varied in effectiveness.
xx
The analysis in chapter II explains the differences between specialization,reorientation of markets and relocation overseas, which have been the main strategieschosen for survival. Specialization (vertical and horizontal) was adopted by developedand developing countries alike. Reorientation of markets was followed mostly bydeveloping countries while relocation was the choice made by developed countryproducers.
Those strategies employed in Asian economies must have worked, as predictionsof the collapse of all Asian suppliers except China obviously did not come true, WilliamJames notes in chapter III. However, restructuring is not over yet and there are stillchallenges to be faced by all exporters. He argues that a threat to the futuredevelopment of the textile and clothing industries within the Asia-Pacific region exists inthe proliferation of preferential trade agreements involving major industrial markets anddeveloping countries. He claims that the agreements between an Asian partner and non-regional partners tend to provide more favourable market access in textiles and clothingthan do agreements involving two Asian partners. In addition, rules of origin tend to bemore restrictive for intra-Asian trade partners than for non-regional partners. Thus, intra-regional PTAs create a denser “noodle bowl” environment for Asian suppliers of textilesand clothing products.
Most of the protectionist measures have been aimed at producers and exportersfrom China, as they are deemed the most competitive. The sharp increases in exportsof various textile and clothing products from China since 2005 support this view of thatcountry’s pre-eminent position as the “tailor of the world”. Studies of the sources ofcompetitive advantages of China have so far mostly focused on low labour costs andlarge-scale production capacity. Chapter IV summarizes research undertaken by BalaRamasamy and Mathew Yeung into the role of restrictive trade policies, and theirimpacts at firm level, in a search for further explanations of the competitive advantagesof China. They apply a case study approach, comparing two garment manufacturers inBeijing and Jakarta, and find that the future of China lies in high-end products thatinvolve fabrics, design and technology that are more sophisticated. The chapter alsoidentifies the fact that for producers in competing countries, greater linkages withChinese producers in forming supply chains may be critical.
India is another highly competitive Asian exporter. While the textile and clothingsector of India has been the second largest employer after agriculture, and thus remainscrucial to India’s efforts to reduce poverty, the sector is facing many problems. Theseproblems are analysed in chapters V and VI.
In chapter V, Badri Narayanan G. focuses on some of the major domestic issuesthat encompass supply and demand in the sector. On the supply side, consideration isgiven to performance and employment, both in the organized and unorganized segmentsof the sector, by looking at productivity measures, employment, capital and output. Onthe demand side, the focus is on fiscal and tariff policies.
In chapter VI, J. N. Singh takes a forward-looking position. He discusses thepitfalls of the static scenario of the Indian textile sector and its position in the worldtextile economy. He reviews supportive government policies for facilitating the growth ofthe sector and the industry’s responses to those policies. Recent trends such asconsolidation and integration, non-differentiation between exports and supply for domes-tic market, entry of large retail buyers and increased presence at foreign fairs are allconsidered. Singh also tackles further steps needed to improve Indian competitivenessglobally.

xxi
Trade facilitation is increasingly being seen as a universal solution to allproblems that prevent producers from succeeding in getting their products to consumers,a viewpoint from which the textile and clothing sector is not excluded. While chapter Iand chapter III each tackle some trade facilitation issues, chapter VII by Noordin Azharisystematizes the role that trade facilitation might play in the sector and the region.Indeed, he agrees that in the post-ATC environment, the time taken to reach marketshas become an important factor in determining whether a textile and clothing companycan sustain, or remain within the global supply chain. He identifies a set of actions tobe undertaken at the global, national and regional levels to improve the efficiency andcompetitiveness of textile and clothing producers.
Trade facilitation reforms in the Asian and Pacific developing countries within thecontext of textiles and clothing can help to promote backward and forward linkages aswell as investment, and can assist the industry in terms of meeting shorter lead-times,thus reducing transaction costs. Azhari outlines the ESCAP role in improving area oftrade facilitation and notes that the main emphasis needs to be placed on promoting thesimplification, harmonization and standardization of procedures and related documentaryrequirements in international trade, thus reducing transaction costs and time.
ESCAP is assisting its members in developing national trade facilitation plans ofaction, based on the identification of the needs and priorities of individual countries. It isencouraging the establishment of, and providing support to,existing national coordinationbodies for facilitating trade and transport. Through its own work and in contacts withvarious stakeholders, to share ideas and best practices on how to reduce tradetransaction costs. In addition, ESCAP is acting to increase the awareness and imple-mentation capacity of global and regional legal arrangements related to trade facilitation.In this regard, ESCAP adopts an inclusive approach to trade facilitation by ensuring thatall stakeholders are involved and consulted, i.e., the public sector (all relevant govern-ment agencies), the private sector (manufacturers and service providers) and civilsociety.
Country reports
The country reports included in this publication have all been prepared byindustry specialists from the following countries: Bangladesh, China, Indonesia,Kazakhstan, Mongolia, Myanmar, Nepal and Thailand.

xxii

1
PART ONE

2

3
I. TEXTILE AND CLOTHING INDUSTRY: ADJUSTINGTO THE POST-QUOTA WORLD*
By Ratnakar Adhikari and Yumiko Yamamoto
Introduction
It is just over two years since the phasing-out of the global system of quotacontrols that governed trade in the textile and clothing (T&C) industry. That industrygenerates US$ 479 billion in world exports and accounts for a 4.6 per cent share inglobal merchandise exports (World Trade Organization, 2006a). The quota system andpolicy developments since its demise illustrate the highly selective and targeted natureof production and market relations in the industry. Although 1 January 2005 wassupposed to mark the end of the quota system for all countries, and was expected tounleash massive adjustment challenges for a number of countries, quota elimination hasshown a mixed result so far. Moreover, those countries that have lost out the most hadseen their exports decline earlier, which means that their dismal performance cannotmerely be ascribed to the quota phase-out.
Several countries that had been projected by numerous studies to lose out in thepost-quota world not only managed to hold on to their past gains, but also achievedsignificant growth in their export earnings. This is mainly because of the re-imposition ofquotas on T&C exports from China, not only by the developed countries but also bysome developing countries that were making use of temporary safeguard measures asagreed to by China during the process of its accession to WTO.
Most analysts predict that the situation will change after the phasing-out of thesafeguards measures, which will expire in 2008. At the same time, the entry of VietNam into WTO on 11 January 2007, which has enabled the country to compete in theglobal T&C market without any quantitative restrictions on T&C exports, means that thecompetitive pressure is likely to become intense for the small and marginal players.Therefore, the real adjustment challenge has yet to begin.
Textiles and clothing comprise a unique industry in the global economy mainlyfor three reasons. First, most developed countries of today as well as newly industrial-ized countries (NICs) have used this industry as the springboard for their developmentjourney; even some least developed countries (LDCs) have been able to step onto thedevelopment ladder on the basis of their T&C industry. Millions of people, mostlywomen, are employed in this industry in most of these economies.
Second, this industry has very low entry barriers; entry does not require hugecapital outlay and factories can be set up that employ workers with relatively low skills.Therefore, this industry is characterized by high competition intensity.
Third, this industry is the most protected of all manufacturing industries in theglobal economy, both in developed and developing countries. Protectionist interests havebeen extremely ingenious in creating new protectionist instruments in the past 50 years.
* The text in this chapter was first published as a chapter under the same title in the book“Industrial Development for the 21st Century: Sustainable Development Perspectives”, UnitedNation, New York, 2007. The authors gratefully acknowledge the helpful comments provided byManuel F. Montes (UN-DESA).

4
Taking as a precedent the imposition in 1957 of voluntary export restraints(VERs) on the exports of cotton textiles from Japan to appease the domestic textileindustry in the United States, the regime of protection in this industry was institutional-ized in 1974 with the introduction of the Multi-fibre Arrangement (MFA). This governedinternational trade in textiles and clothing for almost two decades. This arrangementenabled developed countries to bilaterally negotiate quotas with supplier countries,taking into account their competitiveness and the perceived threat to the domesticinterests in the importing countries. During the Uruguay Round of multilateral tradenegotiations (1986-1993), the international community decided to integrate the MFA intothe new Agreement on Textiles and Clothing (ATC), which featured a clear timetable forphasing out the quota system within a 10-year period, starting on 1 January 1995(Adhikari and Weeratunge, 2007).
Even during the heyday of the quota system, characterized by a distorted globalmarket for T&C products, entrepreneurs in countries restricted by quotas found ways toexploit the system. They established factories in countries with low levels of quotautilization and in some instances even helped in the industrialization process of thosecountries. For example, Korean companies established factories in Bangladesh, theCaribbean and sub-Saharan Africa, Chinese companies established factories in severalAsian and African locations, Indian companies in Nepal; even relatively minor players inthe global market such as Sri Lankan and Mauritian businesspersons establishedfactories in Maldives and Madagascar, respectively, to overcome quota restrictions. Whilethe indigenization of the industry took place in some countries (e.g., Bangladesh andNepal) due to the entry of the local entrepreneurs, in other countries (e.g., Maldives)the industry itself was wiped off the industrial map once the foreign investors pulled out.
Against this backdrop, the objective of this chapter is to discuss the current stateof play in the global T&C market, identify the factors shaping and influencing theevolution of this industry including emerging trends, and provide some policy recommen-dations for the developing countries in order to help them not only survive in the post-quota regime, but also exploit the opportunities created by the increased competition inthe industry.
Section A summarizes the trade flows in the post-quota world and discusses thehuman development implications of the quota phase-out. Section B discusses challengesfacing developing countries and LDCs in using the T&C industry as a springboard fortheir development efforts. Section C deals with emerging issues in the areas of T&Ctrade at the global level, which offers various opportunities as well as challenges to theT&C industry in the developing countries. Section D analyses the efforts made byvarious developing countries to overcome the emerging challenges and critically evalu-ates the sufficiency of such measures in addition to proposing some measures thatcould help these countries minimize the human development fallout of the phasing outof quotas. Section E provides the conclusion.
A. Trade flows in the post-Agreement on Textiles and Clothingperiod and their human development implications
Textiles and clothing are among the first manufactured products that an indus-trializing economy produces. They played a critical role in the early stage of industria-lization in the United Kingdom of Great Britain and Northern Island, parts of NorthAmerica, Japan and, more recently, in the export-oriented growth of the East Asianeconomies (Yang and Zhong, 1998). Hong Kong, China, the Republic of Korea and

5
Taiwan Province of China relied heavily on T&C products for their exports from the1950s to the mid-1980s. As these economies scaled up their industrial developmenttoward more capital-intensive and high-tech manufacturing products, South-East Asianand South Asian developing countries and LDCs started to join the race. For example,Bangladeshi clothing exports increased 10-fold over the past 15 years and the countryis now one of the world’s leading exporters of clothing (table 2). In Cambodia, clothingexports took off in the late 1990s (Adhikari and Yamamoto, 2006). The T&C share intotal exports exceeds 70 per cent in these two economies (UNDP RCC, 2005a). As aresult, the T&C exporters’ group has diversified over time, and Asia has become a hubof manufacturing production. This transition period overlaps the time when the latecom-ers introduced their liberalization policies under structural adjustment programmes,acceded to WTO and/or undertook domestic reforms.
1. Trends in the global market
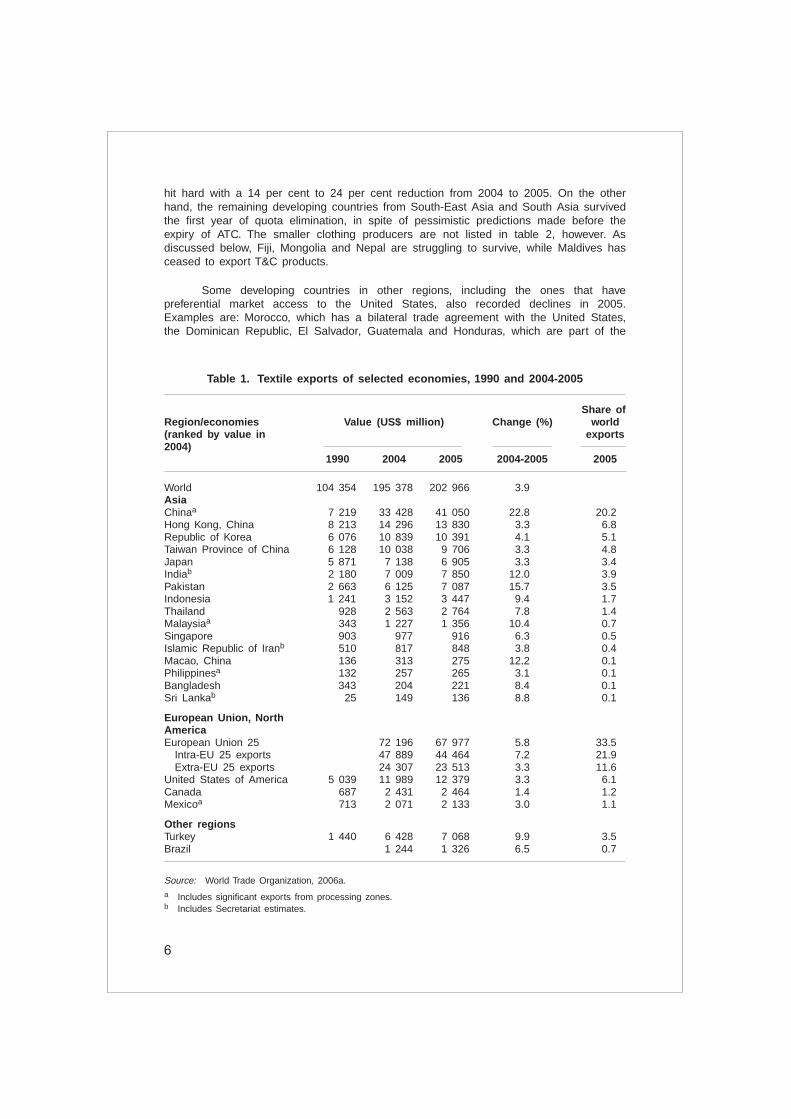
Table 1 shows exports of textiles from selected economies. Global textile exportsreached a historical high of US$ 203 billion in 2005, almost double the 1990 level ofUS$ 104 billion. In broad terms, the immediate effect of the expiry of quotas in thetextile industry was a gain for developing countries, and a loss for developed and semi-developed economies in Asia and the European Union. The growth of Chinese textileexports has been remarkable – increasing by 22.8 per cent from 2004 to 2005 – sothat more than 20 per cent of textiles traded in 2005 originated in China. Otherdeveloping countries in Asia also experienced a significant growth during the first post-ATC year (e.g., exports from Bangladesh, India, Indonesia, Malaysia, Pakistan andThailand grew at between 7 and 15 per cent). On the other hand, textile exports fromthe top producers in East Asia (Hong Kong, China; Japan; Republic of Korea; andTaiwan Province of China) decreased by 3 per cent to 4 per cent from 2004 to 2005.The European Union, the largest textile exporter in the world, also experienced a loss ofexports in both intra- and extra-European Union markets, recording reductions of 7.2 percent and 3.3 per cent, respectively. Textile exports from Asia to Africa, Europe andNorth America increased by 14 per cent to 20 per cent after the expiry of quotas(World Trade Organization, 2006a).1
Products from the top 15 economies account for more than 90 per cent of globaltextile exports while the top 15 economies accounted for 77 per cent to 83 per cent ofglobal clothing exports in 2004-2005 (World Trade Organization, 2006a).2 Table 2 showsthe exports of clothing in selected economies. The clothing export market grew at afaster rate than textiles; the total value of clothing exports reached US$ 276 billion in2005, 150 per cent higher than the US$ 108 billion recorded in 1990.
In 2005, Asia was supplying nearly half of the global T&C market; China’sexports alone accounted for 27 per cent of world trade in clothing. During the first yearof the post-ATC regime, the value of China’s clothing exports went up from US$ 62billion in 2004 to US$ 74 billion in 2005 – a growth rate of almost 20 per cent. Amongthe Asian economies listed in table 2, NICs3 plus Macau, China, on the one hand, were
1 Table IV.70.2 Table IV.74 and table IV.82.3 The composition of 8.7 per cent growth of Hong Kong, China is domestic exports (11.1 per
cent reduction from 2004 to 2005) and re-exports (18.3 per cent growth).
6
Table 1. Textile exports of selected economies, 1990 and 2004-2005
Share ofRegion/economies Value (US$ million) Change (%) world(ranked by value in exports2004)
1990 2004 2005 2004-2005 2005
World 104 354 195 378 202 966 3.9AsiaChinaa 7 219 33 428 41 050 22.8 20.2Hong Kong, China 8 213 14 296 13 830 3.3 6.8Republic of Korea 6 076 10 839 10 391 4.1 5.1Taiwan Province of China 6 128 10 038 9 706 3.3 4.8Japan 5 871 7 138 6 905 3.3 3.4Indiab 2 180 7 009 7 850 12.0 3.9Pakistan 2 663 6 125 7 087 15.7 3.5Indonesia 1 241 3 152 3 447 9.4 1.7Thailand 928 2 563 2 764 7.8 1.4Malaysiaa 343 1 227 1 356 10.4 0.7Singapore 903 977 916 6.3 0.5Islamic Republic of Iranb 510 817 848 3.8 0.4Macao, China 136 313 275 12.2 0.1Philippinesa 132 257 265 3.1 0.1Bangladesh 343 204 221 8.4 0.1Sri Lankab 25 149 136 8.8 0.1
European Union, NorthAmericaEuropean Union 25 72 196 67 977 5.8 33.5
Intra-EU 25 exports 47 889 44 464 7.2 21.9Extra-EU 25 exports 24 307 23 513 3.3 11.6
United States of America 5 039 11 989 12 379 3.3 6.1Canada 687 2 431 2 464 1.4 1.2Mexicoa 713 2 071 2 133 3.0 1.1
Other regionsTurkey 1 440 6 428 7 068 9.9 3.5Brazil 1 244 1 326 6.5 0.7
Source: World Trade Organization, 2006a.a Includes significant exports from processing zones.b Includes Secretariat estimates.
hit hard with a 14 per cent to 24 per cent reduction from 2004 to 2005. On the otherhand, the remaining developing countries from South-East Asia and South Asia survivedthe first year of quota elimination, in spite of pessimistic predictions made before theexpiry of ATC. The smaller clothing producers are not listed in table 2, however. Asdiscussed below, Fiji, Mongolia and Nepal are struggling to survive, while Maldives hasceased to export T&C products.
Some developing countries in other regions, including the ones that havepreferential market access to the United States, also recorded declines in 2005.Examples are: Morocco, which has a bilateral trade agreement with the United States,the Dominican Republic, El Salvador, Guatemala and Honduras, which are part of the

7
Table 2. Clothing exports of selected economies, 1990 and 2004-2005
Share ofRegion/economies Value (US$ million) Change (%) world(ranked by value in exports2004)
1990 2004 2005 2004-2005 2005
World 108 129 259 147 275 639 6.4AsiaChinaa 9 669 61 856 74 163 19.9 26.9Hong Kong, China 15 406 25 097 27 292 8.7 9.9Indiab 2 530 6 632 8 290 25.0 3.0Bangladesh 643 5 686 6 418 12.9 2.3Indonesia 1 646 4 454 5 106 14.6 1.9Viet Namb 4 441 4 805 8.2 1.7Thailand 2 817 3 985 4 085 2.5 1.5Republic of Korea 7 879 3 391 2 581 23.9 0.9Pakistan 1 014 3 026 3 604 19.1 1.3Sri Lankab 638 2 776 2 877 3.6 1.0Malaysiaa 1 315 2 326 2 479 6.6 0.9Philippinesa 1 733 2 157 2 276 5.5 0.8Cambodiab 1 981 2 199 11.0 0.8Singapore 1 588 1 972 1 696 14.0 0.6Macao, China 1 111 1 952 1 654 15.3 0.6Taiwan Province of China 3 987 1 951 1 561 20.0 0.6Myanmar 12 568 331 41.7 0.1Islamic Republic of Iranb 222 273 22.6 0.1
European Union. NorthAmericaEuropean Union 25 76 887 80 354 4.5 29.2
Intra-EU 25 exports 57 759 57 737 0.0 20.9Extra-EU 25 exports 19 128 22 617 18.2 8.2
Mexicoa 587 7 490 7 271 2.9 2.6United States 2 565 5 059 4 998 1.2 1.8
Other regionsTurkey 3 331 11 193 11 818 5.6 4.3Romania 363 4 717 4 627 1.9 1.7Tunisiab 1 126 3 289 3 332 1.3 1.2Moroccoa 722 3 023 2 783 7.9 1.0Hondurasb 64 2 680 2 626 2.0 1.0Dominican Republica,b 782 2 121 1 908 10.0 1.0El Salvadora,b 184 1 815 1 702 6.3 1.0Guatemala 24 1 651 1 506 8.8 0.5Mauritiusa,b 607 939 745 20.7 0.3Peru 120 883 1 057 19.7 0.4Colombia 460 853 904 6.0 0.4Madagascarb 7 552 530 4.0 0.2South Africa 85 258 173 32.7 0.1
Source: World Trade Organization, 2006a.
a Includes significant exports from processing zones.b Includes secretariat estimates.

8
United States-Caribbean Basin Trade Partnership Act (CBPTA); and Madagascar,Mauritius and South Africa, which receive preferential market access to the UnitedStates market under the African Growth and Opportunity Act (AGOA). Exports fromMauritius and South Africa started to decline in 2004 (World Trade Organization, 2006a)and even in the United States market despite the preferential arrangement under AGOA(Morris, 2006). The extent of the declines in exports of clothing from Mauritius andSouth Africa in 2005 were 20.7 per cent and 32.7 per cent, respectably. Exceptionswere Peru and Colombia, which benefited from the preferential arrangement with theUnited States under the Andean Trade Promotion and Drug Eradication Act andexperienced continuous growth over time.
2. Two years after the expiry of quotas
The 2006 data will help demonstrate the impacts of quantitative restrictionsimposed on Chinese exports by the European Union and the United States in thesummer of 2005. This section summarizes the growth of T&C exports from selectedAsian and Pacific countries, based on the import data from two major markets – theEuropean Union and the United States.4,5 For the European Union, data for the firsteight months of 2006 are available; for the United States, data for the first nine monthsof 2006 were available at the time of writing.
The main focus is on 12 selected Asian countries (Asian 12) – Bangladesh,Cambodia, China, India, Indonesia, the Lao People’s Democratic Republic, Nepal,Pakistan, the Philippines, Sri Lanka, Thailand and Viet Nam. These countries can begrouped into four categories: (a) countries with a large production capability in bothtextile and apparel production (China and India); (b) countries that have limitedproduction capability in both textiles and apparel (Indonesia, Pakistan, Thailand and VietNam); (c) middle-income countries that mainly have apparel production capability(Philippines and Sri Lanka); and (d) LDCs (Bangladesh, Cambodia, the Lao People’sDemocratic Republic and Nepal). The cases of Fiji, Maldives and Mongolia, which wereseverely hit by the expiry of ATC, are also discussed.
(a) European Union market
Table 3 shows the market share and growth rates of imports from the Asian 12and other major trading partners in European Union markets from 2004 to 2006. Thisanalysis focuses only on imports from non-European Union member countries, i.e.,extra-European Union trade. The share of extra-European Union trade in total imports ofT&C products had increased to around 50 per cent in 2006 from 46 per cent in 2004.
Asia’s share of European Union T&C imports continued to increase in the post-ATC period. In 2004, about 46 per cent of total European Union imports were from theAsian 12; that share now accounts for more than half of European Union imports of
4 Analysis based on the counties’ export data is ideal; however, the disaggregated export data ofmany countries in the region are not available in a timely manner and the period of coveragebased on the calendar/fiscal year and timing of releasing data differ country by country.
5 Data are complied by the Harmonized Commodity Description and Coding System (HS) at 6-digit and 10-digit levels. Agricultural raw materials such as silk, cotton, wool and vegetablefibres are excluded from HS 50-53. European Union data from HS 54 to HS 63 include tradedata broken down at chapter level only, corrections due to erroneous codes, and confidentialtrade at chapter level.

9
Table 3. Share of the value of European Union imports of textile andclothing products, 2004-2006
(In percentages)
European Union 25 imports
Country Market share Growth rateAnnual Jan.-Aug. Annual Jan.-Aug.
2004 2005 2006 2004-2005 2005-2006
Extra-EU trade ranked by2004 value of imports 100.0 100.0 100.0 6.4 12.4
Asian 12 45.9 51.5 52.8 19.6 13.91 China 21.8 29.0 28.0 41.9 5.53 India 6.6 7.3 8.1 18.3 18.45 Bangladesh 5.8 5.2 6.1 5.0 34.88 Pakistan 3.4 2.8 2.9 13.2 14.9
10 Indonesia 2.6 2.2 2.3 9.6 30.815 Thailand 1.7 1.5 1.5 8.0 16.916 Sri Lanka 1.2 1.2 1.2 1.3 26.018 Viet Nam 1.1 1.1 1.4 6.2 56.922 Cambodia 0.8 0.7 0.6 8.3 22.729 Philippines 0.5 0.3 0.4 33.1 36.246 Lao PDR 0.2 0.2 0.2 0.7 10.853 Nepal 0.1 0.1 0.1 6.1 6.2
Rest of the world 54.1 48.5 47.2 4.7 10.8 2 Turkey 15.5 15.2 14.5 4.1 5.1 4 Romania 6.3 5.6 5.0 5.1 0.6 6 Tunisia 4.2 3.7 3.5 5.5 1.5 7 Morocco 3.8 3.3 3.2 6.9 2.6 9 Hong Kong, China 3.0 2.5 3.7 13.4 221.8
Extra-EU trade/ totalEU trade 46.4 47.9 49.8
Source: Eurostat external trade database (COMTEXT).
T&C products. In contrast, regions that have a trade agreement with the EuropeanUnion have lost their market shares in spite of their preferential market access. Forexample, the market shares of Morocco, Romania, Tunisia and Turkey declined, albeitslightly, in the post-ATC years.
Between 2004 and 2005, European Union imports from the Asian 12 increasedby 19.6 per cent; however, the gains were not distributed evenly in Asia. China was theleading contributor to this rapid growth, with India a distant second. European Unionimports from China increased by US$ 6.1 billion (42 per cent up), from US$ 14.7 billionto US$ 20.8 billion during the first post-ATC year while European Union imports fromIndia increased by US$ 800 million, from US$ 4.4 billion to US$ 5.2 billion, a growthrate of 18.3 per cent. Other Asian 12 countries (except Viet Nam and the Lao People’sDemocratic Republic) as well as the exporters in other regions (except Turkey) had adifficult start to the post-ATC regime, experiencing negative growth despite their benefitsfrom several variants of the generalized system of preferences (GSP) and otherpreferential arrangements.

10
This trend changed noticeably in 2006 after the European Union and Chinacame to an agreement on restricting Chinese T&C exports to the European Union inJune 2005. Until 2008, the annual growth rate of 10 of the 35 categories of Chineseimports liberalized with the expiry of ATC is restricted to between 8 per cent and 12.5per cent (European Commission, 2005). A comparison of the data for the first eightmonths of 2005 and 2006 reveals that European Union imports from China slowed to a5.5 per cent growth rate whereas the rest of the Asian 12 countries (except Nepal)revived their exports to the European Union market at two-digit growth rates. Exportersin other regions (rest of the world in table 3) also resumed their exports to the 2004level by experiencing 10.8 per cent growth for the first eight months of 2006.
(b) United States market
Table 4 shows the market share and growth rates of imports from selected Asianand Pacific countries, including the Asian 12 and other major trading partners, in theUnited States market from 2004 to 2006. The Asian 12 share of United States T&Cimports continued to rise. In 2004, the Asian 12 share of United States T&C imports
Table 4. Share of the value of United States imports of textile and clothingproducts, 2004-2006
(In percentages)
United States imports
Country/area Market share Growth rateAnnual Jan.-Aug. Annual Jan.-Aug.
2004 2005 2006 2004-2005 2005-2006
World 100.0 100.0 100.0 6.8 2.6Asian 12 ranked by 2004value of imports 41.3 49.8 54.8 28.6 11.8China 17.2 24.2 26.4 50.2 7.3India 4.6 5.4 5.8 26.0 11.7Indonesia 3.0 3.3 4.1 18.9 27.2Viet Nam 3.0 2.9 3.5 5.9 24.1Pakistan 2.9 3.1 3.4 13.2 16.2Thailand 2.5 2.4 2.3 1.3 1.5Bangladesh 2.3 2.6 3.1 19.8 24.4Philippines 2.1 2.0 2.2 1.0 11.8Sri Lanka 1.8 1.8 1.8 5.9 1.2Cambodia 1.7 1.9 2.2 19.9 26.8Nepal 0.2 0.1 0.1 25.8 9.2Lao PDR 0.0 0.0 0.0 34.3 303.2
CBI-Mexico 21.6 19.2 17.0 4.9 9.3AGOA 2.1 1.6 1.4 16.5 13.2Rest of the world 35.0 29.4 26.9 10.3 4.6Fiji 0.1 0.0 0.0 77.7 81.5Maldives 0.1 0.0 0.0 94.2 100.0Mongolia 0.3 0.1 0.1 41.2 15.0
Sources: USITC, interactive tariff and Trade Data Web.

11
was 41.3 per cent; data for the first nine months of 2006 show that 54.8 per cent of thetotal United States imports are now from the Asian 12. In contrast, exporting countriesfrom other regions – in fact, the majority of those countries that have preferentialarrangements with the United States – continued to lose their market shares. Forexample, the share of the Caribbean Basin Initiative member nations plus Mexicodeclined from 21.6 per cent in 2004 to 17 per cent in 2006. The share of sub-SaharanAfrican countries (in the category classified as AGOA) also declined from 2.1 per centin 2004 to 1.4 per cent in 2006.
United States imports from the Asian 12, like in the European Union case,showed significant increase during the first year of the post-ATC regime. The growth rateof United States T&C imports from the Asian 12 between 2004 and 2005 was 28.6 percent. China is the leading contributor to this growth with a 50 per cent growth rate from2004 to 2005. In contrast to the trend in the European Union, other Asian 12 countries– except Nepal and Thailand – also showed steady growth even after the expiry ofquotas. When United States imports from China declined to a growth rate of 7.3 percent for the first three quarters of 2006 compared with the same period in 2005, therest of the Asian 12 (except Nepal) either succeeded in exporting more or sustainedtheir positive growth. As a result, United States imports from the Asian 12 continued togrow at 11.8 per cent for the first nine months of 2006, which is much higher than the2.6 per cent growth rate of total United States imports.
The difference in the pattern observed between United States and EuropeanUnion imports is that, in the United States market, exports from other regions did notrevive after quantitative restrictions imposed by the United States on Chinese T&Cimports.6 This was the case for countries that have preferential arrangements with theUnited States. For example, United States imports from the Caribbean Basin Initiativecountries plus Mexico decreased by 4.9 per cent from 2004 to 2005 and by 9.3 percent from 2005 to 2006. In the case of sub-Saharan African countries, the reductionrate of United States imports was 16.5 per cent in 2005 and 13.2 per cent for the firstnine months of 2006.
Smaller exporters from the Asia-Pacific region (e.g., Fiji, Maldives, Mongolia andNepal) were hit hard by the elimination of quotas. In the case of Mongolia and Nepal, itwas observed that some orders came back after the safeguards on Chinese imports.For Fiji and Maldives, United States imports continued to decline in 2006.
3. Human development impact of the expiry of quotas
As discussed above, the ready-made garment (RMG) industry in the countries hithard by the expiry of quotas (Fiji, Maldives, Mongolia and Nepal) was established byforeign investors whose T&C exports were bounded by the quota system. These smallexporters have the disadvantage of being landlocked or small island economies as wellsupply-side problems, as discuss later in this chapter. The expiry of quotas triggered theclosure of factories in those countries as foreign investors shifted production back totheir own countries. As a result, thousands of jobs were lost in these countries.
6 For an example of quantitative restrictions by the United States, see United States TradeRepresentative, 2005.
12
(a) Fiji
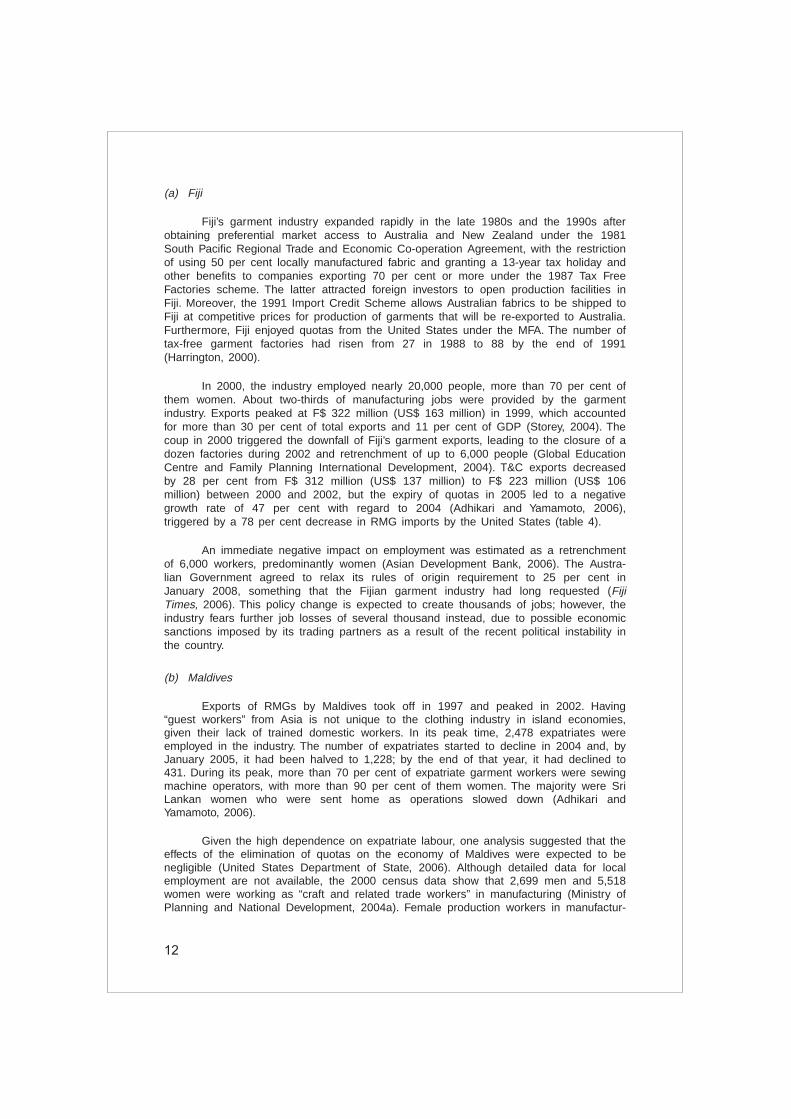
Fiji’s garment industry expanded rapidly in the late 1980s and the 1990s afterobtaining preferential market access to Australia and New Zealand under the 1981South Pacific Regional Trade and Economic Co-operation Agreement, with the restrictionof using 50 per cent locally manufactured fabric and granting a 13-year tax holiday andother benefits to companies exporting 70 per cent or more under the 1987 Tax FreeFactories scheme. The latter attracted foreign investors to open production facilities inFiji. Moreover, the 1991 Import Credit Scheme allows Australian fabrics to be shipped toFiji at competitive prices for production of garments that will be re-exported to Australia.Furthermore, Fiji enjoyed quotas from the United States under the MFA. The number oftax-free garment factories had risen from 27 in 1988 to 88 by the end of 1991(Harrington, 2000).
In 2000, the industry employed nearly 20,000 people, more than 70 per cent ofthem women. About two-thirds of manufacturing jobs were provided by the garmentindustry. Exports peaked at F$ 322 million (US$ 163 million) in 1999, which accountedfor more than 30 per cent of total exports and 11 per cent of GDP (Storey, 2004). Thecoup in 2000 triggered the downfall of Fiji’s garment exports, leading to the closure of adozen factories during 2002 and retrenchment of up to 6,000 people (Global EducationCentre and Family Planning International Development, 2004). T&C exports decreasedby 28 per cent from F$ 312 million (US$ 137 million) to F$ 223 million (US$ 106million) between 2000 and 2002, but the expiry of quotas in 2005 led to a negativegrowth rate of 47 per cent with regard to 2004 (Adhikari and Yamamoto, 2006),triggered by a 78 per cent decrease in RMG imports by the United States (table 4).
An immediate negative impact on employment was estimated as a retrenchmentof 6,000 workers, predominantly women (Asian Development Bank, 2006). The Austra-lian Government agreed to relax its rules of origin requirement to 25 per cent inJanuary 2008, something that the Fijian garment industry had long requested (FijiTimes, 2006). This policy change is expected to create thousands of jobs; however, theindustry fears further job losses of several thousand instead, due to possible economicsanctions imposed by its trading partners as a result of the recent political instability inthe country.
(b) Maldives
Exports of RMGs by Maldives took off in 1997 and peaked in 2002. Having“guest workers” from Asia is not unique to the clothing industry in island economies,given their lack of trained domestic workers. In its peak time, 2,478 expatriates wereemployed in the industry. The number of expatriates started to decline in 2004 and, byJanuary 2005, it had been halved to 1,228; by the end of that year, it had declined to431. During its peak, more than 70 per cent of expatriate garment workers were sewingmachine operators, with more than 90 per cent of them women. The majority were SriLankan women who were sent home as operations slowed down (Adhikari andYamamoto, 2006).
Given the high dependence on expatriate labour, one analysis suggested that theeffects of the elimination of quotas on the economy of Maldives were expected to benegligible (United States Department of State, 2006). Although detailed data for localemployment are not available, the 2000 census data show that 2,699 men and 5,518women were working as “craft and related trade workers” in manufacturing (Ministry ofPlanning and National Development, 2004a). Female production workers in manufactur-

13
ing received the lowest pay among industries (Ministry of Planning and NationalDevelopment, 2004b). Since many garment factories have been located in the outeratolls, where alternative jobs for low-paid garment workers are hard to find, femaleworkers with low skills are likely to face the loss of income and possible long-termunemployment.
Income inequality between Malé and the atolls increased, as did gender inequal-ity in the labour market. Unemployment among women aged 15-24 years rose from 30per cent to 40 per cent during 1997-2004 compared with the male unemployment rateof 10 per cent to 23 per cent, respectively, for the same age group (Ministry of Planningand National Development, 2005). The loss of foreign exchange may be another factorto consider. RMGs accounted for about one-third of total merchandise exports and halfof merchandise exports by the private sector in 2003 (Ministry of Planning and NationalDevelopment, 2004a).
(c) Mongolia
The T&C industry accounted for 11.3 per cent of total 2004 exports in Mongoliaand employed an estimated 20,000, mostly women, as well as illegal migrants (AsianDevelopment Bank, 2006). With the elimination of quotas, United States’ T&C importsfrom Mongolia recorded a 41.2 per cent decline from 2004 to 2005 (table 4). In March2005, the number of workers was 4,526 persons in textiles and 8,880 persons in wearingapparel, dressing and dyeing fur sectors, a 30 per cent decline from 6,401 and 12,725persons, respectively, in March 2004 (National Statistical Office of Mongolia, 2005).
Products that faced severe declines in 2005 were those items for which quotasexpired at the end of 2004 as well as products that other countries were producing.Table 5 shows the top five United States T&C imports from Mongolia, based on theirvalue in 2004. Three of the top five were knitted jerseys and pullovers of cotton,cashmere and man-made fibres, whose export value plunged by 35.1 per cent, 91.6 percent and 54.8 per cent, respectively. Two other products, women’s and girls’ woven
Table 5. Top five trade and clothing products imported by theUnited States from Mongolia, 2004-2005
Top five commodities (HS code) 2004 2005 % change,2004-2005
Knitted cotton jerseys, pullovers, cardigans,waistcoats and similar articles (611020) 53 072 983 34 443 733 35.1
Women’s or girl’s woven cotton trousers(620462) 38 832 389 35 084 568 9.7
Knitted cashmere jerseys, pullovers, cardiganswaistcoats and similar articles (611012) 34 369 618 2 887 544 91.6
Knitted manmade fibres, jerseys, pullovers,cardigans, waistcoats and similar articles(611030) 21 323 058 9 637 070 54.8
Knitted cotton T-shirts, singlets and othervests (610910) 5 860 528 2 580 009 56.0
Sources: USITC, interactive tariff and Trade Data Web.

14
cotton trousers and knitted cotton T-shirts, are also common RMGs produced by manyother countries. These products recorded a negative growth of 9.7 per cent and 56 percent, respectively, during the first post-ATC year. Cotton imported from China andMongolia is used in the most labour-intensive parts of production, such as sewing.
Mongolia, which traditionally produces cashmere and wool clothing products, hasnot been successful in establishing vertical integration for export markets. For example,more than half of the foreign exchange generated from cashmere-related trade consistsof exports of raw cashmere to China. The price of raw cashmere is not stable while theprice of manufactured cashmere products is; therefore, it is more profitable for Mongoliato process the raw cashmere for domestic manufactures and export the final products.However, Mongolia currently lacks a cashmere processing industry; thus, it often importscashmere inputs back from China to produce the final products. Lecraw and others(2005) reported that if all raw cashmere produced in Mongolia were fully processed intofinished knitted and woven products before export, such exports would generate aboutUS$ 206 million, more than the 2005 level of the country’s entire T&C exports, andemployment in the processing industry would more than double.
As for wool, Mongolia currently exports about US$ 6 million worth of uncombedsheep wool, while carpet exports generate only US$ 1 million. Mongolia committed toremove its export duty on raw cashmere by 2007 upon its accession to WTO in 1997;however, the Government of Mongolia has been studying the possibility of extending thisperiod to discourage the exports of raw cashmere (German Technical Cooperation,2006).
With quantitative restrictions on Chinese T&C imports, it was hoped that foreigninvestors would reopen their factories and restart production in Mongolia. The first eightmonths of the country’s 2006 industrial production data show that the total textile outputwas 30.7 per cent higher compared with the previous year in real terms (GermanTechnical Cooperation, 2006). In December 2005, the European Union granted MongoliaGSP-plus status for 2006-2008. However, the United States market accounts for morethan 95 per cent of Mongolia’s T&C exports; therefore, the positive impact from GSP-plus will be limited. Mongolia is currently negotiating a free trade agreement with theUnited States.
(d) Nepal
The T&C industry in Nepal grew rapidly and became a major foreign currencyearner after Indian exporters established an RMG industry in the country in the early1980s. Nepal also expanded its exports of carpets, a product in which the countrytraditionally has a competitive advantage. RMG exports peaked in 2000 and thereafterstarted to decline, partly because of preferential market access granted by the UnitedStates to sub-Saharan African countries under AGOA. Uncertainties and apprehensionsregarding the post-ATC scenario also appear to have contributed to the gradual declinein Nepalese garment exports between 2000 and 2004 (Dahal, 2006). Nepal’s T&Cexports were heavily concentrated in the United States and European Union markets,accounting for 98 per cent of total T&C exports. The United States alone accounted formore than 90 per cent of T&C exports in the early 1990s, but this share has sincebeen declining (Bhatt and others, 2006).
In both the European Union and the United States markets, Nepal’s exports in2005 and 2006 could not recover to their pre-ATC levels (tables 3 and 4). Table 6displays the top five T&C export products to the European Union and United States

15
markets, based on their value in 2004. Wool or fine animal hair carpets and other textilefloor coverings (HS 570110) were the top exports of Nepal in both markets. In theEuropean Union, this commodity accounted for nearly 60 per cent of total NepaleseT&C exports in terms of value. Two other commodities that appear in both EuropeanUnion and United States markets are woven cotton trousers for women or girls (HS620462) and for men or boys (HS 620342). In 2004, they ranked second and fourth inthe European Union market, and second and third in the United States market.
Table 6. Top five Nepalese export products to the European Unionand United States markets, 2004-2005
HS European Union (Euro 1 000) Change (%)
2004 2005
1 570110 46 024 461 41 890 749 9.02 620462 5 586 541 1 386 703 75.23 621420 5 058 894 5 597 784 10.74 620342 2 016 490 1 194 459 40.85 621410 1 796 347 1 457 607 18.9
HS United States (US dollars) Change (%)
2004 2005
1 570110 28 489 601 2 257 750 13.22 620342 21 200 101 12 844 170 39.43 620462 18 489 193 12 214 687 33.94 611020 14 159 360 6 022 073 57.55 610510 4 663 232 1 879 954 59.7
Sources: Eurostat and USITC.
However, both the value of European Union and United States imports of thesecommodities dropped significantly in 2005 – in the European Union, by 75.2 per centand 40.8 per cent, respectively, and in the United States, by 39.4 per cent and 33.9 percent. The two other categories in the top five United States imports from Nepal wereknitted cotton jerseys, pullovers, cardigans, waistcoats and similar articles (HS 611020),and knitted men’s or boy’s cotton shirts (HS 610510). The export value of these twocategories decreased by 57.5 per cent and 59.7 per cent, respectively, in 2005. Similarto the Mongolian case described above, Nepal’s loss of competitiveness in three of thetop five commodities in the United States market are explained by the fact that: (a) theyfaced more competition after the eliminations of quotas; and (b) they are also producedby other countries in the region.
During its peak period, the RMG industry in Nepal employed more than 50,000persons; when production for exports declined, the number of workers also went down.A recent study by Bhatt and others (2006) found that the industry employed less than5,000 persons. Several alarming findings reported in the study regarding Nepali RMGworkers can be summarized as follows:

16
(a) Nearly 25 per cent of employees reported a decrease in their salaries after2005 while about 40 per cent saw no changes in salary and 36.1 per centreceived better salaries;
(b) Only 14.6 per cent of the RMG employees lived above the poverty line withnet earnings of more than NRs 7,500 (US$ 100) per month;
(c) Women on average earned only 60 per cent of a man’s monthly salary, andgender disparity in salary was observed among similar occupations evenafter working hours were taken into account;
(d) Two-thirds of workers who were previously employed in the RMG industryhad become unemployed because of factory closures and about 82 per centof former workers had not found other forms of employment immediatelyafter leaving the industry; and
(e) The loss of garment factory jobs had resulted in declining income for almost20 per cent of the workers while the majority experienced a rise in food andhousing costs.
The job losses among RMG workers indicate further negative impacts on humandevelopment. More than half of RMG workers surveyed sent remittances home; amajority of those remittances were used to buy necessities and support education offamily members. With the loss of income or a reduced salary, their livelihoods are alsolikely to be affected.
(e) Trade gains, but not in terms of human development
Even in countries where export growth has been robust, increased exports donot necessarily translate into more employment, better wages or better working condi-tions. In general, T&C workers receive relatively low wages. In Bangladesh, where thetotal number of workers in RMG sector is 2 million, of which 80 per cent are women,the legal minimum earnings of Tk 930 per month (US$ 16), fixed in 1994, has not beenrevised since, despite a rising trend in inflation (Asian Development Bank, 2006). In thecase of Sri Lanka, a recent report on apparel industry workers estimated that the totalcosts of covering the basic needs of a worker, excluding savings and remittance, wereSL Rs 7,000 and SL Rs 8,800 (US$ 70-US$ 85) for outside-free trade zone (FTZ)workers and FTZ workers, respectively (Prasanna and Gowthaman, 2006). The minimumwage of US$ 36, however, does not meet workers’ basic needs; in fact, 86 per cent ofworkers surveyed receive a basic salary of less than SL Rs 6,000 per month (Prasannaand Gowthaman, 2006).
In Cambodia, despite a rise in RMG exports, workers’ earnings decreased by 8.5per cent in 2005, compared with 2004 (Cambodia Development Resource Institute,2006, cited in Chan and Sok, 2006). A recent study by Chan and Sok (2006) also foundthat 30 per cent of workers surveyed perceived that their real wage had decreased inthe post-ATC years, opposed to 19 per cent who perceived that their salaries wereincreasing. The study also found that about 60 per cent perceived that their healthcondition had worsened compared with the number in 2004 (i.e., prior to the quotaexpiry). The study argued that longer working hours to meet an increase in orders inthe post-ATC environment and less expenditure on food, in order to save money forother purposes such as remittances and savings, might have affected workers’ healthconditions. Employment had become increasingly casual over time, with increasingprevalence of short-term contracts and piece-rate work. As discussed later in this

17
chapter, Cambodia has adopted the industry-wide compliance monitoring system. How-ever, the latest report shows that less than a quarter of those factories monitoredcomply with the overtime within the legal limit (International Labour Organization, 2006).
In the case of Bangladesh, Ahmed and others (2005) found that althoughovertime for RMG workers had decreased in the post-ATC environment because ofbuyer pressure to meet the legal limit of 60 hours a week, this had affected workers’well-being negatively because of reduced income and loss of nutritional supplementsprovided as snacks for overtime workers. The factories were meeting the increasedorders by subcontracting some parts of the orders. In short, even in the countries thatperformed well in the post-ATC period, there were a number of factors that needed tobe improved from a human development perspective.
B. Challenges facing developing countries
Getting a foothold in the T&C sector may not be a difficult task, but sustainingand achieving growth may be a real challenge for a number of developing countries. Itis not advisable to lump all the countries together because a country with all thenecessary prerequisites to become a leading exporter of T&C products (e.g., China)faces challenges that lie more on the demand side, or market access barriers, than onthe supply side. However, a small landlocked LDC such as Nepal faces challenges onboth the demand as well as the supply side. Therefore, only selected and the mostcommon challenges are highlighted in this section, and examples from countries facingeach specific challenge have been included where available.
1. Protectionist forces
Given the existence of powerful vested interests in the T&C industry, particularlyin developed countries, the protectionist forces are not likely to wane but rather to befurther accentuated in the future. However, the form of protection may change over time.In the past, there was double protection to the T&C industry – through quotas and hightariffs. In the case of China, very little would appear to have changed even after thephasing out of quotas.
Powerful and vocal protectionist lobbies have not only found ways to protect theirindustries in connivance with their governments, but have also managed to couch thesearguments in an altruistic fashion in order to remain “politically correct”. Domestic joblosses are the largest single argument made by these interests, followed by helpingweaker countries move up the industrial ladder so as to enable them to grow out ofpoverty through preferential arrangements. Therefore, when it comes to the T&Cindustry, the normal economic rationale of the need to prevent distortion in the economycaused by trade protection becomes hollow. Moreover, the advice to follow a transparentmeans of protection such as tariffs, should the protection be inevitable, is also not fullyheeded. This is followed by several other near-arbitrary measures such as the impositionof trade remedy measures and discriminatory measures in preferential trading agree-ments. The various forms of protection in the developed countries, some of which aretruly ingenious, are discussed below:
(a) Tariff barriers
On average, the tariffs imposed on T&C products are four times higher than theaverage industrial tariffs imposed by the developed countries. The average post-Uruguay

18
Round tariffs on T&C products in three major industrial countries are 14.6 per cent inthe United States, 9.1 per cent in the European Union and 7.6 per cent in Japan, whiletheir average industrial tariffs are 3.5 per cent, 3.6 per cent and 1.7 per cent,respectively (Hayashi, 2005).
Disaggregated data reveal remarkably high tariffs imposed on some products. Inthe post-Uruguay Round era, the majority of T&C tariff lines face tariff peaks: 52 percent of T&C imports in the United States have tariff rates of 15.7 per cent to 35 percent; 54 per cent of European Union imports have duties of 10.1 per cent to 15.0 percent; and 55 per cent of Japanese imports have duties of 5.1 per cent to 10 per cent(Hayashi, 2005). The high tariff on T&C products has become an even more importanttrade policy tool in the hands of the developed countries and is not likely to come downsignificantly even if the stalled negotiations on non-agricultural market access arerevived at WTO.7
One of the ways to get around this barrier is to provide preferential marketaccess – through either a GSP or an FTA – to a selected group of countries ostensiblywith the objective of helping them in their developmental objectives. Undoubtedly, suchpreferences have helped some countries. However, evidence shows that their impactshave been, at best, mixed as far as the export performance of the preference-receivingcountries is concerned. For example, Bangladesh has been able to use the duty-free,quota-free market access treatment to the European Union provided under the “Every-thing but Arms” (EBA) initiative to the benefit of its knitted apparel exports, with thepreference “take-up” rate of 80 per cent. However, the country has not been able toregister significant growth in the export of woven items,8 the reason for which isdiscussed below.
Similarly, Jordan, a country largely unknown regarding its prowess in textiles andclothing, emerged as a significant player in this industry only after its 2001 free tradeagreement with the United States. It has maintained its growth momentum for the pastfive years. Jordan’s clothing exports to the United States increased from a mere US$ 43million in 2000 to US$ 1.1 billion in 2005 (Ahmad, 2005). During the first six months of2006, Jordan posted an increase of 18.3 per cent in the United States market(International Textiles and Clothing Bureau, 2006). In contrast, the value of Jordanianexports to the European Union, where it does not enjoy duty-free market access, wasonly US$ 8.8 million in 2005 (Ahmad, 2005).
A number of other countries that enjoy preferential market access to the UnitedStates or European Union markets did not necessarily fare well in the post-quota era.Examples include: Lesotho, Malawi, Namibia and Swaziland in southern Africa, whichare beneficiaries of AGOA; Costa Rica, the Dominican Republic, Jamaica, El Salvador
7 Although the major demanders of the NAMA negotiations are the developed countries, the majorinterest of developing countries lies in the possibility of being able to reduce tariff peaks onproducts of their export interests to the developed countries such as textiles, apparel andfootwear. However, due to a call made by several powerful textile lobbies to have a “sectoral”negotiation on T&C tariffs, with the average tariff capped to 15 per cent (which in itself is a veryhigh figure), the chances of a substantial reduction in tariffs on these products are very slim.Moreover, on 13 June 2006, 44 members of Congress sent United States Trade RepresentativeAmbassador Susan Schwab a letter demanding that textiles be negotiated separately in theDoha Round of trade talks. See National Council of Textiles Organizations, 2006.
8 See Razzaque and Raihan, 2006.

19
and Honduras, which are the beneficiaries of CBPTA; and Mexico, which is a beneficiaryof the North American Free Trade Agreement (NAFTA). Similarly, a number of countriesthat enjoy preferential market access to the European Union, e.g., Morocco, Romaniaand Tunisia, did not achieve a significant export growth in the post-quota era, asdiscussed above.
There are three major problems associated with countries having preferentialtrading arrangements. First, since they have had assured market access opportunitiesduring the MFA and ATC periods, they never felt the competitive pressure and did nothave any incentive to improve their performance. Complacency led to their lacklustreperformance in the post-quota era.
Second, due to strict rules of origin requirements, they have to rely on importedmaterials from relatively high-cost sources such as the United States and the EuropeanUnion, which makes them uncompetitive. The “yarn forward” requirement included inmost FTAs, which makes it mandatory for the preference-receiving countries to useUnited States yarn and fabrics as a condition for assembled textile or clothing productsto enter duty-free, is a testimony to this factor.9 While this scheme provides a captivemarket for United States textile exporters, it also prevents the preference-receivingcountries from using textiles from other competitive sources such as China, which areseen as a threat to the survival of United States textile firms.10
The captive market hypothesis is corroborated by export data from the UnitedStates and the European Union. United States exports of yarns and fabric to NAFTA,Central American and Caribbean Basin countries, which are the beneficiaries of duty-free access to the United States, increased from less than 40 per cent in 1989 to 77per cent in 2004. Since the European Union also promotes a captive market strategy,37 per cent of its textiles exports were destined to Eastern European, African andMediterranean countries (Romania, Tunisia, Morocco, Bulgaria and Turkey) in 2004.11
Third, again due to rules of origin requirements included in GSP preferences,most developing countries and LDCs that lack textile and other raw material producingcapacities are handicapped because they cannot meet the minimum rules of originthreshold.12 Among the existing rules of origin requirements imposed for preferentialtrading arrangement, the one being implemented by the European Union is consideredthe most restrictive because it requires at least two finishing operations – a processknown as “double transformation” – to occur in the exporting country to qualify forpreferential market access. Therefore, despite the EBA initiative, LDCs that are not ableto meet the requirement continue to have a low level of preference utilization. Forexample, the utilization rates for clothing preferences of the Asian LDCs under EBA in2004 were 33.8 per cent for Bangladesh and 65.8 per cent for Nepal (World TradeOrganization, 2005). This partly explains the reason behind Bangladesh’s ability toachieve impressive export growth in knitted garments, in which domestic value addition
9 See UNDP RCC, 2005b.10 See National Council of Textiles Organizations and American Manufacturing Trade Action
Coalition, 2005.11 See Ahmad, 2005.12 For a detailed discussion on rules of origin, see Adhikari and Yamamoto, 2005 and Adhikari,
2005.
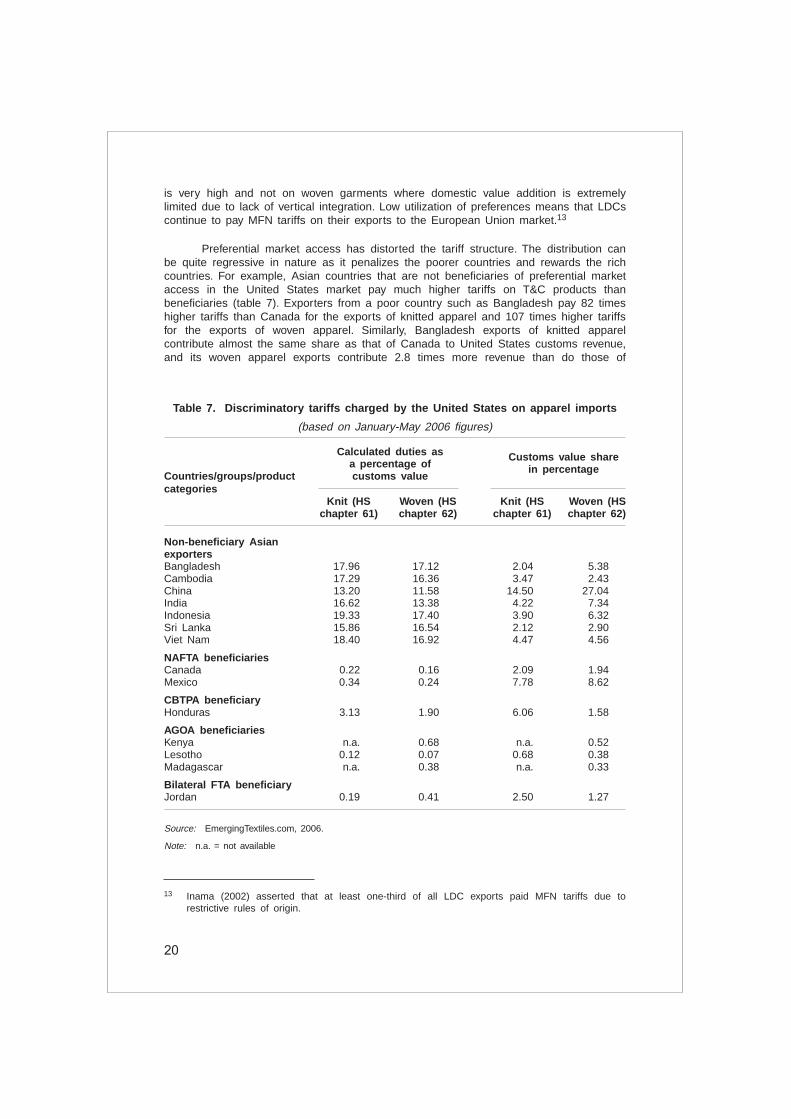
20
is very high and not on woven garments where domestic value addition is extremelylimited due to lack of vertical integration. Low utilization of preferences means that LDCscontinue to pay MFN tariffs on their exports to the European Union market.13
Preferential market access has distorted the tariff structure. The distribution canbe quite regressive in nature as it penalizes the poorer countries and rewards the richcountries. For example, Asian countries that are not beneficiaries of preferential marketaccess in the United States market pay much higher tariffs on T&C products thanbeneficiaries (table 7). Exporters from a poor country such as Bangladesh pay 82 timeshigher tariffs than Canada for the exports of knitted apparel and 107 times higher tariffsfor the exports of woven apparel. Similarly, Bangladesh exports of knitted apparelcontribute almost the same share as that of Canada to United States customs revenue,and its woven apparel exports contribute 2.8 times more revenue than do those of
13 Inama (2002) asserted that at least one-third of all LDC exports paid MFN tariffs due torestrictive rules of origin.
Table 7. Discriminatory tariffs charged by the United States on apparel imports
(based on January-May 2006 figures)
Calculated duties as Customs value sharea percentage of in percentage
Countries/groups/product customs valuecategories
Knit (HS Woven (HS Knit (HS Woven (HSchapter 61) chapter 62) chapter 61) chapter 62)
Non-beneficiary AsianexportersBangladesh 17.96 17.12 2.04 5.38Cambodia 17.29 16.36 3.47 2.43China 13.20 11.58 14.50 27.04India 16.62 13.38 4.22 7.34Indonesia 19.33 17.40 3.90 6.32Sri Lanka 15.86 16.54 2.12 2.90Viet Nam 18.40 16.92 4.47 4.56
NAFTA beneficiariesCanada 0.22 0.16 2.09 1.94Mexico 0.34 0.24 7.78 8.62
CBTPA beneficiaryHonduras 3.13 1.90 6.06 1.58
AGOA beneficiariesKenya n.a. 0.68 n.a. 0.52Lesotho 0.12 0.07 0.68 0.38Madagascar n.a. 0.38 n.a. 0.33
Bilateral FTA beneficiaryJordan 0.19 0.41 2.50 1.27
Source: EmergingTextiles.com, 2006.
Note: n.a. = not available

21
Canada. Another comparison between two LDCs from two different regions, Cambodiaand Lesotho, is quite striking. Cambodia pays 144 times higher tariffs to access theUnited States market for its knitted apparel than Lesotho does, and it pays 233 timeshigher tariffs for exports of its woven apparel.
It is interesting to note that such discriminatory practices do not fall foul of themultilateral rules-based and non-discriminatory systems espoused by WTO. Effortsaimed at remedying these problems have yet to bear fruit. For example, despite the factthat there were extensive discussions in the run-up to the Hong Kong Ministerialconference to provide duty-free and quota-free market access to all LDCs, the decisionnow limits the duty-free access to only 97 per cent of the products under the tariff linesof the importing countries. Given the strong protectionist undercurrent in the T&Cindustry in developed countries, many T&C products in which LDCs are competitive maynot be included in the “covered list” (Adhikari, 2006a).
(b) Non-tariff barriers
Of the several non-tariff barriers, only two – trade remedy measures andregulatory/standard-related barriers – are discussed in this subsection. While the firstone is a traditional barrier that is still being actively used by both developed anddeveloping countries, the second one is an emerging barrier that reduces the competi-tiveness of the T&C exporters of developing countries. A common element in thesebarriers is that they can be, and have been abused for protectionist purposes.
(i) Trade remedy measures
Introduced in the global trading system as measures to protect domestic industryfrom unfair foreign competition, trade remedies or contingent protection measures havebecome tools in the hands of the domestic protectionist interest in the developed anddeveloping countries. Three types of WTO-sanctioned trade remedy measures, of whichthe anti-dumping measure is the most pernicious, can be imposed by the importingcountries without having to wait for a verdict from a WTO dispute settlement body.
As documented by Adhikari and Weeratunge (2006), such measures have haddire consequences for the industry revenue as well as employment situation in countriessuch as India and Pakistan. T&C imports from relatively competitive countries such asChina, India, Pakistan and Turkey have been routinely subjected to anti-dumpinginvestigations in the past.14 Bed linen has been one of the most targeted products bythe European Union, and most of the time such an action is initiated at the behest of asingle industry group – in this case, Euro Cotton.
Based on a survey of anti-dumping actions initiated between 1994 and 2001, itwas found that one major WTO member initiated 53 investigations into allegations ofdumping, placing the T&C industry in the third position only after iron and steel, andchemicals.15 In several instances, investigations into the same products were revivedback-to-back, extending over a long period (World Trade Organization, 2003). Comment-ing on the unfair nature of anti-dumping investigations, Oxfam International (2004)
14 See Adhikari and Weeratunge, forthcoming, for a detailed discussion.15 See World Trade Organization, 2003.
22
asserted, “[T]hey take a long time to resolve, impose heavy costs of arbitration, and canbe prolonged by small changes to the case”. Anti-dumping measures, unlike other traderemedy measures, can be applied to targeted firms in specific countries, with almostabsolute impunity (Adhikari and Yamamoto, 2005).
The post-quota period has seen the burgeoning of other trade remedy measuresalongside anti-dumping ones. Temporary safeguard on Chinese imports is a case inpoint. Although this measure is part of the WTO accession package that China signedonto, this reflects the ingenuity of the protectionist interests. Taking advantage of thisprovision, a number of countries/groupings, both developed and developing, haveimposed various safeguards measures against China. Although the temporary safe-guards will expire on 31 December 2008, two other provisions incorporated in China’sProtocol of Accession pose a significant burden to China. They are: (a) until 2013, it ispossible for WTO members to impose “selective” safeguards against any Chineseexports that cause “market disruption”; and (b) until 2016, it is possible to use the “non-market economy” criterion against China to calculate a “dumping margin” in the processof an anti-dumping investigation. This margin inflates the dumping margin, subjecting theChinese imports to a higher anti-dumping duty.16
(ii) Regulatory barriers
Government regulations or industry standards for goods can have an impact ontrade in at least three ways: (a) they can facilitate exchange by clearly defining productcharacteristics and improving compatibility and usability; (b) they also advance domesticsocial goals such as public health by establishing minimum standards or prescribingsafety requirements; and (c) they can hide protectionist policies.17 Tariffs cannot blockmarket entry unless they are prohibitive. However, regulatory and standard-relatedbarriers could effectively foreclose the market for the exporters if they are stringent andcomplex, making compliance de facto very costly if not impossible. These are oftenknown as “frictional” barriers in that they raise the cost to the exporters, but do notprovide any revenue to the governments imposing such requirements.
Since governments are ingenious in devising various ways to inhibit imports toprotect domestic producers in sensitive industries where domestic pressure for protec-tion persists, the list of possible regulatory barriers could be infinite. The risk is that thetraditional barriers such as tariffs, quotas and VERs may be replaced by a new form ofregulatory barrier.18 Baldwin (2000) succinctly described the political economy ofregulatory and technical barriers:
16 This is particularly striking, because on average the anti-dumping duties on dumped importsfrom non-market economies tend to be more than 12 times higher than normal anti-dumpingduties. Messerlin (2004) revealed that in the anti-dumping investigations initiated by the UnitedStates (between 1995 and 1998), which resulted in a positive determination, the averagedumping margin with price comparison as the basis for estimated normal value of exportswas only was 3.2 per cent; however, following the non-market economies principle as thebasis for arriving at estimated normal value of exports resulted in dumping margin of 40 percent on an average.
17 See Sanitary and Phytosanitary Measures and Technical Barriers to Trade (Summary), Centrefor International Development at Harvard University, www.cid.harvard.edu/cidtrade/issues/spstbt.html (accessed 14 December 2004).
18 See Maskus and Wilson, 2000.

23
“Most [regulatory barriers] are highly technical, and a large fraction coversintermediate inputs – products unknown to most voters. Owing to theirtechnical complexity and political invisibility, product norms are oftenwritten, directly or indirectly, by domestic firms to which they apply. Quitenaturally, these firms write the norms in a way that favours their varietiesor at least disfavours foreign varieties.”
Imposition of regulatory and standards-related barriers on T&C products hasbeen limited, but the future looks uncertain. A particularly elaborate and complex trade-restrictive barrier is posed by a new system called “Registration, Evaluation andAuthorisation of Chemicals” (REACH)) proposed by the European Union. If adopted, theREACH legislation could subject textiles and clothing firms to a procedure of registra-tion, evaluation, authorization and restriction for a large number of chemical substances.The European Union trading partners, including developed countries, are making effortsto convince the European Union to modify the rules before a formal announcement inorder to reduce the potentially disruptive impact of REACH on international trade, and toimprove its workability (United States Mission to the European Union, 2006).
The governmental barriers mentioned above would at least provide some ele-ment of predictability despite their protectionist undercurrent. Private standards, differingfrom firm to firm, can also pose costly barriers. Due to pressures from consumergroups, the environmental lobby and trade unions, some of the major buyers indeveloped countries have private “codes of conduct”, which they expect all suppliers tofollow. These codes mainly correspond to environmental and labour standards, whichcan significantly raise suppliers’ costs (Adhikari and Weerantunge, forthcoming), espe-cially where multiple codes with different monitoring and reporting requirements areinvolved.
It is desirable from a human development perspective to make a gradual butsustained effort aimed at reaching higher environmental and labour standards, since anabrupt switch to higher standards could erode the competitiveness of enterprises indeveloping countries. The necessity of ensuring compliance with multiple standards canfurther aggravate the problem. Due to the immense market power of the buyers, whocan dictate their terms, T&C exporters are left with only two choices. Either they have tocustom-tailor the working environment in the factory to fulfil different conditions imposedby their buyers, or they have to follow the most stringent buyer standards. Both theseresponses can affect the competitiveness of these enterprises.
2. Supply side constraints
Even if market access barriers are removed, most developing countries still faceseveral supply-side constraints, which impede their competitiveness. The five mostcommon constraints, some of which cut across the entire manufacturing sector, arediscussed below.
(a) Poor human capital
The lack of skilled and/or trained human resources, which impedes productivitygrowth, is a major reason for the inability of most developing countries to take fulladvantage of trade liberalization, and for others the incapability of facing a threat to theirsurvival. While the wages paid to T&C workers in several Asian countries are muchlower than those paid in China, they are not as competitive as Chinese workers due to

24
poorer skills (notably among non-production workers) and other factors that have animpact on productivity. According to the United States International Trade Commission(2004), the average hourly compensation for Chinese garment workers in 2002 wasUS$ 0.68, whereas the figures for Bangladesh, India, Indonesia, Pakistan and Sri Lankawere US$ 0.39, US$ 0.38, US$ 0.27, US$ 0.41 and US$ 0.48, respectively. However,the report pointed out that the productivity levels of T&C workers in these Asiancountries were significantly lower than that of their Chinese counterparts.
Due to the lack of technical skills, some countries are hiring expatriate staff. Asurvey conducted by the United States Agency for International Development (2005)found that 40 per cent of indirect personnel positions in the factories that responded inCambodia were staffed by expatriates. Because using expatriate staff in technical andsupervisory positions raises costs, this can have a significant impact on industrycompetitiveness (Adhikari and Yamamoto, 2006; Chan and Sok, 2006).
The problem of skill deficit can be improved by investments in increasing thegeneral level of education (as has been done in several East Asian countries) and byproviding training opportunities. Again, China offers an example for other developingcountries; even a decade ago, a Chinese firm, on average, provided about 70 hours oftraining per year to its workers and managers compared with only 10 hours in India(Chandra, 1998, cited in Tewari, 2006).
Investments in training can help firms achieve considerable productivity improve-ments. For example, after realizing the virtue of training, garment firms in Lesotho havenow started to invest in staff training. Some training programmes have had spectacularresults (Bennet, 2006). A training programme implemented by the Lesotho NationalDevelopment Corporation/ComMark has helped many apparel factories achieve sustain-able increases in production line output, sometimes in excess of 25 per cent.19
(b) Poor quality of infrastructure
The poor quality of infrastructure, whether dilapidated roads or ports, antiquatedtelecommunications networks or power supplies, adds to the cost of doing business.Most developing countries face these problems, but the degree may differ from countryto country. Infrastructure is a major constraint in some South-East Asian countries suchas the Philippines and Indonesia, and the situation in African and South Asian countriesis arguably worse.
The costs of inefficiency in two Asian countries, Bangladesh and India, are welldocumented. According to OECD (2004), Indian companies suffer a 37 per cent costdisadvantage in shipping containers of clothing products from Mumbai/Chennai to theeast coast of the United States, relative to similar container shipments originating inShanghai. This cost disadvantage arises from delays and inefficiencies in Indian ports.Similarly, according to the Asian Development Bank (2006), a technical assistance studyin 2003 found that clothing producers in Bangladesh were likely to earn 30 per centmore if inefficiencies were removed at Chittagong port. Of the six major exporters fromsub-Saharan Africa, South Africa and Mauritius are the only two countries with relativelygood facilities in place; other countries such as Kenya, Lesotho, Madagascar andSwaziland are known for their relative weaknesses in infrastructure provisioning.
19 See ComMark Trust, 2006.

25
(c) Limited trade facilitation measures20
Trade facilitation is defined as the simplification and harmonization of interna-tional trade procedures. These procedures encompass the activities, practices andformalities involved in collecting, presenting, communicating and processing data re-quired for the movement of goods in international trade. Procedural hurdles can becorrected with adjustments in customs rules and formalities as well as investment incomputerization to speed up the process. However, efforts in that direction have beenextremely limited, particularly in South Asia and sub-Saharan Africa where total timetaken for import reaches 46.5 and 60.5 days, respectively, against the best performingcountry’s (Denmark) average of five days (table 8).
South Asian countries are marginally better than sub-Saharan African countriesin terms of trading across borders, although there are intercountry variations withinregions. Hummels (2001) estimated that each day saved in shipping time was worth 0.8per cent ad valorem duty for manufactured goods. While the time taken for export orimport is influenced by several factors, including the quality of transportation and otherinfrastructure as discussed above, the lead-time can be reduced by doing away with thenumber of documents and signatures required for import and export, e.g., via automatedcustoms and certification processing. This will provide a significant payoff not only forthe T&C industry but also for the trading sector as a whole.
Table 8. Trading across borders
Document Signatures Time Documents Signatures TimeRegion/ for for for for for foreconomy exports exports exports imports imports imports
(number) (number) (days) (number) (number) (days)
East Asia and Pacific 7.1 7.2 25.8 10.3 9.0 28.6Europe and Central
Asia 7.7 10.9 31.6 11.7 15.0 43.0Latin America and
Caribbean 7.5 8.0 30.3 10.6 11.0 37.0Middle East and North
Africa 7.3 14.5 33.6 10.6 21.3 41.9OECD 5.3 3.2 12.6 6.9 3.3 14.0
Denmark 3.0 2.0 5.0 3.0 1.0 5.0
South Asia 8.1 12.1 33.7 12.8 24.0 46.5Bangladesh 7.0 15.0 35.0 16.0 38.0 57.0India 10.0 22.0 36.0 15.0 27.0 43.0Pakistan 8.0 10.0 33.0 12.0 15.0 39.0
Sub-Saharan Africa 8.5 18.9 48.6 12.8 29.9 60.5
Kenya 8.0 15.0 45.0 13.0 20.0 62.0Madagascar 7.0 15.0 50.0 9.0 18.0 59.0Malawi 9.0 12.0 41.0 6.0 20.0 61.0Zambia 16.0 25.0 60.0 19.0 28.0 62.0
Sources: World Bank and IFC, 2006.
20 See also chapter VII in this volume.

26
In the post-quota era, improved trade facilitation is even more critical for thesurvival of the T&C industry in those two regions, not least because it is one industrythat involves both imports of inputs as well as exports of finished products. Given themove towards vertical specialization and the slicing up of the value chain, each daysaved could provide enormous benefits in terms of enhancing the industry’s competitive-ness. This is important, as some RMG products are time-sensitive and delayedconsignments could lead to the cancellation of orders (Adhikari and Weeratunge,forthcoming).
(d) High costs of inputs
Except for countries with vertically integrated production structures, most devel-oping countries have to rely on imported fabrics and accessories in the process ofproduction. The absence of a vertically integrated production structure may not be amajor disadvantage provided the inputs can be obtained in a short time at internationalprices. However, due to the problems mentioned above in the section on infrastructureand trade facilitation, it is not possible for most South Asian and sub-Saharan Africancountries to access inputs on short order.
The high cost of inputs can be reduced by lowering tariffs on inputs across theboard. However, this may not be a desirable option given the reliance of developingcountries on customs for raising government revenue (Adhikari and Yamamoto, 2006).Therefore, many countries allow the import of inputs to be used for export processing atreduced or even zero duty rates. In order to ensure that the inputs are actually used formanufacturing exportable items, several governments have made use of bonded ware-house facilities.
This system can, however, be burdened with bureaucratic problems, as theexample of Nepal shows. Exporters who have not exported for a year have facedadministrative difficulties in benefiting from this facility. Even for regular exporters,refunds are not delivered in time, taking more than 30 days to process from the date ofthe claim. Moreover, it has become extremely difficult to get the bank guaranteereleased, particularly after the introduction of the value added tax -related regulation.21
(e) Limited access to finance
Access to credit, especially for small and medium-sized enterprises, includingT&C ventures, is a major problem in many Asian and African countries that hinders theprospect of unleashing entrepreneurial potential. Due to the time and difficulties involvedin recovering loans in the event of default, and generally the high level of non-performing assets, financial institutions exercise extra caution while lending. Accordingly,they do not consider small enterprises and/or those enterprises with limited ability toprovide collateral security as creditworthy. Consequently, these enterprises have tofinance the majority of their operations through internal resources or rely on informalsources of funding, which tend to be extremely costly (Adhikari and Yamamoto, 2006).
For example, as stated in a study conducted by International Business andTechnical Consultants, Inc. (2003) for the Ministry of Commerce of Bangladesh, a largenumber of knitwear garment exporters with a capital of Tk 10 million to Tk 20 million(US$ 170,000-US$ 340,000), and a workforce of between 150 and 300, were forced to
21 See Dahal, 2006, for further details.

27
borrow from local moneylenders at a monthly interest rate close to 11 per cent.Exporters are compelled to take such loans when they fail to obtain timely bankfinancing (Adhikari and Yamamoto, 2006).
In the case of Nepal, the story is slightly different. While small entrepreneurs’access to credit as well as other banking facilities is severely restricted by discrimina-tory interest rates and the need for collateral, exporters are facing new problems afterthe phasing out of quotas. Nepalese commercial banks are increasingly becomingreluctant to make new investments in this sector and are initiating stricter action againstdebtors (Shakya, 2005).
C. Emerging issues
Apart from the conventional issues discussed above, trade in T&C products isgoing to be influenced by several others emerging issues, some of which are discussedbelow.
1. Changing buyers’ behaviour
Textiles and clothing, and particularly clothing, is a classic example of a buyer-driven commodity chain that is characterized by decentralized, globally dispersedproduction networks, coordinated by lead firms who control design, marketing, andbranding at the retail level. Many of the most powerful branded retailers such as Gap,Nike, Wal-Mart and Liz Claiborne own no factories and do not necessarily “make” inorder to sell. Yet, by controlling design, input sourcing, branding and distribution, thesepowerful retailers capture the largest share of value added in apparel and textilesproduction (Gereffi, 1999).
The economic power of large retailers, predominantly in developed countries, hasincreased substantially over the past few years (World Trade Organization, 2005). In theUnited States, for example, the 29 biggest retailers account for 98 per cent of sales(UNDP RCC, 2005a). The trend now is toward greater product specialization and brand-name, and market segmentation. These large retailers collect market information aboutthe latest trends in styles and tastes, and their integration of this information combinedwith the volume of their business gives them considerable leverage in dealing withsuppliers (Kelegama and Weeraratne, 2005).
Because of the sheer market power, it is the buyers’ preference that is going toshape market response in the exporting countries. Although price and quality used to bethe two dominant variables, buyer preferences these days represent the interplay ofvarious factors, of which the following five are critically important.22
(a) Price and cost factors
The price of final delivery of goods into the warehouse is still a factor thatinfluences the sourcing decision of the majority of buyers.23 While several Asiancountries including Bangladesh, Pakistan, Indonesia and Viet Nam appear to have
22 See also Kelegama and Weeraratne, 2005.23 For example, Wal-Mart is well known for its “notorious practice of squeezing its supplies’
margin.” See Tewari, 2006 (p. 16).

28
followed a low-cost strategy, the sustainability of this approach has been challenged onthe basis that the focus on low costs makes them always vulnerable to competition fromthe next lower cost supplier (Tewari, 2006).
(b) Critical mass
Buyers will be reluctant to place orders with producers who have a small sharein the world market. According to this view, countries with large production capacitiesand the ability to deliver huge quantities are likely to be preferred by buyers, as thiskeeps down the input costs of those suppliers, the transaction costs of dealing withmultiple suppliers and the trading costs of shipping from those countries. This view issupported by the United States Department of Commerce, which estimates the numberof countries from which major items would be sourced by United States buyers will dropto 25 per cent of current levels by 2010 (UNDP RCC, 2005a).
(c) Risk spreading
A possible scenario opposing the critical mass sentiment is the risk-spreadingargument. Buyers, desirous of maintaining uninterrupted supply, would like to diversifythe sources from which they import T&C products. For example, according to theUnited States International Trade Commission (2004): “To reduce the risk of sourcingfrom only one country, the United States importers also plan to expand trade relation-ships with other low-cost countries alternative to China”.
For example, stores such as Wal-Mart and Dillards make spatial distinctionsamong the location of the suppliers from whom they source certain categories ofapparel (Tewari, 2006). Indeed, because they were anticipating the re-imposition ofquotas on China, several buyers continued to source products from countries such asBangladesh and Cambodia during the first few months of phasing out of quotas, andthis contributed to the continued success of those countries.
(d) Total solution providers
Buyers’ preferences are likely to be tilted in favour of suppliers who can cover allstages of the value chain in production, ranging from product design to input sourcing,manufacturing, packaging and shipping of the final product (Adhikari and Yamamoto,2005). Several East Asian manufacturers have now moved up from assembly of cutfabric into more complex operations that entail coordination, supply of machinery andfinance, and management of subcontractors. They are now full-package suppliers forinternational buyers, and are operating as transnational intermediaries receiving ordersfrom large retailers and subcontracting to their network of producers, which are locatedin Asia, Latin America and Africa (Hayashi, 2005). This issue is further discussed belowunder the subheading “value chain management”.
(e) Ethical concerns
As discussed above, pressure from consumer groups in industrialized countries,including the boycotting of products manufactured in sweatshops or in an environmen-tally-unfriendly manner, has brought ethical concerns into the decision-making matrix ofthe buyers. Most buyers have themselves developed a “code of conduct” with which theywant all their suppliers to comply. This includes issues such as working conditions,workers’ health and safety, minimum wages, maximum working hours and overtime.
29
2. Graduation and loss of competitiveness
The history of the T&C industry suggests that as economies developed andworkers’ incomes increased, countries gradually moved up the technology ladder, andeither started producing value-added T&C products or moved to other manufacturessuch as electronics and consumer durables. Even within the T&C sector, with textilesbeing more capital and often knowledge-intensive compared to clothing, countriescontinue producing textiles even after reaching a certain threshold in the developmentladder. Mayer (2005) argued that the shift of labour-intensive activities in textiles andclothing away from the first-tier NICs towards other Asian countries had clearly reflectedindustrial upgrading associated with wage increases as well as a move in productionand export patterns towards more technology-intensive goods.
Of late, China’s changing comparative advantage has been a topic of generaldiscussion as well as empirical studies. Based on a Heckscher-Ohlin-type trade modelthat concentrates on relative endowments of labour, land and human capital, Mayer andWood (2001) showed that China’s comparative advantage was not in low-skill, labour-intensive production, such as clothing, but in manufacturing sectors with a higher skillcontent. Compared to other countries including China, important clothing exporters fromSouth Asia such as Bangladesh, India and Pakistan have an unusual combination of lowlevels of both skill per worker and land per worker. This gives those countries a strongcomparative advantage in labour-intensive manufactures, which use little of either skill orland per unit of labour (Mayer, 2005).
Similarly, according to the International Labour Organization (2005a), China is inthe process of outgrowing its comparative advantage for the most labour-intensivemanufacturing industries. It is evolving towards higher value-added industries. During thisprocess, China is developing not only as a manufacturing hub, but also as an importantconsumer market that is likely to absorb a larger share of its own production as well astotal world imports. Rising income in China is likely to be associated with rising wagesfor low-skilled workers, so that the share of skill-intensive items in China’s manufacturedexports is likely to rise. It is interesting to note, in this context, that wages in China’sexport industries are indeed rising and that this may jeopardize the internationalcompetitiveness of Chinese exporters of labour-intensive manufactures, especially ifproductivity fails to keep pace (Harney, 2004, cited in Mayer, 2005).
3. Lean retailing
As yet another reflection of their market power, buyers are unwilling to maintainhigh levels of stock in their warehouses or stores. Moreover, taking advantage of thelatest technology, they would like to respond promptly to consumer demand in line withrapidly changing fashions. With this trend toward “lean retailing”, producers that canprovide quick turnaround time enjoy an important competitive advantage. Most studiesargue that proximity to large markets (e.g., Mexico, Central America and the Caribbeancountries to the markets of the United States and Turkey, and Central and EasternEuropean countries to the European Union) is a key factor in ensuring a quickturnaround (World Trade Organization, 2005).
The importance of “timeliness” and fast delivery in lean retailing practices hassignificantly affected supplier location over and above consideration of price (Nordas,2004; and Berger, 2006, cited in Tewari, 2006). Emphasizing promptness in delivery asa key factor in order to remain competitive in the post-quota era, Abernathy and Weil(2004) argued that the proximity advantage would become even greater as retailersraised the bar higher on the responsiveness and flexibility required of their suppliers.

30
However, it is necessary to see if this is the case even at a disaggregated level.For example, with high-fashion products such as women’s clothing, which do not requirereplenishment after one season, the issue of proximity may not matter. On the otherhand, for replenishment products such as men’s jeans, it would appear that producersclosely located to the world’s major markets are at an advantage (Abernathy, Volpe andWeil, 2004). For example, replenishable products make up a greater share of UnitedStates apparel imports from Mexico than they do from Asian locations, despite the costadvantage associated with the sourcing from the latter. In 2003, United States buyerssourced over US$ 4 billion-worth of replenishable products from Mexico and theCaribbean Basin (amounting to 22 per cent of all apparel sourced from these countries)compared with US$ 1.3 billion of those products from China and other Asian countries(Abernathy, Volpe and Weil, 2004).
However, declining shares of Mexico, Caribbean and other South Americancountries in United States imports and declining shares of Eastern European, Mediterra-nean and North African countries in European Union imports of T&C products showthat, on the whole, proximity has a limited role in shaping and influencing buyers’decisions. It may continue to be important in a limited range of products, but its overallsignificance is gradually declining due to decreasing communications costs and shippingtransit time, and improved efficiency of trade-related services.
4. Value chain networks
Large retail chains such as Wal-Mart and “branded marketers” such as Nike andReebok have been outsourcing their production to low-wage countries but have retainedcontrol, as noted above, over the major portion of the value chain. By keeping controlover the design and marketing functions, they also maintain close control over theglobal T&C value chain through standard-setting, often sourcing raw materials them-selves, distributing them globally and then importing the made-up garments.24 However,it is difficult for these large-scale buyers to coordinate all these activities by themselves.As Abernathy, Volpe and Weil (2004) argued:
“Making sourcing decisions in the global apparel market is a dauntingtask. Due to factors including language and custom barriers, communica-tions hurdles, and the sheer number of producers scattered across theworld, United States retailers have had to change the way they approachthe world market. Some large retailers have established their own buyingoffices overseas to administer the outsourcing of their private labelproducts. Others work with large and sophisticated independent sourcingagents to handle this intricate task.”
Buyers’ inclination toward the second option mentioned has led to the emergenceof intermediaries, which are essentially “subcontracted” by large buyers to performcritical tasks in the value chain. Drawing on tacit knowledge gained from years ofimmersion in the garment industry, their ability to master the process of fulfilling largeorders to the exact specification of their buyers and to exacting delivery schedules aswell as their specific knowledge about production management, many companies fromEast Asia (mainly Hong Kong, China, as well as the Republic of Korea and TaiwanProvince of China) have been acting as intermediaries for global buyers since the 1980s
24 See Morris, 2006.

31
and 1990s (Tewari, 2006). Their capacity to mobilize and coordinate full-packagemanufacturing in global T&C value chains led to what Gereffi (1999) termed “triangularproduction networks”. This implies production is done in one country (usually lessdeveloped), organized and coordinated by firms in another country (usually middle-income), and sold to a buyer in yet another country (usually developed).25 Companiessuch as Li & Fung Ltd. are emerging as successful intermediaries of such triangularnetworks (see box).
Organizational skills in the changing landscape of T&C trade
A Hong Kong, China, based company, Li & Fung Ltd.,26 founded in China in1906, has evolved from an exporting agent of porcelain and silk from China to aprofessional manager of the entire supply chain – from product design and develop-ment, through raw material and factory sourcing, production planning and manage-ment, quality assurance and export documentation, to shipping consolidation. Thecompany gained expertise in buying and selling quotas from Asian markets forshipment into the United States in the 1970s and 1980s as an important element ofits garment exporting business.
As a buying agent and broker in quotas, it established backward links withmore than 2,000 Asian suppliers and forward links to manufacturers and retailers. Inthe late 1980s and 1990s, the company took advantage of its network of Asiansuppliers and its growing familiarity with logistics management to offer United Statesretailers an efficient means of sourcing products in Asian nations. Currently, theGroup has more than 70 offices in more than 40 countries and employs 8,000 staffglobally who operate a global network of more than 10,000 suppliers. It has achieveda turnover of US$ 7 billion and aims to maintain the growth rate of 18 per centachieved in 2005 to be able to achieve a turnover of US$ 10 billion by 2010.
Perhaps indicative of the next step of evolution, the company has entered intoa licensing agreement with Levi Strauss & Co. Under this agreement, the companywill design, manufacture and market men’s tops for United States market undervarious Levi’s® labels including Levi Strauss SignatureTM branded jeans that are soldto United States mass marketers (Abernathy, Volpe and Weil, 2004).
25 See Morris, 2006.26 Figures are updated based on the company’s website at www.lifung.com/eng/global/home.php
(accessed on 14 December 2006).
5. Adjusting to the post-quota world
The temporary safeguards imposed on China have changed the entire dynamics ofthe T&C trade, with several countries either holding on to their past gains or achievingremarkable export growth. However, many analysts believe that this situation is short-lived(Razzaque and Raihan, 2006; Bhatt and others, 2006; Sisouphanthong and others, 2006;and Chan and Sok, 2006). From this point of view, the real competition in the world T&Cmarket will begin only after 2008 with the phasing out of these temporary quotas.
32
Safeguard measures on Chinese imports can be seen as yet another breathingspace for a number of countries that are expected to lose out in the post-2008 period.Efforts have already been made in several countries, even before the phasing out ofATC, either as a “preparedness strategy” or as a “survival strategy”. While some supportmeasures have been taken only by governments, others were undertaken throughpublic-private partnership or with the private sector reacting to incentives provided bythe governments.
(a) Efforts made so far
(i) Government support for the T&C industry
Governments all over the world are known for providing targeted support topriority sectors, including protection from outside competition, in order for them to grow,prosper and face global competition. A recent study by Adhikari (2006b) on themagnitude and type of government support provided in seven Asian countries(Bangladesh, China, India, Indonesia, Pakistan, Sri Lanka and Viet Nam) suggests theemergence of the following pattern.
First, support is a function of the ability as well as the willingness of govern-ments to provide assistance. Therefore, better resourced countries such as Chinaappear to have provided more assistance compared to, say, Indonesia. Government ofChina has heavily supported the modernization of its factories27 and provided “taxforgiveness” to the state-owned enterprises (SOEs),28 in addition to creating textilecities and providing export credit insurance to the T&C enterprises. Governments thatpursue active industrial policies tend to provide higher levels of support, which can alsobe seen from the examples of China and India vis-à-vis Indonesia or Sri Lanka.
Second, since maintaining and improving competitiveness is the key to survivalin the post-quota world, investment in technological upgrading or modernization of theT&C sector has been the most widely utilized form of support in all the countriesreviewed. While some countries have reduced tariffs on imports of machinery andequipment, others have provided preferential credit or cash support to help their firmsmodernize themselves. Apart from China, as mentioned above, examples includeBangladesh, India, Indonesia, Pakistan and Viet Nam.
Third, a reduction in the prices of infrastructure, such as rebates/reductions inutility charges, was found to be the least used (or least reported) form of governmentsupport. Even in the case of Bangladesh, where this facility is provided to export-oriented enterprises, the scheme appears to have only been introduced into its industrialpolicy of 2005.
Fourth, income tax exemption for the exporting sectors, an extensively used formof government support in the past, is not the norm anymore, with some governmentsnot providing such a facility and some recently discontinuing it. For example, income tax
27 During 1997 and 2000, more than US$ 30 billion of state-of-the-art textile machinery wasimported by China. See Ministry of Commerce, 2005, cited in World Trade Organization,2006b.
28 Grants or tax forgiveness totalled Y 3.1 billion in 1997 and 1998. See World TradeOrganization, 2001.
33
exemption is not provided by Indonesia while India has recently discontinued it. Otherscharge income tax at reduced rates for export oriented enterprises.
Fifth, the operation of special economic zones (SEZs) or export processingzones (EPZs), which are not only targeted at the T&C industry, is common in all theseven countries reviewed. A separate discussion on this special measure is includedbelow. Moreover, refunds of, and reductions in excise duty, sales tax and VAT for theinputs – goods and/or services – used in export processing, which is provided in all thecountries reviewed, is another general support measure not confined to the T&C sector.Similarly, duty reduction on the imports of inputs also figures as one prominent meansof supporting export-oriented industries in the majority of the countries reviewed.
Sixth, although all the countries studied have achieved export growth in the post-quota period, no systematic study has been conducted to establish any casual linkbetween the magnitude of government support and its contribution to export growth.Moreover, much of the support appears to have resulted from a “demonstration effect”,with countries trying to replicate a successful model without conducting a proper cost-benefit analysis. Government support to the industry has important fiscal implications,and its sustainability can be questioned.
Seventh, most governments appear to have provided such support in a WTO-compliant manner. This has been made easier by the fact that LDCs and developingcountries with less than US$ 1,000 per capita gross national product are exempted fromrules on subsidies under the Agreement on Subsidies and Countervailing Measures.Moreover, general subsidies, i.e., the subsidies given for production across the board tothe entire industrial sector, based on some generally applied criteria can be provided,as can subsidies for research and development and/or environmental conservation (Das,2006). The fact that these subsidies have not been challenged so far is also a testimonyto the fact that they do not fall foul of WTO provisions.
(ii) Export processing zones
One of the major supply-side constraints faced by most least developed and low-income countries is the lack of ability to enhance competitiveness, resulting from poorinfrastructure, inability to obtain inputs at international prices with the shortest possiblelead-time, inability to meet the deadline for orders because of frequent interruptions inoperation from labour unrest or political disturbances, and other regulatory barriers.Because these barriers severely constrain the ability of the private sector to earn anattractive return on investment, the private sector, in turn, is reluctant to invest insectors such as light manufacturing of T&C and electronic products despite their exportpotential. Foreign investors are even more hesitant (Adhikari and Yamamoto, 2006).Therefore, in order to attract investments29 in these sectors, many governments indeveloping countries have established various EPZs and SEZs. Within these zones,governments provide incentives to enterprises that mimic – and go beyond – the freetrade scenario. For example:
29 In several countries, foreign investors are the main beneficiary of the positive environmentcreated by export processing zones, whereas governments could provide incentives to localinvestors in order to benefit equally from the favourable setting. See World Trade Organization,2005.

34
·
Enterprises within EPZs can obtain inputs such as equipment and rawmaterials duty-free; a certain level of regulatory relief is assured;30
·
Foreign exchange controls are not applied;
·
Profit repatriation is guaranteed;
·
Strikes and other labour actions are prohibited; and
·
In some cases, freedom of trade unions is also restricted.
Moreover, trade services and infrastructure facilities available within an EPZ arehigher than national average standards. However, certain conditions are also imposedon EPZ enterprises including, among others, either not being allowed, or severelyrestricted from making domestic sales.
The primary goals of EPZs are to create conducive business environments andto enhance earnings by promoting non-traditional exports, direct investment, technologytransfer and knowledge spillover. The greatest EPZ contribution appears to be jobcreation and income generation. EPZs can also contribute to building human capitalthrough their demonstration and catalyst effects on the country entrepreneur pool(Madani, 1999).
Although EPZs have attracted considerable attention in the empirical literature,studies focusing on the efficiency of the T&C sector within an EPZ are rare. Accordingto one analysis conducted by WTO (2005), which focused exclusively on LDCs, EPZs insome cases not only offered beneficial business to domestic and foreign firms, but alsoboosted economic development by helping countries enhance their competitiveness.However, the report cautioned: “In the majority of cases, success of the EPZ waslimited and contributed only to a minor extent to an improvement of LDC competitive-ness in the T&C sector” (Madani, 1999).
One reason for this could be the very limited backward or forward linkagesbetween the EPZ and the local economy. Because of the incentive structure, togetherwith the quality and reliability of inputs demanded by EPZ-based exporting firms, mostprefer not to purchase inputs from local industries. This acts as a barrier to creating areliable backward linkage. Moreover, because firms located in the EPZ are preventedfrom making domestic sales, their forward linkage with the local economy is severelyconstrained (Adhikari and Yamamoto, 2006).
Another important consideration is whether the incremental net value of theexpected benefits justifies the huge investment to be made, at least initially, by thepublic sector31 as well as the costs to be incurred in the form of foregone revenue.Research by Jayanthakumaran (2003) on the performance of EPZs, using a benefit-costanalytical framework, found that zones in China, Indonesia, Malaysia, the Republic ofKorea and Sri Lanka were economically efficient and generated returns well above
30 For example, in Sri Lanka, the Board of Investment (BOI) encourages investors to locate theirfactories in BOI-managed industrial processing zones to avoid land allocation problems. SeeUnited States Trade Representative, 2004.
31 The assumption is that the private sector also will be made to participate in the exportprocessing zone by contributing both financial and managerial inputs.

35
estimated opportunity costs. On the other hand, the heavy infrastructure costs involvedin setting up the zone in the Philippines resulted in a negative net present value.
In some countries, EPZs can become controversial mainly because of the tug ofwar between the Ministry of Finance, which is concerned with revenue foregone, andthe Ministry of Industry, which wants to create industries as well as employmentopportunities. For example, two ministries in India are currently at loggerheads over aproposed plan to upscale the creation of SEZs. According to an estimate prepared bythe Finance Ministry, the country would have to forego about US$ 22 billion, on accountof the SEZ-granted tax rebates, by 2009/10. According to the estimate by the Com-merce and Industry Ministry, one million new direct jobs will be created on account ofSEZs in the next five years, with corresponding impacts on incomes and potential taxrevenue as well as spillovers in the economy, including the creation of indirectemployment.32
(iii) Case studies
Building on an earlier study (Adhikari and Yamamoto, 2005), this subsectiondiscusses case studies of three Asian countries that have achieved success inmaintaining or even increasing their exports in the face of phasing-out of quotas. Thesecase studies (Cambodia, Sri Lanka and Thailand) were initially prepared when theimpact of safeguards imposed on China had yet to be felt. However, even after theimposition of safeguards on China, the contributions of these strategies have notdiminished.
·
Cambodia – improved labour standards
Cambodia’s access to the United States market from 1999 to 2004 wascontingent on its record of compliance with labour standards, with quota rates increasedevery year based on successful compliance. In order to satisfy this requirement,Cambodia adopted a corporate social responsibility programme in collaboration with theInternational Labour Organization (ILO), known as Better Factories Cambodia (formerlythe ILO Garment Sector Project).
Started in 2001 to help Cambodia’s garment sector achieve and maintainimprovements in working conditions, the project (a) monitors and reports on workingconditions in Cambodian garment factories measured against national and internationalstandards, (b) helps factories to improve their productivity, and (c) works with theGovernment and international buyers to ensure a rigorous and transparent cycle ofimprovement. The main objective of the programme is to help Cambodian garmentfactories constantly improve the conditions of labour by strictly adhering to nationallabour legislation as well as international Conventions that Cambodia has signed as amember of ILO. The programme aims at setting minimum standards as agreed by thedecision of a tripartite body (Government, private sector and trade union), monitoringcompliance and providing advisory support and capacity-building training to stakeholdersto support compliance (International Labour Organization, 2005a and 2005b).
According to a buyers’ survey conducted by the Foreign Investment AdvisoryServices (2004) of the World Bank Group, more than 60 per cent of buyers interviewed
32 See Mehta, 2006, for further details.
36
said compliance with labour standards was of equal or more importance compared toconsiderations of price, quality and lead times. The survey also found that Cambodia’slabour standards were seen as higher than other Asian countries (Bangladesh, China,Thailand and Viet Nam). It also revealed that 60 per cent of the buyers planned toincrease their garment purchases from Cambodia, while none said they would cut back.
Cambodia’s ability to achieve an overall export value of US$ 2.2 billion in 2005,an increase of 11.7 per cent over the 2004 figure,33 lends credence to the findings ofthe study. Based on the import figures of the European Union and the United States forthe first eight and nine months of 2006, respectively, Cambodia has done extremely wellin both markets. While improved labour standards could have partly contributed to this,safeguards against China’s exports may have played a greater role in this regard.Although Cambodia’s bilateral agreement with the United States has expired andsecuring increased quotas is no longer an incentive for Cambodia, the programme oflabour standards is to be continued by the Government of Cambodia in all likelihood(Chan and Sok, 2006).
However, there are four clear problems associated with this programme. First, asexpressed by the Garment Manufacturers Association of Cambodia, compliance withlabour standards has led to increased costs for exporting enterprises, thereby erodingtheir competitiveness. Second, greater freedom of association has led to an increase instrikes and other disruptive activities that are detrimental to the interests of the industry(Chan and Sok, 2006). Third, despite the success of this model in the garment industry,it has not been replicated in other industries in the country and certainly not in otherLDCs having similar socio-economic conditions and export profiles. Fourth, this schemecovers only the formal sector, not the informal sector (Adhikari and Yamamoto, 2005).
·
Sri Lanka: Focus on a niche product
The growth of the Sri Lankan garment industry, like that of many otherdeveloping countries, can be mainly ascribed to the existence of the quota system.Several studies predicted that Sri Lanka would be one of the losers in the post-quotaregime. This almost came true in 2005, when Sri Lanka’s export to the European Unionmarket declined by 1.3 per cent in value terms. Fortunately, due to a 5.9 per centgrowth in the United States market, Sri Lanka still managed to post a positive growth of3 per cent in United States dollar terms at the end of 2005 (Adhikari and Yamamoto,2005). Since the Sri Lankan T&C sector is not considered highly competitive due toseveral factors – higher wages, low productivity of workers, high cost of utilities and alack of backward linkages – private entrepreneurs realized that they should focus onniche products in order to create an opportunity for themselves.
Taking advantage of the relatively high level of education of its workers,34
coupled with their aptitude for learning quickly, Sri Lanka started focusing on a distinctsegment of apparel, i.e., women’s undergarments. Another distinct advantage of Sri
33 See Chan and Sok, 2006.34 The literacy as well as education level of Sri Lanka is considered “one of the best” in South
Asia. In 2004, the literary rate (ages 15 and above) was 90.7 per cent, compared to 61 percent in India, 48.6 per cent in Nepal and 49.9 per cent in Pakistan. The only South Asiancountry to have a higher literacy rate comparable with Sri Lanka is Maldives (96.3 per cent).See UNDP, 2006.
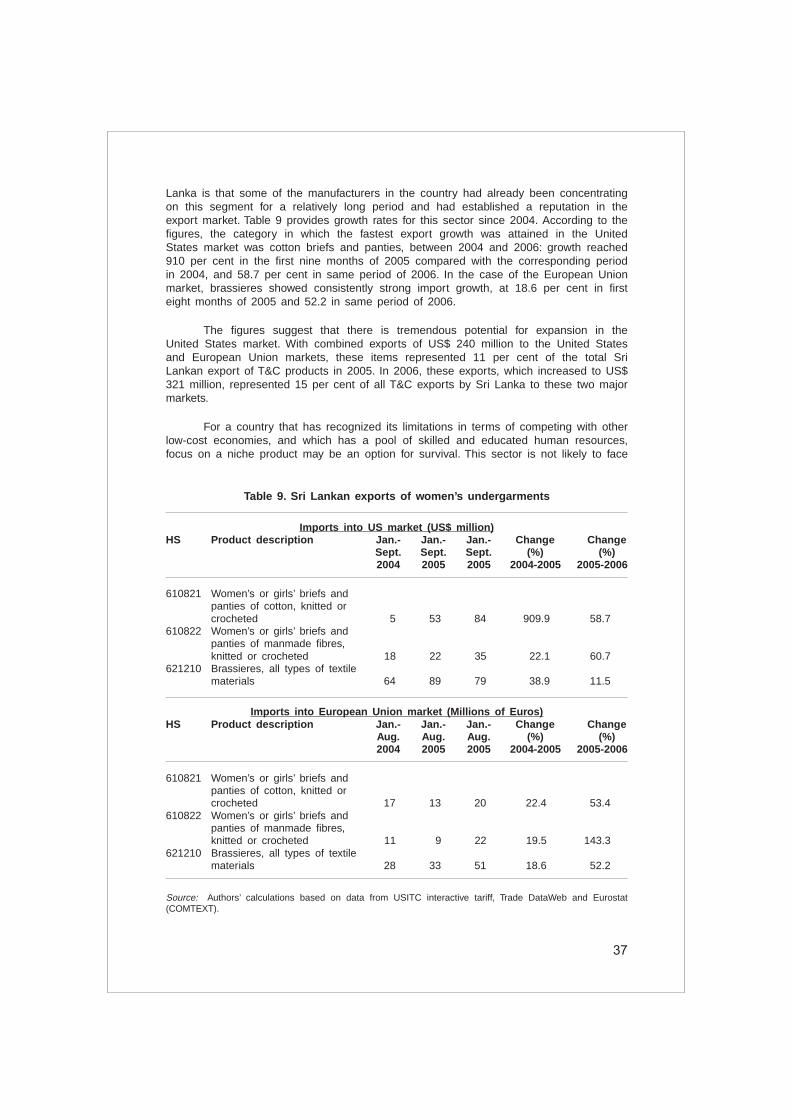
37
Lanka is that some of the manufacturers in the country had already been concentratingon this segment for a relatively long period and had established a reputation in theexport market. Table 9 provides growth rates for this sector since 2004. According to thefigures, the category in which the fastest export growth was attained in the UnitedStates market was cotton briefs and panties, between 2004 and 2006: growth reached910 per cent in the first nine months of 2005 compared with the corresponding periodin 2004, and 58.7 per cent in same period of 2006. In the case of the European Unionmarket, brassieres showed consistently strong import growth, at 18.6 per cent in firsteight months of 2005 and 52.2 in same period of 2006.
The figures suggest that there is tremendous potential for expansion in theUnited States market. With combined exports of US$ 240 million to the United Statesand European Union markets, these items represented 11 per cent of the total SriLankan export of T&C products in 2005. In 2006, these exports, which increased to US$321 million, represented 15 per cent of all T&C exports by Sri Lanka to these two majormarkets.
For a country that has recognized its limitations in terms of competing with otherlow-cost economies, and which has a pool of skilled and educated human resources,focus on a niche product may be an option for survival. This sector is not likely to face
Table 9. Sri Lankan exports of women’s undergarments
Imports into US market (US$ million)HS Product description Jan.- Jan.- Jan.- Change Change
Sept. Sept. Sept. (%) (%)2004 2005 2005 2004-2005 2005-2006
610821 Women’s or girls’ briefs andpanties of cotton, knitted orcrocheted 5 53 84 909.9 58.7
610822 Women’s or girls’ briefs andpanties of manmade fibres,knitted or crocheted 18 22 35 22.1 60.7
621210 Brassieres, all types of textilematerials 64 89 79 38.9 11.5
Imports into European Union market (Millions of Euros)HS Product description Jan.- Jan.- Jan.- Change Change
Aug. Aug. Aug. (%) (%)2004 2005 2005 2004-2005 2005-2006
610821 Women’s or girls’ briefs andpanties of cotton, knitted orcrocheted 17 13 20 22.4 53.4
610822 Women’s or girls’ briefs andpanties of manmade fibres,knitted or crocheted 11 9 22 19.5 143.3
621210 Brassieres, all types of textilematerials 28 33 51 18.6 52.2
Source: Authors’ calculations based on data from USITC interactive tariff, Trade DataWeb and Eurostat(COMTEXT).

38
increased competitive pressure in the immediate future because other developingcountries with limited skills may not be able to replicate this model easily, mainlybecause of the lack of educated and skilled human resources.
The Sri Lankan private sector’s continuous search for niche products was alsodemonstrated by the recent success of a single firm in carving a global niche bypenetrating an even more lucrative market – body armour, flak jackets and bullet-proofvests for troops in Saudi Arabia as well as for the United Nations (Daily Mirror, 2006).Therefore, it is not surprising that Sri Lanka has the second lowest export concentrationof T&C products in South Asia, second only to India (Adhikari, 2006c).
·
Thailand: Focus on regional trade
While Thailand has been able to increase its exports of garment products to theUnited States, its exports to the European Union market declined in 2005. This may bedue in part to competition from players that are more efficient, such as China and Indiaafter the quotas were eliminated. However, Thailand, as a member of the ASEAN FreeTrade Agreement, was able to export to its immediate neighbours to make up for thelosses it incurred in other large markets. It has become a major supplier of fabrics to allother ASEAN countries, as seen by the profile of its fabric exports. Except forSingapore and Brunei Darussalam, which do not have strong T&C sectors, all othermember countries of ASEAN have increased their imports from Thailand.
The European Union’s policy of allowing for ASEAN cumulation to achieve rulesof origin requirements under EBA appears also to have indirectly helped Thailand. Sinceits immediate LDC neighbours such as Cambodia and the Lao People’s DemocraticRepublic do not have well-developed textile and other accessories manufacturing, theEuropean Union’s requirement for using fabrics from ASEAN to qualify for rules of originrequirements provides a captive market for Thai textiles. Likewise, export diversificationin the case of garments is quite impressive, and there are lessons to be learnt for otherAsian developing countries.35
It might be possible for other ASEAN developing countries such as Indonesiaand Viet Nam to follow the same trajectory, while LDCs such as Cambodia and the LaoPeople’s Democratic Republic probably will have to wait for several years to make thishappen. Due to a relatively liberal and problem-free preferential trade regime withinASEAN, increasing intraregional trade to make up for losses in multilateral tradeappears feasible. However, it might not be possible in the South Asian region not onlybecause intraregional trade in the area is very low but also because most membercountries have included a majority of T&C products under the “sensitive list” negotiatedunder the Agreement on South Asian Free Trade Area (SAFTA).36
(b) Efforts required
Developing countries have designed and implemented a variety of survivalstrategies to keep themselves afloat in the post-quota era. While some of them havepaid off as well as provided a sustained advantage to the T&C industry, others may not
35 See Adhikari and Yamamoto, 2005, for a detailed account of Thailand’s success story.36 See Adhikari and Weeratunge, 2006, for a detailed account of regional cooperation on T&C
trade in South Asia.

39
be sustainable. For example, Sri Lanka’s continuous search for identifying niche prod-ucts and product diversification, and the Thai model of South-South trade look moresustainable than the Cambodian strategy, which can be replicated by other countries.Since the competition in this industry is bound to be intense post-2008, there is nosubstitute for enhanced competitiveness. However, achieving cost competitiveness aloneis not enough. It might be possible to replicate one of the above models by fine-tuningthem to suit the national conditions. Developing countries should consider a broaderrange of policy responses to be able to survive in a fiercely competitive post-2008market.
(i) Market access
Improved market access is necessary for overcoming trade barriers. It is in theinterest of most developed countries to promote a rules-based, multilateral tradingsystem rather than promoting a “spaghetti bowl” of frequently overlapping rules of origin.However, in the context of Asian LDCs that have been deprived of market accessopportunities in the United States market, a campaign for unconditional duty-free marketaccess with flexible rules of origin, taking account of the stage of industrialization ofsuch LDCs, should continue. Other non-tariff barriers should also be addressed as apart of the Doha Round of negotiations, when revived.
(ii) Human capital
Increased productivity is a major tool for improving competitiveness at theenterprise level. However, in order to enhance the productivity of the country as awhole, investments in health and nutrition are as important as investments in educationand skills development. A combination of public-private partnerships and mobilization ofdonor support could be an effective way to create better human capital critical forsurvival in the post-quota world.
(iii) Value chain management
Given the increased importance of full-package service delivery, timeliness andconsistency in delivery, quality assurance and adaptability, developing country suppliersshould try to learn these techniques. Constant improvement and upgrading of tradefacilitation measures is a must for achieving these objectives. Such efforts will not onlyhelp to improve competitiveness of the T&C sector, but will also provide economy-widebenefits.
(iv) Sustainability of government support
In order to reduce the burden on budgetary resources, due both to supportprovided and revenue foregone, governments could usefully explore several approachesto sector support. First, the potential of public-private partnerships between governmentand consortia of exporters should be utilized to the extent possible in developing thissector. Cost sharing should be encouraged in every support programme. Second, it maybe possible to charge nominal user fees for various services provided by governmentsto the industry, with a gradual increase of the fees over time. Third, governments shouldtry to obtain technical assistance from various multilateral and bilateral donors tosupport some of these initiatives. Subject to the outcomes of cost-benefit analysis, thistype of support can be a perfect candidate for utilizing the benefits of “Aid for Trade” –a proposal currently being discussed at WTO.
40
(v) Access to credit
Reforms aimed at infusing more competition, including encouraging FDI and jointventures, can help unlock the potential of the financial sector. This can be achievedthrough enactment/implementation of competition laws in developing countries. Anotheroption is to empower the regulatory institutions to play a more active role in promotingcompetition in the financial sector. Moreover, legal reform to improve the loan recoverysystem could go a long way towards building the confidence of the banking system andproviding it with incentives to treat small and medium-sized enterprises more or less atpar with other borrowers. If it is not possible to implement either, or both of theinstruments mentioned above, a government may have to resort to directed lending.However, this should be conditional on performance requirements and should have acredible “sunset” clause to prevent the same from being captured by vested interests.
(vi) South-South cooperation
While the starting point for South-South cooperation is trade, it should go muchbeyond that. Areas of South-South cooperation for the development of the T&C sectormay include the flow of investment not only in the rather “footloose” RMG sector, butalso in helping to create vertically integrated facilities by making investments in textilesor accessories industries and the south-south transfer of technology. Countries such asChina and India could take the lead in these initiatives. Another possible area ofcooperation could be to encourage training institutions in relatively better-off developingcountries to partner with such institutions in countries with limited capacities.
E. Conclusion
The post-quota world has not brought about a dramatic transformation in theT&C market or in sourcing patterns. Among the losers of the post-quota era, not all areon the same footing. While some have graduated into the production of higher-valueproducts, others have lost out because of their lack of competitiveness and their inabilityto adapt. The current status quo is the result of the re-imposition of quotas on China asa part of the temporary safeguard measures agreed by the country at the time of itsaccession to WTO. Countries that did not manage to withstand competition in the firstsix months after the phasing out of quotas need to be extremely cautious and makeevery possible effort to enhance their competitiveness before the expiry of this tempo-rary measure in 2008.
Given the history of protection in this industry and rather strong politicaleconomy factors, market access remains the largest single problem for the developingcountries. However, this can be resolved mainly through international and regionalcooperation. There are several supply-side issues that are impeding the growth pros-pects of several developing countries. These problems need to be addressed first at thedomestic level. International support in the form of “aid for trade” can, however, beinstrumental in supplementing the domestic reforms initiatives.
Despite protectionist barriers, the T&C industry has not remained static over thepast five decades or so. It keeps evolving due to changing demand of the buyers,sourcing patterns, availability of and access to technology, shifting levels of economicgrowth and increased consciousness as well as sensitivity towards corporate socialresponsibility and ethical procurement. While some of these emerging issues offeropportunities for developing countries, others pose challenges. In order to survive in the

41
present T&C market that is characterized by rapidly changing consumer demand andretailer market power, organizational skills and flexibility become more important thanmerely achieving cost competitiveness.
Some of the efforts made by governments as well as the private sector to helpthe T&C exporters survive the phasing out of quotas have produced encouraging results.However, some other endeavours have either not been successful or could yet proveunsustainable. Therefore, concerted efforts should be made by various stakeholdersaimed at addressing the market access anomalies and supply side constraints, keepingin view the emerging challenges and the future evolution of the T&C industry and trade.

42
Abernathy, F. H., A. Volpe and D. Weil, 2004. The apparel and textile industries after2005: Prospects and choices (draft), Harvard Centre for Textile and ApparelResearch.
Abernathy, F. H. and D. Weil, 2004. “Apparel apocalypse? America’s textile industrieswon’t die when quotas do”, The Washington Post, 18 November 2004.
Adhikari, R., 2006a. “LDCs should stay the course”, The Kathmandu Post, 20 and 21January 2006.
, 2006b. “Governments’ support to T&C sector in select Asian countries” (mimeo-graph), UNDP RCC APTII, Colombo.
, 2006c. One year after phasing-out of T&C quotas: Where does South AsiaStand?” Trade Insight, vol. 2, No. 1, South Asia Watch on Trade, Economics andEnvironment, Kathmandu.
, 2005. “Sense and nonsense of rules of origin”, Trade Insight, vol. 1, No. 2.South Asia Watch on Trade, Economics and Environment, Kathmandu.
Adhikari, R., and C. Weeratunge, 2007. “Textiles and clothing sector in South Asia:Coping with post-quota challenges”, in B.S. Chimni, B. L. Das, S. Kelegama andM. Rahman (eds.), South Asian Yearbook of Trade and Development 2006 –Multilateralism at Cross-roads: Reaffirming Development Priorities. Centre forTrade and Development and Wiley India, New Delhi, pp.109-147.
Adhikari, R., and Y. Yamamoto, 2006. “Sewing thoughts: how to realise human develop-ment gains in the post-quota world”, Tracking Report (April), UNDP RCC APTII,Colombo.
, 2005. “Flying colours, broken threads: One year of evidence from Asia after thephase-out of textiles and clothing quotas”, Tracking Report (December), UNDPRCC APTII, Colombo.
Ahmed, I., A. Rahman and F. Siobhan, 2005. “Impact of trade changes on labourstandards – lessons to be learned from the response to the MFA phase out inBangladesh”, study prepared for the Department for International Development,Dhaka.
Ahmad, M., 2005. “Developments in textiles and clothing trade, post-ATC: Modellers offmark – EU/US trade policy remains the predominant influence”, paper presentedat a Panel Discussion on Textiles and Clothing: One Year of Evidence after thePhasing-out of Quotas in Hong Kong, 16 December 2005.
Asian Development Bank, 2006. Asian Development Outlook 2006: Routes for Asia’sTrade, Manila
Baldwin, R. E., 2000. Regulatory Protectionism, Developing Nations and a Two-TierWorld Trade System, Brookings Trade Forum.
References
43
Bennet, M., 2006. “Lesotho’s export textiles and garment industry”, in H. Jauch and R.Traub-Merz (eds.), The Future of the Textile and Clothing Industry in Sub-Saharan Africa, Friedrich-Ebert-Stiftung, Bonn, Germany.
Berger, S., 2006. How We Compete. Currency/Doubleday, New York.
Bhatt, S. R., B. Shakya, M. Udas, S. Thapa, G. Sharma, M. Pradhananga and A.Shrestha, 2006. “Human development impact assessment in the post-ATC period:The case of Nepal”, revised draft report submitted to UNDP RCC APTII. SouthAsia Watch on Trade, Economics and Environment, and Action Aid Nepal,Kathmandu.
Cambodia Development Resource Institute, 2006. Cambodia Development Review, vol.10, No. 1, January-March 2006.
Chan, V. and H. Sok, 2006. “Cambodia’s garment industry post-ATC: Human develop-ment impact assessment, report prepared for UNDP RCC APTII. EconomicInstitute of Cambodia, Phnom Penh.
Chandra, P., 1998. “Competing through capabilities: Strategies for global competitivenessof Indian textile industry”, Economic and Political Weekly, vol. 34, No. 9; M-17-M-24.
ComMark Trust, 2006. Annual Report 2006. Johannesburg.
Dahal, N., 2006. “Review of Nepalese garments industry in the quota free regime”,report prepared for UNDP RCC.
Daily Mirror, 2006. “Bullet-proof jackets new weapon in Sri Lankan export armoury”, 2September 2006.
Das, B. L., 2006. World Trade Organization: Notes on the Content and Process, UNDPRCC APTII, Colombo.
EmergingTextiles.com, 2006. “US tariff impact for knitted and woven apparel imports:Asia pays a high price for accessing the US apparel market, www.emergingtextiles.com/?q=art&s=060801Amark&r=search&n=1 (accessed on 7September 2006).
European Commission, 2005. European Union-China textile agreement, memo, 12 June2005, ec.europa.eu/trade/issues/sectoral/industry/textile/memo100605_en.htm (ac-cessed 13 December 2006).
Eurostat. External Trade Database (COMEXT), europa.eu.int/
Fiji Times, 2006. “Australia to relax Fiji garment import fees”, 8 September,www.fijitimes.com.
Foreign Investment Advisory Services, 2004. Cambodian Garment Sector: Buyers’Survey Results, December 2004, World Bank, Washington, D.C.
Gereffi, G., 1999. “International trade and industrial upgrading in the apparel commoditychain”, Journal of International Economics, vol. 48, No. 1; pp. 37-70.
44
, 1994. “The organization of buyer-driven global commodity chains: How USretailers shape overseas production networks”, in G. Gereffi and M. Korzeniewicz(eds.), Commodity Chains and Global Capitalism. Greenwood Press, Connecticut,United States.
German Technical Cooperation, 2006. Economic Monitor of Mongolia (January-August2006), GTZ, Ulaanbaatar.
Global Education Centre and Family Planning International Development, 2004. JustNext Door: Development Themes for Fiji and Samoa. Wellington.
Gupta, R. K., 1997. “Non-tariff barriers or disguised protectionism”, Briefing Paper No. 2/1997, Consumer Unity and Trust Society, Jaipur, India.
Harney, A., 2004. “Going home: Chinese migrant workers shun long factory hours andlow pay”, Financial Times, 3 November.
Harrington, C., 2000. “Fiji’s women garment workers: Negotiating constraints in employ-ment and beyond”, Labour and Management in Development Journal, vol. 1, No.5; pp. 3-22.
Hayashi, M., 2005. Weaving a new world: Realizing development gains in a post-ATCtrading system, United Nations Conference on Trade and Development Series onAssuring Development Gains from the International Trading System and TradeNegotiations. United Nations, New York and Geneva.
Hummels, D., 2001. Time as a Trade Barrier, Purdue University Economics Department,West Lafayette, Indianapolis, United States.
Inama, S., 2002. “Market access for LDCs: Issues to be addressed”, Journal of WorldTrade, vol. 36, No. 1; pp. 85-116.
International Business and Technical Consultants, Inc., 2003. “A Study on the efficiencyand effectiveness of banking and financial services for exporters”, report submit-ted to Ministry of Commerce, Dhaka.
International Labour Organization, 2006. Seventeenth Synthesis Report on WorkingConditions in Cambodia’s Garment Sector, ILO and Better Factories Cambodia,Phnom Penh.
, 2005a. “Promoting fair globalisation in textiles and clothing in a post-MFAenvironment”, report for discussion at the Tripartite Meeting on Promoting FairGlobalisation in Textiles and Clothing in a Post-MFA Environment, Geneva.
, 2005b. Fifteenth Synthesis Report on Working Conditions in Cambodia’sGarment Sector. Geneva.
International Textiles and Clothing Bureau, 2006. “Few, yet important changes in UStextiles and clothing imports in first half of 2006” (mimeograph). Available atwww.itcb.org/Documents/ITCB-TD6-06.pdf (accessed 12 December 2006).
Jayanthakumaran, K., 2003. “Benefit-costs appraisals of export processing zones: Asurvey of the literature”, Development Policy Review, vol. 21, No. 1.

45
Kelegama, S. and B. Weeraratne, 2005. “Trade in textiles and apparel in South Asia”, inSouth Asian Yearbook of Trade and Development 2005 – Mainstreaming Develop-ment in Trade Negotiations: Run up to Hong Kong. Centre for Trade andDevelopment, New Delhi.
Lecraw, D. J., P. Eddleston and A. McMahon, 2005. “A value chain analysis of theMongolian cashmere industry”, report for the Mongolia Economic Policy Reformand Competitiveness Project (EPRC). United States Agency for InternationalDevelopment and EPRC, Ulaanbaatar.
Madani, D., 1999. “A review of the role and impact of export processing zones”, PolicyResearch Working Paper, No. 2238, World Bank, Washington, D.C.
Maskus, K. E. and J. S. Wilson, 2000. “Quantifying the impact of technical barriers totrade: A review of past attempts and the new policy context”, paper prepared forthe World Bank Workshop on Quantifying the Trade Effect of Standards andTechnical Barriers: Is it Possible?, 27 April 2000.
Mayer, J. and A. Wood, 2001. “South Asia’s export structure in a comparative perspec-tive”, Oxford Development Studies, No. 29; pp. 5-29.
Mayer, J., 2005. “Not totally naked: Textiles and clothing trade in a quota-free environ-ment”, Journal of World Trade, vol. 39, No. 3; pp. 393-426.
Mehta, P. S., 2006. “Broad benefits of special economic zones”, Financial Express, 14December 2006.
Messerlin, P. A., 2004. “China in the WTO: Antidumping and safeguards”, in D.Bhattasali, S. Li and W. J. Martin (eds.), China and the WTO: Accession, PolicyReform, and Poverty Reduction Strategies, World Bank, Washington, D.C.
Ministry of Commerce, 2005. “Intellectual property protection in China” (March). Beijing.
Ministry of Planning and National Development, 2005. Millennium Development Goals:Maldives Country Report. Malé. Available at www.planning.gov.mv.
, 2004a. Statistical Yearbook of Maldives 2004. Malé. Available at www.planning.gov.mv.
, 2004b. Household Income and Expenditure Survey 2002-2003. Malé. Availableat www.planning.gov.mv.
Morris, M., 2006. “Globalisation, China, and clothing industrialisation strategies in sub-Saharan Africa”, in H. Jauch and R. Traub-Merz (eds.), The Future of the Textileand Clothing Industry in Sub-Saharan Africa. Friedrich-Ebert-Stiftung, Bonn,Germany.
National Council of Textiles Organizations, 2006. “US House of Representatives calls forUSTR to adhere to textile negotiating objectives in WTO talks: AppropriationsCommittee Mandates Report on Progress of Textile Negotiations”, press release,29 June 2006, www.ncto.org/newsroom/pr200610.asp (accessed 12 December2006).

46
and American Manufacturing Trade Action Coalition, 2005. “Members of Congresscall for United States to oppose the EU-led LDC duty-free, quota-free initiative ontextiles and to endorse separate textile talks in upcoming WTO negotiations”,press release, 8 December 2005, www.ncto.org/newsroom/pr200542.asp (ac-cessed 13 December 2006).
National Statistical Office of Mongolia, 2005. Monthly Bulletin of Statistics (March),www.nso.mn (accessed November 2006). Ulaanbaatar.
Nordas, H. K., 2004. “The global textile and clothing industry and clothing”, DiscussionPaper No. 5, World Trade Organization, Geneva.
Organisation for Economic Co-operation and Development, 2004. “Structural adjustmentin textiles and clothing in the post-ATC trading environment”, TD/TC/WP 2004/4/FINAL. Paris.
Oxfam International, 2004. “Stitched up: How rich-country protectionism in textiles andclothing trade prevents poverty alleviation”, Briefing Paper 60 (April 2004).Oxford, United Kingdom.
Prasanna, R. P. I. R. and B. Gowthaman, 2006. “Sector specific living wage for SriLankan apparel industry workers, survey findings and preliminary report for widerdiscussion”, prepared for Apparel-industry Labour Rights Movement (AlaRM),Colombo.
Razzaque, M. A. and S. Raihan, 2006. “Two years after MFA phase-out: Concerns forBangladesh in multilateral and regional trade negotiations – implications for theBangladesh economy”, report submitted to UNDP RCC APTII. UnnayanShamannay, Dhaka.
Shakya, B., 2005. “Sustaining Nepalese garment industry after quota abolition”, reportprepared for Ministry of Finance, Kathmandu and Asian Development Bank,Manila.
Sisouphanthong, B., K. Phimmahasay, V. Ngonvorarath, V. Phonepraseuth and V. Syvilay,2006. “Human development impact assessment in post-ATC period”, reportprepared for UNDP RCC APTII. National Statistics Centre, Vientiane.
Storey, D., 2004. The Fiji Garment Industry. Oxfam, New Zealand.
Tewari, M., 2006. “Is price and cost competitiveness enough for apparel firms to gainmarket share in the world after quotas? A review”, Global Economy Journal, vol.6, No. 4; Art. 5.
The Jakarta Post, 2006. “Plans weighed for reinvigorating textile industry” (accessedonline, 15 April 2006.)
UNDP RCC, 2005a. “International trade in textiles and clothing and development policyoptions: After the full implementation of the WTO Agreement on Textiles andClothing (ATC) on 1 January 2005”, Policy Paper.
, 2005b. “The great maze: Regional and bilateral free trade agreements in Asia –trends, characteristics, and implications for human development”, Policy Paper.

47
UNDP, 2006. Human Development Report 2006. Palgrave Macmillan, New York.
United States Agency for International Development, 2005. Measuring Competitivenessand Labour Productivity in Cambodia’s Garment Industry. Phnom Penh.
United States Department of State, 2006. “Investment climate statement: Maldives”.www.state.gov/e/eb/ifd/2006/63586.htm (accessed 31 March 2006).
United States Mission to the European Union, 2006. “REACH requires further improve-ments, according to EU trading partners”, 8 June 2006. Brussels.
United States Trade Representative, 2005. “Memorandum of Understanding between theGovernments of the United States of America and the People’s Republic Chinaconcerning trade in textile and apparel products”, www.ustr.gov/assets/World_Regions/North_Asia/China/asset_upload_file91_8344.pdf (accessed 13 De-cember 2006).
, 2004. “National Trade Estimate Report on Foreign Trade Barriers”, www.ustr.gov/assets/Document_Librar y/Repor ts_Publ icat ions/2004/2004_Nat ional_Trade_Estimate/2004_NTE_Report/asset_upload_file10_4797.pdf.
United States International Trade Commission, 2004. Textiles and Apparel: Assessmentof the Competitiveness of Certain Foreign Suppliers to the US Market, publica-tion No. 3671, Washington D.C. Available online at hotdocs.usitc.gov/pub3671/pub3671.pdf (accessed 31 March 2006).
United States International Trade Commission Interactive Tariff and Trade DataWeb atdataweb.usitc.gov/.
World Bank and International Finance Corporation, 2006. Doing Business in 2006:Creating Jobs, Washington, D.C.
World Trade Organization, 2006a. International Trade Statistics 2006, www.wto.org/english/res_e/statis_e/its2006_e/its06_toc_e.htm (accessed 13 December 2006).
, 2006b. “China: Trade policy review”, WT/TPR/S/161. Geneva.
, 2005. “Options for least-developed countries to improve their competitiveness inthe textiles and clothing business”, WT/COMTD/LDC/W/37. Geneva.
, 2003. “Anti-dumping actions in the areas of textiles and clothing, proposal for aspecific short-term dispensation in favour of developing members following fullintegration of the sector into GATT 1994 from January 2005”, WT/GC/W/502.Geneva.
, 2001. “Accession of the People’s Republic of China – Decision of 10 Novem-ber”, WT/L/432, Annex 5B. Geneva.
Yang, Y. and C. Zhong, 1998. “China’s textile and clothing exports in a changing worldeconomy”, The Developing Economies, vol. XXXVI, No. 1; pp. 3-23.

48

49
II. ECONOMIC IMPACTS OF THE PHASE-OUT IN 2005OF QUANTITATIVE RESTRICTIONS UNDER THE
AGREEMENT ON TEXTILES AND CLOTHINGBy Margit Molnar and Przemyslaw Kowalski*
Introduction
This paper provides a quick review of the integration process into GATT 1994 oftextiles and clothing products. It also examines the most recent changes in the globaltextile and clothing markets, and analyses some major strategies adopted by producersin order to survive in the post- Multi-Fibre Arrangement (MFA) global competitive arena.
The Agreement on Textiles and Clothing (ATC) was one of the major achieve-ments of the Uruguay Round. It put an end to a system of managed trade in textile andclothing products that lasted for more than 40 years, first under the Long-TermAgreement Regarding International Trade in Cotton Textiles (LTA) and then MFA. TheMFA quota system was adopted as a temporary relief measure in favour of thedomestic textile and clothing (T&C) manufacturers in the developed countries. It providedprotection for high-cost domestic industries and allowed inefficient exporters to gainaccess to markets at the expense of more productive ones whose access had beenlimited. The quota system prompted a scattering of global production and sourcing, andstrongly influenced locational decisions of global textile and garment producers.
Not surprisingly, the abolition of the quota system is starting to significantlyreshape the global T&C production, trade and investment landscapes by bringing aboutefficiency gains. However, the benefits of the phase-out are not evenly distributed, andfor some countries may only be realized in the medium to long term; this is particularlyso, since a significant share of trade with China, the world’s top exporter of T&Cproducts, is still restricted by temporary quotas in the European Union and UnitedStates markets. Efficiency gains are being realized, inter alia, through the agglomerationof production exploiting scale economies, technology spillovers and reduction in tradecosts. Pro-competitive effects in derestricted markets are also being observed.
The consequences of the ATC phase-out differ across exporters, and theirpreparedness is playing a role in how they manage to cope with competitive challengesin more open markets. Exporters with low costs and high productivity such as China,India and, to a lesser extent, Pakistan and Viet Nam have succeeded in benefiting fromenlarged markets, while the phase-out has brought about challenges for OECD andsmall country producers. A major challenge in OECD countries is how to cope withdecreasing labour demand in the textile and clothing industries as a result of increasedcompetition and relocation, while in low-income countries it is how to specialize inproducts and markets to stay afloat. This group of countries has been given further time
* The material presented in this chapter draws on work in progress within the OECDSecretariat. Nevertheless, the views presented are those of the authors and do not necessar-ily represent the views of OECD or its member countries. Comments by Raed Safadi andRalph Lattimore, and the excellent research and statistical assistance provided by LauraMunro and Clarisse Legendre are gratefully acknowledged.

50
for adjustment, which should be better exploited to prepare for fiercer competition inglobal textiles and clothing markets, and in particular learning from the experience priorto the phase-out.
A. Textiles and clothing in world trade: An overview
1. T&C industry offers opportunities for producers in countries withdiffering endowments and technologies
The textiles and clothing industry is a large and diverse sector that can besubdivided into distinct parts thus offering opportunities for countries with differingresource endowments and technologies. The traditional division is between the produc-tion of natural fibres, fabrics and finished clothing, although the import, distribution andretail segments play an ever more important role in the industry’s value chain (OECD,2004 and 2005; Nordas, 2005).
Natural fibre production is the domain of agricultural economies with access toplants from which the fibre is produced. Synthetic fibre production depends on the abilityto innovate or adopt new technologies. Fibres are spun into yarn, and yarn is either wovenor knitted into fabric. Fabric is then finished, which involves dying, printing or softening,among others. Fabric production is a highly automated, capital-intensive activity and issusceptible to technological advances. Clothing production consists of cutting the fabric,grouping it, tying it into bundles and sewing together. It is labour intensive and workers arespecialized in a limited number of tasks that are performed repetitively.
Nevertheless, cutting is often a computer-assisted process and specializedmachines are used for different types of sewing (Nordas, 2005). Indeed, as table 1indicates, labour costs account for a higher share of costs in the clothing sector,although capital shares are not obviously lower; however, this does not apply to thecase of Mexico, where the share of capital in total textiles cost is close to two and ahalf times that of labour. The wearing apparel sector relies relatively less on intermedi-ate inputs compared with the textile sector. Interestingly, up to 34 per cent ofintermediate inputs can be of foreign origin, which underlines the extent of international-ization of the industry.
2. Share of T&C in world trade is decreasingbut remains important
The T&C industry remains a significant industry in world exchanges, although itsshare in world trade and its annual output growth rates have been falling over the pastfew years (table 2). In 2005 – the most recent year for which consistent data areavailable – world trade in T&C amounted to US$ 481 billion, or 4.7 per cent of worldexports, compared with 6 per cent and 5.3 per cent in 2003 and 2004, respectively.T&C still plays an important role in trade of OECD countries, amounting to 3.5 per centof their merchandise exports; however, such trade is more critically important for manydeveloping countries where the share of T&C in total exports can reach more than 60per cent. The share in OECD’s trade was 3.5 per cent in 2005 (table 3), which wasbelow the world average; however, this masks a considerable reliance on T&C ship-ments by countries such as Portugal, Greece or Italy with shares of between 9 to 13per cent in their total exports.

51
Table 1. Cost structure of firms in the textiles and wearing apparel sectors
Unit: %
Primary factors Intermediate inputs
Skilled Unskilled Totallabour labour labour Capital Domestic Imports
Textiles sector
China 1.5 9.2 10.6 11.6 66.9 10.9Japan 6.5 17.4 23.9 7.4 58.5 10.2India 2.7 17.6 20.3 6.6 67.9 5.2Canada 2.9 21.4 24.3 9.7 36.5 29.4United States 4.3 19.6 23.9 10.9 56.2 9.1Mexico 1.9 11.3 13.2 31.1 49.1 6.7EU15 (average) 4.6 17.3 21.9 7.8 35.9 34.4
Wearing apparel
China 2.4 17.5 19.9 12.0 60.5 7.7Japan 3.9 21.7 25.6 11.5 56.0 6.9India 2.9 20.9 23.8 7.8 66.0 2.4Canada 4.7 24.6 29.3 9.8 36.9 24.0United States 5.7 20.9 26.6 6.2 54.1 13.1Mexico 1.4 9.1 10.5 29.0 56.1 4.4EU15 (average) 4.0 18.3 22.2 8.3 35.6 33.9
Source: GTAP 6 database, base year 2001.
Table 2. World exports of textiles and clothing 2003-2005
2003 2004 2005
Value (US$ billion) 418 466 481Percentage of world exports 5.96 5.25 4.75Percentage change for year before 15.1 11.47 3.15
Source: United Nations Comtrade Database, 2007.
In contrast to the OECD area, low- and middle-income countries in East Asia,the Pacific and South Asia record particularly high shares with countries such asBangladesh, Pakistan or Sri Lanka recording shares of, respectively, 84 per cent, 63 percent and 48 per cent. The high reliance on T&C shipments underlies the important rolethat this sector plays in development and trade integration of these and other developingcountries. More broadly, developing countries account for more than 50 per cent ofworld textile exports and, as pointed out by WTO, “in no other category of manufacturedgoods do developing countries enjoy such a large net-trading position” (World TradeOrganization, 2006).

52
The EU25 and the United States are the two main destination markets for T&Cproducts, accounting respectively for US$ 185 billion and US$ 84 billion, or 44 per centand 20 per cent of world imports in this category in 2005.1 Other important importersinclude Hong Kong, China with nearly 7 per cent of world’s imports, Japan (6 per cent),and China (5 per cent). Canada and Mexico each account for approximately 2 per centof world imports. Remarkably, 2003 and 2004 – the two years that preceded the phase-out of ATC quotas – recorded high growth rates in the textile trade of around 12 percent, while in 2005 those rates reverted to 2-3 per cent.
The world’s largest single country exporter of T&C products in 2005 was China,with US$ 107 billion or 22 per cent of world exports, followed by Hong Kong, China,with US$ 40 billion (8 per cent). Yet, the EU25 as a group remains the most importantexporter with US$ 149 billion or 32 per cent of world exports. Other OECD countrieswith high shares are the United States (4.6 per cent of world exports), Turkey (3.9 percent), the Republic of Korea (2.9 per cent), Mexico (2 per cent) and Japan (1.7 percent).
Table 3. Textiles exports as a percentage of total merchandise exports, 2005
By country grouping % 20 countries withhighest sharesa %
Bangladeshb 84.0All countries – total 4.8 Pakistan 63.9
Benin 60.5All high-income 3.5 Sri Lanka 47.5High-income, non-OECD 7.2 Mauritius 40.8High-income, OECD 3.1 Tunisia 32.7OECD 30 3.5 Guatemala 30.9
Albania 30.4Low and middle income, East Asia and Pacific 10.3 Morocco 26.9Low and middle income, Europe 5.7 The former YugoslavLow and middle income, Latin America and Republic of Macedonia 26.4
Caribbean 3.3 Mongolia 26.1Low and middle income, Middle East and Jordan 25.8
North America 3.1 Turkey 25.8Low and middle income, South Asia 24.7 Romania 19.0Least developed countries 3.5 Moldova 17.8
Bulgaria 17.7India 17.3United Republic of Tanzania 16.1China 14.1Hong Kong, China 13.5Portugal 13.4
Source: United Nations Comtrade Database, 2007.
a Countries for which the data were available for 2006.b Data are for 2004.
1 It should be noted that the import and export shares for EU25 referred to in the two followingparagraphs include intra-EU25 trade.

53
3. Phase-out of MFA quotas under ATC
(a) ATC phase-out concludes integration of T&C trade into GATT rules
The 10-year period of eliminating quantitative restrictions on imports of textile andclothing set out in ATC ended on 1 January 2005. ATC was designed to regulate thetransition between MFA – an agreement that came into force in 1974 as a replacement ofthe Long-Term Agreement Regarding International Trade in Cotton Textiles signed in 1962– and a full integration of textiles and clothing products into the GATT rules.
Even though MFA was aimed at an orderly opening of restricted textile andclothing markets, it was a major departure from the basic GATT rules and, in particular,the principle of non-discrimination and application of quantitative restrictions instead oftariffs. The MFA quotas were applied almost exclusively to imports from developingcountries, an application which was also against the pro-development spirit of GATT. Thediscriminatory nature of MFA, the historical importance of textiles in the process ofindustrialization and the comparative advantage that many low-wage countries displayedin the labour-intensive segments of textile production created a situation where, asReinert (2000) pointed out, the inclusion of ATC in the Marrakech Agreement was seenas crucial to the success of the Uruguay Round in the minds of many developingcountry members of WTO.
Integration of textiles products into GATT 1994 was considered the main pillarthrough which ATC was supposed to deliver market opening. For the European Union,Canada, Norway and the United States, which carried the MFA restrictions into ATC,the integration of a product into GATT 1994 had two consequences (World TradeOrganization, 2004). First, any quantitative restriction maintained on such a productunder ATC was eliminated. Second, the transitional safeguard mechanism could not beinvoked any more with respect to imports of such a product.2 For WTO members whodid not maintain quotas under MFA, the effect of implementing integration programmeswas to remove the possibility of having recourse to the transitional safeguard mecha-nism.
Products were to be integrated in four cumulative steps – 16 per cent of the1990 volume of trade by 1 January 1995, 33 per cent by 1 January 1998, 51 per centby 1 January 2002 and 100 per cent by 1 January 2005.3 In this regard, a back-loading was built into the system, as the last 50 per cent of the volume integration wasscheduled to occur on 1 January 2005. Additionally, the choice of products to beliberalized at each stage was left to the concerned countries as long as the integrated
2 ATC regulated the application of transitional safeguards, in the form of quantitative restrictionsthat could be utilized also by countries that had not maintained quotas under MFA on importsof products covered by ATC and which cause serious damage or a threat thereof to theimport-competing domestic industry. Such restrictions appear to have been important only forselected bilateral trade flows involving mainly the United States and some Latin Americancountries in the first half of the ATC period. In fact, in ATC Stage 3 (1 January 2002 to 1January 2005) there were only two recourses to this mechanism, both by Brazil.
3 Norway eliminated all restrictions in three quicker steps – 1 January 1996, 1 January 1998, 1January 1999 and 1 January 2001. For Norway the potential effects of integration of productsinto GATT 1994 became equivalent to members who did not carry over the restrictions butretained the right to use the provisions of Article 6 of ATC on the transitional safeguardmechanism.

54
items comprised four categories of products: (a) tops and yarns; (b) fabrics; (c) made-uptextile products; and (d) clothing. Yet, the relatively broad product coverage of ATCimplied – especially in its initial phases – that the integration of products into GATT didnot necessarily cover the products on which MFA quotas existed in the first place.4 Inaddition, different MFA quotas had different restrictiveness, which was demonstrated byvarying quota fill rates; those non-binding quotas were the ones to be integrated first.Furthermore, the commitments were set in terms of volumes, not values, which impliedthat the first two stages of ATC were characterized by integration of low-value addeditems (Reinert, 2000).
Taken together, these rules appear to have created possibilities of postponing theliberalization of the most sensitive products and, indeed, the first two stages of ATCwere skewed away from clothing products that have the highest low-skilled labourcontent (Reinert, 2000). Yet, while many would like to have seen a more gradualintegration of T&C products over the ATC period, the back-loading of the liberalizationprocess should not have been unexpected, since some of the restricting countries hadmade clear from the start that they intended to integrate the most sensitive productsat the end of the 10-year period, i.e., on 1 January 2005 (World Trade Organization,2004).
In addition to the integration of textiles and clothing products into GATT, ATCaccelerated the annual growth rates of quotas carried over from MFA. These growthrates were supposed to be increased by 16 per cent by 1 January 1995, 25 per cent by1 January 1998 and 27 per cent by 1 January 2002. What this pillar of ATC meant was,in practice, that if the quota was set to increase by 6 per cent annually5 under MFA itshould increase by 6*1.16=6.96 per cent annually under the first phase and by6.96*1.25=8.7 per cent annually under the second phase of ATC, and so on. Whetherthis system of quota growth has delivered significant liberalization is disputed. As perNordas (2005), quoting Reinert (2000), the accumulated aggregate increases of thequotas over the ATC period in the European Union were 18 per cent and in the UnitedStates 25 per cent above the levels that they would have been with the continuation ofMFA.
There has been full compliance with the quota growth rate and volume integra-tion commitments at each ATC stage. However, as indicated in Textiles Monitoring Bodyreports to the Council for Trade in Goods (World Trade Organization, 2004), despite thefact that ATC had provisions and encouraged quicker liberalization, most importingcountries had not gone beyond the minimum liberalization required for each stage. Infact, the most sensitive products were only liberalized at the end of 2004.6
4 Many analysts have pointed out that the choice of products covered by ATC and included inthe Annex to the Agreement could be seen as working against the objective of liberalizingtrade in textiles and clothing. The list included some products that had never been subject torestrictions in any bilateral agreement under MFA. In effect, the list from which the ATCcountries selected products for integration at each stage was wider than the list of productsactually restricted under MFA by any individual importer.
5 Under MFA, the restricted textile and clothing were limited to 6 per cent annualgrowth, although in exceptional circumstances these growth rates could be set at lowerlevels.
6 Nevertheless, Canada, for example, has reported integration going beyond the set minima inits submissions to the Textiles Monitoring Body of WTO.
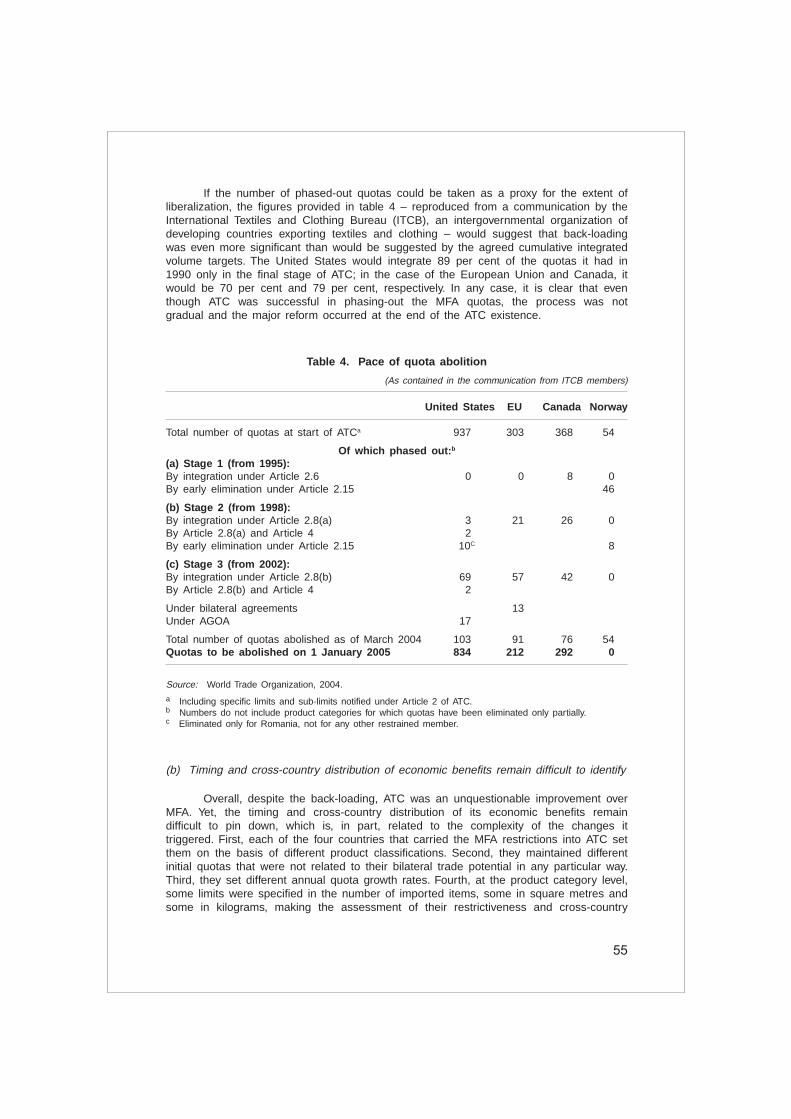
55
If the number of phased-out quotas could be taken as a proxy for the extent ofliberalization, the figures provided in table 4 – reproduced from a communication by theInternational Textiles and Clothing Bureau (ITCB), an intergovernmental organization ofdeveloping countries exporting textiles and clothing – would suggest that back-loadingwas even more significant than would be suggested by the agreed cumulative integratedvolume targets. The United States would integrate 89 per cent of the quotas it had in1990 only in the final stage of ATC; in the case of the European Union and Canada, itwould be 70 per cent and 79 per cent, respectively. In any case, it is clear that eventhough ATC was successful in phasing-out the MFA quotas, the process was notgradual and the major reform occurred at the end of the ATC existence.
Table 4. Pace of quota abolition
(As contained in the communication from ITCB members)
United States EU Canada Norway
Total number of quotas at start of ATCa 937 303 368 54
Of which phased out:b
(a) Stage 1 (from 1995):By integration under Article 2.6 0 0 8 0By early elimination under Article 2.15 46
(b) Stage 2 (from 1998):By integration under Article 2.8(a) 3 21 26 0By Article 2.8(a) and Article 4 2By early elimination under Article 2.15 10C 8
(c) Stage 3 (from 2002):By integration under Article 2.8(b) 69 57 42 0By Article 2.8(b) and Article 4 2
Under bilateral agreements 13Under AGOA 17
Total number of quotas abolished as of March 2004 103 91 76 54Quotas to be abolished on 1 January 2005 834 212 292 0
Source: World Trade Organization, 2004.
a Including specific limits and sub-limits notified under Article 2 of ATC.b Numbers do not include product categories for which quotas have been eliminated only partially.c Eliminated only for Romania, not for any other restrained member.
(b) Timing and cross-country distribution of economic benefits remain difficult to identify
Overall, despite the back-loading, ATC was an unquestionable improvement overMFA. Yet, the timing and cross-country distribution of its economic benefits remaindifficult to pin down, which is, in part, related to the complexity of the changes ittriggered. First, each of the four countries that carried the MFA restrictions into ATC setthem on the basis of different product classifications. Second, they maintained differentinitial quotas that were not related to their bilateral trade potential in any particular way.Third, they set different annual quota growth rates. Fourth, at the product category level,some limits were specified in the number of imported items, some in square metres andsome in kilograms, making the assessment of their restrictiveness and cross-country

56
comparisons extremely difficult. Fifth, existing quotas could have been changed in theinterim as long as the targets set for integration stages were obeyed. All these factorsimply that the extent of restrictiveness of MFA, and consequently the extent ofliberalization brought about by ATC, was specific to each individual bilateral traderelation. Hence, it should be borne in mind that the concept of a generalized assess-ment of the economic impact of MFA and ATC is limited.
4. Post-ATC policy changes in the United States andEuropean Union markets
On the one hand, the developments in the first few months immediatelyfollowing the final stage of ATC were predictable given the back-loading of quotaremoval. On the other hand, their precise magnitude could not be foreseen, amongothers, for the reasons given in the preceding paragraph. During January-March 2005,for example, imports by the United States of cotton trousers from China increased by1,500 per cent and those of knit cotton shirts by 1,250 per cent compared with theirlevels recorded during the same period in 2004.7 Other low-cost producers that havesignificantly increased their exports to the United States include Bangladesh, India,Indonesia, Pakistan and Viet Nam, among others. In late April 2005, the United StatesCommittee on the Implementation of the Textile Agreement (CITA) began consideringrequests for safeguard action on seven product categories imported from China.Approximately one month later, quantitative limitations on imports of seven textilecategories were established through 31 December 2005 and bilateral negotiations withChina were requested. Upon receipt of the request, China agreed to limit its exportsto a level not greater than 7.5 per cent above the amount shipped during thepreceding 12 months.
The bilateral talks between the United States and China that were concluded inNovember 2005 resulted in a memorandum of understanding in which reintroduction oftemporary quotas for 21 product categories was agreed under the special T&Csafeguard clause of China’s WTO accession protocol. The temporary quotas wereimposed on several items including cotton shirts, cotton trousers and underwear. Theywere reported to cover 90 per cent of imports restricted in 2004. Depending on theproduct category, the agreement allowed for an increase of between 173 per cent and640 per cent in the biennium 2004-2006, between 12.5 per cent and 16 per cent in2007, and between 15 per cent and 17 per cent in 2008.
Similar to the United States, in the European Union the beginning of 2005brought about significant increases of imports from China. The highest percentageincreases with respect to the first quarter of 2004 were recorded for pullovers (534 percent), men’s trousers (413 per cent), blouses (186 per cent) and bed linen (164 percent). Investigations for evidence on market disruptions caused by the surge of importsfrom China were initiated at the end of April 2005 and a memorandum of understandingwas reached in June 2005. The agreement limited, until end 2007, China’s exports in 10product categories for 2005, 2006 and 2007, with annual quantity growth rates rangingfrom 10 per cent to 12.5 per cent from the base imports level in April 2004-March 2005.The restricted items included pullovers, men’s trousers, blouses, T-shirts, dresses,brassieres, flax yarn, cotton fabrics, bed linen, and table and kitchen linen.
7 Based on communications of the US Department of State.

57
Hence, the additional transitory protection provided to the domestic textileindustry through the reintroduction of quantitative restrictions in the European Union willbe one year shorter than in the United States. There are also differences in productcoverage that are likely to differentiate the third-country impacts. For example, theUnited States restricted cotton knit shirts while the European Union did not; theEuropean Union restricted dresses while the United States did not. While one shouldnot perhaps be reading too much into these differences, it is possible that to a certainextent they do influence the differential impacts that the new quantitative restrictionshave on third-party textile suppliers competing with China in the European Union andthe United States markets, such as Bangladesh, India or Viet Nam.
5. Major post-ATC changes in T&C trade in the European Union andUnited States markets
After the initial shock, the European Union quotas curbed the surge in importsfrom China. However, China’s competitors are being put under increasing pressure eachyear.
Even with the reintroduction of temporary quotas, 2005 and 2006 brought aboutsignificant changes in the European Union and the United States markets. The value ofChina’s textiles and apparel exports to the EU25 increased by 43 per cent in 2005,which was the largest increase across all the suppliers. This surge was mainly driven byapparel products, which grew by 45 per cent, while textiles exports increased by 22 percent. India and Viet Nam have also experienced growing exports amounting to 18 percent and 6 per cent, respectively; this growth was largely driven by wearing apparel.Other exporters that enjoyed small increases were the United States, Turkey andBulgaria (figures I to III).
However, for most of the other suppliers, the value of exports to the EU25decreased in 2005. One group of countries with negative impacts include those enjoyingsome sort of preferential access to the European Union market, such as: (a) Morocco(-7 per cent) and Tunisia (-13 per cent), both of which are parties to the Euro-Mediterranean Partnership Agreements; (b) Bangladesh (-5 per cent), which enjoyedduty and quota-free market access within the Everything but Arms initiative: and (c)Mauritius, which enjoyed preferential access granted to the ACP countries.8 Neverthe-less, several other suppliers such as the Republic of Korea (-24 per cent), Australia(-29 per cent) and Thailand (-8 per cent) also faced decreasing demands for theirshipments.
Remarkably, the negative 2005 trends in the EU25 market were reversed in2006 for almost all suppliers. The value of Chinese exports grew by 13 per cent – amarked slowdown from the previous year – and the value of exports increased formost other suppliers including Bangladesh (30 per cent), Viet Nam and Hong Kong,China (47 per cent each), Sri Lanka (21 per cent), Cambodia (16 per cent), Pakistan(13 per cent) and Mauritius (10 per cent). This likely illustrates the impact of thetemporary quotas, which apparently had succeeded in curbing the surging importsfrom China only in 2006. This is likely to do with the fact that even though a quota
8 Box 2 provides a discussion of Madagascar’s textiles and clothing industry, its reliance onpreferential trade and ways of coping with the MFA phase-out.

58
for 2005 was also established, it was based on the import level during April2004-March 2005, which covered the first three months of China’s unlimited access tothe market.
As far as the most current data (January-March 2007) are concerned, there wasan increase in the imports of textiles and apparel from China of 36 per cent over thesame period in 2006, which suggests acceleration with regard to the rate of growth forthe whole of 2006 (22 per cent). If only apparel is taken into account, the accelerationin growth rates is from 13 per cent to 39 per cent. This suggests that with the increasesin the temporary quotas, China’s competitors in the EU25 market are under increasingpressure. This is also visible in the rates of export growth calculated for these suppliers,which, especially in apparel, were much lower in the first quarter of 2007 than theywere in 2006.
In the United States market, 2005 and 2006 brought about even larger increasesin imports from China. The value of textiles and apparel imports from China increasedby 54 per cent in 2005, which was the largest increase across all suppliers. This surgewas mainly driven by apparel products, which grew by 70 per cent, while textilesexports increased by 29 per cent. The impacts on third countries in the United Statesmarket give a clearer picture with Bangladesh, Cambodia, India, Indonesia, Pakistan andViet Nam all increasing their exports by between 6 per cent and 29 per cent. With theexception of India and Pakistan, this trend is quite clearly driven by apparel exportssince, in fact, most of these countries’ exports of textiles have declined. Many supplierslost market shares, including the Republic of Korea (-26 per cent), Turkey (-9 per cent),NAFTA members Mexico (-7 per cent) and Canada (-8 per cent), CaribbeanBasin Initiative countries (-4 per cent), Central American Free Trade Agreement(CAFTA) (-4 per cent), Guatemala (-7 per cent) and Honduras (-2 per cent) (figures IIIand IV).
In contrast to the EU25 market, 2006 did not bring about a reversal in thesetrends in the United States market, even though the increase of imports from China washalved from 54 per cent in 2005 to 21 per cent in 2006. In fact, for many Asiansuppliers other than China the growth rates of exports increased with regard to 2005.This was the case for Bangladesh, Indonesia and Viet Nam, among others. At the sametime, the decline in exports for countries such as Mexico, Canada and Turkey was morepronounced in 2006 than in 2005.
The data for 2007 confirm the conclusions drawn already for the EuropeanUnion: increasing quotas on Chinese imports put increasing pressure on other suppliers.In January-March 2007, imports of Chinese apparel grew by a high of 63 per cent fromthe same period in 2006 – almost as quickly as in 2005. It can also be observed that inmany countries that were losing their market shares in 2005 and 2006, this process hascontinued in 2007 at an even faster pace (figures III and IV).
The fact that many of the exporters that experienced declining exports to theEuropean Union following the abolition of quotas in 2005 were gaining back their marketshares in 2006, and that a similar situation did not happen in the United States market,might suggest that the temporary measures introduced by the European Union mighthave been more binding although they varied by product category.

59
I(b). Percentage change
Figure I. EU25 imports of textiles by country and region, 2005 and 2006
I(a). Value in billions of Euros
Source: Eurostat COMEXT, 2007.
World excl. EU25 intra-tradeChinaTurkey
IndiaUnited States
SwitzerlandPakistan
Republic of KoreaJapan
Taiwan Province of ChinaAustralia
IndonesiaThailandRomania
EgyptSouth Africa
IsraelIran, Islamic Republic of
New ZealandBulgariaMalaysia
BrazilTunisia
UzbekistanRussian Federation
Norway
13.414.4
2.42.8
1.71.9
1.31.4
0.80.9
0.80.8
0.60.7
0.60.50.40.5
0.40.40.30.30.30.4
0.30.3
0.2
0.10.1
822
14
141
12
8
1
11
515
9
115
211
302
4
53
210
255
10
42
2005 2006
–2
–1
0
–10
–5
–4–5–6
–30–9
–11
–13–9
–12–5
–7
–19–30
–6–1
–36
–34–8
–1
0.30.3
0.20.20.20.20.20.20.20.20.20.20.20.10.10.10.10.10.10.10.10.10.1
World excl. EU25 intra-tradeChinaTurkey
IndiaUnited States
SwitzerlandPakistan
Republic of KoreaJapan
Taiwan Province of ChinaAustralia
IndonesiaThailandRomania
EgyptSouth Africa
IsraelIran, Islamic Republic of
New ZealandBulgariaMalaysia
BrazilTunisia
UzbekistanRussian Federation
Norway

60
II(b). Percentage change
Figure II. EU25 imports of apparel by country and region, 2005 and 2006
II(a). Value in billion euros
Source: Eurostat COMEXT, 2007.
World excl. EU25 intra-tradeChinaTurkey
IndiaRomania
BangladeshTunisia
MoroccoHong Kong, China
PakistanIndonesia
BulgariaThailand
Sri LankaViet Nam
SwitzerlandRepublic of Korea
CambodiaUkraine
United StatesMauritius
EgyptCroatia
Macao, ChinaThe former Yugoslav Republic of Macedonia
Taiwan Province of China
59.866.8
18.721.1
9.39.5
4.04.6
3.83.73.7
4.82.62.62.32.4
1.72.6
1.41.61.21.51.11.30.80.90.81.00.81.1
0.60.60.50.50.50.60.50.40.40.50.40.5
0.40.40.30.40.30.4
0.40.5
0.30.3
8
–6
1245
135
225
15
30
0
4
48
14
201
12
12
216
45
1
3
161
1511
9
15
187
22
5
–3–5
–6
–7
–13
–16
–10
–12
–2
–5
–8
–38
–8
–14
–2
–10–5
–25
–31
2005 2006
World excl. EU25 intra-tradeChinaTurkey
IndiaRomania
BangladeshTunisia
MoroccoHong Kong, China
PakistanIndonesia
BulgariaThailand
Sri LankaViet Nam
SwitzerlandRepublic of Korea
CambodiaUkraine
United StatesMauritius
EgyptCroatia
Macao, ChinaThe former Yugoslav Republic of Macedonia
Taiwan Province of China

61
III(b). Percentage change
Figure III. United States imports of textiles by country and region, 2005 and 2006
III(a). Value in billion United States dollars
Source: Office of Textiles and Apparel, 2007.
WorldChinaIndia
PakistanCanadaMexico
ItalyRepublic of Korea
TurkeyTaiwan Province of China
JapanGermanyThailand
BrazilIsrael
IndonesiaFrance
United KingdomBelgiumPortugal
EgyptViet Nam
Iran, Islamic Republic ofNetherlands
SpainBangladesh
20.521.6
7.38.5
1.61.8
1.61.8
1.61.4
1.21.1
0.80.80.80.80.70.60.50.5
0.30.40.30.30.30.30.30.30.3
0.2
0.10.1
0.10.1
0.20.2
11
–1
629
1816
1217
12
5
3
12
1
10
1
12
5
207
127
169
1
–10
–8–5
–4–2
0
–12–9
–2–2
–8–21
–10
–13
–6–5
–2–8
–11–9
–1
–5–9
–1
–10
–17–3
–2
2005 2006
0.10.1
0.10.1
0.20.2
0.20.2
0.20.2
0.20.2
0.20.2
0.20.2
WorldChinaIndia
PakistanCanadaMexico
ItalyRepublic of Korea
TurkeyTaiwan Province of China
JapanGermanyThailand
BrazilIsrael
IndonesiaFrance
United KingdomBelgiumPortugal
EgyptViet Nam
Iran, Islamic Republic ofNetherlands
SpainBangladesh

62
B. Percentage change
Figure IV. United States imports of apparel by country and region, 2005 and 2006
A. Value in billion United States dollars
Source: Office of Textiles and Apparel, 2007.
WorldChina
CBICAFTAMexico
IndonesiaViet Nam
IndiaBangladesh
Hong Kong, ChinaHondurasCambodiaPhilippines
ThailandSri Lanka
GuatemalaDominican Rep.
PakistanEl Salvador
ANDEAN (ATPA)Italy
SUB-SAHARAJordan
CanadaMacau, China
Taiwan Province of China
–4
6
68.771.6
15.118.5
9.68.99.1
8.46.1
5.32.9
3.72.73.23.03.2
2.42.93.5
2.82.62.4
1.72.1
1.82.01.81.81.71.71.81.71.81.51.31.41.61.41.41.41.41.31.51.31.11.31.31.21.21.21.11.0
470
22
2028
618
347
2023
2025
39
02
72
1112
8
1316
–7–4
–8–9
–13
–9–20
–2–7
–7–8
–10–16
–6–13
–2–5
–3–17
–12
–15–8
–17–3
–27–11
2005 2006
WorldChina
CBICAFTAMexico
IndonesiaViet Nam
IndiaBangladesh
Hong Kong, ChinaHondurasCambodiaPhilippines
ThailandSri Lanka
GuatemalaDominican Rep.
PakistanEl Salvador
ANDEAN (ATPA)Italy
SUB-SAHARAJordan
CanadaMacau, China
Taiwan Province of China
63
B. Survival strategies
The post-ATC setting has provided an opportunity for all exporters to compete inglobal markets under more equal conditions, although the temporary quotas that werereintroduced by the European Union and the United States during the course of 2005 didnot make the quota removal process complete. In addition, tariff and non-tariff barriers ontextile and clothing products persist at levels that are higher than in other sectors.
The economic implications of T&C quota removal differ slightly across differenttheories of international trade. The “traditional trade theory” would predict increasedspecialization between countries with different endowments or technologies of produc-tion. Capital-abundant countries, for example, would tend to specialize in capital-, skill-and research-intensive segments of the industry.
The predictions of the “new trade theory” are not very different: high-incomecountries would also tend to concentrate on industries with high levels of innovation andin products on the upper quality segment. This specialization may be both vertical (i.e.,differentiation by product quality) and horizontal (i.e., differentiation by product variety),given that not only different product categories but also products in the same categorycan be produced with techniques of different capital, skill and research intensities.Nevertheless, the new trade theory allows for increasing returns to scale and productdifferentiation. Countries producing differentiated products will engage in intra-industrytrade, and larger volumes of trade will be observed between countries of relativelysimilar size.
The “economic geography theory”, unlike the other two theories, which do notaddress the spatial implications of trade, would predict that producers in the proximity ofthe large market would benefit first, leading to a formation of a core and periphery. Thecore would specialize in industries with increasing returns to scale, and spillovers shouldenforce the advantages of large markets as will forward and backward linkages. Theperiphery will specialize in low-wage industries, industries with less product differentia-tion and limited spillovers. This initial advantage, however, could be eroded with thedecrease in transportation costs, with the emergence of agglomeration dis-economies orwith a faster rise in wages in the core.
The analysis in this chapter suggests that the phase-out of textiles and garmentsquotas indeed prompted both developed and developing country producers to adopt newstrategies in their quest for survival in the global competitive arena. On the one hand,countries that had formerly underutilized their quotas (i.e., less efficient producers) wereput under increasing pressure to secure their markets. Formerly restricted producerswith high aggregate efficiency, on the other hand, were provided with the opportunity toenter previously unconquerable markets. In an environment that is increasingly based onmarket principles, exporting countries could choose their strategies according to theirrelative strengths. Some of the strategies adopted by producers include specialization,both vertical and horizontal, reorientation of markets and relocation overseas. Verticalspecialization, which involves differentiation by quality within the same product category,is often achieved through the upgrading of technology. In contrast, horizontal specializa-tion is differentiation by product variety.
The following preliminary analysis of available post-ATC data suggests that verticaland horizontal specialization have been adopted by OECD as well as developingproducers. The strategy of reorientation of markets has been followed by many developingcountry producers, while relocation has been typically adopted by OECD producers.
64
1. Vertical differentiation
A promising strategy for survival in the competitive arena, in particular for moreefficient, high-quality producers, is to differentiate their products by quality. For estab-lished high-quality producers this mainly means withdrawing from low-cost segments andfocusing on high value-added products. For latecomers, this strategy can be pursued by,for example, upgrading production technology. New technology facilitates achievinghigher aggregate efficiency, which in turn leads to a higher quality of every good (i.e.,produces the quality margin). Moving up the value-added chain induces vertical special-ization or differentiation by quality. The prerequisite for such a strategy is the acquisitionof new technology through imports or research and development, or both. Some of theproducers such as China, for example, have been very successful in adopting thisstrategy; in preparation for the post-ATC trading environment, China started to importadvanced textile machines mainly from Germany and boosted research and develop-ment investment in the textile and garments industry.
(a) Comparison of unit prices reveals evidence for some differentiation strategies
To examine which producers chose to differentiate their products vertically, acomparison of unit prices of different producers in third markets is performed, assumingthat unit prices reflect quality within the same product category (Ito and Fukao, 2005).Unit prices of major exporters in major OECD markets obtained from the United NationsComtrade Database are compared at the 6-digit level of the HS classification for 1990-2006, where available. Unit prices in the detailed product category are expressed interms of percentage of the “benchmark” unit price. These prices are then weighted byvalue shares and aggregated to the 2-digit level; then the share of products, defined as“similar” or “very different” in terms of quality from the benchmark, is calculated overtime.
In the United States market, Italian producers, for example, have clearly adoptedthe strategy of vertical differentiation. Nearly 80 per cent of other competitors’ productsare less than a quarter of the Italian unit price and only a few producers approach theItalian unit price (defined as within 10 per cent of the Italian unit price) in a limitednumber of product categories.
When choosing China as a benchmark, differentiation strategies of its majorcompetitors in the United States can be inferred. In the clothing categories (HS 60-63),among China’s top 10 competitors9 only Canada chose vertical differentiation intohigher-quality, higher-priced products (defined as at least double the Chinese unit price).However, Honduras, and pre-2005 Bangladesh and Pakistan decided upon lower-priced(defined as less than half the Chinese unit price) product, as shown in figure V(A).10
Figure V(B) shows that during the past 10 years, India and Indonesia have beenexporting products to the United States that are of similar quality as those from China,while Bangladesh, Pakistan and Viet Nam started adjusting their prices to those ofChina as of 2005. By 2006, more than half of all clothing exported to the United Statesmarket had a unit price very close to that of China (defined as within a 10 per centrange of the Chinese unit price).
9 Italy is not among China’s top 10 competitors.10 In the case of Honduras, the lower pricing may be related to geographical proximity.

65
Figure V. Positioning strategies of selected major competitors of China in theUnited States market, 1997-2006
A. Few exporters able to undercut Chinese prices (share of products with less than half theChinese price in per cent)
90
80
70
60
50
40
30
20
10
01997 1998 1999 2000 2001 2002 2003 2004 2005 2006
Bangladesh Honduras Pakistan Viet Nam
1997 1998 1999 2000 2001 2002 2003 2004 2005 2006
B. China clothing prices post-2005 (share of clothing exports within 10 per cent of Chinese unitprice in per cent)
50
45
40
35
30
25
20
15
10
5
0
Bangladesh India Indonesia Pakistan Viet Nam
Source: OECD calculation from United Nations Comtrade Database, 2007.
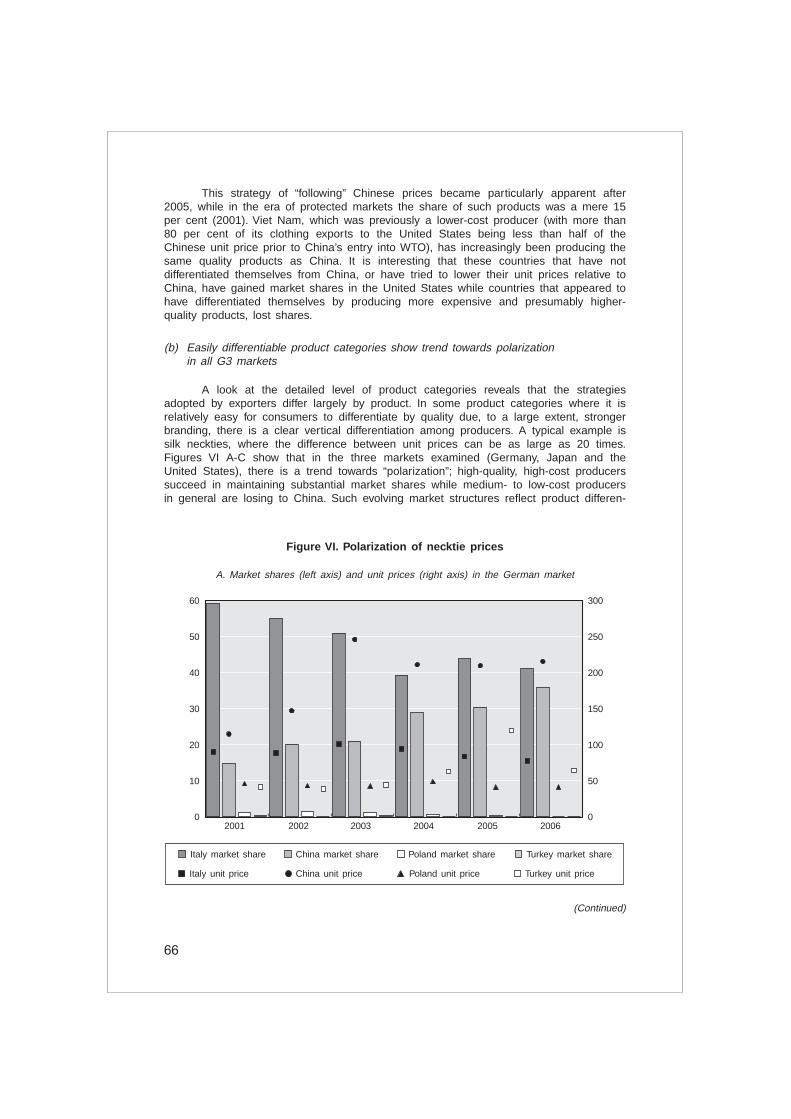
66
This strategy of “following” Chinese prices became particularly apparent after2005, while in the era of protected markets the share of such products was a mere 15per cent (2001). Viet Nam, which was previously a lower-cost producer (with more than80 per cent of its clothing exports to the United States being less than half of theChinese unit price prior to China’s entry into WTO), has increasingly been producing thesame quality products as China. It is interesting that these countries that have notdifferentiated themselves from China, or have tried to lower their unit prices relative toChina, have gained market shares in the United States while countries that appeared tohave differentiated themselves by producing more expensive and presumably higher-quality products, lost shares.
(b) Easily differentiable product categories show trend towards polarizationin all G3 markets
A look at the detailed level of product categories reveals that the strategiesadopted by exporters differ largely by product. In some product categories where it isrelatively easy for consumers to differentiate by quality due, to a large extent, strongerbranding, there is a clear vertical differentiation among producers. A typical example issilk neckties, where the difference between unit prices can be as large as 20 times.Figures VI A-C show that in the three markets examined (Germany, Japan and theUnited States), there is a trend towards “polarization”; high-quality, high-cost producerssucceed in maintaining substantial market shares while medium- to low-cost producersin general are losing to China. Such evolving market structures reflect product differen-
Figure VI. Polarization of necktie prices
A. Market shares (left axis) and unit prices (right axis) in the German market
60
50
40
30
20
10
0
300
250
200
150
100
50
02001 2002 2003 2004 2005 2006
Italy market share China market share Poland market share Turkey market share
Italy unit price China unit price Poland unit price Turkey unit price
(Continued)
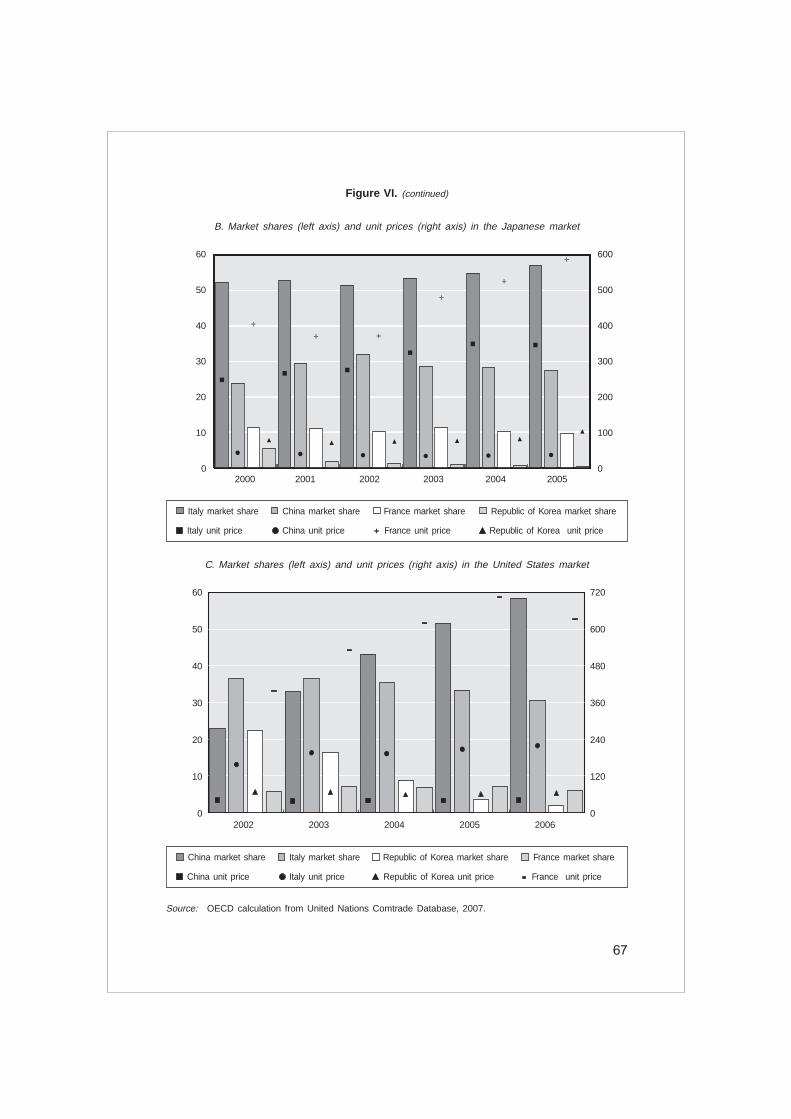
67
B. Market shares (left axis) and unit prices (right axis) in the Japanese market
60
50
40
30
20
10
0
720
600
480
360
240
120
02002 2003 2004 2005 2006
C. Market shares (left axis) and unit prices (right axis) in the United States market
Source: OECD calculation from United Nations Comtrade Database, 2007.
60
50
40
30
20
10
0
600
500
400
300
200
100
02000 2001 2002 2003 2004 2005
Italy market share China market share France market share Republic of Korea market share
Italy unit price China unit price France unit price Republic of Korea unit price
China market share Italy market share Republic of Korea market share France market share
China unit price Italy unit price Republic of Korea unit price France unit price
Figure VI. (continued)

68
tiation by quality as well as fierce competition in the lower-price segments. Differentprice elasticities of consumer demand may also carry some explanatory influence in thechoice of major exporters.
Notwithstanding some major common strategies of suppliers in the G3 markets,slight differences across markets remain. In the German market, Italy’s rising unit pricesfor silk neckties since 2001 has led to a decline in its market share from 60 per cent toslightly above 40 per cent just in five years. Nevertheless, Italy remains the largestexporter. China is catching up fast, however, with its market share having reachednearly 36 per cent by 2006. Viet Nam is the third largest exporter with rapid marketshare gains. In the Japanese market, there is a clear “polarization” trend; high-costproducers such as France, Italy and the United Kingdom are maintaining their marketshares, while medium- to low-cost producers are losing out to China. NotwithstandingChina’s rapid gains in terms of market share (from 0.1 per cent in 1990 to more than27 per cent in 2005), Italy succeeded in maintaining its share above 50 per cent. Thebiggest loser in the Japanese silk necktie market is the Republic of Korea, with itsmarket share declining from nearly 28 per cent in 1993 to 0.3 per cent in 2005.
In the United States market, Italy’s share has more than halved during the past15 years (from 65 per cent in 1991 to 30 per cent in 2006); however, Italy’s shareremains high despite the slight increase in the unit price. During the same period,China’s share increased from about 1 per cent to 58 per cent with only slight decreasesin the unit price. Similarly, in the United States market, high-cost producers such asFrance and the United Kingdom have maintained their market shares while medium- tolow-cost producers’ shares have dropped sharply. The Republic of Korea is a majorloser also in the United States market, with its share falling from above 25 per cent toless than 2 per cent during the five years to 2006.
(c) Prices of less differentiable products converge in Germany and Japan
In other product categories, where vertical specialization may be less feasibledue to the difficulty for consumers to differentiate between products by quality, unitprices have converged. A typical example is men’s cotton shirts, where prices ofdifferent producers had come very close to each other in the German market by 2006.The convergence in unit prices was accompanied with changes in market positions ofmajor exporters, particularly since 2005. The biggest gainer in the German market isChina, which increased its market share by 650 per cent from 1990 to 2006, to reach ashare of above 14 per cent in 2006. The bulk of the market share gain by China wasrealized between 2004 and 2005 as a result of the phasing out of quotas. Bangladesh,which was previously the biggest player, had been overtaken by not only China but alsoIndia and Turkey by 2006. Apart from China, some other producers previously con-strained by quotas such as India, Indonesia, the Lao People’s Democratic Republic,Malaysia, Myanmar and those in proximity such as the former Yugoslav Republic ofMacedonia, also gained market shares. Some smaller players exited the market verylikely due to economies of scale and/or high transportation costs. (This may be the casewith many Latin-American producers, such as Barbados, Bermuda, Bolivia and Cuba,which abandoned the German market).
The variation in unit prices of men’s cotton shirts in the Japanese market issimilarly limited. Although Japan has not imposed quotas, there have been significantchanges in market shares of major exporters over the past decades. The mostimportant change is China’s gain, its market share increased from a third in 1990 to

69
over three-quarters in 2005. At the same time, other countries such as India, Malaysia,Thailand and the United States lost market shares and some high-cost producers (e.g.,Belgium and Finland) exited the market. Given the fact that Japan did not imposequotas, this process can be considered as driven by market forces and characterized assurvival of the “fittest”.
(d) Much less convergence in the United States
In the United States market, the convergence of unit prices for men’s cottonshirts has been less extreme than in the German or the Japanese markets. Althoughprices of the most expensive exporter (Switzerland) can be as much as 50 times higherthan the prices of the cheapest exporter (Jamaica), their market shares are negligible.The top 20 producers in terms of market share set prices within the range of 300 percent of the lowest price with the exception of Italy, which differentiated into higher-qualitysegments, and set its prices above 400 per cent of its competitors’ average unit priceand more than 1,000 per cent of the lowest price.
It appears that the different post-2005 unit price evolution patterns of men’scotton shirts in the German and United States markets might be best explained by thedifferent trade policies adopted in reaction to the surge of Chinese imports after thephase-out of quotas. While both the European Union and the United States re-imposedquotas on Chinese products in 2005, the product categories subject to quotas differed.The United States target included woven shirts while the European Union target did not.This has resulted in more enhanced competition in this product category in Germany,while in the United States exporters not subject to quotas can offer lower prices thancan their Chinese competitors (and maintain higher market shares). In Japan, where themost efficient suppliers have not been restrained by quotas, unit prices of differentsuppliers move together.
2. Horizontal specialization
As a result of enhanced competition in major markets, many producers chose toconcentrate on fewer product categories in their quest to increase their market shares inthose markets. Apart from the efficiency gains related to the reduction of importsources, such a strategy also allows better exploitation of economies of scale, therebybenefiting both importers and producers.
The extent of the similarity of the different producers’ export structures isimportant, as it heavily influences their positions in third markets. Two countries with avery similar export commodity structure, for example, can differentiate their products byquality or, if their qualities are also similar, can enter into price competition in globalmarkets. In addition, they can geographically slice markets. This latter strategy, however,is usually not voluntarily chosen by exporters, but is driven by transportation costs orother factors such as bilateral or regional agreements, historical or cultural ties etc. Onepossible measure of the degree of similarity is the Kreinin-Finger (1979) index. If thecommodity composition of two countries’ exports is identical, this measure takes a valueof 100, while in case of complete dissimilarity the value of the index is 0. As producersface different competitors in different destination markets, the similarity of exportstructures is examined by market. In addition, given that the textile and clothingindustries generally need different endowments, similarities in exports of these twocommodities need to be looked at separately.

70
(b) China and India closer to OECD producers’ export structures but furtherfrom each other in Germany
In general, the major competitors’ export structures have become more similar inthe German market over time, but there are some clear trends of horizontal differentia-tion in some product categories. In the textile market (HS 50-59), the most significanttrend is the move by China up the value chain; while in 1990, it showed little similaritywith other producers except Hong Kong, China, by 2006 its export structure hasbecome closer to that of Italy or Poland. Bangladesh and India also export increasinglysimilar textile commodities as other producers to Germany, nevertheless the overlap oftheir exports with those of other countries still remains low. The developments in theclothing (HS 60-63) segment show a somewhat different pattern. Bangladesh reduced itsoverlap with other countries except Italy and Turkey between 1990 and 2006.
China, on the contrary, exports increasingly similar products to Germany asthose from high value-added producers such as Belgium, Italy and the Netherlands, andless similar ones, for example, to those of India. India, while it has reduced its overlapwith China over the past 15 years, has increased it with Italy and the Netherlands.These findings suggest that there is a certain degree of horizontal differentiation in theGerman clothing market – lower-cost producers try to avoid competition with each otherand, instead, move into product categories supplied by higher-cost exporters.
A glance at a more disaggregated (2-digit) level reveals that the overlap betweenChinese and Indian exports has been limited in non-knitted or crocheted clothing (HS62) and the other made articles (HS 63) categories. Even in knitted or crochetedclothing it has decreased. Analysis of 4-digit data further indicates that the decrease ofoverlap between Chinese and Indian exports to Germany is, to a large extent,attributable to the withdrawal of Indian producers in several categories (includingwomen’s ensembles, brassieres etc.).
(c) A clear trend of horizontal differentiation among most suppliers in the United States
Trends in the United States textile and clothing market are somewhat differentfrom those in Germany. In particular, among textile exporters there is a clear horizontaldifferentiation. In 1991, China, India and Pakistan exported very similar products and theoverlap between exports from Honduras, Hong Kong, China and Indonesia was alsosignificant. Mexico and Indonesia also had some similarities, but exports by Bangladeshwere very distinct. By 2006, the overlap between exports from Bangladesh and othercountries had increased somewhat, but remained very low. Moreover, the exportstructures of all the other countries (except that of Mexico and Viet Nam, and Mexicoand Canada) have become increasingly dissimilar.
In clothing, the general trend is a decreasing overlap of products but the exportstructure of China has come close to identical to those of other exporters such asMexico and India. The same tendency is observed for Indonesia and Viet Nam as wellas Hong Kong, China and Viet Nam. This can be explained by the increasing range ofproducts that China and some other exporters deliver to the United States market.Another clear trend is the significant decrease of the overlap between Honduras andmost other suppliers. In 1991, Honduras had a very similar export structure toBangladesh, Canada, China, Hong Kong, China, Indonesia and Mexico; however, by2006, it only had high overlap with Hong Kong, China. Honduras, being a small countrywith a limited variety of products it could produce with reasonable economies of scaleas well as inadequate backward linkage facilities and heavy reliance on imported

71
fabrics, had not been able to increase the range of goods to the extent its competitorshad done. It has even exited some product segments (e.g., men’s cotton pyjamas)during the past 15 years (see box 1).
Box 1. Impact of ATC phase-out in Honduras
By restricting the export growth of competitive clothing industries, MFA quotasopened the door to the global market for the apparel sector in Honduras. Given thesepreferential trading conditions, foreign investment from the United States and Asiahelped to establish a thriving apparel industry in Honduras. The removal of MFA quotasand the associated erosion of preferential access triggered a decline, causing theHonduras’ share of the United States market to decline from 3.09 per cent in 2004 to2.57 per cent by 2006. Additionally, the country’s impressive escalation from the UnitedStates’ thirty-first largest supplier of apparel products in 1991 to the seventh largestsupplier in 2002 stalled and then slipped to tenth largest supplier in 2006 (UnitedNations Comtrade Database, 2007). Despite the country’s close geographic andbusiness relations with United States apparel firms, MFA expiration threatens theadolescent textiles and clothing industry. Strengthened relations with internationalcompanies and increased investment in the textile industry and vertically integratedenterprises, however, could support Honduras’ struggle with global competition.
The collective shift of the Caribbean Basin (namely, Central America and theCaribbean) into the apparel industry began in the 1950s. At the time, new govern-ment policies promoted offshore production, and United States apparel firms showedincreased interest in the Caribbean’s cheap labour supply and geographic proximity.In the 1960s and 1970s, export-oriented industrialization became more popularamong Latin American governments, prompting the growth of many export-processingzones (EPZs). However, export-led growth did not take hold until 1984 when theCaribbean Basin Initiative improved political stability and economic cooperation withthe United States. The Special Access Programme, more widely known as the 807Rule, further contributed to the sector’s development in 1986 by allowing low-incomecountries such as Honduras to export unlimited amounts of apparel to the UnitedStates if the apparel was made from United States-cut fabrics. Following theintroduction of this rule, “production-sharing” became a common practice for Carib-bean apparel industries.
Currently maquiladoras are the most common type of apparel firm in Hondu-ras, and they have made a notable contribution to the decrease of the country’s highunemployment. While this initially augmented the growth of apparel sectors, the rawmaterial conditions discouraged development of many local textile sectors, thushindering the possibility of developing full-package manufacturing plants. Despite theincentives structure that promoted imports of fabric, several firms have integratedbackwards by acquiring fabric production plants, thus demanding an expansion of theHonduras textile industry (Bair and Peters, 2006). Textile integration has grantedautonomy to many Honduran companies although the textile industry as a wholeremains in an infant state. As of 2005, CAFTA had encouraged the development ofthe textile industry by authorizing the use of raw materials from any member country.These developments appear to have strengthened the roots of the Honduran apparelindustry and fortified its response to MFA expiration. Yet, Asian competitors haveoperated vertically integrated enterprises for decades.
(Continued)

72
Box 1. (continued)
Foreign involvement in Honduran clothing production has solidified the country’srole in the global apparel market. United States investment in Honduran export-processing plants has played an integral part in the preliminary transfer of industrialtechnology and the development of United States-Honduran trade relations since the1990s. As illustrated in table 5, the United States has monopolised Honduran exportssince granting preferential treatment in 1991, taking advantage of the short lead timesgenerated by the geographic proximity of Honduras. A study by Ozden and Sharma(2006) found that 8.5 per cent to 9.5 per cent of the average export price increase inHonduras, Costa Rica and the Dominican Republic could be attributed to United Statespreferential access schemes. Asian investors have also shown a strong interest inHonduras, funding the majority of Honduran textile factories. As Chinese companies lookto expand globally, the Honduran clothing industry offers an attractive investmentbecause of CAFTA’s duty-free access to the United States market.
The stagnation of most Caribbean Basin apparel sectors since 2000 mirrorsthe progressive expiration of MFA quotas. Honduras’ growth rates have slowed aswell, relative to the exponential growth rates achieved in the 1990s, but the industryhas concurrently adapted and advanced in recent years to prepare for increasedlevels of global competition. Honduras’ progression from production sharing to full-package manufacturing and, especially, to vertically integrated production is central tothis development. A vertically integrated industry comprising local production oftextiles offers Honduras a strong competitive advantage over regional competitorswho have not evolved from United States-dependent maquiladora production, avulnerable form of enterprise plagued by low barriers to exit.
While Honduras has achieved record growth rates and captured market sharefrom other Caribbean Basin competitors such as Jamaica and Haiti, the concentrationof quota-sensitive apparel products in the last stage of MFA expiration posed asignificant threat. Knitted T-shirts, knitted jerseys, and sweaters comprise the majorityof Honduras’ export product range (Bair and Peters, 2006). As these productspreviously were protected by high quota constraints, Honduras now faces directcompetition from China. Product differentiation would help to protect Honduras in theglobal market, but the industry has made limited efforts in that direction.
Table 5. Top 10 destinations of Honduran apparel exports
(Unit: Percentage)
1990 1991 1992 1993 1994 1995 1996 1997 1998 1999 2000 2001 2002 2003 2004 2005 2006
United States .. 98.9 97.2 97.1 96.8 97.6 97.6 97.8 97.4 97.7 97.2 96.8 96.0 95.9 93.8 93.4 95.1Canada 15.1 0.2 0.3 0.4 0.5 0.7 0.9 0.9 1.2 1.2 0.9 1.3 1.8 1.4 1.8 1.8 2.2Casta Rica .. .. .. .. 0.6 0.2 0.2 0.2 0.2 0.1 0.1 0.1 0.2 0.2 0.3 1.0 1.0Mexico 36.5 0.3 0.1 0.0 0.2 0.0 0.1 0.1 0.1 0.1 0.1 0.2 0.2 0.2 0.4 0.6 0.7Belgium .. .. .. .. .. 0.0 0.0 0.0 0.0 0.1 0.7 0.5 0.5 0.5 0.6 0.4 0.6Japan 1.0 0.0 0.0 0.1 0.1 0.1 0.2 0.2 0.3 0.3 0.3 0.3 0.4 0.3 0.3 0.3 ..United Kingdom .. .. .. 0.1 0.1 0.1 0.1 0.0 0.0 0.0 0.0 0.0 0.0 0.2 0.3 0.2 ..France .. .. .. .. 0.1 0.1 0.1 0.1 0.1 0.1 0.1 0.1 0.1 0.1 0.2 0.2 ..Guatemala .. .. .. 0.4 0.2 0.2 0.2 0.2 0.2 0.1 0.1 0.1 0.2 0.4 0.3 0.2 ..Germany 37.1 0.5 0.6 0.2 0.1 0.1 0.1 0.0 0.0 0.0 0.0 0.1 0.1 0.1 0.1 0.1 0.2Total top 10 0.0 0.2 0.4 0.5 0.7 1.0 1.3 1.8 2.0 2.3 2.5 2.6 2.7 2.7 2.9 2.9 2.7
Source: United Nations Comtrade Database, 2007.

73
(d) In world markets, Chinese exports have become less similar to those ofBangladesh or India
To complement the above analyses of similarities of export structures, theSpearman correlation coefficients of revealed comparative advantage (RCA) indices ofthe top 10 exporters and their most dynamic competitor, China, are calculated. Thecorrelation index takes values between +1 and -1, with positive values showing that acountry specializes in similar products as China and with negative values showingdissimilarity of export structures. As figure VII indicates, China’s textile export structurehas become less dissimilar to that of the United States as a result of China’s move intohigher value-added textiles segments. At the same time, China is exporting increasinglysimilar products to those of India and Italy and less similar products to those ofBangladesh and Hong Kong, China. These findings support the catching up hypothesis:China is moving into more capital- and technology-intensive product segments and isimproving the quality of export goods. The Spearman correlation coefficients of RCAs inthe clothing market reveal some different trends (figure VIII). Compared with 1995,China exported more products in 2005 that were dissimilar to those exported by Italy,Mexico, Turkey and the United States, and less dissimilar ones compared with France.The similarity with Bangladesh and India, on the other hand, decreased during thesame period. A possible reason for this finding is that China has basically diversified itsexport structure, moving into all categories and gaining export shares more rapidly thanits competitors. This could have happened by the acquisition of foreign firms thatproduce a wider array of products.
Figure VII. Textile trade specialization of China vis-à-vis its top 10 competitors
Spearman rank correlation coefficients of RCA indices, textiles
0.6
0.5
0.4
0.3
0.2
0.1
0.0
–0.1
–0.2
–0.3
–0.4
–0.5
–0.6United Belgium Germany Mexico France Turkey Bangladesh India Italy Hong Kong,States China
1996 2005
Source: OECD calculation based on United Nations Comtrade Database, 2007.

74
(e) China’s revealed comparative advantage in labour-intensiveproducts is decreasing
The revealed comparative advantage reflects a country’s relative strength inexporting different types of commodities. The RCA index – which measures a country’sexport share for a commodity and compares it with the world export share of thatcommodity – is calculated at the 4-digit level of textiles and clothing categories for1996-2005. In design-intensive goods where quality is easily differentiable, such asneckties, Italy has the highest revealed comparative advantage among the countriesexamined. Moreover, its RCA increased during the past 10 years. Bangladesh, forexample, appears strong in labour-intensive manufactures such as men’s shirts and T-shirts, with the highest RCA values in the group. China’s revealed comparative advan-tage shows a declining trend in labour-intensive products such as men’s shirts and T-shirts, and an increasing trend in neckties. This is additional support for the catching upview. This, however, does not mean that China may not be competitive in thesesegments in the world market. The RCA index simply reveals the performance of acommodity relative to other commodities; thus, it reflects more on the pattern ofspecialization rather than competitiveness per se. In other words, Chinese textiles andgarments may be competitive in the world market, but other industries may be evenmore competitive. India’s RCA has also increased for neckties, although it is still verylow. India also shows an increasing RCA in T-shirts, but its RCA in men’s shirts hasdecreased.
Figure VIII. Clothing trade specialization of China vis-à-vis its top 10 competitors
Spearman rank correlation coefficients of RCA indices, clothing
0.7
0.6
0.5
0.4
0.3
0.2
0.1
0.0
–0.1
–0.2
–0.3
–0.4
–0.5
–0.6United Belgium Gemany Mexico France Turkey Bangladesh India Italy Hong Kong,States China
Source: OECD calculation based on United Nations Comtrade Database, 2007.
1996 2005

75
3. Reorientation of markets
During the quota system under ATC, the major way to expand export markets bythe most productive producers was to enter into new markets or increase sales inmarkets that did not impose quotas. Before 2005, this led to a diversification trend ofexport markets for rapidly-growing producers such as China. With the phase-out ofquotas, these producers started to gain market shares in Canada, Europe and theUnited States, and a larger share of their exports was directed to these markets. Asfigure IX indicates, countries previously restricted by quotas (such as Bangladesh, Chinaand India) have reversed their trend of market diversification to market concentration in2005. This reversal was sharper for Bangladesh and India, whose top 10 export marketshad been countries with quota restrictions. China, on the other hand, had importantmarkets such as Australia, Hong Kong, China, Japan and the Republic of Korea that didnot impose quotas among its top 10 markets; therefore, the reversal towards marketconcentration is not as drastic as India’s. On the contrary, countries not affected byquotas, such as the OECD members, did not show any significant change in theirexport market structure in 2005.
The phasing out of quotas has also brought about temporary market share gainsfor less efficient producers. As theory suggests, quotas add extra margins to the exportprice and limit the export volumes to quota-imposing countries, while there is excess
Figure IX. Producers previously restricted by quotas consolidatetheir export markets
Percentage share of top 10 export markets in total textile and garment exportsby selected major producers
Source: OECD calculation based on United Nations Comtrade Database, 2007.
90
85
80
75
70
65
601999 2000 2001 2002 2003 2004 2005
Bangladesh Belgium China France
Germany India Italy United States
76
capacity in the rest of the world (assuming that at least some of the producers expandproduction at a faster pace than market growth in the markets affected by quotas, ashas been the case), bringing down prices. Lower prices create extra demand in thosecountries. With the removal of quotas, the logic is supposed to work the other wayaround – exports to the previously quota-imposing countries should surge due toredirection from non-quota imposing countries. The example of China clearly illustratesthis fact; in 2005, there was a sharp increase in the share of China’s exports toCanada, Europe and the United States while some other major markets, such as Japanand the Republic of Korea, had a smaller share of exports. It should be noted, however,that in the case of Japan this was also due to the fact that Chinese exports grew muchfaster than Japanese demand.
(Continued)
Box 2. Uncertain times for Malagasy apparel
Madagascar offers a prime example of a low-income country drawn into theapparel industry by MFA quota protection and preferential treatment schemes. Bylimiting competition from other exporting countries and redirecting foreign investmentto Madagascar, these programmes have facilitated the global establishment of thisemerging industry. Madagascar is a particularly interesting case because of itsdramatic growth period from 1990 to 2001, during which its clothing sector was oneof the fastest growing industries in sub-Saharan Africa. In 2002, the industry endureda severe downturn due to a political crisis, and then rebounded to pre-crisis exportlevels by 2004 due to the depreciation of the Malagasy currency (a temporarydefence against the pending MFA expiration). To surmount the long-term implicationsof MFA expiration and compensate for the country’s reputation for political instability,Madagascar should increase the industry’s competitiveness by (a) boosting invest-ment and vertically integrating the textile industry, (b) promoting synergies within theexport-processing zones and smaller companies, and (c) specializing in niche prod-ucts that circumvent direct competition with China.
The swift development of Madagascar’s clothing industry in the 1990s can beattributed to three main factors. First, Malagasy exports were promoted as analternative to exporting countries restricted by the Multi-Fibre Arrangement. Second,duty-free access for clothing imports to the European market was granted by theEuropean Union Cotonou Agreement programme and reaffirmed in 2001 by the“Everything but Arms” (EBA) initiative. Last, Madagascar profited from the AfricaGrowth and Opportunity Act (AGOA) programme, which granted duty-free access tothe United States market for clothing products from sub-Saharan Africa, with aprovision for the use of local fabric until September 2007. The impact of AGOA onMadagascar’s clothing industry is evident from the increase in foreign investment afterthe scheme was announced in 1997 and the 114 per cent growth in Malagasyapparel exports from 1997 to 2001 (Tait, 2002).
Stimulated by these programmes, Madagascar has established itself in theglobal clothing market, primarily in the role of an apparel assembler. The industrygrew from a handful of factories in the 1980s to approximately 115 factories in 2005(Sedowski, 2006). Meanwhile, the country’s textile industry remains underdevelopeddue to insufficient cotton production and lack of investment in production technologiesby Madagascar. The country’s three textile mills cannot meet demand, so most

77
(Continued)
Box 2. (continued)
production units are imported from China, a low-cost alternative, and Mauritius, aqualifying LDC AGOA supplier.
The Multi-Fibre Agreement first facilitated the establishment of Madagascar’sapparel industry by promoting triangular manufacturing arrangements. In response toMFA quota restrictions, middle-income countries began to subcontract all or part of aproject to less developed countries, thus developing fledgling industries such asMadagascar’s apparel sector. As Malagasy apparel firms became more established,they capitalized on these investments by forming direct relationships with buyers,particularly from Europe.
The growth of Madagascar’s clothing industry is also largely attributed toforeign investment from Mauritius, which was attracted by Madagascar’s cheap laboursupply. Concurrently, Madagascar’s thriving French expatriate population facilitated aninflux of foreign investment into the expanding industry. Asian investors (chiefly China,Malaysia, Pakistan, Singapore and Hong Kong, China), quickly followed suit in the1990s. In addition, since the launch of AGOA, several Middle Eastern companies(particularly from Saudi Arabia and the United Arab Emirates) have also invested inthe Madagascar apparel sector (Tait, 2002).
Among the various national development initiatives, the introduction of EPZsin 1990 had the greatest impact on the growth of the clothing and textile industry.Taking advantage of MFA quota protection, duty-free inputs for 95 per cent of exportsattracted many new market entrants and the development of three major productioncentres. These government-subsidized zones aimed to increase foreign investmentthrough duty exemptions, tax deferral and drawback schemes, and a 10-per cent taxon dividends (Tait, 2002). The EPZs of Madagascar and Mauritius have beenparticularly successful in that they offer EPZ benefits to firms that are locatedanywhere in the country. Interestingly, the EPZs still suffered in the 2002 politicalcrisis because of the industry’s low barriers to exit, but they were also the bestequipped to bounce back (Cling and others, 2005).
Despite the apparel industry’s quick recovery after the political crisis, theability of the country to withstand the expiration of preferential treatment schemes isunclear. Madagascar’s physical infrastructure severely limits the development of thetextile and clothing industry. This involves rent, electricity and administrative costs,and Madagascar’s overhead charges have become a serious consideration forpotential investors. The country has an inefficient transportation system; the roadsystem is deficient, port facilities are in poor condition, and export lead times arelong because the country is not on a direct shipping route (exports must be shippedvia Durban in South Africa). In addition, the country’s deficient training facilities arelimiting the development of skilled labour and contributing to the industry’s lowproductivity rates.
Despite infrastructural setbacks, however, exports to the European Unionmarket have grown since 2004. Interestingly, exports to the United States haveconcurrently fallen (figure X). Madagascar’s share of the United States market fellfrom 0.38 per cent in 2004 to 0.25 per cent in 2006, primarily because of a decrease
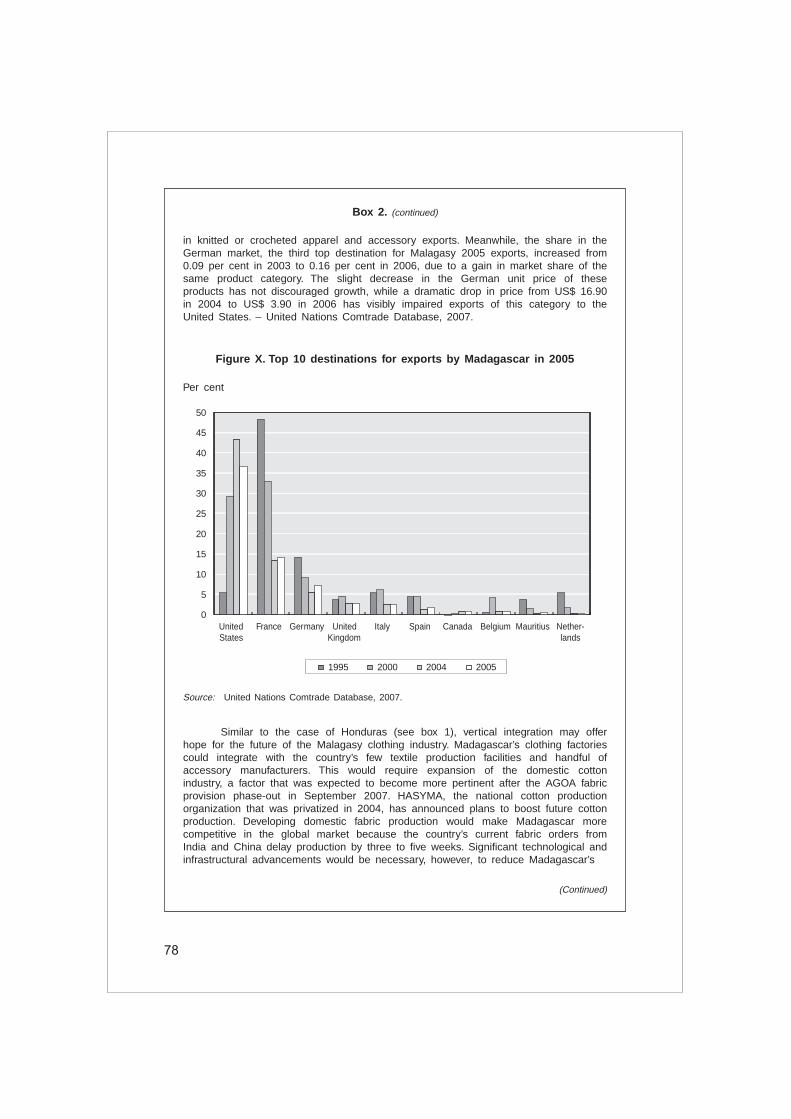
78
Figure X. Top 10 destinations for exports by Madagascar in 2005
Per cent
50
45
40
35
30
25
20
15
10
5
0United France Germany United Italy Spain Canada Belgium Mauritius Nether-States Kingdom lands
1995 2000 2004 2005
Source: United Nations Comtrade Database, 2007.
(Continued)
Similar to the case of Honduras (see box 1), vertical integration may offerhope for the future of the Malagasy clothing industry. Madagascar’s clothing factoriescould integrate with the country’s few textile production facilities and handful ofaccessory manufacturers. This would require expansion of the domestic cottonindustry, a factor that was expected to become more pertinent after the AGOA fabricprovision phase-out in September 2007. HASYMA, the national cotton productionorganization that was privatized in 2004, has announced plans to boost future cottonproduction. Developing domestic fabric production would make Madagascar morecompetitive in the global market because the country’s current fabric orders fromIndia and China delay production by three to five weeks. Significant technological andinfrastructural advancements would be necessary, however, to reduce Madagascar’s
Box 2. (continued)
in knitted or crocheted apparel and accessory exports. Meanwhile, the share in theGerman market, the third top destination for Malagasy 2005 exports, increased from0.09 per cent in 2003 to 0.16 per cent in 2006, due to a gain in market share of thesame product category. The slight decrease in the German unit price of theseproducts has not discouraged growth, while a dramatic drop in price from US$ 16.90in 2004 to US$ 3.90 in 2006 has visibly impaired exports of this category to theUnited States. – United Nations Comtrade Database, 2007.
79
4. Relocation of production facilities
The quota system under ATC was an important determinant of the location offoreign direct investment (FDI) in textiles and garments. Multinationals aiming at re-exporting to the host country had been constrained in increasing their investment incountries where quotas were binding, and they had been forced to expand in countriesthat may have had lower production efficiency. Similarly, exporter countries with highproductivity but full utilization of quotas established production facilities in countries withlower productivity but under-utilized quotas or in countries not subject to quotas. Thisresulted in dispersed production of textiles and clothing around the globe, implyinginefficiencies.
The removal of the quota system, not surprisingly, accelerated the efficiency-enhancing consolidation wave that had started earlier in the industry. This consolidation/relocation wave, together with declining trade barriers, has also been driven bydecreasing services costs, including transportation, and has allowed for further slicing ofthe value-added chain (Jones and Kierzkowski, 1990). Production plants both from low-cost, low-productivity and high-cost, high-productivity countries are relocating to the mostproductive, relatively low-cost countries.
The move to a more efficient global production system, however, involvesadjustment costs that may be sizeable in the short term. These adjustment costs mayincur in the form of output and employment losses related to relocation overseas. Using
Box 2. (continued)
current lead-time on orders (six to seven weeks) to an efficiency level competitivewith Indian and Chinese suppliers.
The apparel industry’s chance of long-term survival would also improve byincreasing synergies between Madagascar’s many small, adolescent companies.USAID has initiated the JUMPSTART programme to promote the development ofsmall and mid-sized firms. Meanwhile, the European Union has developed a cluster-ing organization called Text’lle Mada, to facilitate the pooling of knowledge andproduct specializations. The cluster appears to have increased the apparel sector’scompetitiveness in the global market by decreasing costs and by uniting companiesin offering a broader range of services to overseas clients and competing with Chinafor large orders.
Product specialization would also increase Madagascar’s competitiveness inthe global market. Wadding, felt, non-wovens, yarns, twine and cordage, which havebeen exported to Germany since 1994, offer a potential niche market for Madagascar.These products comprised 0.12 per cent of the German market share and 0.02 percent of the United States market share in 2006. While nearly all categories of apparelexports are growing, this product category remains a minor export category for China.Additionally, Madagascar can offer a price advantage, exporting for US$ 1.70 to theGerman market versus China’s average unit price of US$ 4.40 (United NationsComtrade Database, 2007). Further investment in the development and promotion ofthese products in the United States and European markets would allow Madagascarto sidestep Chinese competition.

80
time series industry data, Molnar and others (2007) estimated the labour marketimpacts in OECD countries of overseas relocation and found that there was heterogene-ity across industries. Robust to the way of specification, the findings show thatemployment in the services industries is positively affected by moving overseas, while inthe manufacturing sectors the effect depends on whether the sector has strongcommercial ties (in terms of the share of imports and outward FDI) with non-OECDcountries. In the industries with the strongest ties with non-OECD countries, such astextiles and garments, food and beverages, electronics and transport equipment, there isa strong negative effect of outward investment on domestic employment, while in othermanufacturing industries such as pulp and paper, chemicals, metals and machinery, nosignificant impact is found.
Furthermore, according to the study, in sectors with strong ties to non-OECDcountries, increasing relocation overseas raises long-term wage elasticity as well as thespeed of adjustment of domestic employment. In the services sectors, on the contrary,overseas investment reduces the speed of adjustment of domestic employment. Theabove findings suggest that in certain manufacturing industries, particularly textiles andgarments, overseas and domestic employment may be substitutable to a certain extent,while in services they are somewhat complementary. Analysis of the relationshipbetween overseas and domestic employment in the G3 countries shows that they aresomewhat complementary in the United States and substitutes in Japan, while forGermany there are no significant results.
C. Conclusion
This chapter provides a preliminary insight into the economic impacts of the ATCphase-out in 2005 and the strategies adopted by exporters in its anticipation. It is clearthat developments in the first few months immediately following the last stage of ATCwere inspired by the back-loading of quota removal. The increases of imports to theEuropean Union and the United States of several hundred or even several thousand percent on many textile and clothing items prompted the introduction of temporarysafeguards that intermittently overturned or slowed down the adjustment process. Thefact that some of the exporters who experienced declining exports to the EuropeanUnion following the abolishment of quotas in the first few months of 2005 were gainingtheir market shares back in the 2006, and the fact that this did not happen in theUnited States market where the trends from 2005 continued, suggests that temporarymeasures introduced by the European Union might have been more binding eventhough it is also clear that impacts varied by product category.
Temporary quotas have curbed the surge in imports from China, but each yearChina’s competitors in these markets are put under increasing pressure. As far as themost current data (January-March 2007) are concerned, in both the European Unionand the United States markets an increase in the imports of textiles and apparel fromChina are observed from the same period in 2006, which suggests acceleration withregard to the rate of growth for the whole of 2006.
The anticipation of the new post-MFA environment based on market principles aswell as the liberalization already effectuated within ATC prior to 2005, prompted anadoption of new survival strategies. A promising strategy adopted by mainly high-cost,high-quality producers was vertical specialization. Whether this strategy can be adoptedlargely depends on the type of the product; where consumers can differentiate byproduct quality (e.g., silk neckties), it has been seen as a successful choice, but where
81
it is hard for consumers to differentiate across different qualities, price competition aroseinstead. For this latter type of product (e.g., men’s cotton shirts and T-shirts), Chinaemerged as the major supplier, forcing other exporters to lose market shares or exit themarket.
As vertical specialization appears to be a viable option mainly for high-qualityproducers, some exporters in the lowest segments have adopted horizontal specializa-tion to maintain or gain market shares. This appears to be the strategy in particular forsmaller producers who cannot possibly compete in a wide range of products due tolimited economies of scale. To exploit economies of scale in production and transporta-tion, for these producers it is essential to identify their niche products with comparativeadvantage and focus on fewer destinations. Relocation of production facilities nowtargets lower-cost, high-productivity large-size countries. Multinational enterprises havelong since started this process and had been limited in such expansion by the quotasystem. Relocation from low-income, low-productivity countries is not yet seen as amajor trend; however, with the removal of quota restrictions, a certain degree ofconsolidation is foreseen in low-cost, high-productivity countries.
The consequences of the phase-out differ across exporters, and their prepared-ness is playing a role in how they manage to cope with competitive challenges in moreopen markets. Exporters with low costs and high productivity such as China, India and,to a lesser extent, Pakistan and Viet Nam have succeeded in benefiting from enlargedmarkets, while the phase-out has brought about challenges for OECD and small-countryproducers. A major challenge in OECD countries is how to cope with decreasing labourdemand in the textile and clothing industries as a result of relocation, while in low-income countries the challenge is how to specialize in products and markets in order tostay afloat. This latter group of countries have been given further time for adjustment,which should be better exploited to prepare for fiercer competition in the global textileand clothing markets, especially by learning from the experience prior to the phase-out.

82
Bair, J. and E. D. Peters, 2006. “Global commodity chains and endogenous growth:Export dynamism and development in Mexico and Honduras”, World Develop-ment, vol. 34, No. 2; pp. 203-221.
Cling, J-P., M. Razafindrakoto and F. Ribaud, 2005. “Export processing zones inMadagascar: A success story under threat?” World Development, vol. 33, No. 5;pp. 785-803.
Eurostat COMEXT, 2007. European Commission, Brussels.
Ito, K. and K. Fukao, 2005. “The vertical division of labour and Japanese outward FDI:Impacts on human capital deepening in Japan”, mimeograph.
Jones, R. W. and H. Kierzkowski, 1990. “The role of services in production andinternational trade: A theoretical framework”, in R. W. Jones and A. O. Krueger(eds.), The Political Economy of International Trade: Essays in Honour of RobertE. Baldwin. Oxford, Basil Blackwell.
Kreinin, M. E. and J. M. Finger, 1979. “A measure of export similarity and its possibleuses”, The Economic Journal, vol. 89.
Molnar, M., N. Pain and D. Taglioni, 2007. “The internationalisation of production,international outsourcing and employment in the OECD”, OECD EconomicsDepartment Working Paper 561. Paris.
Nordas, H. K., 2005. “The global textile and clothing industry, post the agreement ontextiles and clothing”, Discussion Paper No. 5, World Trade Organization, Geneva.
OECD, 2005. Trade and Structural Adjustment – Embracing Globalisation. Paris.
, 2004. A New World Map in Textiles and Clothing – Adjusting to Change. Paris.
Office of Textiles and Apparel, 2007. United States Department of Commerce, Washing-ton, D.C.
Ozden, C. and G. Sharma, 2006. “Price effects of preferential market access: CaribbeanBasin Initiative and the apparel secto”, World Bank Economic Review, vol. 20,No. 2; pp. 241-259.
Reinert, K. A., 2000. “Give us virtue, but not yet: Safeguard actions under theAgreement on Textiles and Clothing”, The World Economy, vol. 23, No. 1; pp. 25-55.
Sedowski, L., 2006. “Hanging by a thread? The post-MFA competitive dynamics of theclothing industry in Madagascar”, PhD thesis, University of KwaZulu-Natal,Durban, South Africa.
Tait, N., (2002. “Prospects for the textile and clothing industry in Madagascar”, TextileOutlook International, March-April 2002; p. 131.
REFERENCES

83
United Nations Comtrade Database, 2007. United Nations, New York.
World Trade Organization, 2006. World Trade Report 2006. Geneva.
, 2004. “Comprehensive report of the Textiles Monitoring Body to the Council forTrade in Goods on the Implementation of the Agreement on Textiles and Clothingduring the third stage of the integration process”, G/L/683. Geneva.

84

85
III. STATUS OF PROTECTION FACING EXPORTERS OFTEXTILES AND CLOTHING FROM ASIA AND THEPACIFIC IN THE NORTH AND SOUTH MARKETS
By William E. James
Introduction
Textiles and clothing were identified with export-oriented, manufacturing-ledgrowth throughout East and South-East Asia in the latter half of the previous century.South Asian countries have initiated a similar process of growth in these critical sectors,by far the largest industrial branch within the South Asian region in terms of GDP,exports and employment. The emergence of China as a major textile and clothingproducer and supplier to world markets has been facilitated by China’s accession in late2001 to WTO. All the countries in the region have been strongly affected by theachievement of global trade liberalization through ATC, which gradually reintegratedtextiles and clothing into the multilateral trade regime during 1995-2004. A process ofconsolidation of the industry has unfolded with the abolition of the global system ofquota restrictions on trade in textiles and clothing. Small and marginal clothing suppliershave exited the market, and market shares of competitive Asian suppliers in themarkets of the OECD countries have consequently grown. Textiles production is alsobeing consolidated, with only the largest suppliers likely to be left standing at the end ofthe process.
Predictions that Asian suppliers would collapse in countries such as Bangladesh,Cambodia, Indonesia, the Philippines, Sri Lanka, among others, have turned out to beunduly pessimistic. In fact, the performance of most developing Asian suppliers in worldmarkets has been quite good (Asian Development Bank, 2006). Furthermore, eventhough China has attained a predominant position in world production and exports,textiles and clothing are occupying a shrinking proportion of China’s national exportbasket as more sophisticated manufactures – especially in machinery and chemicals,and allied industries – become more important (Asian Development Bank, 2007).
A threat to the future development of the textiles and clothing industries withindeveloping Asia and Pacific economies, however, exists in the increasing proliferation ofpreferential trade agreements involving major industrial markets and developing coun-tries. It is estimated that more than 300 bilateral free trade agreements (FTAs) are likelyto be in force by the end of 2008, many of which impose restrictive rules of origin andhigh margins of preference in the textiles and clothing industries with a view toprotecting the domestic producers within each bilateral trade agreement (Asian Develop-ment Bank, 2006). Moreover, a recent study of FTAs entered into by Asia-Pacificcountries noted that the agreements between an Asian partner and non-regionalpartners tended to provide more favourable market access in textiles and clothing thandid agreements involving two Asian partners (James, 2006). For example, the Republicof Korea-Chile FTA offers immediate duty-free access to the Korean market for Chileantextile and clothing exports, but the Republic of Korea-Singapore FTA only phases outtariffs on textiles and clothing over a 10-year period. In addition, rules of origin tendto be more restrictive for intra-Asian trade partners than for non-regional partners.Hence, Asian bilateral agreements, such as those in Europe and the western hemi-sphere are creating a more complex and difficult trade environment for Asian suppliersof textiles and clothing.

86
The impasse in global trade negotiations in the Doha Round and the likelydemise of the Trade Promotion Authority of the Bush administration in July 2007 meanthat initiatives to further liberalize multilateral trade in these sectors are unlikely to takeplace any time soon. To some extent, unilateral initiatives taken by select OECDcountries to provide duty-free and quota-free access to designated LDCs or to otherdesignated low-income countries may offset the failure of Doha. However, theseinitiatives in themselves are unlikely to lead to greater integration within developing Asia,as they are usually capped at relatively small volumes of trade and do not provide anycertainty for long-term investments.1
The Association of South-East Asian Nations (ASEAN) has identified textiles andapparel as one of the dozen priority sectors for early liberalization in its efforts to createan ASEAN Economic Community by 2015. ASEAN earlier commissioned a study of non-tariff measures (NTMs) inhibiting the integration of textiles and clothing, which wascompleted early in 2007.2 The investigation found that there was a significant incidenceof NTMs and that a number of them were highly restrictive of the development of intra-ASEAN trade in intermediate textile products and of investment in textile and clothingindustries. Similarly, a recent study prepared for the Asian Development Bank (ADB) onthe textile and clothing sectors in the member countries of the South Asian Associationfor Regional Co-operation (SAARC) finds substantial and highly restrictive internalbarriers to trade in textile intermediate products in the South Asian region.3
It is logical that the developing countries and customs territories of the Asianand Pacific region should consider textiles and clothing as sectors that are likely to beon the leading edge of trade and investment cooperation in the region.4 In South Asia,Bangladesh, India, Nepal, Pakistan and Sri Lanka all have a revealed comparativeadvantage in both textiles and apparel (James, 2007). Afghanistan and Bhutan havesignificant handicraft production, although mainly for the tourist trade but not yet forcommercial exports. Afghanistan also has capacity in the production and exporting ofcarpets. It remains to be seen whether either of these SAARC members will becomesuppliers of clothing to world markets.
In ASEAN, Cambodia, Indonesia, the Lao People’s Democratic Republic, thePhilippines, Thailand and Viet Nam all have a revealed comparative advantage inclothing; in addition, Indonesia, Thailand and Viet Nam have a revealed comparativeadvantage in textiles (James and others, 2007). The other member countries also havesignificant capacities in textile and clothing production and trade, as suppliers (Malaysia
1 For a discussion of these unilateral preference programmes and their impact on Asiansuppliers, see James, 2006.
2 James and others, 2007. This study is one of three on measures inhibiting the integration ofpriority sectors: textiles and apparel, electronics and logistics.
3 James, 2007. This report is a precursor to a larger study of measures restricting tradeintegration and investment in SAARC textiles and clothing industries.
4 In both the European Union and North America, regional integration and cooperation beganwith the integration of an industrial sector at an early stage of the integration process. TheSteel and Coal Community of 1952, comprising the six original members of the EuropeanCommunity, was the predecessor to the Treaty of Rome of 1957. In North America, the AutoPact of 1965 was the predecessor to the Canada-United States Free Trade Agreement of1989 and the North American Free Trade Agreement (NAFTA) of 1993 (Trebilcock and Howse,2005).

87
and Brunei Darussalam) or potential suppliers (Myanmar), or as hubs for intraregionaltrade as well as between the region and the world (Singapore). China also has a verystrong revealed comparative advantage in both textiles and clothing (James, 2007).
Despite the strong competitiveness of South Asian suppliers in world markets,trade integration within SAARC is barely developed. Specialized clothing exporters inBangladesh and Sri Lanka make hardly any use of regional supplies of fabric from Indiaor Pakistan. Trade integration is also very limited within ASEAN as extraregional fabricsare largely used by clothing exporters in Cambodia, Indonesia, the Philippines and VietNam, despite strong textile capacities in Indonesia, Malaysia, Thailand and, increasingly,Viet Nam. A recent study conducted for ADB shows that intra-industry trade withinlabour-intensive industries, including textiles and clothing, declined during 1995-2004, incontrast with rising intra-industry trade in technology-intensive and human capital-intensive industries (Asian Development Bank, 2007).5 The external trade environmentin textiles and clothing has also been altered by the agreements between China and theEuropean Union, and China and the United States to implement temporary quotarestrictions on selected clothing and textile products. The new quota restrictions onshipments from China to the United States market are examined in section A below. Insection B, market access conditions as well as external barriers to textile and clothingexports from Asia-Pacific suppliers in major markets are considered. Section C reviewsinternal barriers to increasing intraregional trade in the Asia-Pacific region. Section Dlooks at policy implications and makes recommendations.
A. Performance of Asian and Pacific suppliers in major markets in thepost-quota era: Case study of the United States market
The member countries of ASEAN and SAARC comprise a major portion of worldpopulation, and a growing share of world production and trade. These countries wereexpected to be among the major beneficiaries of liberalization of world trade in textilesand clothing with the phasing out of the quota system under ATC. This expectationappears to be borne out in the case of the United States market – the largest importmarket for clothing in the world.6
The performance of ASEAN in the post-quota era in the United States market interms of value (table 1) and volume (table 2) can be compared with overall worldshipments (tables 5 and 6). ASEAN clearly outperformed the growth of world shipmentsin apparel during the first two years of the post-quota era in value, and although thegrowth in volume of shipments was below the world average in 2005, volume growth in2006 was a multiple of world growth (16 per cent vs. 2.4 per cent). For the ASEANmember States, apparel is dominant in the value of shipments, up from 91.8 per cent in2004 to more than 94 per cent in 2006. Textile intermediate products (yarn and fabric)accounted for just 2.4 per cent of the value of shipments of all textile and apparel itemsto the United States in 2006. However, textile shipments fell sharply in 2005 compared
5 The Grubel-Lloyd index of intra-industry trade is calculated in the case of SITC 3-digit productgroups for 11 East and South-East Asian economies: China; Hong Kong, China; TaiwanProvince of China; Japan; the Republic of Korea; Indonesia; Malaysia; the Philippines;Singapore; Thailand; and Viet Nam.
6 United States apparel imports in 2006 reached US$ 71.6 billion (Office of Textiles andApparel, January 2007) compared with US$ 59.9 billion for the EU25 (EmergingTextiles.com,2007a).

88
with 2004, causing total ASEAN shipments in 2005 to grow more slowly than worldtotal shipments in value in the first year of the post-quota era. In 2006, textilesshowed modest growth in value and overall growth in value and volume ofshipments from ASEAN outperformed world average growth in the United States importmarket.
Cotton apparel accounted for 63 per cent of total apparel shipments to theUnited States in 2006, thus showing faster growth than any other product group during2004-2006 (in both value and volume). A major development in 2006, comparedwith 2005, was the strong performance of synthetic fibre apparel. The positive trendin shipments of synthetic fibre apparel appears to be carrying over into 2007 andpartially makes up for a stagnation in cotton apparel shipments in the first month of2007.
In the SAARC member countries (Bangladesh, India, Nepal, Pakistan and SriLanka) that supply textiles and apparel to the United States, performance in terms ofgrowth in the post-quota era has been clearly superior to world average growth in value(table 3) and volume (table 4). Apparel shipments to the United States from SAARC arealso predominantly cotton apparel, accounting for more than 79 per cent of total apparelshipments in 2006. Indeed, with the elimination of quotas, shipments of non-cottonapparel (with the exception of silk apparel in 2006) have shrunk as SAARC suppliersspecialize in cotton fabric apparel. In marked contrast to ASEAN, SAARC suppliers oftextiles performed quite well in the United States market, with shipments growing by 15per cent in 2005 and 11 per cent in 2006. Moreover, textiles account for between 25-30per cent of SAARC total shipments to the United States, a much higher share than forthe ASEAN countries. This helps to highlight a possible complementary relationshipbetween SAARC and ASEAN that might provide a basis for increased integration of thetwo subregions. Fabric shipments from SAARC are dominated by those of India andPakistan, and are much larger than ASEAN fabric shipments to the United Statesmarket.
At present, fabric imports in ASEAN are mainly from East Asian suppliers(China, Hong Kong, China, Japan, the Republic of Korea and Taiwan Province ofChina). However, scope may exist for increased trade in intermediate products fromSouth Asian suppliers if shipments are timely, of good quality and competitive in cost.Barriers that obstruct the development of intraregional trade are discussed in section Cbelow.
China’s performance in the United States market in terms of value and volume(tables 7 and 8) was very strong in 2005, with extremely rapid growth in apparelshipments of almost 70 per cent in value and 98 per cent in volume. For textiles, growthin value (29 per cent) exceeded growth in volume (25 per cent) in 2005. Overallshipments were up in 2005 by 54 per cent in value and 44 per cent in volume. Theimposition of restrictions on selected clothing and textile items began in the second halfof 2005; this may have cooled off the rate of increase in the latter half of the year, asin the first six months of 2005 shipments of apparel grew by over 140 per cent in value(Asian Development Bank, 2006). A comprehensive agreement to restrict shipments ofclothing and textile products in most of the fastest growth categories was reachedbetween the governments of the United States and China in November of 2005, andrestrictions were implemented thereafter, strongly affecting shipments in 2006. Therestrictions are implemented through agreed limits on the volume of shipments, and itcan be seen that apparel shipments in all of 2006 slowed to just over 10 per cent (table8) while growth of textile shipments was limited to just over 11 per cent.

89
However, unit prices are not regulated by the agreement and these rosesomewhat (unit values of China’s clothing items that were restricted increased in theUnited States by an estimated 21.3 per cent in 2006). Despite that fact, unit values ofChina’s products remained a good deal cheaper than those from other ASEANsuppliers. For example, unit values of Indonesian shipments to the United Statescomprising items for which China faced quota restrictions in 2006 remained nearly 37per cent higher than Chinese unit values.7
In 2007, China’s shipments have gained momentum as the system for allocatingquotas apparently has become more efficient – the volume of apparel shipmentsincreased by nearly 68 per cent in January of 2007 compared with January 2006.8
However, shipments of textiles grew by less than 5 per cent in January 2007 comparedwith January 2006 (table 8). Unit values of shipments by China continue to increase,with an expected growth rate in both clothing and textile items of about 10 per cent in2007 compared with 2006. The likelihood is that China will be able to increaseshipments in terms of volume up to the allowable limits in 2007; however, actual growthin value will be determined by unit values, which may be expected to rise somewhat.
Does the improvement in China’s performance in 2007 mean that other competi-tive Asian suppliers will be displaced in the United States market? In looking at thisissue, market shares were calculated for value and volume for ASEAN (tables 9 and 10)and SAARC suppliers (tables 11 and 12). These tables show that ASEAN has steadilyimproved its share in the United States market for apparel during 2004-2007, with thevalue share topping 20 per cent in the first month of 2007 (up from 17 per cent in2004). The tables also show that market shares of ASEAN in items on which Chinafaces restrictions are rising even faster than for all apparel shipments, from just under18 per cent in 2005 to almost 22 per cent in January 2007.
Value shares in textiles have continued to fall for ASEAN. Volume shares haveincreased for ASEAN apparel although cotton apparel shows a slight drop in 2007,which is more than compensated for by an increase in the share of synthetic fabricapparel. The market share, in terms of volume, of textile shipments, however, continuedto fall and was under 5 per cent in the first month of 2007 (table 10). The overallvolume share is stable for all shipments compared with all United States imports ataround 11 per cent for ASEAN. This indicates that unit prices of ASEAN shipments arerising and that ASEAN suppliers are attempting to move up in terms of quality ofproducts rather than compete in low-end products in the United States market.
SAARC members have also steadily increased their market share of apparel inthe United States market between 2004 and 2007. Cotton apparel from SAARC hasincreased its market share from 13 per cent in 2004 to more than 20 per cent in 2007.This pattern is different from ASEAN where the share of synthetic fabric apparel isrising sharply. In contrast to ASEAN, SAARC is also increasing its share of the UnitedStates textile market with an 18.2 per cent share of all textile items (value), up from 16per cent in 2004 (table 11). SAARC suppliers have also taken advantage of limits onChina’s shipments in restricted items with a jump in market share from 10 per cent in2004 to almost 15 per cent in the first month of 2007. The volume share of SAARC
7 These estimates are available upon request from the author.8 EmergingTextiles.com (2007b) reports quota fill rates as much higher in 2007 than in 2006 for
China’s shipments in restricted items.

90
products has risen sharply since restrictions were imposed, but the trend in share isupward over the entire period of 2004-2007 (table 12).
The market share data indicate that ASEAN and SAARC suppliers are stillcompetitive in the United States market. In addition, the market share of the China hasincreased in the United States market (tables 17 and 18). China’s share in terms ofvalue rose to 19 per cent in 2006 compared with 13 per cent in 2004. In terms ofvolume, the rise over the same period was from 22 per cent to just over 30 per cent.The question is, then, which suppliers to the United States market are being displaced?Aside from former large quota suppliers in East Asia (the Republic of Korea, China,Taiwan Province of China, Hong Kong, China, and Macau, China), the big losers in theUnited States market have been preferential suppliers to that market under variousbilateral and unilateral preference agreements. The growth in the value and volume ofshipments by major preferential suppliers of textiles and clothing in the United Statesmarket have consistently been negative since the system of quotas was eliminated. Thevalue of shipments from NAFTA partners (Canada and Mexico) has fallen each year(table 13) and volumes of NAFTA partners are also consistently negative (table 14). Themembers of the African Growth and Opportunity Act (AGOA) preference scheme hadlarge negative growth in both value and volume (tables 13 and 14). The members of theCentral America-Dominican Republic-United States Free Trade Agreement (CAFTA-DR)recorded negative growth in the value of shipments as well. United States preferenceprogrammes with restrictive rules of origin (particularly NAFTA) have performed poorlysince quotas were eliminated. The relaxed rules of origin used in agreements with Egyptand Jordan have allowed these preferential suppliers to increase shipments to theUnited States market, although from a low base and in amounts that cannot reverse theoverall trend for preferential suppliers as a whole. Whether or not this trend will continuemay crucially depend on the implementation of the CAFTA-DR agreement, which wasdelayed by legal difficulties in some of the member countries. CAFTA-DR has moreliberal rules of origin than NAFTA in that it allows cumulation across members, andbetween CAFTA-DR and NAFTA itself.
Market shares of major preferential suppliers in the United States market havedeteriorated since 2004 in both value (table 15) and volume (table 16). Restrictions onChina’s shipments appear to have had little positive effect on United States’ preference-receiving suppliers except perhaps to have slightly slowed down the pace of decline inmarket shares. Further analysis of market share trends over time will help to verifywhether the trend can be reversed, as CAFTA-DR is a huge supplier and hasadvantages over Asian suppliers in terms of proximity and delivery time to the UnitedStates.
B. External tariff and non-tariff obstacles facing Asian and Pacificsuppliers in major markets
The United States and the European Union constitute by far the largest marketsfor textile and apparel imports globally, and together they account for the bulk ofshipments from suppliers in Asia and the Pacific. The main form of protection in thesetwo large markets, aside from the recently introduced safeguard quotas on selectedproducts from China, is in the form of tariffs. United States tariffs on cotton apparel aretypically in the range of 10 per cent to 20 per cent; however, for synthetic fabricapparel, peak tariffs of more than 30 per cent are applied on a “most favoured nation”(MFN) basis. The European Union also has relatively high tariffs on textiles and clothingon an MFN basis. Japan has somewhat lower ad valorem tariffs but has hundreds ofspecific tariff rates on textile products that can be highly restrictive.

91
A number of Asia-Pacific region suppliers are attempting to gain preferentialaccess to the United States market through bilateral FTAs. Singapore is the only Asia-Pacific developing country to have an FTA with the United States that has entered intoforce. However, Singapore has a very small capacity in textiles and apparel and is not amajor supplier to the United States market. (Neither is Australia, which also has a FTAwith the United States). In any case, the rules of origin in the Singapore-United StatesFTA are highly restrictive, along similar lines to NAFTA (James, 2006). A significantrecent development is the conclusion of FTA negotiations between the United Statesand the Republic of Korea. The agreement’s provisions for rules of origin in textiles andclothing are similar to those in the United States-Singapore case, with a restrictive“yarn-forward” rule that requires use of regional yarn and fabric.9 Details of rulesgoverning non-regional yarns and fabrics remain to be worked out. The Republic ofKorea has significantly greater capacity as a supplier, particularly of textile intermediateproducts and clothing. The agreement mandates immediate reciprocal duty-free treat-ment for qualifying shipments of textiles and fabric. (However, there is also a specialsafeguard provision for the United States to fall back on, should textile and clothingimports from the Republic of Korea surge). Hence, trade diversion from competitiveAsian suppliers to Korean suppliers in the United States market is a possibility.
The United States (like the European Union) is contemplating greater use oftrade remedies to stem the inflow of shipments of textiles and clothing from competitiveAsian suppliers. In particular, the United States is targeting Viet Nam and is implement-ing a vigorous monitoring programme of shipments from Viet Nam for the purpose ofanti-dumping investigations and measures. The United States insisted upon this require-ment as part of Viet Nam’s WTO Accession Agreement (EmergingTextiles.com, 2007c).It is also likely that China will face anti-dumping measures in future, once the safeguardquotas are eliminated at the end of 2008. China is regarded as a “non-market”economy, and the United States has until 2016 to impose anti-dumping duties unilater-ally on that basis on shipments from China.
Another worrisome trend is the push in the United States Congress to excludetextiles and clothing from the Doha Round Agreement. The issue may be moot, as theBush administration was not successful in obtaining an extension of the negotiatingauthority under the Trade Promotion Act (TPA) after it expired on 30 June 2007. Failureof the Doha Round to move forward will have adverse consequences in that it will leavehigh MFN tariffs in the United States, European Union and Japan untouched, even asthose countries continue to pursue more bilateral trade agreements with restrictive rulesof origin.
C. Internal tariff and non-tariff barriers to trade and investment inAsian and Pacific textiles and clothing
The presence of internal barriers to regional integration of Asian-Pacific textileand apparel sectors has been recognized as a major problem that requires urgentconsideration by governments in the region. In 2006, the ASEAN Secretariat commis-sioned a study of NTMs and their impact on efforts to create a single ASEAN market inthree of the 12 priority sectors that ASEAN leaders have identified in their efforts to
9 A summary of the agreement can be downloaded from the Office of Textiles and Apparel,United States Department of Commerce homepage at www.otexa.ita.doc.gov/. See also AsianDevelopment Bank, 2006.

92
create an ASEAN Economic Community (AEC) by 2015. A brief summary ofthe findings of a report on NTMs in textiles and clothing (James and others, 2007)follows.
The inventory of NTMs restricting intra-ASEAN trade in textiles and clothing isevaluated in seven major supplier countries – Cambodia, Indonesia, the Lao People’sDemocratic Republic, Malaysia, the Philippines, Thailand and Viet Nam. The occurrenceof NTMs, the consistency with which observed NTMs are applied, and the degree ofrestrictiveness they pose for trade in textiles and clothing are estimated based upon asample of respondents. The most frequently occurring NTMs are those involvingcustoms administration, followed by taxes and tariffs, technical barriers, investment,outward processing arrangements, and political economy and institutions. The mostrestrictive NTMs were those on outward processing arrangements (OPAs), followed byinvestment, subsidies, taxes and tariffs, political economy and institutions, and customsadministration with moderate to critical values. Structural change characterizes the textileand apparel sectors, with smaller countries (Cambodia and the Lao People’s DemocraticRepublic) becoming more specialized in clothing exports and larger, more developedcountries (Indonesia, Malaysia and Thailand) maintaining substantial textile capacities.The Philippines is undergoing transformation into a specialized clothing exporter as itstextile sector is contracting. In Viet Nam, the opposite is occurring through FDI flowsinto textile production. ASEAN integration in textiles and clothing is limited, andrestrictions on investment and OPAs are serious obstacles to efficient development ofproduction networks.
SAARC is also likely to consider designating textiles and apparel as prioritysectors for regional integration. It is widely recognized that South Asia is among theworld’s least integrated regions, due in large part to the historical legacy of conflictbetween the two largest member countries, India and Pakistan. A study of internalbarriers to integration of the textile and apparel industry would be necessary to providea detailed analysis of the problem. Fortunately, it is likely that such a study will beforthcoming in the near future. However, for now, it is worth noting that the SAARCmember countries maintain high tariff and non-tariff barriers to trade in textiles andapparel, and have excluded hundreds of tariff lines (mainly in textile fabrics) fromliberalization under the South Asian Free Trade Agreement (SAFTA), which recentlyentered into force.
Only Bhutan, Maldives and Sri Lanka have refrained from large-scale exclusionsin textile intermediate products among SAARC members. Of these three countries, SriLanka is the only SAARC member with a substantial textile and apparel capacity and itmakes little use of fabric from within SAARC, preferring instead to import fabric fromEast and South-East Asia. Despite the severity of the internal restrictions on tradebetween Bangladesh, India, Nepal and Pakistan (the other main SAARC suppliers),potential for integration in these sectors in the long term is very favourable. Bangladeshand Nepal (like Sri Lanka) tend to specialize in garment production (althoughBangladesh has a large spinning and knitting capacity). India and Pakistan have largedomestic supplies of raw materials (especially cotton), and India is a competitivesupplier of synthetic fabric and numerous inputs related to textile and clothing produc-tion. While Nepal together with Pakistan specialize in cotton apparel, India and SriLanka have large capacities in synthetic apparel. In addition, Bangladesh is a competi-tive supplier of most types of ready-made garments. Freeing internal trade in textileintermediate products would be a significant step towards taking advantage of thepotential for regional integration in South Asia.

93
The creation of an Asian-Pacific Textile and Clothing Community would help toboost the competitiveness of suppliers from developing countries within the region, andwould help offset the discriminatory effects the region faces in major markets from theproliferation of bilateral FTAs. ASEAN efforts to create a single market in textiles andapparel would be an important milestone in developing a broader regional agreement.The ASEAN-based suppliers are intent upon developing OPAs in order to take advan-tage of the competitive prowess of the 10 member States. The recent successfuldevelopment of OPAs between Thailand and the Lao People’s Democratic Republic is acase in point. Thai-Lao cooperation has enabled suppliers of cotton apparel in the LaoPeople’s Democratic Republic to enter the United States market. Similar arrangementsare envisioned between Malaysia and Viet Nam, Cambodia and Thailand, Indonesia andViet Nam, and eventually extending to Myanmar. The Philippines is developing OPAs,through Hong Kong, China, with suppliers in China. These arrangements can form thebasis for wider regional cooperation. If SAARC members can join in the process,possibly through subregional agreements, this would further boost the process. Signal-ling that a region-wide open trade regime in intermediate textile products was in theworks would also attract FDI flows that would strengthen technological capacities andproduction networks in textiles and clothing in the region.
D. Policy implications and conclusions
The adoption of policy measures is vital to enhancing competitiveness betweenthe present and the end of 2008, when safeguard measures restricting China’sshipments to the United States market will end. In the case of the European Union,safeguards are currently scheduled to end in 2007 (year-end).10 Competition willbecome more intense in 2008 and 2009 and in the following years. Hence, there is alimited window of opportunity for competitive Asian suppliers to prepare themselves.
Private sector efforts to boost productivity at the level of the firm or manufactur-ing establishment through improved management of the entire value chain can besupported by government efforts to facilitate trade (Azhari, 2007). Trade facilitationmeasures are identified as any means of easing the movement of goods acrossborders. The most important areas where government actions can influence the ease ofmovement of goods across international borders include improved customs administra-tion (including reducing corruption), better port handling, and efficiency and improvementin the quantity and quality of infrastructure. Trade agreements aimed at fosteringintegration by removing internal barriers to trade in intermediate textile products areclearly important in allowing private enterprises to exploit opportunities. The combinationof private sector investment and management improvement, trade facilitation and tradeagreements are immediate areas where competitive Asian suppliers can work toenhance overall competitiveness.
The reduction of tariff and non-tariff barriers to trade needs to be accelerated ifintraregional trade in textile and related inputs is to grow in line with potential. In thecase of SAARC, the member countries have all but precluded the healthy integration ofthe textile and clothing sectors in the region by excluding most products in HS 50-63(textiles and clothing) from liberalization under SAFTA. In contrast, ASEAN has already
10 See European Commission, 2005 for the schedule of European Union safeguard quotas. Theagreement notes that the European Union will undertake restraint in exercising its rights underthe terms of China’s WTO Accession Agreement in 2008.

94
implemented tariff reductions in these sectors, particularly for textile yarns and fabricsunder the Common Effective Preferential Tariff (CEPT).11
Taxes and investment regulations may also be reformed to encourage integrationthrough development of OPAs. In particular, domestic taxes on imported raw materialssuch as cotton and on intermediate inputs such as yarns, fabrics and accessories maydiscourage development of OPAs within the region. Restrictions on foreign investmenthave also limited integration of Asian suppliers. Removal of barriers and restrictions onFDI through mergers and acquisitions would spur intraregional trade and enhancecompetitiveness. Reductions of trade costs and time delays in moving inputs andoutputs across borders could be the key to whether or not the industry survives andthrives after the end of China safeguards, particularly in smaller Asian suppliers ofapparel to world markets. For larger countries with integrated textile and apparel sectors,trade cost reduction is the sine qua non for remaining competitive and for enhancingmarket share in large world markets for textiles and apparel, particularly if the DohaRound continues to be kept on hold.
Among the measures that could immediately benefit textile and clothing produc-ers within ASEAN, going to zero CEPT tariffs on textile intermediate products withoutexception and adoption of an ASEAN green lane for shipments from member countriesto member countries (even if transiting through a non-member country) are recom-mended. ASEAN is engaged in broader liberalization negotiations with China, Japan, theRepublic of Korea and India, and thus could provide a uniform template for intraregionaltrade in textiles and apparel. A consistent set of rules of origin with a provision forregional cumulation and a choice of complying through a threshold value-added,maximum non-regional content percentage or a specified process (production of fabricfrom yarn, cutting and sewing of fabric into clothing) would be an important step inavoiding the increasingly complex “noodle-bowl” of rules of origin.
In addition, ASEAN-plus agreements could help the region to avoid developinginto a series of competing hub and spoke systems by linking all the spokes togetherunder one set of rules. This would benefit businesses by simplifying their decision-making, and by providing an environment conducive to intraregional investment andtrade.
Asian suppliers of textiles and clothing can face the future with confidence andbank on continued growth if steps are taken now to prepare for the rising competitionover the next two years or so.
11 Trade in intermediate products for exporters is also benefited by duty exemption anddrawback schemes in the member countries of both SAARC and ASEAN, but thesearrangements discourage the development of an integrated domestic industry and encouragethe use of fabric and yarn from non-member suppliers. This is not necessarily a bad idea, asit makes sense to purchase inputs from the lowest cost suppliers. However, timidity inreducing internal barriers to trade in textile products reduces the opportunity for firms to attaineconomies of scale and to develop regional production networks.
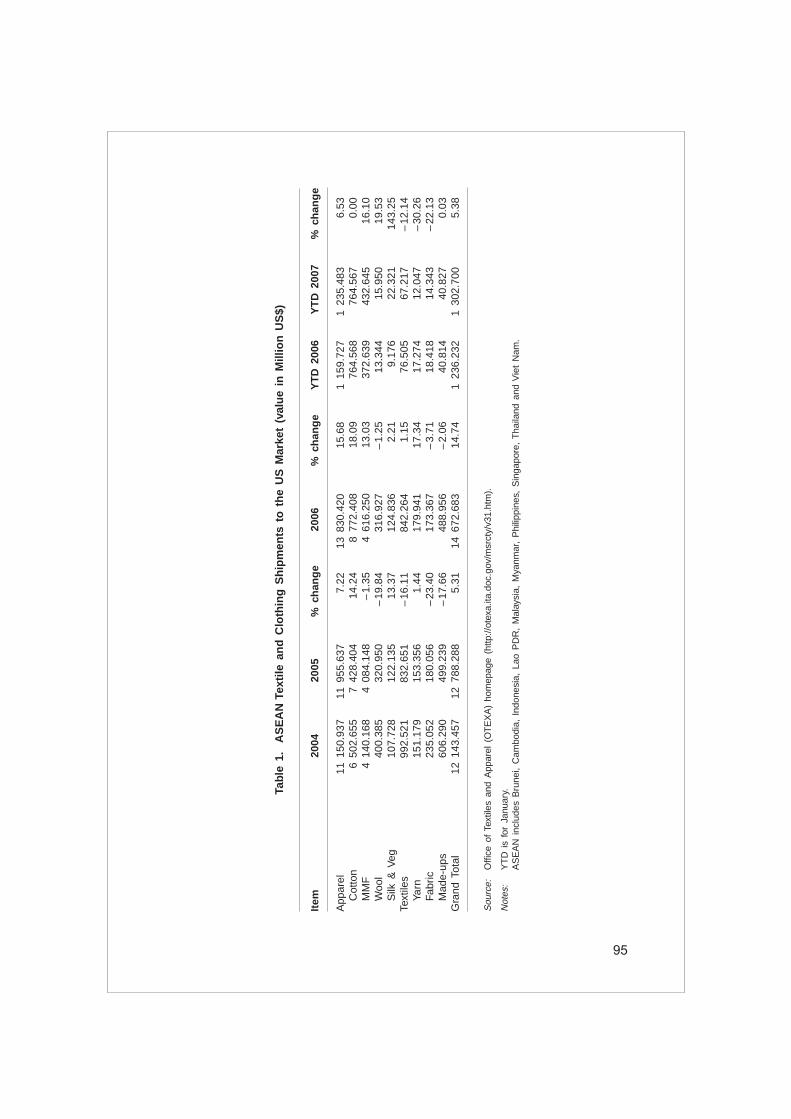
95
Tab
le 1
. A
SE
AN
Tex
tile
an
d C
loth
ing
Sh
ipm
ents
to
th
e U
S M
arke
t (v
alu
e in
Mill
ion
US
$)
Item
2004
2005
% c
han
ge
2006
% c
han
ge
YT
D 2
006
YT
D 2
007
% c
han
ge
App
arel
11 1
50.9
3711
955
.637
7.22
13 8
30.4
2015
.68
1 15
9.72
71
235.
483
6.53
Cot
ton
6 5
02.6
557
428.
404
14.2
48
772.
408
18.0
976
4.56
876
4.56
70.
00M
MF
4 14
0.16
84
084.
148
–1.
354
616.
250
13.0
337
2.63
943
2.64
516
.10
Woo
l40
0.38
532
0.95
0–
19.8
431
6.92
7–
1.25
13.3
4415
.950
19.5
3S
ilk &
Veg
107.
728
122.
135
13.3
712
4.83
62.
219.
176
22.3
2114
3.25
Text
iles
992.
521
832.
651
–16
.11
842.
264
1.15
76.5
0567
.217
–12
.14
Yarn
151.
179
153.
356
1.44
179.
941
17.3
417
.274
12.0
47–
30.2
6Fa
bric
235.
052
180.
056
–23
.40
173.
367
–3.
7118
.418
14.3
43–
22.1
3M
ade-
ups
606.
290
499.
239
–17
.66
488.
956
–2.
0640
.814
40.8
270.
03G
rand
Tot
al12
143
.457
12 7
88.2
885.
3114
672
.683
14.7
41
236.
232
1 30
2.70
05.
38
Sou
rce:
Offi
ce o
f Te
xtile
s an
d A
ppar
el (
OT
EX
A)
hom
epag
e (h
ttp://
otex
a.ita
.doc
.gov
/msr
cty/
v31.
htm
).
Not
es:
YT
D i
s fo
r Ja
nuar
y.A
SE
AN
inc
lude
s B
rune
i, C
ambo
dia,
Ind
ones
ia,
Lao
PD
R,
Mal
aysi
a, M
yanm
ar,
Phi
lippi
nes,
Sin
gapo
re,
Tha
iland
and
Vie
t N
am.

96
Tab
le 2
. A
SE
AN
Tex
tile
an
d C
loth
ing
Sh
ipm
ents
to
th
e U
S M
arke
t (v
olu
me
in m
illio
n s
qu
are
met
er e
qu
ival
ents
)
Item
2004
2005
% c
han
ge
2006
% c
han
ge
YT
D 2
006
YT
D 2
007
% c
han
ge
App
arel
3 46
8.49
0 3
668
.415
5.76
4 25
5.96
16.0
236
0.63
236
4.64
61.
11C
otto
n1
799.
282
046.
9313
.76
2 44
3.87
719
.39
216.
055
205.
001
–5.1
2M
MF
1 59
7.65
51
561.
274
–2.
281
754.
382
12.3
714
1.62
215
4.39
99.
02W
ool
42.5
8433
.402
–21.
5632
.089
–3.9
31.
251
1.44
715
.67
Silk
& v
eg28
.969
26.8
13–7
.44
25.6
08–4
.49
1.70
43.
799
122.
95Te
xtile
s1
671.
107
1 47
6.27
8–
11.6
61
498.
065
1.48
146.
419
110.
177
–24.
75Ya
rn44
9.14
447
0.90
04.
8452
9.83
912
.52
52.3
3234
.464
–34.
14Fa
bric
518.
964
399.
366
–23
.05
382.
596
–4.2
042
.217
31.2
36–2
6.01
Mad
e-up
s70
2.99
860
6.01
1–1
3.80
585.
630
–3.3
651
.870
44.4
77–1
4.25
Gra
nd T
otal
5 1
39.5
975
144.
693
0.10
5 75
4.02
211
.84
507.
051
474.
823
–6.3
6
Sou
rce:
Offi
ce o
f Te
xtile
s an
d A
ppar
el (
OT
EX
A)
hom
epag
e (h
ttp://
otex
a.ita
.doc
.gov
/msr
cty/
v31.
htm
).
Not
es:
YT
D i
s fo
r Ja
nuar
y.A
SE
AN
inc
lude
s: B
rune
i, C
ambo
dia,
Ind
ones
ia,
Lao
PD
R,
Mal
aysi
a, M
yanm
ar,
Phi
lippi
nes,
Sin
gapo
re,
Tha
iland
and
Vie
t N
am.
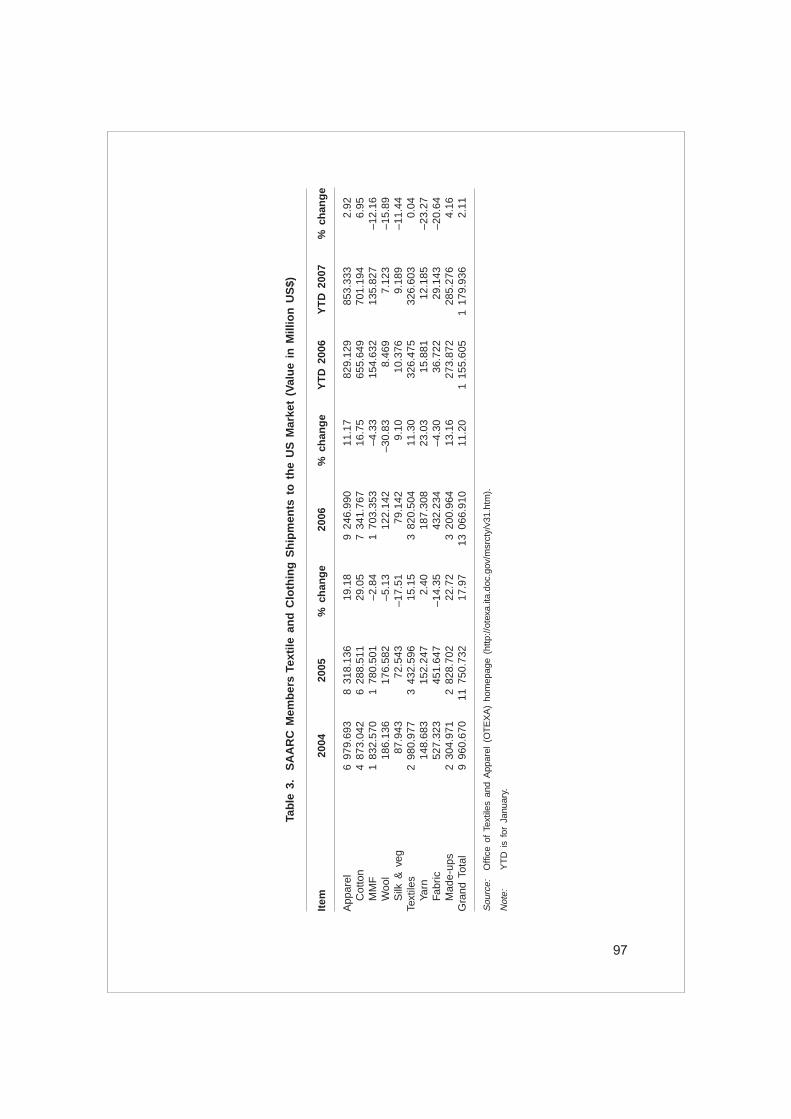
97
Tab
le 3
. S
AA
RC
Mem
ber
s Te
xtile
an
d C
loth
ing
Sh
ipm
ents
to
th
e U
S M
arke
t (V
alu
e in
Mill
ion
US
$)
Item
2004
2005
% c
han
ge
2006
% c
han
ge
YT
D 2
006
YT
D 2
007
% c
han
ge
App
arel
6 97
9.69
38
318.
136
19.1
89
246.
990
11.1
782
9.12
985
3.33
32.
92C
otto
n4
873.
042
6 28
8.51
129
.05
7 34
1.76
716
.75
655.
649
701.
194
6.95
MM
F1
832.
570
1 78
0.50
1–2
.84
1 70
3.35
3–4
.33
154.
632
135.
827
–12.
16W
ool
186.
136
176.
582
–5.1
312
2.14
2–3
0.83
8.46
97.
123
–15.
89S
ilk &
veg
87.9
4372
.543
–17.
5179
.142
9.10
10.3
769.
189
–11.
44Te
xtile
s2
980.
977
3 43
2.59
615
.15
3 82
0.50
411
.30
326.
475
326.
603
0.04
Yarn
148.
683
152.
247
2.40
187.
308
23.0
315
.881
12.1
85–2
3.27
Fabr
ic52
7.32
345
1.64
7–1
4.35
432.
234
–4.3
036
.722
29.1
43–2
0.64
Mad
e-up
s2
304.
971
2 82
8.70
222
.72
3 20
0.96
413
.16
273.
872
285.
276
4.16
Gra
nd T
otal
9 96
0.67
011
750
.732
17.9
713
066
.910
11.2
0 1
155
.605
1
179.
936
2.11
Sou
rce:
Offi
ce o
f Te
xtile
s an
d A
ppar
el (
OT
EX
A)
hom
epag
e (h
ttp://
otex
a.ita
.doc
.gov
/msr
cty/
v31.
htm
).
Not
e:Y
TD
is
for
Janu
ary.

98
Tab
le 4
. S
AA
RC
Mem
ber
s Te
xtile
an
d C
loth
ing
Sh
ipm
ents
to
th
e U
S M
arke
t (V
olu
me
in M
illio
n S
qu
are
Met
er e
qu
ival
ents
)
Item
2004
2005
% c
han
ge
2006
% c
han
ge
YT
D 2
006
YT
D 2
007
% c
han
ge
App
arel
2 52
0.17
22
965.
822
17.6
83
286.
059
10.8
028
0.86
930
6.79
79.
23C
otto
n1
675.
623
2 16
1.24
728
.98
2 54
4.15
217
.72
213.
840
241.
040
12.7
2M
MF
796.
253
765.
114
–3.9
171
1.96
5–6
.95
64.1
1163
.471
–1.0
0W
ool
23.7
7922
.561
–5.1
214
.513
–35.
670.
980
0.69
4–2
9.18
Silk
& v
eg24
.517
16.8
98–3
1.08
15.3
65–9
.07
1.94
01.
592
–17.
94Te
xtile
s4
003.
602
4 51
2.33
612
.71
4 94
4.33
39.
5742
0.35
639
5.87
4–5
.82
Yarn
442.
052
501.
524
13.4
559
1.97
318
.03
51.9
9737
.590
–27.
71Fa
bric
832.
942
818.
918
–1.6
884
2.19
02.
8466
.225
60.5
08–8
.63
Mad
e-up
s2
728.
608
3 19
1.89
416
.98
3 51
0.17
19.
9730
2.13
729
7.77
5–1
.44
Gra
nd T
otal
6 52
3.77
47
478.
158
14.6
38
230.
390
10.0
670
1.22
670
2.67
10.
21
Sou
rce:
Offi
ce o
f Te
xtile
s an
d A
ppar
el (
OT
EX
A)
hom
epag
e (h
ttp://
otex
a.ita
.doc
.gov
/msr
cty/
v31.
htm
).
Not
e:Y
TD
is
for
Janu
ary.

99
Tab
le 5
. W
orl
d T
exti
le a
nd
Clo
thin
g S
hip
men
ts t
o t
he
US
Mar
ket
(val
ue
in M
illio
n U
S$)
Item
2004
2005
% c
han
ge
2006
% c
han
ge
YT
D 2
006
YT
D 2
007
% c
han
ge
App
arel
64 7
67.6
7368
713
.251
6.09
71 6
29.1
704.
24 5
494
.750
6 0
97.1
8310
.96
Cot
ton
37 3
98.8
7741
141
.989
10.0
143
411
.020
5.52
3 43
7.37
2 3
827
.006
11.3
4M
MF
20 4
46.0
8820
763
.698
1.55
21 5
86.0
543.
961
546.
523
1 77
9.86
615
.09
Woo
l3
964.
110
4 12
9.96
34.
183
938.
308
–4.
6417
5.35
218
1.49
73.
50S
ilk &
veg
2 9
58.5
982
677.
600
–9.
502
693.
788
0.60
335.
504
308.
815
–7.9
5Te
xtile
s18
542
.769
20 4
92.2
4510
.51
21 6
47.9
475.
641
790.
763
1 8
52.9
913.
47Ya
rn 1
648
.168
1 71
4.05
64.
001
603.
642
–6.
4414
6.60
712
2.85
4–1
6.20
Fabr
ic5
637.
508
5 71
9.12
31.
455
472.
441
–4.
3145
9.56
743
9.56
7–4
.35
Mad
e-up
s11
257
.094
13 0
59.0
6616
.01
14 5
71.8
6511
.58
1 18
4.58
91
290.
681
8.96
Gra
nd T
otal
83 3
10.4
4289
205
.496
7.08
93 2
27.1
174.
517
285.
513
7 9
50.1
749.
12
Sou
rce:
Offi
ce o
f Te
xtile
s an
d A
ppar
el (
OT
EX
A)
hom
epag
e (h
ttp://
otex
a.ita
.doc
.gov
/msr
cty/
v31.
htm
).
Not
e:Y
TD
is
for
Janu
ary.

100
Tab
le 6
. W
orl
d T
exti
le a
nd
Clo
thin
g S
hip
men
ts t
o t
he
US
mar
ket
(vo
lum
e in
mill
ion
sq
uar
e m
eter
eq
uiv
alen
ts)
Item
2004
2005
% c
han
ge
2006
% c
han
ge
YT
D 2
006
YT
D 2
007
% c
han
ge
App
arel
19 9
51.0
0022
009
.810
10.3
222
538
.970
2.40
1 69
7.45
21
918.
708
13.0
3C
otto
n11
233
.600
12 7
96.2
4013
.91
13 4
58.3
805.
17 1
026
.355
1 16
9.49
313
.95
MM
F 7
635
.154
8 19
9.44
97.
39 8
164
.944
–0.4
258
0.51
467
2.35
815
.82
Woo
l26
5.80
328
6.39
07.
7526
0.42
8–9
.07
10.5
5910
.607
0.45
Silk
& v
eg81
6.43
472
7.73
2–1
0.86
655.
220
–9.9
680
.025
66.2
50–1
7.21
Text
iles
26 9
85.1
5028
829
.090
6.83
29 6
07.2
102.
702
503.
504
2 37
3.45
6–5
.19
Yarn
3 51
4.76
53
629.
934
3.28
3 6
29.0
65–0
.20
337.
319
279.
279
–17.
21Fa
bric
9 25
0.04
89
521.
842
2.94
8 87
2.87
3–6
.82
800.
852
705.
588
–11.
90M
ade-
ups
14 2
20.3
3015
677
.310
10.2
517
105
.270
9.11
1 36
5.33
31
388.
589
1.70
Gra
nd T
otal
46 9
36.1
4050
838
.900
8.32
52 1
46.1
802.
574
200.
957
4 29
2.16
42.
17
Sou
rce:
Offi
ce o
f Te
xtile
s an
d A
ppar
el (
OT
EX
A)
hom
epag
e (h
ttp://
otex
a.ita
.doc
.gov
/msr
cty/
v31.
htm
).
Not
e:Y
TD
is
for
Janu
ary.

101
Tab
le 7
. C
hin
a Te
xtile
an
d C
loth
ing
Sh
ipm
ents
to
th
e U
S (
valu
e in
Mill
ion
US
$)
Item
2004
2005
% c
han
ge
2006
% c
han
ge
YT
D 2
006
YT
D 2
007
% c
han
ge
App
arel
8 92
7.86
415
142
.869
69.6
118
157
.487
19.9
11
119.
322
2 0
13.2
7879
.87
Cot
ton
2 7
54.9
416
003.
881
117.
937
855.
387
30.8
444
2.54
4 1
056
.337
138.
70M
MF
3 3
54.8
305
680.
036
69.3
1 6
915
.745
21.7
635
4.13
865
8.27
785
.88
Woo
l37
0.24
11
232.
224
232.
82 1
505
.559
22.1
841
.117
49.8
0521
.13
Silk
& v
eg2
447.
852
2 22
6.72
7–
9.03
2 2
40.7
970.
6328
1.52
324
8.85
9–1
1.60
Text
iles
5 63
0.21
3 7
262
.350
28.9
98
549.
186
17.7
269
5.35
879
6.15
314
.50
Yarn
23.5
8457
.983
145.
8671
.607
23.5
05.
660
7.74
936
.91
Fabr
ic55
2.09
583
8.93
751
.96
900.
076
7.29
82.2
4587
.216
6.04
Mad
e-up
s5
054.
533
6 36
5.42
925
.94
7 57
7.50
219
.04
607.
454
701.
189
15.4
3G
rand
Tot
al14
558
.077
22 4
05.2
1953
.90
27 0
66.6
7320
.81
1 81
4.68
0 2
809
.431
54.8
2
Sou
rce:
Offi
ce o
f Te
xtile
s an
d A
ppar
el (
OT
EX
A)
hom
epag
e (h
ttp://
otex
a.ita
.doc
.gov
/msr
cty/
v31.
htm
).
Not
e:Y
TD
is
for
Janu
ary.

102
Tab
le 8
. C
hin
a Te
xtile
an
d C
loth
ing
Sh
ipm
ents
to
th
e U
S (
volu
me
in m
illio
n s
qu
are
met
er e
qu
ival
ents
)
Item
2004
2005
% c
han
ge
2006
% c
han
ge
YT
D 2
006
YT
D 2
007
% c
han
ge
App
arel
2 9
72.5
23 5
883
.431
97.9
36
506.
037
10.5
841
1.18
669
0.69
567
.98
Cot
ton
1 10
6.32
52
543.
580
129.
91 2
976
.500
17.0
218
7.84
336
1.10
992
.24
MM
F1
139.
026
2 5
96.6
3012
7.97
2 82
4.57
18.
7814
6.92
526
7.24
281
.89
Woo
l24
.677
99.0
2230
1.27
122.
191
23.4
03.
544
4.24
719
.84
Silk
& v
eg70
2.49
564
4.20
0–8
.30
582.
776
–9.5
372
.864
58.0
97–2
0.27
Text
iles
8 6
89.7
6910
879
.670
25.2
012
104
.860
11.2
697
6.58
01
020.
778
4.53
Yarn
41.1
0511
7.44
218
5.71
208.
777
77.7
716
.971
20.3
2919
.79
Fabr
ic92
7.30
9 1
651
.858
78.1
31
491.
688
–9.7
016
0.41
214
3.22
5–1
0.71
Mad
e-up
s 7
721
.355
9 1
10.3
7317
.99
10 4
04.3
9014
.20
799.
196
857.
223
7.26
Gra
nd T
otal
11 6
62.2
9216
763
.101
43.7
418
610
.890
11.0
21
387.
767
1 71
1.47
223
.33
Sou
rce:
Offi
ce o
f Te
xtile
s an
d A
ppar
el (
OT
EX
A)
hom
epag
e (h
ttp://
otex
a.ita
.doc
.gov
/msr
cty/
v31.
htm
).
Not
e:Y
TD
is
for
Janu
ary.

103
Table 9. ASEAN Textile and Clothing market Sharesin the US Market in Value (%)
2004 2005 2006 YTD 2007
Clothing, all items 17.22 17.40 19.31 20.26Cotton 17.39 18.06 20.21 19.98MMF 20.25 19.67 21.39 24.31Wool 10.01 7.77 8.05 8.79Silk & veg 3.64 4.56 4.63 7.23
China-restricted clothing items 16.30 17.88 19.76 21.77Textiles, all items 5.35 4.06 3.89 3.63
Yarn 9.17 8.95 11.22 9.81Fabric 4.17 3.15 3.17 3.26Made-ups 5.39 3.82 3.36 3.16
China-restricted textile items 4.13 3.16 3.50 3.17Grand total all items 14.58 14.34 15.74 16.39China-restricted items 15.00 15.88 18.06 19.88
Source: Author’s compilations.
Table 10. ASEAN Textile and Clothing Market Sharesin the US market in Volume (%)
2004 2005 2006 YTD 2007
Clothing, all items 17.39 16.67 18.88 19.00Cotton 16.02 15.96 18.16 17.53MMF 20.92 19.04 21.49 22.96Wool 16.02 11.66 12.32 13.64Silk & veg 3.55 3.68 3.91 5.73
China-restricted clothing items 14.09 14.24 17.74 18.29Textiles, all items 6.19 5.12 5.06 4.64
Yarn 12.78 12.97 14.60 12.34Fabric 5.61 4.19 4.31 4.43Made-ups 4.94 3.87 3.42 3.20
China-restricted textile items 3.98 3.23 3.93 3.52Grand total all items 10.95 10.12 11.03 11.06China-restricted items 9.96 9.74 12.18 12.89
Source: Author’s compilations.
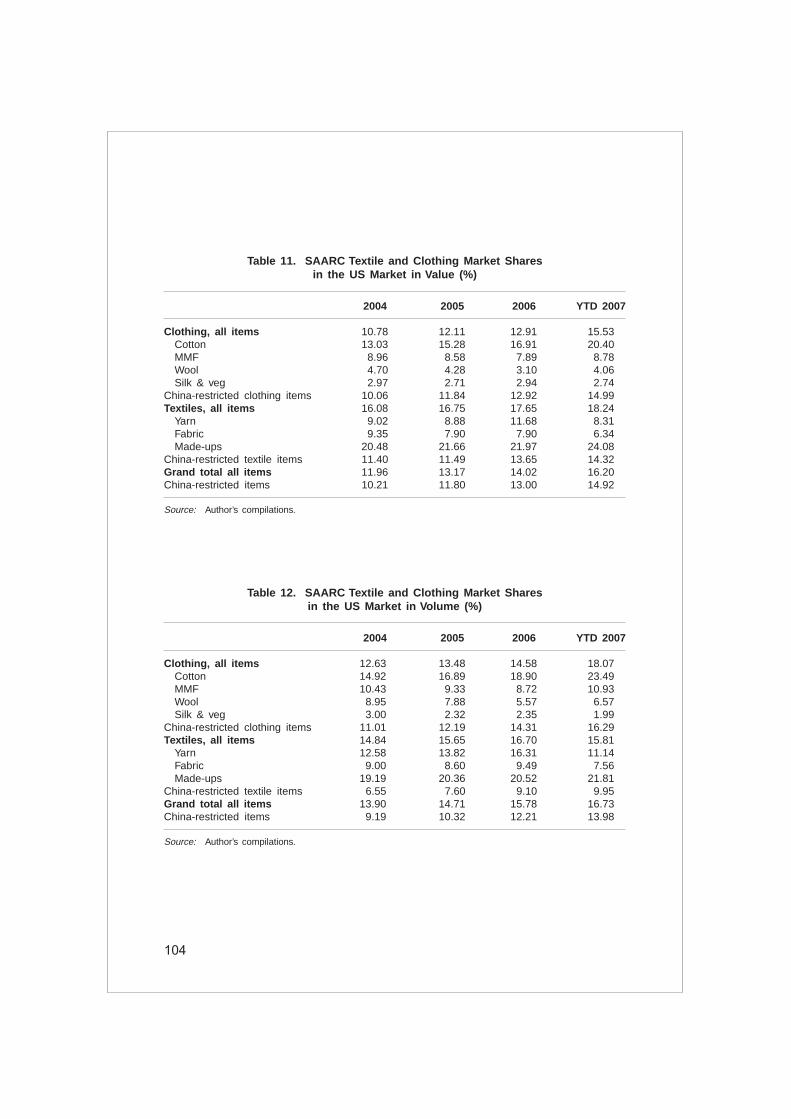
104
Table 11. SAARC Textile and Clothing Market Sharesin the US Market in Value (%)
2004 2005 2006 YTD 2007
Clothing, all items 10.78 12.11 12.91 15.53Cotton 13.03 15.28 16.91 20.40MMF 8.96 8.58 7.89 8.78Wool 4.70 4.28 3.10 4.06Silk & veg 2.97 2.71 2.94 2.74
China-restricted clothing items 10.06 11.84 12.92 14.99Textiles, all items 16.08 16.75 17.65 18.24
Yarn 9.02 8.88 11.68 8.31Fabric 9.35 7.90 7.90 6.34Made-ups 20.48 21.66 21.97 24.08
China-restricted textile items 11.40 11.49 13.65 14.32Grand total all items 11.96 13.17 14.02 16.20China-restricted items 10.21 11.80 13.00 14.92
Source: Author’s compilations.
Table 12. SAARC Textile and Clothing Market Sharesin the US Market in Volume (%)
2004 2005 2006 YTD 2007
Clothing, all items 12.63 13.48 14.58 18.07Cotton 14.92 16.89 18.90 23.49MMF 10.43 9.33 8.72 10.93Wool 8.95 7.88 5.57 6.57Silk & veg 3.00 2.32 2.35 1.99
China-restricted clothing items 11.01 12.19 14.31 16.29Textiles, all items 14.84 15.65 16.70 15.81
Yarn 12.58 13.82 16.31 11.14Fabric 9.00 8.60 9.49 7.56Made-ups 19.19 20.36 20.52 21.81
China-restricted textile items 6.55 7.60 9.10 9.95Grand total all items 13.90 14.71 15.78 16.73China-restricted items 9.19 10.32 12.21 13.98
Source: Author’s compilations.

105
Tab
le 1
3.
Maj
or
Pre
fere
nti
al S
up
plie
rs P
erfo
rman
ce i
n C
hin
a R
estr
icte
d I
tem
s in
th
e U
S M
arke
t(V
alu
e in
Mill
ion
US
$)
2004
2005
% c
han
ge
2006
% c
han
ge
YT
D 2
006
YT
D 2
007
% c
han
ge
Pre
fent
ial
Sup
plie
r:C
anad
a1
729.
524
1 5
69.0
96–
9.28
1 44
2.93
1–
8.04
130.
400
103.
676
–20.
49M
exic
o 6
528
.536
6 03
7.82
0–
7.52
5 3
54.1
43–
11.3
238
4.17
732
9.97
7–1
4.11
CA
FTA
-DR
8 7
42.7
918
485.
637
–2.
947
943.
048
–6.
3950
1.21
149
3.65
1–1
.51
AN
DE
AN
1 2
07.9
111
316.
597
9.00
1 29
6.87
6–
1.50
96.9
0699
.530
2.71
AG
OA
1 64
2.91
81
398.
220
–14
.89
1 2
44.2
16–
11.0
110
1.88
411
0.85
48.
80E
gypt
424.
731
442.
412
4.16
615.
171
39.0
545
.863
60.2
8831
.45
Jord
an86
1.97
598
7.35
814
.55
1 11
8.88
213
.32
86.2
1974
.317
–13.
80S
ub T
otal
21 1
38.3
8620
237
.140
–4.
2619
015
.267
–6.
041
346.
660
1 27
2.29
3–
5.52
Sou
rce:
Aut
hor’s
com
pila
tions
.
Not
es:
CA
FTA
-DR
inc
lude
s C
osta
Ric
a, D
omin
ican
Rep
ublic
, E
l S
alva
dor,
Gua
tem
ala,
Hon
dura
s an
d N
icar
agua
.A
ND
EA
N i
nclu
des
Bol
ivia
, C
olom
bia,
Ecu
ador
and
Per
u.A
GO
A i
nclu
des
37 S
ub-S
ahar
an A
fric
an C
ount
ries.

106
Tab
le 1
4.
Maj
or
Pre
fere
nti
al S
up
plie
rs P
erfo
rman
ce i
n C
hin
a R
estr
icte
d I
tem
s in
th
e U
S M
arke
t(V
olu
me
in M
illio
n S
qu
are
Met
er E
qu
ival
ents
)
2004
2005
% c
han
ge
2006
% c
han
ge
YT
D 2
006
YT
D 2
007
% c
han
ge
Pre
fere
ntia
l S
uppl
ier:
Can
ada
1 62
2.18
51
536.
676
–5.
271
264.
119
–17.
7412
1.73
885
.375
–29.
87M
exic
o2
569.
924
2 38
4.99
3–
7.20
2 11
7.37
7–1
1.22
157.
408
130.
679
–16.
98C
AF
TA-D
R3
419.
604
3 51
2.88
22.
733
211.
127
–8.5
920
2.81
920
4.32
50.
74A
ND
EA
N22
6.92
322
5.74
9–0
.52
206.
649
–8.4
615
.847
15.6
88–1
.00
AG
OA
399.
425
351.
122
–12.
0931
1.40
3–1
1.31
25.4
1029
.042
14.2
9E
gypt
189.
524
178.
254
–5.9
520
1.42
013
.00
17.9
5017
.787
–0.9
1Jo
rdan
188.
390
222.
830
18.2
825
1.69
012
.95
20.1
2016
.333
–18.
82S
ub T
otal
8 61
5.97
58
412.
506
–2.
367
563.
785
–10.
0956
1.29
249
9.22
9–1
1.06
Sou
rce:
Aut
hor’s
com
pila
tions
.
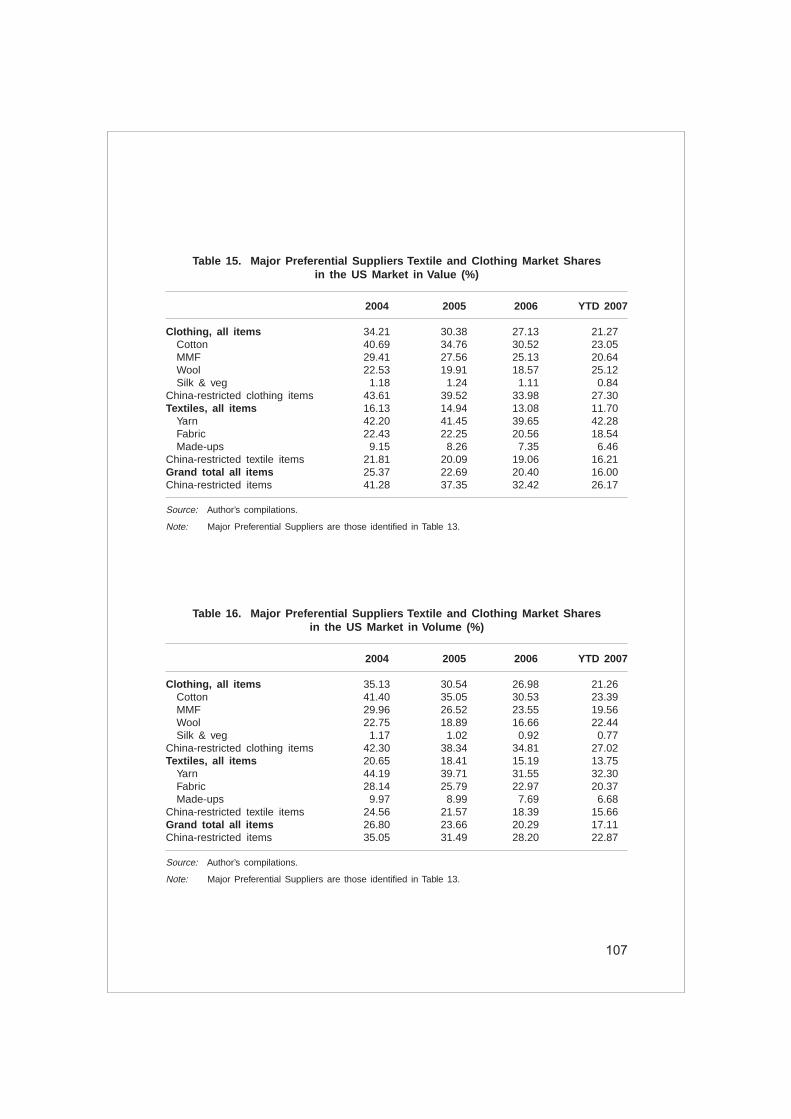
107
Table 15. Major Preferential Suppliers Textile and Clothing Market Sharesin the US Market in Value (%)
2004 2005 2006 YTD 2007
Clothing, all items 34.21 30.38 27.13 21.27Cotton 40.69 34.76 30.52 23.05MMF 29.41 27.56 25.13 20.64Wool 22.53 19.91 18.57 25.12Silk & veg 1.18 1.24 1.11 0.84
China-restricted clothing items 43.61 39.52 33.98 27.30Textiles, all items 16.13 14.94 13.08 11.70
Yarn 42.20 41.45 39.65 42.28Fabric 22.43 22.25 20.56 18.54Made-ups 9.15 8.26 7.35 6.46
China-restricted textile items 21.81 20.09 19.06 16.21Grand total all items 25.37 22.69 20.40 16.00China-restricted items 41.28 37.35 32.42 26.17
Source: Author’s compilations.
Note: Major Preferential Suppliers are those identified in Table 13.
Table 16. Major Preferential Suppliers Textile and Clothing Market Sharesin the US Market in Volume (%)
2004 2005 2006 YTD 2007
Clothing, all items 35.13 30.54 26.98 21.26Cotton 41.40 35.05 30.53 23.39MMF 29.96 26.52 23.55 19.56Wool 22.75 18.89 16.66 22.44Silk & veg 1.17 1.02 0.92 0.77
China-restricted clothing items 42.30 38.34 34.81 27.02Textiles, all items 20.65 18.41 15.19 13.75
Yarn 44.19 39.71 31.55 32.30Fabric 28.14 25.79 22.97 20.37Made-ups 9.97 8.99 7.69 6.68
China-restricted textile items 24.56 21.57 18.39 15.66Grand total all items 26.80 23.66 20.29 17.11China-restricted items 35.05 31.49 28.20 22.87
Source: Author’s compilations.
Note: Major Preferential Suppliers are those identified in Table 13.
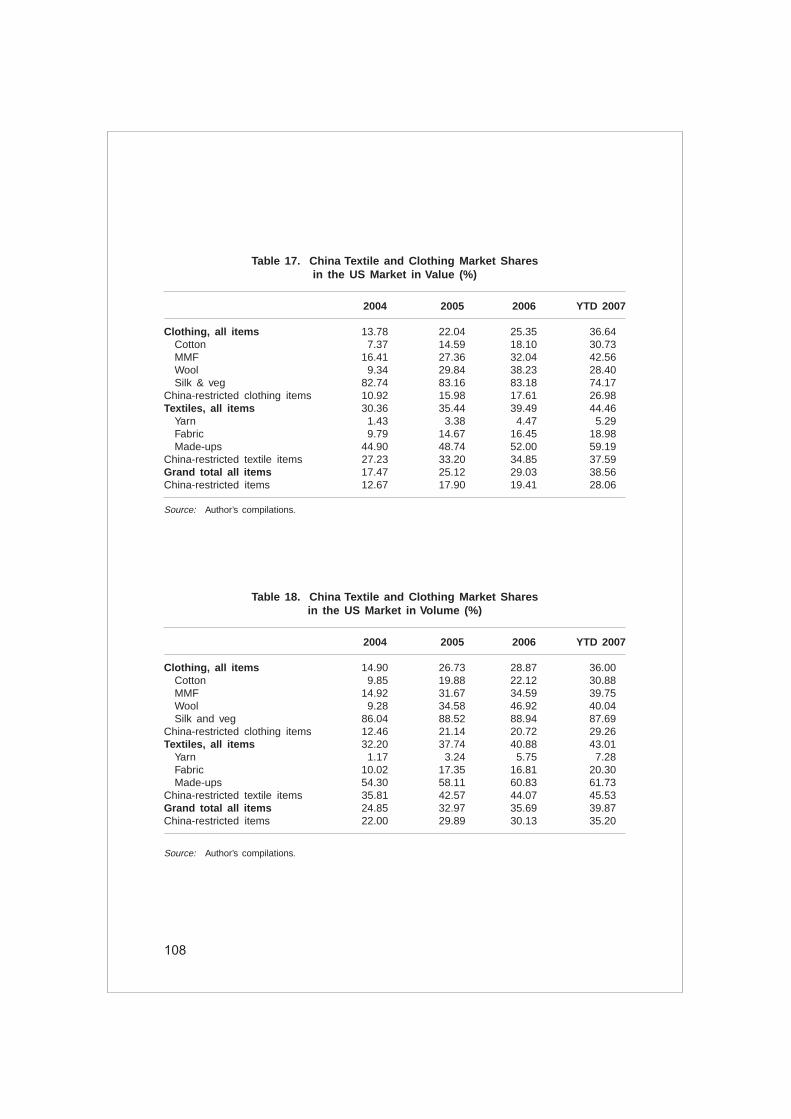
108
Table 17. China Textile and Clothing Market Sharesin the US Market in Value (%)
2004 2005 2006 YTD 2007
Clothing, all items 13.78 22.04 25.35 36.64Cotton 7.37 14.59 18.10 30.73MMF 16.41 27.36 32.04 42.56Wool 9.34 29.84 38.23 28.40Silk & veg 82.74 83.16 83.18 74.17
China-restricted clothing items 10.92 15.98 17.61 26.98Textiles, all items 30.36 35.44 39.49 44.46
Yarn 1.43 3.38 4.47 5.29Fabric 9.79 14.67 16.45 18.98Made-ups 44.90 48.74 52.00 59.19
China-restricted textile items 27.23 33.20 34.85 37.59Grand total all items 17.47 25.12 29.03 38.56China-restricted items 12.67 17.90 19.41 28.06
Source: Author’s compilations.
Table 18. China Textile and Clothing Market Sharesin the US Market in Volume (%)
2004 2005 2006 YTD 2007
Clothing, all items 14.90 26.73 28.87 36.00Cotton 9.85 19.88 22.12 30.88MMF 14.92 31.67 34.59 39.75Wool 9.28 34.58 46.92 40.04Silk and veg 86.04 88.52 88.94 87.69
China-restricted clothing items 12.46 21.14 20.72 29.26Textiles, all items 32.20 37.74 40.88 43.01
Yarn 1.17 3.24 5.75 7.28Fabric 10.02 17.35 16.81 20.30Made-ups 54.30 58.11 60.83 61.73
China-restricted textile items 35.81 42.57 44.07 45.53Grand total all items 24.85 32.97 35.69 39.87China-restricted items 22.00 29.89 30.13 35.20
Source: Author’s compilations.

109
Asian Development Bank, 2006. Asian Development Outlook 2006: Routes for Asia’sTrade. Manila.
, 2007. Asian Development Outlook 2007: Growth and Change. Manila.
Azhari, N., 2007. “Textiles and clothing trade post-ATC: Can trade facilitation help?”ESCAP and Colombo Plan Secretariat paper presented at the Regional Dialogueon Restrictive Policies and Measures in the Textile and Clothing Trade, 9-10April, Shanghai, China.
EmergingTextiles.com, 2007a. “EU clothing imports in 2006,” statistical report, 31 March(www.emergingtextiles.com).
, 2007b. “US-China quota fill rates and prices by mid-March,” monthly report, 22March (www.emergingtextiles.com).
, 2007c “Vietnam imposing minimum prices for apparel exports to the UnitedStates,” 13 March (www.emergingtextiles.com).
European Commission, 2005. “EU-China textile agreement,” Memo/05/201, 12 June.Brussels.
James, W. E., 2007. “Priority sectors for trade and investment promotion in the SouthAsian region: A case study of the textiles and clothing industries,” draft report,Asian Development Bank, Manila.
, 2006. “Rules of origin in emerging Asia-Pacific preferential trade agreements:Will PTAs promote trade and development?” Trade Working Paper Series, No. 19,Asia-Pacific Research and Training Network, Bangkok.
James, W. E., P. J. Minor and K. Dourng, 2007. “Non-tariff measures in ASEAN textileand apparel sectors: Impact on competitiveness and regional integration”, REPSFProject No. 06/001c.
Office of Textiles and Apparel, 2006. “Memorandum of Understanding”, United StatesDepartment of Commerce, Washington, D.C. (Available from http://www.otexa.ita.doc.gov/).
Trebilcock, M. J. and R. Howse, 2005. The Regulation of International Trade, thirdedition. Routledge, London and New York.
REFERENCES

110

111
IV. DOES CHINA HAVE A COMPETITIVE ADVANTAGEIN THE LOW-END GARMENT INDUSTRY?
A CASE STUDY APPROACHBy Bala Ramasamy and Matthew Yeung*
Introduction
A new era began in the textile and garment industry on 1 January 2005. A four-decade long system of trade restraints on the exports of textiles and garments endedwith the full implementation of ATC. An import quota system practiced by the developedcountries (particularly the United States and the European Union), while aimed atprotecting domestic producers in those countries, provided a ready market for textileand garment producers in developing countries despite their inefficiencies in production.The removal of the quotas and the re-emergence of China and India as economicpowerhouses have posed serious problems for several Asian developing economies(e.g., Cambodia, Indonesia, Mongolia and the Lao People’s Democratic Republic). Tradeeconomists feared that these countries would be unable to compete with China despitea temporary safeguard measure imposed by the European Union and the United Statesthat is valid until the end of 2008 (Nordås, 2004).
China’s pre-eminent position as the world’s largest exporter of textiles andgarments is beyond doubt. The ADB reported that in 2005 China controlled more than aquarter of the market share of clothing imports in the United States and a third of theEuropean Union’s imports of textile and clothing. What drives China’s advantage in thisindustry? Macro studies tend to point to, among other factors, China’s low labour costs.However, economic development in China is also pushing wage rates upwards. To whatextent is the low labour cost argument true? What are other drivers that cement China’sposition as the “tailor to the world”? To what extent are restrictive trade policies affectingindividual firms? Can Chinese garment manufacturers continue to dominate the garmentindustry in the long term? This chapter attempts to answer these questions by using acase study approach. Other studies have considered similar questions at a macro level(Dayaratna-Banda and Whalley 2007; Tong, 2006; Yamagata, 2007; Yang, 1995, 1999;Yang and Zhong, 1998). However, in-depth case studies of garment manufacturers arecapable of providing insights that could help producers and policy makers in theirdecision- making. In this chapter, a comparison is made of two garment manufacturers– one located in Beijing and the other in Jakarta – their cost structures and thechallenges they face in their respective countries.
Section A provides a general discussion of the trade policies within the garmentindustry and its implications for China. Section B provides an overview of the garmentindustry in China. Section C introduces the methodology used in this study, particularlya description of the manufacturers who form the basis of the study. Section D providesthe findings, followed by a discussion of the results in section E.
* The authors acknowledge a grant provided by ESCAP for undertaking this study. Thanks arealso due to Yuan Yizhou for his research assistance.

112
A. Quotas, no quotas, more quotas
Historically, the textile and garment industry has been the most regulatedmanufacturing sector in international trade. In an effort to protect their domesticindustries, the European Union and the United States restricted imports of textiles fromJapan in the 1950s and 1960s. These restrictions were then extended to countries suchas India, Hong Kong, China, and Pakistan. These restraints, which were complex innature, were brought together under the MFA in 1974. Developed countries wereallowed to impose export restraints on developing countries under the MFA if there wasevidence of market disruptions in their home markets. The MFA quota regime andincreasing labour costs resulted in the outsourcing of labour-intensive production ofgarments to low-cost countries following the “flying geese pattern”, i.e., from Japan tothe newly industrialized countries to South-East Asia. As China and Viet Nam venturedinto reforms of their respective economies, they also have been recipients of theseinvestments. Unexpectedly, the MFA resulted in the emergence of garment industries incountries that did not have a true competitive advantage in the sector (Deutsche Bank,2005). However, this provided a launching pad for industrialization among LDCs (Nordås,2004; Brenton and Hoppe, 2007).
On 1 January 1995, the plan to phase out the MFA during the following 10 yearsled to ATC, under which quotas were to be gradually removed in four stages resulting ina complete no-quota environment on 1 January 2005. The growing economic prowess ofChina and its accession to WTO in 2001 were perhaps in the minds of negotiatorssince ATC allowed importers to impose safeguard measures if there was evidence toshow there as an imminent threat to their own domestic industry. Although China wasexcluded from the agreement in the initial phases, the increase in quotas in the earlierstages was grandfathered into the later stages when China acceded to WTO. However,a no-quota environment for China only lasted a few months as the United Statesinitiated safeguard measures on 12 apparel and textile products (later increased to 34product categories) until the end of 2008.
The European Union was more supportive of liberalization in that it imposedsafeguards on 10 product categories that were to last until 2008. The European Unionalso agreed that it would not extend the safeguards after 2008. Nevertheless, under theChina accession protocol, member States can impose product-specific safeguard mea-sures for 12 years after accession, and China’s status as a non-market economy allowsother member States to impose anti-dumping and countervailing actions against Chinauntil 2016. Brazil, Canada, Mexico, Peru, South Africa and Turkey have thus far takenaction against China. Ironically, while the objective of extending the quota environmentwas to protect domestic suppliers, research tends to suggest that imports from Chinaare being diverted to other low-cost and perhaps less efficient international producers(Brambilla and others, 2007). Despite such evidence, the possibility of China experienc-ing a quota-free environment in the near future looks bleak. Thus, it is necessary forChinese garment manufacturers to assume that a quota-imposed environment willcontinue for the next 10 years and to make the necessary strategic decisions.
B. Textile and garment industry in the Chinese economy
The textile and garment industry has been a strategic component of China’seconomy since 1949. Like many other industries, it had experienced both stagnancy andreceding competitiveness by the end of the command economy era. Under the Reformand Opening-up Policy, the industry has undertaken major changes since the late
113
1970s. State-owned enterprises (SOEs) went through privatization, and private compa-nies (including firms with foreign investment) have now become leading players in theindustry.
The growth of the textile and garment industry has gone hand-in-hand withChina’s economic takeoff since the 1980s. Annual output increase in the garmentindustry during the past 20 years was about 15 per cent, relatively higher than thecountry’s overall GDP growth of about 10 per cent a year. However, it has lost itsposition as the leading industrial sector in the Chinese economy. In 1985, the top fiveindustries in China by proportion of total industrial output were textiles (12.1 per cent),food, beverages and tobacco (12 per cent), machinery (10.9 per cent), metallurgy (8.6per cent) and construction materials (6.9 per cent). By 1995, the top five industries byproportion of total industrial output were food, beverages and tobacco (10.9 per cent),metallurgy (9.5), machinery (8.2 per cent), textiles (8.2) and construction materials (7.7per cent). In 2005, textile output was ranked seventh (4.6 per cent) while the garmentindustry ranked seventeenth (1.9 per cent) among various industries (table 1).
In 1993, China became the world’s leading exporter of textiles and garments. In2005, industrial output reached US$ 217.6 billion, with a total export value exceedingUS$ 100 billion. Although in terms of industrial output other more technology-basedindustries such as communications equipment, computers and other electronic equip-ment became more important, the growth in the manufacturing of textiles, wearingapparel, footwear and caps increased dramatically (see table 1).
Although China’s textile and garment industry enjoyed continuous expansion andits share of GDP growth remained stable, its contribution to China’s total exportsappears to have decreased. In 1996, the industry accounted for 2.7 per cent of GDPand 6.5 per cent of total industrial output, and employed 12.4 per cent of the labourforce. Comparatively, in 2005, the industry accounted for about 2.9 per cent of China’sGDP, 7 per cent of China’s total industrial output and 13.4 per cent of employment inindustries. However, the following figure shows that the proportion of textile and garmentexports decreased from 23.1 per cent in 1996 to 15.1 per cent in 2005. It should benoted, however, that the export value has tripled.
In 2005, China’s total exports of textiles and garments amounted to US$ 115billion. The export of garments was US$ 73.9 billion, among which Asia (42 per cent),EU 25 (19 per cent) and North America (21 per cent) were major destinations. Japan,the United States, Hong Kong, China, the European Union, the Russian Federation andthe Republic of Korea were the major national markets. Jerseys, pullovers, cardigansetc. (HS Code 6110) comprised the largest exported category in 2006. As table 2shows, China’s total exports of knitted and non-knitted garments increased by 489 percent and 200 per cent, respectively, but that exports of men’s trousers and shirts werebelow industry average.
Prior to 2001, the textile and garment industry accounted for 5 per cent of FDI intoChina, and foreign enterprises contributed about 35 per cent of total exports. The increaseof FDI in the industry has been higher than the national average since 2000. From 2000 to2005, FDI into China grew by 48.2 per cent, while FDI into the textile and garment sectorincreased by 56.2 per cent. The major investors were from Hong Kong, China, TaiwanProvince of China, Japan and the United States, and the investment primarily went tocoastal regions. In 2006, FDI in the garment sector was 30.9 per cent of the total amountof investment while in the textile sector it amounted to 16.5 per cent. In December 2004,China lifted restrictions vis-à-vis region, equity structure and total number for foreignenterprises, and trends for expansion into China’s inland areas are perceivable.

114
Tab
le 1
. C
hin
a’s
lead
ing
in
du
stri
es b
y g
ross
in
du
stri
al o
utp
ut,
1999
an
d 2
005
Gro
ssP
rop
ort
ion
of
Gro
ssP
rop
ort
ion
of
Per
cen
t20
05In
du
stry
ind
ust
rial
tota
l in
du
stri
alin
du
stri
alto
tal
ind
ust
rial
incr
ease
ran
kin
go
utp
ut
1999
ou
tpu
t, 1
999
ou
tpu
t 20
05 o
utp
ut
2005
fro
m 1
999
(Y 1
00 m
illio
n)
(%)
(Y 1
00 m
illio
n)
(%)
to 2
005
1C
omm
unic
atio
n eq
uipm
ent,
com
pute
rs a
nd o
ther
ele
ctro
nic
equi
pmen
t2
513.
217.
122
594
.03
9.0
799
2S
mel
ting
and
pres
sing
of
ferr
ous
met
als
3 03
4.52
8.5
17 3
09.8
16.
947
0
3P
rodu
ctio
n an
d su
pply
of
elec
tric
pow
er a
nd h
eat
pow
er3
423.
739.
614
904
.26
5.9
335
4M
anuf
actu
re o
f tr
ansp
ort
equi
pmen
t3
164.
638.
914
538
.43
5.8
359
5M
anuf
actu
re o
f ra
w c
hem
ical
mat
eria
lsan
d ch
emic
al p
rodu
cts
2 60
5.09
7.3
14 0
27.7
45.
643
8
7M
anuf
actu
re o
f te
xtile
s1
547.
674.
411
655
.12
4.6
653
17M
anuf
actu
re o
f te
xtile
wea
ring
appa
rel,
foot
wea
r an
d ca
ps14
2.39
0.4
4 66
8.52
1.9
3 17
9
Chi
na t
otal
35 5
71.1
810
025
1 61
9.50
100
607
Sou
rce:
Chi
na N
atio
nal
Bur
eau
of S
tatis
tics.

115
Export value of China’s textile and garment industry, 1996-2005
Source: Annual Report on China’s International Trade in Textiles and Clothing, 2005-2006.
1 400
1 200
1 000
800
600
400
200
0
25
20
15
10
5
01996 1997 1998 1999 2000 2001 2002 2003 2004 2005
Export value (US$ 100 million) Per cent of total export value
Table 2. China’s garment exports, 1996 and 2006: selected items
HS Garment type Export value, Export value, Per centCode 1996 (US$) 2006 (US$) increase
61 Articles of apparel, accessories,knit or crochet 7 626 391 947 44 900 426 797 489
62 Articles of apparel, accessories,not knit or crochet 14 570 613 800 43 720 321 656 200
6110 Jerseys, pullovers, cardigansetc., knit or crochet 2 529 116 127 12 858 753 806 408
610342 Men’s or boys’ trousers,overalls, breeches, cotton, knitted 101 250 996 349 186 224 245
610510 Men’s or boys’ shirts, cotton,knitted 33 510 330 144 144 213 330
620342 Men’s or boys’ trousers andshorts, cotton, not knit 1 067 967 088 3 214 116 820 201
620530 Men’s or boys’ shirts, man-madefibres 382 015 593 779 491 671 104
Source: United Nations Comtrade Database.

116
Despite growth in output and profitability in the textile and garment industry, 20per cent of the small and medium-sized garment enterprises reported losses. State-owned enterprises now comprise less than 1 per cent of the total industry, while theprivate sector dominates the industry. In general, SOEs lag behind private and foreignenterprises in terms of profitability, although they appear to be larger in terms ofaverage number of employees. Compared to domestically owned private firms, foreignenterprises are more capital intensive, suggesting higher technological standards. Thecorrelation between asset/size ratio and profitability appears to support the perceptionthat China’s labour cost advantage in the textile and garment industry may be ebbing(table 3). For example, the average salary in Shenzhen rose nearly three-fold in thepast 10 years, and a yarn worker in Zhejiang may earn 70 per cent more than a similarworker in Henan, an inland province that is rich in labour supply. Therefore, manymanufacturers are already relocating to third-tier towns and even other provinces toretain cost advantage. Moving production locations to South-East Asia is also beingconsidered as an option.
Location being a decisive factor, China’s textile and garment industry is distinc-tively regionalized. The five coastal provinces, that is, Zhejiang, Guangdong, Jiangsu,Shanghai and Shandong, comprise the majority of industrial output by producing 81 percent of chemical fibre, 60 per cent of yarn and 66 per cent of cloth. The five provincescombined account for 77.2 per cent of China’s total export value of textiles andgarments (tables 4 and 5).
China has emphasized the upgrading of industrial productivity by investing in thetechnology side. In 2005, the import value of equipment was US$ 3.45 billion, an 80 percent increase compared with 2000. The top five exporting provinces took up 83 per centof the imports of equipment, mostly from Japan, Germany and Italy.
In sum, the textile and garment industry is vital for the national economy,employment, and foreign trade, not only for China but also for other labour-intensiveeconomies including Cambodia, India, Indonesia, Pakistan and Viet Nam. The biggestfuture challenge for China’s textile and garment industry is its competitive advantage.Cheap labour, which was once the source of this advantage, is gradually becomingscarcer, particularly in the coastal areas that continue to dominate China’s textile andgarment industry. China is losing this advantage to other developing countries in theregion that are also rich in labour supply.
China has actively engaged in the global textile and garment market, although itis estimated that China is mainly producing OEM and only accounts for 10 per cent ofthe total value added of the end product.1 China’s textile and garment industry isheavily dependent on exports, and the end of ATC did not give China an easy passageto overwhelming market share. Rather, renewed trade disputes and barriers emerged.Therefore, China is trying to increase its efficiency in the textile and garment industry inthe post-ATC era by upgrading technologies and improving supply chains etc. However,these measures will further undermine the cost advantage in low-end garment manufac-ture. Using a case study approach, the following sections show the loss of advantagethat China is experiencing in these low value-added products. China is pressed to find anew competitive advantage in the global market.
1 http://www.fdi.gov.cn/pub/FDI/zgjj/hyzk/zzy/fzgy/t20060419_23739.htm, andhttp://english.peopledaily.com.cn/200508/31/eng20050831_205457.html
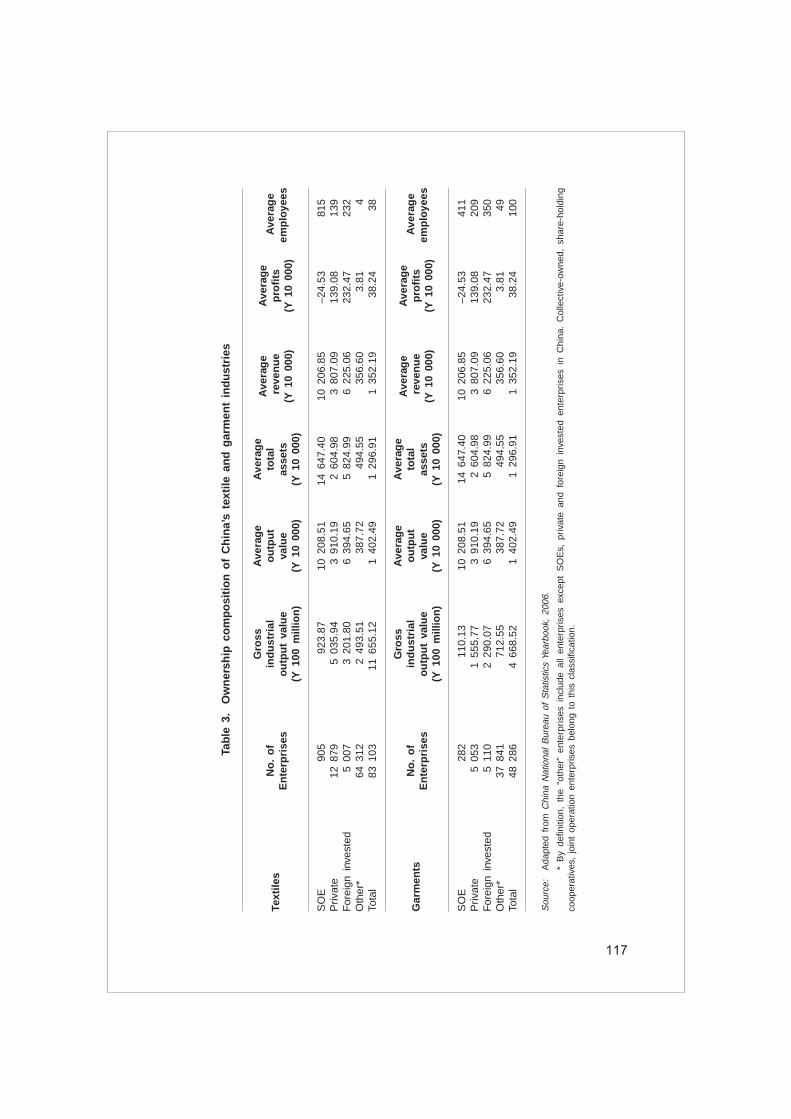
117
Tab
le 3
. O
wn
ersh
ip c
om
po
siti
on
of
Ch
ina’
s te
xtile
an
d g
arm
ent
ind
ust
ries
Gro
ssA
vera
ge
Ave
rag
eA
vera
ge
Ave
rag
eTe
xtile
sN
o.
of
ind
ust
rial
ou
tpu
tto
tal
reve
nu
ep
rofi
tsA
vera
ge
En
terp
rise
so
utp
ut
valu
eva
lue
asse
ts(Y
10
000)
(Y 1
0 00
0)em
plo
yees
(Y 1
00 m
illio
n)
(Y 1
0 00
0)(Y
10
000)
SO
E90
592
3.87
10 2
08.5
114
647
.40
10 2
06.8
5–2
4.53
815
Priv
ate
12 8
795
035.
943
910.
192
604.
983
807.
0913
9.08
139
For
eign
inv
este
d5
007
3 20
1.80
6 39
4.65
5 82
4.99
6 22
5.06
232.
4723
2O
ther
*64
312
2 49
3.51
387.
7249
4.55
356.
603.
814
Tota
l83
103
11 6
55.1
21
402.
491
296.
911
352.
1938
.24
38
Gro
ssA
vera
ge
Ave
rag
eA
vera
ge
Ave
rag
eG
arm
ents
No
. o
fin
du
stri
alo
utp
ut
tota
l re
ven
ue
pro
fits
Ave
rag
eE
nte
rpri
ses
ou
tpu
t va
lue
valu
eas
sets
(Y 1
0 00
0)(Y
10
000)
emp
loye
es(Y
100
mill
ion
)(Y
10
000)
(Y 1
0 00
0)
SO
E28
211
0.13
10 2
08.5
114
647
.40
10 2
06.8
5–2
4.53
411
Priv
ate
5 05
31
555.
773
910.
192
604.
983
807.
0913
9.08
209
For
eign
inv
este
d5
110
2 29
0.07
6 39
4.65
5 82
4.99
6 22
5.06
232.
4735
0O
ther
*37
841
712.
5538
7.72
494.
5535
6.60
3.81
49To
tal
48 2
864
668.
521
402.
491
296.
911
352.
1938
.24
100
Sou
rce:
Ada
pted
fro
m C
hina
Nat
iona
l B
urea
u of
Sta
tistic
s Ye
arbo
ok,
2006
.
* B
y de
finiti
on,
the
“oth
er”
ente
rpris
es i
nclu
de a
ll en
terp
rises
exc
ept
SO
Es,
priv
ate
and
fore
ign
inve
sted
ent
erpr
ises
in
Chi
na.
Col
lect
ive-
owne
d, s
hare
-hol
ding
coop
erat
ives
, jo
int
oper
atio
n en
terp
rises
bel
ong
to t
his
clas
sific
atio
n.

118
Table 4. Leading Provinces in the textile industry in China
Chemical Yarn ClothProvince fibre Province (10 000 tons) Province (100 million
(10 000 tons) metres)
Zhejiang 660.33 Shandong 371.77 Zhejiang 96.20Jiangsu 501.95 Jiangsu 335.60 Jiangsu 90.46Shandong 95.38 Henan 141.80 Shandong 90.17Fujian 70.12 Zhejiang 96.41 Guangdong 40.41Shanghai 49.78 Hubei 89.82 Hebei 30.76Guangdong 39.91 Hebei 68.59 Henan 23.65Henan 39.73 Fujian 64.53 Hubei 23.40Sichuan 26.56 Anhui 38.31 Fujian 21.69Jilin 24.36 Guangdong 36.64 Chongqing 14.55Liaoning 23.70 Xinjiang 27.90 Shaanxi 10.67Hebei 22.67 Hunan 26.06 Sichuan 7.93Tianjin 20.54 Sichuan 25.48 Anhui 6.66Jiangxi 18.07 Jiangxi 20.44 Liaoning 5.71Heilongjiang 17.83 Shaanxi 19.43 Jiangxi 4.12Hubei 11.74 Liaoning 17.41 Hunan 3.70Anhui 11.36 Guangxi 11.87 Shanxi 3.63Hunan 8.29 Shanghai 11.65 Tianjin 2.85Xinjiang 5.42 Shanxi 10.39 Shanghai 1.55Hainan 4.61 Tianjin 7.32 Xinjiang 1.34Yunnan 3.04 Chongqing 6.90 Heilongjiang 1.10
Source: China Textile Industry Development Report 2005-2006.
Table 5. Chinese regional contributions to textile and garmentexports and imports, 2005
Exports Imports Exports Exports,Province (US$ 10 000) (US$ 10 000) and imports per cent of
(US$ 10 000) China total
Zhejiang 2 443 507 114 855 2 558 361 21.2Guangdong 2 201 023 763 042 2 964 065 19.1Jiangsu 1 881 968 204 166 2 086 133 16.3Shanghai 1 286 866 227 549 1 514 415 11.2Shandong 1 061 994 150 782 1 212 776 9.2Five provinces combined 8 875 358 1 460 394 10 335 750 77.2China total 11 503 337 1 713 619 13 216 956 100
Source: Annual Report on China’s International Trade in Textiles and Clothing, 2005-2006.

119
C. Methodology
In an effort to understand clearly the issues discussed above, we now focus ona representative garment factory in China and analyse its cost structure for a fewselected products. As a comparison, a representative firm in Indonesia was selectedand an attempt was made to obtain similar information. Although only the cost of cut,make and trim was considered, the problems faced by each producer at various levelsof production were explored. In order to ensure valid comparability, the collection of costdata was limited to men’s shirts and men’s trousers. Since these product categories arebasic in terms of fashion and standard in terms of design, comparing manufacturers intwo different countries is possible. In this way, it is possible to highlight the competitiveadvantage of China, if any, to its counterpart in Indonesia. The latter country was for thecomparison due to the importance of the industry to the Indonesian economy resultingfrom of the changes in quota arrangements.
Information was collected from in-depth, face-to-face interviews at the city wherethe manufacturers had their offices, i.e., Beijing and Jakarta. In the case of the Beijingmanufacturer, the interviewee was the general manager of the company, while the Jakartainterviewee was the owner. In addition, three other garment manufacturers wereinterviewed – two in China and one in Jakarta – who were not engaged in the productionof shirts and trousers, but had an in-depth knowledge of the industry. The interviews,which lasted between 2 hours and 2.5 hours, were conducted in a cordial manner. Theinterviewees were extremely helpful and more than willing to share their experience withthe interviewers. Additional information was solicited through e-mail at later stages.
The interviews focused on a number of issues including the cost of production,availability of raw materials, labour quality and availability, quotas and tariffs, qualitystandards and requirements, customs procedures, and governance and regional agree-ments.
Brief profiles of the companies interviewed are provided below. The names of thecompanies have been kept confidential for competitive reasons.
1. Company A in Jakarta
Established in 1989, Company A is a garment manufacturer in Jakarta, Indone-sia. Starting from basic garment products, it has grown into a competitive regional andinternational market participant. It has developed two business units – Firm S for OEMand Firm T for proprietary branding. Firm S now boasts 800 employees, 10 productionlines and an annual capacity of 2 million pieces. Firm T is of similar size, with acapacity of about 700 employees and 10 lines.
The main products of the company include woven and knitted ladies’ apparel,blouses, skirts, trousers etc., and production is backed by digital technology. Firm Saims to be a solution provider by incorporating in-house facilities and by practicing rigidAQL quality controls. Production is divided into three departments: cutting, sewing andfinishing. Both Firm S and Firm T have a daily output of about 5,000 pieces. CompanyA has been a supplier of many renowned apparel brands to the European Union andthe United States, including Liz Claiborne, Quicksilver and Kellwood. About 60 per centof its exports go to the United States, 30 per cent to the European Union and 10 percent to the rest of the world. Firm S may have benefited from its locational advantagein east Jakarta’s Export Processing Zone (e.g., efficiency in export procedures andenhanced security).
120
Company A aims to be a leader in the regional garment market by emphasizingboth quality and corporate responsibility. Since 1998, Firm S has been a certified vendorof Target and Wal-Mart. In 2005, it obtained ISO 9002 Quality Certification. Firm S andFirm T also received their Worldwide Responsible Apparel Production (WRAP) certifica-tion in 2003 and 2007, respectively.
2. Company C in Beijing
Company C is a SOE located in Beijing, and a leading SOE in the industry. Ithas a number of subsidiaries producing various types of textiles and garments. It alsohas a dedicated subsidiary that focuses on its international trading activities. With officesin Japan, the United States and the United Arab Emirates, Company C is among thetop 100 garment exporters in China with a total export value of US$ 75 million in 2005.
The focus here is on two subsidiaries that are engaged in the production ofmen’s shirts and men’s trousers. Firm X and Firm Y were established in 1996 in aneconomic development zone, 40 km from Beijing and 60 km from Tianjin, one of thebusiest ports in northern China. Firm X is a Sino-Japanese joint venture that currentlyhas about 1,000 employees, 22 production lines and 4 workshops (1 cutting, 2 tailoring,and 1 dyeing and finishing). The fixed assets exceed yuan renminbi 22 million (US$ 3million), and the majority of the machines have been imported from Japanese textileequipment manufacturers Brother and Juki. The products of Firm Y include jackets,trousers, suits and skirts, with a total annual output of about 1.6 million pieces. Firm Xenjoys customer design capacities and its products fulfill the nation’s first-class qualityranking for garment exports. Firm X’s international partners include GAP, Columbia andLiz Claiborne.
Firm Y is a Sino-United States joint venture that currently has about 660 staffmembers and 5 workshops (1 cutting and 4 tailoring), 17 production lines (9 for shirts,4 for fashion and 4 for other garment lines). Most of the production equipment wasimported from Japan and its products include shirts, blouses, and fashion and othergarments. The company’s annual output is about 1.6 million pieces, which are mainlyexported to Japan, the United States, Germany and Australia. Firm Y received ISO9002certification in 2000.
3. Additional interviews
Mr. J, who is from Hong Kong, China, has factories in Guangdong province,China. He was involved in the production of men’s shirt and trousers seven years agobut decided to move on to higher value-added products. Currently, Mr. J focuses on thedesign and production of wedding gowns for export.
Mr. U is a German who owns a manufacturing plant in Zhejiang province, China.He also has a showroom in Shanghai with headquarters located in Macau, China. Mr. Uhas been involved in the garment industry for more than 30 years, building up hiscurrent business from scratch. He also engages in consulting for foreign enterprisesdealing with textiles and garments in China.
Mr. C is a Malaysian who has lived in Indonesia for the past 30 years. Hespecializes in the garment trade although he does not own any plants. He acts as anintermediary between clients in the United States and the European Union, and producersin Indonesia. As such, Mr. C is well versed in the issues considered in this project.
121
D. Findings
1. Cost of production
Surprisingly, there appears to be no difference in direct labour costs between themanufacturer in Beijing and the one in Jakarta. Both reported that the direct labour costwas US$ 0.90 per shirt and US$ 1.10 per pair of trousers. There is also no significantdifference between the average monthly salaries of production workers and supervisorsin the two locations. On average, production workers earn between US$ 120-US$ 130per month, while supervisors earn about US$ 200 per month. However, there appears tobe a difference in productivity in shirt making. In Beijing, the productivity is 14.54 shirtsper worker, while in Jakarta it is 11.90. This may be due to higher capital intensity asthe Beijing manufacturer reported 45 machines per production line compared to 34 inJakarta. There does not appear to be a significant difference in productivity in trousermaking, i.e., 8.57 pairs of trousers per worker in Beijing compared with 8.70 in Jakarta,although the number of machines per line in Jakarta is greater.
It is also interesting to note that the cost of raw materials in the form of fabricand accessories shows an insignificant difference between the two locations. For astandard specification of 133 x 72/40 x 40 at 48”/50” width (used for shirt production),the cost in both countries was reported to be US$ 1.32 – US$ 1.35 per yard. Fortrouser production, fabric of 120 x 80/32 x 32, width 48”/50” costs between US$ 1.53and US$ 1.55 per yard. Accessory (buttons, zippers etc.) costs range from 50 centsfor shirts to 80 cents for trousers in both countries. The Chinese manufacturersources most of the required fabric from within China but about 10 per cent issourced from overseas. In particular, more fancy fabric (for other items such asblouses etc.) is imported from the Republic of Korea and Taiwan Province of China.The Indonesian manufacturer sources 90 per cent of his fabric for shirt productionfrom foreign suppliers, i.e., China, the Republic of Korea and Taiwan Province ofChina (the ratio being 30 per cent, 30 per cent and 40 per cent, respectively). Fortrousers, 50 per cent of the fabrics are imported from China, while the remainder isfrom the Republic of Korea and Taiwan Province of China. There do not appear to beany issues in sourcing as the delivery lead-time in both countries ranges from 20-30days for plain dyed fabric to 35-40 days for yarn-dyed fabric. The interesting point tonote here is that despite sourcing the fabric from China, the Indonesian manufactureris still able to obtain it at a price and a lead-time that is competitive to the Chineseproducer.
Utility costs are more expensive in China than in Indonesia. For example, thecost of electricity in Beijing is US$ 0.104 per kWh compared with US$ 0.06 inJakarta. The cost of rental is also far higher in Beijing. The cost of office space inBeijing is US$ 172.41 per m2 per year compared with only US$ 18 in Jakarta. It wasnot possible to determine the cost of factory space as it is fully owned by the Beijingoperator. The cost of capital is not relevant in these two cases because the Beijingoperator has a small loan while in Indonesia garment manufacturers are not eligiblefor bank loans.2
2 As a result of the 1997 economic crisis in Asia, the Indonesian Central Bank blacklistedcompanies in the textile and garment industry as they had a high degree of non-performing loans.Ten years after the crisis, the industry continues to be penalized by the financial community.

122
Quotas can be a major cost to Chinese producers. In the case of the Beijingmanufacturer, the government allocated quotas for shirts and trousers are quite small.For these government allocated quotas, the manufacturer needs to pay US$ 0.80 perdozen shirts and US$ 1.75 per dozen pairs of trousers. If quotas are purchased fromthe open market, the cost can go up to US$ 4-US$ 5 per dozen shirts and US$ 10-US$ 15 per dozen pairs of trousers. Hence, while the quotas can provide someprotection for a manufacturer, they can also hamper production. The manufacturerinsisted that the removal of the quota for the products in question in 2007 by theEuropean Union and in 2008 by the United States could reduce the cost and providemore opportunities for China’s garment manufacturers. Quota costs do not apply to theIndonesian manufacturer.
Neither manufacturer is required to pay import duties as these are paid by thebuyers.3 In the case of Indonesia, VAT of 10 per cent is imposed on fabrics boughtfrom local sources. However, if the fabric is used for export purposes, a 60 per centrebate is offered, although this may involve a six-month waiting period. In the case ofimported fabrics, a 2.5 per cent duty is imposed. In China, VAT is imposed on allmaterials purchased locally. However, if the materials are used for export purposes, an11 per cent refund is granted for garments.4 It should be noted that this rebate hasgradually been reduced by the Chinese authorities.
2. Issues in production
The lead-time for production is quite similar for both locations. Both manufactur-ers reported similar periods, i.e., 30 days. However, the rejection rate experienced bythe Chinese producer was far higher than the Indonesian manufacturer (i.e., 5 per centto 10 per cent in China compared with 2 per cent in Indonesia).
Perhaps the most important issue raised by both respondents was labour-relatedmatters. The Chinese producer complained that there was an acute shortage of skilledlabour, which increased his production costs. Increasingly, customers are moving theirorders towards South-East Asian countries such as Viet Nam and Cambodia. On theother hand, the Indonesian producer lamented that the labour laws provided anadvantage to workers. In 2007, for example, the minimum wage rate was increased fromRp 819 100 (about US$ 89) to Rp 900 516 (about US$ 99).5 Compliance with theminimum wage law is mandatory not only because it is required by law, but also due topressure by the customer for the producer to comply with WRAP. Under WRAP, wages,working hours, minimum working age, benefits, safety and health etc. are stated indetail. The Indonesian producer has the required WRAP certification, but the result ishigher production costs. The tight labour law with regard to remuneration also does notallow the producer to switch to a piece rate system.
The labour issues in China must not be underestimated. It was reported by oneof the additional interviewees that there was a tendency for management as well theworkers to opt out of a legal contract so that welfare payments (which may be up to 25
3 The agreement with the buyer from the European Union and/or United States is on an FOBbasis.
4 For textile production, the rebate is lower at 9 per cent.
5 As a comparison, in 2007 the minimum wage rate in Beijing is Y 730 (about US$ 96)compared with Y 640 (about US$ 84) in 2006.

123
per cent of total salaries) need not be paid to the Government.6 A lower than actualnumber of workers are reported to the authorities, which results in a smaller amount ofwelfare contribution being paid by the producer while the workers get to keep a largerportion of their income. In such cases, the incentive to pay on a piece rate and/or lowerthan minimum wages is likely. In a competitive market like that for shirts/trousers, badproducers can drive out the good ones.
Interestingly, neither of the producers complained about custom procedures orillegally solicited payments, either in their operations or in the transportation of theiroutput. This may be due to their factories being located in free trade or bonded zones.However, the Indonesian producer allocates 0.2 per cent of total sales for this purpose.The Chinese producer, being an SOE, need not deal with these issues. Similarly,sourcing for fabric and accessories was not considered an issue, at least in theproduction of shirts and trousers. However, this may emerge as a problem for morefancy garments, which require fabric that is more sophisticated.
Finally, both producers are focusing their efforts towards markets in the Euro-pean Union, the United States and, to a certain extent, Japan. Regional agreements donot appear to have benefited either producer. The Indonesian manufacturer, despitehaving some business in the ASEAN region, was unaware of any regional efforts thatcontributed to his industry. The Beijing manufacturer had no comment on regionalagreements affecting garments.
E. Discussion and conclusion
Despite current belief that China has abundant cheap labour to offer in the low-end garment industry, the authors’ research found no such evidence. There is no clearcompetitive advantage for China compared to its rivals in South-East Asia. In China,several factors may have contributed to the rising cost of labour. China continues to bethe economic powerhouse in Asia, attracting investors from many types of industries.Local companies are also expanding in order to satisfy the insatiable appetite ofChinese consumers. Thus, the demand for labour is continuously increasing, particularlyskilled labour or at least labour that is trainable. The low-end garment industry needs tocompete with other industries in attracting talent, pushing up wage rates. In addition, therising cost of living, as highlighted by the increasing inflation rate over the past fewmonths, is forcing workers to demand higher wages. In other words, the cheap labouradvantage in China is becoming a myth rather than a reality.
In order to remain competitive, Chinese manufacturers have two choices. First,they can move west towards the inland provinces, where cheap but unskilled labour maybe still available. If it is critical that they remain in the coastal provinces for logisticalreasons, shifting production operations to third- or fourth-tier cities within these prov-inces may be an option. However, accessibility to skilled labour in those smaller citiesmay still be an issue as the migration of workers to larger cities continues. However,such a move would provide some solace, at least in the short term. In fact, relocating tosmaller cities is already a trend among some garment producers (CTEI, 2007). Second,Chinese producers may need to consider relocating to neighbouring South-East Asian
6 This may not be the case with the interviewed Chinese manufacturer as it is a state-ownedenterprise.

124
countries such as Cambodia, the Lao People’s Democratic Republic and Viet Nam inorder to take advantage of relatively cheaper labour in those countries. There may belogistics issues in some of those countries, but the cost of losing foreign customers toother more competitive producers will be greater. More importantly, the findings of thepresent study show the need for Chinese producers to move towards higher-endgarments. As emphasized by the consultants during this study, profit margins are higherfor high-end garments such as sportswear and fashionable women’s wear. However, thischangeover would need a greater investment in improving the skills of the current labourforce, establishing sources for more sophisticated fabric and securing orders for suchitems from clients.
Based on the price of fabrics paid by the two interviewed manufacturers, it isclear that China also does not have a true competitive advantage, either in cost or inavailability of the raw materials. The Indonesian producer, although importing a largeportion of his fabric, is able to secure a price similar to the Chinese producer. Areduction in the cost of imports due to lower transportation costs on the one hand, andtariff liberalization policies on the other, point to an advantage that China will continue tolose in the medium term. In fact, as Chinese producers move to higher-end garmentitems, more resources will be allocated to fabrics that are more sophisticated ratherthan those required for lower-end products. In the long term, China may have to turn toimports for low-end fabrics.
China’s lack of a competitive advantage brings us to the issue of quotas. If thedirect cost of production between the Chinese and the Indonesian producer is more orless the same, the price paid for the quota puts the Chinese producer at a cleardisadvantage. The cost of quotas may be forcing Chinese producers to engage in illegalpractices, e.g., transshipping through South-East Asian countries, or the exploitation ofworkers by providing a less than appropriate work environment. Since quotas are anadded cost to Chinese producers, it is not surprising that the interviewed Chinesemanufacturer reported a maximum profit margin of 8 per cent compared with the 10 percent earned by his Indonesian counterpart. Considering the appreciation of the yuanrenminbi since the middle of 2006 (it has reportedly appreciated about 10 per centsince China adjusted its exchange rate policies in July 20057), it is obvious that Chineseproducers at the low end of the garment industry are being squeezed out of theirprofits. Therefore, the exports of these low-end products by China should decline. Astable 6 shows, after a sudden spurt of growth in 2005 due to a no-quota environment,the growth in exports of knitted and woven garments to the United States in 2005/06was relatively lower. The growth in the export of shirts (knitted or crocheted) in 2005/06was far higher than the sector average, i.e., 83.3 per cent compared with the average of23.1 per cent. However, non-knitted shirts (HS6205) literally stagnated (-1.3 per cent) in2006.
Why is there a difference between exports of knitted and non-knitted shirts tothe United States? It is likely that more orders for non-knitted shirts are being directedto South-East Asia compared with orders for knitted shirts. The fabric for non-knittedshirts is less cumbersome, and the most important capital investment needed is sewingmachines. On the other hand, for knitted shirts, producers require machines that canweave the yarn before cut, make and trim can take place. In other words, knitted shirtproduction is relatively more capital- and skill-intensive. It is therefore quite likely that, inthe medium term, more non-knitted shirt production will be moved out of China.
7 Financial Times, 9 October 2007.

125
Tab
le 6
. E
xpo
rts
of
shir
ts b
y C
hin
a to
th
e U
nit
ed S
tate
s
(Uni
t: U
S$)
HS
Per
cen
tP
er c
ent
Co
de
Co
mm
od
ity
2004
2005
2006
incr
ease
,in
crea
se,
2004
-200
520
05-2
006
61A
rtic
les
of a
ppar
el a
nd c
loth
ing
acce
ssor
ies,
knitt
ed o
r cr
oche
ted
2 40
8 73
5 50
85
118
797
183
6 30
2 95
8 66
211
2.5
23.1
62A
rtic
les
of a
ppar
el a
nd c
loth
ing
acce
ssor
ies,
not
knitt
ed o
r cr
oche
ted
3 47
5 71
2 76
96
603
794
883
7 88
4 39
9 39
590
.019
.461
05M
en’s
or
boys
’ sh
irts
, kn
itted
or
croc
hete
d21
267
404
50 8
73 6
6993
242
756
139.
283
.362
05M
en’s
or
boys
’ sh
irts
, no
t kn
itted
or
croc
hete
d30
3 47
0 45
743
9 23
5 78
443
3 34
3 96
444
.7–1
.3
Sou
rce:
Uni
ted
Nat
ions
Com
trad
e D
atab
ase.

126
Based on the above findings and the export figures for 2005 and 2006, oneof two scenarios is likely to occur in 2009. Here, emphasis is on the situation withregard to the United States, as it is the only nation to impose a substantial quota onChina.
In scenario one, the status quo is maintained, i.e., no major increases in exportsof low-end garments to the United States. The reason is the realization by Americanbuyers that China has lost its competitive advantage to other producers in the region.Orders that were meant for China gradually move towards other countries such asCambodia, Indonesia, the Lao People’s Democratic Republic and Viet Nam. Thus, inscenario one, the removal of quotas would have minimal effect on imports of low-endgarments by the United States.
Scenario two assumes that United States buyers are unaware of China’sdeclining competitive advantage in these low-end products. If such is the case, theremoval of quotas would result in an increase in orders from the United States buyers,perhaps diverting the orders from other developing countries such as Mexico or Turkey.On the other side of the Pacific Ocean, Chinese producers may not be willing to rejectthese orders despite a higher cost of production. The Chinese may be forced to movetheir operations inland or to outsource the labour-intensive production to lower costlocations in South-East Asia. In such a scenario, whether exports increase woulddepend on the location to which production would be shifted.
Scenario two is probably the more likely outcome. If that is indeed the case, theGovernment of China will need to address the issue, as it may invite further retaliationfrom the Government of the United States on the one hand, and a misallocation ofChinese resources on the other. As mentioned above, the future of China’s garmentindustry is in the higher value-added categories. It is therefore advisable for theGovernment of China to steer the industry in that direction. The possible policyconsiderations include: (a) removing the tax rebate that is currently granted for low-endproducts; (b) providing incentives to move production to inland provinces and/or otherlow-cost locations such as South-East Asia; and (c) offering incentives to produce highvalue-added garments, including the creation of Chinese brands.
This chapter shows that China’s labour cost advantage in low-end garmentproducts, particularly men’s shirts and trousers, is being lost to other producers in theregion. The advantage of producing its own fabrics is also not strong enough tocompete with producers of neighbouring countries. Increasing labour costs, coupled withan added quota cost and an appreciating currency, is forcing China’s producers to moveproduction to smaller cities or to outsource them completely to cheaper manufacturers inother countries. The future of China’s garment industry lies in higher-end products thatinvolve fabrics, designs and technology that are more sophisticated. The good news isthat the industry is developed enough to meet these challenges. The modernization ofits factories over the past two decades, and the clustering of firms in the textile andgarment industry through government-directed efforts, can sustain China’s position asthe “tailor to the world”.
For garment producers in competing countries, particularly developing andemerging economies in South-East Asia, greater linkages with Chinese garment produc-ers are critical. These linkages, for example by being part of China’s supply chain, couldopen markets in the developed countries and, more importantly, the growing Chinesemarket.

127
A clear limitation in this research is the case study method used. A largernumber of manufacturers would increase the credibility of the above findings. However,given limited resources, it is hoped that these findings will assist the protagonists in thegarment industry.

128
Brambilla, I., A. Khandelwal and P. Schott, 2007. “China’s experience under the MultifiberArrangement (MFA) and the agreement on textiles and clothing (ATC)”, NationalBureau of Economic Research Working Paper 13346. Cambridge, Massachusetts,United States.
Brenton, P. and M. Hoppe, 2007. “Clothing and export diversification: Still a route togrowth for low-income countries?” World Bank Policy Research Working Paper4343. Washington, D.C.
CTEI, 2007. “China’s textile and garment industry should be updated and restructured”.Translated from China Textile Economic Information Portal, available at http://news.ctei.gov.cn/show.asp?xx=87936
Dayaratna-Banda, O. G. and J. Whalley, 2007. “After the MFA, the CCAs (ChinaContainment Agreements)”, The Center for International Governance Innovation,Canada, CIGI Working Paper No. 24.
Deutsche Bank, 2005. “WTO textile agreement now expired: China maturing into theworld’s tailor”, Deutsche Bank Research Current Issues, 14 February 2005.
Evans, C. L. and J. Harrigan, 2004. “Tight clothing: How the MFA affects Asian apparelexports”, National Bureau of Economic Research Working Paper 10250. Cam-bridge, Massachusetts, United States.
Nordås, H. K., 2004. “The global textile and clothing industry post the Agreement ontextiles and clothing”, World Trade Organization Discussion Paper No. 5. Geneva.
Rodgers, Y. M. and G. Berik, 2006. “Asia’s race to capture post-MFA markets: Asnapshot of labor standards, compliance, and impacts on competitiveness”, AsianDevelopment Review, vol. 23, No. 1; p. 55. Manila.
Tong, Z. 2006. “The development of China and world trade”, Journal of World Trade, vol.40, No. 1; p. 129. New York.
USITC, 2004. “Textile and apparel: Assessment of the competitiveness of certain foreignsuppliers to the US market”, Investigation, No. 332-448
Yamagata, T., 2007. “Prospects for development of the garment industry in developingcountries: What has happened since the MFA phase-out?” Institute of DevelopingEconomies Discussion Paper No. 101.
Yang, Y., 1999. “China’s textile and clothing exports: Changing international comparativeadvantage and its policy implications”, Australian National University DemetriusWorking Paper, 99-103.
, 1995. “China’s textile and clothing exports: Challenges in the post-MFA period”,Pacific Economic Papers 250, pp. 6.7-6.12.
Yang, Y. and C. Zhong, 1998. “China’s textile and clothing exports in a changing worldeconomy”, The Developing Economies, No. XXXVI-1 March: 3-23.
REFERENCES
129
V. INDIAN TEXTILE AND APPAREL SECTOR:AN ANALYSIS OF ASPECTS RELATED TO
DOMESTIC SUPPLY AND DEMANDBy Badri Narayanan G.
Introduction
The Indian textile1 and apparel sectors2 comprise the second largest employerafter agriculture, with more than 33 million persons engaged in this industry. In 2004/05,it contributed 1 per cent to GDP, 15 per cent to the total exports and 8 per cent to thetotal manufacturing output of India (based on calculations from the Annual Survey ofIndustries and Directorate-General of Foreign Trade, India). By virtue of being amongthe earliest established industries in the country, and being a major sector responsiblefor rapid growth of the newly industrialized countries, in addition to the data givenabove, the textile industry plays a significant role in the Indian economy. This industryhas a rich past in India, in addition to its dimensions in culture and heritage, so muchso that any study of Indian history would be incomplete without a detailed treatment ofthe country’s textile trade. Textile production has been an integral part of the lives ofmillions of poor people, including farmers, in India for centuries.3 In addition, textileproduction has backward linkages with agriculture and allied activities, at least in thecase of natural fibres.
A strong and diverse raw material base, cheap labour, an ever-growing domesticmarket and relatively better technologies4 than some of the other developing countriesare the key strengths of the Indian textile sector that have resulted in such apronounced prominence of this industry. The development of a modern textile industry inIndia gained momentum after a similar trend in Britain, owing to the availability ofindigenous cotton, cheap labour, access to British machinery and a well-developedmercantile tradition in India.
Briefly, some fundamental features of the Indian textile and clothing industry are:
·
The co-existence of a broad spectrum of production techniques;
·
A distinct trend towards decentralized manufacturing in the informal sector;
·
Sustained, albeit a considerably reduced predominance of cotton as the rawmaterial;
1 The textile sector includes spinning that involves producing yarn from fibres, weaving thatinvolves manufacturing fabric from that yarn, and processing that involves chemical treatmentand colouration of yarns and fabrics for durability as well as aesthetics.
2 The apparel sector includes the processes that result in the manufacture of readymadegarments from fabrics.
3 A comprehensive study of Indian textile history is given in Roy, 1996.4 For example, Lakshmi Machine Works, India, is one of the largest textile machinery
manufacturers in the world. The presence of companies such as these has ensured that manyadvanced technologies are accessible to Indian industry.

130
·
A huge ailing public sector;
·
A recent trend among manufacturers of adopting e modern techniques; and
·
The existence of a number of regulations and a preferential tariff structure(favouring natural fibres and conventional means of production).5
Despite being among the world leaders in textile production in 1950 and the factthat India has a self-reliant value chain of textiles, the country had been steadily losingground in the world textile market, together with a loss of importance in industrializationat home. The decline of the Indian textile industry is very conspicuous relative to thecountry’s other industries as well as the textile industries of other countries in thedeveloping world, as is evident from the steep fall in the share of Indian textiles in theinternational market and in total Indian exports.
In the 1990s, the Indian textile industry faced a severe recession, both in termsof employment as well as in the number of operational mills/factories, which continuedduring the mid-1980s and 1991 despite fundamental changes in the tariff structureamong other policy aspects. Although symptoms of recovery have been of late, owing tothe market expansion resulting from the phasing out of MFA quotas, there was anastonishing decline in export growth from more than 16 per cent in 2005/06 to 10.53per cent in 2006/07 (Ministry of Textiles, 2007).
However, the objective of this chapter is not to examine the performance of theIndian textile and apparel sectors in international trade. Rather, it focuses on some ofthe major domestic issues that encompass supply and demand in this industry. Withregard to the supply side, performance and employment in organized and unorganizedsegments are considered separately. The key aspects that are analysed are partialproductivity measures, employment, capital and output. As for the demand-side, thefocus is on the fiscal and tariff policies in the textile and apparel sectors and theirimplications for demand.
This chapter is divided into six sections, in addition to this introduction. Section Agives an account of performance of the organised textile sector in India. Section Banalyses the performance of the unorganized textile sector. Consumption of textiles byIndians and the factors affecting it are analysed in Section C. In conclusion, Section Dand elucidates some policy inferences of the analysis in this chapter.
A. Organized textile sector in India: Performanceand employment
During the past few decades, numerous textile mills have been declaredailing and have been closed. However, many of the mills under the National TextileCorporation continued to operate, despite losses, owing to the large number ofemployees involved. Even in the private sector mills, employment has been a majorissue. Although the sector has largely recovered, its performance post-MFA has notbeen encouraging.
5 See Misra, 1993 and Sastry, 1984 for elaboration of these aspects.
131
A wide range of regulations in the textile industry involving bureaucratic difficul-ties in expansion and the highly distortional tariff structure were partly responsible forthis steady recession. For example, hank yarn obligation6 required the spinners toallocate a fixed part of their production to handloom weavers. This not only restrictedthe profits of spinners, but also raw material access and costs for weavers and othersfurther up the value chain. The reservation of the garment sector7 under the Small-Scale Industry Act had restricted large-scale investment in this sector, which led to hugelosses in efficiency that could have been otherwise achieved by economies of scale.
In the informal or unorganized apparel sector, which is progressing well, theprocesses are not planned and systematic. The working conditions are not satisfactoryas the labour regulations cannot be enforced and a hire-and-fire principle is in place.This is true even in a part of the organized sector, wherein the manufacturers recruitcontract labourers in order to minimize the losses they face due to the inflexible labourregulations preventing them from firing their permanent employees even during reces-sions. In fact, some studies have observed a rapid growth of the informal sector in thetextile industry, especially after the reforms of 1991.
Table 1 shows the trends in annual average growth rates of some majorvariables for the aggregate textile industry. Since it was based on the aggregated textiledata, figures could be calculated for four decades with proper concordance of variousAnnual Survey of Industries reports. It can be seen that output, wages and fixed capitalhave been growing at an increasing rate from 1961/62 to 1999/2000, except for a smalldrop in the growth rate from 1991/92 to 1999/2000.8 The trend in the employmentgrowth rate is, however, not uniform. Apart for the period between 1971/72 and 1980/81,it has grown at a much lower rate than the other variables in most periods and, in fact,declined from 1981/82 to 1990/91.
Although employment grew on average after the reforms of 1991, its growth wasnowhere comparable to the growth of the other variables, especially capital stock, whichhas grown at about 18 per cent annually.9 This observation is even more precise if the1980/81 to 1997/98 period alone is examined, as employment fell at approximately thesame annual average rate at which output grew, despite a remarkable annual growth ofcapital of more than 8 per cent. It would thus appear that, overall, the textile industry ischaracterized by substitutability between capital and labour. Given the labour-intensivenature and unionized labour of the organised segment of this industry, entrepreneursmight have had capital to substitute the labour. Even then, the absolute fall of 5 percent annually in employment while output increased by 5 per cent annually drawsattention.
6 After coming into effect in 1974, it was fixed at 50 per cent of the total marketable yarn in1986, reduced to 40 per cent and then to 20 per cent in 2003.
7 This requirement was withdrawn with effect from 2 November 2000.8 This might be partly due to the omission of the cotton-ginning sector for the two years after
1997/98, as the National Industrial Classification-1998 classified this sector under agriculturewhile the pre-1997/98 data are based on National Industrial Classification-1987. The sameargument holds for the other variables; therefore, the figures for the period between 1980/81and 1997/98 have been highlighted.
9 This is as expected, since the phasing out of MFA quotas was initiated during this period andfirms were apparently preparing for the free trade regime by attempting to invest in both anenhancement of their quality and scale as well as to improve efficiency.

132
Another striking observation from table 1 is that the period of 2000/01 to 2004/05 saw the sharpest growth in organized sector employment. This is seen together witha decent growth in real wages and output. This rise in employment, despite the growthof the unorganized sector and the number of contract workers within the organizedsector, has faced stiff cost competition mainly in the wake of the gradual phasing out ofquotas during this period. The growth in capital has come down to below 3 per cent,which is another reason to worry since to face the competitive market in the free traderegime, huge investments are required.
Three measures of partial productivity have been analysed in table 2 – capitalproductivity, capital intensity and labour productivity. Capital productivity is the ratio ofgross output to gross capital. This gives the amount of output produced from a unit ofcapital. Capital intensity is defined as the ratio of gross capital to total employment. Thisreflects the relative size of capital and labour in the industries. Labour productivity is theratio of gross output to total employment, and measures the extent to which labour hasbeen used for production.
Table 2, in terms of lakhs (1 lakh = 100,000) of rupees of gross value of outputand gross invested capital per person engaged, makes it more explicit that the textileindustry, on an average, has become much less labour-intensive than it was 30 yearsago. A rise in the capital-labour ratio, despite a fall in capital productivity, appears tosuggest the existence of mere substitution of labour by capital, at least until 1997/98. By
Table 1. Average annual growth rates in the organised textile and apparelsector in India (1993/94 prices)
Real RealPeriod Output Employment Wages fixed capital
1961/62 to 1970/71 5.034 0.496 2.487 3.6451971/72 to 1980/81 6.668 3.295 2.882 4.6431981/82 to 1990/91 8.174 –0.968 5.44 8.8021991/92 to 1999/00 6.718 0.997 2.378 17.7741980/81 to 1997/98 5.34 –5.17 5.35 8.112001/02 to 2004/05 8.90 4.79 5.18 2.73
Source: Author’s calculations from Annual Survey of Industries.
Table 2. Trends in some ratios of capital (K), output (Y) and employment (N)
Year Y/K K/N Y/N
1973/74 2.569 4.523 11.6161980/81 3.657 4.364 15.9581985/86 3.092 7.331 22.6641990/91 3.614 10.332 37.3361997/98 1.546 34.122 52.762001/02 1.403 3.969 6.4432004/05 1.777 4.426 7.864
Source: Author’s calculations from Annual Survey of Industries.

133
2001/02, capital productivity, capital intensity and labour productivity had fallen sharply.Even though there had been a slight increase in all these measures by 2004/05, this isa serious problem given the fact that the international market is becoming more andmore competitive, requiring high productivity and capital intensity.
Capital productivity (Y/K) was quite stable from the 1970s until 2005, varyingbetween 1.4 and 3.7. However, there are bulges in capital intensity (K/N) as well aslabour productivity (Y/N). Strikingly huge increases for these values during 1985/86,1990/91 and 1997/98 could possibly be a result of a rapid fall in employment, which isin the denominator for both these measures in this period, as can be inferred from table1. The growth of employment by 2001/02 might have offset the unusually high rise inthese ratios before, thus explaining the fall in these ratios to much lower values.However, a not-so-high growth of capital since 2001/02 led to increase in capitalproductivity by 2004/05, while an impressive output growth rate caused a rise in bothcapital and labour productivity.
In the recent years, most of the protection measures have been brought in as apart of the reforms. Table 3 shows effective rates of protection for different subsectors ofthe textile industry over the past few years. The measure used is based on Das (2003),who defined the effective rate of protection as a measure of the extent to which a sectoris sheltered from foreign competition. Specifically, this is based on Corden’s formula andis the percentage excess of domestic value-added, vis-à-vis world value-added, intro-duced because of tariff and other trade barriers. This measures the distortion introduceddue to tariffs on the input prices as well as the final output prices, and it thereforemeasures protection of domestic factors of production. This measure of protection isused, because it not only captures the absolute level of the effective rate of protection ofeach sector, but also accounts for the intersectoral differences in protection mentionedabove. It is evident from table 3 that protection has fallen in all subsectors, and that thisreduction has been strikingly sharp in cotton khadi and handlooms. A fall in protectionmay have implications for employment to the extent that protected industries that tend tolose because of a fall in protection are employment-intensive.
Table 3. Trends in effective protection rates for differentsubsectors in the Indian textile sector
NIC-1987 Description of sectors 1980-1985 1986-1990 1991-1995 1996-2000codes
230,231,235 Cotton ginning, spinningand weaving 109.77 125.38 68.38 42.93
262 Embroidery, ornamentaltrimming and zari 160.91 151.23 95.79 48.22
232,233 Cotton khadi and handlooms 109.36 126.85 70.95 0
234,236 Power looms and processingin mills 109.77 125.38 68.38 42.93
260,265,267 Hosiery, garments and othermade-ups 138.33 149.89 98.45 54.25
263 Carpets and other furnishings 102.52 91.8 63.3 44.66
268,269 Waterproof and other specialtytextiles 160.91 151.23 95.79 48.2
Source: Das, 2003.Note: NIC – National Industrial Classification.

134
It is useful to examine the employment trends in some subsectors, using pastdata, and to link them with some policy measures. Figure I shows that employment inhandlooms and power looms was more or less stagnant from 1973/974 to 1997/98,except for the fact that the Handlooms (Reservation of Articles for Production) Act of1985, which was enforced from 1986, caused a sharp increase in employment in thatsubsector in 1986/87. Subsequently, however, it fell rapidly owing to the liberalizationthat favoured the power looms and mill sector in the late 1980s, leading to the levels ofemployment recorded in the recent past.
Figure II shows that employment has been consistently falling in the cotton millsubsector, while it has been almost stagnant in wool, silk and other natural fibres. It hasrisen sharply in synthetics and made-up textiles, more so after the reforms of 1991. Thisroughly indicates that the highly regulated conventional cotton mill subsector hassuffered the most among all the subsectors of cotton textiles in terms of employment,implying the existence of a negative relationship between labour regulations andemployment. This also suggests a positive effect of liberalization, at least in somesubsectors that come under the made-ups.
Figure III shows that employment has been rising as a whole in the textileprocessing sectors that are prime polluters in the industry. However, its fall in 1987/88and 1995/996 in the overall cotton and synthetic processing sectors indicates thepossible existence of a negative impact, at least in the short term, of the EnvironmentalPollution Act (1987) and the ban imposed in 1995 on certain dyes by some members ofthe European Union.
Figure IV strengthens the evidence for this statement since the fall in employ-ment is even more conspicuous in the case of the wool and silk processing subsectors,which are more pollution-intensive in nature. Despite all these short-term trends, thelong-term increasing trend is still preserved, suggesting that the rise in employment thatmight be gained by compliance with these regulations may have played a role inincreasing employment. This fact is also confirmed by a rigorous econometric exercisebased on a comprehensive theoretical framework by Narayanan (2007 and 2005b).
Table 4 shows that the number of factories has increased in the textile and theapparel sectors, implying a spectacular rise in fixed capital, number of workers, totalpersons engaged, total emoluments and gross output in the apparel sector. The growthin most of the variables has not been so high in the textile sector. However, the growthin the number of factories in the apparel sector has been less than half that in thetextile sector, highlighting the massive consolidation and scaling up that has been takingplace among apparel manufacturing enterprises. In part, this could be attributed to thefact that the garment sector was de-reserved from the small-scale industries sector in2000 as well as the resultant mergers of smaller fragments after de-reservation, causingan actual reduction in the number of factories, which could have been outweighed bythe number of new factories established.10 Thus, the organized apparel sector appearsto be getting more in tune with the free-trade regime than the organized textile sector,in terms of scaling up even though the latter has always been a large-scale sectorcompared with the former.
10 An investment of up to Rs 3 crore (1 crore = 10 million) in plant and machinery and an FDIcap of 25 per cent is permitted, subject to an export obligation of 50 per cent of totalgarment production, even before de-reservation.

135
Figure I. Employment trends in non-mill textile sector
60 000
50 000
40 000
30 000
20 000
10 000
0
1973
-74
1975
-76
1977
-78
1979
-80
1981
-82
1983
-84
1985
-86
1987
-88
1989
-90
1991
-92
1993
-94
1995
-96
1997
-98
Handloom powerloom
Figure II. Employment trends in different subsectors of thetextile wet processing sector
120 000
100 000
80 000
60 000
40 000
20 000
0
1973
-74
1975
-76
1977
-78
1979
-80
1981
-82
1983
-84
1985
-86
1987
-88
1989
-90
1991
-92
1993
-94
1995
-96
1997
-98
all processing factories cotton Synthetics

136
Figure III. Employment trends in textile wet processing sector
2 500
2 000
1 500
1 000
500
0
1973
-74
1975
-76
1977
-78
1979
-80
1981
-82
1983
-84
1985
-86
1987
-88
1989
-90
1991
-92
1993
-94
1995
-96
1997
-98
Wool Silk
Figure IV. Employment trends in subsectors of the textile sector
900 000800 000700 000600 000500 000400 000300 000200 000100 000
0
1973
-74
1975
-76
1977
-78
1979
-80
1981
-82
1983
-84
1985
-86
1987
-88
1989
-90
1991
-92
1993
-94
1995
-96
1997
-98
Wool, Silk and other fibres Synthetics Cotton
Source: Author’s calculations from Annual Survey of Industries.
Note: Post-1997/98 data exist in NIC-98 classification, which does not allow us to look at thesectors in this scheme of disaggregation, done using NIC-87. Therefore, this analysis stops with1997/98.
Made-ups

137
Tab
le 4
. S
alie
nt
feat
ure
s o
f th
e o
rgan
ised
tex
tile
an
d a
pp
arel
sec
tor
in I
nd
ia:
Rec
ent
tren
ds
Fix
edTo
tal
Wag
esTo
tal
Gro
ssYe
arS
ecto
rF
acto
ries
cap
ital
Wo
rker
sp
erso
ns
eng
aged
to w
ork
ers
emo
lum
ents
ou
tpu
t(R
p l
akh
s)(R
p l
akh
s)(R
p l
akh
s)(R
p l
akh
s)
2001
/02
Text
iles
12 5
573
931
489
1 00
4 84
81
182
124
445
017
602
216
8 20
2 04
620
01/0
2A
ppar
el3
283
310
821
272
524
317
089
86 6
4712
7 91
71
456
746
2001
/02
Tota
l15
840
4 24
2 31
01
277
372
1 49
9 21
353
1 66
473
0 13
39
658
792
2004
/05
Text
iles
13 5
214
629
094
1 07
6 48
01
264
427
480
456
714
951
11 1
08 3
2720
04/0
5A
ppar
el3
397
470
132
387
606
450
175
139
024
222
732
2 37
4 78
920
04/0
5To
tal
16 9
185
099
226
1 46
4 08
61
714
602
619
480
937
683
13 4
83 1
16
Ave
rag
e an
nu
al g
row
th r
ates
2001
-200
5Te
xtile
s2.
559
5.91
52.
376
2.32
12.
655
6.24
011
.811
2001
-200
5A
ppar
el1.
157
17.0
8514
.076
13.9
9020
.150
24.7
0721
.007
2001
-200
5To
tal
2.26
96.
733
4.87
24.
789
5.50
69.
475
13.1
98
Sou
rce:
Aut
hor’s
cal
cula
tions
fro
m A
nnua
l S
urve
y of
Ind
ustr
ies
(200
1/02
and
200
2/03
).

138
A higher growth rate in the number of workers than in total employment, coupledwith conspicuously higher growth rates in total emoluments than in wages, indicate thatdespite an increased demand for production workers pay increases are becoming higherfor supervisory and managerial staff, i.e., more skilled employees.
However, a word of caution is needed while mentioning employment in organisedtextile sector. Given the high labour costs and rigidities in the labour market, coupledwith the ailing factories, employers have been subcontracting employees from theunorganized sector, thereby reducing employment in the organized sector. This, inaddition to showing up as a decline in employment, is not a healthy trend as far as thewelfare of employees is concerned, as they are not protected by any legislation giventheir unorganized nature. This needs to be taken care of by the policy makers, possiblyby ensuring income security for the workers coupled with some labour flexibility for theemployers, so that they are discouraged from subcontracting.
Having analysed the employment trends in India’s organized textile sector, it isessential to link these observations with a perspective of development. The apparelsector has performed quite well in terms of employment in recent years, showing arecovery from the earlier decline; however, the same is not fully true in the case of thetextile sector. This appears to be a good indication of the country’s development ingeneral, given the immense contribution of the textile sector to the economy. The storyof employment and the performance of textile industry would not be complete, however,without a comprehensive examination of the trends in the unorganized textile sector.Therefore, section B analyses the performance, in terms of partial productivity trends aswell as several other factors.
B. Performance of India’s unorganized textile sector
In India, the unorganized manufacturing sector is defined as a collection of thosemanufacturing units:
(a) Whose activities do not come under any statutory Act or legal provision;and/or which do not maintain any regular accounts; or
(b) That are not registered under Sections 2m(i)11 and 2m(ii)12 of the FactoriesAct, 1948; and
(c) That are registered under Section 8513 of the Factories Act, 1948.
As table 5 reveals, the unorganized manufacturing sector contributes 28 per centof the gross value added and 73 per cent of employment to total manufacturingincluding the organized sector, thus playing a vital role in the Indian economy.
As Table 5 illustrates, the unorganized textile and apparel sector comprises 31per cent of gross value added and 79 per cent of employment in the entire textile andapparel sector in India. In fact, the unorganized apparel sector, which contributes about
11 Factories using power and employing 10 or more workers on any working day.12 Factories not using power and employing 20 or more workers on any working day.13 Factories that have less than 10/20 workers with or without power, and specially notified by
the State Government.

139
59 per cent to gross value added and 89 per cent to employment in the apparel sectorin India is predominantly unorganized. Thus, any study of Indian textile industry cannotclaim completeness unless it considers the unorganized sector in its analysis.
Misra (1993) noted that the unorganized segment of India’s textile sectorcomprises handlooms, power looms, small power-processors and traditional hand-processors in addition to the numerous small-scale garment firms in the woven as wellas hosiery subsectors. Power looms either operate on an independent basis or serve amaster-weaver system, in which they just process the orders from the master-weaverproviding the raw materials and charges based on the quantity of cloth produced. Theyacquire loans from non-bank sources, while handlooms in rural areas rely on non-institutional sources such as village moneylenders, unlike the organized weaving mills, ata higher rate of interest and from undeclared, untaxed and often illegal income.
In the urban areas, where this sector is dominant, labour is mostly drawn frommigration from the rural areas, is non-unionized and is thus obtained at market-determined wage rates that are much lower than in the organized sector. These factors,in addition to the exemption of grey fabric from excise duty and sales taxes, and longworking hours, provide a competitive advantage for the unorganized power loomsubsector over the organized mill subsector. In fact, the rapid growth of the power loomsector after the deregulatory measures were introduced in 1985 could be attributed toits unorganized labour market, well-developed input markets, ease of entry and flexiblespecialization.
Although there are some large handloom production centres in urban areas, amajor part of this subsector is small-scale, often as an ancillary activity to agriculture inrural areas. Many of the Indian handlooms are even non-commercial, such as those inthe north-east, which produce for local or domestic consumption. There are small-scalepower-processors as well as hand-processors using traditional techniques in India. Thefact that the cost of raw material, cotton, is around one-fourth of the total value, andthat the three stages of spinning, grey weaving and processing each progressively addone-fourth of the final value, clearly illustrates the importance of processing and weavingin the cotton textile value chain.
Table 5. Shares of various subsectors in different sectors for 2000/01(current prices)
Per cent Per centSubsector Sector share in gross share in
value added employment
Unorganized manufacturing Total manufacturing 28 73Unorganized textiles Total textiles 18 74Unorganized apparel Total apparel 59 89Unorganized textiles and
apparel Total textiles and apparel 31 79Unorganized textiles and
apparel Unorganized manufacturing 29 31
Source: Author’s calculations from Annual Survey of Industries and National Sample Survey Organisationdata for 2000/01.

140
Further down the value chain, most of the knitted garment manufacturers are inthe unorganized sector. For example, many firms in Tiruppur, an industrial town in TamilNadu, are either unorganized or depend heavily on subcontracting to firms in unorga-nized sector. Most of these firms are export-oriented and are seasonal/casual inoperation, depending on orders from the foreign buyers. These firms are usuallyspecialized14 and small, and hence complete their job orders15 with the help ofnumerous suppliers. Even some of the woven garment manufacturers, such as a few inMumbai, Gurgaon, Chennai and Bangalore, are unorganized.
It is worth mentioning that the aforementioned characteristics are more or lesstypical for the cotton sector. However, the features of the other sectors such as wool,silk and synthetics, which involve similar processes, remain the same. The jutesector, which is concentrated in rural and urban areas of West Bengal as well as a fewother States, has gone through major transformation from prosperity during pre-independence to difficult times in recent years. The coir sector is a major cottageindustry in many rural areas in Tamil Nadu and Kerala. Other miscellaneous sectorsinclude furnishings, manufacturing textiles for industrial purposes such as nylon tyrecords, metallised yarns and rubber thread or cord covered with textile material, specialtytextiles such as tapes, cords and nets, fancy textiles such as embroidery, zari work, andwadded textiles.
As MFA quotas are being phased out, Indian textile sector is facing bothopportunities and threats. While the organized segment of the sector appears poised fora boom, due to its relatively better economies of scale, the large unorganized sector isexpected to suffer because of its lack of competitiveness and technical efficiency amongother related factors such as insufficient scales of operation, which limits the level ofefficiency and competitiveness that these firms can achieve.
Furthermore, de-reservation of the garment sector under the small-scale indus-tries sector in 2000 is likely to have adverse effects on the unorganized sector, as theenterprises in this sector now face stiff competition from big players entering the marketwith this development in policy. In fact, this is already threatening the export sector, asthe upper limit of investment was previously higher, as footnoted elsewhere in thischapter. Given the huge contribution of the unorganized segment to the textile sector,this is certainly a serious issue for the sector as a whole. On the other hand,small firms are becoming competitive after the recent trade reforms, as decentralisedproduction does have some strengths in terms of costs. In addition, mergers ofsmaller firms into bigger ones could offer a solution in the face of competition frombig players. Combined effluent treatment plants established in clusters of smalltextile dyeing units, in places such as Tiruppur, are examples of how small firms canjoin hands in eliminating their disadvantage resulting from the lack of economies ofscale.
Given the heterogeneity of the unorganized textile segment coupled with thepotential strengths and drawbacks, as explained above, it is imperative that theproductivity trends in this sector are examined in those recent years for which detaileddata are available.
14 A handful of firms carry out all the activities involved in the textile value chain.15 Most firms are order-based, although there are few that also market their own products.

141
This analysis uses the aggregate summary results of fortieth, forty-fifth, fifty-firstand fifty-sixth rounds on unorganized manufacturing of the National Sample SurveyOrganisation (NSSO), (1989, 1994, 1998 and 2002). The different types of enterprisescovered in this study are: (a) own account manufacturing enterprises (OAMEs) consist-ing of no employees other than the working owner; (b) non-directory manufacturingestablishments (NDMEs) employing less than six persons other than a working owner;and (c) directory manufacturing establishments (DMEs) employing more than six per-sons other than a working owner.
Based on this data,16 the average annual growth rates in employment, fixedassets, wages and output are analysed here (see table 6). While employment andwages fell, on average, from 1984 to 1990, they increased in the early 1990s and theirgrowth was much higher in the late 1990s. This was despite a fall in fixed assets andoutput throughout this period, although the decline was not as high in 1990s as it wasin 1980s. The interesting observation herein is that this trend is exactly the reverse ofwhat has happened in the organized sector – a decline in employment despite a rise incapital and output.
Table 6. Annual average growth rates in the unorganized textile sector(based on 1993/94 prices)
Period Employment Fixed assets Wages Output
1984-1990 –11.803 –24.19 –8.787 –24.5121989-1995 2.724 –8.412 9.174 –3.2761994-2001 6.781 –9.123 10.946 –7.251
Source: Author’s calculations based on National Sample Survey Organisation data (1989, 1994, 1998 and2002)
Partial productivity measures should be analysed in order to obtain an overviewof the performance of the unorganized textile sector. Three of the measures areanalysed here: (a) capital productivity (no units); (b) labour productivity; and (c) capitalintensity (in rupees per employee). In large-scale or capital-intensive industries, capitalproductivity can be expected to be much lower than unity, as output produced willrequire capital much larger than the value of output, owing to the capital-intensivenature of production. However, as the unorganized sector is not very likely to includesuch enterprises, this ratio may be even greater than one. This indicates the extent towhich capital has been used for production.
To facilitate inter-temporal comparability, the measures were expressed in con-stant prices (base year: 1981/82) by deflating the fixed assets using WPI for textilemachinery and gross output using WPI for the respective products, i.e., textiles andapparel.
16 The demerits of National Sample Survey Organisation data on the unorganized manufacturingsegment are the possibility of unrepresentative sampling, response errors, inadequate samplesizes and the absence of sampling error estimates. Owing to the absence of any bettersource of data for the unorganized textile sector, these data were used for this analysis whileacknowledging these limitations.

142
Tables 7 and 8 show the trends and growth rates, respectively, for capitalintensity, capital productivity and labour productivity across different enterprises andareas in the two subsectors of the textile sector, i.e., textile manufacture (NIC-98 code:17) and apparel manufacture (NIC-98 code: 18).
Table 7. Trends in partial productivity measuresin the unorganized textile sector in India
Year Subsector Sample Enterprise Capital Capital Labourtype productivity intensity productivity
1984/85 Textiles Rural OAME 0.902 2 016.479 1 819.410Apparel Rural OAME 0.251 8 600.825 2 154.820Textiles Urban OAME 0.687 3 679.076 2 527.268Apparel Urban OAME 0.108 39 475.000 4 281.939Textiles Rural NDME 0.863 5 204.038 4 488.943Apparel Rural NDME 0.884 4 554.780 4 026.569Textiles Urban NDME 3.263 3 648.323 11 903.930Apparel Urban NDME 0.695 9 940.026 6 906.713
1989/90 Textiles Rural OAME 1.021 1 742.425 1 778.319Apparel Rural OAME 1.253 1 879.168 2 354.176Textiles Rural NDME 1.740 2 435.485 4 238.551Apparel Rural NDME 1.757 3 445.447 6 054.648Textiles Urban OAME 0.713 4 247.893 3 030.697Apparel Urban OAME 1.069 4 832.785 5 165.134Textiles Urban NDME 1.871 10 575.990 19 787.060Apparel Urban NDME 1.303 12 223.040 15 922.370
1994/95 Textiles Rural OAME 1.143 2 033.080 2 323.994Apparel Rural OAME 1.166 1 596.906 1 862.392Textiles Urban OAME 0.836 4 524.921 3 782.379Apparel Urban OAME 0.889 5 100.408 4 532.575Textiles Rural NDME 1.279 4 335.058 5 542.978Apparel Rural NDME 2.310 1 965.746 4 541.748Textiles Urban NDME 1.251 11 294.630 14 133.050Apparel Urban NDME 0.493 24 059.050 11 871.760Textiles Rural DME 1.578 5 905.005 9 320.225Apparel Rural DME 2.244 3 438.526 7 717.756Textiles Urban DME 1.804 9 804.714 17 688.040Apparel Urban DME 2.800 6 893.022 19 301.480
2000/01 Textiles Rural OAME 0.906 2 577.797 2 336.765Apparel Rural OAME 0.612 4 986.596 3 050.152Textiles Rural NDME 1.160 4 680.898 5 429.882Apparel Rural NDME 0.794 6 554.459 5 202.371Textiles Rural DME 1.575 6 661.292 10 490.510Apparel Rural DME 1.201 5 341.884 6 418.246Textiles Urban OAME 0.653 6 369.440 4 159.148Apparel Urban OAME 0.430 10 000.640 4 296.527Textiles Urban NDME 1.490 15 329.540 22 846.260Apparel Urban NDME 0.539 15 875.740 8 554.678Textiles Urban DME 1.452 16 719.660 24 275.790Apparel Urban DME 1.049 16 444.340 17 243.160
Source: Author’s calculations based on National Sample Survey Organisation data (1989, 1994, 1998 and2002)

143
First, a comparison is made of the trends in these variables for each yearacross different enterprise types, areas and subsectors. Second, we look at the averageannual growth rates in them during a few recent years. Third, overall inferences arederived from this analysis.
1. Capital productivity
In 1984/85, NDMEs were more capital-productive than OAMEs in almost allcategories except the rural textile sector, where both were comparable. While the urbantextile NDME subsector produces output that is more than thrice that of capital, outputis as high as capital in most other subsectors except apparel OAMEs. In all casesexcept rural NDMEs,17 the apparel subsector is less capital-productive than the textile
Table 8. Growth trends in partial productivity measuresin the unorganized textile sector of India
Period Subseetor Sample Enterprise Capital Capital Labourtype productivity intensity productivity
1984/85 Textiles Rural OAME 2.623 –2.718 –0.452to Apparel Rural OAME 80.007 –15.63 1.851989/90 Textiles Rural NDME 20.351 –10.64 –1.116
Apparel Rural NDME 19.756 –4.871 10.073Textiles Urban OAME 0.772 3.092 3.984Apparel Urban OAME 177.059 –17.551 4.125Textiles Urban NDME –8.532 37.977 13.245Apparel Urban NDME 17.495 4.594 26.107Textiles Rural OAME 2.4 3.336 6.137
1989/90 Apparel Rural OAME –1.381 –3.004 –4.178to Textiles Urban OAME –4.358 –1.274 –5.3541994/95 Apparel Urban OAME –3.37 1.108 –2.449
Textiles Rural NDME –5.306 15.599 6.155Apparel Rural NDME 6.296 –8.589 –4.997Textiles Urban NDME –6.624 1.359 –5.715Apparel Urban NDME –12.424 19.367 –5.088Textiles Rural OAME –4.14 5.359 0.11Apparel Rural OAME –9.51 42.453 12.755
1994/95 Textiles Urban NDME –1.856 1.596 –0.408to Apparel Urban NDME –13.129 46.687 2.9092000/01 Textiles Rural DME –0.045 2.562 2.511
Apparel Rural DME –9.294 11.071 –3.368Textiles Rural OAME –4.376 8.153 1.992Apparel Rural OAME –10.331 19.215 –1.042Textiles Rural NDME 3.821 7.145 12.33Apparel Rural NDME 1.841 –6.803 –5.588Textiles Urban DME –3.904 14.105 7.449Apparel Urban DME –12.511 27.713 –2.133
Source: Author’s calculations based on National Sample Survey Organisation data (1989, 1994, 1998 and2002)
17 In this case, both the textile and the apparel subsectors are equally capital-productive.

144
subsector. Rural textile NDMEs are the only exception for the observation thatall categories in rural areas have been more capital-productive than those in urbanareas.
In 1989/90, all categories except rural textile OAMEs recorded capital productivitymeasuring above unity, exhibiting higher levels compared to those in 1984/85, excepturban textile NDMEs in which it was halved. Further, NDMEs were more capital-productive than OAME in all categories, thereby comprising the four best ones amongthem in terms of capital productivity. All categories in rural areas have been morecapital-productive than those in urban areas, except textile NDMEs, as was the case in1984/85. Further, in all categories except urban NDMEs, the apparel sector has beenmore capital-productive than the textile sector.
In 1994/95, DMEs were also including in the analysis, owing to the availability oftheir data from the same source (National Sample Survey Organisation, 1998). In thatyear, all categories of NDMEs, except for the urban apparel subsector, were morecapital-productive than OAMEs, while those in the DME category, except the ruralapparel sector, were better than those in the NDME category. Compared to 1989/90,capital productivity fell in all categories except rural apparel NDMEs. While urban textileNDMEs had been the most capital-productive of all categories until 1989/90, it was justan average category in these terms in 1994/95. Except in urban NDMEs, capitalproductivity was higher in the apparel subsector than in the textile subsector in allenterprise types and areas. Enterprises in urban areas had higher capital productivitythan in rural areas only in the case of DMEs while the reverse holds true for otherenterprise types.
In 2000/01, capital productivity declined markedly in all categories. All categoriesof DMEs, except urban textiles, were more capital-productive than were the othercategories, while those in the OAME category were worse than in the other categories.One striking observation is that capital productivity in the apparel subsector was lowerthan that in the textile subsector for all enterprise types and areas. In all cases excepttextile NDMEs, enterprises in rural areas were more capital productive than those inurban areas.
As shown in table 7, the annual average growth rate of capital productivity from1984/85 to 1989/90 was two-digit or even higher in all categories except textile OAMEswhere it was less than 10 per cent, and urban textile NDMEs where it fell. From 1989/90 to 1994/95, the average annual rate of decline in all categories, except textileOAMEs and apparel NDMEs in the rural sample18, ranged from 1 per cent to 12 percent. Between 1994/95 and 2000/01, enterprises became 0.05 per cent to 13 per centless productive every year, on average, except in the case of urban NDMEs, where theybecame more productive at an average annual rate of 1.8 per cent to 3.8 per cent.These rates of decline were much higher in the apparel subsector than in the textilesubsector. Even in urban NDMEs, the apparel subsector became more productive at arate lower than that at which the textile subsector had become. A decline in capitalproductivity, wherever it occurred, was more rapid in urban enterprises than in ruralenterprises.
18 Note that capital productivity grew in these categories during this period.

145
2. Capital intensity
In 1984/85, capital intensity varied between Rs 2,000 and Rs 10,000 peremployee, with an outlier of more than Rs 39,000 for the urban apparel OAMEsubsector. Capital intensity was much higher in the apparel subsector than in the textilesubsector, except in rural NDMEs, wherein it was the other way round. Except in textileNDMEs, the enterprises in urban areas were more capital-intensive than those in ruralareas. With the exception of the rural textile subsector, NDMEs were less capital-intensive than OAMEs.
While these figures varied between Rs 1700 and Rs 12,000 in 1989/90,enterprises in the apparel subsector, urban areas and NDMEs were uniformly morecapital-intensive than those in the textiles subsector, rural areas and OAMEs, respec-tively, with no exceptions. Except for the enterprises in urban textile OAMEs and urbanNDMEs, capital intensity fell in all categories, the sharpest fall being more than eighttimes in the case of urban apparel OAMEs.
In 1994/95, capital intensity ranged from Rs. 2,000 to Rs. 24,000, and the textilesubsector was more capital-intensive than the apparel subsector in the enterprises inrural areas and DMEs, although urban apparel NDMEs were the most capital-intensiveamong all categories. Urban enterprises and NDMEs were more capital-intensive thanrural enterprises and OAMEs, respectively. While DMEs in rural areas were more capitalintensive than NDMEs in the same areas, DMEs in urban areas were less capital-intensive than NDMEs in those areas. Except for rural apparel NDMEs, capital-intensityfell in all categories in 1994/95, compared with 1989/90.
Unlike in 1994/95, urban DMEs were the most capital-intensive (approximatelyRs 16,000, while the lowest was some Rs 2,600) category in 2000/01, pushing urbanNDMEs into second place. The apparel subsector was more capital-intensive than thetextile subsector in all categories except DMEs. OAMEs were less capital-intensive thanNDMEs, which were less capital-intensive than DMEs in all categories except the ruralapparel subsector, wherein DMEs were less capital-intensive than NDMEs. Further, itcan be seen that enterprises in urban areas were much more capital-intensive thanthose in rural areas. Capital-intensity was much higher during 2000/01 than that during1994/95 in all categories.
Except for urban NDMEs and textile urban OAMEs, enterprises in all categoriesbecame less capital-intensive, at annual rates of 3 per cent – 18 per cent from 1984/85 to1989/90. However, the annual growth rate was as high as 38 per cent in textile urbanNDMEs. This decline in capital intensity could not be offset by growth in a few categoriesfrom 1989/90 to 1994/95, because rapid growth occurred only in the categories that had,to begin with, grown in capital intensity since 1984/85. Where growth did occur in the othercategories, it was not high relative to the rates of decline in the previous period.
Unlike the previous periods, capital-intensity grew quite rapidly in most categoriesfrom 1994/95 to 2000/01, with the annual average growth rate ranging from 2 per cent to47 per cent, the only exception being urban apparel DMEs. One more noteworthyobservation is that the apparel subsector became capital-intensive much faster than thetextile subsector did, wherever it grew, which explains why the apparel subsector becamemore capital-intensive than the textile subsector in 2000/01, in contrast with 1994/95 figures.While the growth rates were much higher in the textile subsector in the urban sample thanthat in the rural sample, the reverse held for the apparel subsector, with the exception ofDMEs. The other observations in growth rates may be made directly from table 7.

146
3. Labour productivity
While the textile subsector was less labour-productive than the apparel subsectorin OAMEs during 1984/85, the reverse held true for NDMEs. NDMEs were more labour-productive than OAMEs in all sectors and areas. Urban enterprises were more labour-productive than were those in rural areas. While rural textile OAMEs were the leastlabour-productive (Rs 1,800), urban textile NDMEs were the most labour-productive(approximately Rs 12,000).
Except for rural textile enterprises, labour productivity increased in all categoriesfrom 1984/85 to 1989/90. Urban enterprises and NDMEs were more labour-productivethan rural enterprises and OAMEs, respectively, during 1989/90. The apparel subsectorwas more labour-productive than the textile subsector except in the case of urbanNDMEs, where they were the most labour-productive (about Rs 19,800). Rural textileOAMEs was the least labour-productive at about Rs 1780 per person.
In 1994/95, except in urban OAMEs and DMEs, labour productivity, which variedfrom around Rs 1,800 to Rs 19,000, was less in the apparel subsector than in thetextile subsector. Urban enterprises, DMEs and NDMEs were more labour-productivethan rural enterprises, NDMEs and OAMEs, respectively.
During 2000/01, DMEs were more labour-productive than NDMEs, which in turn,were more labour-productive than OAMEs. With the exception of OAMEs, the apparelsubsector was more labour-productive than the textile subsector. Urban enterprises weremore labour-productive than rural ones. Labour productivity varied from Rs 2,300 to Rs24,000 during this period.
From 1984/85 to 1989/90, labour productivity grew in all categories at anaverage annual rate ranging from 1.8 per cent to 26 per cent, except in the textilesubsector in the rural sample, where it declined at relatively lower rates. In contrast, itdeclined in all categories except the rural textile subsector, where it grew at about 6 percent per year from 1989/90 to 1994/95. This decline was slightly more pronounced inthe apparel subsector than in the textile subsector.
From 1994/95 to 2000/01, labour productivity grew in the textile subsector in allcategories except rural NDMEs, in which it declined at an annual rate of less than 1 percent. In the rural areas, apparel subsector labour productivity grew at between 3 percent and 13 per cent per year, except in DMEs, which saw a decline of around 3 percent per year. Urban apparel enterprises became less labour- productive in all catego-ries at between 1 per cent and 6 per cent per year.
4. Overall inferences on partial productivity measures
With a few exceptions, NDMEs, rural enterprises and the textile subsector weremore capital-productive than OAMEs, urban enterprises and the apparel subsector,respectively, in 1984/85. While capital productivity grew between 1984/85 and 1989/90 inmost categories, the other observations are the same as for 1984/85, except that theapparel subsector was more capital-productive than was the textile subsector. From1989/90 to 1994/95, capital productivity declined in almost all categories, with that ofDMEs being the highest among all enterprise types. The observation that DMEs inurban areas were more capital-productive than were those in rural areas is the onlyother difference between the figures for 1994/95 vis-à-vis those for 1989/90. In 2000/01,

147
capital productivity declined conspicuously in all categories, more so in urban than inrural areas, explaining the fact that enterprises in rural areas were more capital-productive than were those in urban areas. One striking observation is the fall in capitalproductivity in the apparel subsector, both in absolute and relative terms, and hence theapparel subsector was less capital-productive in the apparel subsector than in the textilesubsector.
In 1984/85, capital intensity was much higher in the apparel subsector, urbanareas and NDMEs than in the textile subsector, rural areas and OAMEs, respectively,with few exceptions. The same is true for 1989/90 with no exceptions, although capitalintensity fell sharply in most categories from 1984/85. Between 1989/90 and 1994/95,there was little, no or negative growth in capital intensity.
The textile subsector was more capital-intensive than the apparel subsector inrural DMEs. While rural DMEs were more capital intensive than rural NDMEs, urbanDMEs were less capital-intensive than urban NDMEs in 1994/95. The other observationsare identical to those in 1989/90. In 2000/01, the apparel subsector was more capital-intensive than the textile subsector in all categories except DMEs. Urban enterpriseswere much more capital-intensive than were rural ones. Capital intensity was muchhigher during 2000/01 than that during 1994/95 in all categories.
While the textile subsector was less labour-productive than the apparel subsectorin OAMEs, the reverse held true for NDMEs during 1984/85, when urban enterprisesand NDMs were more labour-productive than were rural enterprises and OAMEs,respectively. This increased in most categories from 1984/85 to 1989/90. Except for thefact that the apparel subsector was more labour-productive than the textile subsector inmost cases, the relative positions remained the same as in 1984/85. In 1994/95, labourproductivity was lower in the apparel subsector than in the textile subsector in allcategories except urban OAMEs and DMEs.
Urban enterprises, DMEs and NDMEs were more labour-productive than ruralenterprises, NDMEs and OAMEs, respectively. While labour productivity grew in most ofthe textile subsector between 1994/95 and 2000/01, with the exception of OAMEs, theapparel subsector was more labour-productive than the textile subsector.
To highlight the findings of this section, two observations can be mentioned atthis point. First, urban enterprises performed better than rural enterprises in mostsubsectors and measures in the unorganized textile subsector. This underscores thedominant problem of the rural-urban divide even in this section of the economy. Second,DMEs performed better than NDMEs, which in turn performed better than OAMEs inthis sector. This supports the argument that smaller firms may not be in a position toperform better than larger ones, highlighting the need to encourage the relativelysusceptible segments of the industry, in order to provide a level playing field. Havingexamined the organized and unorganized segments of the Indian textile sector, whichform the sector’s supply side, it is useful to look at some aspects of domestic demandfor textiles and clothing. An attempt is made to do this in the next section.
C. Domestic consumption of textiles in India
Household textile demand has an immense significance for the Indian economy.Given India’s population, and more importantly its exploding growth rate, as a part ofthe subsistence trio (food, clothing and shelter) textiles are poised to be among the key

148
factors of demand. Tables 9 and 10 illustrate the fact that the share of clothing in thetotal expenditure of an average Indian household has been 6 per cent to 7 per cent inrecent years.
Table 10. Trends in per capita consumption expenditures andshare of clothing in urban India (current prices)
Per capita 1989/90 1993/94 1999/2000 2000/01 2001/02 2002/03 2003/04 2004/05expenditure
Clothing (Rs) 15.00 32.70 51.76 58.16 57.81 60.83 60.08 62.48Non-food 110.18 214.00 444.08 514.01 530.48 582.18 593.56 619.74Total (Rs) 249.92 464.30 854.92 914.57 932.79 1 011.97 1 022.68 1 104.84
Clothing’s share 0.14 0.15 0.12 0.11 0.11 0.10 0.10 0.10in non-food
Clothing’s share 0.06 0.07 0.06 0.06 0.06 0.06 0.06 0.06total
Source: Author’s calculations from the National Sample Survey Organisation, 2005.
Table 9. Trends in per capita consumption expenditures andshares on clothing in rural India (current prices)
Per capita 1989/90 1993/94 1999/2000 2000/01 2001/02 2002/03 2003/04 2004/05expenditure
Clothing (Rs) 10.52 21.20 33.28 35.94 35.33 37.68 38.58 39.80Non-food 57.28 108.30 197.36 216.34 221.92 239.21 255.68 260.1Total (Rs) 158.10 286.10 486.16 494.90 498.27 531.49 555.55 616.57
Clothing’s sharein non-food 0.18 0.20 0.17 0.17 0.16 0.16 0.15 0.15
Clothing’s share 0.07 0.07 0.07 0.07 0.07 0.07 0.07 0.07total
Source: Author’s calculations from the National Sample Survey Organisation, 2005.
The share of textiles and clothing in total expenditure could be an indicator ofdevelopment for countries, because the more the households in a country spend forclothing, the more developed and comfortable they are with their other basic necessities,especially food. Thus, there appears to be some scope for increasing the per capitademand for clothing, which could show up as an increase in the share of clothing intotal expenditure. In urban households, the share of clothing in non-food expenditureshas been much lower than in rural households. This is partly because the basket ofnon-food commodities (both goods and services) is bigger in urban areas, hencerendering the share of clothing relatively low. However, these shares have been slowlyfalling both in rural and in urban areas.
Further, the problem of various ailing textile mills in the past has been largelyattributed to the lack of demand in India by several studies (see, for example, Goswami,1985 and 1990; and Murty and Sukumari, 1991). Although most of the studies were

149
based on the data and scenario up until the late 1980s, a demand constraint could beexpected to have remained persistent in the textile sector, at least until 2005, when theMFA quotas were phased out, leading to a boom in the external demand sector. Thus,demand for clothing appears to have two dimensions relevant to a country’s develop-ment – its own intrinsic value as an indicator of development, and its implications forthe supply-side and hence the employment aspects.
Table 11 shows that the aggregate household purchases of textiles have grownover recent years, although the per capita purchases either have been stagnant or havefallen, unlike exports, which have been increasing for decades despite the quota system.The domestic demand trends are not in line with the trends in domestic production, asillustrated by table 11. Hence, textiles in India clearly face a domestic demandconstraint.
Table 11. Indian textile and apparel subsectors –trends in growth of supply and demand
Aggregate Per capita SupplyPeriod household household Exports (production)
purchases purchases
1975-1980 3.519 0.991 3.877 6.351980-1985 4.742 2.225 0.402 4.8411986-1994 0.875 –1.08 14.478 10.5181995-2000 3.026 1.129 19.045 5.0332000-2005 4.001 2.028 10.205 8.9
Source: Author’s calculations from different Annual Survey of Industries yearbooks, Compendium of TextileStatistics, Directorate-General of Foreign Trade and consumer’s purchases in textiles.
The demand constraints are attributed to the excise structure that is highlybiased towards cotton and other natural fibres as well as the textile commodities thatare manufactured by relatively less efficient ways, such as without power and steam.Table 13 shows the excise structure over recent years for different textile fibres, whiletables 14 and 15 show the same for different yarns and fabrics.
Before examining the figures given in tables 14 and 15, it is imperative to note afew facts. First, natural fibres, hank yarn (plain reel and cross reel up to 25s), all fabricsprocessed without the aid of power and steam, and products of factories owned by/registered to the National Handloom Development Corporation, State GovernmentHandloom Development Corporations, and Khadi and Village Industries Commission payno excise duty to begin with. Second, since 1995/96, a provision has been made in thebudget to take a part of excise duty in lieu of sales tax for all fabrics; hence, the figuresfrom 1995/96 are a bit higher than what they effectively are, compared with those forprevious years. Third, handloom cotton fabrics and those processed by independentpower processors approved by the Government pay an excise duty that is 40 per centof that for the mill and power-loom subsector.
Woollen fabrics made of shoddy yarn have been exempted up to the value of Rs60/m2 until 1992/93 and Rs 100/m2 since 1993/94. The hank yarn exemption waswithdrawn from 2002/03, but the exemption for coarse hank yarns counts up to 2s (English

150
count, i.e., number of 840 yards of yarn in one pound). Since 2004/05, duties withcentralized value added taxes for natural fibre yarns and all fabrics have been applied.
Considering the fact that the recent figures for excise duties consist of what waspreviously sales tax as well, it can be seen that there is a falling trend in almost allcommodity groups. Another inference is that the excise structure is now much simplerthan it was previously. For example, while it was different for each type of staple fibre,in recent years it has been the same for all synthetic stable fibres. Filament yarns ingeneral, and polyester in particular, are the commodity groups for which the exciseduties appear to be the highest.
For the purpose of simplicity, the excise structure of the intermediates involved inthe production of synthetics is not shown. For most of them, it has remained static ataround 15 per cent to 18 per cent for the past 10 years. Thus, it is very clear that theexcise structure is still highly biased towards natural fibres, although this has beenreduced to great extent. Further, less efficient ways of manufacturing, such as thosethat do not use power and steam, pay less excise duties, thus leading to higher relativemarginal costs of production for the more efficient manufacturers. This type of differen-tiation is removed only in the case of woollen fabrics, as noted in table 14.
A recent exercise in demand estimation was undertaken by the author,19 using adynamic and almost ideal demand system, and was performed for a monthly household-level survey data on textile purchases from 1994 to 2003. The exercise shows that thecross-price elasticities among the 12 major commodity groups within textiles arenegligible compared to own-price elasticities, which are very high for the synthetic andblended textiles and low for cotton textiles. These findings are in line with previous
Table 12. Trends in excise structure of various textile staple fibresin India, 1992-2005
Year Acrylic, Polyester Nylon Acetate Poly-viscose propylene
1992/93 15.6 13.65 59.15 15.6 17.871993/94 14.95 12.65 14.95 14.95 17.251994/95 23 23 23 23 231995/96 23 23 23 23 231996/97 23 23 23 23 231997/98 20.7 20.7 20.7 20.7 20.71998/99 20.7 20.7 20.7 20.7 20.71999/2000 18.4 18.4 18.4 18.4 18.42000/01 18.4 18.4 18.4 18.4 18.42001/02 18.4 18.4 18.4 18.4 18.42002/03 18.4 18.4 18.4 18.4 18.42003/04 18.4 18.4 18.4 18.4 18.42004/05 16.32 16.32 16.32 16.32 16.32
Source: Compendium of Textile Statistics, Office of the Textile Commissioner, Ministry of Textiles, Govern-ment of India, 1994-2005.
19 Details of this model are available on request from the author (see Narayanan, 2007).
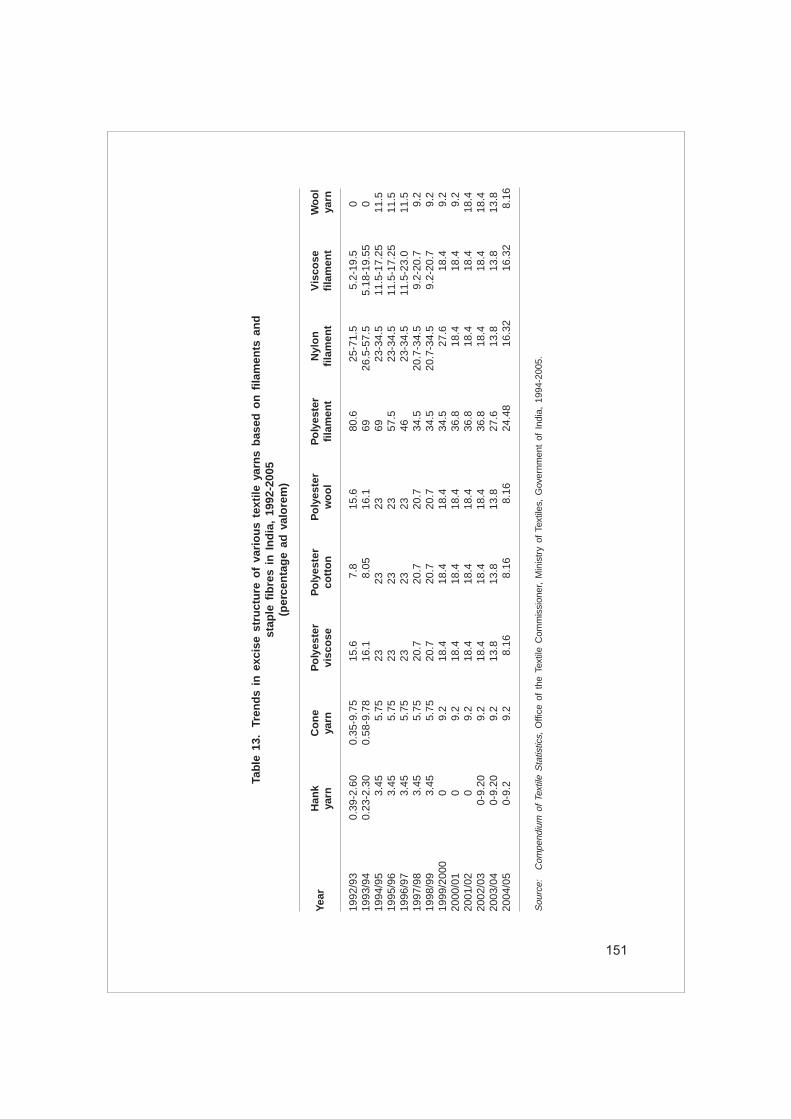
151
Tab
le 1
3.
Tren
ds
in e
xcis
e st
ruct
ure
of
vari
ou
s te
xtile
yar
ns
bas
ed o
n f
ilam
ents
an
dst
aple
fib
res
in I
nd
ia,
1992
-200
5(p
erce
nta
ge
ad v
alo
rem
)
Year
Han
kC
on
eP
oly
este
rP
oly
este
rP
oly
este
rP
oly
este
rN
ylo
nV
isco
seW
oo
lya
rnya
rnvi
sco
seco
tto
nw
oo
lfi
lam
ent
fila
men
tfi
lam
ent
yarn
1992
/93
0.39
-2.6
00.
35-9
.75
15.6
7.8
15.6
80.6
25-7
1.5
5.2-
19.5
019
93/9
40.
23-2
.30
0.58
-9.7
816
.18.
0516
.169
26.5
-57.
55.
18-1
9.55
019
94/9
53.
455.
7523
2323
6923
-34.
511
.5-1
7.25
11.5
1995
/96
3.45
5.75
2323
2357
.523
-34.
511
.5-1
7.25
11.5
1996
/97
3.45
5.75
2323
2346
23-3
4.5
11.5
-23.
011
.519
97/9
83.
455.
7520
.720
.720
.734
.520
.7-3
4.5
9.2-
20.7
9.2
1998
/99
3.45
5.75
20.7
20.7
20.7
34.5
20.7
-34.
59.
2-20
.79.
219
99/2
000
09.
218
.418
.418
.434
.527
.618
.49.
220
00/0
10
9.2
18.4
18.4
18.4
36.8
18.4
18.4
9.2
2001
/02
09.
218
.418
.418
.436
.818
.418
.418
.420
02/0
30-
9.20
9.2
18.4
18.4
18.4
36.8
18.4
18.4
18.4
2003
/04
0-9.
209.
213
.813
.813
.827
.613
.813
.813
.820
04/0
50-
9.2
9.2
8.16
8.16
8.16
24.4
816
.32
16.3
28.
16
Sou
rce:
Com
pend
ium
of
Text
ile S
tatis
tics,
Offi
ce o
f th
eTe
xtile
Com
mis
sion
er,
Min
istr
y of
Tex
tiles
, G
over
nmen
t of
Ind
ia,
1994
-200
5.
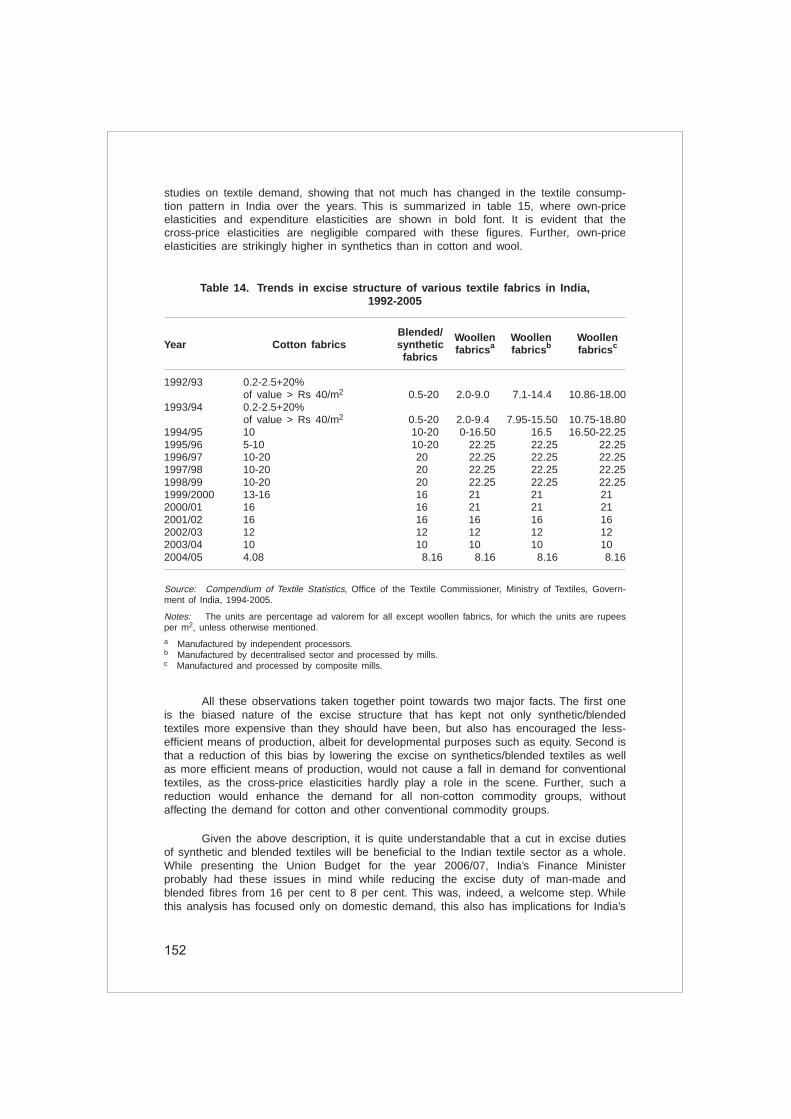
152
studies on textile demand, showing that not much has changed in the textile consump-tion pattern in India over the years. This is summarized in table 15, where own-priceelasticities and expenditure elasticities are shown in bold font. It is evident that thecross-price elasticities are negligible compared with these figures. Further, own-priceelasticities are strikingly higher in synthetics than in cotton and wool.
Table 14. Trends in excise structure of various textile fabrics in India,1992-2005
Blended/ Woollen Woollen WoollenYear Cotton fabrics synthetic fabricsa fabricsb fabricsc
fabrics
1992/93 0.2-2.5+20%of value > Rs 40/m2 0.5-20 2.0-9.0 7.1-14.4 10.86-18.00
1993/94 0.2-2.5+20%of value > Rs 40/m2 0.5-20 2.0-9.4 7.95-15.50 10.75-18.80
1994/95 10 10-20 0-16.50 16.5 16.50-22.251995/96 5-10 10-20 22.25 22.25 22.251996/97 10-20 20 22.25 22.25 22.251997/98 10-20 20 22.25 22.25 22.251998/99 10-20 20 22.25 22.25 22.251999/2000 13-16 16 21 21 212000/01 16 16 21 21 212001/02 16 16 16 16 162002/03 12 12 12 12 122003/04 10 10 10 10 102004/05 4.08 8.16 8.16 8.16 8.16
Source: Compendium of Textile Statistics, Office of the Textile Commissioner, Ministry of Textiles, Govern-ment of India, 1994-2005.
Notes: The units are percentage ad valorem for all except woollen fabrics, for which the units are rupeesper m2, unless otherwise mentioned.a Manufactured by independent processors.b Manufactured by decentralised sector and processed by mills.c Manufactured and processed by composite mills.
All these observations taken together point towards two major facts. The first oneis the biased nature of the excise structure that has kept not only synthetic/blendedtextiles more expensive than they should have been, but also has encouraged the less-efficient means of production, albeit for developmental purposes such as equity. Second isthat a reduction of this bias by lowering the excise on synthetics/blended textiles as wellas more efficient means of production, would not cause a fall in demand for conventionaltextiles, as the cross-price elasticities hardly play a role in the scene. Further, such areduction would enhance the demand for all non-cotton commodity groups, withoutaffecting the demand for cotton and other conventional commodity groups.
Given the above description, it is quite understandable that a cut in excise dutiesof synthetic and blended textiles will be beneficial to the Indian textile sector as a whole.While presenting the Union Budget for the year 2006/07, India’s Finance Ministerprobably had these issues in mind while reducing the excise duty of man-made andblended fibres from 16 per cent to 8 per cent. This was, indeed, a welcome step. Whilethis analysis has focused only on domestic demand, this also has implications for India’s

153
Tab
le 1
5.
Ela
stic
itie
s o
f va
rio
us
text
ile c
om
mo
dit
y g
rou
ps
wit
h r
egar
d t
o p
rice
s an
d t
exti
le e
xpen
dit
ure
Ela
stic
ity
of:
Acr
ylic
Vis
cose
Co
tto
nC
ott
on
-N
ylo
nP
oly
este
rP
oly
este
r-S
ilkP
oly
este
r-P
oly
este
r-W
oo
lvi
sco
seco
tto
nvi
sco
sew
oo
l
Acr
ylic
–0.8
510.
008
0.04
50.
013
0.07
3–0
.070
–0.0
36–0
.001
–0.1
09–0
.033
–0.0
21V
isco
se0.
010
–0.9
200.
035
0.02
50.
134
–0.0
560.
046
–0.0
24–0
.031
–0.0
02–0
.027
Cot
ton
0.00
7–0
.020
–0.6
67–0
.024
–0.0
540.
042
–0.3
230.
002
0.03
40.
036
0.02
1C
otto
n-vi
scos
e0.
006
0.01
0–0
.010
–0.8
76–0
.099
–0.0
01–0
.017
–0.0
01–0
.001
0.00
3–0
.012
Nyl
on0.
012
0.02
3–0
.010
–0.0
37–1
.334
0.00
9–0
.036
0.00
90.
046
0.03
6–0
.000
3P
olye
ster
–0.0
61–0
.053
0.11
70.
001
0.05
4–0
.948
0.18
8–0
.019
–0.0
43–0
.032
–0.0
55P
olye
ster
-cot
ton
–0.0
220.
055
–0.3
40–0
.023
–0.1
570.
198
–0.9
060.
015
–0.0
120.
036
–0.0
26S
ilk–0
.001
–0.0
670.
149
0.00
50.
158
–0.0
540.
025
–0.9
360.
011
–0.1
33–0
.089
Pol
yest
er-v
isco
se–0
.043
–0.0
140.
040
0.00
10.
107
–0.0
20–0
.011
0.00
1–0
.688
–0.0
42–0
.040
Pol
yest
er-w
ool
–0.0
21–0
.004
0.04
40.
004
0.12
6–0
.024
0.02
1–0
.033
–0.0
66–0
.730
–0.0
45W
ool
–0.0
35–0
.049
0.11
0–0
.045
–0.0
01–0
.109
–0.0
59–0
.057
–0.1
79–0
.126
–0.7
13Te
xtile
Exp
endi
ture
1.00
01.
039
0.48
70.
982
0.94
11.
018
1.12
91.
037
1.00
50.
981
1.03
2
Sou
rce:
Aut
hor’s
cal
cula
tions
fro
m h
ouse
hold
-leve
l da
ta f
rom
Tex
tiles
Com
mitt
ee (
see
Nar
ayan
an,
2007
).

154
international competitiveness vis-à-vis other countries in the textile sector. With reducedprotection, Indian industries are likely to become more competitive and some rawmaterial inputs are likely to become cheaper due to lowered duties.
Thus, it may be said with a reasonable degree of confidence that the Indiantextile sector is going to benefit immensely because of such steps as tariff and taxreduction. The major point emphasised in this section, but which is less obvious, is thata cut in duties will not affect the conventional textile sector, owing to the low cross-priceelasticities between the textile commodity groups. This is not only essential for the well-being and better performance of the sectors, per se, but also the standards of living ofthe public, in terms of textile consumption. It should be highlighted that the consumptionof textiles itself is as much a measure of development as is the consumption of food.Hence, enhancing textile consumption should be an inherent feature of developmentalpolicies. In addition, enhanced textile demand would benefit the supply side, which isimmensely significant for development of the economy in general.
D. Conclusion
With the objective of analysing the structure of India’s textile sector, both fromthe supply and demand perspectives, this chapter has considered the performance andemployment in the organized and unorganized subsectors, and the fiscal and tariffpolicies and their impacts on domestic consumption of textiles and clothing in India.
Examining the organized textile and apparel sector has shown that employmentremained stagnant while capital and output were increasing until 2000/01, after whichemployment started to rise as well. The apparel subsector has expanding tremendouslyin terms of output, capital and employment, despite a much lower increase in thenumber of factories than in textile subsector, indicating a structural change in terms ofhuge investments and an increase in scales of operation since its de-reservation fromthe small-scale industry subsector in 2000. Better prospects of employment are possiblein the apparel subsector, although it should be enhanced in the textile subsector aswell, by promoting huge investments. Even in the unorganized subsector, smaller firmsare worse off than the bigger ones, in terms of various productivity measures. Hence,even small firms could be encouraged to expand by investing more while preservingtheir merits in being small, especially flexibility and customized production possibilities.
Investment could be encouraged by better credit disbursement policies. In thisconnection, it should be noted that the credit disbursement through the TechnologyUpgrading Fund Scheme (TUFS), as a fraction of credits applied for, has beenreasonable as shown in table 16.20 A glance at the figures in table 16 suggests thatthe disbursement of credit has been fairly good, especially in the case of thoseagencies responsible for promoting SSIs (such as the Small Industries DevelopmentBank of India), with an application-rejection rate of less than 2 per cent and creditdisbursement rate of around 70 per cent. However, the figures are less impressive forthe agencies that lend to all industries (such as the Industrial Credit and InvestmentCorporation of India, the Industrial Development Bank of India and the Export ImportBank). To the extent that SSIs are more dependent on the sources of credit such asTUFS than are the other industries, these figures show that credit disbursement is not amajor issue. In fact, the same can be said for the other industries, although not to the
20 See Narayanan, 2005a for more details in this regard.

155
extent of SSIs. Thus, the reasons for the low investment may be a lack of awarenessamong the entrepreneurs about these schemes; therefore, the Government should takesteps to promote such useful schemes.
As for the unorganized textile subsector, employment has been increasingdespite falls in capital and output, an issue that is in striking contrast to that inorganized textile subsector. From the late 1990s until 2001, capital productivity declinedin this subsector, more so in urban than in rural areas. Capital intensity was muchhigher during 2000/01 than that during 1994/95 in all categories. While labour productiv-ity grew in most of textile subsector between 1994/95 and 2000/01, with the exceptionof OAMEs, the apparel subsector was more labour-productive than the textile subsector.Enterprises in rural areas were more capital-productive, less capital-intensive and lesslabour-productive than were those in urban areas. The apparel subsector was lesscapital-productive, more capital-intensive (except in DMEs), and more labour-productivethan in the textile subsector. These trends also varied across enterprise types. A majorobservation from the analysis of the unorganized textile subsector is that there hasbeen a divide between various segments within the textile sector, in terms of perfor-mance.
The analysis of household demand has shown that the per capita textilepurchases have been declining in real terms during the past few years. The excise andcustoms duties on man-made fibre textiles have been a barrier to increasing theirpurchases due to the fact that these duties are reflected in the prices and that thedemand for these products is highly own-price elastic. Given the fact that the cross-price elasticity between cotton and these fibres is negligible compared with the own-price elasticities, a rise in demand for textiles without a fall in demand for conventionaltextiles could be ensured by a fall in prices of man-made fibre textiles. However, thiswould be possible only by cutting excise and customs duties on these products, as hasbeen done during recent years. This appears to be a significant step towards fosteringdevelopment in the country, from the supply side and demand side viewpoints.
Table 16. Credit applications that were received anddisbursed under TUFS, 2004/05
Credit applications received Credits Disbursed
Nodal Number of
agencies Number of Project Amount Number Project Amount applicationsapplica- costa of loan of applica- costa sanctioneda rejected
tions requireda tions
Agencies that 1 290 23 031.07 12 237.79 950 14 224.00 6 682.58 118lend to all (73.64)b (61.68)b (55.00)b (9.15)b
industriesAgencies that 2 379 2 498.38 1 480.32 1 930 1 778.29 1 006.88 44
lend only (81.13)b (71.18)b (68.04)b (1.85)b
to SSITotal 3 669 25 529.45 13 718.11 2 880 16 002.29 7 689.46 162
(78.50)b (62.26)b (56.04)b (4.42)b
Source: Author’s calculations from a report, “Progress of TUFS as on 30 November 2004”, by the Office ofthe Textile Commissioner, Mumbai.
Notes: a Project costs/amount sanctioned are in crores of rupees (1 crore=10 million).b Percentage of the corresponding total.

156
Das, D. K., 2003. “Quantifying trade barriers”, Working Paper No. 105, Indian Council forResearch on International Economic Relations, New Delhi.
Goswami, O., 1990. “Sickness and growth of India’s textile industry: Analysis and policyoptions”, Economic and Political Weekly, vol. 25, No. 44; pp. 2429-2439.
, (1985). “Indian textile industry, 1970-1984: An analysis of demand and supply”,Economic and Political Weekly, vol. 20, No. 38; pp. 1603-1614.
Ministry of Textiles, 2007. “Review note on growth and investment in textiles during2006-07”, Economic Division, New Delhi.
Misra, S., 1993. India’s Textile Sector: A Policy Analysis. Sage Publishers, New Delhi.
Murty, G. V. S. N. and T. R. Sukumari, 1991. “Demand for textiles in India”, Economicand Political Weekly, vol. 26, No. 21; pp. M61-M67.
Narayanan, G. B., 2007. “Some economic issues in the Indian textile sector. UnpublishedPhD thesis. Indira Gandhi Institute of Development Research, Mumbai.
, 2005a. “Questions on textile industry competitiveness”, Economic and PoliticalWeekly, 26 February-4 March 2005.
, 2005b. “Effects of trade liberalisation and environmental and labour regulationson India’s organised textile sector”, Working Paper No. WP2005-005, IndiraGandhi Institute of Development Research, Mumbai.
National Sample Survey Organisation (NSS), 2005. NSS sixtieth round – “HouseholdConsumer Expenditure in India”, No. 505. Department of Statistics, New Delhi.
, (2002). NSS fifty-sixth round (July 2000-June 2001) – “Unorganised Manufactur-ing Sector in India: Characteristics of Enterprises”, No. 477. Department ofStatistics, New Delhi.
, (1998). NSS fifty-first round (July 1994-June 1995) – “Assets and Borrowings ofthe Unorganised Manufacturing Sector in India”, No. 435. Department of Statis-tics, New Delhi.
, (1994). NSS forty-fifth round (July 1989-June 1990) – “Tables with Notes on Surveyof Unorganised Manufacture: Non-Directory Establishments and Own AccountEnterprises, Part I (All-India)”, No. 396/2. Department of Statistics, New Delhi.
, (1989). NSS fortieth round (July 1984-June 1985) – “Tables with Notes onSurvey of Unorganised Manufacture: Non-Directory Establishments and OwnAccount Enterprises, Part I and Part II (vols. 1 and 2), No. 363/1. Department ofStatistics, New Delhi.
Roy, T., 1996. Cloth and Commerce: Textiles in Colonial India. Sage Publications, New Delhi.
Sastry, D. U., 1984. The Cotton Mill Sector in India. Oxford University Press, New Delhi.
REFERENCES

157
VI. INDIAN TEXTILE AND CLOTHING SECTORPOISED FOR A LEAP*
By J. N. Singh
Introduction
The Indian textile and clothing industry, as one of the oldest industries of thecountry, has witnessed several changes in fortune during the post-independence period.Following a quick upturn in the immediate post-independence period until the 1960s,when the dominant industrial policy was that of import substitution, it went into a declineuntil almost 1985 as market forces were not being allowed to operate and the entirepolicy had become very restrictive and stifling. The “New Textile Policy” of 1985managed to relax several licensing requirements, raised the maximum investment limitand generally created a good investment climate.
However, in the absence of a general economic resurgence in the country, thetextile sector continued to languish until a few years ago. Since then, it has witnessedunprecedented optimism and investment, heralding the vision of a new and glorious erain the Indian textile and clothing sector. This chapter first reviews the static scenario ofthe Indian textile sector and its standing in the world textile economy. It then discussesand analyses the trend in production and exports of Indian textiles and clothing. Finally,it looks at supportive government policies for facilitating growth in this sector, theindustry’s response to those policies and emerging trends that are making the sectorstrong and vibrant. The chapter concludes with a discussion on what would make theIndian industry more competitive globally.
A. Overview of the sector
The Indian textile and clothing industry is one of the largest segments of theIndian economy, as it contributes around 14 per cent of total industrial production, orabout 4 per cent of India’s gross domestic product, and bout 17 per cent of the grossexport earnings with a very low import intensity. The sector directly employees about 35million people, making it the second largest provider of jobs after agriculture.1
The Indian textile sector is also well placed globally (table 1). In terms ofinstalled capacity of spinning machinery, it ranks second after China, while in weaving itranks first in plain looms and fourth in the shuttleless variety. In raw materials, it ranksthird in cotton after China and the United States, first in jute, second in silk and fifth insynthetic fibres and yarn.
Thus, it can be seen that India is traditionally strong in textile productioncapabilities and in raw materials. However, decades of restrictive government policiesfavouring small-scale operations have led to certain structural weaknesses in the sector.
* For further statistical information and details, readers are invited to check www.txcindia.comand www.texmin.nic.in.
1 See Ministry of Textiles, 2007, Annual Report, 2006/07 (also at www.texmin.nic.in).

158
Therefore, although India has the highest member of weaving looms, the percentage ofshuttleless looms (which ensure high-quality fabric) to plain looms is hardly 3 per centcompared with the world average of 16 per cent. Except for spinning, sectors such asweaving, processing and garment production are predominantly in the decentralizedsector, thus lacking the advantage of scale. The processing and weaving sectors inparticular are highly fragmented and technologically less advanced.
Table 1. India’s position in the world textile economy
India as India’s CountryCategory World India per cent of world with first
world rank rank
Installed capacitySpinning – 2005
Spindles(cotton system) Million 190.87 37.42 19.60 2 ChinaSpindles (wool) Million 14.98 1.04 6.94 3 ChinaSpindles(cotton and wool) Million 205.85 38.46 18.68 2 ChinaRotors Million 8.39 0.52 6.20 5 Russian
Federation
Weaving – 2005Shuttlle looms Million 4.34 1.98 45.62 1 IndiaShuttleless looms Million 0.88 0.05 5.68 4 ChinaHandlooms Million 4.60 3.90 84.78 1 India
Total looms 9.82 5.93 60.39 1 India
Production (P)Fibre/yarn
Raw cotton(2005/06)(Oct-Sept) Million kg. 24 756 4 148 16.76 3 ChinaCellulosic fibre/yarn(2005) Million kg. 2 529 295 11.66 2 ChinaSynthetic fibre/yarn(2005) Million kg. 31 762 1 850 5.82 5 ChinaRaw wool(greasy) (2005) Million kg. 2 164 45 2.08 7 AustraliaRaw silk (2004) Million kg. 126 17 13.49 2 ChinaJute (2005/06) Million kg. 2 826 1 575 55.73 1 India
Total 64 163 7 930 12.36
Yarn – 2005Cotton yarn (est.) Million kg. 24 994 2 460 9.84 2 China
Fabrics – 2005Cotton fabrics (est.) Million kg. 14 011 2 071 14.78 3 China
Per capita fibreconsumption
Total fibre, 2005 (P) Kg. 9.28 5.05 – – –World trade – 2005
Total textiles andclothing exports US$ billion 479.54 17.08 3.56 6 European
Union 25
Sources: WTO, ITMF, ICAC, JMDC, ASFI and Fibre Organon, compiled in the “Compendium of internationaltextile statistics” (available at www.txcindia.com).

159
B. Trends in investment and production
In the post-independence period until the mid-1980s, India followed a stronginward-looking policy, using a variety of regulatory mechanisms to orient the textile andclothing sector in a key way. A strict industrial licensing regime required firms to seekgovernment permission for establishing any new operation or the expansion of existingones, while several sectors such as garments, knitting etc., were kept restricted forsmall-scale entrepreneurs, and strict labour laws proved a disincentive for expansion.The New Textile Policy relaxed several licensing requirements, raised the maximumlimits on allowable investment and reduced import controls. Businesses were alsoencouraged to modernize their technological base through the disbursement of cheaperlines of credit.
This trend continued in 1991 with the opening up of the Indian economy, but thesector remained largely stagnant and decaying during the 1990s when several largemills closed and several traditional entrepreneurs moved out of the textile trade.
In fact, after a very long time the sector has received a real boost only in the pastfour-five years as the general economy has substantially improved, leading to a surge indemand. There is an all-around sentiment of tremendous optimism, backed by a surge inproduction and investment growth. As the investment figures in figure I show, thesanctioned investment (basically, projects in various stages of implementation) has shownalmost 100 per cent growth, year-on-year, for the past five years. The investment figures atthis level have so far been unprecedented in the history of the Indian textile sector.
Figure I. Sanctioned investments in India's textile and clothing sector
Source: www.txcindia.com.
Note: The non-TUFS investment is an informed estimate.
10 000
9 000
8 000
7 000
6 000
5 000
4 000
3 000
2 000
1 000
0
69278
74298
144
718
328
1639
510
3402
786
7860
2001-2002 2002-2003 2003-2004 2004-2005 2005-2006 2006-2007(Apr-Feb)
Investment in textile industry TUFS Investment in textile industry (US$ million) non-TUFS
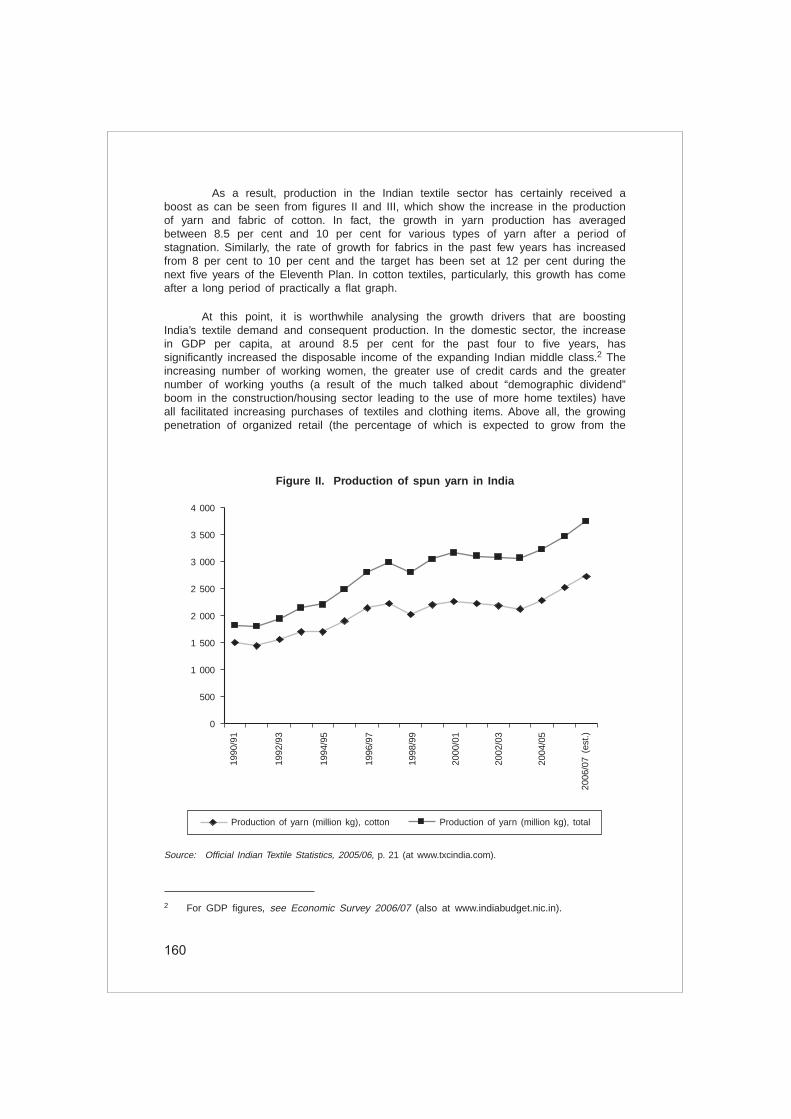
160
As a result, production in the Indian textile sector has certainly received aboost as can be seen from figures II and III, which show the increase in the productionof yarn and fabric of cotton. In fact, the growth in yarn production has averagedbetween 8.5 per cent and 10 per cent for various types of yarn after a period ofstagnation. Similarly, the rate of growth for fabrics in the past few years has increasedfrom 8 per cent to 10 per cent and the target has been set at 12 per cent during thenext five years of the Eleventh Plan. In cotton textiles, particularly, this growth has comeafter a long period of practically a flat graph.
At this point, it is worthwhile analysing the growth drivers that are boostingIndia’s textile demand and consequent production. In the domestic sector, the increasein GDP per capita, at around 8.5 per cent for the past four to five years, hassignificantly increased the disposable income of the expanding Indian middle class.2 Theincreasing number of working women, the greater use of credit cards and the greaternumber of working youths (a result of the much talked about “demographic dividend”boom in the construction/housing sector leading to the use of more home textiles) haveall facilitated increasing purchases of textiles and clothing items. Above all, the growingpenetration of organized retail (the percentage of which is expected to grow from the
Figure II. Production of spun yarn in India
Source: Official Indian Textile Statistics, 2005/06, p. 21 (at www.txcindia.com).
4 000
3 500
3 000
2 500
2 000
1 500
1 000
500
0
1990
/91
1992
/93
1994
/95
1996
/97
1998
/99
2000
/01
2002
/03
2004
/05
2006
/07
(est
.)
Production of yarn (million kg), cotton Production of yarn (million kg), total
2 For GDP figures, see Economic Survey 2006/07 (also at www.indiabudget.nic.in).

161
present 3 per cent to more than 10 per cent by 2010) (Kearney, 2006) will facilitateavailability, thus substantially increasing purchases of textiles and clothing by Indianconsumers.
In the export sector, the end of the MFA has given a boost to the Indian textileentrepreneur trend, which has been augmented by the progressive dismantling ofspinning and weaving from the developed world.
In fact, in response to the growth drivers, and in anticipation of those driversbecoming sustainable in the long term, the Indian textile industry has been makingsubstantial investments in the past four-five years (see figure I).
C. Trends in exports: How does India fare?
Indian exports from 1992/93 to 2005/06 showed an increasing trend (figure IV),especially in 2005/06, when a growth rate of 18.33 per cent was recorded.
However, India was not a big gainer during the early period of integration. Whilethe share of China in global textile and clothing exports increased from 7.94 per cent in1990 to 14.75 per cent in 2000, 20.93 per cent in 2004 and 24.02 per cent in 2005,India’s figures are more modest. India’s share increased from 2.22 per cent in 1990 to3.16 per cent in 2000, 3.12 per cent in 2004 and 3.56 per cent in 2005.
Figure III. Production of cloth in India
Source: Official Indian Textile Statistics, 2005/06, p. 30 (at www.txcindia.com).
60 000
50 000
40 000
30 000
20 000
10 000
0
1990
/91
1992
/93
1994
/95
1996
/97
1998
/99
2000
/01
2002
/03
2004
/05
2006
/07
(est
.)
Production of cloth (million m2), cotton Production of cloth (million m2), total
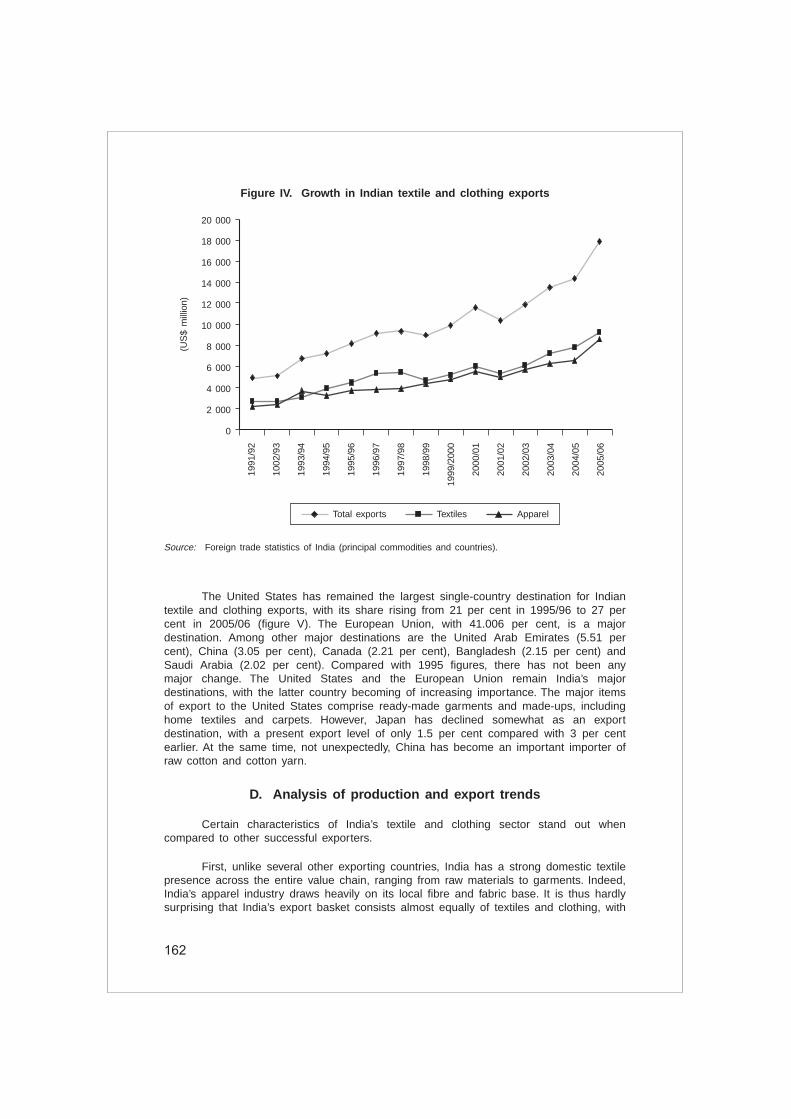
162
The United States has remained the largest single-country destination for Indiantextile and clothing exports, with its share rising from 21 per cent in 1995/96 to 27 percent in 2005/06 (figure V). The European Union, with 41.006 per cent, is a majordestination. Among other major destinations are the United Arab Emirates (5.51 percent), China (3.05 per cent), Canada (2.21 per cent), Bangladesh (2.15 per cent) andSaudi Arabia (2.02 per cent). Compared with 1995 figures, there has not been anymajor change. The United States and the European Union remain India’s majordestinations, with the latter country becoming of increasing importance. The major itemsof export to the United States comprise ready-made garments and made-ups, includinghome textiles and carpets. However, Japan has declined somewhat as an exportdestination, with a present export level of only 1.5 per cent compared with 3 per centearlier. At the same time, not unexpectedly, China has become an important importer ofraw cotton and cotton yarn.
D. Analysis of production and export trends
Certain characteristics of India’s textile and clothing sector stand out whencompared to other successful exporters.
First, unlike several other exporting countries, India has a strong domestic textilepresence across the entire value chain, ranging from raw materials to garments. Indeed,India’s apparel industry draws heavily on its local fibre and fabric base. It is thus hardlysurprising that India’s export basket consists almost equally of textiles and clothing, with
Figure IV. Growth in Indian textile and clothing exports
Source: Foreign trade statistics of India (principal commodities and countries).
20 000
18 000
16 000
14 000
12 000
10 000
8 000
6 000
4 000
2 000
0
1991
/92
1002
/93
1993
/94
1994
/95
1995
/96
1996
/97
1997
/98
1998
/99
1999
/200
0
2000
/01
2001
/02
2002
/03
2003
/04
2004
/05
2005
/06
Total exports Textiles Apparel
(US
$ m
illio
n)

163
values of US$ 8.86 billion and US$ 8.22 billion, respectively. Only a few countries suchas China, Indonesia, Pakistan and Turkey, plus the European Union, are strong in bothsubsectors or else their major clothing exporters are also significant textile importers.
However, this strength in textile production and raw materials has not beenproperly utilized in enhancing exports, as China has so capably done. One reason hasbeen the restrictive government policies that, until the 1990s, kept the garmentsubsector only for the small-scale enterprise sector, while labour policies ensured thatmost industries would rather remain small and not take export orders then expand.Another reason was a huge disparity between domestic textile producers and apparelexporters – the two being separate set of entrepreneurs. The latter group was thusunable to take full advantage of India’s extensive textile production capabilities.
Figure V. Direction of exports, 1995 and 2005
Source: Foreign trade statistics of India (principal commodities and countries).
Direction of exports, 1995
United States21%
Germany10%
United Kingdom10%
United ArabEmirates
5%
France5%
Italy4%
Bangladesh4%
Japan3%
Netherlands3%
Belgium3%
Others32%
Direction of exports, 2005/06
United States27%
United Kingdom8%
Germany6%
United ArabEmirates
6%
France5%
Italy3%
Spain3%
China3%
Canada2%
Netherlands2%
Others33%

164
Third, the Indian textile and clothing sector received an insignificant FDI inflow ofonly US$ 450.02 million between 1991 and March 2006, amounting to just 1.16 per centof total FDI of US$ 38.96 billion.3 This was due, in part, to the lesser attractiveness ofIndia as an FDI destination and in part to the Government’s restrictive policy. Thus,India was unable to gain from the growing global integration as the rapidly expandingapparel-exporting countries such as Cambodia, China, Mexico and Viet Nam, plus thecountries of Eastern Europe, were able to expand their apparel exports due tosubstantial FDI inflows.
Another consequence of the poor FDI inflow was the relative absence of globalretailers and textile chains until quite recently. The weak presence of major buyers suchas Wal-Mart, Sears, Nike and Liz Claiborne hindered the organization of the domesticproduct towards substantive exports.
A third factor that hindered India’s export growth was its absence from practicallyall major regional free-trade agreements. In the past decade, the fastest-growing apparelexporters – Bangladesh, Mexico, Romania and Turkey – have all been part ofpreferential trade agreements while China has received massive FDI inflows from HongKong, China, Taiwan Province of China and Japan. In fact, each of the above exportingcountries experienced a surge in exports after joining their respective regional tradeagreements or a bilateral preferential trade agreement.
E. Supportive government policies and new trends towardsre-emergence of the textile economy in India
1. Supportive government policies
It has been shown above that the Indian textile and apparel sector has shownpositive signs of an upturn in the past three to four years. The Government has takenseveral positive steps, detailed below, to facilitate the smooth growth of the sector.4
(a) Technology Upgrading Fund Scheme
To facilitate technological upgrading in the sector, the Government launchedTUFS with effect from 1 April 1999 for five years initially, and which has now beenextended up to 2011/12. The scheme provides for reimbursement of 5 per cent interestpaid on term loans for technological upgrading of textile machinery. In this way, theGovernment has assisted the Indian textile companies by ensuring that they are notover-burdened by the high interest rate prevailing in the country.
(b) Integrated textile parks scheme
In order to a world-class infrastructure for textile units as well as facilitate the needfor them to meet international social and environmental standards, this scheme envisagesthe creation of textile parks in the public-private partnership mode. Currently, 30 parks arein various stages of implementation, and 50 more are planned for the next five years.
3 See the proceedings of the seminar on “The Need and Scope of FDI in Indian Textiles” atwww.crisil.com/policy-advisory/seminar-textiles/.
4 Details of these steps can be found at www.texmin.nic.in and www.txcindia.com.

165
(c) Fiscal rationalization
In the 2006 budget, the excise duty on all manmade fibres and yarns wasreduced from 16 per cent to 8 per cent. The 2007 budget carried it forward by reducingthe customs duty on polyester fibres and yarns from 10 per cent to 7.5 per cent. Thecustoms duty on polyester raw materials such as DMT, PTA and MEG were alsoreduced from 10 per cent to 7.5 per cent. These measures are expected to makemanmade fibres and yarn cheaper and thus increase the competitiveness of fabric andapparel manufacturers.
(d) Technology Mission on Cotton
In February 2000, the Government launched the Technology Mission on Cottonwith the objective of addressing the issues of raising productivity, improving quality andreduction of contamination in cotton. Indeed, cotton production in the past three yearshas increased substantially and contamination has been reduced, as assessed byindependent agencies.
(e) Other steps taken to increase competitiveness
Earlier, only small-scale manufacturers were allowed to make woven RMG,knitted and hosiery products. While the initial aim was to boost employment opportuni-ties and promote entrepreneurship at the smaller enterprise levels, in practice itrendered the small manufacturers uncompetitive globally. By 2003/04, the sector hadbeen totally freed.
In addition, FDI up to 100 per cent through the automatic route has now beenallowed.
2. Positive response of the industry
The industry has responded positively to these policy initiatives, and investmentin this sector has been unprecedented. In fact, growth figures during the past few yearshave made the entire textile industry brim with unprecedented confidence and optimism.It is no coincidence that two separate studies (although overlapping in part), carried outin 2006, projected almost identical growth targets for the industry. The first study wasthe “Report of the Working Group on the Textile and Jute Industry for the Eleventh Five-Year Plan”,5 in which the textile industry was projected to grow at 16 per cent in valueto reach US$ 115 billion by 2012. The report also projected a growth rate of 12 percent in volume for cloth production while apparel was expected to grow at 16 per centin volume and 20 per cent in value terms. Exports were expected to grow at a rate of20 per cent in value.
The second study was the Confederation of Indian Textile Industries-sponsored“Vision for the Indian Textile and Clothing Industry” prepared by CRISIL.6 The studyenvisages a figure of US$ 110 billion by 2012, boosted by a CAGR of 10 per centannually in the domestic sector and 19 per cent annually in the export sector.
5 See www.txcindia.com.6 See www.citiindia.com for details.

166
3. Why has textile sector investment picked up only recently?
A question that is persistently asked is why have the investments in the textilesector picked up only recently, especially when it had long been known that the MFAsystem would be fully dismantled from 1 January 2005. Of course, the post-quotaatmosphere provided a tremendous incentive for the Indian textile and cloth entrepre-neurs to grab the impending opportunity. However, an equally important factor boostinginvestment has been the present buoyancy in domestic textile demand and theexpectation of continued buoyancy (the drivers of domestic textile growth, both in thesupply and demand side, have been discussed above). At the same time, the Indiantextile sector was only recently unshackled from most restrictions. In the apparelsubsector, while the woven segment was de-reserved from the small sector industrylimitation in 2001, the knitwear segment was totally freed only in 2005.
The fiscal rationalization in the entire sector began significantly in 2004. Natu-rally, investments started flowing in as the industry became unshackled and able tocompete freely and fully. Yet another factor propelling investment has been the extraordi-nary growth in cotton production since 2004/05, which has removed the dependence oncotton imports and the consequent uncertainty leading to poor investments.
4. New trends towards re-emergence of the textile and apparelsubsectors in India
Several new trends can be seen in the textile and clothing sector that will onlyserve to strengthen the sector.
(a) Consolidation and integration
There is a significant scaling up by way of horizontal consolidation and verticalintegration. The majority of the investments under TUFS have come not from newentrants but by the existing players. With the removal of restrictions on increasingcapacity, following the progressive liberalization of this sector during the mid-1980s andcontinuing into the 2000s, the mean investment per firm in plant and machinery hassignificantly increased. In the past fours, in particular, this trend has greatly accelerated.The largest Indian firms, such as Arvind, Indian Rayons, Vardhaman, Welspun and Alok,among others, have sanctioned investments of more than Rs 10,000 crores in the pastfew years.7
Second, there has been a significant forward integration into garments by yarnmakers, spinners and major weavers. For example, Arvind Mills and Vardhman exemplifythis trend. Interestingly, a significant number of cotton ginners are forward integratinginto spinning, as can be seen in the cotton areas of Andhra Pradesh and Punjab.
Third, significant backward integration by small and medium-sized knitwearexporters into yarn-making is occurring in the Coimbatore-Tirupur area. In fact, some ofthe best examples of full integration are exemplified by Alok, Welspun Industries andVardhman Industries, which straddle the entire range from spinning to branded garmentsand home textiles.
7 Office of the Textile Commissioner.

167
Thus, there is an all-around trend towards scaling up as well as capturing theentire value chain from spinning to garmenting, in order to gain from the efficiencies ateach level. Even the government-facilitated integrated textile parks scheme is servingthe purpose of informal consolidation, as despite separate ownership, firms are likely tohave a similar brand name and take common big orders.
(b) Blurring of boundaries between export and domestic markets
Whereas previously domestic textile companies and exporters formed two sepa-rate sets of entrepreneurs, that boundary is now fast becoming blurred, as all majordomestic players are becoming significant exporters. As purchasing power in the Indianmarket has increased, due to India’s increasing GDP and “demographic dividend”, therehas been a rapid rise of domestic brands. Practically all of the 20 to 30 top textile andapparel firms have introduced their domestic brands and are aggressively positioningthemselves within segments of domestic markets.
As these players become large, several of them are going beyond the nationalboundaries by purchasing international brands in order to penetrate the First Worldmarket as well as to supply the domestic market under that brand name. For example,in the home textile market, Welspun has purchased Christy while GHCL has purchasedDan River and Roseby’s, Creative has purchased Portico brands to facilitate entry intothe United States and European Union markets while Alok Industries has purchased 8to 10 European brands.
Thus, the earlier difference between domestic manufacturers and exporters isbeing whittling away; the successful textile player has to constantly look at opportunitiesin the domestic and export markets.
(c) Entry of large domestic and foreign retail buyers
Until recently, India had been virtually ignored by the top international retailchains. Now their strong presence is increasingly being felt and several top firms haveopened their sourcing centres in India. However, even more significant is the impendingentry of the very large Indian retailers such as Reliance, Bharati-Wal-Mart, the AdityaBirla Group and Tata-Trent. Although the current penetration by organized retailers isonly 3 per cent in India, it is expected to grow to around 12 per cent by 2012. Asclothing forms an important aspect of organized retail, the sale of clothing throughorganized retail chain shops can be as high as 15 per cent to 20 per cent of totalsales. This would still be much less than in the United States, where the 24 biggestretailers account for 98 per cent of apparel sales. The position in the European Union issimilar.
International experience suggests that because of their large distribution networkand considerable buying power, these high-volume retail chains exert a great deal ofcontrol over prices and quality terms. The retail experience has two other features. Firstis “lean retailing”, which allows retailers to maintain a lean inventory, but will involvessuppliers for “rapid replenishment” of goods. Second is the concept of “full packaging” inthat rather than buy fabric from specific sources for conversion into apparel by differentsources, the retailer prefers a “full package” solution from a limited member of sources.
Thus, the increasing presence of national and international major retailers inIndia will result in further formal and informal vertical integration and horizontalconsolidation in the sector as well as in enhancing quality trends. The pressure on

168
margins will serve to reduce inefficiencies in the system by way of further moderniza-tion, consolidation and integration. The best outcome, however, will be the increase inthe demand for fabric and, hence, an increase in the size of the sector.
(d) Confident participation in foreign exhibitions
Indian textile and apparel exporters are now confidently exhibiting at internationaltrade fairs as they seek new areas and territories. The various textile and apparel exportpromotion agencies are currently extremely pro-active and have introduced severalschemes for promoting exports to new areas. An example of this newfound confidencewas the recent Indian participation in Heimtextile at Frankfurt where, after the Germanexhibitors, the second highest number of participants were from India.
5. Further steps required to increase India’s competitiveness
(a) Improving labour laws
One of the main requirements for growth in the apparel subsector is therelaxation/amendment of the labour laws, to ensure an equal chance of success for thecountry’s exporters and manufacturers in the present global environment.8 Outdatedlabour laws have induced inflexibility in the clothing industry, leading both to fragmentedoperations in order to circumvent these laws and to lost export orders due to industry’shesitation over expanding when there is an upsurge. Most of the countries competingwith India have labour laws that are more flexible. For example, the Chinese apparelindustry has highly flexible labour laws that allow for lay-offs during the non-peakseason, hiring of contract labour, and a flexible hiring and firing system in SEZ-basedunits. The Mexican apparel industry allows layoffs during the slack business season.
The industry in India is proposing the provision of flexibility to textile exporting unitsin hiring labour, subject to ensuring 100 days employment to cater to variations indemand. An increase in daily working hours from 9 hours a day to 12 hours a day, and inweekly working hours from 48 hours a week to 60 hours a week, is also being proposed.
(b) Decreasing transaction costs
Various studies have established that the transaction costs faced by the Indianindustry are very high, which adversely affects its competitiveness. A study undertakenby the EXIM Bank of India clearly showed that although transaction costs in India haddeclined because of declining procedural complexities, they were still substantially higherif compared with competitors. Transaction costs vary from sector to sector, and are veryhigh in the textiles and garment subsector, ranging from 3 per cent to 10 per cent ofexport revenue in 2002. These costs, inter alia, are shown in table 2.
(c) Improving the general infrastructural conditions
This improvement includes roads, transportation etc., so that the costs ofreaching the nearest port as well as turn-around time at the port are globallycomparable, to ensure that Indian exporters are not placed at a disadvantage vis-à-visglobal competitors.
8 For an outstanding analysis, see T. Besley and R. Burgess, 2004.

169
(d) Augmenting existing training infrastructure
Significant improvements are necessary in order to ensure the availability of asufficient number of trained personnel needed to meet the huge shortfall. Already, areassuch as Tirupur and Surat are experiencing a noticeable lack of trained manpower.
F. Conclusion
Investment in the textile sector in the past three to four years, the consequentincrease in yarn and fabric production and the immense optimism witnessed in thesector have definitely resulted in a very different scenario compared to the stagnationand the despondency witnessed just five or six years ago. As India’s Minister of TextilesSri Shankersinh Vaghela has said, “the erstwhile sunset sector is now recognized as thenew sunrise sector”.
However, it must be recognized that the industry still has a long way to go,these recent advances notwithstanding. Large sections of the textile value-chain stillneed to be fully modernized, while the export sector has yet to take full advantage of itsexisting production strength. There are many areas around the world and many productlines where India is very weakly represented. Thus, while the private sector will need tocontinue its heavy investment in this industry during the next several years, building onthe recent positive trends, India also needs to integrate more fully into the global textileand apparel value chain in order to reap the full benefits from its strengths.
Only a coordinated effort by all – the Government, industry and individual units –can enable India to achieve its apparently high and stretched targets of the eleventhFive-Year Plan. Therefore, the next five years will indeed be a period of reckoning whenthe future direction of the Indian textile and apparel sector will be set for theforeseeable future. The period 2007/12 will also show whether India has successfullygrasped the momentous and unprecedented opportunity that has come its way.
Table 2. Transaction cost in Indian industries
Incidence of un-neutralized Percentage of FOBstate taxes and duties value of exports
Sales tax (including CST) 3.41Octroi, Mandi Tax and other local levies 1.36Electricity duty 1.00Others 1.00
Source: EXIM Bank Study, 2002.

170
Ministry of Textiles, 2007. Annual Report 2006/07. New Delhi. (See also www.texmin.nic.in).
Ministry of Finance, 2007. Economic Survey, 2006/07. New Delhi. (See also www.indiabudget.nic.in).
2006. “Retail in India: Getting organized to drive growth” and “Will Wal-Martsucceed in India? Perhaps…but it won’t be easy”, IndiaKnowledge@Whartonhttp://knowledge.wharton.upenn.edu/india/articlepdf/4133.pdf?CFID=59736386&CFTOKEN=64614846&jsessionid=9a30e4966d4f6e2e7f7f published 14 December
Besley, T. and R. Burgess, 2004. “Can labour regulation hinder economic performance?Evidence from India”, Quarterly Journal of Economics, vol. 119, No. 1; pp. 91-134.
REFERENCES
171
VII. TEXTILES AND CLOTHING TRADEPOST-AGREEMENT ON TEXTILES AND CLOTHING:
CAN TRADE FACILITATION HELP?By Noordin Azhari
Introduction
Developed and developing countries increasingly recognize that trade facilitationcould be instrumental in saving traders from a great deal of difficulties and wastage ofresources, collectively known as trade transaction costs. The objective of trade facilita-tion is to reduce the cost of doing business among all parties by eliminating unneces-sary administrative burdens associated with moving goods and services across borders.The means of achieving this objective are the simplifiaction, modernization and automa-tion of trade procedures to match established international standards. Because tradefacilitation is instrumental in removing bottlenecks in import and export, it has also beenreferred to as the “plumbing” of international trade.
Trade facilitation may be defined1 as the simplification and harmonization ofinternational trade procedures, encompassing the activities, practices and formalitiesinvolved in collecting, presenting, communicating and processing data required for themovement of goods internationally. This definition is related to a wide range of activitiesassociated with import, export and transit procedures (e.g., customs or licensingprocedures), transport formalities, and payments, insurance and other financial require-ments. Yet, however one defines trade facilitation, its ultimate meaning is the ease bywhich goods move across international borders, whether the goods are arriving at theirfinal destination or in transit to final consumption in other trading economies.
In the international textiles and clothing trade, tariffs and quotas are indeedimportant determinants of trade flows. In the post-ATC period, it has been observed thatmarket access improvement through tariff reduction and quota removal has beennegated by the imposition of other measures such as the use of antidumping measures,restrictive rules of origin together with existing administrative and physical barriers. Thelatter, coupled with cumbersome border procedures, a lack of infrastructure and hightransportation costs, have the same effect on trade as high tariffs.
According to Nordås (2004), port efficiency, control of corruption and quality ofinfrastructure are among the most important trade barriers affecting international produc-tion networks in the textiles and clothing sectors.
While one can argue over which of these or other barriers are more important, itcannot be denied that countries with a weak infrastructure and time-consuming bordercrossing procedures will be less attractive for inclusion in the international productionnetworks in the post-ATC period. Furthermore, poor infrastructure and weak control ofcorruption reduce the ability of exporting firms to pay decent wages to their workers.This is because producers cannot significantly affect the market price of their product ormaterial inputs. When costs are high due to the weaknesses discussed above, labourcosts have to give way.
1 There is no universally agreed definition on trade facilitation yet.

172
Many studies that have evaluated the implication of quota-free textiles andclothing trade have concluded that lead-time is likely to be more important in thepost-ATC market. Therefore, a combination of being dependent on imported intermedi-ate inputs, having a weak infrastructure and weak control of corruption can beparticularly damaging. Thus, under the post-ATC environment, time taken to reachmarkets has become an important factor in determining whether a textile and clothingcompany can sustain, or remain within, the global textiles and clothing supply chainnetwork.
A. Importance of trade facilitation
Walkenhorst and Yasui (2003) estimated that if transaction costs were reducedby 1 per cent globally, welfare gains would amount to about US$ 40 billion, with allcountries benefiting and non-OECD countries experiencing the biggest gains in relativeterms. UNCTAD (1994) calculated that trade transaction costs equal to 7-10 per cent oftotal value of world trade. European Union estimates that in intra-EC trade, transactioncosts equal between 3.5 per cent and 15 per cent.2
In addition to the above, cumbersome trade procedures and documentaryrequirements cause delays in shipments of goods and services that may also betranslated into costs (see table, “Procedural hurdles in trading in selected regions”).The delays will be compounded if there are minor mistakes in the documentssubmitted. With an average of 27-30 different parties involved in a single internationaltrade transaction involving 40 documents, 200 data elements (30 of which arerepeated many times) and re-keying of 60 per cent to 70 per cent of all data atleast once, mistakes can and do happen along the paper trail.3 The figure, “Datarepetition in trade documentation”, illustrates data repetition by type of documentaryrequirement.
Someone has to bear these costs. If the seller absorbs the cost, his profitmargin will be reduced. If he chooses to pass it on the buyer, his price may not becompetitive. This is where the importance of trade facilitation comes in, especially asmost developing countries are dependent on international trade. This becomes morecritical if the seller’s exports contain high proportion of imported intermediate goods.Thus, an inefficient trade facilitation system cuts both ways.
Trade facilitation is recognized as a tool that reduces time, transaction costs andthe complexity of international trade. Well-targeted trade facilitation measures, such asthe establishment of Single Window facilities, the introduction of a Single AdministrativeDocument, the application of risk management techniques and “green lanes”, will bebeneficial both to governments and to businesses. Governments benefit from enhancedrevenue collection, better statistics and administrative controls, while businesses benefitfrom faster customs clearance. From a country perspective, trade facilitation could leadto better trade and economic performance. From a regional integration perspective, tradefacilitation can be a useful tool that will promote intraregional trade and the establish-ment of regional production networks.
2 Estimates vary depending on the methodology and parameters used.3 See APEC Business Advisory Council Report, 1996
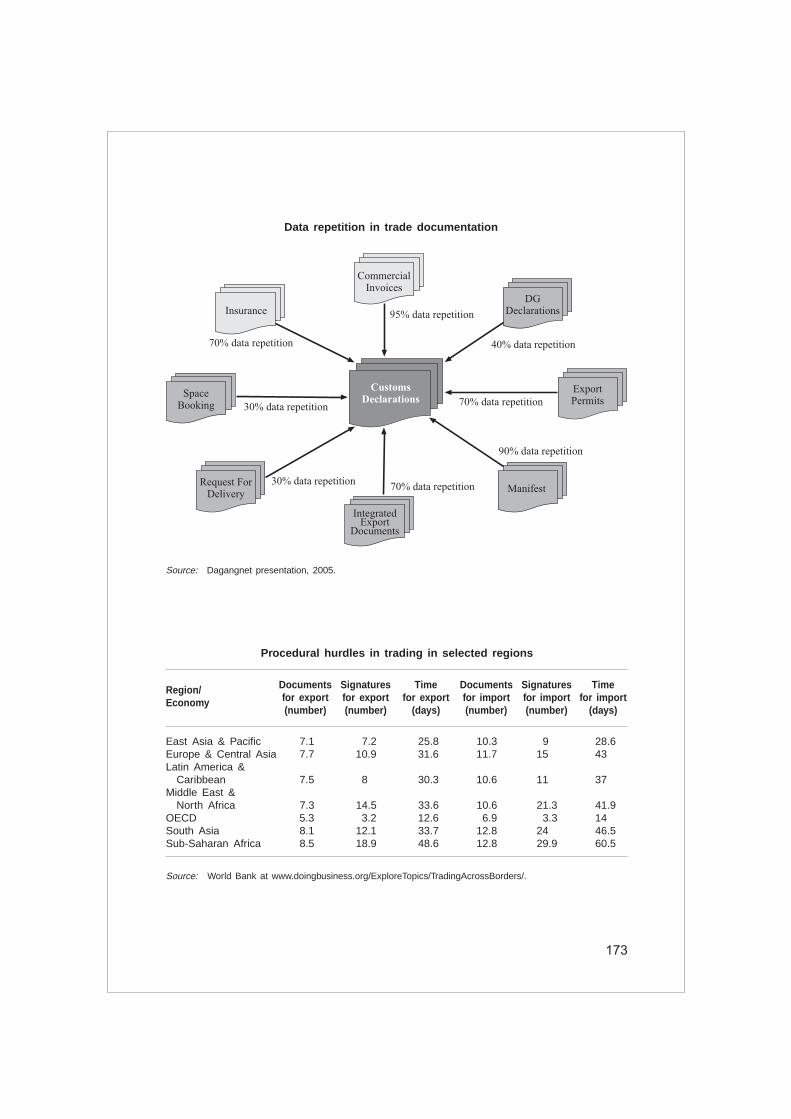
173
Procedural hurdles in trading in selected regions
Region/ Documents Signatures Time Documents Signatures Time
Economy for export for export for export for import for import for import(number) (number) (days) (number) (number) (days)
East Asia & Pacific 7.1 7.2 25.8 10.3 9 28.6Europe & Central Asia 7.7 10.9 31.6 11.7 15 43Latin America &
Caribbean 7.5 8 30.3 10.6 11 37Middle East &
North Africa 7.3 14.5 33.6 10.6 21.3 41.9OECD 5.3 3.2 12.6 6.9 3.3 14South Asia 8.1 12.1 33.7 12.8 24 46.5Sub-Saharan Africa 8.5 18.9 48.6 12.8 29.9 60.5
Source: World Bank at www.doingbusiness.org/ExploreTopics/TradingAcrossBorders/.
Data repetition in trade documentation
Source: Dagangnet presentation, 2005.
Customs
Declarations
Insurance
CommercialInvoices
DGDeclarations
ExportPermits
Manifest
SpaceBooking
Request ForDelivery
IntegratedExport
Documents
70% data repetition
30% data repetition
30% data repetition70% data repetition
90% data repetition
70% data repetition
40% data repetition
95% data repetition

174
Several studies have tried to estimate the benefits that could be derived fromimplementation of trade facilitation measures. According to APEC, a 5 per cent reductionin trade transaction costs for trade in goods by 2006 would have raised APEC’s GDP by0.9 per cent, which in absolute terms represents around US$ 154 billion (APEC, 2002).The APEC study concluded that improvements across the board in trade facilitation incustoms, standards, business mobility and e-commerce would surpass the impact oftariff reduction on intraregional APEC imports.
The World Bank (2004) report on global economic prospects for 2004 estimatedthat enhancing capacity in global trade facilitation would increase world trade inmanufacturing goods by approximately US$ 77 billion, an increase of about 9.7 percent.
A European Commission study4 indicated that there were many benefits of tradefacilitation – for governments and citizens alike. It showed that the cost of tradeprocedures could represent as much as 4-5 per cent of the overall costs of tradetransaction. This cost is about the same as the current tariff average for trade inindustrial goods by industrialized countries, which is 3.8 per cent. Halving the costswould mean saving US$ 325 billion annually – money currently being wasted largely atthe expense of SMEs and developing country traders.
As mentioned above, trade transaction costs are reflected not only in the directmonetary outlays associated with tariffs, freight, insurance, transportation etc., but alsoin indirect expenses such as time and uncertainties. A study by Hummels (2001) foundthat for United States imports, the time cost of one day in transit is equivalent to an advalorem tariff rate of 0.8 per cent, yielding the equivalent of a 16 per cent tariff on anaverage ocean shipment of 20 days. An ESCAP time-cost-distance study, using amodified gravity model, estimated that on average, each additional day that a productwas delayed reduced trade by at least 1 per cent.
Put differently, each day’s delay is equivalent to a country distancing itself fromits trade partners by 85 km on average. Delays have an even greater impact ondeveloping country exports and the exports of time-sensitive goods, such as perishableagricultural products. In particular, a day’s delay reduces a country’s relative exports oftime-sensitive to time-insensitive agricultural goods by 7 per cent. Higher-end apparelmay also be considered as “perishable” due to its short lead-time requirement, thusmaking it time sensitive.
Recognizing the importance of the contribution of trade facilitation, the followingprogrammes/action plans have been adopted by various regional groupings and initia-tives:
(a) The Trade Facilitation Action Plan of APEC;
(b) The Pacific Regional Trade Facilitation Programme of the Pacific islandcountries;
(c) The Regional Trade Facilitation Programme of SADC/COMESA; and
4 See http://ec.europa.eu/taxation_customs/resources/documents/trade_facilitation-interest_for_developing_countries.pdf.

175
(d) The Trade and Transport Facilitation Programme in South-East Europe(being implemented by the World Bank).
The renewed interest in trade facilitation is also influenced by other recentdevelopments such as WTO trade facilitation negotiations, just-in-time operations and theneed for a swift flow of data and information, and trade and security.
1. World Trade Organization
Trade facilitation has become a prominent negotiating issue of the WTO DohaDevelopment Agenda negotiations. The initiation of trade facilitation negotiations by theJuly Package has placed this issue in the forefront of the development agenda of mostdeveloping countries. These negotiations are focused on clarifying and improving rel-evant aspects of GATT Articles V, VIII and X, which contain provisions on goods intransit, fees and formalities for imports and exports, and transparency issues.
2. Just-in-time operations
Modern businesses involving just-in-time operations and IT-based processes haveaccelerated the pace of doing business and the demand for fast and predictable releaseof goods. However, they are often hampered by inefficient customs and other adminis-trative procedures throughout the complete international supply chain, causing seriousdelays in goods delivery and increasing transaction costs.
Several countries in the Asian and Pacific region have implemented modern IT-based trade methods and have succeeded in reducing these delays. Such trademethods include paperless environments, ICT-enabled Single Window facilities orInternet-based systems, all of which enable swift exchange of data and informationelectronically. The success stories of Dagang Net in Malaysia, TradeNet of Singapore,and TradeLink and the Digital Trade and Transportation Network in Hong Kong, China,could serve as the drivers in the Asian and Pacific region by helping neighbouringcountries to implement similar systems.
3. Trade and security
Since the 11 September 2001 terrorist attacks, trade security has become anintegral part of the global supply chain. The traditional threat to trade has changed tothreat from trade. The challenge is how to facilitate the secure movement of the vastmajority of legitimate international cargo as efficiently as possible, while at the sametime effectively dealing with the small percentage that may pose a threat to security.This involves the application, at both the national and the international levels, of themany existing trade facilitation tools, instruments and recommendations related to theprocess and practice of international trade. Such measures could accelerate theimplementation of new trade facilitation techniques and procedures, including riskmanagement techniques, the concept of authorized traders, pre-arrival clearances orpost-clearance audits, which often require an extensive use of ICT and advanceinformation.
In this context, trade facilitation and trade security have complementary goals.The higher information content of many trade security efforts have, as their complement,improved trade facilitation outcomes. Moreover, it is clear that since many economies

176
are well inside the frontier of global best practice in the area of customs and portlogistics, improvement will “kill two birds with one stone” by yielding better tradefacilitation and trade security (APEC, 2002).
B. Textiles and apparel, post-ATC
1. Current situation
From 1 January 2005, textiles and clothing, after more than 40 years ofdeviation, returned to the general rules and disciplines of WTO. While this change wasexpected to bring considerable welfare gains, it also posed some significant challengesto developing countries.
According to Adhikari and Yamamoto (2005), the textile and clothing market hasbeen transformed into a buyers’ market, with a small number of large retailersdominating the sector. The economic power of large retailers, predominantly in devel-oped countries, has increased substantially over the past few years. In the UnitedStates, for example, the 29 biggest retailers account for 98 per cent of sales. The trendnow is towards greater product specialization, brand names and market segmentation.These large retailers collect market information about the latest trends in styles andtastes, and their integration of this information gives them a considerable advantage indealing with suppliers (Kelegama and Weeraratne, 2005).
In a buyers’ market, buyers’ preferences shape market response in the exportingcountries. To enhance their competitiveness, the buyers who, in turn, are importers andretailers are pushing their suppliers hard not only to offer the best prices, but alsopremium services in production management, design, delivery and the entire supplychain management. Increasingly, the United States and European Union importers andretailers are also requesting overseas suppliers to comply with their practices in ethicalsourcing as well as security measures.
Under the MFA and ATC, the existence of quotas made it necessary for buyersto source from different locations. They were compelled to source from locations wherequotas were available, instead of from locations with better competitiveness in textileand clothing production. The removal of quotas has enabled buyers to source fromlocations that offer the most competitive products and services, leading to a reduction ofsourcing locations. Under these circumstances, a typical importer, for example, mayreduce its number of sourcing locations from more than 30 to around 10 after quotaelimination (Nordås, 2004). This is expected to lower administrative costs, given thatsome 40 per cent of the time and effort was previously spent on allocations of orders toa large number of sources. Lead-time has also changed dramatically.
Without quota restrictions, price competition among suppliers will intensify. Onthe one hand, lower prices are now possible due to the elimination of quota premiums.On the other hand, competition will become more intense as newcomers from differentlocations, and not just companies holding quotas as in the past, make a great effort toactively explore the United States and European Union markets. The removal of quotas,in tandem with an increasing number of new players clamouring for market share, isexerting enormous downward pressure on the prices of textile and clothing products.
Under this operating environment, while low wages can still give developingcountries a competitive edge in world markets, quick turnaround times are now playing
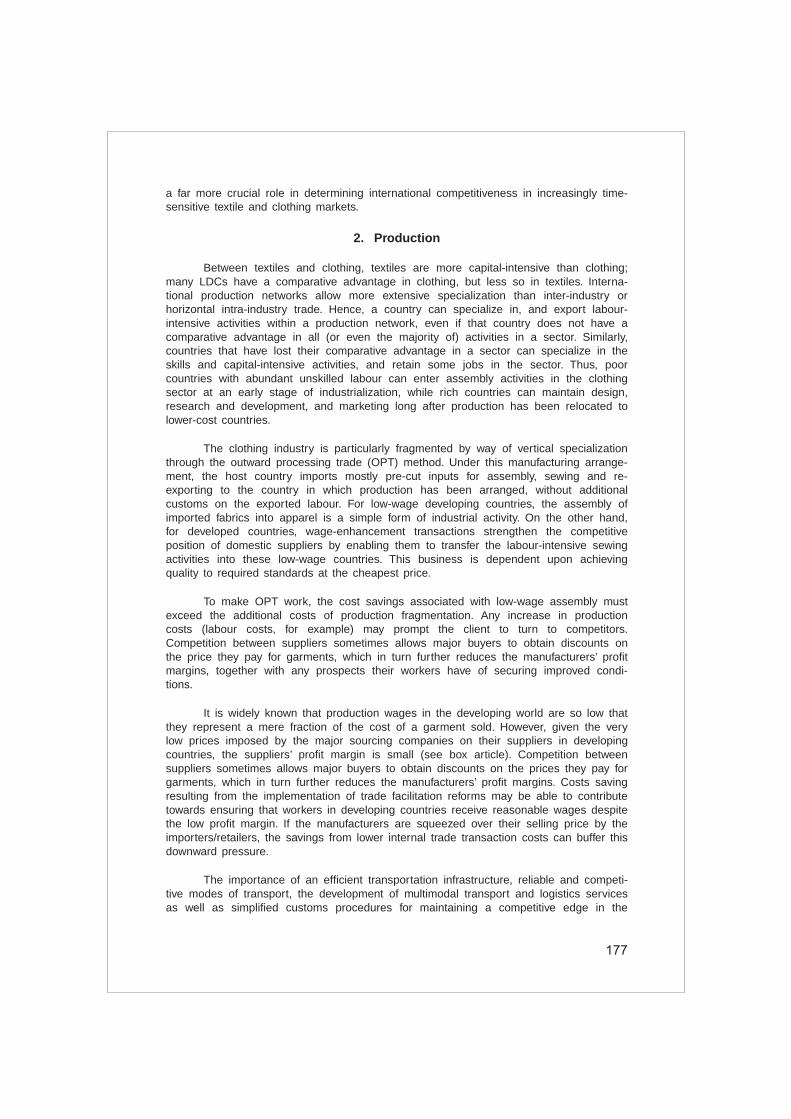
177
a far more crucial role in determining international competitiveness in increasingly time-sensitive textile and clothing markets.
2. Production
Between textiles and clothing, textiles are more capital-intensive than clothing;many LDCs have a comparative advantage in clothing, but less so in textiles. Interna-tional production networks allow more extensive specialization than inter-industry orhorizontal intra-industry trade. Hence, a country can specialize in, and export labour-intensive activities within a production network, even if that country does not have acomparative advantage in all (or even the majority of) activities in a sector. Similarly,countries that have lost their comparative advantage in a sector can specialize in theskills and capital-intensive activities, and retain some jobs in the sector. Thus, poorcountries with abundant unskilled labour can enter assembly activities in the clothingsector at an early stage of industrialization, while rich countries can maintain design,research and development, and marketing long after production has been relocated tolower-cost countries.
The clothing industry is particularly fragmented by way of vertical specializationthrough the outward processing trade (OPT) method. Under this manufacturing arrange-ment, the host country imports mostly pre-cut inputs for assembly, sewing and re-exporting to the country in which production has been arranged, without additionalcustoms on the exported labour. For low-wage developing countries, the assembly ofimported fabrics into apparel is a simple form of industrial activity. On the other hand,for developed countries, wage-enhancement transactions strengthen the competitiveposition of domestic suppliers by enabling them to transfer the labour-intensive sewingactivities into these low-wage countries. This business is dependent upon achievingquality to required standards at the cheapest price.
To make OPT work, the cost savings associated with low-wage assembly mustexceed the additional costs of production fragmentation. Any increase in productioncosts (labour costs, for example) may prompt the client to turn to competitors.Competition between suppliers sometimes allows major buyers to obtain discounts onthe price they pay for garments, which in turn further reduces the manufacturers’ profitmargins, together with any prospects their workers have of securing improved condi-tions.
It is widely known that production wages in the developing world are so low thatthey represent a mere fraction of the cost of a garment sold. However, given the verylow prices imposed by the major sourcing companies on their suppliers in developingcountries, the suppliers’ profit margin is small (see box article). Competition betweensuppliers sometimes allows major buyers to obtain discounts on the prices they pay forgarments, which in turn further reduces the manufacturers’ profit margins. Costs savingresulting from the implementation of trade facilitation reforms may be able to contributetowards ensuring that workers in developing countries receive reasonable wages despitethe low profit margin. If the manufacturers are squeezed over their selling price by theimporters/retailers, the savings from lower internal trade transaction costs can buffer thisdownward pressure.
The importance of an efficient transportation infrastructure, reliable and competi-tive modes of transport, the development of multimodal transport and logistics servicesas well as simplified customs procedures for maintaining a competitive edge in the

178
highly competitive textile and clothing markets is high.5 Reliability of the transportationinfrastructure and efficiency in customs procedures complement each other in minimiz-ing transit periods for shipments involved in international trade and can make geographi-cally remote locations more internationally competitive.
Paramount to the development of the clothing industry is the ability to deliver theproducts into the markets against tightly controlled schedules. Many retail groups nowbook transport at the same time as placing their orders for production, to ensure thatthe products are collected and delivered against their preplanned intake of stock. Latedeliveries, however caused, are no longer acceptable in the highly competitive marketsof Western Europe (Centre for Research and Policy Making, 2005).
Time is therefore a key issue. Ever-shorter deadlines have become one of thebuyers’ central requirements, where just-in-time delivery and logistic services play acrucial role. For the suppliers, it means having to deliver smaller orders in shorter timeand according to very tight export deadlines. If they fail to do so, they incur fines andother penalties such as heavier freighting charges.
Profit margins
·
“Chinese textile companies reported an average profit margin of only 3.7 percent last year, much lower than the national average of 5.69 per cent for allindustrial enterprises, according to a National Development and Reform Commis-sion report.” – Xinhua News Agency, 9 February 2007.
·
“The Chinese textile industry is still at the processing stage in the globalindustry chain, which features the extensive growth mode and [a] low level ofexports in general. The average profit margin of Chinese textile exporters is only3 per cent to 5 per cent. Most exports are OEM or ODM products, while only 10per cent are products with our own brands.” – Minister Bo Xilai at the thirdGlobal Textile Business Forum, 16 June 2006.
·
“…. most exporters are operating at 2-3 per cent profit that used to be around15 per cent a few years back. … the exporters are not in a position to absorbthe shock if a foreign buyer defaults on goods sent on consignment basis.” –World Trade Review Pakistan, vol. 7, No. 6.
·
“The clothing and textile sector has seen its profit margin fall to 1.1 per cent, ahuge percentage cut from the five-year average of 2.8 per cent.” – Stephen S.Poloz, Senior Vice-President, Corporate Affairs and Chief Economist, ExportDevelopment Canada, 30 August 2006.
5 A study of the Bangladesh textile and clothing sector indicated that the era of the 90-daylead-time would soon be over. A serious effort must therefore be made to strengthen furtherbackward linkages for producing fabrics, particularly for providing inputs to the export-oriented,woven-RMG sector. Efficient infrastructure services and port facilities reduce administrativehassles and a conducive investment environment will be necessary to bring down the cost ofdoing business in Bangladesh.

179
The traditional system of ordering in bulk to meet consumer demands in thebasic four seasons has dramatically altered. Mid-term collections are becoming morenumerous. Buyers commit later and later, and split their large orders into several smallones that are delivered all throughout the season.
Pressure to speed up production time is continually increasing in the textile andfashion field. For example, according to a Puma source: “Lead-times are today impor-tant. Here we try to shorten lead-times in order to become competitive, especially inthat area where fashion brands are working with very short lead- times, [as] we have tocompete with them” (OXFAM, 2004).
3. What can trade facilitation reforms do?
International trade has grown rapidly in recent years and, with it, the relativeimportance of border procedures such as customs requirements, adding to the costsincurred by governments and businesses, and ultimately the customers. Indeed, in somecases, surveys have suggested that border-related costs, such as the expense ofsupplying the required customs documentation or the surcharges arising from proceduraldelays when importing goods, could total as much as 15 per cent of the value of thegoods being traded (OECD, 2003). By rule of thumb, the incidence is more pronouncedand expenses on border-related charges are higher in developing countries due toinefficiency and complicated bureaucratic procedures. Therefore, improved trade facilita-tion is even more critical for the survival of the textile and clothing industry of manyAsia-Pacific region countries in the post-ATC era.
Given the move towards vertical specialization and slicing up of the value chain,each day saved could provide enormous benefits in terms of enhancing the industry’scompetitiveness. This is more so in the case of time-sensitive clothing products, wherefashion changes rapidly and a delayed consignment could lead to cancellation of orders.
OECD (2004) cites a study by Verma (2002) estimates that Indian companiessuffer a 37 per cent cost disadvantage in shipping containers of clothing products fromMumbai/Chennai to the east coast of the United States, relative to similar containershipments originating from Shanghai. This cost disadvantage arises from delays andinefficiencies in Indian ports. The study also highlights the importance of efficient portinfrastructure, reliable and competitive modes of transportation, and efficient customsprocedures for maintaining an edge in the competitive, time-sensitive and fashion-oriented textile and clothing markets. Similarly, an Asian Development Bank (2006)technical assistance study in 2003 found that clothing producers in Bangladesh couldearn 30 per cent more if inefficiencies were removed at Chittagong port.
Trade facilitation also improves government revenue and promotes good gover-nance through transparency, reduction of corruption, better regulation, due process andpublic-private sector cooperation. A study by Engman (2005), which comprised 12country case studies to evaluate the impact of customs reform on government revenue,concluded that customs modernization programmes could have a marked positive effecton the collection of trade taxes, if effectively implemented. The study also mentionedthat several countries had more than doubled their customs revenue after the introduc-tion of comprehensive reform programmes, and that country experiences also indicatedthat even relatively modest modernization programmes had brought quantifiable in-creases in customs revenue. This finding proved that rationalized and efficient customsprocedures boost customs duty collection. Since the majority of developing countriesdepend substantially on customs duties for financing public expenditure, improved tradefacilitation would enhance their ability to augment their revenue.

180
Another compelling reason for developing countries to adopt trade facilitationmeasures is that because inefficient procedures represent a “fixed overhead”, theburden is likely to fall disproportionately heavily on small and medium-sized enterprises(SMEs) of those countries. SMEs are often unable to employ dedicated personnel incharge of logistics because of resource constraints. Since most of the textiles andclothing industry in the Asia-Pacific developing countries are SMEs, they will suffer themost if inadequate attention is given to trade facilitation measures.
IV. What can be done?
1. Global level
Improvements in the effectiveness of infrastructural services such as ports andcustoms and in infrastructure (both transport and ICT) in general are decisive for exportperformance, both within the assembly system and for upgrading to full-packageservices. The WTO Doha Round provides an opportunity to implement such reforms inan international context through the negotiations on trade facilitation where technicalassistance is part of the deal. However, large-scale investments in infrastructure areoften not affordable, at least not in the short term, for many developing countries. Onthe other hand, reforms that improve port efficiency and reduce the time for customsclearance should be possible in the short to medium term, and could have a significantimpact on export performance, employment and wages. In addition, trade policy mea-sures such as reducing or eliminating tariffs on imported intermediate inputs andmachinery, would improve export performance. Finally, easing constraints, if any, onforeign direct investment in the textiles and clothing sector and crucial logistics servicescould help developing countries become better integrated into global or regionalproduction networks.
2. National and regional levels
Because trade facilitation has many stakeholders that cut across both the publicand private sectors, trade facilitation reforms need strong and influential champions topush the agenda forward on a sustained basis. The private sector, through tradeassociations or chambers of commerce, can first propose that their governments take acloser look at the need for trade facilitation reforms within the country. The overallobjective is to reduce the transaction costs at the national level in a more concertedand coordinated manner.
Bearing in mind that there is no such thing as “an island of competitiveness” atthe subregional level where RTAs exist, trade facilitation must be accompanied bysimilar regional level initiatives. It is imperative that national level reform, at the sametime, ensures that national trade documentation and procedures are standardized andharmonized within the subregion. This process will ensure that the subregion as a groupis equally efficient. This will encourage investment and the establishment of moreproduction networks within a subregion. This could overcome the lack of forward andbackward linkages in the textile and clothing sectors in individual developing country.The linkages could then be augmented at the subregional level if the right investmentclimate could be established.
To achieve the above sets of objectives, a step-by-step approach to national andregional trade and transport facilitation is required. It would be prudent to first assessthe existing trade facilitation environment, including the problematic areas and bottle-

181
necks, at the national level. Furthermore, it is necessary to identify the needs andrequirements of individual member countries in trade facilitation, including the capacity-building priorities. This will allow a more targeted reform programme for addressing orrectify gaps. There should also be development of an agreed set of trade facilitationindicators or a trade facilitation index that can be used as benchmarks against whichthe relative position of each member country can be measured. Developing such anindex could help in prioritizing elements of national policy and procedures that have animpact on a country’s “facilitation profile.” Such an index could also help focus publicattention on areas where progress has been made or where work remains to be done.
The implementation of trade facilitation reforms should result in, among others:
(a) Development and adoption of individual national and regional action planson trade and transport facilitation reforms;
(b) Implementation of trade facilitation measures aimed at simplifying, stan-dardizing and harmonizing trade documents and procedures;
(c) The introduction of transparent and consistent rules and procedures;
(d) Establishment of new, or the strengthening of existing national trade andtransport facilitation committees;
(e) Creation of a regional platform on trade and transport facilitation;
(f) Enhancement of public-private partnerships for trade and transport facilita-tion at the national and regional levels; and
(g) Ensuring interoperability of national Single Window facilities.
To successfully implement any trade facilitation reform or programme, thefollowing prerequisites are essential:
(a) Political will. This is crucial to providing the required push for the reform.The different and sometimes contradicting aims of ministries as well as therelative absence of domestic push on reform can effectively derail a tradefacilitation programme;
(b) National strategy. Governments must have a national strategy in whichtrade facilitation plays an important role in enhancing the competitivenessof traders, especially SMEs;
(c) Effective monitoring. Without effective monitoring, trade facilitation is likelyto fail. Responding to users requirements and feedbacks, checking up onthe implementation of launched programmes and building on the trainingprovided are all elements of success in this regard;
(d) Human capacity-building. The need here is not extensive courses ortraining but in ensuring that trained personnel apply the knowledge ac-quired;
(e) Infrastructure. Among the most important pillars needed is extensive depen-dence on automation and computer use. Without automation, trade facilita-tion with its basic requirements is unlikely to bear fruitful results;

182
(f) A national transport facilitation body. Each country must commit to estab-lishing a National Trade and Transport Facilitation Committee, which will bethe main driver of trade facilitation at the national level. If one alreadyexists, efforts must be made to make sure it is effective and functioning.The membership of such a committee must be open to all stakeholders inboth the public and private sectors;
(g) Change management, The implementation of these trade facilitation reformsneeds a dedicated platform in-country as well as at the subregional level inASEAN, SAARC/SAFTA and ECO. Such a body or committee would beresponsible for the overall coordination and monitoring of the trade facilita-tion programme. The private sector representatives must be from thoserepresenting the manufacturers, logistic providers, port operators and SMEsetc.
V. Conclusion
Trade facilitation reforms is a generic tool to reduce trade transaction costs andincrease competitveness that can lead to enhancing the overall investment climate of anation. Within the context of textiles and clothing, it can help promote backward andforward linkages for increased investment in the textiles and clothing industry, and moreimportantly it can assist the industry in terms of meeting shorter leadtime. A reductionin the transaction costs, irrespective of the size of the company, is especially critical tothe survival of this industry, which is charaterized by thin profit margins.
The ESCAP mission in the area of trade facilitation is to support activitiesdedicated to improving the abilities of traders and the administration by its membercountries of exchanges of goods and services effectively and safely. The main emphasisneeds to be placed on promoting the simplification, harmonization, standardization ofprocedures and related documentary requirements in international trade, thus reducingthe transaction costs and time.
ESCAP has been assisting its member countries in developing national tradefacilitation plans of action based on the identification of the needs and priorities ofindividual countries; encouraging establishment of new or enhancing of existing nationalcoordination bodies for facilitating trade and transport; and increasing awareness andimplementation capacity of global and regional legal arrangements related to tradefacilitation. “ESCAP is intensively promoting the establishment of a regional forum fortrade facilitation – the Asia-Pacific Forum for Efficient Trade (AFET) and possible sub-regional forums to meet and discuss common problems”. In this regard, ESCAP adoptsan inclusive approach in trade facilitation by ensuring that all stakeholders are involved,i.e., the public sector (all relevant government agencies) and private sector (manufactur-ers and service providers).

183
, 2005, Flying Colours, Broken Threads, Asia-Pacific Trade and InvestmentInitiative, UNDP Regional Centre, Colombo (revised January 2006).
APEC, 2002, “APEC economies: Realizing the benefits of trade facilitation”, reportprepared for the APEC Ministerial Meeting, Los Cabos, Mexico.
, 1996, APEC Business Advisory Council Report.
Asian Development Bank, 2006, “Textile and clothing trade: Performance of Asiansuppliers”, in ADB Outlook; chap. 1, Manila.
Centre for Research and Policy Making, 2005, “World trends in clothing manufacturing”,Occasional Paper No. 9, Skopje.
Engman, Michael, 2005, “The Economic Impact of Trade Facilitation”, OECD TradePolicy Working Paper No. 21, October, Paris, OECD Trade Directorate.
Hummels, D., 2001, “Time as a trade barriers”, mimeograph available at http://www.mgmt.purdue.edu/faculty/hummelsd/research/time3b.pdf.
Kelegama, S. and B. Weeraratne, 2005, “Trade in textiles and apparel in South Asia”, inSouth Asian Yearbook of Trade and Development 2005, Centre for Trade andDevelopment, New Delhi.
Nordås, H. K. 2004, “The global textile and clothing industry, post the Agreement onTextiles and Clothing”, WTO discussion paper No. 5, Geneva.
OECD, 2003, “Trade facilitation: The benefits of simpler, more transparent borderprocedures”, Policy Brief, Paris.
, 2004, “Structural Adjustment in Textiles and Clothing in the Post-ATC TradingEnvironment”, TD/TC/WP(2004)23/FINAL.
OXFAM, 2004, “Play fair at the Olympics”, available at www.fairolympics.org.
UNCTAD, 1994, “Fact Sheet 5”, United Nations International Symposium on TradeEfficiency (17-21 October), Geneva.
Walkenhorst, P. and T. Yasui, 2003, “Quantitative assessment of the benefits of tradefacilitation”, OECD Trade Directorate, Paris. Available at www.oecd.org/trade.
World Bank, 2004, Global Economic Prospects, Washington D.C., available at http://ec.europa.eu/taxation_customs/resources/documents/trade_faci l i tat ion-interest_for_developing_countries.pdf.
REFERENCES

184

185
PART TWO
COUNTRY REPORTS ON COPING WITH RESTRICTIVEPOLICIES AND MAINTAINING COMPETITIVENESS
IN THE TEXTILE AND CLOTHING INDUSTRY

186

187
I. Bangladesh*
Introduction
Textiles play an important role in the economic life of Bangladesh. The sector, inaddition to meeting the demand of fabrics and apparel domestically, contributes signifi-cantly to the textiles and clothing (T&C) export trade. At present, more than 78 per centof the country’s export earnings come from T&C. The sector provides employment to aworkforce of 4.5 million and contributes 40 per cent value addition to the manufacturingsector. Textiles as a whole play the most significant role in the alleviation of poverty,provision of employment to rural women and economic empowerment of women. Thesector provides 200,000 jobs in the waste recycling industry related to ready-madegarments (RMG), contributes 10.5 per cent to GDP, provides indirect employment for an800,000-workforce in accessories industries related to T&C and generates a hugecliental base for banking, insurance, shipping, transport, hotel, cosmetics, toiletries andrelated economic activities.
Bangladesh entered the international T&C trade in the early part of the 1980s,when the Government opted for a market-oriented economy. Investments in the primarytextile sector (PTS), i.e., spinning, weaving and dyeing-printing-finishing (textile productprocessors), started at the same time as the expansion and entry of ready-madegarments (apparels and clothing) into international markets. When Bangladesh enteredthe global T&C markets, export earnings were insignificant. For example, during fiscalyear 1981/82 (July-June), the share of T&C in total export earnings was 1.1 per cent(comprising only woven garments). Over the years, that share increased to 78 per centof the total earnings, to reach US$ 8.1 billion during fiscal 2005/06.
Immediately after liberation in 1972, the Government opted for a socialisticeconomic policy by nationalizing all big industries. At that time, all large textile millswere nationalized. However, when the Government opted for a market-oriented economicpolicy, the textile mills were gradually handed over to the private sector in phases.
Ministry of Textiles records show that as of 2006 there were 23 textile millsunder Government ownership with 400,000 installed spindles and a total capacity of 40million kg of yarn production. However, most of the mills are non-functional and themachinery is obsolete. Although the performance of public sector mills has slowlydeclined, private sector mills have flourished under the supportive policy of successivegovernments. Table 1 provides an overview of the growth pattern of primary textile mills.
Since the T&C sector comprises spinning, weaving, dyeing-printing-finishing,handlooms and power looms, export-oriented ready-made garment units and otherancillary textile units table 2 provides a comprehensive idea about the size andcontribution of each sector in the national economy:
There are different types of mills in the overall T&C structure of Bangladesh.Table 3 shows the size and ownership of mills and the average number of employees(three shifts).
* Prepared by Mr Towfique G. K .M. Hassan, Secretary-General, Bangladesh Textile Manufac-turer Association.

188
Table 1. Growth pattern of primary textile mills in Bangladesh
Spindle Growth in spindleYear No. of mills capacity capacity compared
with previous year (%)
1983 21 511 084 –1992 49 992 938 –1994 76 1 423 366 43.341995 84 1 701 823 19.562000 116 2 289 280 34.512001 145 2 352 310 02.752002 163 3 390 026 44.112003 174 3 419 504 0.872004 197 3 931 624 4.902005 230 4 937 353 25.582006 260 5 500 000 11.39
Source: Bangladesh Textile Manufacturers Association.
Table 2. Structure of Bangladesh textiles and clothing sector, 2006
Subsector No. of Installed machine Production Manpowerunits capacity capacity
Textile spinning(Cotton yarn)(nationalized mills) 23 490,000 spindles 40 million kg 10 000Textile spinning:private sector 260 5.5 million spindles 1 000 million kg 390 000
Subtotal 283 5.99 million spindles 1 040 million kg 400 000Silk yarn – 2,888 reeling 0.060 million kg –
Weaving 356 22,000 SL/SLL 900 million metres 80 000(Large mill – grey fabrics)Private sectorSpl. textile and power loom(a) Public sector 1 40 looms 300 000 metres 150(b) Private sector 1 065 22 960 SL/SLL 300 million metres 42 750
Handlooms (GF/F) 148 342 498 000 handlooms 837 million metres 1 020 000Knitting, knit dyeing (GF):(a) Export-oriented 700 10 000 knit/dye/machines 1 650 million metres 300 000(b) Local market 2 000 5 000 knitting machines 450 million metres 24 100
Subtotal 2 700 15 000 knit/dye/machines 2,100 million metres 324 100
Dyeing and finishing (FF):(a) Semi-mechanized 178 – 107 million metres 10 000(b) Mechanized 115 – 850 million metres 23 000
Export-oriented RMG 4 000 – 200 million dozen 2 000 000
Others: – – – 600 000Textiles Trade Association, buyinghouses, sewing thread, localagents, luggage mfg etc.
Spd = Spindles looms RMG = Ready-madeRtr = Rotor kg = Kilograms garmentsSL = Shuttle looms Knit/M = Knitting FF = Finished fabricSLL = Shuttleless machine GF = Grey fabric
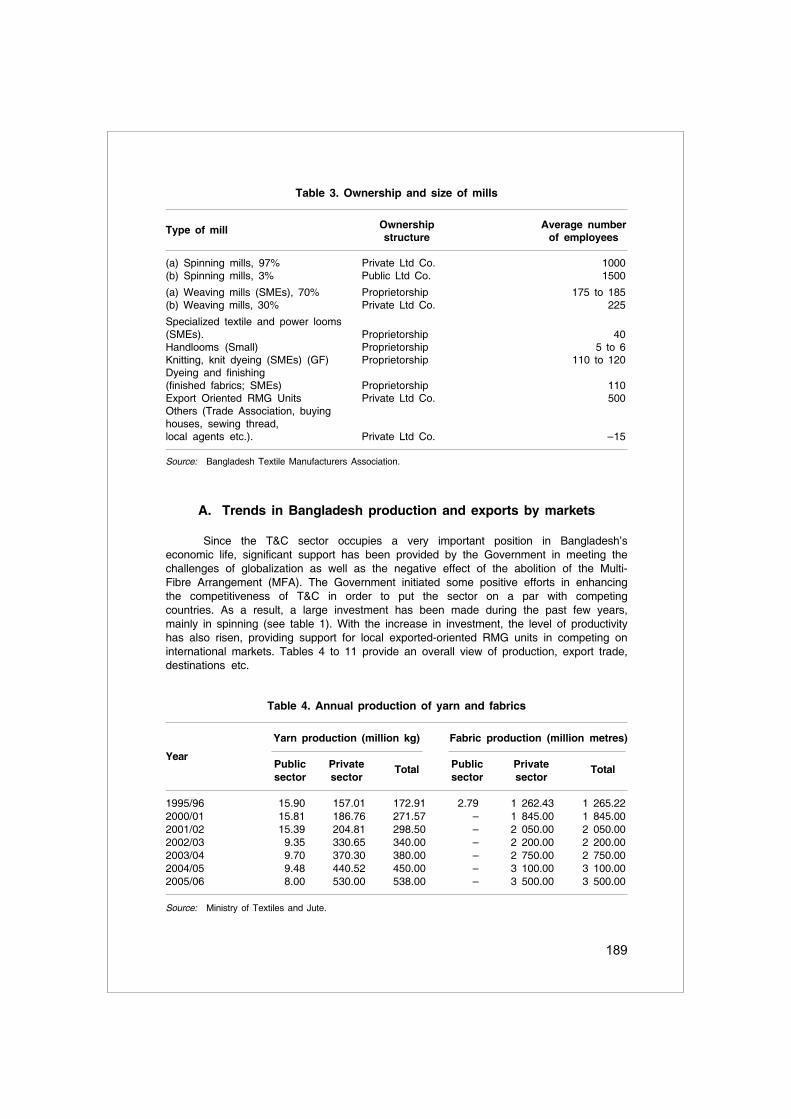
189
A. Trends in Bangladesh production and exports by markets
Since the T&C sector occupies a very important position in Bangladesh’seconomic life, significant support has been provided by the Government in meeting thechallenges of globalization as well as the negative effect of the abolition of the Multi-Fibre Arrangement (MFA). The Government initiated some positive efforts in enhancingthe competitiveness of T&C in order to put the sector on a par with competingcountries. As a result, a large investment has been made during the past few years,mainly in spinning (see table 1). With the increase in investment, the level of productivityhas also risen, providing support for local exported-oriented RMG units in competing oninternational markets. Tables 4 to 11 provide an overall view of production, export trade,destinations etc.
Table 3. Ownership and size of mills
Type of mill Ownership Average numberstructure of employees
(a) Spinning mills, 97% Private Ltd Co. 1000(b) Spinning mills, 3% Public Ltd Co. 1500
(a) Weaving mills (SMEs), 70% Proprietorship 175 to 185(b) Weaving mills, 30% Private Ltd Co. 225
Specialized textile and power looms(SMEs). Proprietorship 40Handlooms (Small) Proprietorship 5 to 6Knitting, knit dyeing (SMEs) (GF) Proprietorship 110 to 120Dyeing and finishing(finished fabrics; SMEs) Proprietorship 110Export Oriented RMG Units Private Ltd Co. 500Others (Trade Association, buyinghouses, sewing thread,local agents etc.). Private Ltd Co. –15
Source: Bangladesh Textile Manufacturers Association.
Table 4. Annual production of yarn and fabrics
Yarn production (million kg) Fabric production (million metres)
YearPublic Private Total Public Private Totalsector sector sector sector
1995/96 15.90 157.01 172.91 2.79 1 262.43 1 265.222000/01 15.81 186.76 271.57 – 1 845.00 1 845.002001/02 15.39 204.81 298.50 – 2 050.00 2 050.002002/03 9.35 330.65 340.00 – 2 200.00 2 200.002003/04 9.70 370.30 380.00 – 2 750.00 2 750.002004/05 9.48 440.52 450.00 – 3 100.00 3 100.002005/06 8.00 530.00 538.00 – 3 500.00 3 500.00
Source: Ministry of Textiles and Jute.

190
It is clear from table 4 that the performance of the public sector is graduallygoing down in terms of yarn production and total stoppage in fabric production.
An in-depth analysis of table 5 shows that during recent years exports ofknitwear items have almost overtaken woven garments. Although woven garments,knitwear, home textiles and textile fabrics all achieved persistent growth during the pastfive years, the growth rate in knitwear has been phenomenal compared with the othercategories. This growth pattern has been attributed to the expanding domestic availabilityof raw materials due to expansion of the spinning subsector as well as an activemarketing approach by entrepreneurs, supported by a favourable policy package.
Table 5. Exports of textile products(Unit: US$ million)
Year 2005/06 2004/05 2003/04 2002/03 2001/02Item
Knit woven 3 816.98 2 819.47 2 148.02 1 653.83 1 459.25Woven garment 4 083.82 3 598.20 3 538.07 3 258.27 3 124.56Home textile 165.25 156.14 135.49 71.38 75.58Textile fabrics 36.88 16.96 27.15 21.70 48.08
Source: Bangladesh export statistics, Bangladesh Export Promotion Bureau.
Table 6 shows that in woven garments, trousers rank first in terms of exportvalue. Although woven shirts are in second place, their growth rate is not worthmentioning when compared with the exports during the past five years. Jackets haveshown a fluctuating trend.
Table 6. Export trend of woven garments(Unit: US$ million)
Year 2005/06 2004/05 2003/04 2002/03 2001/02Item
Shirts 1 056.87 1 053.34 1 116.57 1 019.88 871.22Trousers 2 165.25 1 667.72 1 334.85 643.66 636.61Jackets 389.52 430.28 364.78 464.51 412.34Others 472.17 446.87 721.86 1 130.23 1 204.39
Source: Bangladesh export statistics, Bangladesh Export Promotion Bureau.
Table 7 indicates that knitwear items have achieved a continuous steady growth.In fact, items such as T-shirts, sweaters and other items have enjoyed constant growth.
Table 8 provides an analysis of knitwear exports in terms of destination/marketfor 2004/05 and 2003/04. Compared with figures for the United States, Canada andMexico markets, imports of knitwear items by the European Union have been very high

191
(79.18 per cent and 83.33 per cent, respectively, for 2004/05 and 2003/04). Incomparison, the United States, Canada and Mexico collectively absorbed a total of18.65 per cent and 14.57 per cent, respectively, in the same period. However, in bothregions there was a significant upward trend.
Table 9 shows exports of woven items by destination. The data reflect the exportfigures of 2004/05 and 2003/04. In this regard, the European Union ranks first but themarket share is much below that which has been achieved for knitwear (43.30 per centand 53.04 per cent, respectively, during 2004/05 and 2003/04). In comparison, theUnited States, Canada and Mexico occupied first place in 2004/05 with 50.57 per centand second position in 2003/04 with 44.84 per cent. However, in both regions there hasbeen overall growth.
Table 10 shows that exports of home textiles (a new item added to Bangladesh’stextile export basket) have been growing. Most of the products under this heading arefor the European Union market. The European Union market share was 83.12 per centand 77.50 per cent, respectively in 2004/05 and 2004/04. This is due to the presence ofEuropean Union multinationals such as IKEA having buying offices in Dhaka. TheAmerican region imported around 14.54 per cent and 18.88 per cent, respectively,during 2004/05 and 2003/04, respectively.
Table 7. Export trends for knitwear(Unit: US$ million)
Year 2005/06 2004/05 2003/04 2002/03 2001/02Item
T-shirts 1 781.15 1 349.71 1 062.11 642.62 546.28Sweaters 1 042.61 893.12 616.31 578.38 517.83Others 992.85 576.63 469.60 432.83 395.14
Source: Bangladesh export statistics, Bangladesh Export Promotion Bureau
Table 8. Knitwear exports by destination
Value Percentage of market share, Year (US$ million) by destination (%)Country/area 2004/05 2003/04 2004/05 2003/04
United States 401.061 236.543 14.22 11.01Canada 118.652 70.788 4.21 3.30European Union 2 232.459 1 789.995 79.18 83.33Mexico 6.109 5.499 0.22 0.26Others 61.191 45.197 2.17 2.10Total 2 819.472 2 148.022 100.00 100.00
Source: Bangladesh export statistics, Bangladesh Export Promotion Bureau.

192
Table 9. Woven garment exports by destination
Value Percentage of market share, Year (US$ million) by destination (%)Country/area 2004/05 2003/04 2004/05 2003/04
United States 1 622.902 1 391.637 45.10 39.34Canada 188.601 185.912 5.24 5.25European Union 1 704.855 1 878.243 47.39 53.09Mexico 8.316 8.986 0.23 0.25Others 73.531 73.288 2.04 2.07Total 3 598.205 3 538.066 100.00 100.00
Source: Bangladesh export statistics, Bangladesh Export Promotion Bureau.
Table 10. Home textiles export trends
Value Percentage of market share, Year (US$ million) by destination (%)Country/area 2004/05 2003/04 2004/05 2003/04
United States 12.923 13.761 8.28 10.16Canada 9.822 11.812 6.29 8.72European Union 129.789 105.023 83.12 77.50Others 3.604 4.899 2.31 3.62Total 156.138 135.495 100.00 100.00
Source: Bangladesh export statistics, Bangladesh Export Promotion Bureau.
Table 11 provides an interesting picture. The major buyers of textile fabrics arelocal exporters of ready-made garments. They buy the fabrics either to meet exportorders or to use as pocketing material. In that regard, local consumption amounted
Table 11. Textile fabric exports trends
Value Percentage of market share, Year (US$ million) by destination (%)Country/area 2004/05 2003/04 2004/05 2003/04
Domestic sales 7.099 6.622 41.83 24.39United States 3.526 13.485 20.78 49.67European Union 2.391 4.041 14.10 14.89Canada 0.126 0.650 0.74 2.39Mexico 0.110 0.800 0.65 2.95Others 3.718 1.549 21.90 5.71Total 16.961 27.147 100.00 100.00
Source: Bangladesh export statistics.

193
to 41.83 per cent and 29.39 per cent, respectively of the total market share oftextile fabrics during 2004/05 and 2003/04. On the other hand, the American regionaccounted for 22.17 per cent and 55.01 per cent, respectively, during 2004/05and 2003/04. The European Union market consumed 14.10 per cent and 14.89 percent of the fabric, respectively, during 2004/05 and 2003/04. In both the Americanand European Union region markets, the share declined in 2004/05 compared with2003/04.
B. General export trends for some new products
1. Denim trousers
Bangladesh emerged as the number one supplier of denim clothes to theEuropean market, commanding a 27 per cent share of import during the first half of2006. Exporters said that increasing availability of locally- produced denim fabrics andthe enhanced ability to offer the most competitive prices helped Bangladesh gain agreater market share. Restrictions in the European Union on certain types of apparelfrom some Asian countries have also benefited the Bangladesh denim sector to a greatextent.
In terms of earnings, however, Bangladesh ranked third because of the exporters’concentration on low-cost dresses. The latest compilation of European Union data showsthat, during January-June 2006, Bangladeshi apparel manufacturers shipped about 24million pairs of denim jeans in the men’s and boys category to European importers.Export volume during the same period increased by 26.15 per cent and stood at the topwith 26.76 per cent of total European imports of denims. On average, Bangladeshidenim exporters charged a 4.03 unit price for men’s and boys’ jeans, whereas theglobal average was 7.38 per unit.
In the women’s and girls’ denim category, Bangladeshi exporters saw the volumeincrease by more than 91 per cent to about 17 million pairs during January-June 2006.Bangladesh also topped the list in this category with 18.59 per cent of the EuropeanUnion market share, which was more than double the share for the previous year.However, Bangladesh lagged behind in terms of earnings from women’s and girls’ denimclothes. Local capacity for producing denim fabrics has expanded significantly in recentyears, which has helped apparel manufacturers to cater to the demand from Europeanbuyers.
2. Diversity in sweater exports
The country’s sweater exporters have recently earned an encouraging responsefrom buyers in the European Union by exporting high-value woolen products made ofcashmere, the very fine, soft fabric made from the hair of Kashmiri goats.
Bangladesh’s exporters have doubled their European Union market share inrecent years. The export growth in high-value cashmere items indicates a very encour-aging diversity in the sweater subsector. Exports of cashmere items from Bangladeshgrew by 108 per cent during January-August 2006. Bangladesh has emerged as thethird-largest cashmere sweater supplier to the European Union. Currently, the marketshare of Bangladesh-made cashmere sweaters is 12.2 per cent while China and HongKong, China, jointly hold 39 per cent, followed by Madagascar at 17 per cent.

194
Bangladeshi manufacturers mainly depend on wool of Mongolian origin. Sincecashmere sweaters are made of expensive raw materials and need sophistication inthe production process, production is a risk that exporters are afraid to take. Ifentrepreneurs want to capitalize on the demand for this product, policy support will beneeded.
The emerging trend in the global sweater market is apparel made of wool andnatural fibres. If the industry can exploit the market and gain high-value business, it mayemerge as the ultimate winner.
3. Demand-supply gap in textile products and investment opportunitiesin the primary textile sector
With the continuous development and penetration in the textile market as well asdiversification in products, there has been a significant demand for fabrics and yarnduring the past five years. However, domestic fabric manufacturing mills cannot copewith the demand. As such, a vast scope exists for investment in fabric production(tables 12 to 15).
Table 12. Total demand-production gap between fabrics for domesticand export-oriented RMG Units
(Unit: Million metres)
Financial Demand for fabrics Total Domestic Demand-year production production gap
Domestic Export-orientedRMG
2000/01 1 595 2 246 3 841 1 800 2 0412001/02 1 618 2 568 4 186 2 050 2 1362002/03 1 754 2 779 4 533 2 280 2 2532003/04 1 865 3 323 5 188 2 750 2 4382004/05 1 960 3 880 5 840 3 200 2 640
Source: Ministry of Textiles and Jute.

195
Table 13. Projected demand for fabrics for domesticand export-oriented RMG units, 2004/05 to 2008/09
(Unit: Million metres)
Growth Projected demand for fabrics rateYear Domestic Exports through RMG Grand
market total(growth rate Knitwearb Woven Total
4.75%)a (growthrate 3%)c
2004/05 1 960 2 140 1 740 3 880 5 840(Base year)
Projected2005/06 2 050 2 675 1 790 4 465 6 5152006/07 2 150 3 210 1 845 5 055 7 2052007/08 2 252 3 720 1 900 5 620 7 8722008/09 2 360 4 200 1 960 6 160 8 520
Source: Ministry of Textiles and Jute, Production Planning Report.
Notes:a Projected demand for fabrics for domestic consumption assumed to increase at 4.75 per cent per annum
up to 2009/10.b Projected knitwear exports assumed to increase at a declining rate from 2004/05 to 2009/10 at 25 per
cent, 20 per cent, 16 per cent and 13 per cent, respectively, per year.c Projected woven garments exports assumed to increase at an average rate of 3 per cent per year from
2004/05 to 2008/09.
Table 14. Yarn demand-production gap
Base year, 2003/04 Projection for 2008/09Description
Domestic Export Total Domestic Export Total
(i) Domestic production/ 1 013 1 737 2 750 1 764 3 013 4 777production plan for (54%) (52%) (53%) (75%) (70%) (72%)fabrics in millionmetres (as apercentage of totaldemand)
(ii) Yarn requirement 168 290 458 290 500 790 (million kg).(iii) Actual production/ – – 380 – – 687
production plan (82%) (87%)(iv) (-) Production with – – 380 – – 380
existing facilities(million kg)
(v) Balance of yarn – – – – – 307to be produced bycreation of newcapacity (iii-iv)(million kg)
Source: Ministry of Textiles and Jute.

196
Table 15. Estimated Investment Requirements in Primary Textile Sector by 2008/09(Unit: US$ million)
Type of Volume of No. of Estimated Totaltextile industry yarn and fabrics units cost per estimated
to be produced unit cost
Spinning unit (25 000) 300 million kg 65 11.50 747.50spindles/unit with4.6 million kg capacityeach)
Weaving (120 shuttleless 1 010 million metres 77 7.25 558.25looms/unit with 13 millionmetres capacity each)
Knitting and knit processing 1 010 million metres 97 2.90 281.30(1 725 metric tons per year) (168 000 metric tons)Woven fabric processing 1 010 million metres 50 8.70 435.00(20 million metres each,annual capacity per year)Total 2 022.05
C. Major policy options initiated in line with the changedmultilateral regime under WTO
Following the establishment of WTO and the implementation of the UruguayRound agreement, the following measures have been taken in response to tradeliberalization policy, with regard to the T&C subsector of Bangladesh:
(a) In line with the ATC provisions, the Unilateral Quantitative Restrictions onimports of textile products were withdrawn by notifications issued in 1995,1998 and 2002.
(b) The customs duty on imports of textile fibres, yarn and fabrics in 2001were at five levels – zero per cent, 5 per cent, 15 per cent, 25 per centand 37.5 per cent. This has been reduced to four levels – zero per cent, 5per cent, 12 per cent and 25 per cent.
(c) The South Asian Free Trade Area (SAFTA) came into force on 1 January2006. The Tariff Liberation Programme (TLP) commenced on 1 July 2006with a road map for tariff reduction in a phased manner such as by non-LDCs to LDCs (December 2008), non-LDCs to non-LDCs (December 2014)and LDCs to all contracting States (December 2015).
(d) Import duty on textile machinery, most spares and accessories, dyes andchemicals, and raw cotton have been reduced to zero.
(e) Child labour in the T&C industry has been eradicated.
(f) Various compliance issues are gradually being addressed by manufacturersand exporters of T&C products.
(g) Social accountability and labour safeguard measures are gradually beingdeveloped.

197
(h) Sanitary and phytosanitary measures are being developed.
Further, Bangladesh generally follows internationally recognized labelling. In thisregard, the Product Labelling Policy, 2006 was adopted by the Government ofBangladesh. Recognized ISO standards are being developed and implemented. Toensure marketing of quality products of standard specification, the registration and priorapproval of labels for certain products of T&C have been made compulsory.
Imports of T&C products are open, but it requires registration from ChiefController of Import and Export in order to keep track of the importers as well asvolume of imports of different products. To be granted import registration the followingmajor documents are required:
(a) A trade licence;
(b) Membership Certificate from a Chamber of Commerce or related tradeassociation;
(c) Tax identification number;
(d) Bank Solvency Certificate.
In addition, conformity with standard or technical regulation on T&C throughlaboratory tests by a conformity assessment body has been made essential forinternational trade.
Bangladesh is trying to develop an internationally acceptable testing laboratoryfor T&C products. The European Union and UNIDO are providing technical assistance indeveloping and setting up such a laboratory. In this regard, the Government has alreadyestablished the Bangladesh Accreditation Board and has been trying to upgrade thelevel of international standards being followed and to become a signatory of Interna-tional Laboratory Accreditation Cooperation.
D. Policy support to meet post-MFA challenges
With the phasing out of MFA, trade in T&C is facing serious challenges fromnewly industrialized countries. Different competing countries are providing policy supportas well as financial support in order to increase the competitiveness of their T&Cindustries. To compete on an equal footing, the Government of Bangladesh has initiatedprogrammes for not only developing and expanding the sector overall, but also toincrease competitiveness so that Bangladeshi entrepreneurs and exporters will be ableto compete with developing countries as well as with countries of Southeast Asia.
Considering the importance of the primary textile sector in the national economy,in July 2005 the Government formed a high-level inter-ministerial taskforce, headed by aformer Minister for Textiles and Jute, to assess and evaluate the present status andmake recommendations for the development and expansion of PTS.
Following meetings with all stakeholders, the taskforce report made 12 recom-mendations for implementation. The report was approved by the former Government.The recommendations, which form the core policy guideline for overall development ofthe T&C sector for the next 10 years, are that:

198
(a) The debt-equity ratio should be fixed at 70:30 or any other favourable rate;
(b) The weaving and dyeing-finishing subsector should be given an extra boostand priority while considering bank loans for investments;
(c) The difference between export proceeds conversion be restricted within themaximum range of 50 paisa between the Bangladesh taka and the UnitedStates dollar;
(d) Provision be made for bank loans at a lower rate of interest. The intereston investments in the textile sector should be fixed at 9 per cent, both bynationalized and private sector banks. At present, nationalized banks arelending at 9 per cent while private sector banks charge 14 per cent;
(e) In considering textiles as a “thrust sector”, all imported spares and allimported dyes, chemicals and sizing materials used in the textile sector bemade duty-free and tax-free;
(f) The rate of cash assistance in lieu of duty drawbacks and bond facilitiesbe increased to 10 per cent;
(g) In order to meet the scarcity of technical personnel in the textile sector,more technical and vocational technical institutes be set up, and the statusof the Bangladesh College of Textile Technology be upgraded to TextileUniversity. In addition, Textile Faculties should be established at all techni-cal universities, and all technical schools, colleges and vocational institutesshould include textiles as a subject in their curricula;
(h) A High-tech Park, Garment Villages, API and EPZ with necessaryinfrastructural facilities for setting up textile industries should be establishedon a priority basis;
(i) The tax holiday scheme be continued;
(j) In order to protect the environment, the establishment of effluent treatmentplants should be encouraged by providing machinery and other equipmentas well as spare parts on a duty-free basis;
(k) A committee be set up with representatives from the Ministry of LocalGovernment, Ministry of Industry, Ministry of Textiles and Jute, Ministry ofCommerce, the Board of Investment, various local authority bodies and theBangladesh Textile Manufacturers Association for clustering industrial re-gions;
(l) In considering the textile sector as a “thrust sector”, the electricity, gas,cost, freight and insurance sectors be left out of the VAT net.
Once the recommendations have been implemented (in phases, if necessary, thetextile industry will be able to become sustainable, develop, expand and play its role inthe economic development of Bangladesh.

199
II. China*
Introduction
On 1 January 2005, the elimination of textile quotas opened a new era for theglobal textile trade. Before and immediately after the elimination, the textile trade inChina was unstable, with many restrictive cases against Chinese products. The Govern-ment of China and the textile industry have made every effort to establish a healthyglobal environment for the development of the country’s textile industry. The situation in2006 was satisfactory.
A. Chinese textile industry in 2006
The textile industry in China is developing rapidly. In some areas, the industry isforming so-called textile cities that occupy more than 500,000 m2.
The year 2006 was a good beginning for China’s eleventh Five-Year Plan, whichwitnessed a 10.7 per cent growth in GDP while national retail sales growth amounted to13.7 per cent. The textile industry also experienced stable development.
1. Production
In 2006, the production of the main T&C categories grew steadily (see table).
Production of main T&C categories in 2006
Item Unit Production in 2006 Growth rate (%)
Yarn 1 000 tons 17 222.4 19.86Fabric 1 000 m2 43 787 000 14.84Apparel 1 000 pieces 17 001 910 11.86Synthetic fibres 1 000 tons 20 255 12.94
Source: National Statistics Bureau.
* Prepared by Mr. Hongwei Ma, Deputy Division Director, Department of Foreign Trade, Ministryof Commerce of China. The author gratefully acknowledges the assistance of Mr. ZhaoHeming, Manager of the China Textile Information Centre, in providing information and data onthe textile industry in China.
In 2006, the number of sizable textile and clothing enterprises totalled to 39,400,with a growth rate of 9.57 per cent. Sizable enterprises refer to those with annual salesup to Y 5 million.
Textile and clothing products play very import role in increasing employment. In2006, employment in sizable enterprises in China grew by 3.95 per cent. The net valueof their fixed assets increased by 12.53 per cent. Sales of sizable enterprises amounted
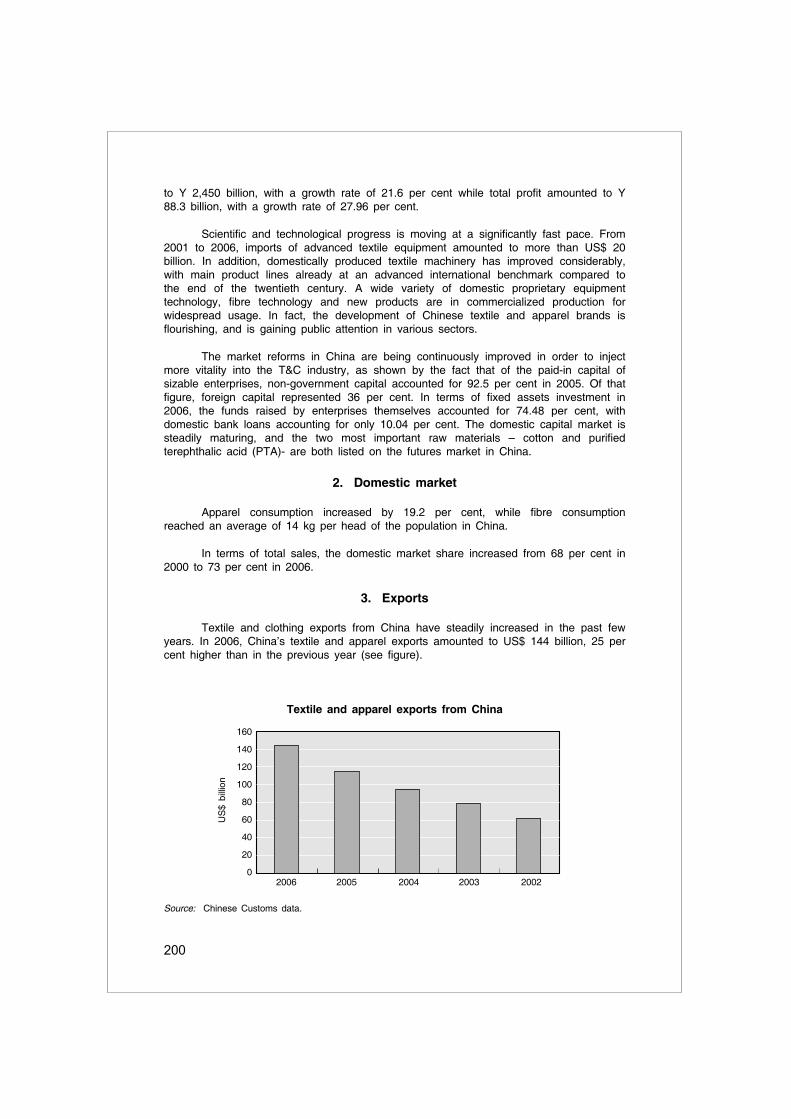
200
to Y 2,450 billion, with a growth rate of 21.6 per cent while total profit amounted to Y88.3 billion, with a growth rate of 27.96 per cent.
Scientific and technological progress is moving at a significantly fast pace. From2001 to 2006, imports of advanced textile equipment amounted to more than US$ 20billion. In addition, domestically produced textile machinery has improved considerably,with main product lines already at an advanced international benchmark compared tothe end of the twentieth century. A wide variety of domestic proprietary equipmenttechnology, fibre technology and new products are in commercialized production forwidespread usage. In fact, the development of Chinese textile and apparel brands isflourishing, and is gaining public attention in various sectors.
The market reforms in China are being continuously improved in order to injectmore vitality into the T&C industry, as shown by the fact that of the paid-in capital ofsizable enterprises, non-government capital accounted for 92.5 per cent in 2005. Of thatfigure, foreign capital represented 36 per cent. In terms of fixed assets investment in2006, the funds raised by enterprises themselves accounted for 74.48 per cent, withdomestic bank loans accounting for only 10.04 per cent. The domestic capital market issteadily maturing, and the two most important raw materials – cotton and purifiedterephthalic acid (PTA)- are both listed on the futures market in China.
2. Domestic market
Apparel consumption increased by 19.2 per cent, while fibre consumptionreached an average of 14 kg per head of the population in China.
In terms of total sales, the domestic market share increased from 68 per cent in2000 to 73 per cent in 2006.
3. Exports
Textile and clothing exports from China have steadily increased in the past fewyears. In 2006, China’s textile and apparel exports amounted to US$ 144 billion, 25 percent higher than in the previous year (see figure).
Textile and apparel exports from China
160
140
120
100
80
60
40
20
0
US
$ bi
llion
2006 2005 2004 2003 2002
Source: Chinese Customs data.
201
In 2006, the value of clothing exports amounted to US$ 95 billion, representing agrowth rate of 28.9 per cent and accounting for 66 per cent of total T&C exports. Yarnand fabric exports totalled US$ 49 billion, representing a growth rate of 17.7 per centand accounting for 34 per cent of total T&C exports.
According to statistical data based on comparable prices, T&C exports in 2006grew by 14 per cent. The comprehensive unit price of T&C exports rose by 10.14 percent.
In 2006, Chinese T&C exports to the European Union and the United Statestotalled US$ 22.3 billion and US$ 21.9 billion, respectively. The growth rates were 21.1per cent and 16.7 per cent, respectively.
4. International cooperation
With accession to WTO, the expanded international cooperation provides theChinese textile industry with a favourable external environment for its development. Oneindication of this positive change is the FDI inflow into the industry, which amounted toUS$ 53.3 billion between 2001 and 2005.
Of total export value in 2006, exports by foreign companies and by companieswith investment from Hong Kong, China, Macao, China, and Taiwan Province of Chinaaccounted for a one-third share.
At the same time imports of cotton, monomers (raw material) for man-madefibre, textile machinery, textile chemicals and dyestuffs increased by 413 per cent, 179per cent, 98 per cent and 160 per cent, respectively. Total import value increased toUS$ 32 billion.
China has stayed loyal to its commitment to WTO on opening its market toforeign products. A large number of international brands have entered China, which hasalso facilitated the growth of domestically produced brands. In fact, the rapid develop-ment of Chinese brands has encouraged a change in the growth of the T&C industryand some Chinese brands have already found acceptance in international markets.
In addition, many world-renowned textile machinery companies have set upmanufacturing facilities in China.
B. Restrictive measures and domestic policies
The Chinese textile industry is one the domestic industries which have been fullymarket-oriented for quite long time. The Chinese Government has long insisted on theliberalization and commercialization of the textile industry, the gradual removal ofinterference and the promotion of self-regulation within the industry.
The Chinese market is open globally. After accession to WTO, China reducedimport duties. The duty on T&C imports has been reduced to 11.4 per cent, which iseven lower than that of some developed countries.
Prior to 1 July 2004, companies in China needed to acquire a permit from theGovernment in order to export. Not all applicant companies were granted an exportpermit and many manufacturers had to go through international trade companies inorder to meet their export orders.
202
The new foreign trade law, which came into effect on 1 July 2004, stipulates that alllegal entities,whether organizations or individuals, can engage in foreign trade afterregistering. The right to undertake international trade is open to all companies and persons.
On 1 January 2005, state trading in silk was discontinued, and export quotasand licensing for seven cocoon and silk products were abolished
China’s T&C exports were tightly restricted for many years under internationaltrade agreements. Under the ATC framework, exports of Chinese T&C products weresubject to quantity restrictions imposed by other countries (i.e., Canada, Turkey and theUnited States) and the European Union until 1 January 2005.
Upon China’s accession to WTO, the quota limit on Chinese T&C exports toCanada, Turkey, the United States and the European Union were gradually removed. On1 January 2005, the old quota system imposed on Chinese products was terminated.However, the restrictions did not end there. Other restrictive measures on Chineseproducts kept emerging.
In order to stabilize the textile trading environment in the transition period beforeand after quota elimination, and to develop together with other countries on the basis ofmutual benefit, China introduced the following self-regulation measures on T&C exports:
(a) On 1 January 2004, China started to reform its VAT rebate system forexports, including the reduction of VAT rebate rates for most T&C exportsfrom 17 per cent to 13 per cent;
(b) On 15 September 2006, China reduced the VAT rebate rate for textileproducts further from 13 per cent to 11 per cent;
(c) On 1 January 2005, China imposed export taxes on 148 T&C products.The taxes were Y 0.2 or Y 0.3 per piece, or Y 0.5 per kilogram;
(d) In May and July of 2005, export tax rates and the list of products subjectto such tax were modified several times. From 1 August 2005, export taxeswere levied on 51 textile and clothing products at rates of Y 0.2, Y 0.3, Y1, Y 3 or Y 4 per piece. However, this measure had been cancelled by theend of 2005;
(e) An automatic export licensing system was adopted for T&C exports on 1March 2005, in order to collect information of exports of some keyproducts. Under the system, Ministry of Commerce (MOFCOM) compiled a“First Batch of Products under Automatic Export Licensing Catalogue”.Exporters were able to obtain an export licence from MOFCOM or itsauthorized agencies automatically once they had export contracts. However,this requirement was terminated in July 2005 and replaced by othermeasures;
(f) A new exchange rate mechanism was established and the value of theyuan renminbi was allowed to float.
Under the China-European Union and China-United States Memoranda of Under-standing, which are now being implemented and which control some important catego-ries of Chinese T&C products, a new domestic administrative system has beenestablished:
203
(a) On 19 June 2005, following the signing of the above Memoranda, theGovernment of China issued “Interim Measures for the Administration ofTextile Exports (Trial Implementation)”. These measures were later replacedby a revised version of the Interim Measures, effective from 22 September2005, and modified again in September 2006;
(b) In the case of export products listed in the “First Batch of Products underAutomatic Export Licensing Catalogue”, part of the quotas will be assignedthrough a bidding system, while the remaining portion will be allocated tothe companies concerned. Bidding and allocation is based on eachexporter’s share in the total export value of the respective categories in theprevious year.
Currently, Chinese T&C products still face different types of restrictive measuresin some countries/regions. Brazil, South Africa, Turkey and the United States as well asthe European Union impose quantity restrictions on Chinese T&C products, while someanti-dumping and specific safeguard measures are in pipeline.
C. Development goals of the Chinese T&C industry
The development guidelines and main goal for the future of China’s textileindustry are to implement a science-led approach to bringing about an improvement inthe economic growth mode, and to build up an innovative, resource-saving, environmen-tally friendly industry. Greater efforts are to be made to increase the contribution byscience and technology as well as brands to the economic growth of the textile industryby:
(a) Introducing an overall brand strategy for boosting brand sophistication,sharpening the competitive edge of domestic brands in domestic andinternational markets, and strengthening exchanges and cooperation withinternational brands;
(b) Expanding and improving energy saving processes, reducing energy con-sumption and effluents, and increasing environmental protection in thetextile industry in order to meet the various restrictive targets stipulated inthe eleventh Five-Year Plan;
(c) Strengthening industrial self-discipline and regulation in order to build upthe industry in harmony with the environment. This includes introducing animproved service system for quality control, enhanced IPR protection and asystem of social responsibility (CSC9000T);
(d) To maintain the policy of collaboration with the aim of achieving a win-wineffect through broad bilateral and multilateral cooperation in the areas ofscience and technology, branding, trade and investment, exhibitions, train-ing, information etc. as part of a joint endeavour to sustain and strengthenthe new global textile economy.
204
III. Indonesia*
Introduction
In Indonesia, which is facing economic problems such as a higher unemploymentrate and poverty, the T&C industry plays a strategic role in absorbing a large number oflabourers and in amassing foreign exchange reserves. The industry’s contribution toGDP in 2006 reached 21 per cent from the manufacturing sector and 3 per cent of totalearnings.
For the past 10 years, in addition to absorbing more then 2 million workers, theT&C sector has contributed US$ 6.93 billion in foreign exchange annually, makingIndonesia one of the world’s major T&C exporting countries in the world, with a marketshare of 3.8 per cent.
For the past four years, Indonesian T&C exports have recorded an averagegrowth rate of 8.4 per cent. In 2006, it was estimated that the country’s total T&Cexports amounted to US$ 9.47 billion, an increase of 10 per cent compared with theprevious year. Trends in textile export growth are influenced by external factors such aschanging market structure in the United States and the European Union, the majormarkets for Indonesian T&C exports.
From mid-2005 and in 2006, the United States and the European Union imposedsafeguard quotas on several T&C products from China. Indonesia has made use of thisopportunity to increase its exports and has succeeded in becoming one of the majorsuppliers to the United States.
In the case of the European Union, Indonesian T&C exports had been decliningdue to the inability to compete with Chinese products. However, following the impositionof safeguard quotas against China in early 2006, Indonesia has been able increase T&Cexports to the European Union by 3 per cent. Market competition in the European Unionis tougher as Indonesia has to compete against that region’s neighbouring countries aswell as African countries that have introduced preference tariffs.
In addition to establishing and developing an integrated industrial structureupstream and downstream, Indonesia has been supported by abundant local humanresources in the middle management level. The Indonesian textile industry is varied, witha spun and hand- woven subsector that is labour- and capital-intensive, and asophisticated mill subsector. The major subsectors include:
(a) Man-made fibres;
(b) Integrated textiles mill;
(c) Cotton yarn;
(d) Small-scale industry;
(e) Handlooms.
* Prepared by Mr Usman Ade Sudradjat, Vice-Chairman, Indonesian Textile and Association (API).

205
In the case of the man-made fibre subsector, since the 1997 economic crisisdevelopment has stagnated. Indonesia has 26 polyester fibre and filament yarn produc-ers and two rayon-viscose fibre producers. About 30,000 people are directly dependenton this sector for their livelihood. This sector produces about 1.1 million tons of yarnand fibre annually.
The integrated textile mill subsector includes spinning, weaving and dying-finishing.
A. Situation of the Indonesian textile industry
1. Overview
The textile industry is one of a number of industries that have been given priorityin the mid-term national priority plan, as detailed in Government Regulation No. 7 in2005. There is a strong reason why this industry is being given development priority bythe Government: exports of textile products have been able to earn high levels offoreign exchange. Indonesia’s export potential in this sector has been developing year byyear. Table 1 shows the textile industry’s net export earnings and growth rates from1996 to 2005, compared with import expenditures.
Table 1. Net textile industry export earnings and growth rates compared withimport expenditures, 1996-2005
Year Exports Growth from Imports Surplus(US$ billion) previous year (US$ billion) (US$ billion)
1996 6.57 – 2.58 4.001997 7.44 13.24 2.24 5.201998 7.43 (–0.13) 2.04 5.401999 7.28 (–2.01) 1.73 5.552000 8.28 15.11 2.28 6.092001 7.68 (–8.35) 2.44 5.242002 6.89 (–10.28) 1.83 5.062003 7.03 2.03 1.67 5.362004 7.75 10.24 1.72 6.032005 8.59 10.83 1.60 6.99
In 2004, Indonesia ranked eleventh among the top 15 textile exporting countries.This clearly shows that Indonesia is an important player in this industry.
2. Labour
During 2002-2005, the Indonesian textile and textile product industry was able toemploy some 1.18 million workers annually (table 2). That figure did not including the smalland medium-sized enterprises and cottage industries, which account for a further 600,000workers. The T&C industry in Indonesia has been undergoing integrative development,from the raw material processing industry (fibres) and intermediate production (staple,filament, weaving, knitting) to finished products (garment and textile product).

206
3. Investment
Total investment and the number of companies in the T&C sector, especially in2005, was significant. Investment reached Rp 132.38 trillion and 2,656 work units. Theadditional investment came from abroad, increasing by 252 per cent from US$ 165.5million to US$ 418.1 million in 2004. Most of the investment came from India and theRepublic of Korea. India concentrated on the raw material processing subsector,whereas the Republic of Korea was involved in the finished product subsector. Mean-while, local investment remained stagnant at Rp 70 billion.
However, during the past few years, T&C industry growth has been slowingbecause of numerous internal and external factors (especially the emergence ofcompetitors such as Bangladesh, Sri Lanka and Viet Nam) and many free trade issues(the environment, social accountability etc.), which have influenced competitiveness. Themain internal factors are transshipments, illegal imports and ageing machinery.
In general, the T&C industry in Indonesia is still undergoing repairs anddevelopment. The increased export value in 2005 was actually the trigger for theindustry’s takeoff. However, the Government did not respond well to this opportunity. Theinvestment conditions, which actually were the main problem, led to stagnation in allareas of the country’s T&C industry (table 3).
Switzerland
Canada
Indonesia
Turkey
Japan
Korea, Republic of
Hong Kong, China
European Union (25)
0.00 10.00 20.00 30.00 40.00 50.00 60.00 70.00 80.00
USD Billion
Source: World Trade Organization, compiled by API.
Figure I. World’s 15 leading textile exporters, 2004
Table 2. Labour absorption by the textile industry
Category 2002 2003 2004 2005
Direct (large-scale industry) 1 182 212 1 182 871 1 184 079 1 176 183Direct (small-scale industry) 635 210 584 786 668 372 665 337Indirect 3 634 844 3 535 314 3 704 902 3 683 040Total 5 452 266 5 302 971 5 557 353 5 524 560
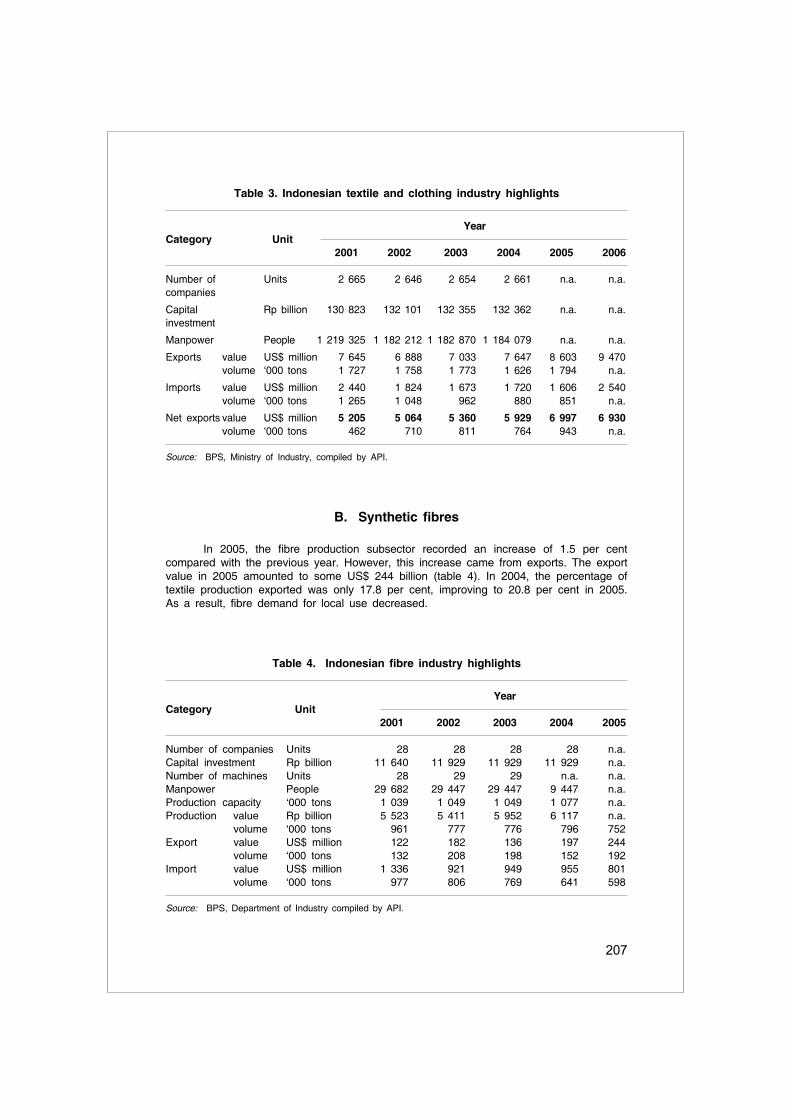
207
B. Synthetic fibres
In 2005, the fibre production subsector recorded an increase of 1.5 per centcompared with the previous year. However, this increase came from exports. The exportvalue in 2005 amounted to some US$ 244 billion (table 4). In 2004, the percentage oftextile production exported was only 17.8 per cent, improving to 20.8 per cent in 2005.As a result, fibre demand for local use decreased.
Table 3. Indonesian textile and clothing industry highlights
YearCategory Unit
2001 2002 2003 2004 2005 2006
Number of Units 2 665 2 646 2 654 2 661 n.a. n.a.companies
Capital Rp billion 130 823 132 101 132 355 132 362 n.a. n.a.investment
Manpower People 1 219 325 1 182 212 1 182 870 1 184 079 n.a. n.a.
Exports value US$ million 7 645 6 888 7 033 7 647 8 603 9 470volume ‘000 tons 1 727 1 758 1 773 1 626 1 794 n.a.
Imports value US$ million 2 440 1 824 1 673 1 720 1 606 2 540volume ‘000 tons 1 265 1 048 962 880 851 n.a.
Net exports value US$ million 5 205 5 064 5 360 5 929 6 997 6 930volume ‘000 tons 462 710 811 764 943 n.a.
Source: BPS, Ministry of Industry, compiled by API.
Table 4. Indonesian fibre industry highlights
YearCategory Unit
2001 2002 2003 2004 2005
Number of companies Units 28 28 28 28 n.a.Capital investment Rp billion 11 640 11 929 11 929 11 929 n.a.Number of machines Units 28 29 29 n.a. n.a.Manpower People 29 682 29 447 29 447 9 447 n.a.Production capacity ‘000 tons 1 039 1 049 1 049 1 077 n.a.Production value Rp billion 5 523 5 411 5 952 6 117 n.a.
volume ‘000 tons 961 777 776 796 752Export value US$ million 122 182 136 197 244
volume ‘000 tons 132 208 198 152 192Import value US$ million 1 336 921 949 955 801
volume ‘000 tons 977 806 769 641 598
Source: BPS, Department of Industry compiled by API.

208
1. Labour
The fibre subsector absorbed about 9,447 workers in 2004, about 0.8 per cent ofthe total workforce employed by the T&C industry. However, this number increases if thesynthetic fibre processing industry is taken into account. Some 27,000 workers areindirectly involved in synthetic fibre processing, most of whom are involved in the rawmaterials subsector and synthetic fibre marketing.
2. Competitiveness
In Indonesia, polyester and rayon fibre production is growing. Polyester filamentconsumption and exports from 1997 to 2003 is shown in table 5. However, because ofstrong competition and incapability of maintaining competitive prices, the synthetic fibresubsector is deteriorating in general. The obstacles faced by the synthetic fibresubsector include:
(a) A declining ability to maintain competitive prices and the lack of develop-ment in the areas of machinery and related technology;
(b) A low operating rate;
(c) Global overcapacity;
(d) Strong competition;
(e) The increasing price of crude oil (raw material) and electricity (energy).
Table 5. Polyester filament yarn
Year Consumption (tons) Exports (tons)
1997 457 672 72 1822000 270 246 302 5412003 256 136 194 039
3. Opportunities
Actually, the synthetic fibre industry in Indonesia has good potential, as prospec-tive export markets are quite promising. In Asia, Indonesian synthetic fibre products arepreferred. In addition to being a major producer in the region, especially of rayon, thequality of the Indonesian product has proved to be a strong competitor to other Asiancountries. This is underscored by the increasing export market for synthetic staple fibreby as much as 15.83 per cent, from US$ 1.1 billion in 2004 to US$ 1.2 million in 2005.
C. Integrated textile mills
One of the strengths of Indonesia’s T&C industry is that it is a completelyintegrated industry, from raw material processing until finishing (i.e., from the spinningindustry until dyeing, finishing and clothing production). This is a key factor in ensuringthat the Indonesian T&C industry is able to meet market demand and thus survive.
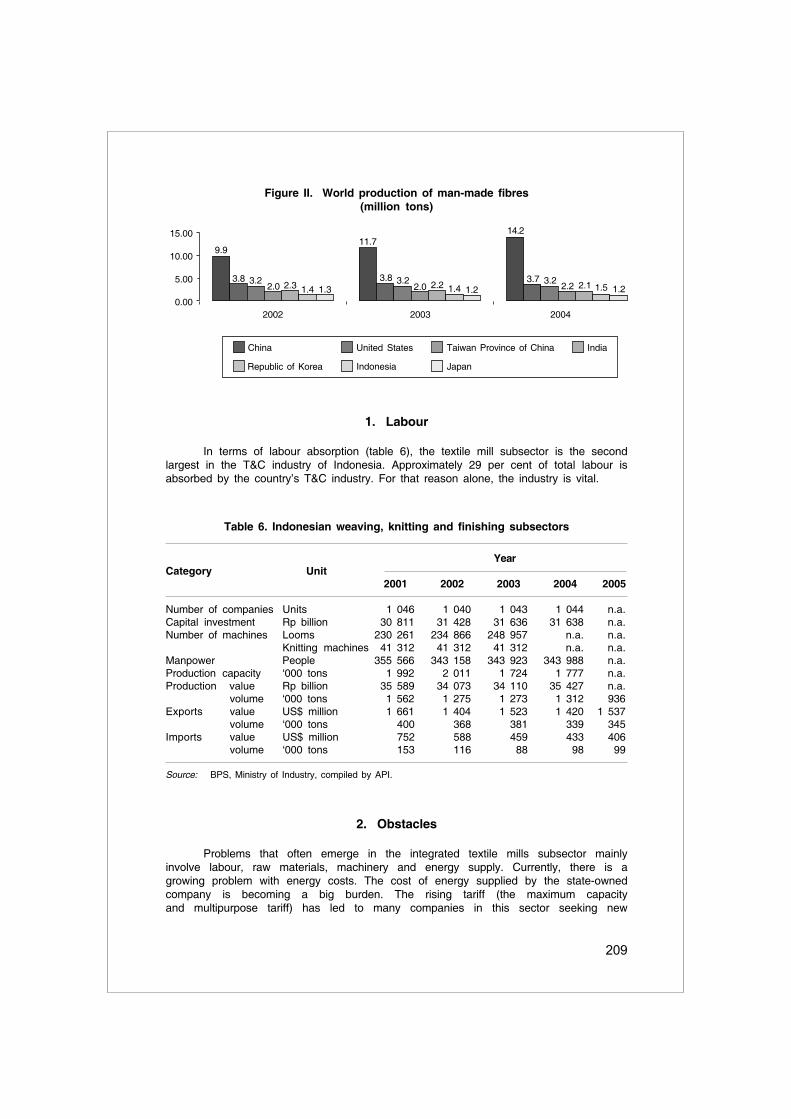
209
Figure II. World production of man-made fibres(million tons)
15.00
10.00
5.00
0.002002 2003 2004
9.9
3.8 3.22.0 2.3 1.4 1.3
11.7
3.8 3.22.0 2.2 1.4 1.2
14.2
3.7 3.22.2 2.1 1.5 1.2
China United States India
Republic of Korea
Taiwan Province of China
Indonesia
Table 6. Indonesian weaving, knitting and finishing subsectors
YearCategory Unit
2001 2002 2003 2004 2005
Number of companies Units 1 046 1 040 1 043 1 044 n.a.Capital investment Rp billion 30 811 31 428 31 636 31 638 n.a.Number of machines Looms 230 261 234 866 248 957 n.a. n.a.
Knitting machines 41 312 41 312 41 312 n.a. n.a.Manpower People 355 566 343 158 343 923 343 988 n.a.Production capacity ‘000 tons 1 992 2 011 1 724 1 777 n.a.Production value Rp billion 35 589 34 073 34 110 35 427 n.a.
volume ‘000 tons 1 562 1 275 1 273 1 312 936Exports value US$ million 1 661 1 404 1 523 1 420 1 537
volume ‘000 tons 400 368 381 339 345Imports value US$ million 752 588 459 433 406
volume ‘000 tons 153 116 88 98 99
Source: BPS, Ministry of Industry, compiled by API.
Japan
1. Labour
In terms of labour absorption (table 6), the textile mill subsector is the secondlargest in the T&C industry of Indonesia. Approximately 29 per cent of total labour isabsorbed by the country’s T&C industry. For that reason alone, the industry is vital.
2. Obstacles
Problems that often emerge in the integrated textile mills subsector mainlyinvolve labour, raw materials, machinery and energy supply. Currently, there is agrowing problem with energy costs. The cost of energy supplied by the state-ownedcompany is becoming a big burden. The rising tariff (the maximum capacityand multipurpose tariff) has led to many companies in this sector seeking new
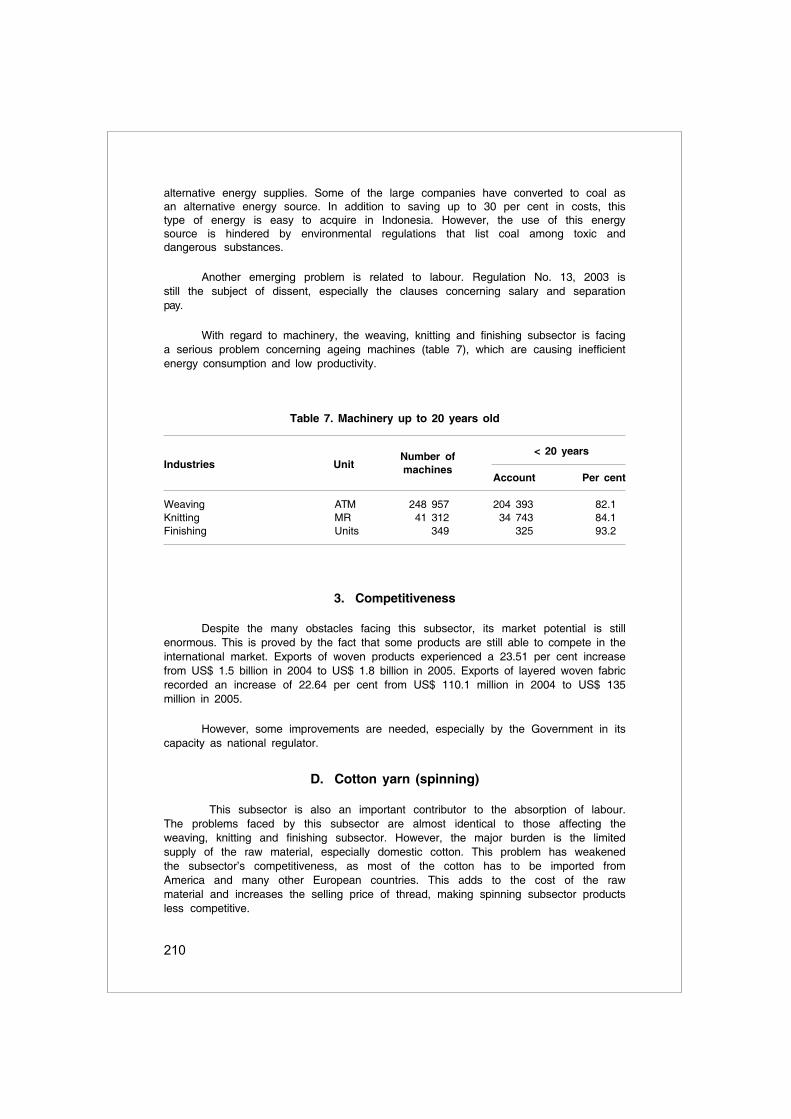
210
alternative energy supplies. Some of the large companies have converted to coal asan alternative energy source. In addition to saving up to 30 per cent in costs, thistype of energy is easy to acquire in Indonesia. However, the use of this energysource is hindered by environmental regulations that list coal among toxic anddangerous substances.
Another emerging problem is related to labour. Regulation No. 13, 2003 isstill the subject of dissent, especially the clauses concerning salary and separationpay.
With regard to machinery, the weaving, knitting and finishing subsector is facinga serious problem concerning ageing machines (table 7), which are causing inefficientenergy consumption and low productivity.
Table 7. Machinery up to 20 years old
Number of < 20 yearsIndustries Unit machines
Account Per cent
Weaving ATM 248 957 204 393 82.1Knitting MR 41 312 34 743 84.1Finishing Units 349 325 93.2
3. Competitiveness
Despite the many obstacles facing this subsector, its market potential is stillenormous. This is proved by the fact that some products are still able to compete in theinternational market. Exports of woven products experienced a 23.51 per cent increasefrom US$ 1.5 billion in 2004 to US$ 1.8 billion in 2005. Exports of layered woven fabricrecorded an increase of 22.64 per cent from US$ 110.1 million in 2004 to US$ 135million in 2005.
However, some improvements are needed, especially by the Government in itscapacity as national regulator.
D. Cotton yarn (spinning)
This subsector is also an important contributor to the absorption of labour.The problems faced by this subsector are almost identical to those affecting theweaving, knitting and finishing subsector. However, the major burden is the limitedsupply of the raw material, especially domestic cotton. This problem has weakenedthe subsector’s competitiveness, as most of the cotton has to be imported fromAmerica and many other European countries. This adds to the cost of the rawmaterial and increases the selling price of thread, making spinning subsector productsless competitive.
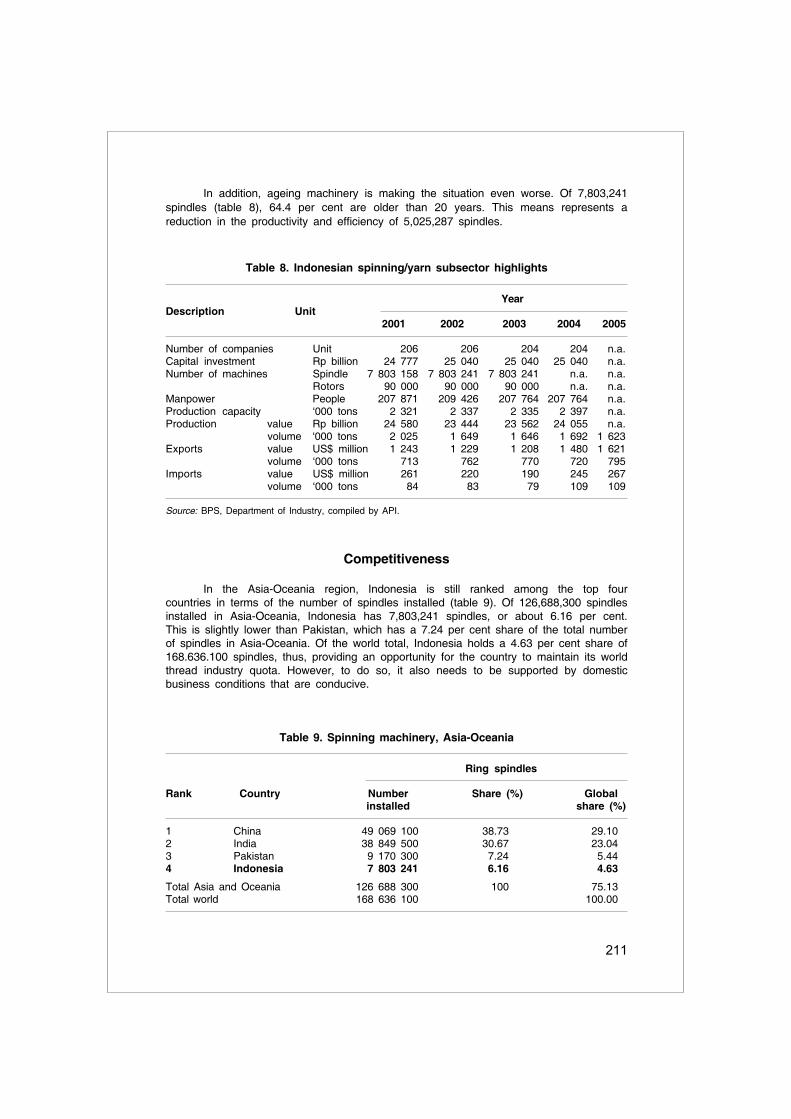
211
Competitiveness
In the Asia-Oceania region, Indonesia is still ranked among the top fourcountries in terms of the number of spindles installed (table 9). Of 126,688,300 spindlesinstalled in Asia-Oceania, Indonesia has 7,803,241 spindles, or about 6.16 per cent.This is slightly lower than Pakistan, which has a 7.24 per cent share of the total numberof spindles in Asia-Oceania. Of the world total, Indonesia holds a 4.63 per cent share of168.636.100 spindles, thus, providing an opportunity for the country to maintain its worldthread industry quota. However, to do so, it also needs to be supported by domesticbusiness conditions that are conducive.
Table 8. Indonesian spinning/yarn subsector highlights
YearDescription Unit
2001 2002 2003 2004 2005
Number of companies Unit 206 206 204 204 n.a.Capital investment Rp billion 24 777 25 040 25 040 25 040 n.a.Number of machines Spindle 7 803 158 7 803 241 7 803 241 n.a. n.a.
Rotors 90 000 90 000 90 000 n.a. n.a.Manpower People 207 871 209 426 207 764 207 764 n.a.Production capacity ‘000 tons 2 321 2 337 2 335 2 397 n.a.Production value Rp billion 24 580 23 444 23 562 24 055 n.a.
volume ‘000 tons 2 025 1 649 1 646 1 692 1 623Exports value US$ million 1 243 1 229 1 208 1 480 1 621
volume ‘000 tons 713 762 770 720 795Imports value US$ million 261 220 190 245 267
volume ‘000 tons 84 83 79 109 109
Source: BPS, Department of Industry, compiled by API.
Table 9. Spinning machinery, Asia-Oceania
Ring spindles
Rank Country Number Share (%) Globalinstalled share (%)
1 China 49 069 100 38.73 29.102 India 38 849 500 30.67 23.043 Pakistan 9 170 300 7.24 5.444 Indonesia 7 803 241 6.16 4.63
Total Asia and Oceania 126 688 300 100 75.13Total world 168 636 100 100.00
In addition, ageing machinery is making the situation even worse. Of 7,803,241spindles (table 8), 64.4 per cent are older than 20 years. This means represents areduction in the productivity and efficiency of 5,025,287 spindles.

212
E. Handlooms
Textile production that is based on handlooms is slowly being left behind.Particularly in West Java, factory owners producing handloom weaving have becomerare. Majalaya Kabupaten Bandung is one of the remaining areas that practices manualand semi-manual weaving. However, even though there are still a few handlooms inoperation in that area, the number is slowly decreasing, mainly due to strong competi-tion and superior capital capacity among the larger automated companies in thesubsector.
Table 10. Profile of other textile industry
Category Unit 2002 2003 2004 2005
Number of companies Units 523 524 524 524Manpower People 249 280 246 319 251 675 250 360Production capacity Tons 90 103 89 875 101 454 101 568Real production Tons 35 339 35 284 43 671 45 654Exports US$ million 267 579 533 536
‘000 tons 120 140 132 133Imports US$ million 69 63 72 73
‘000 tons 30 34 39 39
Actually, the potential of this subsector is quite good. Small-scale producers inMajalaya are complementary to the larger producers. If a cooperative relationship wereto be formed between the large and small-sized (handloom) factories, the results wouldbe beneficial to both sides.
In addition, large producers in other subsectors could use the handloomsubsector as part of the production chain. With a guaranteed supply of raw materialsand by absorbing the products of the handloom subsector, an industrial balance wouldbe formed.
The labour involved in this subsector is significant. However, the subsector hasreceived much less attention from the Government. Yet, if it were to be betterdeveloped, it could create a stronger economic base, especially among the small andmid-sized producers that are a majority in this subsector.
If seen from the production perspective, although output is not large by mass-production standards, the fabric produced has greater originality and artistic value aswell as a high sales value.

213
IV. Kazakhstan*
Introduction
Kazakhstan is known worldwide as a country with significant oil and natural gasreserves. With sufficient export options, Kazakhstan could become one of the world’slargest oil producers and exporters in the next decade. However, Kazakhstan’s strategicaspiration is to become a high-tech, diversified economy, with a high value-added, thatis well integrated into the global economy. The energy sector is viewed as a good basisfor achieving this goal.
The country’s plans for the future are encapsulated in its Strategy of IndustrialInnovation. Its starting point is the identification of priority sectors and the creation ofnetworks or clusters of innovative economic activity. Priorities include oil and gas,machine-building, food processing, textiles, transport logistics, metallurgy, constructionmaterials and tourism. The textile and clothing (T&C) sector is of special importance inthis regard.
A. Industry overview
The textile industry of Kazakhstan includes a group of light industries processingnatural, synthetic and artificial fibres into yarn and fabrics. According to the StateClassification, the textile industry should be represented by seven subsectors involvingdifferent economic activities. Prior to the disintegration of the former Soviet Union, thetextile and apparel sector played a vital part in the Kazakhstan economy. Its share intotal gross industrial production amounted to 15.6 per cent, and the level of profitabilityexceeded 24.5 per cent. However, during the past 15 years, the sector has becomeunprofitable (with a loss rate of about 11.5 per cent) and its share of manufacturingoutput has fallen to 0.6 per cent.
Due to the closure of major textile companies, most textile activities have ceasedto exist. According to the Association of Light Industry, 733 T&C companies wereregistered in 2001, By 2005, the number had decreased to 670 enterprises, amongwhich only 30 were large (>250 workers) and 68 were medium-sized (50-250workers). All companies were privatized. Employment in the T&C sector decreased from25,400 in 2001 to 17,000 in 2005 that makes up 2.8 per cent of all manufacturingemployers.
Currently, the T&C sector is undergoing re-structuring. Between 2001 and 2005,the greatest growth was observed in the manufacturing of cotton yarn made fromcombed and non-combed fibres (71.9 per cent) and in cotton fabric (53.3 per cent).Increasingly larger volumes of cotton fibre are produced in southern Kazakhstan.Overall, however, since 2002, a steady declined has been observed in the T&C sector(see table).
* Prepared by Ms Tatyana Zhdanova, Vice-President, Union Chamber of Commerce andIndustry, Kazakhstan.
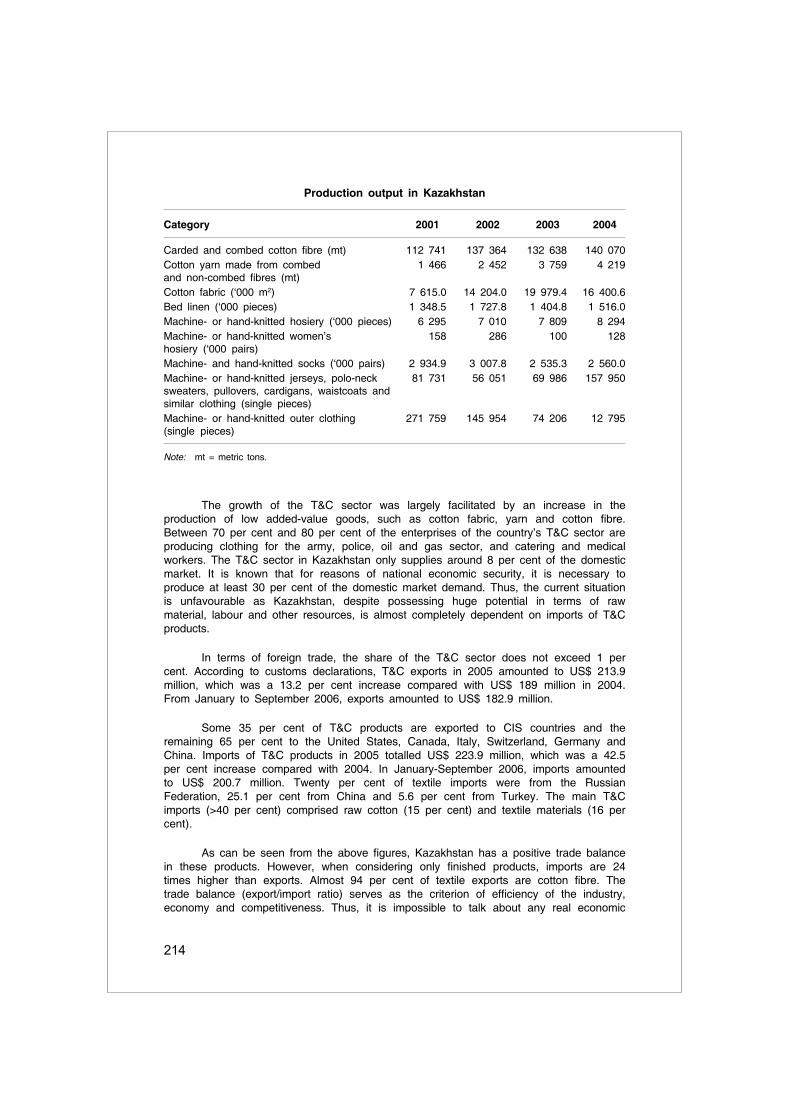
214
The growth of the T&C sector was largely facilitated by an increase in theproduction of low added-value goods, such as cotton fabric, yarn and cotton fibre.Between 70 per cent and 80 per cent of the enterprises of the country’s T&C sector areproducing clothing for the army, police, oil and gas sector, and catering and medicalworkers. The T&C sector in Kazakhstan only supplies around 8 per cent of the domesticmarket. It is known that for reasons of national economic security, it is necessary toproduce at least 30 per cent of the domestic market demand. Thus, the current situationis unfavourable as Kazakhstan, despite possessing huge potential in terms of rawmaterial, labour and other resources, is almost completely dependent on imports of T&Cproducts.
In terms of foreign trade, the share of the T&C sector does not exceed 1 percent. According to customs declarations, T&C exports in 2005 amounted to US$ 213.9million, which was a 13.2 per cent increase compared with US$ 189 million in 2004.From January to September 2006, exports amounted to US$ 182.9 million.
Some 35 per cent of T&C products are exported to CIS countries and theremaining 65 per cent to the United States, Canada, Italy, Switzerland, Germany andChina. Imports of T&C products in 2005 totalled US$ 223.9 million, which was a 42.5per cent increase compared with 2004. In January-September 2006, imports amountedto US$ 200.7 million. Twenty per cent of textile imports were from the RussianFederation, 25.1 per cent from China and 5.6 per cent from Turkey. The main T&Cimports (>40 per cent) comprised raw cotton (15 per cent) and textile materials (16 percent).
As can be seen from the above figures, Kazakhstan has a positive trade balancein these products. However, when considering only finished products, imports are 24times higher than exports. Almost 94 per cent of textile exports are cotton fibre. Thetrade balance (export/import ratio) serves as the criterion of efficiency of the industry,economy and competitiveness. Thus, it is impossible to talk about any real economic
Production output in Kazakhstan
Category 2001 2002 2003 2004
Carded and combed cotton fibre (mt) 112 741 137 364 132 638 140 070Cotton yarn made from combed 1 466 2 452 3 759 4 219and non-combed fibres (mt)Cotton fabric (‘000 m2) 7 615.0 14 204.0 19 979.4 16 400.6Bed linen (‘000 pieces) 1 348.5 1 727.8 1 404.8 1 516.0Machine- or hand-knitted hosiery (‘000 pieces) 6 295 7 010 7 809 8 294Machine- or hand-knitted women’s 158 286 100 128hosiery (‘000 pairs)Machine- and hand-knitted socks (‘000 pairs) 2 934.9 3 007.8 2 535.3 2 560.0Machine- or hand-knitted jerseys, polo-neck 81 731 56 051 69 986 157 950sweaters, pullovers, cardigans, waistcoats andsimilar clothing (single pieces)Machine- or hand-knitted outer clothing 271 759 145 954 74 206 12 795(single pieces)
Note: mt = metric tons.

215
growth given the domination of finished goods in imports and raw materials in exports.Growing domestic demand is mostly met by imports of mainly undeclared, piratedproducts from China, Kyrgyzstan, Turkey and Pakistan, the share of which exceeds 95per cent. These figures all imply that the T&C sector of Kazakhstan is facing a difficultsituation. The Association of Light Industry has identified the main problems facing T&Cmanufacturers as:
(a) A lack of access to capital, including unavailability of privileged financing(for example, for entities making investments in equipment), and the difficultprocess in obtaining loans from second level banks;
(b) A lack of skilled manpower due to the poor quality of specialist training,unavailability of specialized training and the non-involvement of firms in thespecialization process;
(c) The absence of necessary standards and a quality management system;
(d) Poor infrastructure in terms of upgrading of technical equipment and thelack of facilities for machinery construction;
(e) Government controls with regard to the redistribution of VAT betweenfarmers and processing plants, ineffective and inadequate governmenttechnical controls (non-declared imports etc.), inadequate regulations andinefficient enforcement of laws, and a lack of incentives for exportingcompanies;
(f) Related problems such as unstable prices for raw materials (cotton),dependency on world prices, poor quality of raw materials (cotton seeds)and an absence of import barriers.
How can these problems resolved and the situation improved for the T&C sectorin Kazakhstan? According to the Association of Light Industry, the following steps needto be taken:
(a) Lower the tax burden (tax holidays for five years) in order to create equalconditions in the domestic market for legal commodity producers, “shadow”manufactures and “grey” importers;
(b) Lower the VAT rate on T&C products, and grant exemption from profit taxfor light industry enterprises, provided that the profit is used to develop theenterprise;
(c) Protection of the domestic market against an unfair competition anddumping on the basis of current legislation by:
(i) Taking effective measures to suppress “shadow” imports of goods via“cargo transportation”, and creating equal competition conditions inKazakhstan for all participants in foreign trade activities;
(ii) Ensuring full and obligatory customs declaration of light industrygoods;
(iii) Annual warehouse inspections, by independent experts, related Asso-ciations and the Unions, of the quality of goods purchased within theframework of government procurement;

216
(iv) Inspections, by qualified independent experts, of enterprises with re-gard to capacity in terms of equipment, workers, shops etc., to ensurethe quality throughout the manufacturing process. Enterprise ratingsshould be made easily available;
(v) The introduction of a programme for the promotion of domestic textileproducts in the domestic and export markets.
The above issues are regularly discussed during roundtable conferences on theproblems of light industry, the problems of WTO accession etc.
Despite the vast gap between Kazakhstan’s T&C sector and leading foreigntextile sectors, experts believe the outlook for development may be optimistic due to agovernment decision to create a competitive textile sector in Kazakhstan. Based on thedirective of the President of Kazakhstan, N. Nazarbayev, the Government has started anew programme of economic diversification through the development of clusters. Theobjectives of this programme are increased competitiveness of non-extractive industriesin Kazakhstan and increased productivity and economic development. The programme,which is complementary to the growth of the Kazakhstan economy at the national,regional and world levels, includes close cooperation between key members of theGovernment, businessmen and educational institutions.
The experiences of industrially developed countries demonstrate that the textilesector influences the formation of the services sector Development of the T&C sectorfosters employment, fills the domestic market with locally produced commodities, boostsspecialized machine engineering, and facilitates the development of the weaving industryand trade. This is why the concept of a T&C cluster has priority in Kazakhstan’sStrategy for Industrial and Innovation Development. One of the first steps in creating thecluster will be the establishment of the “Ontustik” Special Economic Zone in southernKazakhstan by 1 July 2015 (Presidential Decree No. 1605, dated 6 July 2005). Thismeasure is aimed at encouraging investors in the T&C sector – a promising step forsouthern Kazakhstan and the country as a whole.
It is planned to attract approximately US$ 500 million in private investment inthe development of the Special Economic Zone. Two hundred hectares with a favourablefuel and transportation infrastructure have been allocated for the Special EconomicZone. The construction of at least 15 spinning, weaving and sewing facilities is planned.Textile companies operating within the Special Economic Zone will be exempt fromcorporate income tax, land tax and property tax as well as partially exempt fromVAT (on imports) until 1 July 2015. Considerable customs benefits are also envisagedfor investors.
B. Successful projects
Several companies currently operating in Kazakhstan have invested in upgradingexisting cotton processing facilities and in building new ones. In 2003, the establishmentof the Nimex Textile Company was based on the Ust Kamenogorsk Silk FabricsCombine. Its capacity is 60,000 metric tons (mt) of raw cotton per year. The companyproduces fabrics for overalls, suits, dresses, decorative textiles, filter fabrics, yarn,batting and fabric impregnated to protect against dust, dirt and acids for protectiveclothing as well as clothing for catering and medical workers.
217
The Kazakhstan Development Bank has funded a project to upgrade thetechnology at the UTEX cotton processing company. The total project cost is US$ 19.3million and the design capacity of the plant is approximately 6,000 mt of cotton yarn peryear. The yarn is sold throughout Kazakhstan and exported to the Russian Federationand Ukraine.
In the autumn of 2005, the Melange Complex was commissioned, after recon-struction, for the production of cotton fabrics. The plant’s design capacity is more than 5million running metres of fabrics per year. The total cost of reconstructing andexpanding the enterprise, which includes weaving, dying and finishing workshops, wasUS$ 40.5 million. The company focuses on the production of 3.2-metre-wide terry cloth,linens and jeans fabrics, which are in high demand in international markets. It isplanned to export for these products to the Russian Federation, Ukraine, and other CISand non-CIS countries.
A technopark has been established in southern Kazakhstan with the participationof Switzerland’s Rieter, a world-famous manufacturer and supplier of weaving andknitting equipment. The project comprises a maintenance department, and courses fortechnical personnel and engineers. It is also planned to establish an experimentalknitting plant, design new production facilities, and set up a facility for repairingelectronic components at the technopark.
Another noteworthy textile project was the launch of Alliance Kazakhstani-Russian Textile in Southern Kazakhstan Oblast. The joint venture includes Kazakhstan’sMyrzakent cotton company and the Russian Textile Corporation, which is a major textileholding in the Russian Federation. The company has a complete process cycle includingall stages of processing cotton fibre into fabric. Up-to-date equipment by Belgian,Swedish and German producers has been installed. The investment was more than 35 million. The new company’s planned design capacity is 15 million m2 of fabric per year.Alliance Kazakhstani-Russian Textile will focus on the production of grey goods, but it isplanned to expand its production range to include sheeting, cotton print and terry cloth.
A situational analysis of the T&C sector in the country was implemented by theKazakhstan Centre for Marketing and Analytical Research (CMAR). Taking into accountsuch criteria as increases (decreases) in production, imports and exports as well ascriteria defining production (quality, equipment wear etc.) and marketing (branding, salesand prices), CMAR was able to identify additional products manufactured by T&Cproducers that have a high market potential. In addition, CMAR was able to establishdirections for the sector’s development.
The products with a high level of attractiveness and high industrial potentialinclude PVC fibres (Russian market), cotton yarn of high numbers (European market),and 1.5-metre-wide cotton fabrics, terry cloth and jerseys from camel wool (local andRussian markets). Such products as PVC, PA and PP fibres, dyeing and finishing,technical textiles (yarn and fabrics used for industrial purposes), synthetic fabrics (forproducing professional and working clothes), professional clothing using man-madematerials, and female stockings have high attractiveness and low industrial potential asthey require high capital investment for development.
A similar analysis was made for wool products. Kazakhstan participates in theworld woollen trade in three categories – short-haired wool, woollen fibre and thin woolthat is not carded or combed. From 1999 to 2004, the share of Kazakhstan’s woolexports in total world exports did not exceed 1 per cent. Compared with 2000, in 2004the share of Kazakhstan in global wool exports was reduced practically by 94 per cent

218
in value and by more than 54 per cent in terms of volume. Such a sharp decrease ismainly due to the low level of wool processing in the region. The following countries arethe largest importers of wool from Kazakhstan:
(a) China – shorn wool, and fine or coarse animal hair not carded or combed;
(b) Russian Federation – 96 per cent of exports comprises sheep hair notcarded or combed;
(c) Kyrgyzstan – wool exports make up 23 per cent of total export to thiscountry
The attractive products and prospective segments of export markets have beendefined by the analysis of foreign markets for animal hair and its products. The mostattractive segments are:
(a) Chinese market for shorn wool;
(b) Chinese market for washed sheep’s wool;
(c) Turkish market for wool tops.
The markets with an average degree of attractiveness include:
(a) Shorn wool in the Russian Federation, Belarus and Bulgaria;
(b) Washed sheep’s wool in the Russian Federation, Belarus, Bulgaria andTurkey;
(c) Fine animal hair not carded or combed in China and Belarus;
(d) Machine-spun wool in China, the Russian Federation, Belarus, Bulgaria,Romania and Turkey;
(e) Wool tops in China, Romania and Belarus;
(f) Fine processed animal hair in China, Turkey, Romania and Belarus;
(g) Woollen machine-spun yarn in Romania, Bulgaria, Belarus, the RussianFederation and Turkey;
(h) Woollen combing yarn in China, Bulgaria, Romania, the Russian Federationand Turkey;
(i) Woollen spinning fabrics in Belarus, the Czech Republic and Turkey;
(j) Woollen combing fabrics in China, Romania, Bulgaria, Turkey, the RussianFederation and Belarus.
The dynamics of the development of the international textiles market are suchthat the share of Western Europe and the United States in exports is decreasing whilethe share of India, China, Mongolia, Viet Nam and other Asian countries capable ofcreating a full process chain with geographically close links is growing. The industry hasbecome an arena in which textile leaders from Western Europe as well as novices
219
actively investing in technology and production confront one another. Despite the factthat the T&C sector in Kazakhstan is still declining, participants in the Kazakhstanitextile market stress that the market is very promising. This optimistic view is based onthe following facts:
(a) Kazakhstan is situated in a region where there is a huge demand forcotton yarn. For example, Asian and Pacific countries annually consumemore than 16.5 million mt of yarn, followed by European countries at 1.6million mt, the Russian Federation at 600,000 mt and the Middle East at100,000 mt. It is therefore economically viable for Kazakhstan to export tothe countries of those regions;
(b) In view of its lower production costs as well as its proximity to rawmaterials (southern Kazakhstan, Uzbekistan, Turkmenistan and Tajikistan)and potential markets (China, the Asia-Pacific region, Europe and theMiddle East), Kazakhstan’s textile industry has great development potential.Most importantly, the Kazakhstan Cluster Initiative and the cluster concep-tion come within the framework of the Government’s programme fordiversification of the national economy.
C. Conclusion
Prior to the disintegration of the former Soviet Union, the T&C sector played avital role in Kazakhstan’s economy. Its share of total gross industrial productionamounted to 15.6 per cent, and the level of profitability exceeded 24.5 per cent.However, for the past 15 years, the sector has been unprofitable (with a loss rate ofabout 11.5 per cent) and its share of manufacturing output has fallen to 0.6 per cent.The T&C sector in Kazakhstan only covers around 8 per cent of domestic marketdemand. In the foreign trade turnover, the share of the T&C sector does not exceed 1per cent. Kazakhstan, possessing potentially huge raw material, labour and otherresources, is completely dependent on imports of T&C products. Growing domesticdemand is mostly met by imports of mainly undeclared, pirated products from China,Kyrgyzstan, Turkey and Pakistan, the share of which exceeds 95 per cent.
Based on the directive of the President of Kazakhstan, N. Nazarbayev, theGovernment has introduced a programme of economic diversification through thedevelopment of clusters. One of the first steps in creating the T&C cluster will be theestablishment of the “Ontustik” Special Economic Zone in southern Kazakhstan by 1July 2015. This measure is aimed at encouraging investors in the T&C sector, which willbenefit southern Kazakhstan and the country as a whole.
It is intended to attract approximately US$ 500 million in private investment inthe development of the Special Economic Zone. Two hundred hectares with a favourablefuel and transportation infrastructure have been allocated to the Special Economic Zone.It is planned to construct at least 15 spinning, weaving and sewing facilities, and textilecompanies operating within the Special Economic Zone will be fully exempt fromcorporate income tax, land tax and property tax as well as partially exempt from VAT(on imports) up until 1 July 2015. Considerable customs benefits are also envisaged forinvestors.

220
V. Mongolia*
A. Current situation
Mongolia was one of the non-quota countries with regard to T&C exports to theUnited States market from 1999 to 2005. In 2005, the Agreement on Textile andClothing (ATC) expired. Until 2005, foreign investment in the T&C sector rapidlyincreased in order to take advantage of the quota system. The major foreign investors inthe T&C sector were from China, Taiwan Province of China, Hong Kong, China, and theDemocratic People’s Republic of Korea (figure I). Unfortunately, the removal of quotas in2005 seriously affected the Mongolian T&C sector when the number of T&C factoriesbegan to decline as foreign investments moved to other countries.
Figure I. Share of foreign investment in the Mongolian T&C sector
RussianFederation
2%
Germany0.8%
China29%
Hong Kong,China22%
TaiwanProvince of
China25%
Dem. People’sRep. of Korea
17%
United States2%
UnitedKingdom
2%
VirginiaIsland
1%
In 2006, 30 T&C factories were operating, 17 of which had been established withforeign investment and the remainder domestically owned (table 1). Before 2005, thesector provided direct employment for more than 30,000 people, mostly women fromvulnerable sections of society, who were the main breadwinners for 100,000 dependants.In 2007, only 5,000 workers were working for 30 T&C exporting factories.
* Prepared by Ms Chuluunbat Ch.Tsetsegmaa, Mongolian National Chamber of Commerce andIndustry.
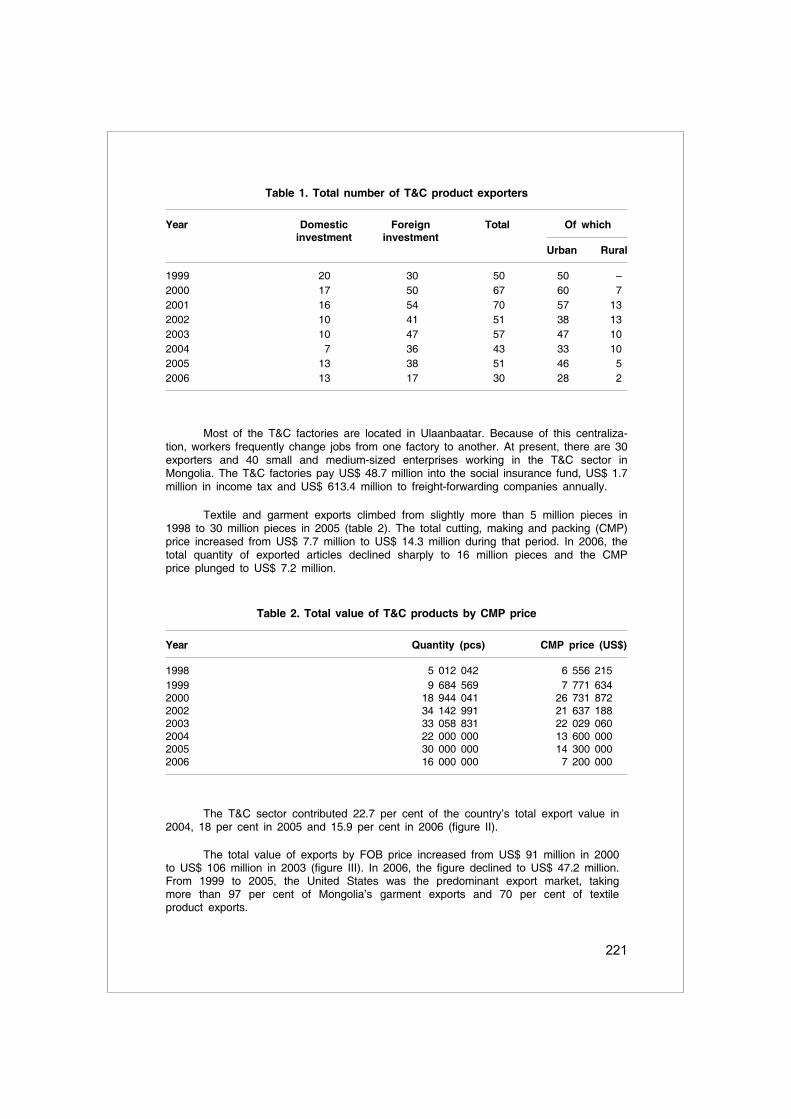
221
Table 1. Total number of T&C product exporters
Year Domestic Foreign Total Of whichinvestment investment
Urban Rural
1999 20 30 50 50 –2000 17 50 67 60 72001 16 54 70 57 132002 10 41 51 38 132003 10 47 57 47 102004 7 36 43 33 102005 13 38 51 46 52006 13 17 30 28 2
Table 2. Total value of T&C products by CMP price
Year Quantity (pcs) CMP price (US$)
1998 5 012 042 6 556 2151999 9 684 569 7 771 6342000 18 944 041 26 731 8722002 34 142 991 21 637 1882003 33 058 831 22 029 0602004 22 000 000 13 600 0002005 30 000 000 14 300 0002006 16 000 000 7 200 000
Most of the T&C factories are located in Ulaanbaatar. Because of this centraliza-tion, workers frequently change jobs from one factory to another. At present, there are 30exporters and 40 small and medium-sized enterprises working in the T&C sector inMongolia. The T&C factories pay US$ 48.7 million into the social insurance fund, US$ 1.7million in income tax and US$ 613.4 million to freight-forwarding companies annually.
Textile and garment exports climbed from slightly more than 5 million pieces in1998 to 30 million pieces in 2005 (table 2). The total cutting, making and packing (CMP)price increased from US$ 7.7 million to US$ 14.3 million during that period. In 2006, thetotal quantity of exported articles declined sharply to 16 million pieces and the CMPprice plunged to US$ 7.2 million.
The T&C sector contributed 22.7 per cent of the country’s total export value in2004, 18 per cent in 2005 and 15.9 per cent in 2006 (figure II).
The total value of exports by FOB price increased from US$ 91 million in 2000to US$ 106 million in 2003 (figure III). In 2006, the figure declined to US$ 47.2 million.From 1999 to 2005, the United States was the predominant export market, takingmore than 97 per cent of Mongolia’s garment exports and 70 per cent of textileproduct exports.
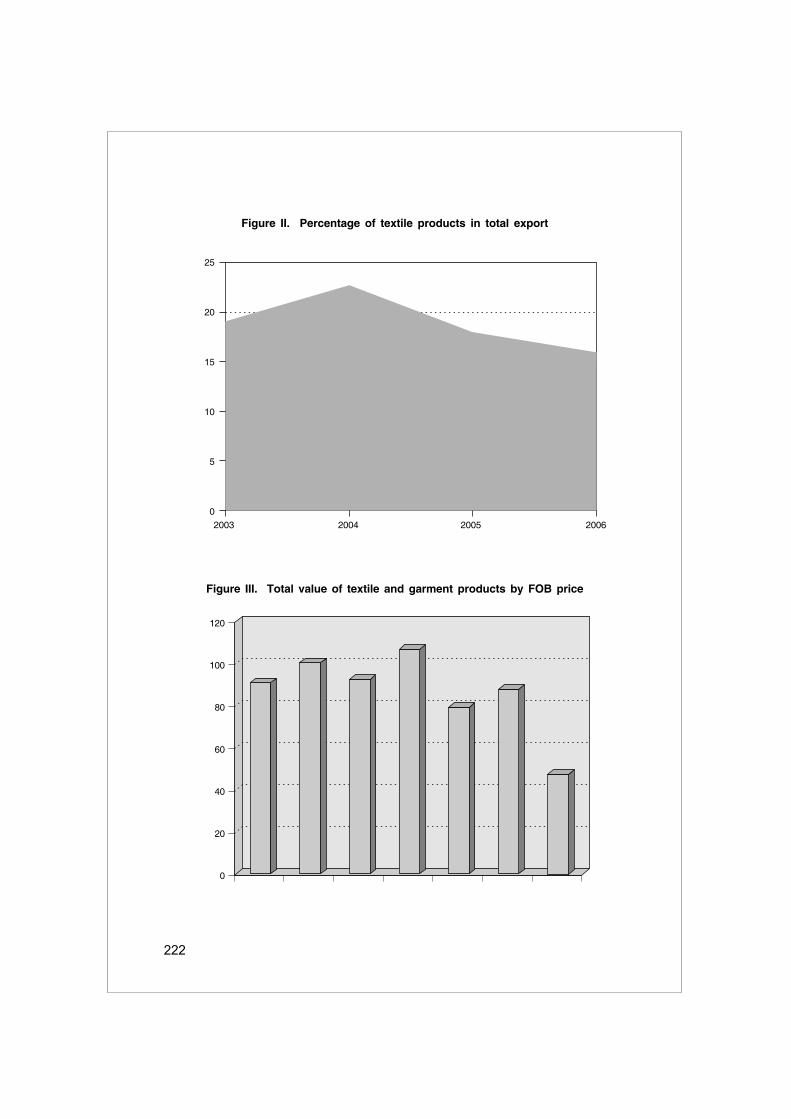
222
Figure II. Percentage of textile products in total export
25
20
15
10
5
0
2003 2004 2005 2006
Figure III. Total value of textile and garment products by FOB price
120
100
80
60
40
20
0

223
The T&C sector in Mongolia currently accounts for about 4.7 per cent of GDP. Atpresent, taxes are not levied on raw materials used in products that are ultimatelyexported.
Like many other developing countries, the T&C sector in Mongolia suppliesoverseas markets by order. A wide range of brand name articles are produced inMongolia for the United States market, including:
Adidas – children’s T-shirts, trousers and suits
Ann Taylor Inc – knitted sweaters
Sears Roebuck and Corp – trousers and knitted sweaters
Liz Claiborne Inc – knitted sweaters
J. C. Penney Purchasing – trousers and shorts
Express LLC – ladies’ trousers, shirts, suits and jackets
Pacific Trail Inc – jackets
Lollytogs Ltd. – children’s trousers, shirts, shorts and knitted sweaters
Dawson Forte Cashmere Co. – cashmere sweaters
Segrets Inc. – knitted sweaters
Phillips Van Heusen Corp. – men’s shirts
Lee Co. – trousers
Jones Apparel Group Inc. – knitted sweaters
Federated Merchandising Group – knitted sweaters
May Department Stores International Inc. – knitted sweaters
London Fog, Gap – jackets
Old Navy – children’s shirts, trousers
Sonoma Jean Co. – denim trousers.
B. Current problems
The T&C sector in Mongolia currently faces a range of problems, including thefollowing:
(a) Mongolian T&C factories have to export their products with help from thirdparties including customers in China and Republic of Korea. In addition, allraw materials are imported from China, Republic of Korea and a number ofother countries. However, the Mongolian factories receive only the CMPprice, which has dropped from US$ 1.4 to US$ 0.48 per item. This isinsufficient to allow the successful development of the sector;

224
(b) Mongolia is a land-locked country and the majority of goods exported needto travel through China or the Russian Federation. Transportation costs arehigh, which affects the whole T&C sector;
(c) High costs of electricity, heating and building rentals;
(d) A high level of dependence on imports of designs. Designs that originate inMongolia have to be done manually. The present methodology is slow,expensive, prone to problems of accuracy, and wasteful in terms ofmaterial and time;
(e) Most of the T&C factories export to the United States and European Unionmarkets through third parties;
(f) A lower level of productivity compared with other countries;
(g) Increasing movement of workers between factories;
(h) A lack of a comprehensive training system for skilled workers and techni-cians.
C. Actions needed to support the T&C sector and its development
In order to support and develop the T&C sector of Mongolia, the following stepsneed to be implemented:
(a) Encourage investment by foreign and domestic companies by providingequal treatment and incentives;
(b) Negotiate preferential trade agreements with trading partners, the EuropeanUnion, Japan and the Russian Federation;
(c) Establish a climate of quality excellence;
(d) Minimize transportation time between suppliers and garment makers aswell as between garment makers and customers;
(e) Revise and implement related laws and regulations (e.g., the Labour Lawand the Education Law) in order to provide incentives that will encourageincreased productivity and the building up of human resources capacity;
(f) Establish a banking and financial system that will provide financial supportfor T&C enterprises in terms of capital turnover;
(g) Develop the whole T&C and related industries to enable them to take anintegrated approach to moving away from low-cost products towards uniquehigher value-added commodities;
(h) Research possibilities of exporting to the United States and other interna-tional markets directly without involving third party intermediaries;
(i) Increase competitiveness;
(j) Use domestically produced raw materials and fabrics;

225
(k) Expand the domestic market and provide home-produced consumer goodsand state-ordered goods;
(l) Improve the infrastructure supporting the T&C sector by establishing acentral supply of raw materials, fabrics, accessories and other relateditems, with the objective of encouraging domestic small and medium-sizedenterprises to use local raw materials in producing basic and supplemen-tary materials;
(m) Fully utilize and upgrade the capacity of factories by transferring andintroducing new technology and equipment.
D. Potential markets and advantages
Mongolia is a beneficiary country under the European Union “GSP+” from 1January 2006 up until 2008. The European Union GSP+ provides preferential duty-freeentry for 7,200 products originating in Mongolia, including all T&C products.
Mongolia is an immediate neighbour of China, which is one of the biggestproducers and suppliers of T&C raw materials in the world.
Mongolia is benefiting from GSP preference in Japan, the Russia Federation,Norway, Switzerland, Belarus, Bulgaria, Australia, Canada, New Zealand and the UnitedStates.
Mongolia is the world’s second largest supplier of cashmere (22 per cent) nextto China and is the source of the best quality cashmere, which comes only fromMongolian or Inner Mongolian goats.
226
VI. Myanmar*
Introduction
This report, which covers the period from 1997 to 2006, is aimed at highlightingthe opportunities and strength of Myanmar’s garment manufacturing firms and theconstraints on their development. It also explores possible ways of cooperation with thegarment industries in China and neighbouring countries on a contractual basis and, ifpossible, to move towards a “supply chain development” in the long term.
A. Background
Since the times of Myanmar kings, a household/cottage textile (cotton andimported silk from Yunnan) and clothing (cotton ginning, spinning, weaving, garment-making etc) industry producing for local use has been developed throughout Myanmar.
During the colonial period,1 the indigenous T&C cottage industry survived despiteextensive imports of English-made quality textiles, especially after the opening of theSuez Canal in 1869.
Following independence, during the 1950s and early 1960s the industry devel-oped with the support of the Government. Exports of quality nylon fabrics began toneighbouring countries including Thailand. Almost all the textile factories at that timewere owned by renowned private companies.
Then, in 1962, a socialist government came to power and nationalized theprivate enterprises and businesses, including micro-businesses, in 1964. From 1964 until1989,2 the private sector – with the exception of small businesses and street vendors,disappeared. The former textile factories became state-owned enterprises (SOEs) underthe Ministry of Industry No.1.
After the present regime took power in 1988, “market-oriented economic reforms”were introduced.3 From 1994, the establishment of private garment factories began,especially those involved in cutting, making and packaging (CMP). From just 25 factorieslocated in Yangon in 1994, the number had expanded rapidly to 291 by 1999.
* Prepared by Mr. Myint Soe, Chairman, Myanmar Garment Manufacturers Association.
1 The first annexation of Myanmar (then known as Burma) by the British was in 1826, followedby the second in 1852. The final annexation of the whole country took place in 1885-1886.The country gained independence in 1948.
2 The present military Government took power in 1988, abolished the socialist regime anddeclared a market-oriented economic policy. It has made a number of economic reforms since1989, restored the National Chambers of Commerce – UMCCI and legalized private busi-nesses under the Myanmar Companies Act [India Act VII, 1913], (1 April 1914). The Union ofBurma Foreign Investment Law and Procedures was promulgated in November 1998. Inaddition, the Myanmar Citizens Investment Law, procedures and types of economic activitieswere enacted in March 1994.
3 See footnote 2.

227
B. Garment firms operating in Myanmar, 1997-2004
Table 1 and figure I show the trend in the number of operational garment firmsin Myanmar from 1997 to 2004.
It can be seen that in the seven-year period covered by table 1 and figure I, thenumber of garment firms in Myanmar grew by 1.5 times. However, if the period isextended to the peak year of 1999, the number grew by 3 times. Subsequently, the
Table 1. Number of operational garment firms in Myanmar, 1997-2004
Financial State- Foreign joint ventures with 100% Local
year owned foreign private Totalenterprises MTI/UMEH Private firms firms firms
1997 1 9 1 6 77 941998 0 8 2 9 213 2321999 0 8 3 10 270 2912000 1 5 18 248 2792001 1 7 5 23 194 2302002 0 6 4 27 180 2172003 0 6 4 27 165 2022004 0 4 4 22 112 142
Figure I. Number of operational garment firms in Myanmar, 1997-2004
325
300
275
250
225
200
175
150
125
100
75
50
25
01997 1998 1999 2000 2001 2002 2003 2004
State-owned enterprises Foreign joint ventures (with MTI/UMEH)
Foreign joint venture 100% foreign firms
Local private firms Total
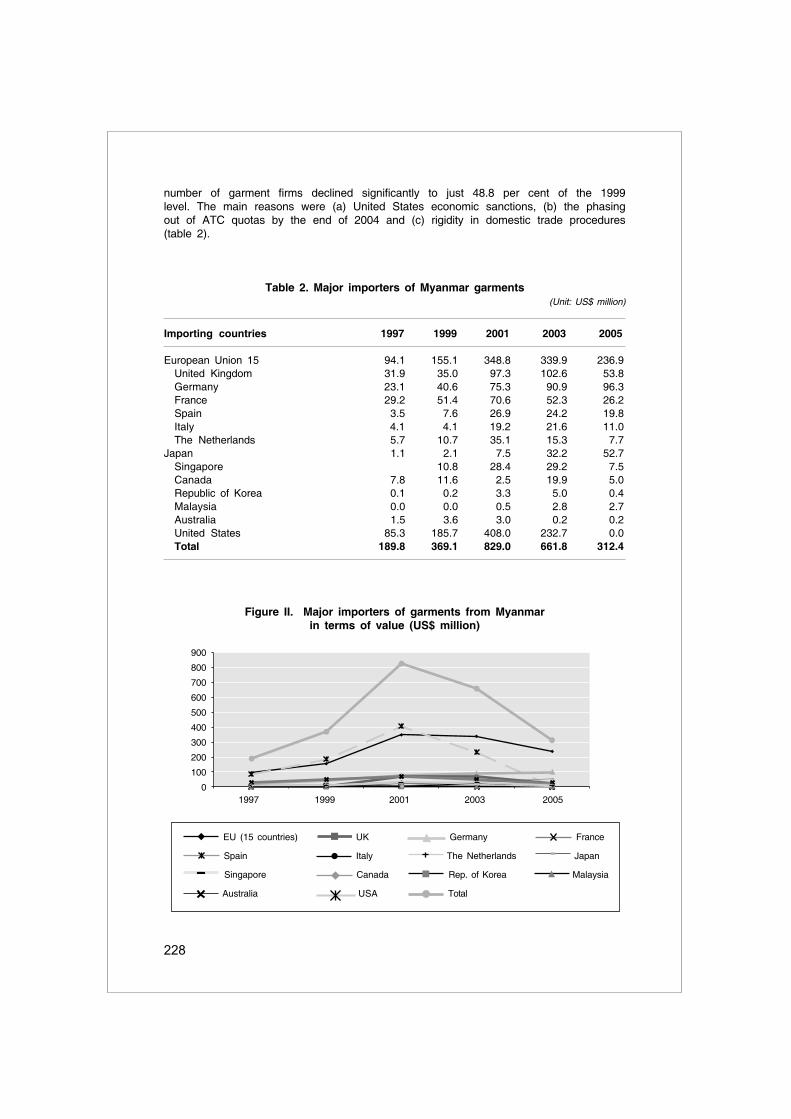
228
number of garment firms declined significantly to just 48.8 per cent of the 1999level. The main reasons were (a) United States economic sanctions, (b) the phasingout of ATC quotas by the end of 2004 and (c) rigidity in domestic trade procedures(table 2).
Figure II. Major importers of garments from Myanmarin terms of value (US$ million)
Table 2. Major importers of Myanmar garments(Unit: US$ million)
Importing countries 1997 1999 2001 2003 2005
European Union 15 94.1 155.1 348.8 339.9 236.9United Kingdom 31.9 35.0 97.3 102.6 53.8Germany 23.1 40.6 75.3 90.9 96.3France 29.2 51.4 70.6 52.3 26.2Spain 3.5 7.6 26.9 24.2 19.8Italy 4.1 4.1 19.2 21.6 11.0The Netherlands 5.7 10.7 35.1 15.3 7.7
Japan 1.1 2.1 7.5 32.2 52.7Singapore 10.8 28.4 29.2 7.5Canada 7.8 11.6 2.5 19.9 5.0Republic of Korea 0.1 0.2 3.3 5.0 0.4Malaysia 0.0 0.0 0.5 2.8 2.7Australia 1.5 3.6 3.0 0.2 0.2United States 85.3 185.7 408.0 232.7 0.0Total 189.8 369.1 829.0 661.8 312.4
900
800
700
600
500
400
300
200
100
01997 1999 2001 2003 2005
EU (15 countries) UK Germany France
Spain Italy The Netherlands Japan
Singapore Canada Rep. of Korea Malaysia
Australia USA Total

229
C. Situational Analysis
The following situational analysis shows the productivity and competitiveness ofgarment firms in Myanmar (tables 3 and 4).
Table 3. Productivity of garment firms in Myanmar, 2004
100% Foreign Domesticforeign joint private Totalfirms ventures firms
Number of firms 13 6 111 130Number of workers 9 790 4 380 29 550 43 720Number of sewing machines 4 412 2 728 16 649 23 789Production (in dozens) 4 445 757 2 423 000 6 092 820 12 961 577
Workers per firm 753 730 266 336Sewing machines per firm 339 455 150 183Production per firm (in dozens) 341 981 403 833 54 890 99 704Production per worker (in dozens) 454 553 206 296Sewing machines per worker 0.5 0.6 0.6 0.5
Productivity (relative to totalproduction per worker) 1.5 1.9 0.7 1.0
Table 4. Competitiveness of garment firms in Myanmar
Category Competitive Non-competitive
Labour wages 123 20Skill 93 50Human resources 86 57Fulfillment ofconsignment orders 73 70Infrastructure 15 128Market - 112Incentives 15 128
Constraints on Myanmar garment firms
Garment firms in Myanmar also face a number of constraints. The mainconstraint has been the strong competition in the global clothing market, especially fromChina and India (table 5), following the phasing out of ATC quotas.
Other constraints include:
(a) Economic sanctions by the United States (see table 2);
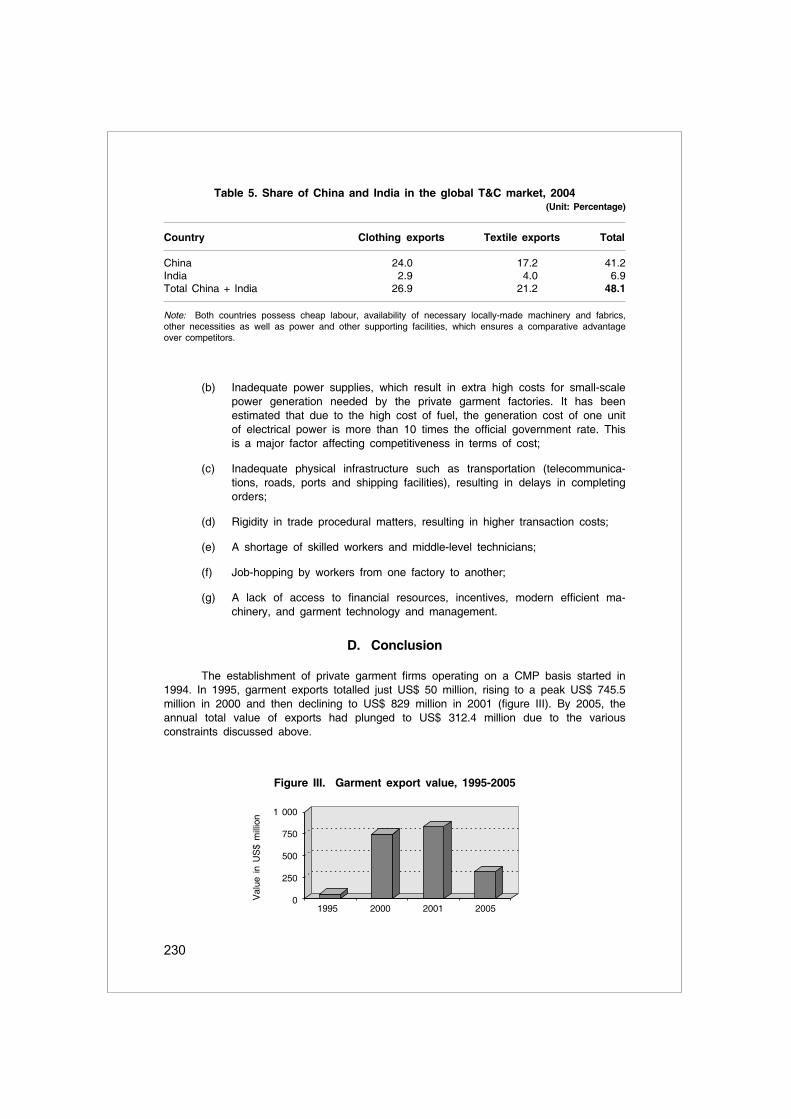
230
(b) Inadequate power supplies, which result in extra high costs for small-scalepower generation needed by the private garment factories. It has beenestimated that due to the high cost of fuel, the generation cost of one unitof electrical power is more than 10 times the official government rate. Thisis a major factor affecting competitiveness in terms of cost;
(c) Inadequate physical infrastructure such as transportation (telecommunica-tions, roads, ports and shipping facilities), resulting in delays in completingorders;
(d) Rigidity in trade procedural matters, resulting in higher transaction costs;
(e) A shortage of skilled workers and middle-level technicians;
(f) Job-hopping by workers from one factory to another;
(g) A lack of access to financial resources, incentives, modern efficient ma-chinery, and garment technology and management.
D. Conclusion
The establishment of private garment firms operating on a CMP basis started in1994. In 1995, garment exports totalled just US$ 50 million, rising to a peak US$ 745.5million in 2000 and then declining to US$ 829 million in 2001 (figure III). By 2005, theannual total value of exports had plunged to US$ 312.4 million due to the variousconstraints discussed above.
Figure III. Garment export value, 1995-2005
Table 5. Share of China and India in the global T&C market, 2004(Unit: Percentage)
Country Clothing exports Textile exports Total
China 24.0 17.2 41.2India 2.9 4.0 6.9Total China + India 26.9 21.2 48.1
Note: Both countries possess cheap labour, availability of necessary locally-made machinery and fabrics,other necessities as well as power and other supporting facilities, which ensures a comparative advantageover competitors.
1 000
750
500
250
01995 2000 2001 2005
Val
ue i
n U
S$
mill
ion
231
However, not only the value of exports declined. The number of factories also fellsharply from 291 in 1999 to 142 in 2004. Most of the private garment firms are small-sized enterprises in regional terms: however, according to the Myanmar definition ofsmall and medium-sized industries, they are medium-sized enterprises that each employ101 to 300 workers.
Strong competition in the global garment trade following the removal of WTOquotas resulted in sharp decline in Myanmar garment exports as well as in the numberof Myanmar private garment firms.
Increased cooperation between Chinese T&C firms and their Myanmar counter-parts in CMP garment products would be mutually beneficial. With that in mind, theMyanmar Garment Manufacturers Association is seeking ways of cooperating with itsChinese counterparts in Myanmar.
232
VII. Nepal*
Introduction
The T&C sector has remained a prime contributor to Nepal’s export tradedevelopment. The imposition and elimination of the quota system in international appareltrading has been responsible for both the rise and the fall of the T&C sector in Nepal.With the introduction of MFA quotas, the industry boomed rapidly because of spilloverbusiness from neighbouring countries; however, it was also damaged unexpectedly bythe elimination of the quota regime more than two years ago.
When compared to other LDC apparel-exporting countries, Nepal is probably theonly country to have experienced an immediate impact resulting from the ending of thequota system in the form of a severe drop in its exports to the United States. Thereare two basic reasons for this adverse situation. First, Nepal is not only an LDCeconomy, but also a land-locked nation with a relatively low competitive edge in bothproduction and delivery for international markets. Second, it acted late in adopting anenvironment conducive to international textiles and clothing trade in the post-MFAperiod. Despite that, the industry has managed to survive, although the situation is stillfar from sound.
A. Production and employment situation
The apparel subsector in Nepal involves two types of industries – businessesthat are totally focused on domestic demand and those that are totally export-oriented.Domestic market-based firms have remained traditional and fragmented with a sluggishgrowth trend, whereas the export-oriented businesses continued to surge until the mid-1990s, reaching a peak of 1,067 according to Garment Association of Nepal (GAN)records. However, the number of exporting firms then declined rapidly with the phasingout of the quota system as well as changes in the internal quota distribution policy.
The declining trend in the number of garment businesses has been ominous,particularly since 2003. The number of operational firms, which totalled 158 in 2003, haddeclined to 126 by 2004. Currently, only 99 firms are registered with GAN, of which only20 per cent are operational. Regarding ownership, almost all of the firms are owned bydomestic entrepreneurs, except for one that is joint venture with India.
Employment in this subsector was more than 50,000 (direct only) during theboom period of 1999-2000, accounting for 12 per cent of total employment in themanufacturing sector. About 25 per cent of the total employees in the garment industryare women, which is an exceptionally high figure for a society with widespread genderdiscrimination.
After reaching a peak level in the mid-1990s, the number of firms continued todecline, while total output continued to rise, indicating growth in the average size of thefirms. That can be attributed to modernized production plants and increased experience
* Prepared by Mr. Kiran P. Saakha, President, Garment Association of Nepal.

233
of Nepalese manufacturers in apparel export marketing. However, Nepal did not reallybenefit from the its factor endowment, despite the industry being labour-intensive. Thismay be because of high employment of unskilled labour and overemphasis placed onlow-value commodity items by Nepalese exporters.
B. Export composition and direction
From an initially minuscule export value until the mid-1980s, exports of Nepaleseapparel increased steadily to achieve a share of more than 90 per cent of the country’stotal exports. Among overseas markets, the United States, Canada and the EuropeanUnion, were the major destinations for Nepalese apparel during the quota regime, andremain so.
Although exports of Nepalese garments to the Indian market previously appearedtrivial, that destination has shown promising indications as the share has graduallyincreased in recent years. Exports to India surged rapidly in 2005/06, passing the NRs1 billion level with a share of more than 17 per cent of total clothing exports to thatcountry. However, a downward trend in total Nepalese garment exports has becomeapparent since the last phase of quota elimination in 2004, as the value of exportsshrank by more than 34 per cent in 2004/05, compared with a year earlier. However,that trend improved slightly in 2005/06, as the loss of exports to overseas markets hasbeen replaced by exports to India (table 1).
Table 1. Apparel exports from Nepal to international markets and India(Value in NRs ‘000)
Year International % India % Total % Percentagemarkets change
in total
2000/01 11 431 246 98.34 192 100 1.65 11 623 346 100 –2001/02 7 752 296 97.31 213 500 2.68 7 965 796 100 –31.42002/03 11 613 749 96.67 399 200 3.32 12 012 949 100 + 50.82003/04 9 552 544 93.84 626 700 6.15 10 179 244 100 –15.22004/05 6 307 211 94.51 365 700 5.48 6 672 911 100 –34.42005/06 5 420 975 82.65 1 137 300 17.37 6 558 275 100 –0.017
Sources: TPC and GAN.
The share of garments in Nepal’s total national exports ranged from 11 per centto 24 per cent between 2000/01 and 2004/05, whereas its share in the total overseasexports ranged from 35 per cent to 50 per cent, indicating a dominant role in Nepal’soverseas exports only (table 2).
Regarding market access opportunities, it is relevant to consider Nepalesegarment exports to the Quad countries (the United States, European Union, Canadaand Japan) (table 3). Among them, the United States has been a prime market forNepalese apparel exports, with an annual share of exports to Quad countries rangingfrom 85 per cent to 90 per cent until the first half of the MFA period. However, theUnited States share has contracted from as high as 90 per cent in 2000/01 to 75 per

234
cent immediately after the quota phase-out, reflecting the impact of liberalization on theinternational RMG trade. In addition, the United States’ share in the post-MFA period isdeclining at a faster rate.
However, the situation has reversed in the case of the other Quad countries,where exports have increased modestly. The increase in exports to Quad countriesother than the United States is probably due to preferential market access granted bythose countries to Nepal under GSP. Exports to the European Union, in particular, havebeen encouraging, with a relatively faster growth rate and larger shares in recent years.One of the reasons for this could be that the standard European Union preferentialrules of origin have been relaxed for Nepalese garment imports since 1997. Sincethen, Nepal’s exports to European Union countries, such as the United Kingdom andFrance, have individually appeared more promising than exports to Canada andJapan. Other European Union markets such as Germany, Italy and Spain have showngood potential.
However, Nepal has not been able to utilize fully the European Union marketaccess opportunities, despite preferential market access and relaxation of the standardpreferential rules of origin. On the other hand, one of the reasons for the decline inNepal’s share in the United States market has been attributed to the absence of
Table 2. Share of apparel in overseas export and total national export of Nepal
Total Apparel Share of Total Total Share ofoverseas exports to apparel in national apparel apparel
Year exports overseas overseas export exports in total(NRs) (NRs) exports (%) (NRs) (NRs) national
exports (%)
2000/01 28 690 299 11 431 246 39.84 55 245 900 11 623 346 21.032001/02 18 409 236 7 752 296 42.00 47 386 788 7 965 796 16.812002/03 21 981 475 11 613 749 52.83 50 011 122 12 012 949 24.022003/04 20 941 661 9 552 544 45.47 53 949 414 10 179 244 18.862004/05 17 691 885 6 307 211 35.65 58 975 321 6 672 911 11.31
Sources: TPC and GAN
Table 3. Share of Nepalese garment exports to the Quad countries(Unit: Percentage)
Year United States European Union Canada Japan
2000/01 90.96 7.32 0.91 0.422001/02 85.28 12.28 0.85 0.602002/03 87.87 9.80 1.00 0.652003/04 75.58 20.48 2.18 1.002004/05 75.18 17.84 3.25 1.452005/06* 62.07 27.31 3.58 2.00
Source: Calculation based on TPC data.* First 10 months.

235
equal opportunity in the American market, as Nepal does not enjoy United Statespreferential market access. Thus, the export market for Nepal can be distinctlyclassified into preferential and non-preferential markets, thus perhaps making it desirableto develop two different marketing strategies in order to increase overall garmentexports.
With regard to export products, cotton apparel has dominated Nepal’s apparelexport composition. Nepalese exporters had managed to retain their position in cotton-based consumer items in the United States market, despite stronger competition in thisproduct category, the most popular of which were cotton-based trousers and shorts, T-shirts and vests, blouses and tops (including pullover and cardigans). However,Nepal has lost its market share of these products in the United States, despite thegrowth in imports by the United States in the first quarter of 2005. These productsactually had the highest quota utilization rates (above 90 per cent) during the quotaregime.
There is a marked difference in the composition of products exported to theUnited States and the European Union. The American market has mainly concentratedon lower-end cotton consumer items, while the European market has attracted relativelyhigh-value wool and silk-based items. Exports of cotton items to both destinations havedeclined sharply in recent years, probably due to the higher degree of competition inthe cotton category since the removal of quotas. In contrast, the European Unionmarket has been concentrating on relatively high-value woollen and silk items.
C. Challenges in the post-MFA period
1. Internal bottlenecks
Internal bottlenecks to development of the Nepalese garment subsector remainpersistent. The ability of apparel manufacturers and exporters to provide a full packagebusiness system has been constrained by the lack of physical infrastructure andlogistics in Nepal, mainly due to geographical disadvantages. Similarly, Nepalesefirms have yet to improve supply efficiency by changing the pattern of sourcingmanagement. In addition, they are affected by the unavailability of ancillary industriesand services.
Delivery efficiency is largely affected by the lack of direct access to seaportfacilities, increasing the transaction costs for Nepalese garment exports. The difficultiesfaced in the transportation of goods are inherent in Nepal’s export trade. This is evenmore problematic in the case of garment exports, as Nepalese exporters requirepayment of up to 20 per cent more in transportation costs and 50 per cent longer timesfor the delivery of goods compared to other suppliers within the region. Hence, inaddition to infrastructure problems, Nepalese garment exporters are affected by costinefficiency and longer lead-times. Another related constraint is that the possibility ofconsolidating Nepal’s garment industry through vertical integration is still being hinderedby the absence of backward and forward linkages. Resolving these constraints remainscritical to the success of efforts by the Nepalese garment subsector to overcomeexisting supply constraints and become competitive in trading without quotas.
Other major internal bottlenecks affecting the Nepalese garment sector are thescarcity of human resources and skilled labour and difficulty in gaining access to tradefinancing (both pre-shipment and post-shipment).

236
At present, however, the Nepalese garment sector is concerned more about thepolitical environment than about market access and competition affecting the interna-tional marketing.
2. External factors
Price competition was, and remains, a major external factor affecting competitive-ness of the Nepalese garment sector. However, demand for some selected items hasnot improved despite their competitive prices. This somehow suggests that the pricedifference is not a decisive factor in sourcing decisions of buyers. Thus, Nepaleseexporters should consider other factors when responding to the growing internationalcompetition.
It is also important to assess the market access issue, as the MFN systemapplies in the United States (a prime market), and preferential treatment must be facedin the European Union (the second-most important export destination). While Nepal nolonger has an equal opportunity market in the United States, it not only enjoyspreferential treatment under GSP in the European Union but also the facility ofderogation from the standard European Union GSP rules of origin. However, althoughEuropean Union preferential treatment supports improved competitiveness of Nepalesegarments due to the duty advantage, the preferential utilization rate among Nepaleseexporters still appears to be quite low. There remains ample scope for Nepaleseexporters to expand in the European Union market, as the European Union GSPscheme is applicable for an unlimited period and not subject to periodic reviews, thusproviding greater certainty of market access.
The Canadian and Japanese preferential schemes are no less valuable toNepalese apparel exporters, as both initiatives have granted duty-free and quota-freestatus to clothing, with relatively flexible rules of origin requirements. However, Nepalesegarment exporters should not depend totally on preferential market access, as themargin of preference is eroding due to reductions in average tariff rates for manufactur-ing goods internationally. In addition, the significance of preferential treatment toNepalese garment exports would largely depend on the result of the ongoing non-agricultural market access negotiations under WTO. Similarly, the relevance of the WTOHong Kong, China, commitment to duty-free and quota-free treatment for all LDCproducts would be meaningless if the scheme were to exclude most of the garmentitems under the provision of a sensitive list.
In a post-quota trade regime, Nepalese exporters are expected to face difficultiesin meeting buyers’ requirements for standards as well as the workplace code of conductthat the manufacturers have to follow. These measures have, however, not been a majorissue of concern for market access, but they must not be underestimated.. Nepalesetraders have to be able to meet such requirements by expanding their capacity, so thatthey will be able to minimize the incidence of such measures in the future.
D. Post-MFA adjustment programmes
With regard to the post-MFA situation, the Nepalese garment subsector needs toconcentrate on supply capacity as well as on strengthening their competitive edgethrough economies of scale in production and delivery efficiency. The current trendindicates that buyers’ decisions on sourcing depend not only on pricing, but also on

237
exporters being assured of supply quantity and delivery. However, this cannot beachieved without developing an infrastructure for vertical production together withconsolidation of the Nepalese clothing industry that includes delivery efficiency. TheNepalese garment subsector, under a GAN initiative, has been advocating industrialclustering through the Garment Processing Zone (GPZ) concept.
The proposed GPZ will be a specialized product-processing zone, with everytype of facility required by the clothing industry available closer to the production site. Itwill support the clustering of industries and services. The major objectives of thisprocessing zone would, among others, be consolidation of output capacity, simplificationof trade procedures, and enhancement of delivery efficiency by reducing transportationand transaction costs. However, the idea of establishing a GPZ is at a very early stage,as the Government has not yet officially endorsed it.
E. Conclusion
Among major LDC garment exporters, the end of the quota system has hitNepal the hardest. Two major factors are responsible. One is higher transaction coststhat have eroded Nepal’s competitive edge in liberal trade, which does not allowprotection from quotas. Two, Nepal has been slow to adjust to an international clothingtrade that is without a quota regime.
The end of quota system has reduced the number of garment industries andtheir export value substantially, thus having a significant impact on employment opportu-nities at large. From direct employment of more than 50,000 workers during the boomperiod, that number has fallen to approximately 10,000.
Exports to other regions, with a major portion going to the United States market,have gained a significant share of Nepal’s total garment export trade. Although apparelhas secured a prominent share of the country’s total overseas garment exports(approximately 50 per cent), its share of total national exports has not exceeded morethan 24 per cent. In 2004/05, apparel shared 11 per cent of total national exports.Interestingly, exports to India have shown an increasing trend, growing from a share ofjust 5 per cent of total in 2004/05 to more than 17 per cent in 2005/06.
The Quad country markets still important with regard to market access opportu-nities for Nepal. The United States remains a prime market even in the post-quotaregime, but its share in total exports to Quad countries is declining at an acceleratingrate, revealing a decline in the scope for marketing. Nepal no longer enjoys equalopportunity benefits in the United States, as its garment exports do not enjoy preferen-tial market access in that country. However, the European Union, Canada and Japancontinue to grant this privilege. However, compared with the European Union, Nepaleseapparel exports to Canada and Japan appear insignificant.
Exports to the European Union have shown promising signs of a smooth growthtrend in recent years. The European Union’s GSP system and the facility for derogationfrom the European Union GSP rules of origin for Nepal have supported the country’smarket diversification drive. However, preferential utilization rate by Nepalese garmentexporters to the European Union is still low. Therefore, efforts should be made toincrease the preferential utilization rate not only in the European Union market, but alsoin Canada and Japan as well as in other markets where Nepal is eligible for GSP.

238
Another problem is that of internal bottlenecks (a lack of both trade infrastructureand trade support services), which continue to be a major barrier to development. Inaddition, the difficulties created by supply-side constraints and delivery inefficiency willremain unresolved unless an initiative is taken to consolidate output and verticalproduction. This will not be possible without the Government’s assurance of capacity-building together with the ability of individual businesses to manage sourcing and thesupply chain. By giving priority to these issues, the private sector – under the auspicesof GAN – has proposed the establishment of a GPZ to the Government in order toovercome the various internal bottlenecks and raise the efficiency of the Nepalesegarment sector.
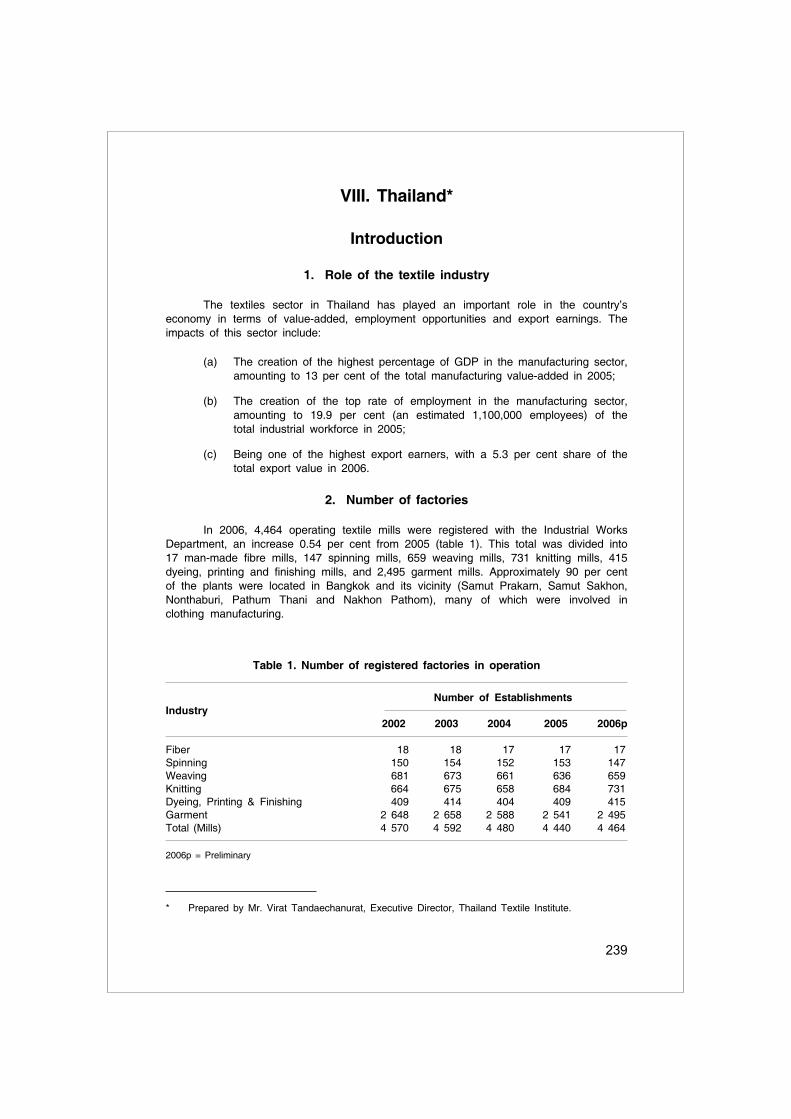
239
VIII. Thailand*
Introduction
1. Role of the textile industry
The textiles sector in Thailand has played an important role in the country’seconomy in terms of value-added, employment opportunities and export earnings. Theimpacts of this sector include:
(a) The creation of the highest percentage of GDP in the manufacturing sector,amounting to 13 per cent of the total manufacturing value-added in 2005;
(b) The creation of the top rate of employment in the manufacturing sector,amounting to 19.9 per cent (an estimated 1,100,000 employees) of thetotal industrial workforce in 2005;
(c) Being one of the highest export earners, with a 5.3 per cent share of thetotal export value in 2006.
2. Number of factories
In 2006, 4,464 operating textile mills were registered with the Industrial WorksDepartment, an increase 0.54 per cent from 2005 (table 1). This total was divided into17 man-made fibre mills, 147 spinning mills, 659 weaving mills, 731 knitting mills, 415dyeing, printing and finishing mills, and 2,495 garment mills. Approximately 90 per centof the plants were located in Bangkok and its vicinity (Samut Prakarn, Samut Sakhon,Nonthaburi, Pathum Thani and Nakhon Pathom), many of which were involved inclothing manufacturing.
Table 1. Number of registered factories in operation
Number of EstablishmentsIndustry
2002 2003 2004 2005 2006p
Fiber 18 18 17 17 17Spinning 150 154 152 153 147Weaving 681 673 661 636 659Knitting 664 675 658 684 731Dyeing, Printing & Finishing 409 414 404 409 415Garment 2 648 2 658 2 588 2 541 2 495Total (Mills) 4 570 4 592 4 480 4 440 4 464
2006p = Preliminary
* Prepared by Mr. Virat Tandaechanurat, Executive Director, Thailand Textile Institute.

240
3. Workforce
In 2006, 1,069,560 workers were employed in the textile industry, an increaseof 0.52 per cent from 2005 (table 2). Of that total, 828,880 employees (77.6 percent) were working in the clothing subsector. The man-made fibre, spinning,weaving, knitting, and dyeing, printing and finishing subsectors accounted for employ-ment rates of 1.4 per cent, 5.7 per cent, 5.2 per cent, 5.7 per cent and 4.4 per cent,respectively.
Table 2. Number of employees by subsector
Number of WorkersIndustry
2002 2003 2004 2005 2006p
Fiber 15 600 15 500 14 550 14 430 14 430Spinning 60 580 61 750 61 360 61 100 60 550Weaving 58 980 57 880 56 760 55 250 56 700Knitting 59 930 60 280 59 710 60 790 62 150Dyeing, Printing & Finishing 46 930 47 200 46 560 46 770 46 850Garment 840 850 841 520 837 680 825 650 828 880Total 1 082 870 1 084 130 1 076 620 1 063 990 1 069 560
2006p = Preliminary
4. Capacity in terms of installed machinery
By the end of 2006, a total of 3,863,850 spindles for spinning and141,220 weaving machines had been installed. The installation of knitting and sewingmachinery in knitting and clothing plants totalled 125,320 and 752,842 machines,respectively.
A. Production
1. Man-made fibres
In 2006, production of man-made fibres totalled 929,500 tons,1 an increase 2.7per cent from 2005 (see figure I). Of the total production, staple fibres accounted for547,000 tons while filament made up the remaining 382,500 tons. The principal varietiesof man-made fibres comprised polyester staple fibre, polyester filament yarn, polyesterpre-oriented yarn, nylon filament yarn, nylon pre-oriented yarn, acrylic stable fibre andrayon staple fibre.
1 References to production output in this report are in metric tons.

241
2. Yarn
Production of cotton yarn and man-made yarn in 2006 totalled 1,200,500 tons,an increase of 0.75 per cent from 2005. Of total production, cotton yarn accounted for430,000 tons while synthetic yarn made up the balance.
3. Fabric
Production of woven and knitted fabrics amounted to 510,300 tons and 264,900tons, respectively, in 2006, which was an increase of 2.7 per cent from 2005. Wovenproducts comprised cotton and man-made fabrics amounting to 238,200 tons and283,500 tons, respectively.
4. Clothing
Total production of clothing in 2006 amounted to 490,500 tons, an increase of2.7 per cent from 2005. The items comprised made from woven and knitted fabricsaccounted for 283,200 tons and 207,500 tons.
5. Overall growth rate
Overall, textile and garment production is expected to show a slower rate ofgrowth than in recent years because of strong competition in the global markets,especially with regard to lower-value products.
Textile and garment production and consumption, 2003-2006
1 200
1 000
800
600
400
200
02003 2004 2005 2006
Fibers (Production) Fibers (Consumption) Yarns (Production)
Yarns (Consumption) Fabrics (Production) Fabrics (Consumption)
Garment (Production) Garment (Consumption)
816.
8 921.
497
7.9
753.
974
6.3
698.
145
5.8
284.
6
924.
590
1.9 1
014.
874
9.3
741.
968
9.5
461.
327
8.4
905.
593
1.7 1
012.
976
2.6
755.
071
2.6
477.
629
5.5
929.
596
0.3
1 02
0.5
787.
577
5.2
727.
049
0.5
312.
41,00
0 to
ns

242
B. Consumption
1. Fibres
Domestic consumption of textile fibres totalled 960,300 tons (figure I), anincrease 3.1 per cent from 2005. Of this amount, 450,000 tons were cotton fibre and510,300 tons were man-made fibres. Of the total consumption of man-made fibres,260,500 tons were staple fibre, while 247,200 tons represented filament.
2. Yarn
Domestic consumption of 360,500 tons of cotton yarn and of 427,000 tons man-made yarn made up the total yarn consumption of 787,500 tons in 2006, an increase3.3 per cent from 2005.
3. Fabric
The consumption of fabrics in 2006 totalled 727,000 tons, an increase of 2 percent from 2005. Man-made fabrics led with 238,200 tons, followed by cotton and knittedfabrics at 220,500 and 268,300 tons, respectively.
4. Clothing
Of the total consumption of 312,400 tons of clothing, which was an increase 5.7per cent from 2005, 218,500 tons comprised woven fabrics. The remainder comprisedknitted fabrics.
C. Exports
1. Fibres
In 2006, fibre exports totalled 349,062.1 tons, worth US$ 465,930,000. Man-made fibres made up the largest proportion at 310,873.3 tons, worth US$ 446,680,000.Woollen and cotton exports amounted to 2,288.7 tons, worth US$ 13,550,000, and992.2 tons, worth US$ 820,000, respectively.
2. Yarn
Yarn exports in 2006 totalled 307,649.9 tons worth US$ 772,090,000, of whichman-made yarn and cotton yarn accounted for 253,821.8 tons, worth US$ 73,850,000,and 48,555.9 tons, worth US$ 138,760,000, respectively.
3. Fabrics
Exports of fabrics in 2006 totalled 160,460.7 tons, worth US$ 969,220,000,comprising 92,746.6 tons of man-made fabrics (US$ 522,720,000), 58,248 tons of cottonfabrics (US$ 383,440,000) and 8,503.6 tons of knitted fabrics (US$ 42,910,000).
243
4. Clothing
Clothing exports in 2006 totalled 4,401,722.8 tons, worth US$ 3,464,700,000,accounted for 58.2 per cent of the total value of textile exports in that year. Clothingmade from woven and knitted fabrics amounted to 68,426.46 tons and 4,333,296.4 tons,worth US$ 1,475,630,000, and US$ 1,989,070,000, respectively.
D. Imports
1. Fibres
Imports of textiles in 2006 totalled 502,409.6 tons, worth US$ 707,980,000.Cotton and man-made fibres accounted for 422,055.1 tons and 56,983.2 tons, worthUS$ 562 million and US$ 96.7 million, respectively. The United States was the mainsupplier of cotton fibre.
2. Yarn
Imports of yarn in 2006 amounted to 112,955.3 tons, worth US$ 420,550,000.Man-made yarn and cotton yarn amounted to 96,062.0 tons and 14,450.6 tons, worthUS$ 337,810,000 and US$ 56,940,000, respectively.
The major cotton yarn suppliers are China, Pakistan, the Republic of Korea,India, Taiwan Province of China, Japan and France. Japan is the principal supplier ofman-made yarn, followed by Taiwan Province of China, Indonesia, the Republic ofKorea, China and the United States.
3. Fabrics
Fabrics comprised the highest portion of total textile product imports (34.3 percent) in 2006, amounting to 132,199.1 tons, worth US$ 687.5 million. Of that, man-madefabrics accounted for 70,899.5 tons worth US$ 306,730,000. Cotton and knitted fabricsamounted to 47,572.2 tons and 11,220.1 tons, worth US$ 264,950,000 and US$67,130,000, respectively.
Hong Kong, China followed by Japan, China, the Republic of Korea, TaiwanProvince of China, Singapore, India and Pakistan are the main suppliers of cottonfabrics. The main suppliers of man-made fabrics are China, Taiwan Province of China,the Republic of Korea, Japan and Indonesia. Knitted fabric suppliers are TaiwanProvince of China, Hong Kong, China, the Republic of Korea, Japan and China.
4. Clothing
Imports of clothing in 2006 totalled 16,180.3 tons, worth US$ 173,350,000. Ofthose amounts, clothing made from woven and knitted fabrics accounted for 7,352.3tons and 8,828.1 tons, worth US$ 113.7 million and US$ 61,660,000, respectively.
E. Problems
Although Thailand’s textile sector has been growing rapidly and has become thecountry’s leading industry, it is still facing the following problems:

244
(a) Most exported textile products are commodity types that are subject tofierce competition and which attract lower prices;
(b) The lack of product variety and quality, due to the shortage of skilledtechnical manpower and state-of-the-art technology;
(c) The loss of its competitive advantage to lower cost countries, especiallywith regard to the labour wage rate. Currently, the comparatively higherwage rate in the Thai textile industry is pushing up the cost of production;
(d) Few or no research and development activities and a lack of testingfacilities for basic quality control in factories;
(e) Reliance to a large degree on raw material imports (such as high-qualityfabrics and yarn).
F. Opportunities
Although the Thai textile sector is still experiencing some constraints, thepotential remains for investment that will to serve local and export demands as:
(a) Wage levels in the Thai textile sector still offer an advantage overcountries/areas with a more developed textile industry such as the Republicof Korea, Hong Kong, China, and Taiwan Province of China. AlthoughThailand may be at a disadvantage compared to lower-cost countries, theThai textile workforce is still comparatively more efficient, especially interms of skilled labour;
(b) There are still opportunities for the Thai textile sector to expand its exportsfrom the quota markets (such as the United States and the EuropeanUnion) to non-quota markets and other new markets such as Indochina(the Lao People’s Democratic Republic, Cambodia and Viet Nam),Myanmar and Eastern Europe (such as Poland and the Russian Federa-tion). Indochina and Myanmar, in particularly apart from serving as ourmarket.
(c) Reductions in tariffs and other barriers based on the ASEAN Free TradeAgreement and the GATT/WTO Agreement will enable further expansion ofinvestment and trading in textiles and garments.
G. Development policy guidelines
Following the removal of quotas in 2005, policy guidelines for the development ofthe Thai textile and garment sector were defined in a master plan. The main points ofthe master plan are summarised below:
(a) Increase competitiveness by –
(i) Improving productivity through the introduction of the latest technology(including machinery);
(ii) Upgrading manpower skills and introducing modern management;
245
(iii) Moving towards higher-value added products with a “Bangkok FashionCity” project;
(iv) Upgrading product quality and standards;
(v) Promoting foreign investment;
(vi) Encouraging Thai textile businesses to invest abroad.
(b) Decentralize the textile and clothing industry, especially small and medium-sized enterprises, to rural areas;
(c) Concentrate on environmental and natural resources conservation throughthe introduction of new technology, in order to save raw materials, waterand energy.
(d) Penetration of traditional and new markets by introducing a more aggres-sive marketing strategy.

246

Printed in BangkokMay 2008 – 400
United Nations publicationSales No. E.08.II.F.17Copyright © United Nations 2008All rights reservedManufactured in ThailandISBN: 978-92-1-120550-3ST/ESCAP/2500

RtiC
UP
UN
VE
ILING
PR
OTE
CTIO
NIS
M:
Reg
ion
al Resp
on
ses to R
emain
ing
Barriers in
the T
extiles and
Clo
thin
g T
rade