unsupervised learning for detecting clusters of interest ... · unsupervised learning for detecting...
TRANSCRIPT
Unsupervised Learningfor Detecting Clusters of
Interest Within TextThomas Dale
Computing BScSession 2010/2011
'
&
$
%
The candidate confirms that the work submitted is their own and the appropriate credit hasbeen given where reference has been made to the work of others.
I understand that failure to attribute material which is obtained from another source may beconsidered as plagiarism.
(Signature of student)
i

Motivation
The motivation for this project stems from counter terrorism. Terrorists are increasingly us-
ing electronic devices such as mobile phones and laptops utilising the internet as a means of
communication. This could be to inform one another of how to make bombs, or coordinating
specific attacks such as the 2005 July 7 bombings in London [1] and the attacks across America
on September 11th 2001 [2].
Counter terrorist agencies need to sift through large amounts of data in the form of emails
and texts. Most of this data is often irrelevant so the problem is trying to identify the relevant
parts. Without the correct methodology the counter terrorist agencies could spend the majority
of their time and money on ciphering through the data rather than actually analyzing the data
that is relevant and so a way of quickly identifying which texts are relevant is needed. Text
classification can assist counter terrorism by providing tools to detect the texts that are relevant.
My aim was, given the dataset specified in this project, attempt to classify a subset of that
dataset, using an unsupervised approach.
ii

Acknowledgements
I would like to thank my supervisor Haiko Muller for guiding me through the project. I would
like to thank Eric Atwell for his useful advice and suggestions and Claire Brierley for her insight
to the various NLP techniques used in this project and advice in the group meetings. My family
for their support. All of the people in the dec10 and Eniac labs for making the many hours
spent there bearable. I would also like to thank my girlfriend Clare for her continuous support
and motivation, and for proof reading the final project. Thanks everyone!
iii

Contents
1 Introduction 1
1.1 Aim . . . . . . . . . . . . . . . . . . . . . . . . . . . . . . . . . . . . . . . . . . . 1
1.2 Objectives . . . . . . . . . . . . . . . . . . . . . . . . . . . . . . . . . . . . . . . . 1
1.3 Minimum Requirements . . . . . . . . . . . . . . . . . . . . . . . . . . . . . . . . 1
1.4 Extensions . . . . . . . . . . . . . . . . . . . . . . . . . . . . . . . . . . . . . . . . 2
2 Literature Review 3
2.1 Data . . . . . . . . . . . . . . . . . . . . . . . . . . . . . . . . . . . . . . . . . . . 3
2.1.1 The Quran . . . . . . . . . . . . . . . . . . . . . . . . . . . . . . . . . . . 3
2.1.2 20 Newsgroups dataset . . . . . . . . . . . . . . . . . . . . . . . . . . . . . 4
2.1.3 Other data . . . . . . . . . . . . . . . . . . . . . . . . . . . . . . . . . . . 4
2.2 Machine Learning . . . . . . . . . . . . . . . . . . . . . . . . . . . . . . . . . . . . 4
2.2.1 Supervised Machine Learning . . . . . . . . . . . . . . . . . . . . . . . . . 5
2.2.2 Unsupervised Learning . . . . . . . . . . . . . . . . . . . . . . . . . . . . . 5
2.2.3 Semi-Supervised Learning . . . . . . . . . . . . . . . . . . . . . . . . . . . 6
2.3 Tools . . . . . . . . . . . . . . . . . . . . . . . . . . . . . . . . . . . . . . . . . . . 6
2.3.1 NLTK . . . . . . . . . . . . . . . . . . . . . . . . . . . . . . . . . . . . . . 6
2.3.2 Weka . . . . . . . . . . . . . . . . . . . . . . . . . . . . . . . . . . . . . . 8
2.3.3 WordNet . . . . . . . . . . . . . . . . . . . . . . . . . . . . . . . . . . . . 8
2.4 Feature Selection . . . . . . . . . . . . . . . . . . . . . . . . . . . . . . . . . . . . 9
2.4.1 Document Frequency . . . . . . . . . . . . . . . . . . . . . . . . . . . . . . 9
2.4.2 Term Strength . . . . . . . . . . . . . . . . . . . . . . . . . . . . . . . . . 9
2.4.3 Bigrams . . . . . . . . . . . . . . . . . . . . . . . . . . . . . . . . . . . . . 10
2.4.4 Bag-of-words . . . . . . . . . . . . . . . . . . . . . . . . . . . . . . . . . . 10
2.5 Evaluation Methods . . . . . . . . . . . . . . . . . . . . . . . . . . . . . . . . . . 10
3 Project Management 12
3.1 Schedule . . . . . . . . . . . . . . . . . . . . . . . . . . . . . . . . . . . . . . . . . 12
3.2 Initial Plan . . . . . . . . . . . . . . . . . . . . . . . . . . . . . . . . . . . . . . . 12
3.2.1 Stages . . . . . . . . . . . . . . . . . . . . . . . . . . . . . . . . . . . . . . 12
3.2.2 Stage One - Background reading . . . . . . . . . . . . . . . . . . . . . . . 13
iv

3.2.3 Stage Two - Design and Implementation . . . . . . . . . . . . . . . . . . . 13
3.2.4 Stage Three - Evaluation . . . . . . . . . . . . . . . . . . . . . . . . . . . 14
3.2.5 Stage Four - Write Up . . . . . . . . . . . . . . . . . . . . . . . . . . . . . 14
3.3 Revisions . . . . . . . . . . . . . . . . . . . . . . . . . . . . . . . . . . . . . . . . 15
3.4 Revised Plan . . . . . . . . . . . . . . . . . . . . . . . . . . . . . . . . . . . . . . 16
3.4.1 Stage Two - Design and Implementation - Iteration 1 . . . . . . . . . . . 16
3.4.2 Final Revised Plan . . . . . . . . . . . . . . . . . . . . . . . . . . . . . . . 17
3.4.3 Stage Two - Design and Implementation - Iteration 2 . . . . . . . . . . . 17
3.5 Real Schedule . . . . . . . . . . . . . . . . . . . . . . . . . . . . . . . . . . . . . . 18
4 Design Choices 19
4.1 Data . . . . . . . . . . . . . . . . . . . . . . . . . . . . . . . . . . . . . . . . . . . 19
4.2 Unsupervised Learning Approach . . . . . . . . . . . . . . . . . . . . . . . . . . . 19
4.3 Features . . . . . . . . . . . . . . . . . . . . . . . . . . . . . . . . . . . . . . . . . 20
4.3.1 Common Word Frequencies . . . . . . . . . . . . . . . . . . . . . . . . . . 20
4.3.2 Bi-grams . . . . . . . . . . . . . . . . . . . . . . . . . . . . . . . . . . . . 20
4.4 Weka . . . . . . . . . . . . . . . . . . . . . . . . . . . . . . . . . . . . . . . . . . . 21
4.5 NLTK . . . . . . . . . . . . . . . . . . . . . . . . . . . . . . . . . . . . . . . . . . 21
4.6 Choice of clustering algorithms. . . . . . . . . . . . . . . . . . . . . . . . . . . . . 22
4.6.1 K-means . . . . . . . . . . . . . . . . . . . . . . . . . . . . . . . . . . . . . 22
4.6.2 X-means . . . . . . . . . . . . . . . . . . . . . . . . . . . . . . . . . . . . . 23
4.6.3 EM Algorithm . . . . . . . . . . . . . . . . . . . . . . . . . . . . . . . . . 23
5 Methodology 24
5.1 Software Development Methodology . . . . . . . . . . . . . . . . . . . . . . . . . 24
5.2 Evidence of Methodology . . . . . . . . . . . . . . . . . . . . . . . . . . . . . . . 25
5.3 Choice of programming language . . . . . . . . . . . . . . . . . . . . . . . . . . . 26
6 Implementation 28
6.1 Step One - Pre-processing . . . . . . . . . . . . . . . . . . . . . . . . . . . . . . . 29
6.2 Step Two - Generating Word/Bi-gram Frequencies . . . . . . . . . . . . . . . . . 30
6.2.1 Word Frequencies . . . . . . . . . . . . . . . . . . . . . . . . . . . . . . . . 30
6.2.2 Bi-gram Frequencies . . . . . . . . . . . . . . . . . . . . . . . . . . . . . . 30
6.3 Step Three - Generating an Arff File . . . . . . . . . . . . . . . . . . . . . . . . 31
6.4 Step Four - Using Weka for Clustering . . . . . . . . . . . . . . . . . . . . . . . . 32
6.5 Step Five - Evaluation of Clusters . . . . . . . . . . . . . . . . . . . . . . . . . . 33
7 Evaluation 34
7.1 Overview . . . . . . . . . . . . . . . . . . . . . . . . . . . . . . . . . . . . . . . . 34
7.2 Aim, Objective and Minimum Requirements Evaluation . . . . . . . . . . . . . . 34
7.2.1 Aim . . . . . . . . . . . . . . . . . . . . . . . . . . . . . . . . . . . . . . . 34
v

7.2.2 Objectives . . . . . . . . . . . . . . . . . . . . . . . . . . . . . . . . . . . . 34
7.2.3 Minimum Requirements . . . . . . . . . . . . . . . . . . . . . . . . . . . . 34
7.3 Experimental Setup . . . . . . . . . . . . . . . . . . . . . . . . . . . . . . . . . . 35
7.3.1 Iteration One . . . . . . . . . . . . . . . . . . . . . . . . . . . . . . . . . . 35
7.3.2 Iteration Two . . . . . . . . . . . . . . . . . . . . . . . . . . . . . . . . . . 36
7.4 Evaluation of Results . . . . . . . . . . . . . . . . . . . . . . . . . . . . . . . . . . 36
7.4.1 Evaluation of Results from Iteration One . . . . . . . . . . . . . . . . . . 36
7.4.2 Evaluation of Results from Iteration Two . . . . . . . . . . . . . . . . . . 37
7.5 Evaluation of Unsupervised Learning . . . . . . . . . . . . . . . . . . . . . . . . . 37
7.6 Further Work . . . . . . . . . . . . . . . . . . . . . . . . . . . . . . . . . . . . . . 38
8 Bibliography 42
Appendices 47
A Reflection 47
B Example Weka Output 49
vi

Chapter 1
Introduction
1.1 Aim
Dr Eric Atwell proposed the final year project ‘Detecting Suspicious Texts’. The aim was to
detect suspicious emails/phone transcripts for intelligence agents. This project would require
access to emails and transcripts that are not in the public domain so it would be unsuitable
to use these for a final year project. This is due to the nature of the data being classified and
protected by data protection laws. The dataset used for this project would therefore have to
be freely available and publicly accessible. The process of detecting suspicious texts can be
generalised to detecting ‘interesting’ verses in the Quran. The Quran will be used because at
Leeds University there is a Quran data set available, which can be provided by the NLP group.
The aim is to use an unsupervised learning clusterer that can classify verses in the Quran into
verses that are of interest to a particular topic, for example “Resurection Day”.
1.2 Objectives
1. Use either Weka or NLTK to pre-process the data.
2. Develop a program that can create an arff file from data set.
3. Use Weka to cluster the data.
4. Analysis of the clusters to see how successful the clustering is.
1.3 Minimum Requirements
The minimum requirements for the project are:
1. A system that utilizes unsupervised learning methods for classifying English language
Quran verses.
1
2. Software that can convert part of one data set into a .arff file for use with Weka.
3. Use of one set of features to use with clustering algorithms
4. Use of Weka to implement the clusterer.
1.4 Extensions
Possible Extensions include:
1. Use of more than one set of features to use with clustering algorithms
2. Perform the clustering on the 20 newsgroups dataset.
2

Chapter 2
Literature Review
2.1 Data
Two methods for gaining the data are apparent. The first would be to create a dataset of
suspicious emails manually by typing out documents that simulate terrorist emails and texts.
Or using existing readily available datasets which are similar to a set of emails or texts, in
that they contain specific themes which are associated with each individual instance. The
former would take a significant amount of time to produce and would not give a very accurate
representation of a suspicious text due to its artificial nature. Therefore the latter method will
be used to gain the dataset. A number of datasets have been identified. These will be presented
below.
2.1.1 The Quran
The Quran is partitioned into chapters and verses with each verse associated with a theme.
Specifically, there are verses that Quranic scholars have agreed relate to “Resurection Day”.
The classifier could focus on trying to detect these verses. This dataset is freely available to
download in text format with the chapters and verse numbers ranked in order. The source
of this data is gained from [16] and the classification of the ”The Resurection” themed verses
are gained from a text document created by Claire Brierley, a senior researcher from The
University of Leeds Natural Language Processing Group. She used the Leeds Qurany Ontology
Browser [17] (which allows you to search for concepts in the Quran) to find the verses that
relate to “Resurection Day”, she then used this infomation to make a text file containing those
verses. The data is split into two sets. The All Quran is a .txt file containing each verse of
the Quran delimitated by line and SubsetQuran is a .txt file containing the verses that relate
to “Resurection Day” delimitated by line. These files have been extracted from a website and
so contain characters that are not of interest such as punctuation and unnecessary quotation
marks. Therefore the data will have to be pre-proccesed to remove such characters.
3
2.1.2 20 Newsgroups dataset
Usenet is a computer network communication system originally conceived in 1979. Users post
articles to Usenet and the articles are accessible to people who have access to the usenet server
that the article was posted to. The articles that are posted are organised into categories called
Newsgroups. The articles theme is known by the newsgroup name. A dataset could be gained
from newsgroups and the classifier could look at detecting specific themes. [3],[14] and [8] used
newsgroup data from the WebKB project in order to evaluate their clustering algorithm. The
WebKB project aims to make a symbolic knowledge base that mirrors the content of the web.
It uses a collection of datasets, one of these datasets is named “20 Newsgroups DataSet”, which
is available from the WebKB Website [24]. This data contains 20,000 messages collected from
20 different Usenet newsgroups. 1000 messages from each of the twenty newsgroups were chosen
at random and the data is partitioned by newsgroup name. This dataset is ideal for working
with classifiers as it contains articles where the theme of the article is known by the newgroup
name. Again, this dataset would have to be pre-processed in order to get rid of the irrelevant
characters.
2.1.3 Other data
A number of other less relevant datasets have also been identified. These include; looking at
short English fairytales and trying to identify the main themes within each chapter, this would
not be realistic as there are no known set of fairytales with their chapters marked according to
theme. Shakespearian novels such as Romeo and Juliette could also be used, these are freely
available online. These books have multiple themes per chapter and so would not be suitable
for a classification algorithm that wants to look for just one theme.
The datasets that will be used in this project will be the Quranic and the 20 newsgroups.
Initially the Quranic data set will be used. This is a relatively small dataset so it should not
take long to pre process, cluster and then analyse the results. Then, if there is enough time left,
the newsgroups from the WebKB project will be used after the classification has been run on
the Quran. This is a much bigger collection of texts and so holds greater generalisation to a real
classification problem such as detecting terrorist emails, however it may take slightly longer to
pre process and pass the data through the classifier due to the size of the data.
The problem of classifying suspicious emails can be generalised to detecting relevant themes
within a data set. We can use machine learning to try to tackle this problem. Machine Learning
algorithms can be used to predict classification and to cluster texts into distinct categories [4].
2.2 Machine Learning
Machine learning algorithms can be used to predict classification and to cluster texts into
categories [4]. One use for machine learning is text classification. This is where the algorithm
learns how to classify a text or parts of a text into certain categories based on previously
4
known examples. If training instances are availible an algorithm for text classification is trained
on the input of a set of training instances with or without the features of interest marked.
The algorithm will learn from the input and can then predict the classification of new, unseen
instances of the text [4]. Three paradigms of machine learning algorithms for text classification
can be observed. supervised, semi-supervised and un-supervised.
2.2.1 Supervised Machine Learning
Supervised machine learning is summarised as:
“The goal of supervised learning is to build an artificial system that can learn the mapping
between the input and the output, and can predict the output of the system given new inputs.
If the output takes a finite set of discrete values that indicate the class labels of the input, the
learned mapping leads to the classification of the input data” [5].
Typically a supervised machine learning algorithm will have labelled training data, it will use
this to train a model that can predict the classification of new unseen data that does not contain
labels. The main advantage of the supervised learning paradigm is that it produces output that
is meaningful to humans [5]. In terms of disadvantages, it is said that the more training data you
have the more accurate your classifier will be [6] and so if you want a relatively good classifier
you will need to spend lots of time and money developing a corpus that is large enough to yield
a high classification accuracy.
2.2.2 Unsupervised Learning
Unsupervised learning tries to learn the natural classes within data, without using labelled ex-
amples. Typically the data does not have pre-defined categories.
Clustering is an example of unsupervised learning. A typical clustering algorithm will try to
find the natural divisions in an unlabeled data set, typicaly by optimizing an objective function
that characterizes good partitions [7]. In text clustering a text is often represented as a bag of
words across all documents in the collection. This means that for each document, the number
of times that a word occurs from the whole document collection is counted. The problem with
this is that most of the documents do not contain all of the words across the whole document
collection, so there is often an issue of data sparseness. This can affect the performance of
clustering algorithms [14] and so it is desirable to reduce this sparseness. The article [13] lists
many clustering algorithms that can be applied to various different classification tasks. [3] used
unsupervised clustering for thematic text segmentation. Thematic text segmentation is a sim-
ilar problem to text classification in that they both try to categorise data, however thematic
segmentation is more the problem of trying to systematically identify all of the themes within
documents. Whereas text classification is focused on trying to classify whether a given text
belongs to a certain category.
5
[3] Used the X-means clustering algorithm, which is an extension of the popular K-means
algorithm in order to cluster words from the articles. [8] Defines the k means algorithm as
“A clustering algorithm based on iterative relocation that partitions a dataset into K clusters,
locally minimizing the average squared distance between data points and the cluster centers”
The clusters gained by the X-means algorithm in [3] each contain terms that relate to a specific
concept. Documents are then segmented by concept based on how many occurrences of these
terms occur within a given article. Often, data is not labelled by theme or concept and labelling
data like this is often time consuming and very expensive as it requires someone to be paid to
manually mark each data item by theme. Therefore the main advantage of unsupervised learning
for text classification is that it can be used when the dataset does not contain any labels.
2.2.3 Semi-Supervised Learning
Semi Supervised Learning tries to bridge the gap between supervised and unsupervised learning.
Semi-supervised learning combines typically a small amount of labelled and a large amount of
unlabeled data during training in order to increase the performance of the classifier or clusterer.
In a semi-supervised clustering algorithm, the small amount of labelled data can be used to
generate“seed clusters” that initialize the clustering algorithm. Constraints which are learned
for the labelled data can be used in order to guide the clustering process. Furthermore, if the
labelled data doesnt contain all of the categories of a given text, the semi supervised clustering
can extend the existing set of categories as needed to reflect other regularities in the data [7].
2.3 Tools
In order to implement an unsupervised learning method for classifying the data sets. A number
of tools can be used.
With text classification one of the main stages is pre-processing of the data. This has to be
done automatically and so requires a programming language that allows quick use of general
purpose tools which can be used to manipulate the data. The language should be easy to use
and should have good string manipulation capabilities because the data in a corpus is often
easiest represented as a string. Python is an interpreted programming language with lots of
libraries that can be used to support natural language processing. It has a shallow learning
curve, its syntax and semantics are transparent and it has good string handling functionality
as well as external modules such as NLTK (See section 2.3.1) which are used for NLP tasks [8].
See section 5.3 for choice of programming language.
2.3.1 NLTK
NLTK - Natural Language Tool Kit, is a collection of open source Python modules. It was
developed in 2001 as part of a computational Linguistics course in the Department of Computer
and Information Science at the University of Pennsylvania [8].
6
It was designed with four primary goals in mind [8]:
Simplicity: To provide an intuitive framework along with substantial building blocks, giving
users a practical knowledge of NLP without getting bogged down in the tedious house-keeping
usually associated with processing annotated language data.
Consistency: To provide a uniform framework with consistent interfaces and data structures,
and easily-guessable method names.
Extensibility: To provide a structure into which new software modules can be easily accommo-
dated, including alternative implementations and competing approaches to the same task.
Modularity: To provide components that can be used independently without needing to under-
stand the rest of the toolkit.
The NLTK contains modules that can help with the task of pre-processing the data sets that
will be used with our clusterer. These include stemmers, which enable us to remove the mor-
phological affixes from words to leave the root of a word. It also includes a library of stop words
which can be used to get rid of words in the Quranic dataset that have little relevance in terms
of helping to classify verses into themes. An example of stop words are ‘the’ and ‘and’.
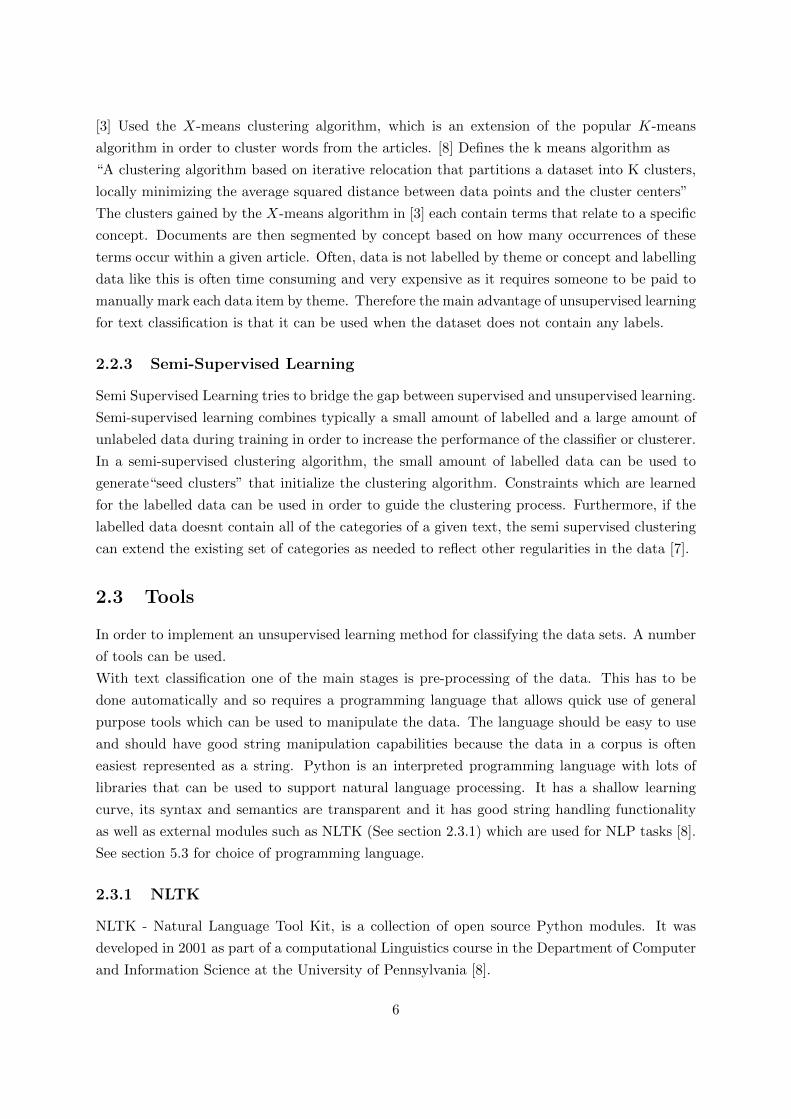
The NLTK also has support for clustering in the form of modules contained within it. It contains
a K-Means Clusterer, a E-M clusterer and a group average agglomerative clusterer.
The NLTK API (application programming interface) documentation [9] describes the three clus-
terers as the following:
‘The k-means cluster starts with k arbitrary means then allocates each feature to the cluster
with the closest mean, it then recalculates the means of each cluster as the centroid of the
vectors in the cluster. This Process repeats until the cluster memberships stabilise.’
‘The GAAC clusterer starts with each of the N vectors as singleton clusters. It then Iteratively
merges pairs of clusters which have the closest centroids. This continues until there is only one
cluster. The order of merges gives rise to a dendogram a tree with the earlier merges lower
than the later merges. The membership of a given number of clusrers c, 1 ¡= c ¡= N, can be
found by cutting the dendrogram at depth c.’
‘The Gaussian EM clusterer models the vectors as being produced by a mixture of k Gaussian
sources. The parameters of these sources (prior probability, mean and covariance matrix) are
then found to maximise the likelihood of the given data. This is done with the expectation
maximisation algorithm. It starts with k arbitrarily chosen means, priors and covariance matri-
ces. It then calculates the membership probabilities for each vector in each of the clusters - this
7

is the ’E’ step. The cluster parameters are then updated in the ’M’ step using the maximum
likelihood estimate from the cluster membership probabilities. This process continues until the
likelihood of the data does not significantly increase.’
NLTK is not the only software to include clustering algorithms. The Weka toolkit also contains
various clustering algorithms, along with the capabilities to pre-process data.
2.3.2 Weka
Weka - The Waikato Environment for Knowledge Analysis [10] is a comprehensive, cross plat-
form suite of Java class libraries that contain various state-of-the-art machine learning algo-
rithms. It has a graphical user interface that allows the user to perform the various stages
within a data mining process.
Often in a machine learning situation we face the problem of pre-processing the data so that it
can be read into a machine learning algorithm. The data is often very noisy and contains a lot of
irrelevant data such as punctuation, words that are spelt wrong amongst other charecters that
do not carry meaning. The aim is to reduce the data to that that is relevant. The process of
cleaning the data so that it is readable by a machine can take lots of time and effort so efficient
methods for cleaning the data are needed. Weka contains pre-processing capabilities. These are
called ‘filters’ in Weka and they enable the data to be processed at instance or attribute level.
In order for machine learning to be performed in Weka, the dataset needs to be represented in
a format that it can process. This format is the attribute-relation file format - Arff. In this
format the relevant features of the dataset are encoded into @attribute sections of the Arff file
(See section 6.3 for more information on Arff files). The file then specifies how many instances
of data are being considered by representing each one as a line after the @Data title. Each line
is typically represented like this [11]:
Sunny, 85, 85, false, no
Where each of the comma separated values map to one of the features in the @attribute section
of the Arff file. In this example the data represents outlook, temperature, humidity, wind and
whether or not to play.
The attributes are the features that have been selected from the dataset which represent the
data that has been deemed relevant to training the model. The Arff file is then used with
machine learning algorithms to classify or cluster each instance of the data. The problem is
then deciding on the features which should be used to train the model.
2.3.3 WordNet
WorldNet is a large lexical database of English (available at http://wordnet.princeton.edu/),
it contains synonyms grouped together into “Synsets” each with distinct concepts. “These
8

groups of synsets are interlinked by conceptual-semantic and lexical relations” [22]. These links
can be used to improve background knowledge of a dataset. A.Hotho et al [15] found that
WordNet improves text document clustering by using synsets to find words that do not occur
in the document but were part of a synset that contained the original word. This then helped
the clustering algorithms find siumilarities that would not have been found had there not been
some kind of background knowledge. However [23] found that WordNet does not help document
clustering if used as a means of finding word similarity.
2.4 Feature Selection
Feature Selection is an important stage in any classification task. There already exists large
amounts of research into Feature Selection. Previous research seems to suggest that in text
classification there are numerous potential features that can be selected and the choice and
quantity of these determines the accuracy of the classification. G. Forman [19] found that the
number of features included determines to a certain extent the classification accuracy of support
vector machines and naive bayes learning algorithms. He found that there is a point where the
number of features for both algorithms will not produce an increase in accuracy, but rather it
will decrease the accuracy.
[14] Defines feature selection as “a process that chooses a subset from the original feature set
according to some criterions. The selected feature retains original physical meaning and provides
a better understanding for the data and learning process” So it can be said that the selection of
features influences the learning of the algorithm, and so the goal is to select features that will
best capture the infomation that is required from the dataset.
2.4.1 Document Frequency
There are a number of already existing feature selection algorithms which are used. Docu-
ment Frequency is an algorithm where the number of documents in which a term occurs in a
dataset is counted. The highest frequency terms are deemed the most relevant and are therefore
used as features. This is a relatively simple algorithm and scales to large datasets with linear
computational complexity [14].
2.4.2 Term Strength
Term Strength is an algorithm which measures the strength of each term.[14] “This is based on
the conditional probability that a term occurs in the second half of a pair of related documents
given that it occurs in the first half.” It can be used with text clustering because the class label
information is not required.
9

2.4.3 Bigrams
Bi-grams have been used as features in classification tasks. B.Pang et al [20] found that in a
study using Bi-grams to capture more context of a sentence in a document classification task.
The use of Bi-grams in general does not increase or decrease the accuracy of machine learning
algorithms that classify text. Claire Brierley of the Natural Language Research Group at leeds
University found in her experiment on the Arabic corpus that bigrams improved the accuracy
of her classifier that aimed to detect ”Resurection day” themed verses from the Quran.
2.4.4 Bag-of-words
A simple way of representing a document is to use the bag-of-words approach which uses each
of the words that occur in the document as features on their own. A.Hotho [15] found that
document clustering using a simple bag-of-words approach can be unsatisfactory as they ignore
relationships between important terms that dont co-occur literally . To overcome this problem
background knowledge can be used in order to group documents that relate but dont use
exactly the same terminology [15]. This background knowledge could be in the form of a lexical
database. (See WordNet Section 2.3.3)
2.5 Evaluation Methods
The choice of evaluation measure is important as it is the only way to tell how successfull our
classification has been. To evaluate the project various methods could be used. One option
could be to evaluate using precision and recall similar to the evaluation methods used in [3].
This study used 3 measures to evaluate the success of their clustering algorithms:
• The number of paragraphs correctly assigned to c.
• The number of paragraphs incorrectly assigned to c.
• The number of paragraphs incorrectly not assigned to c.
These three measures were used to evaluate the precision and recall of the algorithm and con-
clusions were then drawn on the success of the algorithm. These methods could be used in this
project in order to evaluate the accuracy of the Weka clusterers with the Quranic dataset and
if time permits, the 20 newsgroups dataset.
Another approach could be to evaluate the clusters similar to Hughes and Atwell [21] This study
attempted to cluster the LOB Corpus words into grammatical clusters, then the clusters were
compared to the Tagged LOB Corpus PoS-tag classification. For each cluster, the majority
class was calculated as the class which occurred the most in each cluster. A success rate is then
calculated on each cluster as the percentage of instances in a cluster that belong to the majority
10

class of that cluster.
There are other projects that are being developed alongside this project that are using the
Quranic dataset to try to classify the “Resurection Day” themed verses. Albeit in a different
way, using supervised classification algorithms. Due to the nature of supervised learning, these
projects are expected to gain a higher accuracy of classifier to an unsupervised method. These
projects could be compared to mine as another means of evaluation.
11

Chapter 3
Project Management
This section describes how the project was managed from start to finish. An initial plan was
made at the start of the project. As the project progressed this section was updated to show
the changes that occured. It is designed to show the reader the key stages in the project and
when they occurred.
3.1 Schedule
The project started on 24/01/2011 and the deadline for the submission of the final report was
11/05/2011. This meant that the total number of weeks for the project was 16. I came up with
an initial project plan by the end of the second week. As the project progressed amendments
needeed to be made to the original plan as the research stage revealed the tools that would be
used and the software that needed to be written in the implementation stage. Amendments
also needed to be made to the Design and Implementation sections as results from the initial
experiments lead to additional features and experiments being added. The details of the original
project plan and the stages involved within the project aswell as the amendments made to the
Design and Implementation stage are outlined below.
I will use Activity Diagrams instead of Gantt Charts as I believe that they give a clear rep-
resentation of the tasks involved at each stage in the project. There is overlap between the
evaluation and the write up stage as the final write up was started during the evaluation stage.
3.2 Initial Plan
3.2.1 Stages
1. Background Reading
Time allowed for completion: 6 Weeks.
2. Design and Implementation
Time allowed for completion: 5 Weeks
12

3. Evaluation
Time allowed for completion: 3 Weeks
4. Write up of report
Time allowed for completion: 4 Weeks
3.2.2 Stage One - Background reading
The first stage began on the 24/01/2011 and ended on the 07/03/2011 with a duration of six
weeks. The stage focused on understanding the problem and reading relevant research and
investigating the tools needed to tackle the problem. Weekly group meetings were scheduled to
collaborate on background reading. (See Figure 3.1 for Activity Diagram). During this stage
there were a number of other time consuming factors that occured. One of them was to give
a short 15 minute presentation on an academic paper that related to my final year project.
There was also a series of ethics lectures that aimed at making us aware of the Ethical issues
associated with our projects.
Main Activities
• Background Research
• Presentation on academic paper
• Aim and Minimum Requirements
• Decide on datasets to be used
• Mid Project Report
3.2.3 Stage Two - Design and Implementation
The second stage involved the design and implementation of the project. This began on
07/03/2011 and ended on 11/04/2011. The stage focused on designing the software. The
implementation of the software and an evaluation plan. At the time of writing the initial plan,
it was not clear what software tools would be used and so a precise breakdown of the implemen-
tation stages was not given. A further breakdown of the implementation stage will be shown
after the revision section (see section 3.4.1).
Main Activities
• System Design
• Implementation of System
• Plan of Evaluation
13

Figure 3.1: Breakdown of Stage One.
3.2.4 Stage Three - Evaluation
This stage began on 11/04/2011 and ended on the 02/05/2011. It involved producing output
from the system and evaluating the results of the system (see Figure 3.3 for Activity Diagram).
Main Activities
• Produce Output of System
• Analysis of Results
• Evaluate System
3.2.5 Stage Four - Write Up
This stage began on 18/04/2011 and ended 12/05/2011. It involved the final write up of the
report and reflection of the project and the lessons learnt during the project (ee Figure 3.4 for
Activity Diagram).
Main Activities
• Write-up of final Report (Deadline 12/05/2011)
• Reflection
14

Figure 3.2: Breakdown of Stage Two.
Figure 3.3: Breakdown of Stage Three.
Figure 3.4: Breakdown of Stage Four.
3.3 Revisions
The original Design and Implementation stage was deliberately vague because at the time it
was not known what tools would be used or what software would need to be produced. A
15

further plan was made when it was clear what tools and software would be needed to produce
a solution. It was expected that the Design and Implementation stage would evolve iteratively
based on analysis of the first set of results. The details of the revisions and the first iteration
of the plan are shown below. See table 7.1 for details of the results to the first iteration.
3.4 Revised Plan
This illustrates the revised project plan. Revisions have been made to the second stage of the
plan as mentioned previously. (See figure 3.5 for Activity Diagram)
3.4.1 Stage Two - Design and Implementation - Iteration 1
Main Activities
• Create a program that pre-processes the data.
• Create a program that counts the highest frequency words in the Quran.
• Create a program that converts data to arff file.
• Use Weka to implement clustering algorithms on the data.
• Create a program that evaluates the clustering of the data.
Figure 3.5: Revised Stage Two - Iteration 1.
16
3.4.2 Final Revised Plan
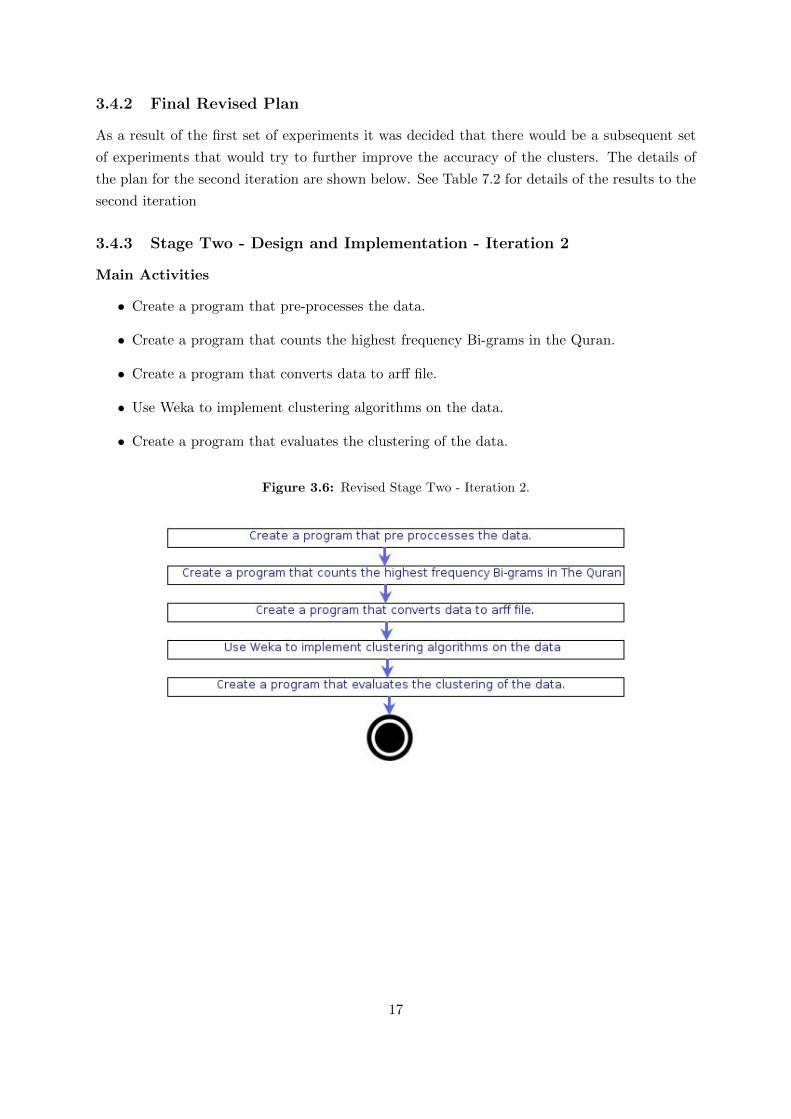
As a result of the first set of experiments it was decided that there would be a subsequent set
of experiments that would try to further improve the accuracy of the clusters. The details of
the plan for the second iteration are shown below. See Table 7.2 for details of the results to the
second iteration
3.4.3 Stage Two - Design and Implementation - Iteration 2
Main Activities
• Create a program that pre-processes the data.
• Create a program that counts the highest frequency Bi-grams in the Quran.
• Create a program that converts data to arff file.
• Use Weka to implement clustering algorithms on the data.
• Create a program that evaluates the clustering of the data.
Figure 3.6: Revised Stage Two - Iteration 2.
17

3.5 Real Schedule
Due to the nature of most projects, the actual schedule followed is often not the same as the
planned schedule. As was the case with this project. Stage one of this project went according
to plan, The second stage was concerned with design and development, this stage took longer
than expected and ended almost three weeks late on the 29/04/2011. This was mainly due to
underestimating the amount of time it would take to develop the programs, but also because of
the addition of the second iteration to including Bi-grams as a feature set. This delay caused
the evaluation to be pushed back by almost three weeks to the 30/05/2011. The write up
started a week late on the 25/04/2011 because I was still implementing at the time the write
up was supposed to start. The evaluation and write up were being carried out simultaniously,
with the evaluation being finished at the end of the penultimate week before the deadline, the
08/05/2011.
18
Chapter 4
Design Choices
4.1 Data
The Quran was chosen because a dataset that contains themed verses is desirable for a text
classification task that aims to detect interesting texts within a set of texts. Furthermore, the
verses that relate to the theme of interest do not always contain words that are typically related
to the “Resurrection Day” theme. This is analogous to the real task of detecting terrorist texts
because terrorists will not use words that will raise suspicion and so by using The Quran the
project has some generalisation to detecting terrorist texts. The theme that was chosen for
detection was “Resurrection Day” (See section 2.1.1) . This theme contained 113 verses which
formed 1.81% of the 6236 total number of verses within The Quran. This dataset is relatively
small compared to the size of the 20 Newsgroups dataset used by [3] and so it could be said
that using The Quran does not provide enough statistical significance when trying to find the
instances of interest. However due to the time constraints of the final year project it was decided
that The Quran would be used, as processing the data would not take as long as it would with
a bigger data set such as the 20 Newsgroups.
4.2 Unsupervised Learning Approach
It was decided that an unsupervised learning method for detecting the relevant themes would
be chosen. From the start of the project there were a number of other students conducting final
year projects using the Quran dataset. These projects focused on using supervised methods
in order to classify the themes that were of interest, this involved training classifiers. It was
decided that this project should try to utilise unsupervised learning methods to distinguish this
project from the others. The advantage of using an unsupervised over a supervised approach
was that it reduces the need of a training set being available. This is important as training
data is not always available for real world tasks such as detecting terrorist texts and so by
using an unsupervised method, natural patterns can be identified within the data. The Quran
is not a large data set and there are only 113 of 6236 verses that relate to the theme of interest.
19

Using a supervised method would require a percentage of the 113 verses to be used for training,
leaving an even smaller pool for testing. This could make it harder to evaluate the success of
the classifier as most of the verses of interest would be known to the model. The unsupervised
learning method used in this project will use clustering algorithms which will try to categorise
the verses of interest based on a number of different features (see section 4.3).
4.3 Features
Many learning algorithms are trained using features. There are numerous features that can be
drawn from data and the choice of feature is dependent on the task. A classifier will use features
in order to train a model that will classify unseen instances of texts, whereas a clusterer will use
features in order to learn the natural groups within data. This section describes the features
used within the project.
4.3.1 Common Word Frequencies
Common word frequencies have shown to be highly effective in previous studies. E. Stamatatos
[25] used common word frequencies (the most frequent words that occur in a text) for text
genre classification in order to classify a variety of texts samples into four genre categories.
This proved to be a successful feature for automatically categorising text into genres. The best
performance achieved using common word frequencies was a 2.5 % error rate based on the 30
most frequent words. They also found that the performance decreased as the number of words
used increased past 30. I undertook a coursework for the AI32 module at the University of
Leeds. This used common word frequencies as features in order to train a model to distinguish
British from American English texts [26]. The use of these as features proved to be effective
and helped to successfully classify the majority of the texts. The corpus in this experiment was
not as highly skewed as detecting The Resurrection Day theme within The Quran, however it
is still a comparable task. Common word frequencies are simple to collect and so will be used
in my experiments. One of the risks with using word frequencies is that they can produce very
sparse matrices if a large amount of words are used. However as the results of the experiments
by E. Stamatatos show, the error rate increases past 30 words and so this should limit data
sparsity.
4.3.2 Bi-grams
Bi-grams, or “2-grams” as they are sometimes known, are used as a popular feature in many
studies. A Bi-gram in the context of this project, is two consecutive words that occur in a
sentence. For example in the sentence “The end of the world”. “The end”, “end of”, “of the”,
“the world”, are all individual Bi-grams.
B. Pang at al [20] found that when trying to classify movie reviews using the presence of Bi-
grams, the classifier had significantly improved accuracy when compared to the baseline. J.
20

Mason et al [27] show that when trying to classify web pages by genre, the use of Bi-grams as
features with a SVM model result in a 99% accuracy rate and a 95.5% accuracy rate with a
K-NN model. It is important to note that with the use of longer n-grams (3-10 n-grams) the
classification accuracy is reduced. This is interesting as it shows that Bi-grams are an effective
feature for many classification tasks. For this reason Bi-grams will be used a feature for my
experiments. An added benefit of using Bi-grams is that they are relatively easy to collect and
have also been shown to improve the accuracy of clustering algorithms.
4.4 Weka
I chose to use the Weka GUI (graphical user interface) to conduct the required learning algo-
rithms as I am familiar with it (See figure 4.1 for example of the Weka GUI). But also because
working from home and University meant that I would be using two different operating sys-
tems (Linux Fedora and Windows 7), so the machine learning software needed to be platform
independent. It contains numerous state of the art, as well as simple classifiers and clustering
algorithms. I chose to use the Weka GUI over the API because Weka is written in Java, a
programming language which I am not fully competent with. Calling the API would require
me to use Java, which would have taken more time than using the standard graphical user
interface. Since time was limited learning a programming language was not viable. I chose to
use Weka over NLTK as the way in which Weka takes input, the Arff file format (see section
2.3.2) helps to separate the pre-processing stage from the clustering stage and also helps to keep
my implementation modular (Details of modularity in implementation section). NLTK requires
input from an input vector. The input vector format is not as clear to a human as an Arff file is.
This would hinder debugging when developing the program that will convert the pre-processed
instances of The Quran into the format required for a clusterer. Another reason for the choice
of Weka is that it supports a wider range of clustering algorithms (Weka supports 12, as shown
in figure 4.1, whereas NLTK supports just 3) which are easily accessed from the GUI once the
Arff file is loaded. This allows for easier experimentation as once the Arff is parsed into Weka,
there is no need to load it again. NLTK would require the experimenter to load the feature
vector every time an experiment is run. This is done automatically when using the Weka GUI
which saves time.
4.5 NLTK
Weka contains the capabilities to pre-process data however the tools provided by Weka are not
flexible enough for use with this project. Therefore the Python external library NLTK will be
used for this task as it contains built in functions, such as stemmers, a library of stop words
amongst other useful functions that can aid the pre-processing of the Quranic verses.
21

Figure 4.1: Weka Explorer Graphical User Interface.
4.6 Choice of clustering algorithms.
It was decided that clustering would be used with this study instead of the classification for
the reasons mentioned in section 4.2. A number of clustering algorithms were considered and a
final decision was based on evidence from previous studies.
4.6.1 K-means
The K-means algorithm is the most popular clustering algorithm. It is described in [29] and [11]
“First, you specify in advance how many clusters are being sought: this is parameter k. Then k
points are chosen at random as cluster centers. All instances are assigned to their closest cluster
center according to the ordinary Euclidean distance metric, Next the centroid, or mean, of the
instances in each cluster is calculated. This is the “means” part. These centroids are taken to
be new center values for their respective clusters, Finally the whole process is repeated with
the new cluster centers. Iteration continues until the same points are assigned to each cluster
in consecutive rounds, at which stage the cluster centers have been stabilized and will remain
the same forever. This algorithm is implemented in the Weka Explorer, which allows the user to
specify the maximum number of iterations and the initial number of clusters. It also gives the
user an alternative distance function, the Manhattan distance, this means that the centroids
are computed as the component-wise median rather than the mean. D. Pelleg at al [28] outlines
a number of drawbacks to the K-means algorithm:
• It is slow and scales poorly with respect to the time it takes to complete each iteration.
• The number of clusters K has to be supplied by the user.
The first drawback should not be an issue with my data set as it is not very large and so
execution time will not be long enough to cause a great deal of concern. The second drawback
22

could prove to be an issue as knowing the total number of clusters at the start is not always
clear. One solution as proposed in [11] for this is to start at a small number of clusters, run the
clusterer and observe the output then increase this until there is no substantial improvement
to the accuracy of the clustering. Another way is to use an improved version of the K-means
algorithm, the X-means algorithm, which is capable of finding out the optimum number of
clusters. The output to the K-means is limited to the original number of clusters that were
specified. When used with the Quranic dataset it is hoped that one of the clusters will contain a
high percentage of the verses of interest. The K-means algorithm will be used in my experiments
as it is a simple and effective way of clustering.
4.6.2 X-means
The X-means clustering algorithm is described in [28] it is similar to the K-means algorithm
in that centroids are found using a distance metric. The main difference in the way the X-
means algorithm works is the method of deciding how many clusters should be used. The K-
means algorithm requires the number of clusters to be specified, whereas the X-means algorithm
requires just a minimum and maximum amount of clusters. It then finds the “optimal number
of clusters. The output is then an optimal number of clusters. The X-means algorithm will be
used in my experiments as it is an improvement on the popular K-means algorithm.
4.6.3 EM Algorithm
The EM algorithm is an iterative algorithm that is based on calculating the cluster probabilities.
It is similar to K-means in that it requires the number of clusters to be specified. It differs
because it has an “expectation step” and a “maximization step” as described in [11]. The final
clusters are output when the successive values of log-likelihood are negligible. It is implemented
in Weka and will be used in my experiments.
23

Chapter 5
Methodology
5.1 Software Development Methodology
A number of factors needed to be considered when choosing the methodology for the project.
The type of project needs to be considered. Since this project is a research project, there will
be no end user, therefore most methodologies designed for software engineering would not be
suitable. The majority of software development theory often presumes that there is a team of
developers that will be producing the software. It is not the case with this project as I am
the only developer and so methodologies that are based on teams would not be appropriate.
The fact that this project is a research project means that the implementation needs to be dy-
namic, and flexible. Often there are aspects of design and implementation that are overlooked,
therefore a methodology that is rigid would impose limitations on the amount of improvement
that could be made during the implementation, this is undesirable. Therefore the choice of
software development methodology was agile development. Agile development is an establish
methodology for the development of software. The focus is that of iterative improvement. This
is because requirements of projects often change as they are in development and as a result,
for some projects, (such as this one) it is not possible to meticulously plan out every detail as
the details of the whole system are often not known at the time of design. This methodology
encourages a flexible, iterative and incremental approach to development [30].
The way in which I designed my software was to first look at the minimum requirements of the
project and draw up requirements for the software. Then draw out a basic design based on these
requirements, implement the design, test it. Then if any improvements needed to be made they
could be made in the next iteration. From the start of the design phase it was not clear what
programs would need to be produced in order to fully complete the system. For example it was
not known if there would be another feature extraction method. By drawing out a basic design,
it helped to give the programming aspect of the project some direction rather than just blindly
focusing on designing every aspect of the system, a task which I realised would be impossible
at the start of the design phase.
24

Other methodologies were considered. The Waterfall model [31] is a design orientated method-
ology. It has a number of clearly defined phases. Once each stage is complete the next phase
begins and there is no going back until the whole cascade of phases is complete. This is a rather
rigid methodology and requires the whole system to be designed implemented and tested before
any improvements can be made. There are other more user oriented methodologies such as
“Exploratory development” and “Throwaway prototyping”. [31] These methodologies require
user feedback after each iteration. This is not suited to this project as the system that will be
produced does not require user evaluation as it is a research project and is not intended to be
used by anyone else.
The design for my system was purposefully modular. Because there were clear steps that needed
to be performed on the data in order for it to be clustered. A “Pipeline” of programs were created
that implemented different features at each stage in the “Pipeline”(See Chapter 6, figure 6.1).
These stages involved pre-processing, generating features, creating the Weka representation of
the data with the features (The Arff file) , using Weka to cluster, then creating a program that
evaluates the clusters. The reason for this modularity was so that if there needed to be any
amendments at each individual stage it would be easy to change the code without having to
make changes to the other parts.
5.2 Evidence of Methodology
This section aims to show how I followed the Agile Development Methodology. When I started
designing the system. One of the choices that had to be made was whether or not the pro-
gram that created the Arff file would be hard coded to automatically take in a set amount
of the highest frequency word counts from the previous program in the pipeline, or whether
the highest frequency words would be specified manually on the command line by a human user.
The first iteration of the implementation used the former because at that time it was not known
that a different set of features (Bi-grams) would be used. However after testing I realised that
the latter approach would be more desirable as it would speed up the experimentation process
because I wouldn’t have to manually edit the code in order to alter the amount of common word
frequency counts that would be encoded into the Arff file. It would also mean that when it
came to implementing the Bi-grams as features, it would make it easier to specify which feature
set the Arff file maker was to use.
After the initial iteration I verified that the code was producing what was expected. And ran
some basic experiments to see how the clusters performed. At this stage it was clear that dif-
ferent features should be used in order to try to increase the accuracy of the clustering and so
I had to investigate using different feature sets. Bi-grams were considered, as well as using the
25
lexical database Wordnet to find the synset of each word in a verse. This synset would then
be analysed to see if it contained words typical of the “Resurrection Day” theme. This would
require prior knowledge of words that were typical to “Resurrection Day”. It was therefore
decided that Bi-grams would be used instead, as previous studies showed that they can increase
the accuracy of some clustering algorithms used with text classification [20]
This is where the next iteration started. The code was updated to incorporate a different Bi-
gram feature set, and the entire system was also updated in order to deal with the subsequent
changes to the feature set. At this point the whole system was ready for testing. The testing
included making sure that the output at each stage in the pipeline was correct, so that when it
came to conducting the experiments, the results that would be produced were legitimate.
These examples show that there were a number of iterations during the project and at each
iteration, additional functionality was incorporated. This shows that the project was able to
successfully adapt to a change in the requirements. This is a typical characteristic of the Agile
development methodology. During the design and implementation stage, I had regular face to
face meetings with my supervisor and group meetings. These were essentially to show what I
had done so far as well as to gain feedback and suggestions on what other functionality to add.
The Bi-grams were first suggested by Claire Brierley at the group meetings. If this had been
a business environment, the supervisor meetings would have been similar to meetings with co-
workers and the group meetings would have been similar to meeting with clients. The fact that
I had these meetings and they influenced the subsequent iterations shows that the methodology
was followed.
It is clear that if I had followed a waterfall model, I would not have had the weekly supervisory
and group meetings. Instead I would have had to gain all of the information from the them at
the start of the project then would have only have been able to meet up with them after the
implementation was complete. [31]
5.3 Choice of programming language
The choice of programming language is important as it determines to a certain extent the time
that it will take to develop the solution. For the implementation of this project, a programming
language that has good support for string manipulation is required as much of the work will
involve processing large amounts of text. The language should also have an extensive range of
modules that contain functions that deal with the various tasks associated with natural lan-
guage processing (NLP), as well as simple file read/write functionality.
There are a number of programming languages that are suited for this task. Perl is a pro-
gramming language that is often used for NLP, it contains The Comprehensive Perl Archive
Network (CPAN) which is an archive of modules for Perl, within CPAN there is a large amount
26

of NLP modules. However the syntax for pearl is not as easy to read as other programming
languages which has lead to many NLP developers adopting the more easier to read languages,
because they promote better productivity. C, C++ and Java also have modules that have been
developed for NLP, however I am not fluent with either of these and so it would be too time
consuming to learn how to use these languages.
Python has excellent support for NLP tasks. It is one of the most widely used languages within
the NLP area, and one which I am competent with. “Its syntax and semantics are transparent,
and it has good string handling functionality.” This is important as strings will be one of the
main data types used for this project, and so support for them is vital. “As an interpreted
language, Python facilitates interactive exploration, as an object-oriented language, Python
permits data and methods to be encapsulated and re-used easily” [32]. These characteristics
mean that it is well suited to the agile development methodology that is used in this project
because it will allow rapid development of code and easy debugging. It also contains NLTK, the
library of NLP related modules which contain functions that help NLP tasks such as stemming
and removal of stop-words amongst other things. For all of the above reasons it was decided
that Python would be the programming language I would use.
27
Chapter 6
Implementation
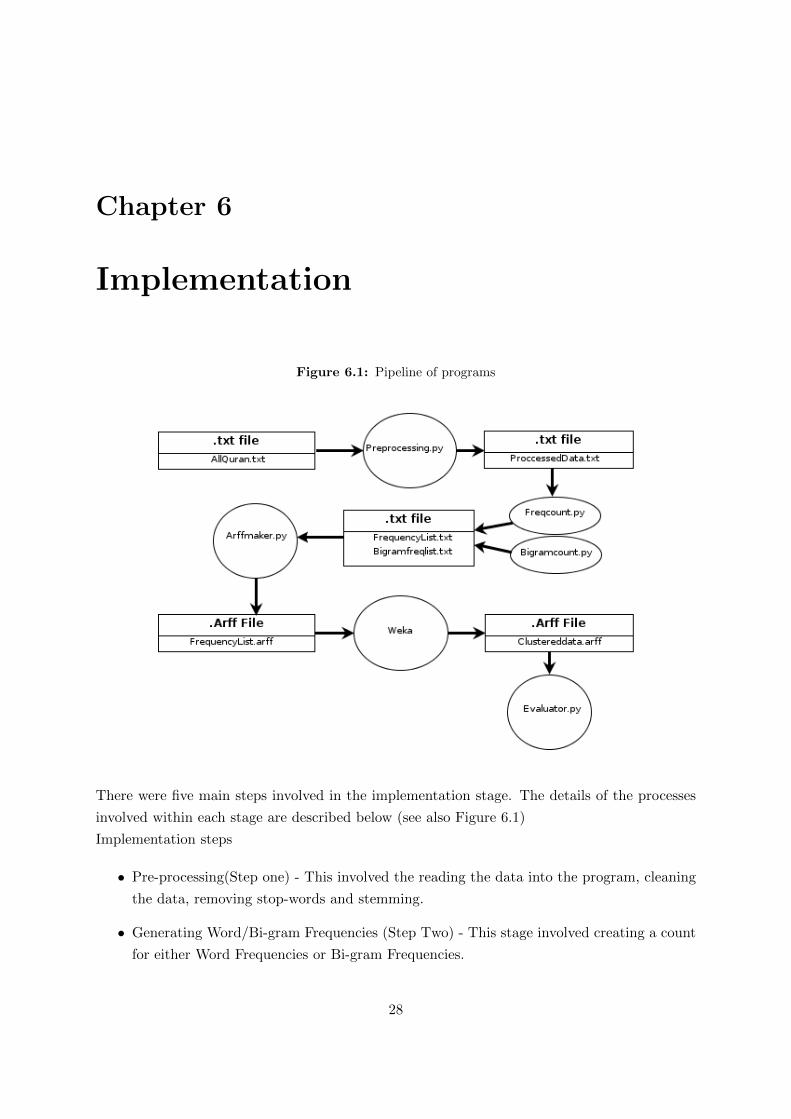
Figure 6.1: Pipeline of programs
There were five main steps involved in the implementation stage. The details of the processes
involved within each stage are described below (see also Figure 6.1)
Implementation steps
• Pre-processing(Step one) - This involved the reading the data into the program, cleaning
the data, removing stop-words and stemming.
• Generating Word/Bi-gram Frequencies (Step Two) - This stage involved creating a count
for either Word Frequencies or Bi-gram Frequencies.
28

• Generating an Arff File (Step Three) - This stage involved generating an Arff file for use
with Weka. The features that were encoded into the arff file were specified by the user.
• Using Weka for Clustering (Step Four) - This stage involved loading the Arff file into
Weka, Using a variety of clustering algorithms (See section 4.6).
• Evaluation of Clusters (Step Five) - This section involved running the evaluation program
to gain the accuracy of the clusters.
6.1 Step One - Pre-processing
The original raw text file contained verses from The Quran. This data needed pre-processing
as each verse contained characters that would affect processing at later stages. The information
below describes the functionality of the program Preprocessed.py
Each verse is encoded as one line in the text file, an example of a line from the raw text is:
"1|1|In the name of Allah, Most Gracious, Most Merciful."
The format of each line is:
"[Verse number] | [Chapter number] | [Verse text]"
The features that would be used for clustering were Common Word Frequencies and Bi-gram
Frequencies. Therefore there was no need for any punctuation, or grammatical features within
the text. The first step dealt with removing the unnecessary characters. First the program
converted all of the characters to lower case. This was achieved by the basic Python function
.lower which converts all characters in a string to lower case. It was decided that all characters
should be converted to lower because words such as “Allah” sometimes occurred without a
capital letter at the start, so when counting the word frequency the true value of total counts
for a word such as “Allah” would not be accurate as it would not count the lower case version.
The next process was to remove all punctuation from the string so that when it came to pro-
cessing the data, the punctuation would not affect the word counts. For example, the algorithm
that counts the words would see gracious! and gracious as the same word. This is because
the algorithm splits sentences by white space. The next step is stemming. It was decided that
stemming would be performed on each word to reduce it to its root form. The stemmer used
was the PorterStemmer class from NLTK. The use of the stemmer was to reduce inflected or
derived words to their root form, so that words with similar semantic interpretations could be
considered equivalent when it came to counting the words for their frequency of occurrence [33].
The next step was to remove Stop-words. Stop-words are words that commonly occur in text
that do not give much added meaning , such as “the” and “at”. These words occur frequently in
all Quranic verses and so would not be good for use as features in a clustering algorithm. NLTK
29

contains a library of common stop-words, however some of the words in this library have been
shown to be significant to the theme of “Resurrection day”. Claire Brierley found that the word
“will” had shown to improved the accuracy of a classifier when trying to detect the“Resurrection
day” verses. For this reason “will” was removed from the list of stop-words. The program takes
a .txt file as input and outputs a proccessed .txt file. An example of one of the processed lines is:
1| 1| allah graciou merci
This verse has had the punctuation and stop-words removed. The words have also been stemmed
to their root form. This is performed on all verses. The program will then write the processed
verses to a new text file.
6.2 Step Two - Generating Word/Bi-gram Frequencies
This step involved either looking at word frequencies or Bi-gram frequencies. The processed
data from the previous stage is read into either of these two programs. The user specifies in
advanced the N number of most frequent words/Bi-grams that are desired as output. Further
details of execution are described below. The names of the two programs are shown in Figure
6.1
6.2.1 Word Frequencies
Each verse in the file is represented as a string, which is parsed into a list. Only the text section
of the verse is considered. The list is then split by white space to get each individual word on its
own. A for loop is then used which iterates through each word and appends it to a dictionary,
if it occurs more than once the value associated with that word in the dictionary is incremented
by one. The loop ends when all of the words have been checked. This is when the program
writes the top N words to file.
6.2.2 Bi-gram Frequencies
Each verse in the file is represented as a string, which is parsed into a list. The list is then
split by white space and the NLTK function bigrams is used to split the list into Bi-grams, the
bi-grams are represented as a list of tuples. The two strings in each tuple are joined to form
one string which represents a Bi-gram. A for loop is then used to appended each Bi-gram to a
dictionary and for every repeat occurrence of an individual Bi-gram, the value associated with
it is incremented by one. The algorithm for this is shown below:
val = 0
dict_ = {}
for word in bigrams:
s = ’-’.join(word)
if s in dict_:
30

dict_[s] += 1
else:
dict_[s] = val
The dictionary is then sorted by value and the top N Bi-grams are output to a text file.
An example of the output to the text file is shown below, it illustrates the top word, and the
frequency of occurence within the text:
allah 2889
lord 957
day 524
people 511
6.3 Step Three - Generating an Arff File
This step involved the generation of an Arff file. An Arff file is the format that Weka takes as
input(See section 2.3.2). This step uses the Arffmaker.py shown in Figure 6.1. The first step
is to read in the N most frequent words/Bi-grams which will be the features used to cluster.
The program gains the top N Words/Bi-grams from the user who looks at the word/Bi-gram
frequency list and provides the input on the command line (See section 6.2 for information of
how to gain these words/Bi-grams). The program has no limit on the amount of words/Bi-
grams that can be input. This is so that when it comes to experimentation, different numbers
of features can be added in order to see if this affects the accuracy of the clustering.
A processed version of the whole Quran is read line by line, into a list, as well as a processed
version of the subset (Containing only verses that are related to the “Resurrection day” theme)
of the Quran. The whole Quran is needed as each line in the Arff file Data section corresponds
to a line in the Quran. The subset of the Quran is needed as it contains the verse and chapter
numbers which will be used to indicate which line is included in the subset, when encoded in
an Arff file.
To make the Arff file. First the @Relation header is needed. This is simply the name of the
Arff file. The program gains this from the user on the command line. After that, the attributes
of the Arff file are added. These are the top N words/Bi-grams preceded by “@attribute”, then
followed by the the type of the attribute. For example:
@attribute allah NUMERIC
The last three attribute values are then added.These are, chapter verse and CLASS. Chapter
will be an integer that represents the chapter number of each verse. Verse will be an integer
that represents the verse number of each verse. CLASS attribute which will indicate whether a
given verse is in the subset indicated by a “Yes” or not in the subset, indicated by a “No”.
31

The @Data line is added to indicate that all subsequent lines are instances of the data. The
program then counts the occurrence of each attribute for each verse and encodes this as one
line in the Arff file. To do this a TopWords function was created for word frequencies(a separate
function Top Bi-grams handles Bi-grams), to look at each line in the Quran. Then for each
attribute(word), it would count the number of times the word occurs for each verse. As well
as appending the appropriate verse chapter and CLASS attributes to the end of a line. An
example of a typical arff file is:
@relation tester999.arff_clustered
@attribute allah numeric
@attribute day numeric
@attribute lord numeric
@attribute people numeric
@attribute earth numeric
@attribute men numeric
@attribute truth numeric
@attribute verily numeric
@attribute chapter numeric
@attribute verse numeric
@attribute CLASS {Yes,No}
@data
1,0,0,0,0,0,0,0,1,1,No
1,0,0,0,0,0,0,0,1,2,No
0,0,0,0,0,0,0,0,1,3,No
0,1,0,0,0,1,0,0,1,4,No
Each attribute is comma separated.
6.4 Step Four - Using Weka for Clustering
This step involved using Weka to cluster the data from the Arff file generated in the previous
step. The first step was to read in the Arff file. This is achieved using the “Preprocess” tab of
Weka explorer (See figure 4.1). Once the Arff file is loaded, the clustering can be performed.
The explorer gives a choice of algorithms in the “Cluster” tab. It also allows customisation of
the clustering algorithms. For example when using the “Simple K-means algorithm” the num-
ber of initial clusters can be specified, along with the choice of distance function, the maximum
number of iterations and the number of seeds, amongst other options. The three clustering
algorithms that were used are described in section 4.6. The different combinations of clustering
32

algorithms, features and options are described in section 7.3.1. Weka will cluster the data. Once
the data has been clustered it will generate an Arff file as output and will also display the result
of the clustering to the GUI (See appendix B for example of what is displayed on the GUI).
The Arff file contains an extra attribute called“Cluster” which marks each instance of a verse
with its cluster number. The example below demonstrates this:
0,1,0,0,0,0,0,0,0,0,0,0,0,0,0,0,1,1,No,cluster4
Once this arff file has been generated, the arff file can be passed to the final evaluation program.
6.5 Step Five - Evaluation of Clusters
The program Evaluator.py was created to evaluate the clustering algorithms. The evaluation
program requires the Arff file generated from Weka from the previous stage. The aim of the
evaluation program is to show the accuracy of clustering. It does this following the method
described in [21] (See section 2.5). The contents of the Arff file are read in line by line to a
list, each line being represented as a string in the list. Only the lines after “@Data” are needed
for evaluation and so the line describing data and attributes are removed from the list. The
program requires the total amount of clusters generated from Weka to be specified. It takes this
value as an int from the command line, which is specified by the user. A dictionary Yesverses
is then created which holds the count of the number of “Resurrection day” themed verses that
each cluster contains. Another dictionary clusters is created which counts the total number
of verses that each cluster contains. Then a final loop iterates through each cluster in the
Yesverses dictionary. This calculates a percentage for each cluster of how many verses in the
cluster are “Resurrection day” verses. The formula to calculate the percentage is shown below,
where A is the total number of ‘Resurrection Day” verses in the cluster and B is the total
number of verses in the cluster.
cluster(n) =
(A
B
)∗ 100
This percentage is then displayed on the command line for each cluster.
33

Chapter 7
Evaluation
7.1 Overview
This chapter examines the extent to which the project fulfilled the aim, objectives and minimum
requirements that were set in the first chapter. The experiments, results and an analysis of the
results are presented and conclusions are drawn from the analysis.
7.2 Aim, Objective and Minimum Requirements Evaluation
7.2.1 Aim
The original aim as specified in section 1.1 was to use an unsupervised learning clusterer to
classify verses in the Quran into verses that are of interest to a particular topic, for example
“Resurrection Day”. A pipeline of programs that attempts to cluster the verses into the theme
of ‘Ressurection Day” has been produced. The full extent to which the aim has been fulfilled
will be described throughout this chapter.
7.2.2 Objectives
The objectives of in section 1.2 have been successfully achieved. NLTK was used to pre-process
the data. A program that created an Arff file from the data set was made. The clustering
algorithms within Weka were used in order to cluster the data from the arff file and finally an
analysis of the results of the project are described in this chapter.
7.2.3 Minimum Requirements
Requirement One
The first requirement “A system that utilizes unsupervised learning methods for classifying
English language Quran verses.” was successfully achieved. The features used and passed
into the cluster were gained in an unsupervised fashion. In that the Word/Bi-gram frequency
counts were not gained from the subset of the Quran, they were instead gained from counting
34

the frequency of Word/Bi-grams in the whole Quran. The class information (“Yes” or “No”)
contained in each Arff file was ignored when clustering as allowing the clustering algorithms to
know which class each verse belonged to would be supervised learning. It would also defeat the
purpose of a classification task and would lead to a cluster with an unrealistically high accuracy.
Requirement Two
The second requirement “Software that can convert part of one data set into a .arff file for
use with Weka” has been successfully achieved as the program described in section 6.3 can be
used to create an arff file from the data set.
Requirement Three
The third requirement “Use of one set of features to use with clustering algorithms” has been
met, and exceeded. The word frequency counts described in section 6.2.1 show how i met this
minimum requirement. The pipeline used one more set of features, Bi-gram frequencies, as
described in section 6.2.2. The use of more than one set of features to use with clustering
algorithms was specified in section 1.4 as an extension to the minimum requirements. This
therefore shows one of the ways in which i have exceeded my minimum requirements.
Requirement Four
The fourth requirement “Use of Weka to implement the clusterer” has been achieved. Section
6.4 demonstrates this.
7.3 Experimental Setup
7.3.1 Iteration One
The experimental stage broadly fell into two stages. The first stage occurred in iteration one
(See section 3.4.1) where the results were gained from the clustering based on the word frequen-
cies feature set. The EM and K-means algorithms which were chosen (See Section 4.6) were
performed on different quantities of top word frequencies (from 10 to 35 in increments of 5). It
was decided that the frequencies would range from 10 to 35 because the study found that there
was a decrease in accuracy past 35 most frequent words when trying to classify Wall Street
Journal articles by category [25]. The clustering was performed with an initial cluster value of
2,3,4 and 5. This was decided as using too many clusters would reduce the chance that a single
cluster would contain the verses of interest. This is because the dataset is relatively small. The
X-means algorithm (See section 4.6) requires a range of clusters, it was decided that the range of
clustering would be the same as the previous two algorithms, from 2-5. The X-means algorithm
then automatically decides on the “best” clusters. The same number of top word frequencies
were used with the X-means algorithm. The results for the X-means algorithm only display the
35
range of clusters as the best cluster is decided automatically by the algorithm.. The results of
these experiments are presented in Table 7.1.
7.3.2 Iteration Two
The second iteration (See section 3.4.3) aimed to improve upon the initial results by using a
more advanced feature set. Top Bi-grams frequencies were used as features. The experiments
were conducted in exactly the same manner as the first iteration because we would like to
directly compare word frequencies with Bi-grams to see which is best. The EM and K-means
algorithms were both performed on top Bi-gram frequencies of between 10 to 35 in increments
of 5, with initial cluster values of 2,3,4 and 5. The X-means algorithm was performed with a
cluster range of 2-5 with Bi-gram frequencies the same as used with EM and K-means. The
results of these experiments are presented in Table 7.2.
7.4 Evaluation of Results
7.4.1 Evaluation of Results from Iteration One
The values presented in Table 7.1 use the evaluation program evaluator.py to gain the accu-
racy of each cluster for each experiment. The value shown in the table corresponding to each
experiment shows the cluster that gives the highest percentage based on the formula in section
6.5. This evaluation method was chosen as it had shown to be effective in [21]. Precision and
recall were considered as a potential evaluation measure, however they were not chosen for this
project as we are not looking for the amount of verses of interest in a cluster. We are more
focused on looking for a cluster that provides the highest proportion of target verses in relation
to the overall number of verses within that cluster. Therefore precision and recall were not a
suitable evaluation measure.
The results show that as the number of word frequencies increase, the accuracy of the best
cluster decreases, with the exception of the experiment with K-means using 35 words with 3,4
and 5 clusters that achieved an accuracy of 8.92%. The reason for this is because the cluster
contained a relatively a small amount of verses (449) with the number of verses of interest being
11, which shows that the cluster still did not contain a significant amount of the 113 verses of
interest.
The highest accuracy achieved for a cluster was 8.92%. This was a disappointing result as the
highest percentage is still relatively low. This shows that clustering using the parameters in
these experiments does not produce clusters that can detect verses of interest. It was hoped that
using Bi-grams would increase the accuracy. The following section will illustrate the accuracy
attained by using Bi-grams as features.
36
7.4.2 Evaluation of Results from Iteration Two
Table 7.2 presents the results of the evaluation program when using the Bi-grams as features. It
shows that the highest accuracy achieved for a cluster was 6.25% when using 5 clusters with the
10 most frequent Bi-grams from the whole of the Quran. It shows that increasing the number of
Bi-grams as features nearly always decreases the accuracy of the clustering. From these results
it can be said that using Bi-grams as features does not provide an imrovement on accuracy
when compared to using single word frequencies as features.
7.5 Evaluation of Unsupervised Learning
The results of the experiments did not deliver what was hoped for. This indicates that unsu-
pervised learning does not provide suitable accuracy for detecting verses of interest within the
Quran. The features used in this project were relatively simple, this could be one of the rea-
sons that the accuracy was not high. Using more advanced features could help to improve the
accuracy. Features that look at the grammatical structure of The Quran as well as looking at
tense structure or the presence of entities could provide the additional information which could
help to improve accuracy of clustering. The choice of corpus for this project was based on the
fact that there was a labelled subset that was identified, which could be used as the “target”
for a clustering algorithm. The corpus was relatively small compared to most studies which
involved clustering [15],[28],[29],[23]. This could have affected the clustering as it is possible
that the subset was not large enough to be detected from the features that were used. The 20
Newsgroups corpus could have been used as it was substantially larger than the Quran, it would
have been interesting to see how the unsupervised methods in this project perform using the
20 Newsgroups corpus. However due to the time constraints of the project the 20 Newsgroups
corpus was not used.
A fellow student [34] used a supervised method, achieved by using a series of classifiers in his
final year project to try to classify the “Resurrection Day” themed verses in the Quran. The
results of this study are presented in figure 7.1. The figure shows that the highest accuracy
achieved was 95.5% however for reasons outlined in [34] this result was disregarded. Therefore
the highest accuracy that was achieved on a test set in his study was 79.8% with the “LogicBoost
classifier that was trained with the top 10 word frequencies from the subset. His accuracy of
classification is much better than the accuracy provided by the unsupervised method used
in this project. Indicating that supervised learning is more appropriate for this type of text
classification task. The study in [34] did not use Bi-grams as features with the classifiers that
were used. It would be interesting to see if using Bi-grams with the classifiers used in the study
could have improved the accuracy. The unsupervised clustering method used within this project
gave a low accuracy, which leads me to conclude that an unsupervised learning method is not
suitable for a classification task that aims to identify “Resurrection Day” themed verses within
the Quran.
37

7.6 Further Work
The field of text classification is well established. Unsupervised text classification seems to be
one of the less researched areas within this field. Further research into this area may help to
discover better ways of classifying small subsets of data within large documents in an unsuper-
vised manner. Further work could involve the use of different features to see if this improves
classification accuracy when using the Quran as a dataset. WordNet could be used to try to find
words that do not directly occur in the verses within the subset but relate to the “Resurrection
Day” theme. Research has been promising using WordNet as described in [15] (See section
5.2 and 2.3.3 for more details). Using WordNet to gain features is not strictly unsupervised
learning. However due to the results from my project, it may be more desirable to use a semi-
supervised/supervised approach. Work that uses WordNet as a feature for training classifiers
such as those used in [34] could help to provide better accuracy.
There is definitely potential for using larger corpora and trying to detect distinct subsets within
them by using the features in this project. By doing this it would help to confirm whether or
not the features used within this project are suitable for text classification.
The motivation for this project stemmed from counter terrorism. The original plan was to
detecting terrorist emails/text messages/phone call transcripts. This was not suitable for a
final year project as it required access to classified information which was not made available.
Further work could try to gain access to this type of information. Unsupervised learning methods
could then be applied to this data (after adequate pre-processing) in order to divide the data
into clusters which an expert in the field could then analyse to see if any of the clusters had a
high percentage of “suspicious” verses. The features used in this project could be more suited
to this type of task as suspicious emails are likely to contain “code” words so looking for the
occurrence of words that would not normally be high frequency could prove to be effective.
38

Tab
le7.1
:W
ord
Fre
qu
ency
Res
ult
s
EM
K-M
ean
sX
-Mea
ns
#C
lust
ers
#C
lust
ers
#C
lust
ers
23
45
23
45
MIN
=2,
MA
X=
5
101.
91%
4.51
%3.
55%
3.40
%2.
17%
3.45
%4.
63%
4.80
%3.
90%
152.
15%
3.60
%4.
48%
8.29
%2.
17%
3.34
%4.
67%
4.77
%3.
90%
Qu
anti
tyof
202.
07%
1.88
%2.
46%
3.19
%2.
18%
3.17
%4.
80%
4.52
%4.
50%
Wor
ds.
251.
98%
1.99
%2.
35%
4.59
%2.
17%
2.31
%4.
51%
4.85
%4.
97%
302.
27%
2.35
%2.
65%
2.64
%2.
17%
2.32
%2.
37%
3.1%
3.40
%35
2.20
%2.
98%
3.38
%2.
93%
2.18
%8.
88%
8.80
%8.
92%
4.01
%
39

Tab
le7.2
:B
i-gra
mF
requ
ency
Res
ult
s
EM
K-M
ean
sX
-Mea
ns
#C
lust
ers
#C
lust
ers
#C
lust
ers
23
45
23
45
MIN
=2,
MA
X=
5
103.
86%
4.81
%4.
00%
4.09
%1.
96%
2.68
%6.
2%6.
25%
4.94
%15
4.36
%3.
40%
5.26
%5.
48%
1.96
%2.
38%
5.26
%5.
48%
5.44
%Q
uan
tity
of20
1.18
%1.
96%
2.40
%5.
94%
1.81
%1.
96%
2.40
%5.
95%
3.60
%B
i-gr
am.
252.
05%
3.67
%3.
42%
3.73
%1.
81%
1.81
%2.
40%
5.94
%3.
90%
302.
48%
3.41
%2.
40%
4.59
%1.
81%
1.96
%2.
40%
5.94
%3.
40%
351.
82%
3.00
%3.
97%
2.17
%1.
81%
1.96
%2.
41%
5.95
%4.
10%
40

Fig
ure
7.1
:P
ipel
ine
of
pro
gra
ms
41

Chapter 8
Bibliography
42

Bibliography
[1] House of Commons (2006), Report of the Official Account of the Bombings in London on
7th July 2005 (London: The Stationery Office) pp 24.
[2] Weimann. G., (2004), How modern terrorism uses the internet., pp 9.
http://books.google.co.uk/books?hl=en&lr=&id=a_cugt6quTYC&oi=fnd&pg=
PA5&dq=terrorists+using+the+internet+communication&ots=JgKa49Rqs3&sig=
kngnUvEE9ky6_vWE7hRRLvgL5SQ#v=onepage&q=terrorists\%20using\%20the\
%20internet\%20communication\&f=false Last Accessed: 11/05/2011.
[3] Caillet. M, Pessiot. J, Amini. M, Gallinari. P., (2004), Unsupervised learning with
term clustering for thematic segmentation of texts. RIAO, 26-28 April 2004 Toulouse,
France. Available from: http://eprints.pascal-network.org/archive/00000432/01/
UnsLrnThmSeg_RIAO04.pdf Last Accessed: 11/05/2011.
[4] Abdul-Baquee, S & Atwell, E., (2010), Is Machine Learning usefull for Quranic Studies?
The problem of classifying Meccan and Medinan chapters of the Quran. http://www.comp.
leeds.ac.uk/eric/sharaf10jqsDraft.pdf Last Accessed: 11/05/2011.
[5] Liu. Q., Wu. Y, Supervised Learning. http://www.fxpal.com/publications/
FXPAL-PR-11-626.pdf Last Accessed: 11/05/2011.
[6] Banko. M., Brill. E., (2001), Scaling to very very large corpora for natural language disam-
biguation. In Proceedings of the 39th Annual Meeting of the Association for Computational
Linguistics (ACL 2001), pp 2633.
[7] Sugato. B, Arindam. B., Raymond. M., (2002), Semi Supervised Clustering by Seeding.
Proceedings of the 19th international conference on machine learning pp.19-26. http://
www-connex.lip6.fr/~amini/RelatedWorks/Bas02.pdf Last Accessed: 11/05/2011.
[8] Bird. S., Klein E., Loper. E., (2009) Natural Language Processing with Python - Analyzing
text with the Natural Language Toolkit, O’Reilly Media Available from: http://nltk.
googlecode.com/svn/trunk/doc/book/ch00.html
[9] Bird. S., Loper. E., Klein. E., (2011) Natural Language Tool Kit Website. http://nltk.
googlecode.com/svn/trunk/doc/api/index.html Last Accessed: 11/05/2011.
43

[10] Waikato Environment for Knowledge Analysis. 2011. http://www.cs.waikato.ac.nz/ml/
weka/ Last Accessed: 11/05/2011.
[11] Witten. H., Frank. E., (2005), Data mining: Practical Machine Learning Tools and Tech-
niques. Second Edition pp 50-55, pp 254-266 Morgan Kaufmann Publishers.
[12] Witten. I., Frank. E., Trigg. L., Hall. M., Holmes. G., Cunningham. S. (1999) Weka:
Practical Machine Learning Tools and Techniques with Java Implementations. Proceedings
of the ICONIP/ANZIIS/ANNES’99 Workshop on Emerging Knowledge Engineering and
Connectionist-Based Information Systems. pp. 192-196.
[13] Aggrawal. C., Yu. S. (2000), Finding generalized projected clusters in high dimensional
spaces. Proc. Of SIGMOD00 (pp. 70-81).
[14] Liu. T., Liu. S., Chen. Z., Ma. W., (2003), An Evaluation on Feature Selection for
Text Clustering. Machine learning international conference 2003 http://www.aaai.org/
Papers/ICML/2003/ICML03-065.pdf Last Accessed: 11/05/2011.
[15] A. Hotho, S. Staab, and G. Stumme.,(2003), Wordnet improves Text Document Clustering.
In Proc. of the Semantic Web Workshop of the 26th Annual International ACM SIGIR
Conference, Toronto, Canada.
[16] QuranDatabase, http://www.qurandatabase.org/Database.aspx Last Accessed:
11/05/2011.
[17] Qurany, http://quranytopics.appspot.com/ Last Accessed: 11/05/2011.
[18] Szaszko.S, Koczy, L.T, Gedeon, T.D, (2005), Fuzzy Pseudo-thesaurus Based Clustering of
a Folkloristic Corpus, The 14th IEEE International Conference on Fuzzy Systems, FUZZ
’05, pp 126-131.
[19] G. Forman., (2004), A Pitfall and Solution in Multi-Class Feature Selection for Text Clas-
sification, Proc. 21st Intl Conf. Machine Learning (ICML 04), ACM Press, 2004, pp. 38.
[20] B.Pang., L.Lee., S.Vaithyanathan.,(2002), Thumbs up? Sentiment Classication using
Machine Learning Technique, Proceedings of EMNLP 2002, pp. 7986. http://www.cs.
cornell.edu/home/llee/papers/sentiment.pdf Last Accessed: 11/05/2011.
[21] Hughes. J., Atwell. E., (1995), The automated evaluation of inferred word classifications.
Cohn, A G (editor) ECAI-94 Proceedings of the 11th European Conference on Artifi-
cial Intelligence, pp.535-539. John Wiley & Sons. http://www.comp.leeds.ac.uk/eric/
hughes95ecai.pdf
[22] WordNet - http://wordnet.princeton.edu/. Last Accessed: 11/05/2011.
44

[23] A.Passos and J.Walner “Wordnet Based Metrics do not seem to help document
clustering.” http://www.ic.unicamp.br/~tachard/docs/wncluster.pdf Last Accessed:
11/05/2011.
[24] WebKb project, http://www.cs.cmu.edu/~webkb/ Accessed 26/04/2011.
[25] E. Stamatatos, N. Fakotakis, and G. Kokkinakis, (2000) Text genre detection using common
word frequencies, in COLING. pp. 808814.
[26] Atwell. E, AI32cw1, http://www.comp.leeds.ac.uk/ai32/ Last Accessed: 11/05/2011.
[27] Jane E. Mason, Michael A. Shepherd, and Jack Duffy.(2009) “Classifying web pages by
genre - a distance function approach. In Web Intelligence and Intelligent Agent Technolo-
gies, WI-IAT ’09. IEEE/WIC/ACM International Joint Conferences on, pages 458-465,
2009.
[28] Pelleg. D., Moore. A., (2000), X-means: Extending K-means with Efficient Estimation of
the Number of Clusters. In: Seventeenth International Conference on Machine Learning,
pp. 727-734.
[29] Rigutini, L. Maggini, M., (2005), A Semi-supervised Document Clustering Algorithm based
on EM Web Intelligence, 2005. Proceedings. The 2005 IEEE/WIC/ACM International
Conference on, pp 200206.
[30] Cohen. D., Costa. P., Lindvall. M., (2011), Agile Software Development, https://www.
thedacs.com/techs/abstracts/abstract.php?dan=345473 Last Accessed: 11/05/2011.
[31] Sommerville. I., Software Engineering, Harlow:Addison-Wesley, 2007.
[32] Bird. S., Klein. E., Loper. E., Natural Language Processing with Python. O’Reilly Media,
Inc. 2009.
[33] University of Lancaster, What is stemming? http://www.comp.lancs.ac.uk/computing/
research/stemming/general/ Last Accessed: 11/05/2011.
[34] Sankey. A. ”Text categorisation using supervised machine learning” Fianl Year Project
2011.
45
Appendices
46

Appendix A
Reflection
Overall I think the project was a success. I have fulfilled all of my requirements specified at
the start of the project and produced a comprehensive report that illustrates the past four
months of work. I successfully applied the knowledge that I had gained from the past three
years of my degree to produce work that I believe shows how capable I am within the field of
computing. In the final year of my degree I found that one of the areas that interested me
was Natural Language Processing. I decided that a project in this field would interest me.
The original project proposed by Eric Atwell was titled “Detecting suspicious texts”. I found
this appealing as I have an interest in crime prevention. I am currently considering a career
within the police/anti-terrorism agencies, so this project was ideal as it relates to this area of
work. This helped to keep me motivated because if it was relevant to a future career. Had I
undertaken a project or that I did not find interesting I would have struggled to stay motivated
and so the final report would have been produced to a quality that was lower than this one.
I found the background reading section particularly interesting. The field of Natural Language
Processing is well established and so there are numerous journals and books that provided the
information needed to complete the task that I undertook, they also helped to improve my own
personal understanding of the field. Knowledge which I can take with me into future careers.
The main downside of this project was the time constraint. I feel that if I had more time I would
have been able to use more features and algorithms to improve the accuracy of my clustering.
This would have helped me to produce a more comprehensive report.
Throughout this degree I have studied lots of theory. I believe that this is vital. However one
of the main issues I had was that I felt that I did not have enough practical experience with
applying this knowledge to a piece of software. This project allowed me to apply the knowledge
that I had learnt to produce a substantial amount of software. I found this satisfying as it
confirmed that I am able to apply this knowledge to a specific problem to produce a software
that is of use.
The meetings with the NLP group and the presentation that I gave helped me to improve my
interpersonal skills in a business situation. I believe this has aided me greatly as it is a skill
that will be useful for which ever career i decide upon.
47

In terms of advice to students about to undertake similar final year projects. My first comment
would be that they should start the project early. As it is easy to fall behind with background
reading (which is one of the most important tasks as it sets the groundwork for the project).
Another piece of advice would be to ensure that you document all of the work that you are
undertaking as you undertake it. As it is very easy to forget what you have produced which
makes the writing of the final report harder. The final comment would be to start the write up
of the final report early to ensure that enough time is given to complete it as the time it takes
to write up the report is often underestimated.
I believe that despite the accuracy of the clustering being low and no clusters successfully
detecting “Resurrection Day” themed verses, the project as a whole went well and i heave
learnt a great deal about my own capability in the field of Computing.
48

Appendix B
Example Weka Output
The following is an example of the clustering output taken from the Weka GUI:
=== Run information ===
Scheme: weka.clusterers.SimpleKMeans -N 5 -A "weka.core.EuclideanDistance -R "
-I 500 -S 10
Relation: tester999.arff_clustered
Instances: 6236
Attributes: 40
Instance_number
allah
will
ye
lord
thou
thee
day
peopl
thi
thing
sign
earth
messeng
men
truth
reject
turn
verili
hath
49
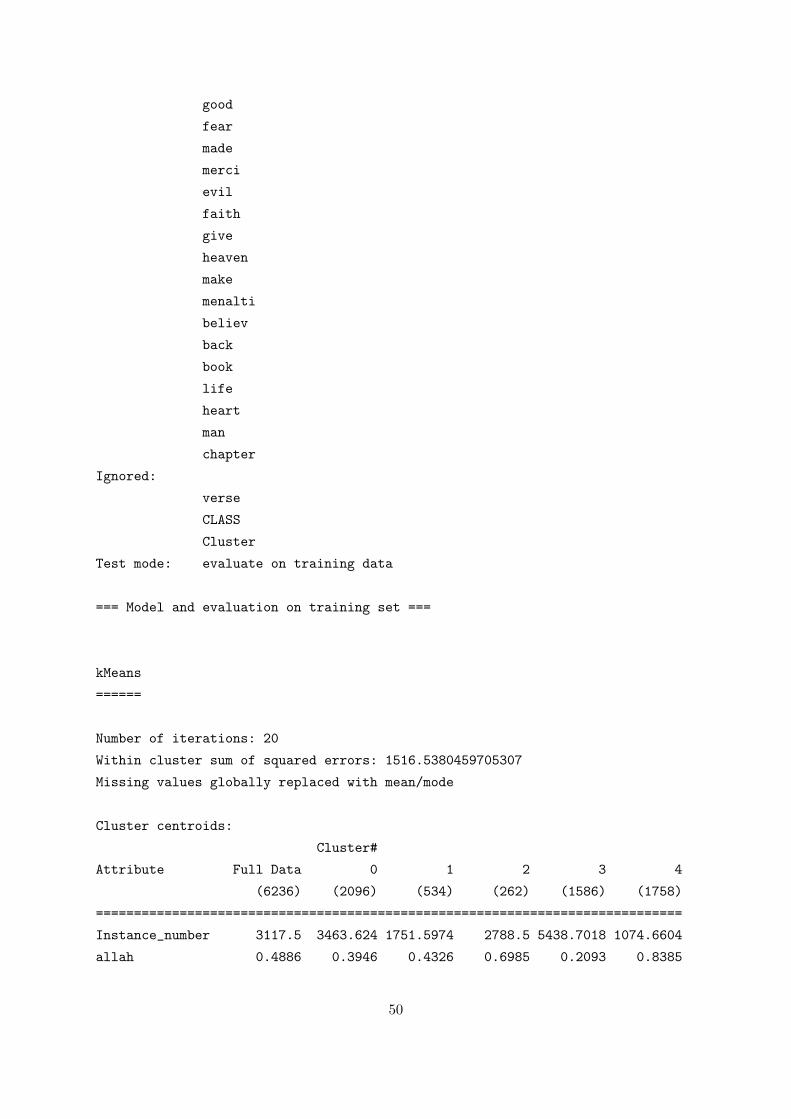
good
fear
made
merci
evil
faith
give
heaven
make
menalti
believ
back
book
life
heart
man
chapter
Ignored:
verse
CLASS
Cluster
Test mode: evaluate on training data
=== Model and evaluation on training set ===
kMeans
======
Number of iterations: 20
Within cluster sum of squared errors: 1516.5380459705307
Missing values globally replaced with mean/mode
Cluster centroids:
Cluster#
Attribute Full Data 0 1 2 3 4
(6236) (2096) (534) (262) (1586) (1758)
=============================================================================
Instance_number 3117.5 3463.624 1751.5974 2788.5 5438.7018 1074.6604
allah 0.4886 0.3946 0.4326 0.6985 0.2093 0.8385
50

will 0.3284 0.3359 0.3951 0.2405 0.2837 0.3527
ye 0.3778 0.3344 0.3858 0.3053 0.2295 0.5717
lord 0.1573 0.0544 1.1873 0.229 0.1091 0
thou 0.1309 0.1226 0.2978 0.1069 0.0593 0.1581
thee 0.0986 0.0883 0.1442 0.0954 0.0467 0.1445
day 0.092 0.1007 0.0562 0.0954 0.0946 0.0899
peopl 0.0861 0.0806 0.1592 0.0534 0.0334 0.1229
thi 0.165 0.1322 0.485 0.2786 0.0782 0.1684
thing 0.0693 0.0654 0.0843 0.1145 0.0252 0.1024
sign 0.0739 0.0649 0.1292 0.2405 0.017 0.0944
earth 0.0678 0.074 0.0712 0.1183 0.0391 0.0779
messeng 0.0621 0.0582 0.0618 0.0267 0.0347 0.0967
men 0.1225 0.1298 0.1479 0.1679 0.0612 0.1547
truth 0.0534 0.0487 0.0712 0.0687 0.0315 0.0711
reject 0.0529 0.0539 0.0487 0.0229 0.0328 0.0757
turn 0.0699 0.0592 0.1161 0.0763 0.0404 0.0944
verili 0.0499 0 0.0131 1.0267 0.0221 0
hath 0.0481 0.0038 0.0955 0.0573 0.0164 0.1138
good 0.0507 0.0406 0.0787 0.0305 0.0202 0.0848
fear 0.0475 0.0425 0.0712 0.0611 0.024 0.0654
made 0.0462 0.0549 0.0449 0.0534 0.0309 0.0489
merci 0.0457 0.0367 0.1348 0.0802 0.012 0.0546
evil 0.0441 0.0501 0.0449 0.0382 0.0189 0.0603
faith 0.0438 0.0229 0.0674 0.0496 0.0164 0.0853
give 0.0473 0.0453 0.0524 0.0611 0.0189 0.0717
heaven 0.0399 0.0439 0.0618 0.0649 0.024 0.0392
make 0.0412 0.0363 0.0655 0.0496 0.0227 0.0552
menalti 0 0 0 0 0 0
believ 0.0669 0.0677 0.0524 0.0534 0.0479 0.0893
back 0.0361 0.032 0.0524 0.0382 0.0189 0.0512
book 0.035 0.0291 0.0543 0.0267 0.0107 0.0592
life 0.0353 0.0401 0.0262 0.0611 0.017 0.0449
heart 0.0343 0.0301 0.0356 0.042 0.0195 0.0512
man 0.0925 0.0844 0.1124 0.1412 0.0706 0.1086
chapter 33.5197 31.803 14.2959 25.3092 71.7919 8.1018
Clustered Instances
0 2096 ( 34%)
51

1 534 ( 9%)
2 262 ( 4%)
3 1586 ( 25%)
4 1758 ( 28%)
52