unreliable flexible manufacturing cell with common cause
TRANSCRIPT
Supriya Maheshwari et. al. / International Journal of Engineering Science and Technology Vol. 2(9), 2010, 4701-4716
UNRELIABLE FLEXIBLE MANUFACTURING CELL WITH
COMMON CAUSE FAILURE
SUPRIYA MAHESHWARI
Department of Mathematics, St. John’s College, Agra (India) [email protected]
PANKAJ SHARMA
Department of Mathematics, St. John’s College, Agra (India) [email protected]
MADHU JAIN
Department of Mathematics, I.I.T. Roorkee (India) [email protected]
Abstract: A mathematical model is developed for unreliable flexible manufacturing cell (FMC) which operates under stochastic environment and produces a variety of parts by utilizing computer controlled machines, a robot and an automated pallet system. FMC is served by the pallet system which delivers blanks into the cell and moves finished parts out of the cell. The robot acts as a mediator between pallet system and the machines i.e. it takes the blanks from the pallet to load them on the machines and places manufactured parts again on the pallet after unloading them from the machines. The operation times, loading/unloading times and material handling times by the pallet are assumed to be exponentially distributed. Using birth death process, the differential difference equations governing the Markov model have been constructed. By using Runge-Kutta method, the probabilities for different system states have been evaluated. Various performance measures viz. machine utilization, robot utilization, pallet handling system utilization, production rate, etc. are established. The model has been compared with that of earlier existing models with reliable/unreliable machines/robot; such models can be treated as special cases of our model. The sensitivity analysis is also performed to explore the effects of different parameters on the various system performance indices, which have been displayed with the help of tables and graphs. Keywords: Unreliable FMC; Common cause failure; Runge-Kutta method.
1. Introduction
Flexible manufacturing system (FMS) is advanced production system, which has evolved in parallel to the developments in computers and automation technology over past three decades. The system is best suited for low to medium volume industries, which work under the unpredictable market environments that demand low cost solutions for fast and effective adaptation to frequently changing demands and designs. An FMS is a highly versatile production system consisting of an integrated computer controlled configuration of numerically controlled (NC) machines with an automated material handling system. The multifunctional machines in FMS can perform a variety of operations simultaneously when provided with the required range of tools. Thus tool management is a significant issue that should necessarily be taken care of in such systems. Many researchers have offered various sophisticated models related to FMC which are capable to mould themselves according to rapidly changing market patterns and customers demand. Numerous contributors working in the area of queueing modeling also paid their attention in this specific area (cf. Vinod [23]; Sharifria and Hildebrant [21]; Vinod and Solberg [24]; Dallery [8]; Chan and Bedwarth [5]; Wang [26] ). Wang and Wilson [27] explored the effect of the cell structures on the means and variances of the cell throughput. Cogun and Savsar [7] have done performance evaluation of a flexible manufacturing cell by computer simulation. Savsar [16] performed reliability analysis of a flexible manufacturing cell and compared it to that of a fully reliable flexible manufacturing cell. A longitudinal study of a flexible manufacturing cell was presented by Sohal et al. [22]. Jain et al. [12] studied flexible manufacturing system with
ISSN: 0975-5462 4701
Supriya Maheshwari et. al. / International Journal of Engineering Science and Technology Vol. 2(9), 2010, 4701-4716
spares and state dependent rates. Abou Ali and Shouman [1] proposed simulation model comprising of eight machines, storage buffer areas, receiving area, three robots and pallets. A stochastic model to determine the performance of a flexible manufacturing cell (FMC) under variable operational conditions including random machining times, random loading/unloading times and random pallet transfer times was developed by Aldaihani and Savsar [2]. Savsar [18] discussed a procedure that combines simulation and analytical models to analyze the effects of corrective, preventive and opportunistic maintenance policies on the productivity of a flexible manufacturing cell. Wahab et al. [25] proposed a generic model to measure machine flexibility with consideration of uncertainties in the system.
In the development phase of flexible manufacturing system (FMS), decision-making is involved at various stages of planning, design and operation. The performance modeling serves as an effective tool in decision-making. During the planning and design, the decisions are connected to the type of machines, number of material handling devices, size of pallet pool, tool storage capacity, scheduling policies, etc.. The typical decisions during operational phase are connected to find best ways in the event of machine failures or sudden change in demands or part mix.
Robot is a reprogrammable machine that can be easily directed to do a variety of tasks without human supervision. Robots are invading the industries and can play a key role in an automated manufacturing system because of their flexibility. The use of sensors, enables them to see, hear, touch and smell the environment just like humans and allows them to communicate with other programmable controllers. The typical industrial robots are generally used for material handling, loading/unloading, inspection, milling, drilling etc. and many other tasks which are difficult or dangerous for humans. Recognizing the wide range of applicability of robots and FMC, numerous mathematicians (see Chakravarty and Shtub [4]; Berrada and Stecke [3]; Sarin and Chan [15] ; Lin et al. [14] have been attracted to the performance analysis of such systems. A polynomial algorithm for scheduling small-scale manufacturing cells served by multiple robots was described by Kogan and Levner [13]. The reliability improvement of industrial robots by optimizing operation plans based on deterioration evaluation was investigated by Yamada and Takata [28]. Chan and Kwan [6] discussed post processing methodologies for off-line robot programming with in computer integrated manufacturing. The approximation algorithm for K-unit cyclic solution in robotic cells was given by Geismar et al. [9]. Gultekin et al. [10] considered flexible robotic manufacturing cell consisting of CNC machines. In the same year, they [11] explored a new robot move cycle which is a direct consequence of process and operational flexibility of CNC machines.
Automated pallet system is an input and output conveyer system governed by automatic machines. In this system, a pallet (a type of platform) which holds the parts to be manufactured, moves into the manufacturing system to deliver these parts. The pallet movement is caused by the machines attached to it. After the part is manufactured, this pallet system takes out the finished part out of the manufacturing cell. To illustrate a pallet system, we can consider the car manufacturing industry. The bodies of cars move into the manufacturing unit which are placed on an automatically moving platform which serves as the automated pallet system. Then these bodies are handled by the robots which perform welding, cutting, drilling, tightening of nut-bolts etc.. Once these operations are finished, the pallet takes these cars out of that system for some additional operations involved in its manufacturing namely for painting, polishing, etc..
The key performance measures in the context of flexible manufacturing system (FMS) are the machine utilization, throughput, productive capacity, flexibility, performability, etc.. These measures of performance can be improved by reducing the non-value adding activities such as machine breakdowns, inventory, shortages and a variety of short-term interruptions (e.g. due to power failure, labour strikes, etc.). By incorporating the concept of common cause failure along with the unreliability of robots and pallet system, in the present investigation we have augmented the work of Savsar and Aldaihani [19]. The organization of the paper is as follows. In the next section, we develop a stochastic model for an unreliable FMC by stating requisite assumptions and notations. In section 3, the equations governing the model are constructed. Section 4 covers the mathematical analysis. Some performance indices are provided in section 5. In section 6, some special cases are discussed by setting appropriate parameters. Section 7 summarizes the computational results obtained by numerical experiment by taking an illustration. Finally, the paper is concluded with some remarks in section 8. The future research directions have also been discussed.
2. Model Description
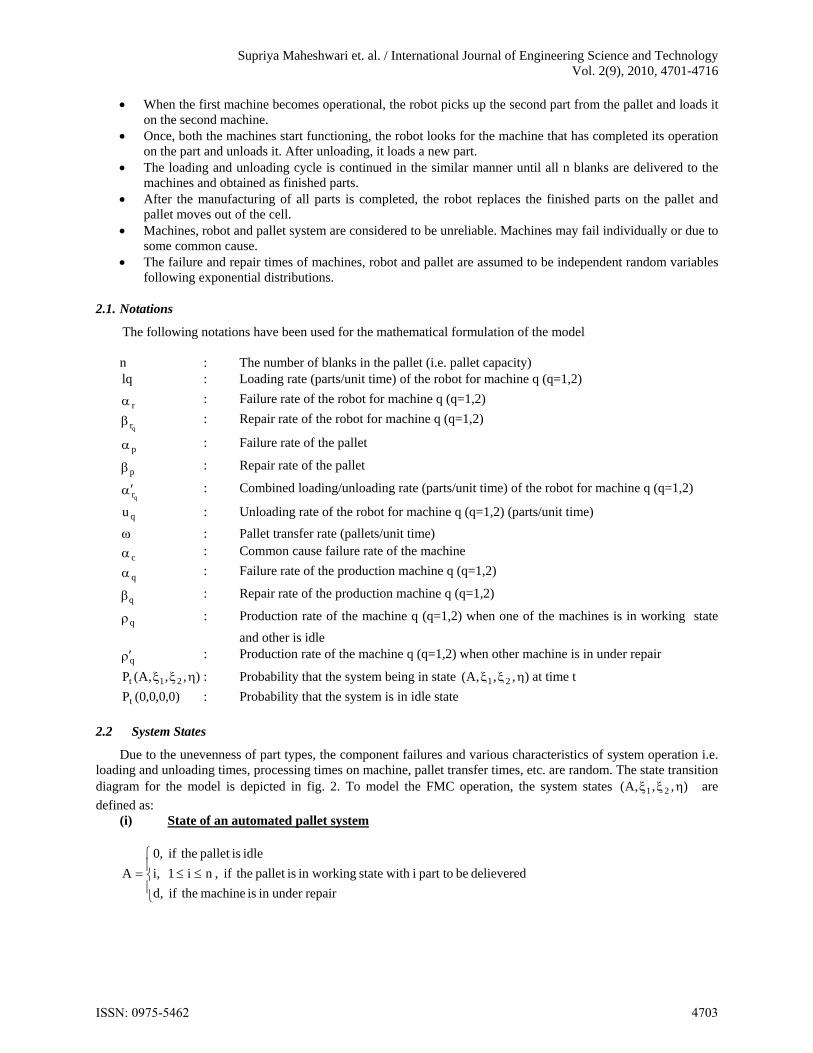
Consider a flexible manufacturing cell (FMC) consisting of two unreliable machines along with a robot and an automated part transfer device called pallet which are also subject to breakdown. The functioning of this FMC system is exhibited in fig. 1. Now we outline the conceptual aspects of FMC as follows:
Firstly, n blanks comprise of different parts are brought into the cell through an automated pallet conveyor system. The robot reaches the pallet, holds the blank and loads it on the first machine.
ISSN: 0975-5462 4702
Supriya Maheshwari et. al. / International Journal of Engineering Science and Technology Vol. 2(9), 2010, 4701-4716
When the first machine becomes operational, the robot picks up the second part from the pallet and loads it on the second machine.
Once, both the machines start functioning, the robot looks for the machine that has completed its operation on the part and unloads it. After unloading, it loads a new part.
The loading and unloading cycle is continued in the similar manner until all n blanks are delivered to the machines and obtained as finished parts.
After the manufacturing of all parts is completed, the robot replaces the finished parts on the pallet and pallet moves out of the cell.
Machines, robot and pallet system are considered to be unreliable. Machines may fail individually or due to some common cause.
The failure and repair times of machines, robot and pallet are assumed to be independent random variables following exponential distributions.
2.1. Notations
The following notations have been used for the mathematical formulation of the model
n : The number of blanks in the pallet (i.e. pallet capacity) lq : Loading rate (parts/unit time) of the robot for machine q (q=1,2)
r : Failure rate of the robot for machine q (q=1,2)
qr : Repair rate of the robot for machine q (q=1,2)
p : Failure rate of the pallet
p : Repair rate of the pallet
qr : Combined loading/unloading rate (parts/unit time) of the robot for machine q (q=1,2)
qu : Unloading rate of the robot for machine q (q=1,2) (parts/unit time)
: Pallet transfer rate (pallets/unit time)
c : Common cause failure rate of the machine
q : Failure rate of the production machine q (q=1,2)
q : Repair rate of the production machine q (q=1,2)
q : Production rate of the machine q (q=1,2) when one of the machines is in working state
and other is idle
q : Production rate of the machine q (q=1,2) when other machine is in under repair
),,,A(P 21t : Probability that the system being in state ),,,A( 21 at time t
)0,0,0,0(Pt : Probability that the system is in idle state
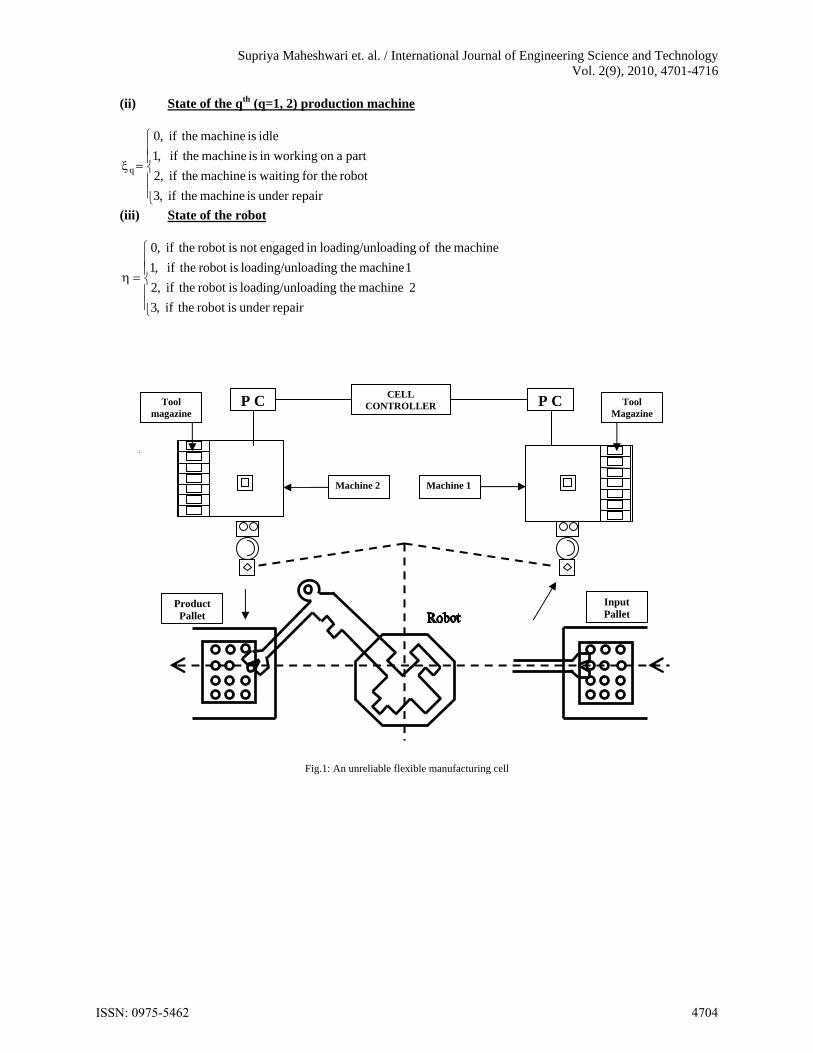
2.2 System States
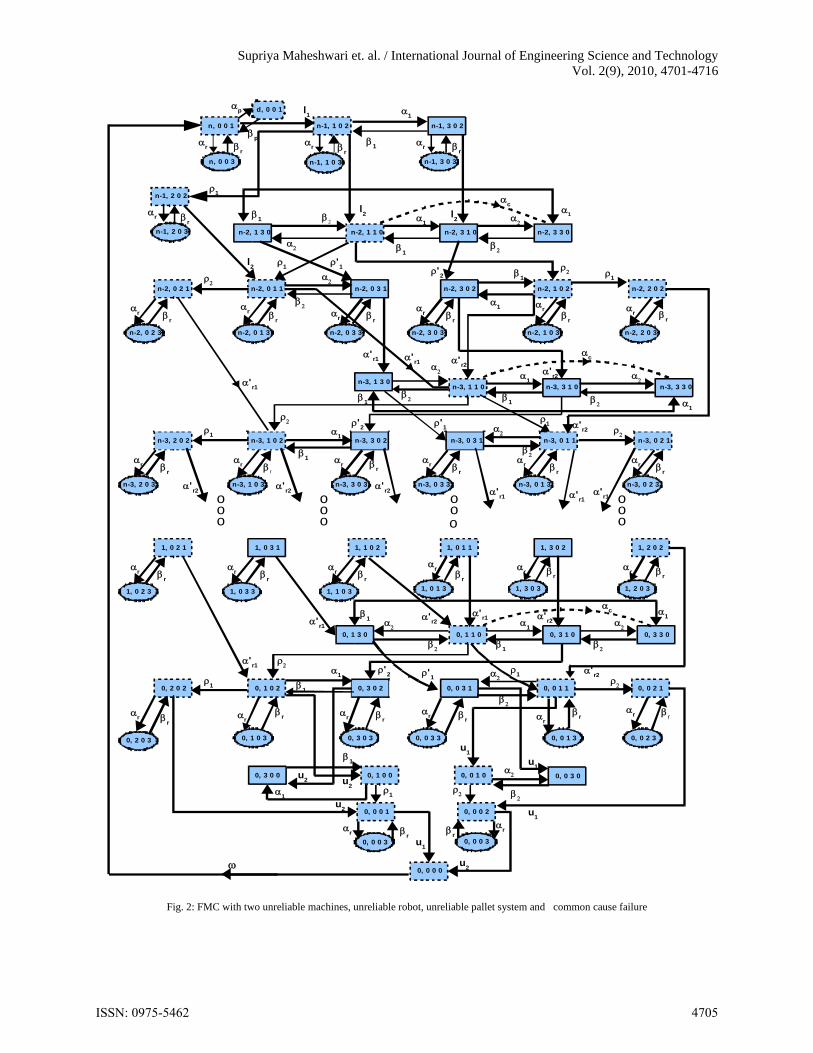
Due to the unevenness of part types, the component failures and various characteristics of system operation i.e. loading and unloading times, processing times on machine, pallet transfer times, etc. are random. The state transition diagram for the model is depicted in fig. 2. To model the FMC operation, the system states ),,,A( 21 are
defined as: (i) State of an automated pallet system
repairunder n i is machine the if ,d
delievered be part to i with state orkingw in isallet p the if ,n i1 ,i
idle isallet p the if ,0
A
ISSN: 0975-5462 4703
Supriya Maheshwari et. al. / International Journal of Engineering Science and Technology Vol. 2(9), 2010, 4701-4716
(ii) State of the qth (q=1, 2) production machine
repairunder is machine the if ,3
robot for the ingitaw is machine the if ,2
part aon orkingwin is machine the if ,1
idle is machine the if ,0
q
(iii) State of the robot
repairunder isobot r the if ,3
2 machine theoadingoading/unll isobot r the if ,2
1 machine theoadingoading/unll isobot r the if ,1
machine theof oadingoading/unllin engagedot n isobot r the if ,0
Fig.1: An unreliable flexible manufacturing cell
CELL CONTROLLER P C P C Tool
Magazine Tool
magazine
Input Pallet
Product Pallet
Machine 1 Machine 2
ISSN: 0975-5462 4704
Supriya Maheshwari et. al. / International Journal of Engineering Science and Technology Vol. 2(9), 2010, 4701-4716
n, 0 0 1 n-1, 3 0 2n-1, 1 0 2
n, 0 0 3
n-1, 2 0 2
n-1, 3 0 3n-1, 1 0 3
n-1, 2 0 3 n-2, 1 3 0 n-2, 3 1 0 n-2, 1 1 0 n-2, 3 3 0
n-2, 0 1 1n-2, 0 2 1 n-2, 0 3 1 n-2, 1 0 2n-2, 3 0 2 n-2, 2 0 2
n-2, 0 2 3 n-2, 0 3 3n-2, 0 1 3 n-2, 3 0 3 n-2, 2 0 3n-2, 1 0 3
n-3, 1 3 0n-3, 3 1 0n-3, 1 1 0 n-3, 3 3 0
n-3, 1 0 2n-3, 2 0 2 n-3, 3 0 2 n-3, 0 1 1 n-3, 0 3 1 n-3, 0 2 1
n-3, 2 0 3 n-3, 3 0 3n-3, 1 0 3 n-3, 0 3 3 n-3, 0 2 3n-3, 0 1 3
1, 0 3 11, 0 2 1 1, 1 0 2 1, 3 0 21, 0 1 1 1, 2 0 2
1, 0 2 3 1, 1 0 31, 0 3 3 1, 3 0 31, 0 1 3 1, 2 0 3
0, 1 3 0 0, 3 1 00, 1 1 0 0, 3 3 0
0, 1 0 20, 2 0 2 0, 3 0 2 0, 0 1 10, 0 3 1 0, 0 2 1
0, 2 0 3 0, 3 0 30, 1 0 3 0, 0 3 3 0, 0 2 30, 0 1 3
0, 3 0 0 0, 0 1 00, 1 0 0 0, 0 3 0
0, 0 0 1 0, 0 0 2
0, 0 0 30, 0 0 3
0, 0 0 0
p
p
l1
1
1
r r
l2
1
1
1
l2
1
r
c
r
r
r
r r
1
'1
l2
'2
1
r
r
r
r
r
rr
r
r
r
r
r
1
1
'r1 '
r1 'r2
'r2
c
1
1
1
1
'r1
1
'
2'
1
'r1 '
r1'
r1
'r2
'r2
'r2
r
r
r
r
r
r
r
r
r r
r
r
1
1
'r2
1
r
r
r
r
r
rr
r
r
r
r
r
r
1
1
1
'r1
'r1
1
1
c
'r2
'r2
'r1
1
1
'
2 '1
r
r
r r
r
r
r
r
r
r
1
'r2
u2 u
2
1
1
1
u2
u2
u1
r
r
r
r
r
u1
u1
u1
ooo
ooo
ooo
ooo
d, 0 0 1
1
Fig. 2: FMC with two unreliable machines, unreliable robot, unreliable pallet system and common cause failure
ISSN: 0975-5462 4705
Supriya Maheshwari et. al. / International Journal of Engineering Science and Technology Vol. 2(9), 2010, 4701-4716
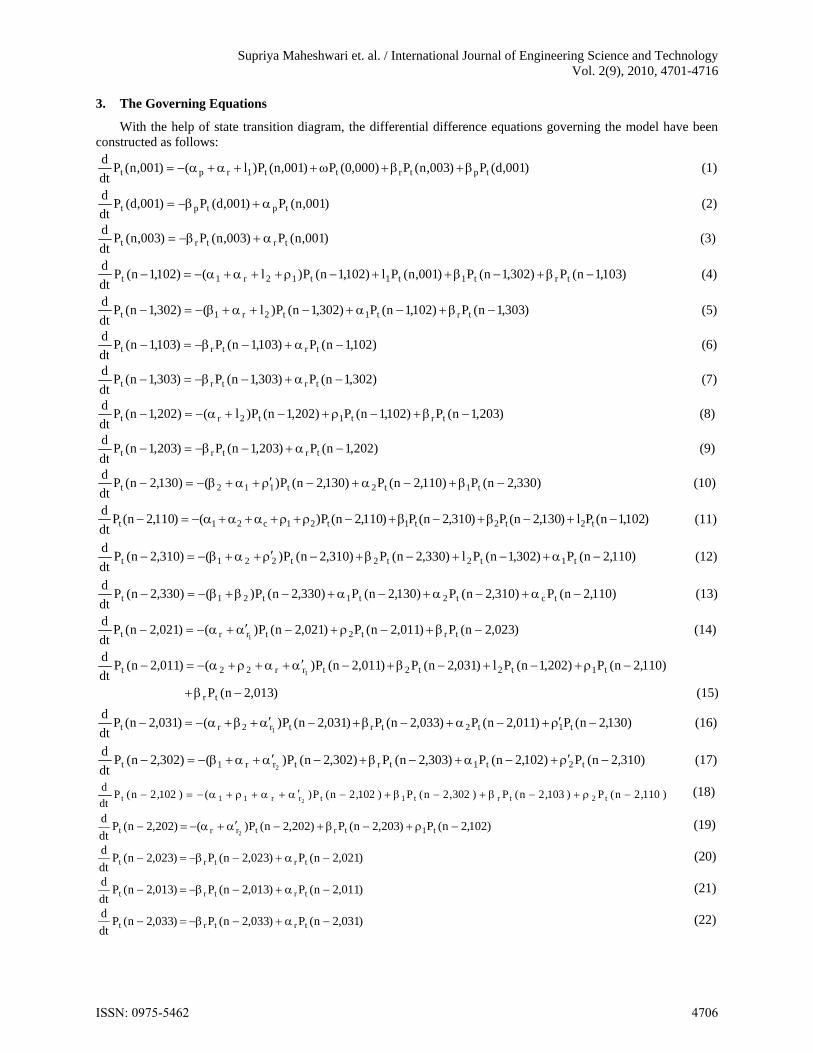
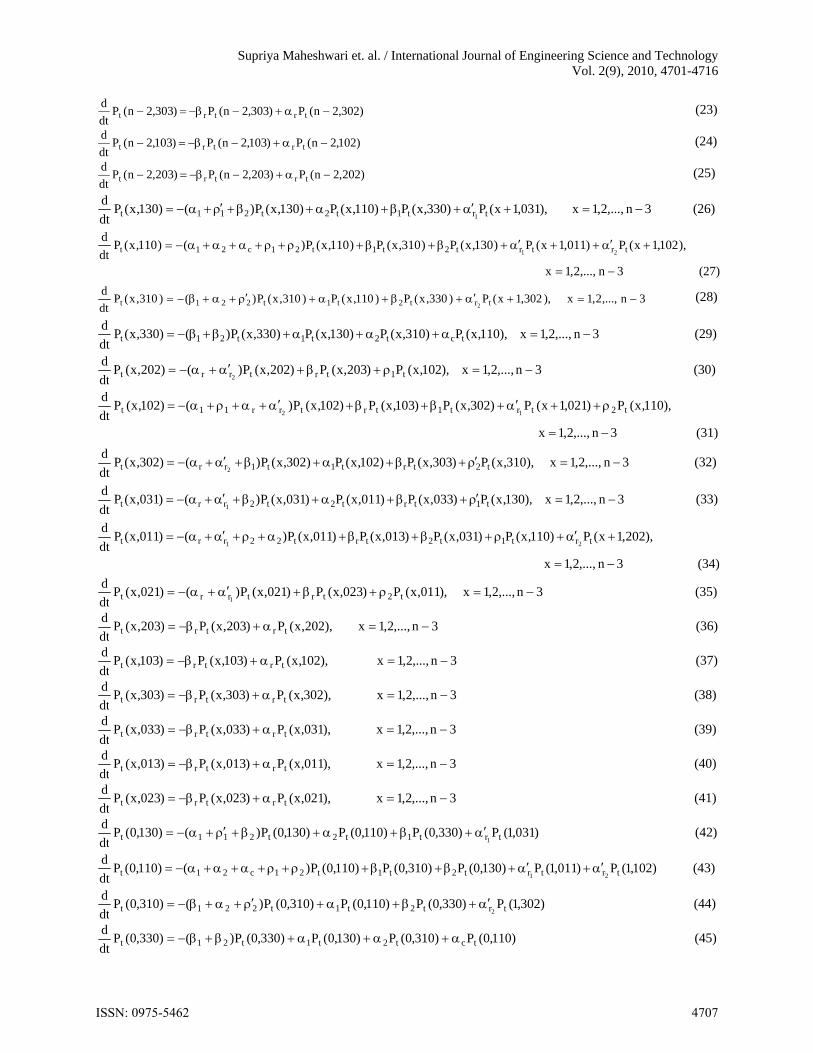
3. The Governing Equations
With the help of state transition diagram, the differential difference equations governing the model have been constructed as follows:
)001,d(P )003,n(P)000,0(P)001,n(P)l()001,n(Pdt
dtptrtt1rpt (1)
)001,n(P)001,d(P)001,d(Pdt
dtptpt (2)
)001,n(P)003,n(P)003,n(Pdt
dtrtrt (3)
)103,1n(P )302,1n(P )001,n(Pl)102,1n(P)l()102,1n(Pdt
dtrt1t1t12r1t (4)
)303,1n(P)102,1n(P)302,1n(P)l()302,1n(Pdt
dtrt1t2r1t (5)
)102,1n(P)103,1n(P)103,1n(Pdt
dtrtrt (6)
)302,1n(P)303,1n(P)303,1n(Pdt
dtrtrt (7)
)203,1n(P)102,1n(P)202,1n(P)l()202,1n(Pdt
dtrt1t2rt (8)
)202,1n(P)203,1n(P)203,1n(Pdt
dtrtrt (9)
)330,2n(P)110,2n(P)130,2n(P)()130,2n(Pdt
dt1t2t112t (10)
)102,1n(Pl )130,2n(P )310,2n(P)110,2n(P)()110,2n(Pdt
dt2t2t1t21c21t (11)
)110,2n(P)302,1n(Pl )330,2n(P)310,2n(P)()310,2n(Pdt
dt1t2t2t221t (12)
)110,2n(P )310,2n(P)130,2n(P)330,2n(P)()330,2n(Pdt
dtct2t1t21t (13)
)023,2n(P)011,2n(P)021,2n(P)()021,2n(Pdt
dtrt2trrt 1
(14)
(15) )013,2n(P
)110,2n(P )202,1n(Pl )031,2n(P)011,2n(P)()011,2n(Pdt
d
tr
t1t2t2trr22t 1
)130,2n(P )011,2n(P )033,2n(P)031,2n(P)()031,2n(Pdt
dt1t2trtr2rt 1
(16)
)310,2n(P )102,2n(P )303,2n(P)302,2n(P)()302,2n(Pdt
dt2t1trtrr1t 2
(17)
)110,2n(P )103,2n(P )302,2n(P)102,2n(P)()102,2n(Pdt
dt2trt1trr11t 2
(18)
)102,2n(P)203,2n(P)202,2n(P)()202,2n(Pdt
dt1trtrrt 2
(19)
)021,2n(P)023,2n(P)023,2n(Pdt
dtrtrt (20)
)011,2n(P)013,2n(P)013,2n(Pdt
dtrtrt (21)
)031,2n(P)033,2n(P)033,2n(Pdt
dtrtrt (22)
ISSN: 0975-5462 4706
Supriya Maheshwari et. al. / International Journal of Engineering Science and Technology Vol. 2(9), 2010, 4701-4716
)302,2n(P)303,2n(P)303,2n(Pdt
dtrtrt (23)
)102,2n(P)103,2n(P)103,2n(Pdt
dtrtrt (24)
)202,2n(P)203,2n(P)203,2n(Pdt
dtrtrt (25)
3n,...,2,1x ),031,1x(P )330,x(P)110,x(P)130,x(P)()130,x(Pdt
dtrt1t2t211t 1
(26)
(27) 3n,...,2,1x
),102,1x(P )011,1x(P )130,x(P )310,x(P)110,x(P)()110,x(Pdt
dtrtrt2t1t21c21t 21
3n,...,2,1x ),302,1x(P )330,x(P)110,x(P)310,x(P)()310,x(Pdt
dtrt2t1t221t 2
(28)
3n,...,2,1x ),110,x(P)310,x(P)130,x(P)330,x(P)()330,x(Pdt
dtct2t1t21t (29)
3n,...,2,1x ),102,x(P)203,x(P)202,x(P)()202,x(Pdt
dt1trtrrt 2
(30)
(31) 3n,...,2,1x
),110,x(P )021,1x(P )302,x(P)103,x(P)102,x(P)()102,x(Pdt
dt2trt1trtrr11t 12
3n,...,2,1x ),310,x(P)303,x(P)102,x(P)302,x(P)()302,x(Pdt
dt2trt1t1rrt 2
(32)
3n,...,2,1x ),130,x(P )033,x(P)011,x(P)031,x(P)()031,x(Pdt
dt1trt2t2rrt 1
(33)
(34) 3n,...,2,1x
),202,1x(P )110,x(P )031,x(P)013,x(P)011,x(P)()011,x(Pdt
dtrt1t2trt22rrt 21
3n,...,2,1x ),011,x(P )023,x(P)021,x(P)()021,x(Pdt
dt2trtrrt 1
(35)
3n,...,2,1x ),202,x(P)203,x(P)203,x(Pdt
dtrtrt (36)
3n,...,2,1x ),102,x(P)103,x(P)103,x(Pdt
dtrtrt (37)
3n,...,2,1x ),302,x(P)303,x(P)303,x(Pdt
dtrtrt (38)
3n,...,2,1x ),031,x(P)033,x(P)033,x(Pdt
dtrtrt (39)
3n,...,2,1x ),011,x(P)013,x(P)013,x(Pdt
dtrtrt (40)
3n,...,2,1x ),021,x(P)023,x(P)023,x(Pdt
dtrtrt (41)
)031,1(P )330,0(P)110,0(P)130,0(P)()130,0(Pdt
dtrt1t2t211t 1
(42)
)102,1(P)011,1(P)130,0(P )310,0(P)110,0(P)()110,0(Pdt
dtrtrt2t1t21c21t 21
(43)
)302,1(P )330,0(P)110,0(P)310,0(P)()310,0(Pdt
dtrt2t1t221t 2
(44)
)110,0(P)310,0(P)130,0(P)330,0(P)()330,0(Pdt
dtct2t1t21t (45)
ISSN: 0975-5462 4707
Supriya Maheshwari et. al. / International Journal of Engineering Science and Technology Vol. 2(9), 2010, 4701-4716
)102,0(P)203,0(P)202,0(P)()202,0(Pdt
dt1trt2rt (46)
)110,0(P)021,1(P)302,0(P)103,0(P)102,0(P)()102,0(Pdt
dt2trt1trt21r1t 1
(47)
)310,0(P )303,0(P)102,0(P)302,0(P)u()302,0(Pdt
dt2trt1t12rt (48)
)130,0(P)033,0(P)011,0(P)031,0(P)u()031,0(Pdt
dt1trt2t21rt (49)
)202,1(P )110,0(P)013,0(P)031,0(P)011,0(P)u()011,0(Pdt
dtrt1trt2t221rt 2
(50)
)011,0(P)023,0(P)021,0(P)u()021,0(Pdt
dt2trt1rt 11
(51)
)202,0(P)203,0(P)203,0(Pdt
dtrtrt (52)
)102,0(P)103,0(P)103,0(Pdt
dtrt1t (53)
)302,0(P)303,0(P)303,0(Pdt
dtrtrt (54)
)031,0(P)033,0(P)033,0(Pdt
dtrtrt (55)
)011,0(P)013,0(P)013,0(Pdt
dtrtrt (56)
)021,0(P)023,0(P)023,0(Pdt
dtrtrt (57)
)302,0(Pu)100,0(P)300,0(P)300,0(Pdt
dt2t1t1t (58)
)102,0(Pu)300,0(P)100,0(P)()100,0(Pdt
dt2t1t11t (59)
)011,0(Pu)030,0(P)010,0(P)()010,0(Pdt
dt1t2t22t (60)
)031,0(Pu)010,0(P)030,0(P)030,0(Pdt
dt1t2t2t (61)
)202,0(Pu )100,0(P)003,0(P)001,0(P)u()001,0(Pdt
dt2t1trt1rt (62)
)021,0(Pu)010,0(P)003,0(P)002,0(P)u()002,0(Pdt
dt1t2trt2rt (63)
)002,0(P)001,0(P)003,0(P)()003,0(Pdt
dtrtrtrrt (64)
)002,0(Pu)001,0(Pu)000,0(P)000,0(Pdt
dt2t1tt (65)
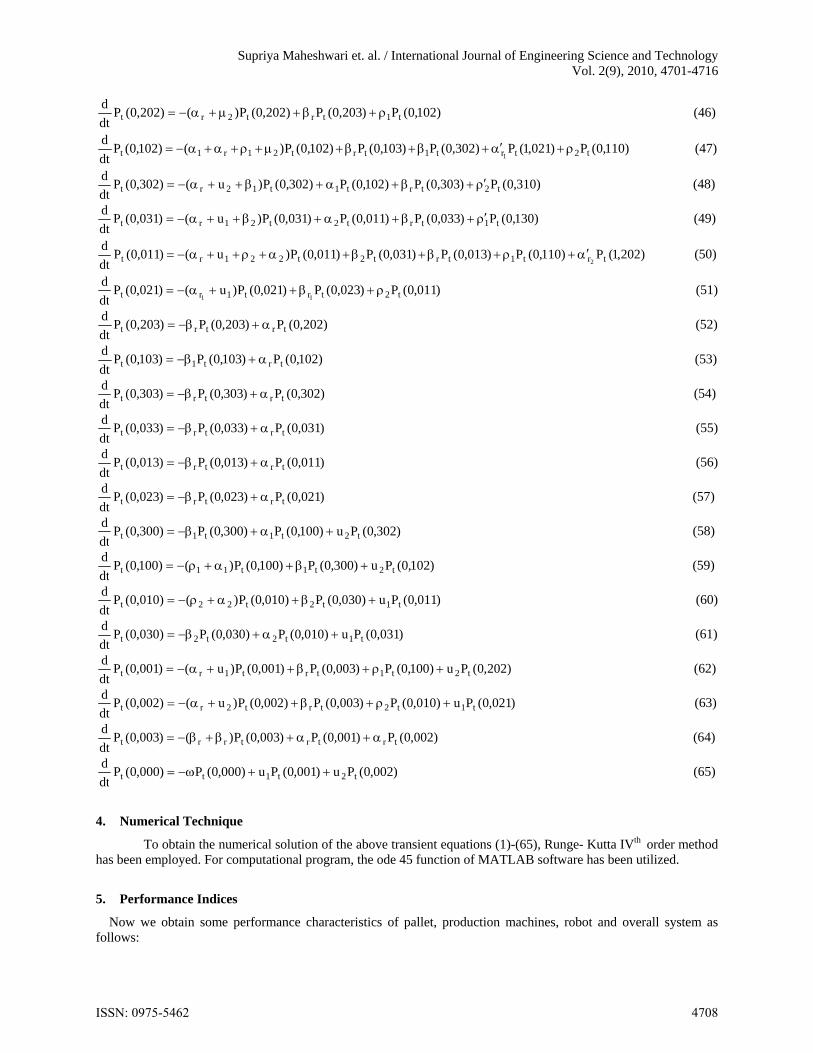
4. Numerical Technique
To obtain the numerical solution of the above transient equations (1)-(65), Runge- Kutta IVth order method
has been employed. For computational program, the ode 45 function of MATLAB software has been utilized.
5. Performance Indices
Now we obtain some performance characteristics of pallet, production machines, robot and overall system as follows:
ISSN: 0975-5462 4708
Supriya Maheshwari et. al. / International Journal of Engineering Science and Technology Vol. 2(9), 2010, 4701-4716
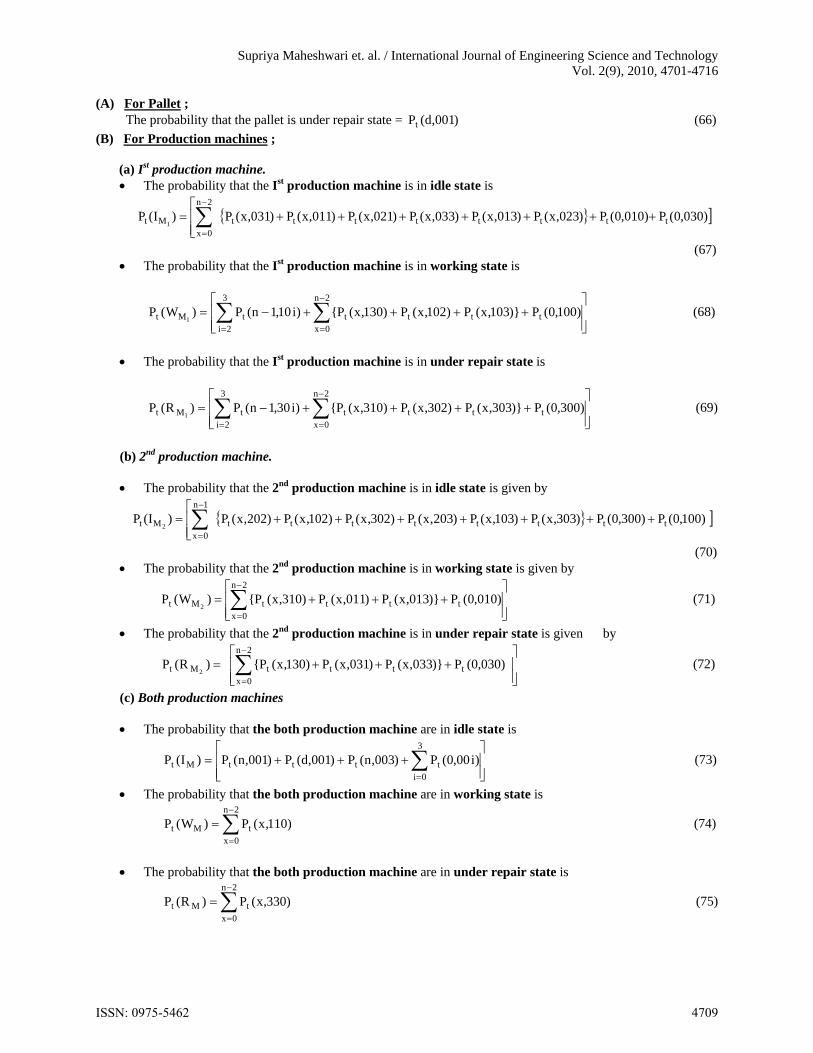
(A) For Pallet ; The probability that the pallet is under repair state = )001,d(Pt (66)
(B) For Production machines ; (a) Ist production machine.
The probability that the Ist production machine is in idle state is
)030,0(P)010,0(P)023,x(P)013,x(P )033,x(P)021,x(P)011,x(P)031,x(P)I(P tttttttt
2n
0xMt 1
(67) The probability that the Ist production machine is in working state is
)100,0(P )}103,x(P)102,x(P)130,x(P{)i10,1n(P)W(P ttt
2n
0xt
3
2itMt 1
(68)
The probability that the Ist production machine is in under repair state is
)300,0(P)}303,x(P)302,x(P)310,x(P{)i30,1n(P)R(P ttt
2n
0xt
3
2itMt 1
(69)
(b) 2nd production machine.
The probability that the 2nd production machine is in idle state is given by
)100,0(P)300,0(P)303,x(P )103,x(P )203,x(P )302,x(P)102,x(P)202,x(P)I(P tttttttt
1n
0xMt 2
(70) The probability that the 2nd production machine is in working state is given by
)010,0(P)}013,x(P )011,x(P)310,x(P{)W(P ttt
2n
0xtMt 2
(71)
The probability that the 2nd production machine is in under repair state is given by
)030,0(P )}033,x(P)031,x(P)130,x(P{ )R(P ttt
2n
0xtMt 2
(72)
(c) Both production machines
The probability that the both production machine are in idle state is
)i00,0(P)003,n(P)001,d(P)001,n(P)I(P3
0ittttMt
(73)
The probability that the both production machine are in working state is
2n
0xtMt )110,x(P)W(P (74)
The probability that the both production machine are in under repair state is
2n
0xtMt )330,x(P)R(P (75)
ISSN: 0975-5462 4709
Supriya Maheshwari et. al. / International Journal of Engineering Science and Technology Vol. 2(9), 2010, 4701-4716
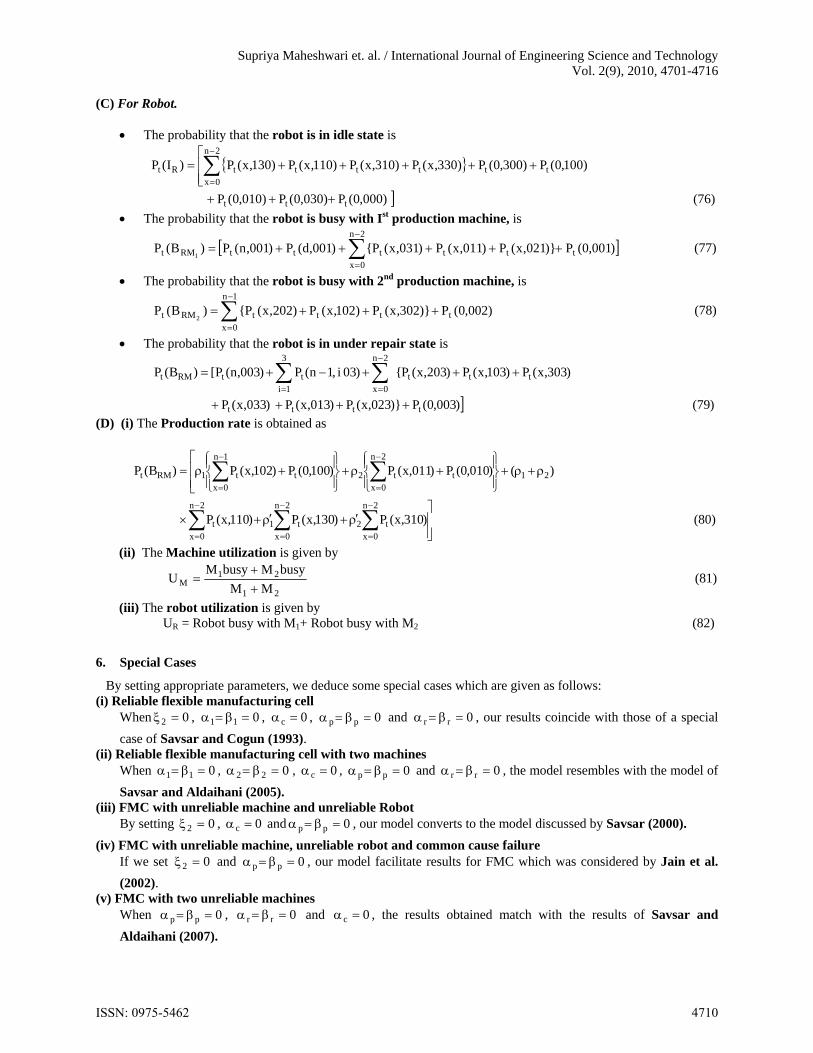
(C) For Robot.
The probability that the robot is in idle state is
(76) )000,0(P)030,0(P)010,0(P
)100,0(P )300,0(P )330,x(P )310,x(P)110,x(P )130,x(P)I(P
ttt
ttttt
2n
0xtRt
The probability that the robot is busy with Ist production machine, is
)001,0(P)}021,x(P )011,x(P)031,x(P{)001,d(P)001,n(P)B(P ttt
2n
0xtttRMt 1
(77)
The probability that the robot is busy with 2nd production machine, is
)002,0(P)}302,x(P )102,x(P)202,x(P{)B(P ttt
1n
0xtRMt 2
(78)
The probability that the robot is in under repair state is
)79()003,0(P )}023,x(P)013,x(P)033,x(P
)303,x(P )103,x(P)203,x(P{)03i,1n(P)003,n(P[)B(P
tttt
ttt
2n
0x
3
1ittRMt
(D) (i) The Production rate is obtained as
(80) )310,x(P )130,x(P)110,x(P
)()010,0(P )011,x(P)100,0(P)102,x(P)B(P
2n
0xt2
2n
0xt1
2n
0xt
21t
2n
0xt2t
1n
0xt1RMt
(ii) The Machine utilization is given by
21
21M MM
busyMbusyMU
(81)
(iii) The robot utilization is given by UR = Robot busy with M1+ Robot busy with M2 (82)
6. Special Cases
By setting appropriate parameters, we deduce some special cases which are given as follows: (i) Reliable flexible manufacturing cell
When 02 , 011 , 0c , 0pp and 0rr , our results coincide with those of a special
case of Savsar and Cogun (1993). (ii) Reliable flexible manufacturing cell with two machines
When 011 , 022 , 0c , 0pp and 0rr , the model resembles with the model of
Savsar and Aldaihani (2005). (iii) FMC with unreliable machine and unreliable Robot
By setting 02 , 0c and 0pp , our model converts to the model discussed by Savsar (2000).
(iv) FMC with unreliable machine, unreliable robot and common cause failure If we set 02 and 0pp , our model facilitate results for FMC which was considered by Jain et al.
(2002). (v) FMC with two unreliable machines
When 0pp , 0rr and 0c , the results obtained match with the results of Savsar and
Aldaihani (2007).
ISSN: 0975-5462 4710
Supriya Maheshwari et. al. / International Journal of Engineering Science and Technology Vol. 2(9), 2010, 4701-4716
7. Numerical Results
In this section, numerical example is presented to illustrate how the performance indices are affected by failure rates, repair rates and other parameters. The default parameters chosen are =0.01, c=0.01, =0.01, ’r1=’r2=’r=2, and =2. The numerical results for the robot utilization (RU), machine utilization (MU) and both production machines in working state P(WM) and under repair state P(RM) are summarized in tables 1-6. The graphical presentation of machine utilization and production rate has been done in figs 3 and 4.
Tables 1-4 display the robot utilization (RU) and machine utilization (MU) by varying the failure rate ( r ) of
the robot, common cause failure rate ( c ) of the machine, failure rate )( of the production machine and repair rate
)( of the production machine, respectively on significant performance measures. It can be observed from table 1
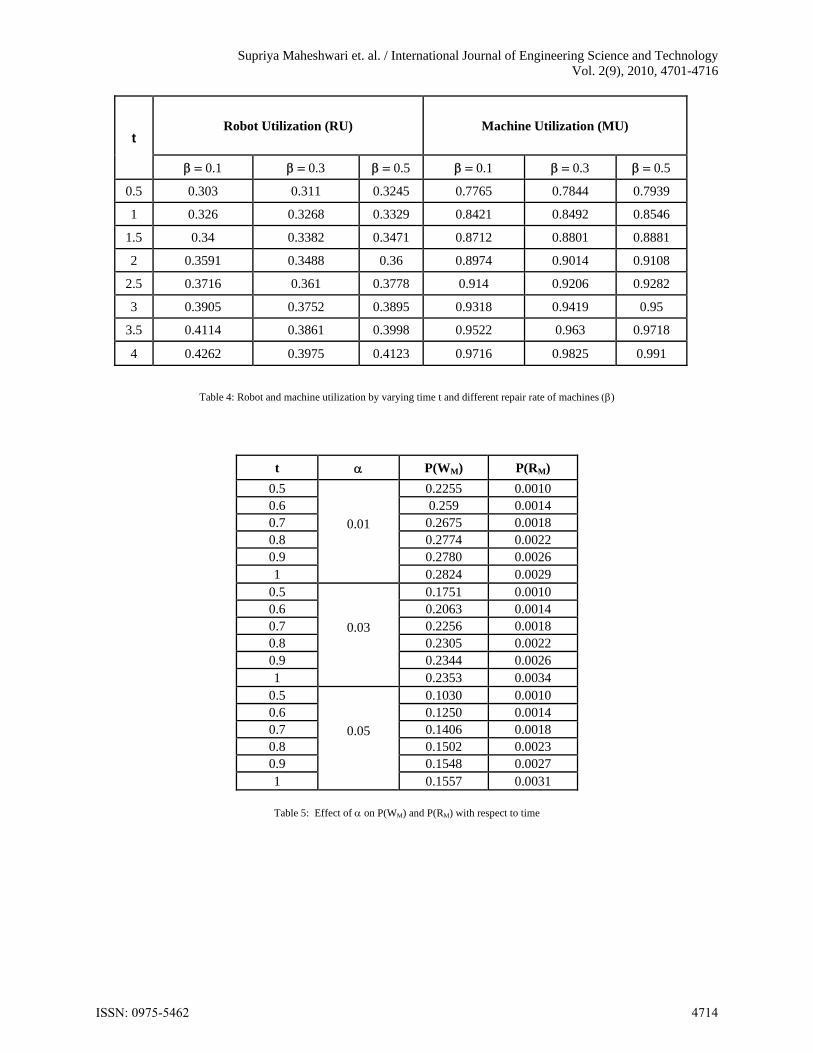
that RU and MU increase (decrease) by increasing the time (failure rate of robot). Similar decreasing patterns of both the performance measures can be seen in table 2, when we increase common cause failure rates. Table 3 exhibits the impact of failure rate of production machines on RU and MU. Once again, it is seen that as the time grows RU and MU also rise but when the failure rates of both machines increase, RU and MU starts decreasing. When the failed machines are repaired quickly, obviously RU and MU should increase; this fact can be observed from table 4, wherein we increase the repair rate. Tables 5 and 6 display the pattern of probability that the both production machines are in working state P(WM) and the probability that both production machines are under repair state P(RM) for varying values of and production rate Both tables reveal the increasing trends of P(WM) and P(RM) by increasing the time. It is seen that P(WM) shows a decreasing trend with respect to increase in . But P(RM) increases slightly as increases. For the increasing values of , P(WM) and P(RM) both increase remarkably.
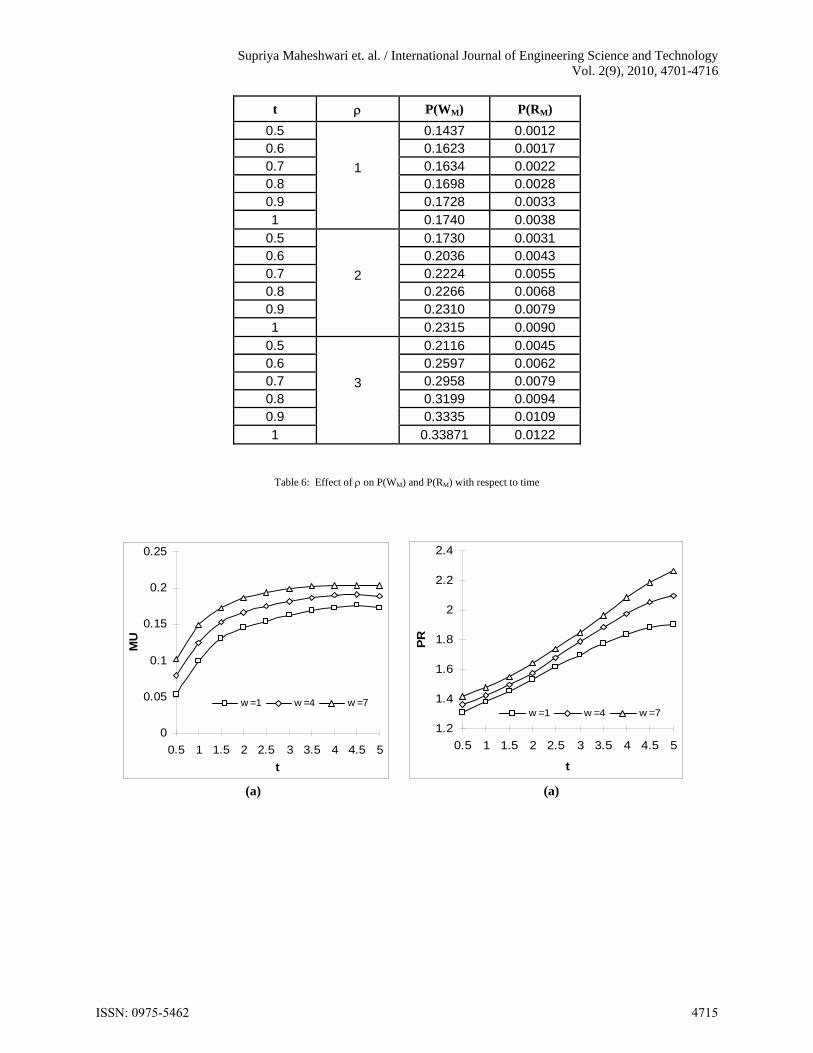
Figs 3-4 display the behavior of machine utilization (MU) and production rate (PR) for different values of pallet transfer rate ),( combined loading/unloading rate ( r ) of the robot and failure rate () of the production machine
with increasing time t. Figs 3(a) and 3(b) show a sharp increasing pattern of MU for primary values of t while it becomes almost constant when time is further increased. It is also observed that MU shows reasonable increment
with varying values of and r . Fig. 3 (c) illustrates that for lower values of t, MU shows a constant trend while
for higher values of t, there is a sudden rise in MU. Also as rises, MU starts dropping which is as per our expectation. Fig. 4(a) exhibits a somewhat linearly increasing trend of PR with respect to time but the trend diminishes for increased values of t. When we examine the effect with respect to , the increment is moderate for the lower values of t while the change is quite significant for larger value of t. Fig. 4(b) reveals a steep increasing pattern of PR for the initial value of time t and after a threshold level it diminishes gradually as time grows; this exceptional pattern may be due to the choice of default parameters. When the variation is checked with respect to increasing values of r , it is found that there is a very slight change in PR initially, however as the time passes, PR
starts increasing. PR depicts increment as time increases but afterward shows a slight decreasing pattern. As increases, PR decreases which is clear from fig. 4(c). Overall we conclude that
As the time grows, various performance indices viz RU, MU, PR, P(WM) and P(RM) increase except in one case i.e. in fig. 4 (b) where PR first increase but after a certain level it shows decreasing trend, which may be due to deterioration in the machining system with time.
Robot utilization (RU) and machine utilization (MU) decreases for the increasing values of r, c and but increase for increasing values of .
As we expect, P(WM) and P(RM) increase for varying values of whereas P(WM) (P(RM)) decreases (increases) with increasing values of which is quite obvious.
8. Concluding Remarks
The robot as well as pallet in FMC can be reprogrammed again after recovery from failure to meet the flexibility which is an essential attribute of an FMC. Robot in FMC can perform a wide range of actions such as material handling, loading/unloading of parts, inspection etc.. Pallet system serves as the interface between robot and work pieces. In this paper, we have analyzed an unreliable FMC consisting of two machines, one robot and an automated pallet system. The randomness of failure and repair are taken into consideration by formulating a stochastic model. The manufacturing cell studied has the capability to produce a wide range of products in a very short time without affecting the manufacturing efficiency. The incorporation of common cause failure and unreliability of machines, robot and pallet system makes our model more versatile to deal with real time FMC system. As cell’s performance relies on several operational and flexible characteristics of machines, robot and pallet
ISSN: 0975-5462 4711
Supriya Maheshwari et. al. / International Journal of Engineering Science and Technology Vol. 2(9), 2010, 4701-4716
system, the incorporation of reliability aspects of these components provides insights to system designers and decision makers to handle failure/repair of such system The future research may include the extension of the present model to m-machines case, multi-gripper robot and non identical machines to have the variation in processing times for different tasks on different machines.
References
[1] Abou-Ali, M.G. and Shouman, M.A. (2004), “Effect of dynamic and static dispatching Strategies on dynamically planned and unplanned FMS”, J. Mater. Process. Tech., 148(1), 132-138.
[2] Aldaihani, M. and Savsar, M. (2005), “Stochastic modeling and analysis of a two machine flexible manufacturing cell”, Comput. Ind. Eng. 49, 600-610.
[3] Berrada, M. and Stecke, K.E. (1986), “A branch and bound approach for machine load balancing in flexible manufacturing systems”, Manage. Sci., 32, 1316-1335.
[4] Chakravarty, A. K. and Shtub, A. (1984), “Selecting parts and loading flexible manufacturing systems”, Proceedings of the first ORSA/TIMS Conference on FMS. University of Michigan, Ann Arbor, 284-289.
[5] Chan, D. and Bedworth, D.D. (1990), “Design of a scheduling system for flexible manufacturing cells”, Int. J. Res., Vol. 28, No. 11, pp. 2037-2049.
[6] Chan, S. F. and Kwan, R. (2003), “Post processing methodologies for off-line robot programming within computer integrated manufacture, J. Mater. Process. Teach., 139(1-3), 8-14.
[7] Cogun, C. and Savsar, M. (1996), “Performance evaluation of a flexible manufacturing cell (FMC) by computer simulation”, Model. Meas Control B, 62(2), 31-44.
[8] Dallery, Y. (1986), “A queueing network model of flexible manufacturing systems consisting of cells”, Proc. IEEE Conf. On Robotics and Automation, San. Francisco, CA, 951-958.
[9] Geismar, H.N., Dawande, M. and Sriskandarajah, C. (2005), “Approximation algorithms for k- unit cyclic solutions in robotic cells”, Euro. J. Oper. Res., 162(2), 291-309.
[10] Gultekin, H. Akturk, M. S. and Karasan, O. E. (2007), “Scheduling in a three machine robotic flexible manufacturing cell”, Comput. Oper. Res., 34(8), 2463-2477.
[11] Gultekin, H., Karasan, O.E. and Akturk, M.S. (2007), “Pure cycles in flexible robotic cells”, Comput. Oper. Res. (In press). [12] Jain, M., Baghel, K.P.S. and Maheshwari, S. (2002), “Flexible manufacturing system with spares and state dependent rates”, Published in
the Proc. On Emerging Convergent Technologies and Systems (SECTAS), Allied Publishers Ltd., New Delhi, (Eds. Prof. S.B. Rao), 272-277.
[13] Kogan, K. and Levner, E. (1998), “A polynomial algorithm for scheduling small scale manufacturing cells served by multiple robots”, Comput. Oper. Res., 25(1), 53-62.
[14] Lin, Li., Wakabayashi, M. and Adiga, S. (1994), “Object-oriented modeling and implementation of control software for a robotic flexible manufacturing cell”, Robot. Comput. Integ. Manuf., 11(1), 1-12.
[15] Sarin, S. C. and Chan, S.C. (1987), “The machine loading and tool allocation problem in an FMS”, Int. J. Prod. Res., 25, 1081-1094. [16] Savsar, M. (2000), “Reliability analysis of a flexible manufacturing cell, Reliab. Eng. Syst. Safety, 67(2), 147-152. [17] Savsar, M. (2006), “Effects of maintenance policies on the productivity of flexible manufacturing cells”, Omega, 34(3), 274-282. [18] Savsar, M. and Aldaihani, M. (2007), “Modeling of machine failures in a flexible manufacturing cell with two machines, served by a
robot”, Reliab. Eng. Syst. Safe. (In press). [19] Savsar, M. and Cogun (1993), “Stochastic modeling and comparisons of two machine flexible manufacturing cell with single and double
gripper robots”, Int. J. Prod. Res., 31, 633-645. [20] Sharifria, A. and Hildebrant, R., (1984), “Modeling flexible manufacturing systems using mean value analysis”, J. Manuf. System, 3, 27-
38. [21] Sohal, A., Fitpatrick, P. and Power, D. (2001), “A longitudinal study of a flexible manufacturing cell”, Integ. Manuf. Syst., 12(4), 236-
245. [22] Vinod, B. (1983), “Queueing models for flexible manufacturing systems subject to resource failure”, Ph. D. dissertation, School of
Indust. Eng., Purdue University. [23] Vinod, D. and Solberg, J. (1985), “The optimal design of flexible manufacturing systems”, Int. J. Prod. Res., 23, 1141-1151. [24] Wahab, M.I.M., Wu, D. and Lee, C. G. (2008), “A generic approach to measuring the machine flexibility of manufacturing systems”,
Euro. J. Oper. Res., 186(1), 137-149 [25] Wang, P. (1990), “A production-planning model for flexible manufacturing systems”, Dissertation, Indust. Eng. Lehigh University. [26] Wang, P.P. and Wilson, G. R. (1994), “Approximations for the mean and variance of the throughput of flexible manufacturing cells”, Int.
J. Prod. Eco., 37(2-3), 275-284. [27] Yamada, A. and Takata, S. (2002), “Reliability improvement of industrial robots by optimizing operation plans based on deterioration
evaluation”, CIRP Annals Manuf. Teach., 51(1), 319-322.
ISSN: 0975-5462 4712

Supriya Maheshwari et. al. / International Journal of Engineering Science and Technology Vol. 2(9), 2010, 4701-4716
t Robot Utilization (RU) Machine Utilization (MU)
r = 0.01 r = 0.03 r = 0.05 r = 0.01 r = 0.03 r = 0.05
0.5 0.4354 0.3927 0.3548 0.694 0.6328 0.5926
1 0.4418 0.3996 0.3664 0.7324 0.6648 0.6214
1.5 0.4511 0.4006 0.3781 0.7646 0.6892 0.6499
2 0.4621 0.4105 0.3857 0.7896 0.7108 0.6736
2.5 0.4713 0.421 0.3934 0.8134 0.7387 0.6912
3 0.4841 0.4305 0.4058 0.8351 0.7594 0.7149
3.5 0.4954 0.4412 0.416 0.8592 0.7888 0.7401
4 0.5102 0.452 0.4244 0.8879 0.8071 0.7655
Table 1: Robot and machine utilization by varying time t and different failure rate of robot r)
t Robot Utilization (RU) Machine Utilization (MU)
c = 0.01 c = 0.03 c = 0.05 c = 0.01 c = 0.03 c = 0.05
0.5 0.3928 0.3615 0.3222 0.7233 0.7106 0.6911
1 0.4096 0.3802 0.3484 0.7921 0.7714 0.7572
1.5 0.42 0.3947 0.3608 0.8361 0.7982 0.778
2 0.4314 0.4104 0.3749 0.8676 0.8182 0.7921
2.5 0.4471 0.4271 0.3891 0.8847 0.8393 0.8112
3 0.452 0.4409 0.4008 0.9066 0.8541 0.8301
3.5 0.4619 0.4555 0.4145 0.9219 0.8711 0.8529
4 0.4748 0.4696 0.4299 0.9442 0.8942 0.8708
Table 2: Robot and machine utilization by varying time t and common cause failure rate of machines c)
t
Robot Utilization (RU) Machine Utilization (MU)
0.01 0.03 0.05 0.01 0.03 0.05
0.5 0.2982 0.2741 0.2602 0.7193 0.7018 0.689
1 0.3112 0.2884 0.2814 0.7714 0.7594 0.7318
1.5 0.3281 0.2997 0.2929 0.7964 0.7717 0.755
2 0.339 0.3128 0.3058 0.8145 0.7926 0.7781
2.5 0.3487 0.3238 0.3162 0.8368 0.8113 0.7919
3 0.3602 0.3401 0.3278 0.8519 0.8303 0.8146
3.5 0.3716 0.352 0.3414 0.8709 0.8515 0.833
4 0.384 0.3644 0.3569 0.8944 0.872 0.8511
Table 3: Robot and machine utilization by varying time t and different failure rate of machine )
ISSN: 0975-5462 4713
Supriya Maheshwari et. al. / International Journal of Engineering Science and Technology Vol. 2(9), 2010, 4701-4716
t Robot Utilization (RU) Machine Utilization (MU)
0.1 0.3 0.5 0.1 0.3 0.5
0.5 0.303 0.311 0.3245 0.7765 0.7844 0.7939
1 0.326 0.3268 0.3329 0.8421 0.8492 0.8546
1.5 0.34 0.3382 0.3471 0.8712 0.8801 0.8881
2 0.3591 0.3488 0.36 0.8974 0.9014 0.9108
2.5 0.3716 0.361 0.3778 0.914 0.9206 0.9282
3 0.3905 0.3752 0.3895 0.9318 0.9419 0.95
3.5 0.4114 0.3861 0.3998 0.9522 0.963 0.9718
4 0.4262 0.3975 0.4123 0.9716 0.9825 0.991
Table 4: Robot and machine utilization by varying time t and different repair rate of machines )
t P(WM) P(RM)
0.5
0.01
0.2255 0.0010 0.6 0.259 0.0014 0.7 0.2675 0.0018 0.8 0.2774 0.0022 0.9 0.2780 0.0026 1 0.2824 0.0029
0.5
0.03
0.1751 0.0010 0.6 0.2063 0.0014 0.7 0.2256 0.0018 0.8 0.2305 0.0022 0.9 0.2344 0.0026 1 0.2353 0.0034
0.5
0.05
0.1030 0.0010 0.6 0.1250 0.0014 0.7 0.1406 0.0018 0.8 0.1502 0.0023 0.9 0.1548 0.0027 1 0.1557 0.0031
Table 5: Effect of on P(WM) and P(RM) with respect to time
ISSN: 0975-5462 4714
Supriya Maheshwari et. al. / International Journal of Engineering Science and Technology Vol. 2(9), 2010, 4701-4716
t P(WM) P(RM)
0.5 1
0.1437 0.0012 0.6 0.1623 0.0017 0.7 0.1634 0.0022 0.8 0.1698 0.0028 0.9 0.1728 0.0033 1 0.1740 0.0038
0.5 2
0.1730 0.0031 0.6 0.2036 0.0043 0.7 0.2224 0.0055 0.8 0.2266 0.0068 0.9 0.2310 0.0079 1 0.2315 0.0090
0.5 3
0.2116 0.0045 0.6 0.2597 0.0062 0.7 0.2958 0.0079 0.8 0.3199 0.0094 0.9 0.3335 0.0109 1 0.33871 0.0122
Table 6: Effect of on P(WM) and P(RM) with respect to time
0
0.05
0.1
0.15
0.2
0.25
0.5 1 1.5 2 2.5 3 3.5 4 4.5 5
t
MU
w =1 w =4 w =7
1.2
1.4
1.6
1.8
2
2.2
2.4
0.5 1 1.5 2 2.5 3 3.5 4 4.5 5
t
PR
w =1 w =4 w =7
(a) (a)
ISSN: 0975-5462 4715

Supriya Maheshwari et. al. / International Journal of Engineering Science and Technology Vol. 2(9), 2010, 4701-4716
0
0.05
0.1
0.15
0.2
0.25
0.5 1 1.5 2 2.5 3 3.5 4 4.5 5
t
MU
a'r=4 a'r=6 a'r=8
(b) (b)
0.1
0.12
0.14
0.16
0.18
0.2
0.22
0.24
0.5 1 1.5 2 2.5 3 3.5 4 4.5 5
t
MU
0.95
1
1.05
1.1
1.15
1.2
1.25
1.3
1 1.5 2 2.5 3 3.5 4 4.5 5
t
PR
(c) (c) Fig. 3: Machine utilization by varying Fig. 4: Production rate by varying
(a) (b) r (c) q (a) (b) r (c) q
0.5
0.7
0.9
1.1
1.3
1.5
1.7
1.9
2.1
0.5 1 1.5 2 2.5 3 3.5 4 4.5 5
t
PR
a'r=4 a'r=6 a'r=8
ISSN: 0975-5462 4716