unrelated diversification strategies by port authorities ... · rukindo pengerukan indonesia...
TRANSCRIPT

i
Erasmus University Rotterdam
MSc in Maritime Economics and Logistics
2014/2015
Unrelated Diversification Strategies by Port Authorities: a Case Study based Comparison
by
Clara Henryanto
Copyright © Clara Henryanto


iii
Acknowledgements The completion of this thesis would not have been possible without the generous support of the author’s supervisor, colleagues, family and many friends. I convey to all of them my deepest gratitude and appreciation. I would like to thank Dr. Michael Dooms who has been my supervisor, and indeed my mentor. He has provided guidance and encouragement during the entire preparation and writing of the thesis. Also, I would like to thank Carlos Zepeda from Port of Rotterdam, David Wignall from IPC, and Xinyao Liu from Dalian Port, for acting as respondents for this project. I really appreciate the time you took answering my emails, talking via Skype, or even meeting in person. Furthermore, I would like to thank all of my friends in the MEL class. I really enjoyed this class as you all provided me with so many lessons that I could learn. This was a precious experience for me. Finally and most importantly, I would like to express my greatest of gratitude to my beloved parents, Papa and Mama. Thank you for your unconditional love and for always praying for me. I dedicate this Master Thesis to you.


v
Abstract
It appears that there is a tendency in which some port authorities implement unrelated diversification strategies. This means that they have a number of divisions or subsidiaries which are to some extent outside their core activities. Yet, the study about this topic is relatively unexplored. Hence, this study aims to investigate the main question “Do unrelated diversification strategies contribute to the building of capabilities in port authorities organizations?” To answer this question, we performed desk research which included figuring out what unrelated diversification means from the strategic management literatures, how port governance gives impact to the unrelated strategies, and the link between the resources and capability of the port authority when it comes to such a strategy. Furthermore, we performed Entropy measurement which allows us to determine and measure the degree of unrelated diversification. This method was used in our archival research which was aimed to obtain an understanding about several characteristics of some ports in three different regions; Asia, Europe, and North America, with respect to unrelated diversification strategies. Based on this research, we constructed a case study with different level of unrelated strategies, namely high, medium and low represented by Dalian Port, Indonesia Port Corporation (IPC) and Port of Rotterdam (PoR) respectively. This study found that port authorities, which operate as port operators and have financial autonomy, are more likely to have unrelated businesses. Moreover, we summarise that the benefits of unrelated diversification in port industry encompass the dimension of income growth and resource and knowhow sharing, which are aimed to improve port capability in providing integrated as well as value-added port services. The contributions of unrelated business units vary among the three ports. In the case of Dalian Port, its unrelated businesses seem to perform significantly as they contribute considerable income and efficient resource synergies. In IPC, the port company might benefit from knowhow sharing but the income contribution from its unrelated businesses shows not significant as some of the subsidiaries experienced loss. While in PoR, the international division, which is intended to improve financial position of the port authority, appears to also not contribute clearly in terms of direct income.

vii
Table of Contents
Acknowledgements .................................................................................................. iii
Abstract .................................................................................................................... v
List of Tables ........................................................................................................... ix
List of Figures ........................................................................................................... x
List of Abbreviations ................................................................................................ xi
1 Introduction ....................................................................................................... 1
1.1 Research Objective ......................................................................................... 2
1.2 Research Methodology .................................................................................... 2
1.3 Thesis Structure .............................................................................................. 3
1.4 Relevance of the Topic .................................................................................... 4
2 Literature Review .............................................................................................. 5
2.1 Overview of Diversification............................................................................... 5
2.2 Unrelated Diversification .................................................................................. 5
2.2.1 Measurement ...................................................................................... 6
2.2.2 Drivers ................................................................................................ 7
2.2.3 Implications ......................................................................................... 9
2.2.4 Role of Path Dependence ................................................................. 10
2.3 Port Governance ........................................................................................... 10
2.3.1 Port model......................................................................................... 10
2.3.2 Port Ownership ................................................................................. 12
2.3.3 Role of Port Governance ................................................................... 13
2.4 Competence, Resource and Capability .......................................................... 14
2.4.1 Overview ........................................................................................... 14
2.4.2 Competences of Port Authority.......................................................... 16
2.4.3 Link between Resources and the Capabilities of Port Authorities and Unrelated Diversification ................................................................................. 17
3 International Practices .................................................................................... 19
3.1 Regional Port ................................................................................................. 19
3.1.1 Asian Ports........................................................................................ 19
3.1.2 European Ports ................................................................................. 23
3.1.3 North American Ports ........................................................................ 27
3.2 Comparison results ........................................................................................ 30
4 Case Study ..................................................................................................... 33
4.1 Dalian Port ..................................................................................................... 33
4.1.1 Policy Framework in China ................................................................ 33
viii
4.1.2 Company Profile of Dalian Port ......................................................... 34
4.1.3 Corporate strategy ............................................................................ 38
4.2 Indonesia Port Corporation ........................................................................... 39
4.2.1 Policy Framework in Indonesia ......................................................... 39
4.2.2 Company Profile of IPC .................................................................... 40
4.2.3 Corporate Strategy ........................................................................... 42
4.3 Port of Rotterdam .......................................................................................... 45
4.3.1 Policy Framework in the Netherlands ............................................... 45
4.3.2 Company profile of the Port of Rotterdam ......................................... 46
4.3.3 Corporate strategy ............................................................................ 47
4.4 Comparison Results ...................................................................................... 49
4.4.1 Summary of the Characteristics of the Three Ports ........................... 49
4.4.2 “Do unrelated diversification strategies contribute to the building of capabilities in port authorities’ organizations?” ............................................... 51
5 Conclusion ..................................................................................................... 53
5.1 Conclusion .................................................................................................... 53
5.2 Limitation and Further Research ................................................................... 54
Bibliography ........................................................................................................... 57
Appendices ............................................................................................................ 65
I. Renaissance Matrix ....................................................................................... 65
II. Entropy Measurement ................................................................................... 66
III. Interview Information ..................................................................................... 70

ix
List of Tables Table 1: Some Diversification Measurements from Previous Studies 6 Table 2: Responsibility Allocation of Port Models under the World Bank 12 Table 3: Type of Ownership of four Port Models 12 Table 4: Container Growth, Port Governance, Workforce and Unrelated Diversification of Asian Ports 20 Table 5: Container Growth, Port Governance, Workforce and Unrelated Diversification of European Ports 24 Table 6: Container Growth, Port Governance, Workforce and Unrelated Diversification of North American Ports 27 Table 7: A Comparison of the Findings from Three Regions 30 Table 8: Dalian Port’s growth of various commodities and income period from 2009-2014 37 Table 9: Types of Activities Carried Out by Dalian Port Subsidiaries 38 Table 10: IPC Business Activities 41 Table 11: IPC’ list of Subsidiaries based on Category and Year Established 43 Table 12: The Percentage of Internal Transaction with IPC Group of Each Subsidiary’s Income 44 Table 13: The Comparison of the Objective and Contribution of Unrelated Business on Three Ports 51 Table 14: Hypothetical Typology of Port Authorities 65 Table 15: Data and Results of the Entropy Measurement 66 Table 16: Some Information about the Port Representatives 70

x
List of Figures Figure 1: Thesis Structure 3 Figure 2: The Root of Competitiveness 15 Figure 3: The Competence Hierarchy 15 Figure 4: Framework of the Link between Resources and Capabilities of Port Authorities and their Unrelated Diversification 17 Figure 5: Location of Dalian Port 35 Figure 6: Percentage Average Showing the Various Sources of Income Received from the Period 2007 to 2014 at Dalian Port 37 Figure 7: IPC Operational Area 41 Figure 8: Percentage Average of the Source of Income in the Period 2007-2014 of IPC 42 Figure 9: IPC’s trend of total assets, operating income and containers throughput in the period from 2007-1014 42 Figure 10: Port of Rotterdam Business Plan 2011-2015 47 Figure 11: Percentage the Source of Income 5 year Period from 2007-2012 49
xi
List of Abbreviations
ADB Asian Development Bank
BOD Board of Director
BSD Broad Spectrum Diversification
CEO Chief Executive Officer
CIMC China International Marine Containers
DCV Dynamic-capability view
DPI Dubai Ports International
DT Related diversification
DU Unrelated diversification
EDII Electronic Data Interchange Indonesia
EPI Energi Pelabuhan Indonesia (Power Provider)
ESPO European Sea Ports Organisation
EU European Union
FTZ Free Trade Zone
HHLA Hamburger Hafen und Logistik AG
HPA Hamburg Port Authority
HPH Hutchison Port Holding
IAPH International Association of Ports and Harbors
IKT Indonesia Car Terminal
ILCS Integrasi Logistik Cipta Solusi
IPC Indonesia Port Corporation
IPC TPK IPC Terminal Petikemas Indonesia (Container Terminal)
IT Information Technology
JAI Jasa Armada Indonesia (Tugboat)
JICT Jakarta International Container Terminal
JPPI Jasa Peralatan Pelabuhan Indonesia (Equipment)
LNG Liquefied Natural Gas
MPA The Maritime and Port Authority of Singapore
MTI Multi Terminal Indonesia
NSD Narrow Spectrum Diversification
OECD Organization for Economic Co-operation and Development
Pelindo Pelabuhan Indonesia
PHA The Port of Houston Authority
PKA Port Klang Authority
PMLI Pendidikan Maritim & Logistik Indoneisa (Training Centre)
PoA Port of Antwerp
PoR Port of Rotterdam Authority
PoZ Port of Zeebruge
PPA Philippine Port Authority
PPI Pengembang Pelabuhan Indonesia (Port Developer)
PTP Pelabuhan Tanjung Priok (Terminal)
PVA Port Authority of Valencia
RBV resources-based view

xii
RSP Rumah Sakit Pelabuhan (Hospital)
Rukindo Pengerukan Indonesia (Dredging)
SBU Strategic Business Unit
SEZ Special Economic Zone
SIC Standard Industrial Classification
SLPA Sri Lanka Port Authority
SOE State-owned Enterprise
TEUs Twenty-feet Equivalent Units
TPI Terminal Petikemas Indonesia (Container Terminal)
UNCTAD United Nations Conference on Trade and Development
VPA Virginia Port Authority
WTC World Trade Centre
WTO World Trade Organization

1
1 Introduction Globalization is a prominent phenomenon when discussing international economics. According to an article published in the World Development Report (2009), there are two waves of globalization. The first wave, from 1840 to World War I, was characterized by international trade that exploited differences in natural endowment. Whereas, the second wave occurred after 1950, international trade was driven more by economies of scale and product differentiation. Pulitzer Prize Winner, Thomas L. Friedman asserts this phenomenon aptly in the title of his book “The World is Flat”. The world has become the global marketplace. Globalization boosts international trade, thereby increasing international transportation (Rodrigue and Notteboom, 2009). Furthermore, the maritime industry has benefited from globalization due to the increasing in seaborne trade. From 1975 to 2013, seaborne shipment increased by as much as 300 per cent (Review of Maritime Transport, 2014). While seizing upon this opportunity, firms also have to compete in the “new modern international competition” which in turn puts additional pressure on a firm’s logistics activities (Berezhnoy, 2012). Robinson (2012) asserts that in a highly competitive economy, firms compete within their supply chain. He argues that more logistics chains become focused on seaports. In order to survive, firms have been developing so-called strategies at the corporate level. One of the most prominent strategies is diversification strategy. This strategy entails that a firm can expand its business units which can be either in related or unrelated industries. A recent study by De Langen and Haezendonck (2012) state that in order to develop port networks, ports can engage in horizontal integration with other ports or vertical integration with inland ports. Here we are witnessing a trend of diversification strategy in port authority. In addition, some ports, particularly in developing countries such as in Indonesia and China, have the tendency to have business units that are involved outside the core activities of the port authorities. For instance, IPC-Indonesia Port Corporation (state-owned port company in Indonesia) has subsidiaries which are based in hospitality and the IT industry, whereas Dalian Port has diversified businesses consisting of a wide range from property, software development, shipping leasing, to commodity trading services. In other words, there is a trend towards unrelated diversification in port authority. However, studies concerning unrelated diversification in port industry are very limited. Thus, it would be interesting for us to investigate the contribution of unrelated business to the building of capabilities in port authority’s organizations in order to survive in such a competitive market. We surmise that know-how sharing between business units might actually improve the capability among the firms, and thus subsequently increase the parents’ company value. In light of the aforementioned, this research aims to analyse the role of the unrelated diversification strategy that is needed to build capability with respect to port authorities. The research findings could therefore provide insight and offer valuable knowledge for executive managers in port as well as maritime industries when making corporate-level decisions.

2
1.1 Research Objective The main research question is “Do unrelated diversification strategies contribute to the building of capabilities in port authorities organizations?” Therefore, in order to answer the main research question, the following sub-research questions have been formulated: 1. What is unrelated diversification strategy, and how can it be defined and
measured? What are its drivers and implications? 2. What is the role of path dependence when it comes to unrelated diversification? 3. What is the role of the institutional context when it comes to unrelated
diversification? 4. What is the link between resources and capabilities of port authorities and their
unrelated diversification strategy?
1.2 Research Methodology In order to answer this research question, we have conducted a qualitative research approach. Further details about the methodologies used are listed below: a. Desk research
To our knowledge, up until now no study concerning the role of unrelated diversification in the port authority has previously been conducted. Thus, we have decided to conduct desk research for two reasons. First, it is important to understand the basic concept regarding diversification and unrelated diversification from strategic management literatures. Second, several issues regarding port governance should be gathered in order to understand how this industry works. This research aims to answer sub-research questions as well as allow us to draw the conceptual framework of the relationship between unrelated diversification and port authority’s capabilities.
b. Archival research We conduct archival research in order to obtain some facts about the practices of unrelated diversification strategy in several ports worldwide. Since it is important to use reliable and comparable data, we have used annual reports as a method for providing basic data from the period 2009-2013. We had expected to obtain as many ports as possible so that so that it would be sufficient to represent the characteristic of the population. Unfortunately, we only found 21 ports which possessed good quality annual reports. As a result, we have used 21 ports altogether or 7 ports per continent as we have used three separate continents: North America, Asia, and Europe. Several aspects are compared such as container growth, port governance, number and type of subsidiaries, total workforce, and the degree of unrelated diversification. In regard to the latter, we have used a method to measure unrelated diversification based on previous studies which will be further discussed in Chapter two. Furthermore, we should mention that this research is mainly exploratory, thus the reliability and validity of the data rely on the quality of port authorities’ website and annual reports.
3
c. Interview As we need a manager point of view, it is important to hold interviews with port managers so that a better understanding about why port authority implement unrelated diversification strategy can be obtained. This aspect encompasses the motivations, the problems and the expectations that port authorities have when applying such a strategy. Their opinions might verify the findings obtained from desk and archival research. Furthermore, the results of the interview will be used to develop a case study that is especially meant to highlight some particular issues (see Appendices III for further details about the respondents).
d. Case study The motivation of this case study is to obtain comprehensive understanding about the conditions in several ports. This case study is developed using the framework that is proposed in desk research and based on results from the archival research and the interview. We discuss three ports each with different level of unrelated diversification namely: high, medium and low which are represented by Dalian Port, Indonesia Port Corporation (IPC) and Port of Rotterdam respectively. For each port, we discuss policy framework, port governance and corporate strategy. Afterwards, we present comparison results of those three ports and answer the main research question.
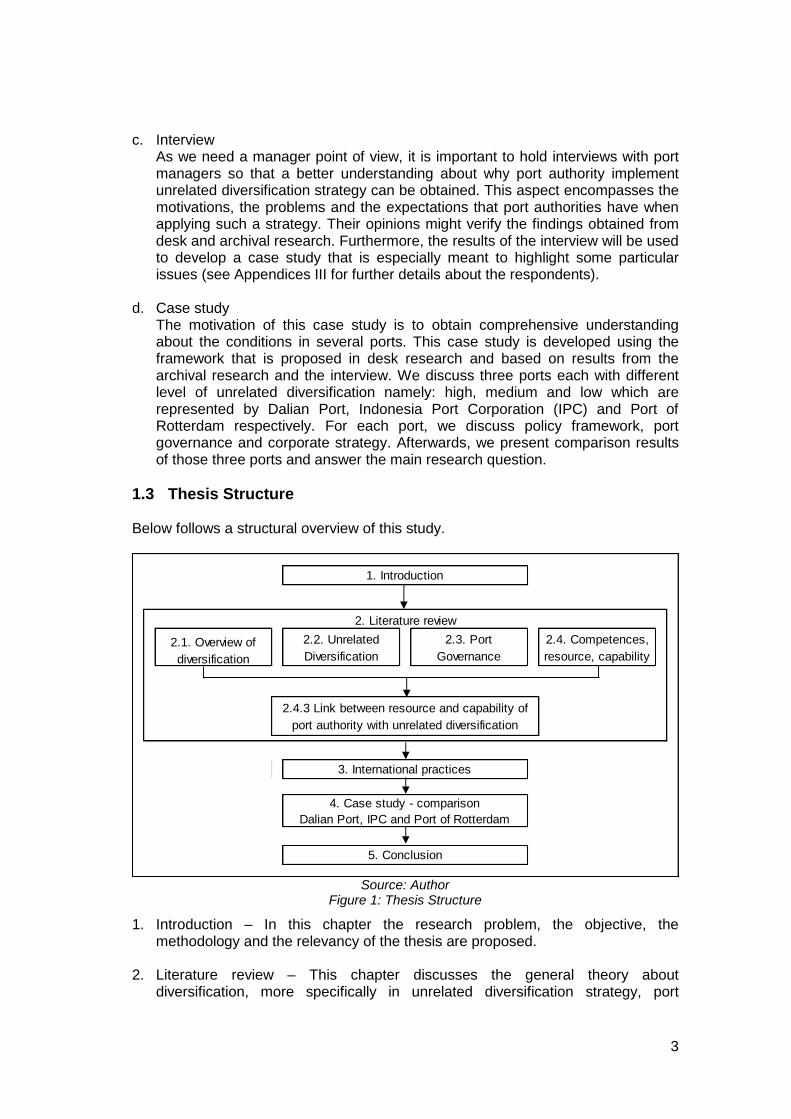
1.3 Thesis Structure Below follows a structural overview of this study.
Source: Author
Figure 1: Thesis Structure
1. Introduction – In this chapter the research problem, the objective, the methodology and the relevancy of the thesis are proposed.
2. Literature review – This chapter discusses the general theory about diversification, more specifically in unrelated diversification strategy, port
2.1. Overview of
diversification
2.2. Unrelated
Diversification
2.3. Port
Governance
2.4. Competences,
resource, capability
1. Introduction
4. Case study - comparison
5. Conclusion
3. International practices
Dalian Port, IPC and Port of Rotterdam
2. Literature review
2.4.3 Link between resource and capability of
port authority with unrelated diversification

4
governance, resource-based view and capability. These theories allow us to develop the framework of the link between unrelated diversification strategy and port resources and capabilities.
3. International practices – This chapter is based on archival research which aims
to gain an understanding about the characteristics of each region. In this case we have taken the regions Asia, Europe and North America. We compare several aspects including container growth, port governance, number and type of subsidiaries, total workforce, and the degree of unrelated diversification. We perform a descriptive analysis to discuss each port briefly and to present a comparison of the results found in these three regions.
4. Case study – This chapter discusses three case studies used in this study. It is developed using the conceptual framework that is proposed in literature review and divided into four sections. The first three chapters discuss each of the unrelated diversification strategies used in Dalian Port, IPC and Port of Rotterdam. These embrace the policy framework of the China, Indonesia and the Netherlands, the company profile, and corporate strategy which focus on unrelated business. The forth section compares the results and answers the main research question based on the three case studies.
5. Conclusion – This chapter presents the findings of the study, its limitations and it
describes recommendations for further research.
1.4 Relevance of the Topic This study is relevance mainly for the following. a. Just as in other industries, constructing a corporate strategy is critical in order to
survive amid all of the competition, and it is vital for achieving better performance, both technically and financially. Due to the fact that in some countries there are ports which have unrelated subsidiaries, it is interesting to discover the rationale behind this and how this strategy could be applied in the port industry. This study might provide insight port managers and external parties such as government, bank, and other stakeholders.
b. Since the topic of unrelated diversification in port companies is hardly discussed
in the maritime and port industry literature, this study can provide additional knowledge for conducting the academic research.
5
2 Literature Review
2.1 Overview of Diversification According to Rumelt (1982), who was a pioneer in the strategic management studies, diversification occurs when a firm expands in order to make and sell products or to develop a product line that has no market interaction with each of the firm’s other products. Another scholar, Pandya and Rao (1998) conclude that diversification is a means by which a firm expands from its core business into other product markets. When referring to organizational structure, diversification can be accommodated under divisions within the company or independent entities which are so-called subsidiaries, through self-establishment, acquisitions or mergers. As corporate strategy, a firm which implements diversification strategy should concern with two questions: ‘What business the firm should be in?’ and ‘How should the firm manage the composition of business units’ (Porter et al. 1996)? Firms can benefit diversification through greater market power, more efficient asset deployment, transferring skilled labour and reducing the chance of bankruptcy by transferring funds from a cash surplus unit to a cash deficit unit (Pandya and Rao, 1998; Reed and Luffman, 1986). In other words, the benefit from such strategy encompasses the dimension of growth, resources synergy and risk reduction. Some previous studies have attempted to separate diversification into two types, namely related and unrelated. They examined whether there is a different result concerning the firm performance. Some of these studies revealed that firms with related business portfolios appeared to out-perform with unrelated diversification (Rumelts, 1982; Christensen and Montgomery, 1981; Wade and Gravill, 2003). In contrast, Michel and Shaked (1984) find that unrelated diversification generates superior risk-return than related diversification. The results are still varied but this study will not focus on these debatable findings. Instead, we will focus on unrelated diversification as it is applied to port authorities. Moreover, unlike the previous studies which used financial indicators as proxies of the performance, this study tends to examine the relationship of unrelated diversification strategy and the capability of the port authority.
2.2 Unrelated Diversification As mentioned above, there are two types of diversification, namely related and unrelated. In this study we will focus on unrelated diversification, it is important to stress the difference of these diversifications in term of definition. According to Anthony and Govindarajan (2006), related diversification exists when a firm owns a number of business units that are related in some way. These could be that they are involved in a similar industry and they have a common set of competences. In the port industry, for instance, port authorities have subsidiaries such as terminal operator companies In contrast, under unrelated diversification, a firm diversifies its business units into different areas or industries which are unrelated to one another. We can take the

6
example of Dalian Port which has diversified its business into property, software development, telecommunication and even commodity trading. Broadly speaking, the definition provided seems clear. However, in this particular industry, we should also aware that several port models exist in this world. These models help us in some extent when defining the core activities as well as the port authority’s capability. Thus, it is important to take this issue into account when determining whether the subsidiaries are related or unrelated. This will be discussed in more detail later in the sub-chapter the role of port governance. 2.2.1 Measurement There is an issue in previous studies regarding how the degree of unrelated diversification can be measured. Several measurements have been developed by several scholars and these are summarized below in Table 1. Table 1: Some Diversification Measurements from Previous Studies
Source: Sambharya (2000)
DT=DR + DU Strengths: can capture diversification
across product groups which are in related
(DR) and unrelated (DU) and compute the
amount of Total Diversification (DT).
Where
m = number of industry groups
j = 1,…,m
pj = share of jth group sales in the total
sales of the firm..
Based on:
(i) specialization ratio;
(ii) direction of diversification;
(iii) vertical ratio
There are 4-category classification
schemes:
1. single business;
2. dominant business;
3. related business;
4. unrelated business.
Broad Spectrum Divers. (BSD) is defined
as the number of 2-digit SIC codes in
which a firm operates.
Strengths: simple and ease of
measurement and computation.
Narrow Spectrum Divers. (NSD) is defined
as the number as the 4-digit SIC codes a
firm participates in divided by the number
of 2-digit SIC categories the firm operates
in.
Weaknesses: the reliability is
questionable.
Weaknesses: it can be subjective and
time consuming in order to obtain
extensive information from various
sources.
Measure/Authors Description Remarks
Entropy (Palepu,
1985)
Rumelt’s
classification (Rumelt,
1974)
Broad and narrow
spectrum diversify
(Varadarajan and
Ramanujam, 1987)
Weaknesses: the computation is
complex, it relies on the accuracy of
reports and information available only for
the 10 largest product segments.
Strengths: it provides conceptual rigour
as this model relies on insight into the
firm’s history, behaviour, and core skills.
7
A study by Sambharya (2000) found that there is no strong evidence that the entropy measure (Palepu, 1985) is superior to other measures of diversification. However, the author argued this model serve as a primary measure considering its technical rigour, strong theoretical base and lack of subjectivity. These outcomes are in line with Hoskisson et al. (1993) who found strong support regarding the validity of the entropy measure. The method is also widely used by many scholars (Rameswamy et al, 2004; Chakrabarti et al, 2007; Park and Jang, 2013). Furthermore, Palepu (1985) used the Standard Industrial Classification (SIC) to define whether the business unit is in related or unrelated industry. Subsidiaries that belong to different 4-digit SIC industries within the same first 2-digit industry are considered as being related. Subsidiaries from different first 2-digit SIC industry are classified as unrelated. Thus, for the purpose of this study, entropy measure will be conducted to define the degree of unrelated diversification in port authorities. 2.2.2 Drivers In order to create conceptual framework that shows how unrelated diversification strategy works in port industry, it is critical to know which kinds of drivers pertain to such a strategy, in general. We have collected findings and results from previous studies, especially in strategic management literatures. Thus, in this sub-chapter, several drivers will be discussed. Performance Hall (1995) argues that firms that possess superior performance also possess the capability or ability to implement diversification, mainly because such firms have huge profits to finance the diversification. The author found that an organization’s past performance had an effect in regard to the desire to implement diversification, which is either related or unrelated. However, the study also found that firms with a high unrelated diversification did not perform as well as firms having a lower degree of unrelated diversification, suggesting that the willingness to diversify does not reflect the ability to diversify. General Electric (GE) can be viewed as the case in which superior past performance drove the company to diversify its business. In the late 1890’s, it started running a business in the electric-related industry, but now GE has spread its businesses to include aviation, finance, healthcare, oil and gas. Thanks to the invention of electricity as a basic human need as well as generating huge profits. In the port industry, IPC can be the example, as recently the port established a number of subsidiaries which are funded by surplus cash generated from operating activities (IPC Annual Report, 2014). Institutional context While in developed countries, companies tend to be focused enterprises, in emerging countries, business groups or so-called conglomerations continue to grow. This phenomenon was studied by Ramachandran et al. (2013). Conglomerations have several names in other countries such as qiye jituan in China, chaebol in South Korea, grupos economicos in Latin America and ‘holding’ in other countries. This business group tends to diversify in an unrelated sector to their prior business. The

8
authors stress that business groups are different from multidivisional in two characteristics. First, the companies of a business group are legally independent entities which have their own board of directors, corporate strategy and performance measurements. Second is there is a high level of involvement by the parent in terms of the major shareholder as well as the decision maker regarding investments. They argue that these traits can help the parent company to drive its diverse business in the three important areas namely greater autonomy in decision making, greater incentive to pursue performance and better resource allocation. The tendency of creating conglomeration in port industry can be seen in China as some ports such as Shanghai and Dalian Port manage a large number of subsidiaries (20-40 companies is common) with some of them are unrelated segments. Another issue is that diversification, as a corporate strategy, is an organizational decision as there are several parties involved such as the Board of Directors (BODs), the CEOs, the shareholders, and the banks. Rameswamy et al. (2004) have examined the organizational context in diversification. In particular, they dealt with the question, ‘Who are the actors who drive the process of unrelated diversification?’ This study was set in the Indian manufacturing sector and the results show that external constituents such as banks have more influence on unrelated diversification decision than CEOs and boards. More specifically, banks are quite encouraging of such a strategy. However, one could argue that it still needs further research whether this finding is valid in other countries. In addition, Kock and Guillen (2001) have asserted that under protectionism in the late-developing countries, contact and connection have become more critical than organizational and technological capabilities. This, in turn, leads to unrelated diversification. Risk “Don’t put all your eggs in one basket” is the most well-known adage in investment, especially when it concerns business portfolios. This embraces the dimension of risk and return. In this financial perspective, Montgomery and Singh (1984) state that the principal concerns are the return of the stock and the associated risk of the stock. They mentioned this associated risk consists of two parts, namely specific risk (un-systematic risk) and market risk (systematic risk-β). Specific risk relates to inherent or unique risk of the firm itself, whereas market risk, accounts for 20-30 per cent of the total, relates to general market trend. Michel and Shaked (1984) propose that unrelated diversification has little effect on the weighted average systematic risk, but it has the potential to reduce total risk. They found evidence that firms that diversify in unrelated areas can generate statistically superior performance over those firms with predominantly related areas. Thus, avoiding and reducing risk is a drive for a firm to diversify into unrelated areas, especially when concerning in the uncertainties of instability and rapid change (Nachum, 1990). In the port context, Dalian Port develops risk management by entering promising unrelated industries such as information technology and trading as well as diversifying its commodities (oil, automobile, grain bulk, and ore).

9
2.2.3 Implications Diversification strategy can be both beneficial and costly for a firm. Montgomery (1994) argues that the implication of such a strategy can be analyzed from three perspectives: namely, the market-power view, the resource-view and the agency view. Market-power view This view argues that diversified firms may have access to conglomerate power. Conglomerates can obtain power through cross-subsidization and reciprocal buying. Cross-subsidization is when a unit with surplus cash transfers funds into a deficit cash unit, whereas reciprocal buying concerns internal trade among business units. Regarding these treatments, Chang and Hong (2000) have pointed out that the most common way of cross-subsidization is by manipulating transfer prices with internal transactions such as loans and debt guarantees. Moreover, they found that in the Korean conglomeration, chaebols, internal trading, selling and purchasing account for 72.6 percent of total sales. This concept might explain some ports, in emerging market such as in China and Indonesia, tend to have a number of subsidiaries, considering also their natural monopoly in the past. In general, Montgomery (1994) states that market power is the consequence of diversification. According to this view, as a firm can obtain the market power effect; diversification gives a positive effect to firm performance as the transaction costs are potentially reduced due to internal transactions. However, she argued that conglomeration can lead to reduced competition. Resource-view This view argues that firms diversify in response to having an excess capacity of resources (Peteraf, 1993). Resources of the firm include items of brand-names, trade contact, capital equipment, skills of employees, patents, finance, and so on (Wernerfelt, 1984; Grant, 1991). Halawi et al. (2005) argues that we are in a new era, namely the knowledge era. Thus, knowledge can be seen as a strategic asset. Many scholars believe that through diversification, a firm can create economies of scale and scope as the utilization of assets is more efficient in regard to transferring technological and employee skills or know-how among business units, thus indicating synergy among business units (Teece, 1980; Reed and Luffman, 1986; Pandya and Rao, 1998). More specifically, operational synergies are usually associated with related diversification, whereas unrelated diversification can benefit from financial synergies (Chatterjee, 1986). Barney (1991) argues that by having valuable, rare, and imitability resources, a firm potentially generates competitive advantage. This concept could explain that, for instance, Port of Rotterdam developed its unique and valuable resources and capability in port development knowledge, and then in turn, built an internationalization strategy on such resources and capability, with the intention to strengthen its image as international leader in the port industry as well as expand its revenue base (Dooms et al. 2013; van der Lugt et al. 2013). Agency view According to agency theory, managers will act out of self-interest (Lane et al. 1998). A study by Amihud and Lev (1981) is widely cited by many scholars as they provide
10
evidence that managers will attempt to reduce their employment risk through unrelated mergers and diversification. Pandya and Rao (1998) argue that diversification can lead to problems of moral concern. Montgomery (1994) points out that in order to control such a manager there is a monitoring cost or so-called ‘agency cost’. Greater diversification increases organizational complexity which in turn incurs greater coordination and integration cost (Chakrabarti et al. 2007). According to this point of view, diversification gives a negative impact to firm value. 2.2.4 Role of Path Dependence Another aspect which should be noted when we refer unrelated diversification is path dependence context. We refer to Teece et al. (1994) as the pioneer of this theory although the study was originally found in a case concerning the manufacturing industry. According to them, history matters in the sense that previous investments or business determines future behaviour. This relates to the company’s learning process. They argue that a company tends to become successful in new development as long as it is still related to previous activities. In addition, they assert that the two key factors pertaining to the learning environment for new business development are the technology capability and market where the new businesses take place. Therefore, if a firm tries to enter new business market with new technology, it is likely to fail as the attempt is outside the learning area. Moreover, they highlight two critical competences in order to manage diverse business namely organizational and technical competences. The former involves (i) allocating competence – deciding what to produce, transactional competence – deciding what to make or buy and administrative competence – how to design organizational structure, whereas the latter relates to the ability to develop new products and to operate effectively. The authors argue that a firm which lacks organizational and technical competences and low-path dependencies tends to expand new businesses by maintaining contractual agreement with other firms namely conglomerates or highly-diversified companies.
2.3 Port Governance 2.3.1 Port model
Adolf and John (2014) note that port authority as a ‘State, Municipal, public, or private body, which is largely responsible for the tasks of construction, administration and sometimes the operation of port facilities and in certain circumstances, for security.’ They point out that in many articles the term ‘authority’ often refers to a specific form of public management. However, they argue that ‘authority’ is the general term for the institution which has responsibility to manage the port regardless of whether there is a legal form such as an institution that manages private facilities. Thus, in this study, the term port authority can be applied to both public and private bodies.

11
In order to obtain a clearer understanding of how unrelated diversification works in port industry, it is essential to know port models exist in the world. The World Bank Port Reform Tool Kit 2001 classifies ports into four basic models: 1. Service port 2. Tool port 3. Landlord port 4. Private service port Service port model This model represents a predominantly public model in which the port authority owns the lands, maintains and operates all the assets (fixed and mobile). Cargo handling activities are also executed by labour employed by the port authority. This model exists in developing countries, e.g. India and Sri Lanka. Under this model, the ports are controlled by (or even part of) the Ministry of Transport and the director is a civil servant appointed by and reporting to, the associate ministry. (World Bank, 2001). The advantage of this model is that the facilities development and operations are the responsibility of one entity, which results in using a streamlined approach to corporate decision making. On the other hand, the absence of internal competition can lead to inefficient port administration and lack of innovation. Moreover, a dependence on government funds can lead to undervalue-investment (World Bank, 2001). Tool port model In this port model, the port authority owns, develops and maintains both infrastructure and superstructure, including cargo handling equipment such as quay cranes, forklifts, trucks, etc. The operation of this equipment is usually performed by the port authority’s employees, but other operations of cargo handling on board vessels, on quay and apron could be performed by private firms (World Bank, 2001). Under this model, the duplication of facilities can be avoided because the investment in infrastructure and equipment is provided by the port authority (public entity). The disadvantage is that there is also a risk of undervalue-investment (World Bank, 2001). Landlord port model Landlord port is a mixed public-private model. Under this model, the port authority acts as a regulatory and as landlord, while port operators, especially cargo handling activities are performed by private companies. This model is widely used in ports in developed countries such as Rotterdam, Antwerp, New York, and also Singapore which has implemented this model since 1997 (World Bank, 2001). In landlord port model, the port authority builds the infrastructure such as sea locks, breakwater, quay walls and main roads. These are subsequently leased to private companies. While private port operators provide and maintain their own superstructure including building such as offices, warehouses, workshops and equipment on the terminal such as quay cranes, conveyor belts, etc. The level of lease amount depends on the initial preparation and construction costs (Word Bank, 2001).

12
The advantage of this model can be found in the owner of the cargo handling equipment as well as in the operation executers who all form part the same entity, and whose plans are more likely to result in better outcomes and be more responsive to changing market conditions. However, there is a risk of over capacity as private companies apply pressure for expansion (World Bank, 2001). Private service port model This port is considered by many as the most extreme model among the port models as the public sector has no longer an interest in port activities. Port land is fully owned by private companies. In addition, all the regulatory functions and operational activities are performed by private entities. This model is used in ports that are located in the United Kingdom and New Zealand (World Bank, 2001). The advantage of this model is that the ports development and tariff policies tend to be more market-oriented. However, there is a risk that this model could lead private ports to be monopolist in the long-term (World Bank, 2001). The responsibility allocation based on the World Bank Tool Kit Port Models is summarized below in Table 2. Table 2: Responsibility Allocation of Port Models under the World Bank
Source: World Bank Port Reform Tool Kit, 2001
2.3.2 Port Ownership In keeping with the port models shown above, we can observe that responsibility is a reflection of the ownership of the assets. The basic infrastructure is usually owned by the public sector, whereas superstructure and other operations can vary depending on the management structure. The typical ownership of the four port model has been summarized in Table 3 shown below. Table 3: Type of Ownership of four Port Models
Source: Author based on World Bank Port Reform Tool Kit, 2001
Public service
portPublic Public Public Majority public
Tool port Public Public Private Public/private
Landlord port Public Private Private Public/private
Private service
portPrivate Private Private Majority private
Type Infrastructure Superstructure Labour Other function
Public service port Government
Tool port Government, private
Landlord port Government, private
Private service port Private
Port model Ownership

13
It is worth nothing that even though the ports are government-owned with the state or municipality as the shareholder, and although they must comply with public law, corporatized port authorities act like limited liability companies which have independent executive autonomy in constructing corporate strategy, decision making as well as financial capability (van der Lugt et al. 2013). Fund can be raised, not only by receiving government’s grants, but the port authority, can also receive funding by issuing long-term bonds and public offerings in the stock exchange. One of the most common methods is to receive a bank loan. The more parties that are involved in financing the port, the more interests need to be covered. Van der Lugt et al. (2013) assert that the strong interdependence of the port authorities to the private sectors will, in turn, influence their strategy making. 2.3.3 Role of Port Governance Besides the previously mentioned port model, Verhoeven (2010) developed the renewed role of port authority, or the so-called renaissance port authority. There are four port functions: namely Landlord, Regulator, Operator and Community manager. The latter refers to ‘cluster manager’, which was developed by De Langen (2004). In the renaissance matrix, for each functions, Verhoeven (2010) expanded the type to include the Conservator, the Facilitator and the Entrepreneur (see Appendices 1) for further details). These spectrums are influenced by governance factors which comprise the balance of power with government, the legal and statutory framework, the financial capability and the management culture. For this study, we use the two most common port functions, the Landlord and Operator/Tool Port to identify the port governance of each port discussed in the next chapter. This is because the regulatory role is not entirely performed by the port authority, but it is also performed in co-operation with government entities, while the community manager, in some extent, is the development of landlord and regulatory functions (Verhoeven, 2011). To be more specific, regardless of whether the port authority owns the port land or manage the land on behalf of the government, the landlord function consists of several activities include the management, maintenance, the provision of infrastructure as well as the formulation and implementation of strategic development of the exploitation of the port land (Verhoeven, 2010). Under this function, a port authority is responsible to provide and promote internal competition within port community (De Langen, 2004). Verhoeven (2010) point out that public ownership deters port authorities to pursue entrepreneurial strategies given the potential conflict with the regulatory function. In addition, to take entrepreneurial role, port authorities need to have access to substantial funding, considering for instance the expansion of hinterland connections. He gives an example by referring to several of the landlord ports in Europe which are mainly financed by the government; these ports tend to have less autonomy to expand their business. Meanwhile, according to Verhoeven (2010), in the operator function, the role of port authority traditionally covers three areas which are cargo/passengers handling, nautical services and ancillary services. In connection with the latter, the author explains that it comprises public area such as waste handling, shore power, etc., or more in commercial field such as logistics or other services which could not be the core activities of the port. In other words, port authority is more likely to have

14
unrelated business units. This might explain why the business group structure as mentioned earlier might be found in port industry. One example might be the Dalian Port, a port which had diversifies business in a wide range of business and several of these businesses are outside the core activities of the port authority such as IT, commodity trading, telecommunication and others. This phenomenon seems in line to be with what Verhoeven (2010) calls the entrepreneurial operator. This context could be linked to the aspect of financial capability as China’s companies have great financial capabilities as a result of the tremendous growth experienced during the last decade.
2.4 Competence, Resource and Capability 2.4.1 Overview Several scholars have examined the relationship between diversification and competences. Hitt and Ireland (1986) have studied the relationships among corporate level distinctive competences and diversification strategy. They define distinctive competence as “a firm’s ability to complete an action in a manner superior to that of its competitors or to apply a skill that competitors lack.” Distinctive competence should be built in order to obtain a competitive advantage. Competitive advantage refers to the capability and strategy that can be employed to outperform the competitors (Porter, 1980). They stress that this objective should be linked to the successful implementation of business strategy. The portfolio approach can be used with the objective to select a business that can meet corporate financial target and allocate resources to each business unit. Several examples which show how this can be formed into corporate level distinctive competences include centralized marketing, corporate research and development, and technology. However, this study does not inform us as to how a firm creates distinctive competence in each business unit. Prahalad and Hamel’s work “Core Competence of the Corporation”, which was written in 1990, is widely cited by many scholars and has generated the critical point in regard to the construct of core competence. In their perspective, a diversified company is a large tree as shown in Figure 2 below; the trunk is its core products, the branches are its subsidiaries/business units, the leaves and fruits are end products, and the root system that provides stability entails the competences. Therefore, they point out that core competence requires collective organizational learning, involvement and commitment. They argue that a diversified firm such as NEC can compete in seemingly disparate (unrelated) business because the point is not in the collection of SBUs, but in producing a portfolio of core competences. Furthermore, they suggest that in order to build core competence, it is important to invest in technologies. That is why they have taken the following example, Citicorp, which can beat its rivals by adopting an operating system that leverage its competences. As a result, it has become the first bank that can work in world markets 24 hours a day.
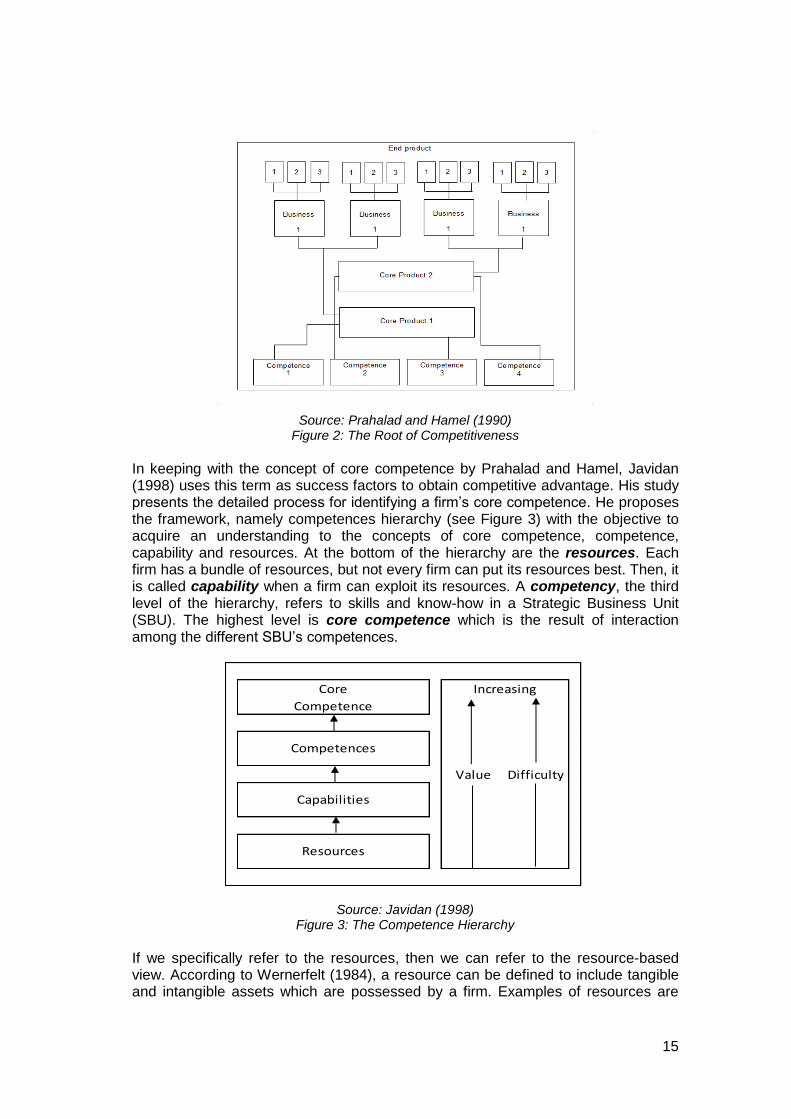
15
Value Difficulty
Increasing
Competence
Core
Competences
Capabilities
Resources
Source: Prahalad and Hamel (1990) Figure 2: The Root of Competitiveness
In keeping with the concept of core competence by Prahalad and Hamel, Javidan (1998) uses this term as success factors to obtain competitive advantage. His study presents the detailed process for identifying a firm’s core competence. He proposes the framework, namely competences hierarchy (see Figure 3) with the objective to acquire an understanding to the concepts of core competence, competence, capability and resources. At the bottom of the hierarchy are the resources. Each firm has a bundle of resources, but not every firm can put its resources best. Then, it is called capability when a firm can exploit its resources. A competency, the third level of the hierarchy, refers to skills and know-how in a Strategic Business Unit (SBU). The highest level is core competence which is the result of interaction among the different SBU’s competences.
Source: Javidan (1998)
Figure 3: The Competence Hierarchy If we specifically refer to the resources, then we can refer to the resource-based view. According to Wernerfelt (1984), a resource can be defined to include tangible and intangible assets which are possessed by a firm. Examples of resources are

16
brand names, in-house knowledge of technology, skilled employees, machinery, efficient procedures, etc. The author stresses that the resource perspective provides a basis when addressing issue regarding the scope of the firm. Wernerfelt proposes the concept of resource position barrier, in which a holder of a resource is able to maintain a relative strong position in terms of affecting costs and revenue, compared to the others. In this sense, a holder could enjoy the protection of a resource position barrier. However, a firm still needs to create a situation in which it is difficult for the competitors to catch up, in the area such as machine capacity, customer loyalty, and technological leads. These barriers are quite often self-reproducing but acquisitions or mergers also allow this to occur. In addition, Montgomery and Hariharan (1991) suggest that a firm with broad resources is more likely to pursue diversification. Usually, a firm tends to enter a business in which the resource requirement is close to their existing resource capability. More recently, Bowman and Ambrosini (2003) developed dynamic-capability views (DCV) as the development of the resources-based view (RBV). They point out that the RBV is essential to look competitive, but corporate strategy is not. The authors define dynamic capability as the firm’s ability to renew its resources in line with environment changes. Since the corporation comprises more than one line of business (SBUs), dynamic capability refers to the holding company ability (centre) to modify the resources by creating, integrating and recombining resources. According to them, there are mainly two ways; first, the centre provides the resources that can be delivered to the SBUs, and second, the centre can establish a process that drives the resource creation within the SBUs. According to them, in some cases, the role of the holding can be to merely set the target in terms financial performance, without requirement for similarity and coordination between the SBU, which is the so-called portfolio approach. 2.4.2 Competences of Port Authority The increase in seaport competition can be traced to the fact that shipping lines have extended their interest to include the business of logistics. The tendency of shipping lines to make alliances and to integrate with freight forwarders, and terminal operators has resulted in obtaining strong bargaining power (Notteboom and Winkelmans, 2001). They assert that shipping lines are no longer attracted by using a port as merely a gateway to an abundant hinterland. Since a port is the only a sub-system in the logistic chain, carriers will focus on the quality of the whole transport chain, instead of the port-sea-to land. In other word, port choice becomes a function of network costs, which means that the port chosen are those that help to minimize the sum of sea, port and inland costs (Notteboom and Winkelmans, 2001). They propose that port authorities can play important role in the creating core competences in the following areas: a. Value-added logistics
Seaports play an important role in the supply chain and they will face challenges in the future. A seaport should continue to seek opportunities to develop value-added logistics.
b. The development of information systems Port authorities should guarantee that information systems have been implemented among all the players in the logistics system.

17
c. An active participation of intermodal services
Port authorities should promote an efficient intermodal system in order to secure cargo under high competition era.
Although their work has originally been set up for port authorities as a landlord port in Europe, this would still be relevant for other type of ports in regard to how they should compete. 2.4.3 Link between Resources and the Capabilities of Port Authorities and
Unrelated Diversification Below in Figure 4, we have illustrated the entire concept as discussed earlier as well as proposing a framework which links the resources and capabilities of the port authorities and their unrelated diversification strategies.
Source: Author Figure 4: Framework of the Link between Resources and Capabilities of Port Authorities and
their Unrelated Diversification
Port governance literature identifies the difference role of port authorities, namely landlord, operator, regulator and community manager, as well as their evolution from conservator to become entrepreneur which is so-called renaissance port authority developed by Verhoeven (2010). However, in this study we will focus on the landlord and operator model as explained earlier. These two port functions differ in terms of main resources as well as the capabilities. For instance, landlord port will tend to have resource such as port infrastructure, real estate management knowledge as well as their skilled-employee. Meanwhile, the operator port has more resources such as port infrastructure and superstructure as their business which comprises cargo handling, nautical service and other ancillary services. In order to improve technical or financial port capability, some port authorities have tendency to expand into business segments outside the core of port function. Previous literatures suggested that this decision relates to their resource and influenced by path dependence. The port authorities have greater financial resources and low-path dependence in terms of technological knowledge and they are more likely to a higher number of unrelated business units through contractual agreement such as acquisitions or mergers (Teece, 1994; Hall, 1995; Kock and Guillen, 2001). They benefit from having these unrelated subsidiaries and the financial synergies among business units and pursuing market power (Chatterjee, 1986; Montgomery, 1994). Moreover, in the port industry, unrelated business mergers could be seen as tool for having new resources such as technology or other field that can improve port capability which in turn increases port competence.
Port governance ResourcesUnrelated
diversificationCapability
Path dependence Competence


19
3 International Practices The overview of regional ports aims to obtain facts or provide a characteristic pattern which can be linked to unrelated diversification strategy. We provide data such as growth, port governance, type of subsidiaries, number of workforce and degree of unrelated diversification for each port. In order to determine whether a subsidiary is unrelated or not, we should regard to the function of port authority. In the case of landlord port, as the core activity of port authority is specialized in real estate industry (SIC 7010), namely the development of port’s infrastructure and it derives its revenue mainly from lease fees and port dues. Thus, any subsidiaries that have a different first 2-digit of SIC, which do not generate revenue from rental fees, can be classified as unrelated. Whereas, as an operator, the core activities of the port authority involve cargo handling, warehousing and nautical services (SIC 6301, 6302, 6303 respectively) and profit is gained from the terminal operation. Therefore, any subsidiary that has a different SIC number is considered as being unrelated. More specifically, since real estate and the terminal operation fall under different industries according to the SIC, some ports which derive income from these two areas have certain degree of unrelated diversification. Moreover, as we perform entropy measure, the amount of revenue contributed by unrelated subsidiaries determines the level of such a strategy.
3.1 Regional Port Each region includes seven ports. We will discuss each port’s distinct features and then we will provide a summary so as to stress our findings in regard to the patterns that are characteristic of each region. 3.1.1 Asian Ports In the past decade, Asia has enjoyed tremendous growth. This is not only because of its abundant natural resources, but also because of the significant improvement in technology. Perhaps this growth can be traced to when China decided to become a member of the World Trade Organization (WTO) in 2001. This action created a situation in which there was considerable liberalization in several sectors and foreign investment was allowed. As a result, many US and EU companies decided to manufacture their products in China in view of the cheap labour costs. Merit should be also given to continual improvement that has been made in the maritime industry, particularly regarding containerization, port development and the evolution of ship size which has achieved a capacity of 18,000 TEUs resulting in economies of scale in maritime transportation costs. This time, the largest producer of containers is a Shenzhen-based company called China International Marine Containers (CIMC). Moreover, according to Forbes (2014), 7 of the top 10 busiest ports in the world are located in China. In turn, thanks to the increase in international trade, China’s growth has triggered other countries in Asia to be able to benefit from this world economy. This is what economists call ‘spill-over’. Here we see that regional growth and seaport

20
development have a reciprocal relationship. Specifically, if we refer to diversification strategy, then the Asian ports have a relatively high number of subsidiaries compared to other regions in the world. In addition, we observed how some of these ports have diversified their businesses into different industries. Furthermore, we discuss some of these aspects briefly in regard to the following 7 ports: The Maritime and Port Authority of Singapore, Port of Salalah, Dalian Port, Port Klang Authority, Indonesia Port Corporation, Sri Lanka Port Authority, and Philippine Port Authority (see Table 4). The Maritime and Port Authority of Singapore (MPA) is owned by the Government and works under the Ministry of Transport of Singapore. According to the World Bank (2001), in 1997, this port authority started acting as a landlord. Based on its annual report, the principal activities of the MPA include controlling vessel movement to ensure a safe port, and regulating of the port and marine services and facilities. As one of the largest transhipment ports in the world, the MPA enjoyed 125% container growth from 2009 to 2013 and achieved throughput at around 30 million TEUs. Its revenue mainly comes from port dues and marine services. The MPA has one subsidiary, MPA Venture Pte, Ltd whose activities involve managing investments in maritime technology start-ups. As this subsidiary is a player in financial industry, we consider it as unrelated business. In order to conduct business with revenue around Singapore $279million in 2013, the MPA has 600 employees which might represent efficient management. Port of Salalah is a joint stock company in the Sultanate of Oman under the Commercial Companies Law of Oman. The port company is owned by the Government of Oman (under Ministry of Finance, 20.08%), APM Terminal (30.13%), and other Omani investor as it is listed in Oman stock exchange. Port of Salalah is a large multi-purpose port which is engaged in operating, managing and equipping port. It handled containers in average around 3 million TEUs period 2009-2013. There is one subsidiary namely Port of Salalah Development Company (POSDC) which is primarily engaged in equipping and managing terminal facilities. The Port of Salalah obtained consolidated revenue amounting to 58 million RO (Omani Rial) in 2013, and around 2,167 people are employed. Table 4: Container Growth, Port Governance, Workforce and Unrelated Diversification of Asian Ports
No Port Growth 2009-2013*
Port governance
Subsidiaries No. of Staff
DU**
1 The Maritime and Port Authority of Singapore (Singapore)
125% Port model: Landlord Ownership: Government
No. of subs: 1 Type of subs: Venture company
600 0.03
2 Port of Salalah (Oman)
96% Port model: Tool Port Ownership: Government and listed
No. of subs: 1 Type of subs: Terminal facilities
2,167 0

21
No Port Growth 2009-2013*
Port governance
Subsidiaries No. of Staff
DU**
3 Dalian Port Company Ltd (China)
239% Port model: Tool Port Ownership: Government and listed
No. of subs: >20 Type of subs: Property, software, trading service, vessel leasing, telecommunication,etc
6,811 0.80
4 Port Klang Authority (Malaysia)
142% Port model: Tool Port/Landlord Ownership: Government
No. of subs: 2 Type of subs: Megahub operator, inland port
221 0.51
5 IPC, Tanjung Priok, Jakarta (Indonesia)
173% Port model: Tool Port Ownership: Government
No. of subs: 13 Type of subs: Terminal operators, dredging, hospital, software development, electricity, training
3,787 0.26
6 Sri Lanka Ports Authority (Sri Lanka)
124% Port model: Service Port Ownership: Government
No. of subs: 2 Type of subs: Terminal operators
13,367 0
7 Philippine Port Authority (Philippine)
131% Port model: Tool Port Ownership: Government
No. of subs: n/a Type of subs: n/a
1,957 0.13
Source: Author *Growth: container growth 2009-2013, database compiled by IAPH based on UNCTAD data “Review of Maritime Transport” **DU: degree of unrelated diversification based on Entropy measurement
Dalian Port is one of the fastest growing ports in China with a considerable container growth rate of 239% with 10.9 million TEUs handled in 2013. This state-owned company is also listed on the Stock Exchange of Hong Kong with 45.58% of its share-owned spread among several minority shareholders. The capital expenditure is mainly funded by surplus cash generated from operating, from public offering of the shares and issuance of corporate bond. It has more than 20 subsidiaries and joint-venture companies play in the industries ranging from terminal operators, property development, software development, vessel leasing, power cable installation, investment institution, telecommunication, trading company, and

22
other logistics-related business. This wide range of businesses makes it possible for Dalian Port to have a high level of unrelated diversification which is around 0.80 based on Entropy measurement. Dalian Port employs around 6,800 people, and in 2013 it gained consolidated revenue of 3.3 million RMB (Renminbi), which is a 60% increase compared to 2012. Port Klang Authority (PKA) is a statutory corporation and under the purview of the Ministry of Transport of Malaysia. According to its annual report, starting in 1988 the container terminal was privatised to Klang Container Terminal Berhad. Recently, there are three private entities which make investments as well as operate the container terminals. As a result, the port authority has taken a role which resembles more that of a facilitator, regulator and landlord. The funding is mainly derived from government loans. Furthermore, PKA has two subsidiaries which are based on Standard Industrial Classification (SIC) and they both fall under the category of terminal operator. As explained earlier, PKA has a medium level of unrelated diversification (DU=0.51) considering the fact that its consolidated revenues come from lease fees (as a landlord) and cargo handling fees (from terminal operator). From 2009-2013, PKA enjoyed a container growth rate of 142%, with number of employees including 221. Based on its audited financial statement, PKA obtained consolidated revenue amounting to 190 million Ringgit Malaysia in 2013 or a 7% increase as of 2012. Indonesia Port Corporation (IPC) is a stated-owned company under Ministry of Transportation of the Republic of Indonesia. This port company can be classified as a tool port considering that some cargo handling activities are performed by private entities. The main funding consists of mid-term and long-term bank loans. As a primary gateway into the Indonesian hinterland, in 2013 IPC handled 6.5 million TEUs containers. This implies 173% container growth as only 3.8 million TEUs were handled in 2009. IPC has 14 subsidiaries and diversifies its business in a wide range of industries such as hospitality, electricity, information technology, dredging and training. Based on Entropy measure, IPC has a 0.26 level of unrelated diversification. This amount is not so high considering the wide range of business IPC has because the revenue gained from these unrelated units is not that high. In 2013, with all of these businesses, in 2013 IPC obtained consolidated revenue of 1.8 billion Rupiah which is a slight increase of 3% from 2012. Sri Lanka Port Authority (SLPA) is a state-owned company and one of the few ports in the world which are categorized as a service port according to the World Bank (2001). This means the port authority maintenances and operates both the infrastructure and superstructure of the ports. In order to fund several expansion projects, SLPA received a significant loan from the Japanese government and the Asian Development Bank (ADB). The interesting thing is the port authority has around a workforce of 13,000 which is huge number of employees. This might relate to many developing countries, a port is seen as a tool to create a great deal of jobs and to increase the country’s economic growth. The World Bank (2015) stated that the economic growth in Sri Lanka was averaged 6.3 per cent between 2002 and 2013; this explains why SLPA could achieve container growth of 124% which increased from 3.4 million TEUs in 2009 to 4.3 million TEUs in 2013. Furthermore, the SLPA has a subsidiary which is also terminal operator so this makes this port have a zero level of unrelated diversification.

23
Philippine Port Authority (PPA) is a state-owned company and falls under the Department of Transportation and Communication of the Philippines for the policy and program coordination. The port authority has a mandate to establish, develop, regulate, manage and operate a port system in order to support the trade and development of the country. This authority can be classified as a tool port as private operators are allowed to perform in the terminals. Moreover, some funding comes from foreign loans mostly from the government of Japan as well as domestic bank loans. In 2013, PPA handled around 3.7 million TEUs containers and its 131% increased from year 2009. It is mainly due to certain improvements such as the rehabilitation of the container yard, the construction of a container freight station, and the reclamation of wharfs. The revenue mainly comes from port and marine services. However, in recent years PPA has also opened to private terminal operators, which gives concession fees to the port authority. From the details mentioned above pertaining to several ports in Asia, we have obtained the following findings. 1. The Maritime and Port Authority of Singapore (MPA) handled the largest number
of containers with about 30 million TEUs in 2013. However, in regard to container growth, Dalian Port achieved a considerable number with 239%, followed by IPC with 173% for handling 10.9 and 6.5 million TEUs respectively.
2. The dominant port model in Asia is Tool Port. It means that the port authorities are responsible for maintaining and operating the infrastructure and superstructure. Moreover, even though they are mostly government-owned companies, the ports have autonomy in terms of raising funds in order to finance the investment projects through bank loans, issuing bonds or public offering in stock exchange such as Dalian Port and Port of Salalah.
3. Ports with relatively high growth, such as Dalian Port and IPC, are more likely to have some subsidiaries, particularly in the area of unrelated business.
4. Some unrelated subsidiaries owned by port authority are in software development, property, vessel leasing, and commodity trading.
5. Ports are seen as powerful tools for creating jobs in order to enhance economic growth, especially in developing countries such as Sri Lanka, Indonesia, and the Philippines. On average, approximately 4,000 people are employed at the port.
3.1.2 European Ports Ever since Christopher Columbus, or perhaps earlier, we have borne witness to how seaports in Europe have played a vital role in supporting the economy. In the so-called Renaissance period, many European scholars made breakthroughs in mathematics, astronomy and naval technology which allowed them to sail around the world in order to discover resources in other areas to support their countries’ prosperity. More recently, since the European Union (EU) was first established in 1957 by the six founding countries, Belgium, France, Germany, Italy Luxembourg and the Netherlands, the role of the seaport has also been to support the internal trade of the member states. In 2014, the EU GDP achieved €13 trillion with around two-thirds of the EU countries’ total trade occurring among the 28 member states (Europa, 2015). Thus, it is important for European countries to develop efficient and sophisticated seaports in order to maintain low transportation costs. Port authorities

24
are dominantly acting as landlord and allow private terminal operators to invest and operate the port superstructure facilities. The idea is that competition among these terminal operators will deliver efficient, as well as cheap port services. Below, we discuss several aspects that pertain to the 7 ports in this region namely Port of Rotterdam, Hamburg Port Authority, Port of Antwerp, Port of Zeebrugge, Port Authority of Valencia, Port of Duisburg and Piraeus Port Authority as shown in Table 5. Table 5: Container Growth, Port Governance, Workforce and Unrelated Diversification of European Ports
No Port Growth 2009-2013*
Port governance
Subsidiaries No. of Staff
DU**
1 Port of Rotterdam Authority (the Netherlands)
119% Port model: Landlord Ownership: Government
No. of subs: No subs, but division Type of subs: Consultancy
1,118 0
2 Hamburg Port Authority (Germany)
133% Port model: Landlord Ownership: Government
No. of subs: 1 Type of subs: Terminal operator
1,808 0
3 Port of Antwerp Authority (Belgium)
117% Port model: Landlord Ownership: Government
No. of subs: No subs, but division Type of subs: Training centre
1,650 0
4 Port of Zeebrugge (Belgium)
90% Port model: Landlord Ownership: Government
No. of subs: 1 Type of subs: Intermodal
137 0
5 Port Authority of Valencia (Spain)
118% Port model: Landlord Ownership: Government
No. of subs: No subs, but non-profit organization Type of subs: Consultancy
407 0
6 Port of Duisburg (Germany)
321% Port model: Tool Port Ownership: Government
No. of subs: 8 Type of subs: Rail operator, packing, logistics
920 0.26
7 Piraeus Port Authority (Greece)
476% Port model: Tool Port
No. of subs: 2
1,180 0.87

25
No Port Growth 2009-2013*
Port governance
Subsidiaries No. of Staff
DU**
Ownership: Government, private and listed
Type of subs: Logistics and ship repair service
Source: Author *Growth: container growth 2009-2013, database compiled by IAPH based on UNCTAD data “Review of Maritime Transport” **DU: degree of unrelated diversification based on Entropy measurement
Port of Rotterdam (PoR) is a government-owned company consisting of two shareholders the municipality of Rotterdam and the Dutch state. As a landlord port, PoR leases land on a long-term basis to the private business entities such as container terminal operators, logistics companies, and the industrial companies such as petrochemical companies, power plants, etc.). The main revenue of the authority comes from lease fees which generated €624 million in 2013. Container throughput amounted to 11 million TEUs or increased by 119% between 2009 and 2013. In order to maintain port performance in terms of throughput, PoR invests in the development of new port sites, namely the Maasvlakte 2 for the purpose of creating space for growth, and also accessibility of port by road, rail and water. The Maasvlakte 2 is financed by PoR and the Dutch State, and the port authority should pay dividends in . A total of 1,118 people are employed in the company. In addition, PoR has a division namely Port of Rotterdam International which seeks to develop ports in other parts of the world, develop strategic partnerships with foreign ports, and provide consultancy. Hamburg Port Authority (HPA) is a government-owned port in Germany and under Public Law; it is in charge of the efficient, sustainable preparation and implementation of infrastructure in the port. As a landlord port, HPA is responsible for the improvement of the infrastructure of the port. In 2013, the port authority handled about 9.3 million TEU and should compete with the other north range ports; Rotterdam, Antwerp and Bremen. In order to survive this competition, HPA makes long-term development projects including the expansion of its railway infrastructure and the implementation of new IT systems to facilitate freight handling. The infrastructure projects were funded largely by the Free and Hanseatic City of Hamburg (FHH). It has a subsidiary in terminal operator business named ‘HHLA’. In 2013 the main revenue amounting to €280.6 million came from lease fees. To conduct the business, HPA employs around 1,808 which is a higher number of employees compared to Rotterdam and Antwerp. Port of Antwerp (PoA) and Port of Zeebruge (PoZ) are respectively municipality-owned port authorities in the cities of Antwerp and city of Bruges. Both are landlord ports with the main responsibility being to develop and improve the port infrastructure. While the terminal superstructures are invested by private terminal operator. The performance of PoZ is ranked below than PoA which handled around 2 million TEUs containers and generated a revenue of €66 million euro, while PoA, as the second greater gateway to Europe (after Rotterdam) could generate income amounted to €335 million with container throughput of 8 million TEUS. The main revenue of both port authorities is derived from lease fees. In general, both port authorities invest on infrastructure and IT. More specifically, PoA has a Business

26
Plan for the period from 2014-2018. The plan encompasses investments in IT systems, port infrastructure, and projects related to hinterland transport in rail, road, barge and pipelines. The total workforce in PoA is much higher than PoZ with 1,600 and 137 people respectively. PoA has a training centre division which aims to share knowledge through seminars, study visits and lectures abroad and PoZ has a subsidiary in intermodal business named ‘PortConnect’. Port Authority of Valencia (PVA) is a port authority owned by the Valencia Regional Government in Spain, which acts as a landlord. PVA considers itself as the port community leader and the investments are mainly directed at improving the port infrastructure, developing of port information-integrated system called ‘Quality Mark’, and promoting inter-modality. In 2013, PVA booked revenue of €117 million, and it handled around 4.3 million TEUs containers and employed approximately 900 people. In addition, the port authority has a consultancy business under non-profit organization. Port of Duisburg is a public port company with two main shareholders, the state of North Rhine-Westphalia which owns two-thirds of the shares, and the remaining one-third, which is owned by the Federal Republic of Germany. As stated in its annual report, the port has a mandate to provide the infrastructure and superstructure. However, the port is not an entirely public service port since some of the cargo handling performed by private operators. The Port of Duisburg uses bank loans as leverage. Furthermore, the company owns 8 subsidiaries which are involved in transportation, logistics and packaging service. Technically speaking, one of the subsidiaries is a rail operator company and according to SIC it falls into the category of being an unrelated business. However, one could argue that those are all integrated-logistics business. Having all these facilities has helped the Port of Duisburg to experience considerable container growth of 321% having handled 3 million TEUs in 2013. Piraeus Port Authority (PPA) is owned by the Greek government (74.14%), private entities named Lansdowne Partners Austria GmbH (6.99%) and listed on the Athens Stock Exchange (18.87%) in order to receive additional funding. PPA has a very high container growth which seems irrational. This is mainly due to the financial crisis in the 2009 that hit Greece severely. Thus, for this reason we will consider this as outlier number. The port authority has two subsidiaries and the one is logistics-related company and the other is a ship repair company named ‘Navsolp’. It seems that the port authority is involved in ship repair as shipping is one of the largest industries in Greece. According to UNCTAD Report “Review of Maritime Transport 2014”, the number of ships in Greece amounted to 3,826, just below China with 6,015 ships. Beside the significant amount of revenue generated from this unit, PPA also generated considerable income from the lease fees from Piraeus Container Terminal (PCT), a terminal operator owned by COSCO, a Chinese shipping company, which make PPA have a high level of unrelated diversification. From the details provided above regarding several of the ports in Europe, we have obtained the following findings. 1. In the Europe, Port of Rotterdam is still the largest port with the highest
container throughput of around 11 million TEUs. However, the highest container
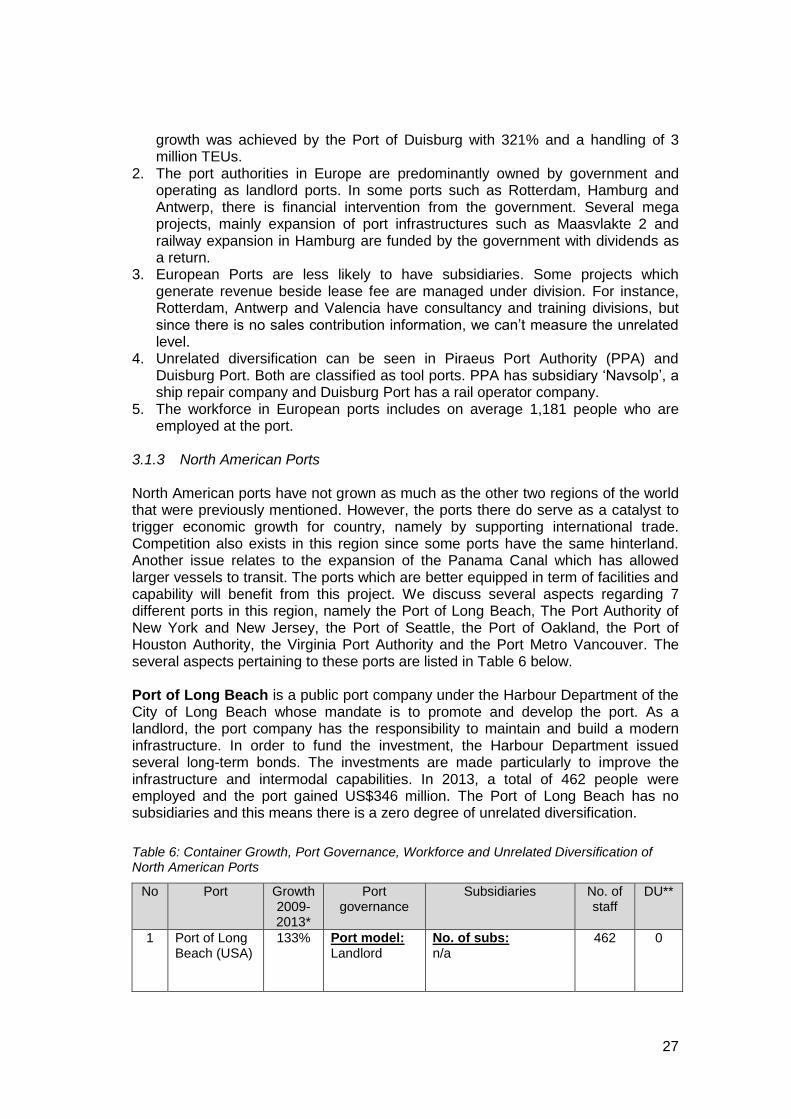
27
growth was achieved by the Port of Duisburg with 321% and a handling of 3 million TEUs.
2. The port authorities in Europe are predominantly owned by government and operating as landlord ports. In some ports such as Rotterdam, Hamburg and Antwerp, there is financial intervention from the government. Several mega projects, mainly expansion of port infrastructures such as Maasvlakte 2 and railway expansion in Hamburg are funded by the government with dividends as a return.
3. European Ports are less likely to have subsidiaries. Some projects which generate revenue beside lease fee are managed under division. For instance, Rotterdam, Antwerp and Valencia have consultancy and training divisions, but since there is no sales contribution information, we can’t measure the unrelated level.
4. Unrelated diversification can be seen in Piraeus Port Authority (PPA) and Duisburg Port. Both are classified as tool ports. PPA has subsidiary ‘Navsolp’, a ship repair company and Duisburg Port has a rail operator company.
5. The workforce in European ports includes on average 1,181 people who are employed at the port.
3.1.3 North American Ports North American ports have not grown as much as the other two regions of the world that were previously mentioned. However, the ports there do serve as a catalyst to trigger economic growth for country, namely by supporting international trade. Competition also exists in this region since some ports have the same hinterland. Another issue relates to the expansion of the Panama Canal which has allowed larger vessels to transit. The ports which are better equipped in term of facilities and capability will benefit from this project. We discuss several aspects regarding 7 different ports in this region, namely the Port of Long Beach, The Port Authority of New York and New Jersey, the Port of Seattle, the Port of Oakland, the Port of Houston Authority, the Virginia Port Authority and the Port Metro Vancouver. The several aspects pertaining to these ports are listed in Table 6 below. Port of Long Beach is a public port company under the Harbour Department of the City of Long Beach whose mandate is to promote and develop the port. As a landlord, the port company has the responsibility to maintain and build a modern infrastructure. In order to fund the investment, the Harbour Department issued several long-term bonds. The investments are made particularly to improve the infrastructure and intermodal capabilities. In 2013, a total of 462 people were employed and the port gained US$346 million. The Port of Long Beach has no subsidiaries and this means there is a zero degree of unrelated diversification.
Table 6: Container Growth, Port Governance, Workforce and Unrelated Diversification of North American Ports
No Port Growth 2009-2013*
Port governance
Subsidiaries No. of staff
DU**
1 Port of Long Beach (USA)
133% Port model: Landlord
No. of subs: n/a
462 0

28
No Port Growth 2009-2013*
Port governance
Subsidiaries No. of staff
DU**
Ownership: Government
Type of subs: n/a
2 The Port Authority of New York and New Jersey (USA)
120% Port model: Landlord Ownership: Government
No. of subs: No subs, but 6 divisions Type of subs: Aviation, rail terminal, bridge, seaport, and building
6,777 0.03
3 Port of Seattle (USA)
101% Port model: Tool Port Ownership: Government
No. of subs: No subs, but 3 divisions Type of subs: Aviation, seaport, real estate
1,763 0.22
4 Port of Oakland (USA)
114% Port model: Tool Port Ownership: Government
No. of subs: No subs, but 3 divisions Type of subs: Aviation, maritime, real estate
448 0.16
5 Port of Houston Authority (USA)
109% Port model: Tool Port Ownership: Government
No. of subs: n/a Type of subs: n/a
350 0
6 Virginia Port Authority (USA)
127% Port model: Tool Port Ownership: Government
No. of subs: 1 Type of subs: Terminal
81 0
7 Port Metro Vancover (Canada)
131% Port model: Tool Port Ownership: Government
No. of subs: 6 Type of subs: Terminal, venture capital, property
310 0.34
Source: Author *Growth: container growth 2009-2013, database compiled by IAPH based on UNCTAD data “Review of Maritime Transport” **DU: degree of unrelated diversification based on Entropy measurement
There are three ports in the US that we have taken as examples for this study, with each having a distinctive business structure. The port authorities are not only

29
managing the cities’ seaport, but also other public infrastructure such as airport, bridge, tunnel and railway. The Port Authority of New York and New Jersey is a government agency owned by the state of New York and New Jersey. The port authority conducts a landlord model and divides the business into 5 divisions, namely aviation, seaport commerce, bridges, rail transit system, and the world trade centre (WTC). Furthermore, the seaport serves the East-Coast area of the US and in 2013 the port handled about 5 million TEUs. The authority has raised funding for the improvement of the infrastructure by issuing long-term bonds and other obligations. In order to conduct business, approximately 6,700 people are employed. In 2013, the port authority generated revenues amounting to US$4.184 billion which has come mainly from receiving lease fees. The Port of Seattle and the Port of Oakland are public-owned companies and they both manage three divisions: aviation, seaport and real estate. These port authorities can be classified as tool port as they build, manage and operate the infrastructure and superstructure but some terminals are operated by private entities. Just as is the case with the Port Authority of New York and New Jersey, these ports have also issued long-term bonds in order to receive some funding for making investments in their infrastructure. Since their income is generated from rental fees and terminal operations, which makes this technically speaking, falls under a different industry, thus these port authorities have certain degree of unrelated diversification. Even though both serve the West-Coast area of the US, the Port of Seattle seems to have bigger market share since it has greater workforce and revenue, compared to the Port of Oakland. The Port of Houston Authority (PHA) and the Virginia Port Authority (VPA) are two other ports in the US, and they can be classified as state-owned and operate as tool port. These two ports are relatively small compared to the North American ports which were previously mentioned in regard to the work force, which consist roughly of only around 300 people. They also handled a smaller number of containers, which numbered approximately 2 million TEUs. In 2013, the PHA received a grant amounting to US$10 million for the expansion of its Bayport terminal. While, Virginia issued long-term bonds in order to fund its investment in the infrastructure. Unlike the previous three US ports, these two port authorities do not have these kinds of divisions. Moreover, the PHA does not manage any subsidiaries and its main income is generated from terminal operations. Meanwhile, the VPA manages one subsidiary which is a terminal operator, thus the majority of revenue is from terminal services. Both port authorities do not manage any unrelated business units. The Port Metro Vancouver is a government-owned port in Canada under the Ministry of Transport. As stated in the annual report, most of terminals are operated by private operators and the port has a number of smaller facilities capable of handling domestic cargo, thus we can consider this port as tool ports. The income is mainly derived from lease fees and harbour dues. The Port Metro Vancouver issued bonds in order to enable port development. In 2013, this port handled around 2.8 million TEUs and in the bulk sector it amounted to around 92.7 million tonnes. Moreover, it has six subsidiaries which include a terminal operator, a property, and a venture company. The last two subsidiaries can be classified as unrelated according to SIC.
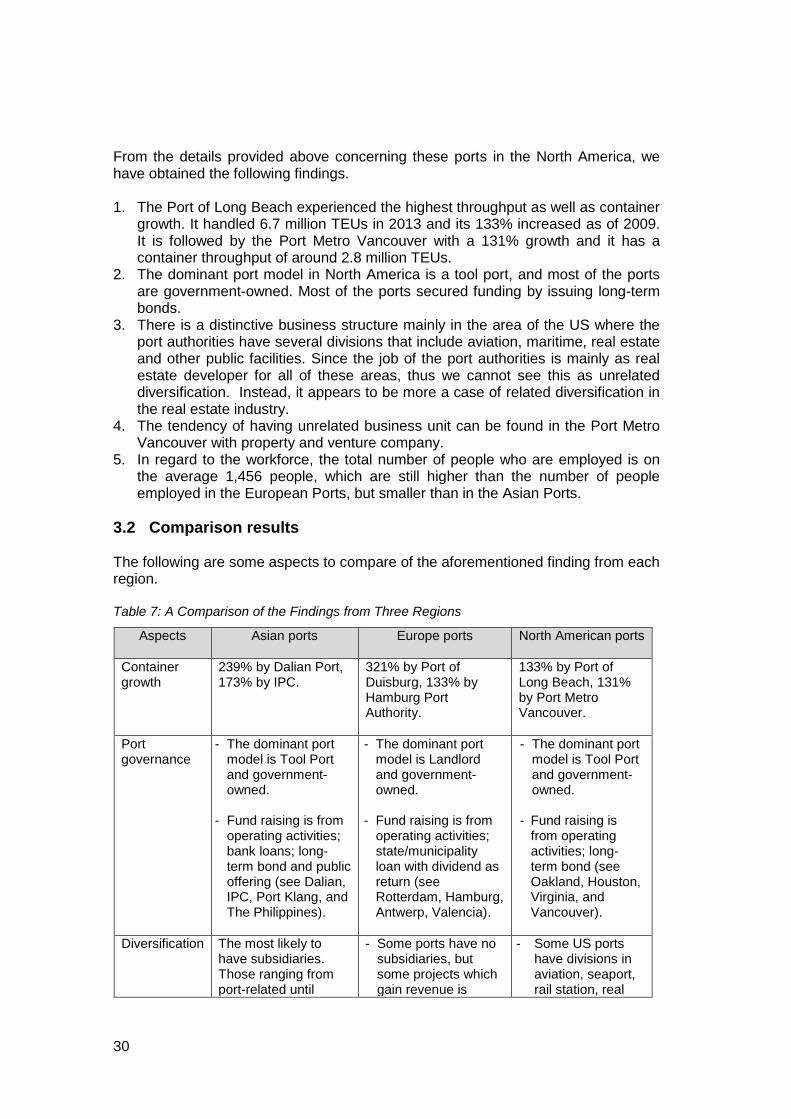
30
From the details provided above concerning these ports in the North America, we have obtained the following findings. 1. The Port of Long Beach experienced the highest throughput as well as container
growth. It handled 6.7 million TEUs in 2013 and its 133% increased as of 2009. It is followed by the Port Metro Vancouver with a 131% growth and it has a container throughput of around 2.8 million TEUs.
2. The dominant port model in North America is a tool port, and most of the ports are government-owned. Most of the ports secured funding by issuing long-term bonds.
3. There is a distinctive business structure mainly in the area of the US where the port authorities have several divisions that include aviation, maritime, real estate and other public facilities. Since the job of the port authorities is mainly as real estate developer for all of these areas, thus we cannot see this as unrelated diversification. Instead, it appears to be more a case of related diversification in the real estate industry.
4. The tendency of having unrelated business unit can be found in the Port Metro Vancouver with property and venture company.
5. In regard to the workforce, the total number of people who are employed is on the average 1,456 people, which are still higher than the number of people employed in the European Ports, but smaller than in the Asian Ports.
3.2 Comparison results The following are some aspects to compare of the aforementioned finding from each region. Table 7: A Comparison of the Findings from Three Regions
Aspects
Asian ports Europe ports North American ports
Container growth
239% by Dalian Port, 173% by IPC.
321% by Port of Duisburg, 133% by Hamburg Port Authority.
133% by Port of Long Beach, 131% by Port Metro Vancouver.
Port governance
- The dominant port model is Tool Port and government-owned.
- Fund raising is from
operating activities; bank loans; long-term bond and public offering (see Dalian, IPC, Port Klang, and The Philippines).
- The dominant port model is Landlord and government-owned.
- Fund raising is from
operating activities; state/municipality loan with dividend as return (see Rotterdam, Hamburg, Antwerp, Valencia).
- The dominant port model is Tool Port and government-owned.
- Fund raising is
from operating activities; long-term bond (see Oakland, Houston, Virginia, and Vancouver).
Diversification The most likely to have subsidiaries. Those ranging from port-related until
- Some ports have no subsidiaries, but some projects which gain revenue is
- Some US ports have divisions in aviation, seaport, rail station, real

31
Aspects
Asian ports Europe ports North American ports
unrelated (see Dalian, IPC, Port Klang, Port of Salalah).
managed under division (see Rotterdam, Antwerp, Valencia).
- Some ports have subsidiaries (see Hamburg, Duisburg and Piraeus).
estate (see New York, Oakland, and Seattle).
- Virginia and
Vancouver have some subsidiaries.
Unrelated subsidiaries
Property, software, trading service, vessel leasing, telecommunication (see Dalian). Hospital, software, electricity, training (see IPC)
Consultancy (see Rotterdam, Antwerp, Valencia). Ship repairing (see Piraeus). Rail operator (see Duisburg)
Property and venture company (see Vancouver).
Source: Author
In general, Asia ports, such as the Dalian Port and IPC still enjoy constantly high container growth in accordance with the regional economic growth. In Europe, the Port of Duisburg has undergone tremendous growth as the largest inland port in the world. Moreover, ports are still dominantly owned by the government, either the state or municipality as the shareholder in all three regions. To be more precise, we can observe a tendency which shows that ports which have a high growth rate, represented by the container growth, are more likely to have subsidiaries, including unrelated business as we can also see Dalian Port and IPC (Asia ports), Duisburg (Europe) and Port Metro Vancouver (North America). This is in line with what Hall (1995) argued that firms with superior performance possess the capability or ability to implement diversification. However, one could argue that it is the role of business units which makes it possible for port to achieve high growth. Thus, it appears that further research is still needed. We also see port companies that operate as tool port are more likely to have subsidiaries, including unrelated business as we have observed in the cases pertaining to the Dalian Port and IPC (Asia ports), Duisburg (Europe) and Port Metro Vancouver (North America). This might be because by nature, port operator has more diversity in its business encompassing cargo handling, nautical service and logistics. Verhoeven (2010) states that as an operator, port authority could become entrepreneur and provide commercial services which are not core the port’s activities. In the table 7, we can see Duisburg has extended its business as rail operator and Piraeus has done the same by having a ship-repair subsidiary. Moreover, according to Verhoeven (2010), a landlord port could also be an entrepreneur by generating revenue from non-core business activities. Here, we can also see how Rotterdam and Antwerp have expanded their business in consultancy and training services. It is worth noting that although real estate and consultancy are both in different fields, in this case it is still somewhat related in similar way namely

32
specific knowledge in port development. This might relate to the resource-based view in which firms tend to enter the market that corresponds with the resource requirement matches with the existing resource capability (Montgomery and Hariharan, 1991). Moreover, port authorities with financial autonomy either with long-term bond, commercial loan or listed on stock exchange, are more likely to diversify the business such as Dalian Port and IPC (Asia), Piraeus and Duisburg (Europe) and Port Metro Vancouver (North America). As the more private parties are involved, the more interest should be covered. This might, in turn, influence the corporate strategy making into more profit oriented; as a result the port authorities consider risk management through portfolio approach or by diversifying business into unrelated areas (Bowman and Ambrosini, 2003; Nachum, 1990; Chatterjee, 1986). In developing countries such as China and Indonesia, port authorities have the tendency to become a conglomerate as appears to be the case in other industries as well. Take example, Dalian Port and IPC, which both have diversified to include a wide range business by creating a number of subsidiaries. A study by Ramachandran et al. (2013) finds that such independent entities have their own board of directors, corporate strategy formulation and performance measurements, which are expected to have more effective decision making, greater autonomy to pursue specific performance and better resource allocation. In addition, there is a high level of involvement by the parent as the major shareholder, which allows them to have a crucial role to identify potential synergies among business units and foster the exchange of capabilities and ideas. These are some factors that might explain why conglomerations continue to thrive in emerging market, including in the port industry. In contrast, port authorities in developed countries are less likely to create subsidiaries, as instead some projects are managed under division. For instance, Rotterdam and Antwerp each have a consultancy service division, and ports in North America manage divisions comprising aviation, harbour and real estate. Ramachandran et al. (2013) explain that this is because investors in developed countries think that diversification could destroy value. Companies tend to accommodate new business in the form of division. Another issue is that it is somewhat tricky to determine whether the subsidiaries are unrelated or not since to some extent it appears they are related and are involved in the port industry. We believe that our framework, which relates it to the core activities of the port function as well as using Standard Industrial Classification (SIC), gives less bias when determining unrelated subsidiaries of the port authority. However, we suggest that the further research also need to take into account the internal management point of view. In conclusion, we have found three levels of unrelated diversification namely high, medium and low, represented by Dalian Port, IPC and Rotterdam. In the next chapter we will perform a case study of these ports in order to investigate the contribution of unrelated subsidiaries for each port authority.
33
4 Case Study This case study aims to obtain an in-depth understanding of the role and contribution the unrelated divisions or subsidiaries play in order to build port capability. The case studies are developed using the framework that is proposed in literature review and based on results from the archival research and the interview. We discuss three ports which each having a different level of unrelated diversification: namely high, medium and low as represented by Dalian Port, IPC and Port of Rotterdam, respectively. The first three chapters discussed each of the unrelated diversification strategies in Dalian Port, IPC and Port of Rotterdam. These include the policy framework employed in China, Indonesia and the Netherlands, the company profile, and the relationship of unrelated diversification strategy and port capabilities. The fourth section compares the results and answers our main research question that has been based on the three case studies.
4.1 Dalian Port 4.1.1 Policy Framework in China It is important to mention that due to our inability to read the Chinese language, we could only perform desk research in order to obtain an understanding of policy framework in China. Therefore, we refer to literature that has been translated to English, which was written by Chinese scholars. According to Cullinane and Wang (2006), the development of the port industry in China can be traced back to 1978 when the government established national economic reforms and introduced more “open” policies for foreign investment with the intention of encouraging trade and technology transfer as well as to reform state-owned enterprises (SOEs). In 1980, the Chinese government started creating a special region designed as an export processing zone: namely Special Economic Zones (SEZs). Nowadays, there are 15 Free Trade Zones (FTZs) and 39 SEZs with some of the largest being Shanghai, Ningbo, Guangzhou, Tianjin, and Dalian. Moreover, since China has becomes a full member of the World Trade Organization (WTO), this means that there is more room for foreign investors to compete with domestic players, thus a reform of the legal system is needed, including the maritime industry (Li et al., 2005). In line with all these transformations, the port industry in China is experiencing tremendous growth as well as port governance evolution. Cullinane and Wang (2006) have distinguished port governance evolution into three periods. First, there was the period dating from 1979-1984, which is called the High level of centralization. During this period, the port authority was extremely controlled by the central government. On behalf of the Chinese government, the Ministry of Communication was responsible for controlling all of the port activities and decision making including strategy formulation, infrastructure investment and the management of port operations. The local governments, such as the provincial or municipal bodies, had no control over the port authorities (Culliane and Wang, 2006). The second, period was from 1984-2004 and is entitled, Towards decentralization. Having learnt that high degree of centralization results in insufficient investment in

34
port infrastructure and superstructure, the local government gained increasing control and decision making so that this became more decentralized. Financial funding does not only come from China’s central government, but it also was provided by local government, foreign investments and commercial bank loans. However, there is an upper limit for foreign shareholders which have been set at 49%. The main reason for maintaining this threshold is that it was found undesirable for foreign investors to have the right to decide upon important issues. In addition, the port authority had the autonomy to be a policy regulator as well as to decide on strategic port activities (Culliane and Wang, 2006). . The third, period which was from 2004 up until today, has been called Decentralization and Corporatization. On 1 June 2004, the Chinese government established the Port Law which, which has made a considerable impact on the port industry. Under the Port Law, the Chinese central government will not hold any ownership of the ports and ports are to evolve and become purely a port business enterprise. The ownership consists of mainly local provincial or municipal governments. However, any strategic planning created by the local government must be approved of by the central government. Furthermore, according to the Port Law, domestic and foreign investors are allowed to enter port markets as well as become shareholders. In addition, the regulation which regards to an upper limit for foreign investors has been removed. Companies which want to invest in port construction and/or operation, either independently or partnerships are allowed (Culliane and Wang, 2006). In summary, Chinese ports have become purely business entity instead of having a regulator function. The companies have the right to manage and operate port infrastructure and superstructure as well as to formulate and implement corporate strategy. As private operators are allowed to invest and operate within the port, the port companies are also involved in landlord function. The port is owned by the provincial or municipality government, but it also has the financial autonomy to rise funding from bank loans or foreign investments. 4.1.2 Company Profile of Dalian Port Dalian Port was established on November 2005 and it is located in Northeast China. It is the subsidiary of a state-owned enterprise called Port of Dalian. Dalian Port is a company listed on the Hong Kong Stock Exchange and through group reorganization; it became the Holding Company of the group. The development of the port can be related to the Dalian Free Trade Zone (FTZ) which was set up by the Chinese government in 1992 (Baixun, 2012). The Dalian Port is the seventh largest ports in China after Shanghai, Shenzhen, Ningbo, Qingdao, Guangzhou and Tianjin in term of container throughput which is in 2013 it amounted to 10.8 million TEUs or which represented a 491% ten-years growth rate according to IAPH (2014).

35
Source: Baixun (2012) Figure 5: Location of Dalian Port
As a listed company, Dalian Port adopted the “Corporate Governance Code” in the Rules Governing the Listing of Securities on The Stock Exchange of Hong Kong Limited. The company has the Board which consists of four executive directors, one non-executive director and three independent non-executive directors. - The executive and non-executive directors are required to have expertise and
skills in management, operation, finance and port business related areas. They are responsible for mapping out the company’s strategy.
- The three independent non-executive directors are highly-qualified professionals who have experience in finance, law, internal control and corporate management. They are responsible for monitoring the management’s performance.
The Dalian Port is engaged in the following areas. - oil/liquefied chemical terminal and related logistics services, - container terminal and related logistics services, - automobile terminal and related logistics services, - ore terminal and related logistics services, - general cargo terminal and related logistics services, - bulk grain terminal and related logistics services, - passenger and roll-on/roll-off terminal and related logistics services, and - port value-added services and ancillary port operations.

36
Oil segment The company is the second largest oil terminal operator in China and the largest in the three Northeastern Provinces of China (Heilongjiang, Jilin and Liaoning. The company operates the 300,000 dwt oil terminal, which is the largest oil terminal in China. The oil terminal is the only oil terminal that has been approved by the Ministry of Communication of the People’s Republic of China to conduct transshipment services of imported crude oil for petrochemical enterprises in Dalian port and Bohai Bay. Container segment Dalian Port is supported by a comprehensive transportation network with a leading sea-to-rail intermodal transportation. As mentioned earlier, the Dalian Port is the seventh largest container terminal operator in China, having had a throughput of around 10 million TEUs in 2013. Automobile terminal segment Dalian Port is one of the four automobile import ports approved by the Chinese government. The port handled around 27,026 vehicles per annum. Ore segment Dalian port has two designated berths which can accommodate up to 300,000 dwt vessels. The throughput handled by the company is approximately 28,000 million tonnes per annum. General cargo segment The company is engaged in the provision of loading and discharging and logistics services for steel, equipment, dry bulk cargoes and large equipment. The throughput handled by the company is approximately 27 million tonnes per annum. Bulk Grain terminal segment The company considers itself as a highly competitive grain transshipment centre and has established a complete logistics operation system and transformed itself from a traditional loading and discharging services provider to a modern logistics provider. The throughput handled by the company totals approximately 6 million tonnes. The types of grain that are handled consist of mainly corn, barley and wheat as well as soy beans. Passenger and Ro-Ro segment The company has a leading position as it is located at the north end of Golden Waterbay in Bohai Bay. Value-added services segment Dalian Port has the exclusive port value-added services provider in Dalian Port which offers services such as tugging, pilotage and tallying. In addition, the company has expanded the business in IT, port logistics, construction management and supervision services and power supply. The company has the second largest tugging feet in China and has extended its services to other ports.

37
Table 8: Dalian Port’s growth of various commodities and income period from 2009-2014
Aspects 2009
2010 2011 2012 2013 2014 Growth 2009/2014
Oil (‘000 tonnes)
39,793 43,549 40,875 38,577 42,722 44,101 11%
Container (‘000 TEUs)
5,485 6,337 7,420 8,917 10,860 10,805 97%
Automobile (vehicle)
50,248 121,011 176,624 226,563 357,148 424,084 744%
Ore (‘000 tonnes)
28,211 28,407 27,348 22,488 22,759 17,523 -38%
General cargo (‘000 tonnes)
23,038 27,540 30,673 32,142 32,314 32,055 39%
Bulk grain (‘000 tonnes)
7,092 6,420 7,066 7,246 8,052 6,408 -10%
Passenger (‘000 persons)
3,524 3,037 4,080 4,062 3,793 3,668 4%
Ro-Ro (‘000 units)
459 512 627 832 947 1,092 138%
Income (million RMB)
1,678 3,317 3,955 4,645 6,982 7,942 373%
Source: Author based on Dalian Port Annual Report 2009-2014
The company conducts several investments in both the infrastructure and superstructure, in order to boost its business. For instance, the company constructs oil storage tanks with a total capacity of 1,000,000 m3, and it is building a stacking yard for ore terminal, which will be able to accommodate ultra large ore vessels of more than 400,000 tonnes, purchasing gantry crane for ore terminal. Moreover, the investment includes construction of railway siding and information systems. The capital expenditure is mainly funded by the Global offering of share, surplus operating funds and bank borrowings.
Source: Author based on Consolidated Financial Statement 2007-2014 of Dalian Port Figure 6: Percentage Average Showing the Various Sources of Income Received from the
Period 2007 to 2014 at Dalian Port
28.7%
14.4%
12.8%
10.6%
6.2%
5%
4.5%
3.8%
3.4%
2.7%
1.7% 1.4% 5%
Loading services
Commodity trading
Logistics services
Storage services
Leasing services
Agency services
Sales of goods
Port management services
Construction management and supervision services
Sales of electricity
IT services
Tallying services
Other
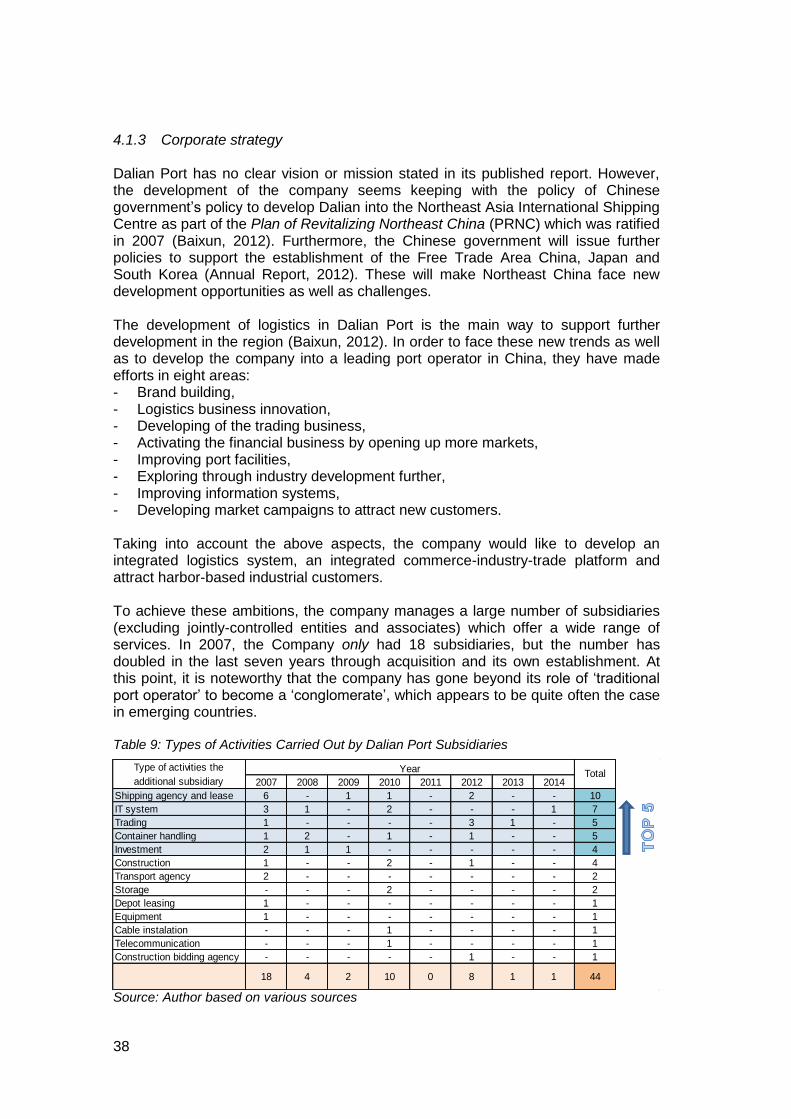
38
2007 2008 2009 2010 2011 2012 2013 2014
Shipping agency and lease 6 - 1 1 - 2 - - 10
IT system 3 1 - 2 - - - 1 7
Trading 1 - - - - 3 1 - 5
Container handling 1 2 - 1 - 1 - - 5
Investment 2 1 1 - - - - - 4
Construction 1 - - 2 - 1 - - 4
Transport agency 2 - - - - - - - 2
Storage - - - 2 - - - - 2
Depot leasing 1 - - - - - - - 1
Equipment 1 - - - - - - - 1
Cable instalation - - - 1 - - - - 1
Telecommunication - - - 1 - - - - 1
Construction bidding agency - - - - - 1 - - 1
1 1 44
Type of activities the
additional subsidiary
Year Total
18 4 2 10 0 8
4.1.3 Corporate strategy Dalian Port has no clear vision or mission stated in its published report. However, the development of the company seems keeping with the policy of Chinese government’s policy to develop Dalian into the Northeast Asia International Shipping Centre as part of the Plan of Revitalizing Northeast China (PRNC) which was ratified in 2007 (Baixun, 2012). Furthermore, the Chinese government will issue further policies to support the establishment of the Free Trade Area China, Japan and South Korea (Annual Report, 2012). These will make Northeast China face new development opportunities as well as challenges. The development of logistics in Dalian Port is the main way to support further development in the region (Baixun, 2012). In order to face these new trends as well as to develop the company into a leading port operator in China, they have made efforts in eight areas: - Brand building, - Logistics business innovation, - Developing of the trading business, - Activating the financial business by opening up more markets, - Improving port facilities, - Exploring through industry development further, - Improving information systems, - Developing market campaigns to attract new customers. Taking into account the above aspects, the company would like to develop an integrated logistics system, an integrated commerce-industry-trade platform and attract harbor-based industrial customers. To achieve these ambitions, the company manages a large number of subsidiaries (excluding jointly-controlled entities and associates) which offer a wide range of services. In 2007, the Company only had 18 subsidiaries, but the number has doubled in the last seven years through acquisition and its own establishment. At this point, it is noteworthy that the company has gone beyond its role of ‘traditional port operator’ to become a ‘conglomerate’, which appears to be quite often the case in emerging countries. Table 9: Types of Activities Carried Out by Dalian Port Subsidiaries
Source: Author based on various sources

39
The company has been gradually establishing subsidiaries throughout the year for the last seven years and as a result, in 2014 it managed 44 subsidiaries in total. The table above depicts the top 5 activities in terms of the number of subsidiaries, showing only one which is related to the core activities as a port operator. In regard to shipping activities, the company has the second largest tugging feet in China. They utilize the advantages offered by its tug boat fleet to further develop tugboat leasing business or investment for tugging business outside of Dalian. The company timely changed its tugboats’ location and optimized the distribution of tugging services so that they can maintain a stable long-term customer base and they developed relationships with new customers. As a result, the vessel leasing business has contributed significant income to the port companies. Currently, there are around 15 tugboats allocated for the market outside Dalian on a long-term lease (Annual Report 2013). In IT system industry, the subsidiaries provide services to internal customers, for instance by developing a logistics integrated system within the port and they have developed an electronic ticket sales system for both the passenger and vehicle. Furthermore, the company has also expanded its external market such as providing port information technology consultancy service. These activities are intended to accelerate the operational business development as well as to maintain the income growth of the port company (Annual Report 2013). Furthermore, in regard to trading and investment activities, it appears that this area of business has generated a considerable income for the company as shown in the figure above. The hinterland of the company is mainly concentrated in the Heilongjiang Province, Jilin Province and Liaoning Province and the eastern regions in Inner Mongolia. The cargo supply is mainly related to bulk general cargo, oil products, containers, automobiles as well as passenger and roll-on and roll-off operations, such as iron ore, coal, steel and grain. Moreover, the improvements made in the handling capacity and the storage capacity has supported the further development and expansion of the terminal logistics business. At the same time, the company has been proactively building an integrated logistics services system through its consolidation of rails, roads, inland ports as well as shipping and other port resources. The company sees an opportunity to expand into the commodity trading business and wishes to utilize those advantages so that it can create relationship between logistics operation and the trading operation. This is aimed to not only contribute to the growth in throughput but also growth for the commodity industry (Liu, 2015).
4.2 Indonesia Port Corporation 4.2.1 Policy Framework in Indonesia As an archipelago country, Indonesia is dependent on sea transport for its domestic trade as well as international trade (Ray, 2008). Sea transport is the cheapest and most efficient means of transportation for reaching isolated areas in Indonesia (Chairijah, 2003). However, Indonesia’s ports are still relatively inefficient and this has become a critical factor in regard to the increased shipping cost (Ray, 2008). To overcome this issue, Indonesia government has established the Shipping Law 2008 which amended the previous Shipping Law 21/1992. The Organization for
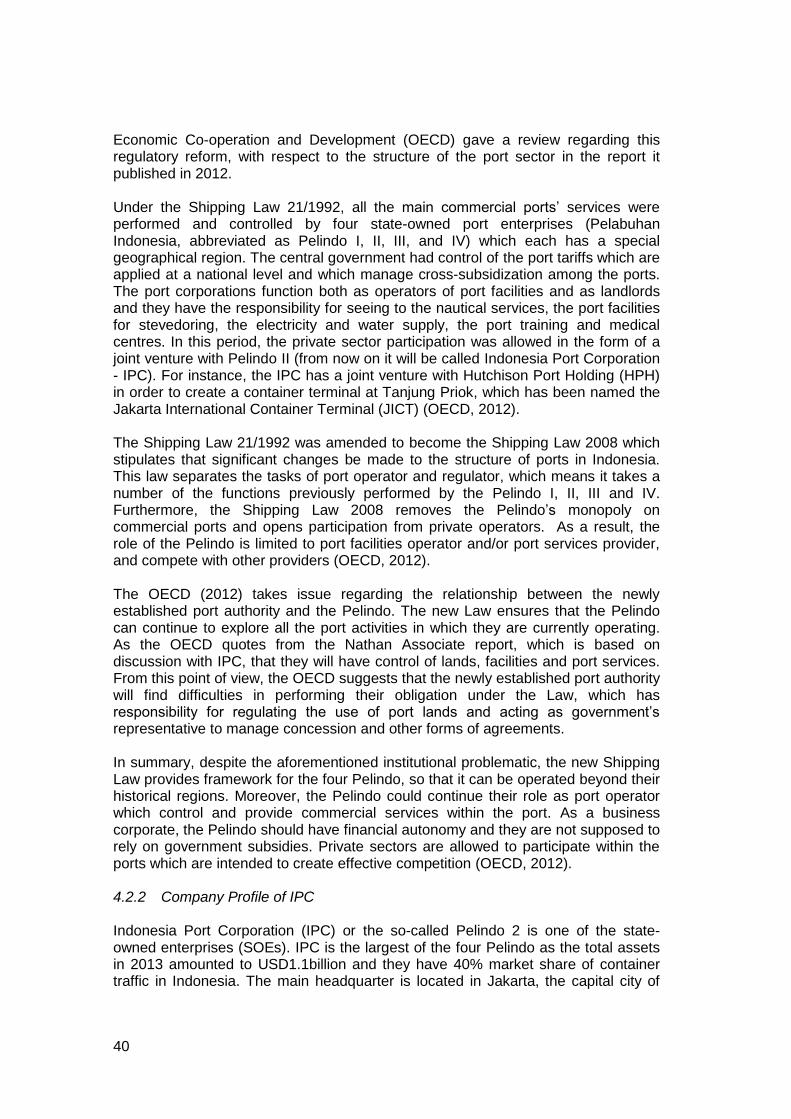
40
Economic Co-operation and Development (OECD) gave a review regarding this regulatory reform, with respect to the structure of the port sector in the report it published in 2012. Under the Shipping Law 21/1992, all the main commercial ports’ services were performed and controlled by four state-owned port enterprises (Pelabuhan Indonesia, abbreviated as Pelindo I, II, III, and IV) which each has a special geographical region. The central government had control of the port tariffs which are applied at a national level and which manage cross-subsidization among the ports. The port corporations function both as operators of port facilities and as landlords and they have the responsibility for seeing to the nautical services, the port facilities for stevedoring, the electricity and water supply, the port training and medical centres. In this period, the private sector participation was allowed in the form of a joint venture with Pelindo II (from now on it will be called Indonesia Port Corporation - IPC). For instance, the IPC has a joint venture with Hutchison Port Holding (HPH) in order to create a container terminal at Tanjung Priok, which has been named the Jakarta International Container Terminal (JICT) (OECD, 2012). The Shipping Law 21/1992 was amended to become the Shipping Law 2008 which stipulates that significant changes be made to the structure of ports in Indonesia. This law separates the tasks of port operator and regulator, which means it takes a number of the functions previously performed by the Pelindo I, II, III and IV. Furthermore, the Shipping Law 2008 removes the Pelindo’s monopoly on commercial ports and opens participation from private operators. As a result, the role of the Pelindo is limited to port facilities operator and/or port services provider, and compete with other providers (OECD, 2012). The OECD (2012) takes issue regarding the relationship between the newly established port authority and the Pelindo. The new Law ensures that the Pelindo can continue to explore all the port activities in which they are currently operating. As the OECD quotes from the Nathan Associate report, which is based on discussion with IPC, that they will have control of lands, facilities and port services. From this point of view, the OECD suggests that the newly established port authority will find difficulties in performing their obligation under the Law, which has responsibility for regulating the use of port lands and acting as government’s representative to manage concession and other forms of agreements. In summary, despite the aforementioned institutional problematic, the new Shipping Law provides framework for the four Pelindo, so that it can be operated beyond their historical regions. Moreover, the Pelindo could continue their role as port operator which control and provide commercial services within the port. As a business corporate, the Pelindo should have financial autonomy and they are not supposed to rely on government subsidies. Private sectors are allowed to participate within the ports which are intended to create effective competition (OECD, 2012). 4.2.2 Company Profile of IPC Indonesia Port Corporation (IPC) or the so-called Pelindo 2 is one of the state-owned enterprises (SOEs). IPC is the largest of the four Pelindo as the total assets in 2013 amounted to USD1.1billion and they have 40% market share of container traffic in Indonesia. The main headquarter is located in Jakarta, the capital city of

41
Indonesia. It manages 12 ports that are spread out across Indonesia. The Port of Tanjung Priok is the main port of the company which is also the busiest port in Indonesia, in which 6.59 million TEUs handled in 2013. Thanks to the GDP growth of Indonesia which is around 5% per year.
Source: IPC Figure 7: IPC Operational Area
IPC is 100% owned by the Indonesia government under the supervision of Ministry of Transportation. A two-tier board system has been applicable to the port company. IPC is an independent company with the Board of Directors which conducts the management of the Company. The Board of Commissioners is the representative of the government and has the responsibility of supervising the management and overseeing the state of affairs in the company. The central government serves as the shareholder and exercises its influence within the organization through the General Meeting of Shareholders. Historically, the IPC has the right to perform commercial activities within the port such as nautical service, cargo handling, maintain the water supply, and other port services. The IPC even performed as landlord since there was a joint venture with Hutchison (HPH) in order to create a container terminal in the Port of Tanjung Priok in 1999. However, the new Shipping Law 2008 stipulated that IPC was to act as port operator and the landlord function has been transferred to the newly established port authority. The new Law also removed the Pelindo’s monopoly operation area. As the market becomes more competitive, in the last five years, IPC has strengthened its position by expanding the business not only in port services, but also in the logistics industry and some supporting businesses. Table 10: IPC Business Activities
Type of service
Services
Ship service Anchorage, pilotage, towage, mooring.
Cargo service Cargo handling, stacking, warehouse.
Other service Port equipment rental services, land rental, water and electricity services, miscellaneous business services.
Source: Author based on IPC Annual Report 2014
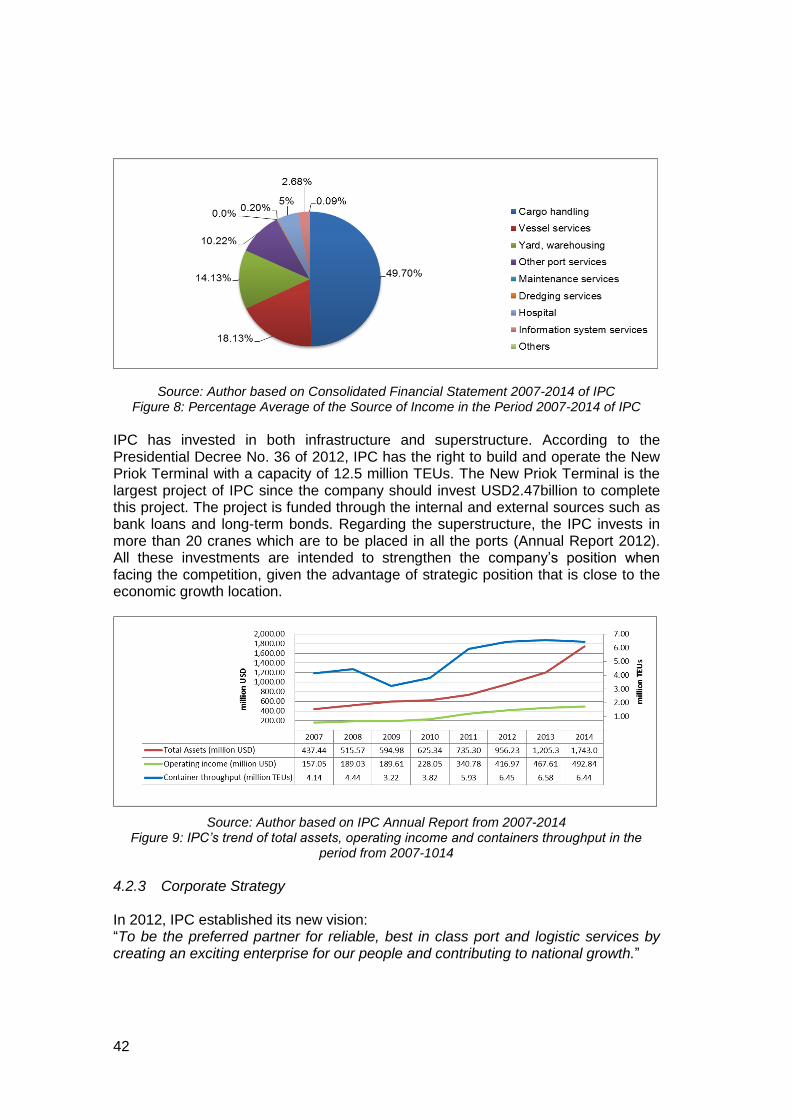
42
Source: Author based on Consolidated Financial Statement 2007-2014 of IPC
Figure 8: Percentage Average of the Source of Income in the Period 2007-2014 of IPC IPC has invested in both infrastructure and superstructure. According to the Presidential Decree No. 36 of 2012, IPC has the right to build and operate the New Priok Terminal with a capacity of 12.5 million TEUs. The New Priok Terminal is the largest project of IPC since the company should invest USD2.47billion to complete this project. The project is funded through the internal and external sources such as bank loans and long-term bonds. Regarding the superstructure, the IPC invests in more than 20 cranes which are to be placed in all the ports (Annual Report 2012). All these investments are intended to strengthen the company’s position when facing the competition, given the advantage of strategic position that is close to the economic growth location.
Source: Author based on IPC Annual Report from 2007-2014
Figure 9: IPC’s trend of total assets, operating income and containers throughput in the period from 2007-1014
4.2.3 Corporate Strategy In 2012, IPC established its new vision: “To be the preferred partner for reliable, best in class port and logistic services by creating an exciting enterprise for our people and contributing to national growth.”

43
In order to realize this vision, the Company sets several goals categorized in three aspects: - Operational excellence through standardizing the operation process and
strengthening people capabilities. - Delivering exceptional service by customer-focused management, setting the
international standards of port services and building an integrated logistics business.
- Taking quantum leap by becoming a holding company with at least 3 subsidiaries listed and completion of the New Priok development.
Accordingly, in the same year, IPC established six subsidiaries and was followed by four more in 2013, all mainly financed by internal surplus cash generated from operating activities. Thus, taking into account the previous subsidiaries, IPC manages 14 subsidiaries with various types of services. Through these subsidiaries, the company aims to build integrated businesses which are believed it can strengthen the port’s capability as well as accelerate the development national logistics system. IPC believes that by establishing subsidiaries, they can provide agility, specialization as well as become self-financed entities (Wignall, 2015). Each of the subsidiaries has its own board of directors and board of commissioners and they have the authority to make decision as well as to construct corporate strategies. IPC divides the subsidiaries into three categories: namely, cargo handling, logistics and supporting business. Table 11: IPC’ list of Subsidiaries based on Category and Year Established
Category
Before 2012 2012 2013
Cargo handling
MTI (Multi terminal).
IKT (Car terminal),
TPI (Container terminal), IPC TPK (Container terminal).
Logistics - PPI (Port developer), JPPI (Port equipment). Rukindo (Dredging).
JAI (Marine service),
Supporting business
RSP (Hospital), EDII (IT).
ILCS (IT), EPI (Power supply),
PMLI (Training).
Source: Author based on various sources
As we refer to the port operator function from a theory point of view, it seems that the IPC performs its role beyond the theory framework. We can see from the table that IPC has established some subsidiaries that are to some extent not in the core activities of a port operator namely PPI, port equipment-company, IT companies, electricity provider, training centre and Hospital. We discuss the role of these kinds of subsidiaries later. In general, IPC believes that these subsidiaries can help the company to improve the port’s capability in term of providing efficient and effective services to the port’s client as well as promoting national growth. Accordingly, PPI (99% owned by IPC) was established with the first task being to build and develop The New Priok Terminal. PPI then expanded its business by providing road access for this new

44
terminal to an industrial area in East Java as the accessibility is a critical success factor for port (Annual Report, 2014). JPPI is 99% owned by IPC and has business in port equipment maintenance within the port. It ensures the readiness and availability of equipment to support the port’s operation. JPPI conducted the maintenance of stevedoring equipment in 10 branches of the IPC ports (Annual Report, 2014). Moreover, the IPC believes that information and communication technology (ICT) is an important part in the transformation to be world-class operators. Through ILCS (51% owned by IPC), IPC has developed an electronic payment service (e-payment), e-office and port community system. The port community is intended to build integrated information systems among the stakeholders in the port such as shipping lines, freight forwarder, cargo terminal and the government agencies (Wignall, 2015). With respect to electricity, the IPC finds that to have effective operation in the port, stable power supply is importantly needed. It is thus IPC (55%) with ‘Haleyora Power’ (45%) (The subsidiary of state-owned electricity company) established the EPI with the objective to provide an electricity supply with premium service for customers in the port area (Wignall, 2015). Whereas the PMLI (99% owned by IPC), has been created to pursue the continuous skill improvement of the IPC staffs. PMLI has a consultancy team from the STC (Netherlands) and conduct port management training for IPC group. The company also manages Port and Maritime Training Centre that is equipped with crane simulators and ship simulators and a hotel with 148 rooms (Annual Report, 2014). In regard to the Hospital, it is a government legacy in the beginning when IPC was established. It manages the health insurance for the IPC staffs (Wignall, 2015). As mentioned earlier, these newly-established subsidiaries are meant to support IPC capability as port operator as well as having a self-financing capability. It is therefore important for those companies to become an entrepreneur in search of business outside the IPC group. Table 12: The Percentage of Internal Transaction with IPC Group of Each Subsidiary’s Income
Name of Subsidiary (date established)
2013 2014
PPI – port developer (Nov’2012)
Loss Loss
JPPI – port equipment (Nov’2012)
98% 49%
ILCS – IT system (Sep’2012)
100% 53%
EPI – power supply (Oct’2012)
47% 82%
PMLI – Training (Jul’2013)
Loss 84%
Source: Author based on Consolidated Financial Statement 2013-2014 of IPC
45
From the table above, it indicates that there is significant internal transaction between the newly-established subsidiaries within the IPC group representing a cross-resource and capability among them. For instance the highest one is PMLI with 84% of its income comes from internal transaction with IPC. Moreover, the majority income of EPI generated from terminal under IPC. Whereas PPI experienced loss over two years after it was established. In regard to the income contribution to the parent company, an internal transaction means that the income in one subsidiary is at the expense of the other subsidiary, which results in zero income for the parent company. According to accounting principle, this term is called ‘elimination’. Establishing of such subsidiaries can be risky if they cannot generate income outside the IPC group since it the end these subsidiaries can be considered as an expense centre. Furthermore, regardless of the advantages of this business structure in terms of agility or decision making and specialization, IPC should take organizational costs, such as monitoring costs (Montgomery, 1994), into account that have emerged from these subsidiaries so that the company can manage its financial capability in the future.
4.3 Port of Rotterdam 4.3.1 Policy Framework in the Netherlands The Netherlands has no specific law on ports and the port activity is regulated by the municipal regulation (OECD, 2010). To give a framework regarding port governance in the Netherlands, we refer to the European Sea Port Organizations (ESPO) Report 2011 which examines the port governance in Europe. The author classifies port authorities into five groups based on a geo-governance typology, namely Hanse, New Hanse, Anglo-Saxon, Latin and New Latin. In particular, the Netherlands belong to ‘Hanse’ together with Iceland, Norway, Finland, Sweden, Denmark, Germany and Belgium. In this study, port governance comprises three aspects: (1) the function of port authority, (2) the institutional framework of port authority and (3) the financial capability of the port authority. The main economic objective of the port authority in the Hanse region is to maximize the value-added of the port authority, instead of maximizing tonnage handled or maximizing profit. This objective in turn influences the functional profile of the port authority. The dominant port function in Hanse as well as in the Netherland is a landlord function. The role of the landlord is to plan port land development, to invest in the port infrastructure and to lease that infrastructure to third parties. Furthermore, the port authority in the Netherlands has autonomy of land ownership (ESPO, 2011). Regarding the institutional framework, the majority of port authorities in the Netherlands are publicly owned with a predominantly municipal ownership. Dutch Port reform began with the corporatization of Port of Rotterdam in 2004. This means that the port authority has been converted into a legally and financially independent legal body with its own board of directors and the government retains its ownership of the port (World Bank, 2001). The responsibilities of a board of directors involve the development of general strategies, overseeing the management as well as the financial well-being and performance of the port (ESPO, 2011).
46
Moreover, with respect to the financial capability, the port authorities in the Netherlands derive income mostly from port dues and lease fees. Port authorities have financial responsibility mainly for the port infrastructure investment such as dredging, quays, operation, and maintenance. However, in some cases the infrastructure development is financed by municipality and national government and the port authority pays the dividend i.e. Maasvlakte 2 project of Port of Rotterdam. Investment for the port superstructure and equipment are the entire responsibility of private sectors (ESPO, 2011). In summary, the port authorities in the Netherlands predominantly act as a landlord and they are responsible for planning port land development, investing in port infrastructure and making concession agreement that infrastructure to third party. Their revenue is mainly derived from lease fees and port dues. The port authorities are responsible for the port infrastructure investment; however, some of the big projects are still financed by the municipalities and/or the national government. 4.3.2 Company profile of the Port of Rotterdam The Port of Rotterdam (PoR) is the largest logistics and industrial hub in Europe, located in the city of Rotterdam, the Netherlands. The port has held a strong position in the Hamburg–Le Havre range for many years with the market share for all commodities at 37.5% (Annual Report 2013). The cargo includes dry bulk (iron, coal, other), liquid bulk (crude oil, mineral oil, LNG), container and other goods. Bellow follows some figures: - Port area: 12,500 ha (land and water, of which approx. 6,000 ha is business
sites. Length of port: over 40 km. (excluding Maasvlakte 2). - Staffs: around 1,200 people. - Direct employment: 180,000 jobs. - Throughput: approx. 450 million tonnes per annum, 11 million TEUs containers
per annum. - Shipping call: around 30,000 sea-going vessels and 110,000 inland vessels. The Port of Rotterdam Authority is a public limited company (N.V.) with to shareholders: the Municipality of Rotterdam (70%) and the Dutch State (30%). The city of Rotterdam is the owner of the port area and has given PoR an eternal concession to develop the port area (Zepeda, 2015). Since 21 July 2008, two-tier board system has been applicable to the port company. The port authority is an independent company with an Executive Board which conducts the day-to-day management of the company. The independent Supervisory Board supervises the Executive Board and oversees the state of affairs in the company. The shareholders exercise their influence within the organization through the General Meeting of Shareholders. The core tasks (under the articles of association) are: - The development, construction, management and operation of the port and
industrial area in Rotterdam. - Promoting the effective, safe and efficient handling of shipping in the port of
Rotterdam and offshore approaches to the port. These activities embrace two domains; the handling of shipping traffic and the development of the port area.

47
In line with the task mentioned above, the port authority invests in the following: - Development of port infrastructure such as quays, jetties, and road and maintain
the waterways at a certain depth. - Traffic management, traffic control centres in order to handle shipping efficient
and effectively. All these port infrastructure developments and investments are in turn leased out with a long-term lease to the terminal operators, logistics companies, and industrial companies such as petrochemical companies, power plants, etc. It is worth noting that the Maasvlakte 2 was mainly financed by the Dutch State and PoR (Zepeda, 2015). The major source of incomes is from land leases and port dues. In 2013, the Port of Rotterdam obtained an income which accounted for €639 million, in which €624 million or 97% of it generated from leases and port dues. 4.3.3 Corporate strategy The mission of the Port of Rotterdam Authority is as follows: “The Port of Rotterdam Authority develops, in partnership, the world-class European port” And, the vision is “The Port of Rotterdam Authority is fully committed to the continued development of Rotterdam’s port and industrial complex so it can become the most efficient, safe and sustainable in the world. The Port of Rotterdam Authority is creating value for customers by developing chains, networks and clusters, both in Europe and in emerging markets worldwide. As an enterprising port developer, the Port of Rotterdam Authority is the partner for world-class customers in petro-chemicals, energy, transport and logistics. In this way the Port of Rotterdam Authority is enhancing the competitiveness of the Netherlands.” (Annual Report 2012) Based on the mission and vision, the port authority formulated its Business Plan 2011-2015 which contains strategies and activities. The Company’s strategies can be illustrated schematically below.
Source: Port of Rotterdam Annual Report 2012 Figure 10: Port of Rotterdam Business Plan 2011-2015
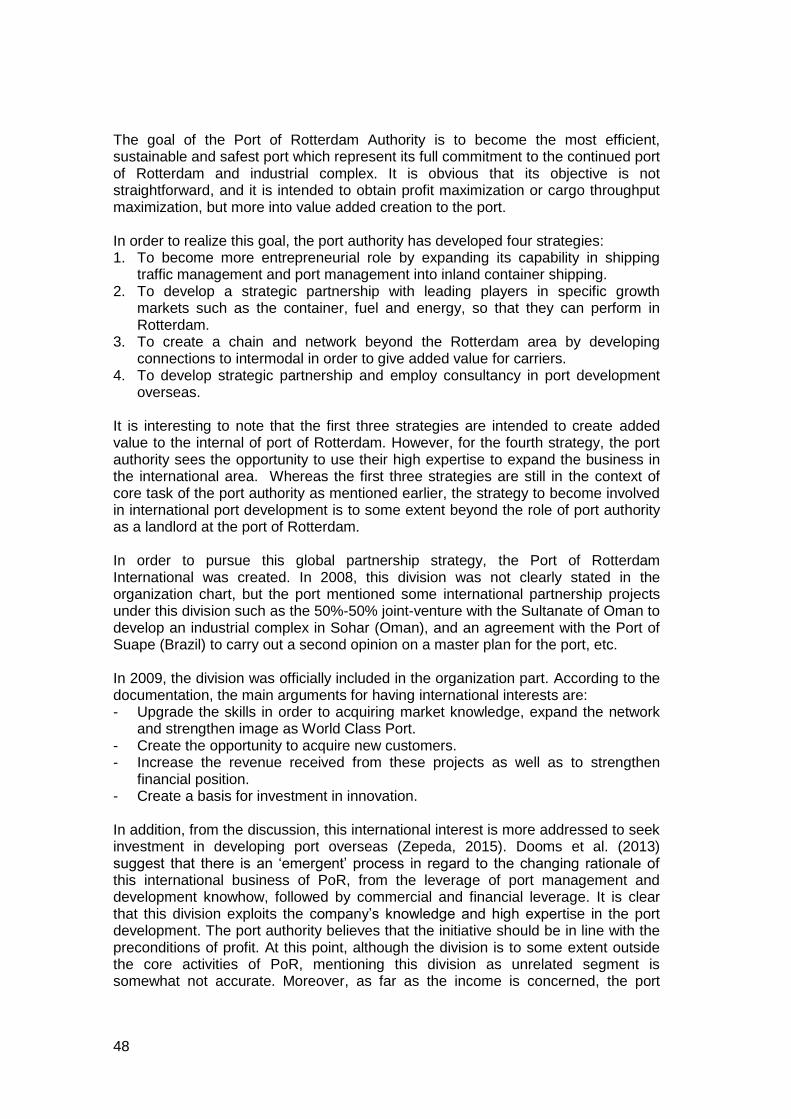
48
The goal of the Port of Rotterdam Authority is to become the most efficient, sustainable and safest port which represent its full commitment to the continued port of Rotterdam and industrial complex. It is obvious that its objective is not straightforward, and it is intended to obtain profit maximization or cargo throughput maximization, but more into value added creation to the port. In order to realize this goal, the port authority has developed four strategies: 1. To become more entrepreneurial role by expanding its capability in shipping
traffic management and port management into inland container shipping. 2. To develop a strategic partnership with leading players in specific growth
markets such as the container, fuel and energy, so that they can perform in Rotterdam.
3. To create a chain and network beyond the Rotterdam area by developing connections to intermodal in order to give added value for carriers.
4. To develop strategic partnership and employ consultancy in port development overseas.
It is interesting to note that the first three strategies are intended to create added value to the internal of port of Rotterdam. However, for the fourth strategy, the port authority sees the opportunity to use their high expertise to expand the business in the international area. Whereas the first three strategies are still in the context of core task of the port authority as mentioned earlier, the strategy to become involved in international port development is to some extent beyond the role of port authority as a landlord at the port of Rotterdam. In order to pursue this global partnership strategy, the Port of Rotterdam International was created. In 2008, this division was not clearly stated in the organization chart, but the port mentioned some international partnership projects under this division such as the 50%-50% joint-venture with the Sultanate of Oman to develop an industrial complex in Sohar (Oman), and an agreement with the Port of Suape (Brazil) to carry out a second opinion on a master plan for the port, etc. In 2009, the division was officially included in the organization part. According to the documentation, the main arguments for having international interests are: - Upgrade the skills in order to acquiring market knowledge, expand the network
and strengthen image as World Class Port. - Create the opportunity to acquire new customers. - Increase the revenue received from these projects as well as to strengthen
financial position. - Create a basis for investment in innovation. In addition, from the discussion, this international interest is more addressed to seek investment in developing port overseas (Zepeda, 2015). Dooms et al. (2013) suggest that there is an ‘emergent’ process in regard to the changing rationale of this international business of PoR, from the leverage of port management and development knowhow, followed by commercial and financial leverage. It is clear that this division exploits the company’s knowledge and high expertise in the port development. The port authority believes that the initiative should be in line with the preconditions of profit. At this point, although the division is to some extent outside the core activities of PoR, mentioning this division as unrelated segment is somewhat not accurate. Moreover, as far as the income is concerned, the port
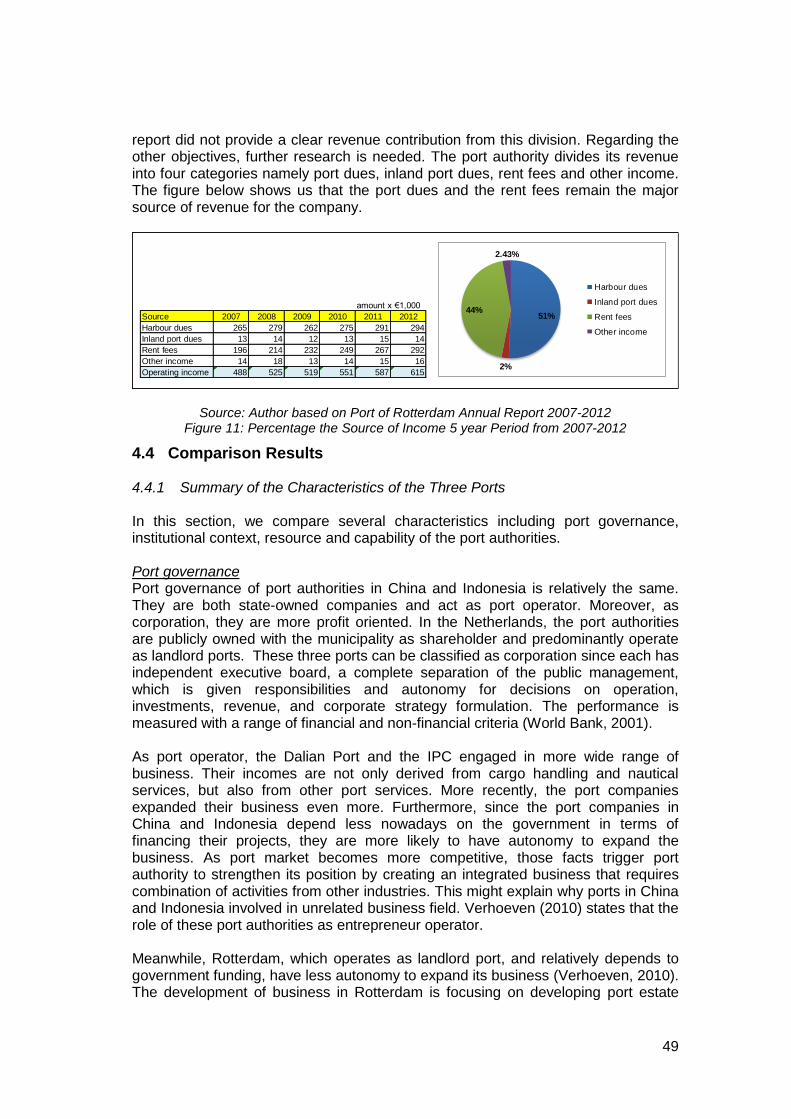
49
report did not provide a clear revenue contribution from this division. Regarding the other objectives, further research is needed. The port authority divides its revenue into four categories namely port dues, inland port dues, rent fees and other income. The figure below shows us that the port dues and the rent fees remain the major source of revenue for the company.
Source: Author based on Port of Rotterdam Annual Report 2007-2012 Figure 11: Percentage the Source of Income 5 year Period from 2007-2012
4.4 Comparison Results 4.4.1 Summary of the Characteristics of the Three Ports
In this section, we compare several characteristics including port governance, institutional context, resource and capability of the port authorities. Port governance Port governance of port authorities in China and Indonesia is relatively the same. They are both state-owned companies and act as port operator. Moreover, as corporation, they are more profit oriented. In the Netherlands, the port authorities are publicly owned with the municipality as shareholder and predominantly operate as landlord ports. These three ports can be classified as corporation since each has independent executive board, a complete separation of the public management, which is given responsibilities and autonomy for decisions on operation, investments, revenue, and corporate strategy formulation. The performance is measured with a range of financial and non-financial criteria (World Bank, 2001). As port operator, the Dalian Port and the IPC engaged in more wide range of business. Their incomes are not only derived from cargo handling and nautical services, but also from other port services. More recently, the port companies expanded their business even more. Furthermore, since the port companies in China and Indonesia depend less nowadays on the government in terms of financing their projects, they are more likely to have autonomy to expand the business. As port market becomes more competitive, those facts trigger port authority to strengthen its position by creating an integrated business that requires combination of activities from other industries. This might explain why ports in China and Indonesia involved in unrelated business field. Verhoeven (2010) states that the role of these port authorities as entrepreneur operator. Meanwhile, Rotterdam, which operates as landlord port, and relatively depends to government funding, have less autonomy to expand its business (Verhoeven, 2010). The development of business in Rotterdam is focusing on developing port estate
amount x €1,000
Source 2007 2008 2009 2010 2011 2012
Harbour dues 265 279 262 275 291 294
Inland port dues 13 14 12 13 15 14
Rent fees 196 214 232 249 267 292
Other income 14 18 13 14 15 16
Operating income 488 525 519 551 587 615
51%
2%
44%
2.43%
Harbour dues
Inland port dues
Rent fees
Other income

50
and intermodal expansion. Rotterdam derives income mainly from port dues and rent fees. Institutional context As mentioned in the previous chapter, companies in emerging market are more likely to form conglomerates by creating a number of subsidiaries. In this case, the Dalian Port and the IPC can represent this phenomenon in the port industry. Dalian Port views the establishment of these subsidiaries, through acquisition and own creation, as a tool for expanding their business by utilizing the resources they have, as well as allowing them to maintain income growth by entering such promising industries such as commodity trading and information technology. Moreover, the IPC established several subsidiaries so that each subsidiary is expected to be more agile, having more self-financing capability in order to improve the parent company capability both in technical and financial. In contrast, Rotterdam, which represents ports in developed countries, is less likely to have a subsidiary. The new business, in this case the port management consultancy, will be accommodated by creating new division instead of independent entity such as subsidiary. In addition, Rotterdam shares views that the creation of new business should be related to a precondition in which profit and in the area where they are good at. That is why the port company is less likely to have unrelated business. These findings seem in line with study by Ramachandran et al. (2013). Resource and capability It is worth mentioning that the resource and capability of the port authorities depends on their role. In this case, as port operator, the Dalian Port and the IPC, have a relatively wide range of resource such as terminal capacities, cranes, tugboats, skilled-employees, cargo handling knowledge and other resources as they provide several other services. In addition, Rotterdam, as a landlord port, manages port lands and a great degree of expertise in real estate development as their main resources. With the wide range of resources, as well as their financial capability, the Dalian Port and the IPC tends to have more subsidiaries which are in some cases outside the core activities of the port operator. In the case of the Dalian Port, the company manages their excess capacity in the tugboat business so as to enter market in the ship leasing industry. Moreover, they utilize the advantage of having considerable handling capacity and proximity to the hinterland to involve in commodity trading business. These businesses seem to be intended to maintain resources synergies and income growth of the company as well as pursue market power in the port industry (Montgomery, 1994). However, in the case of the IPC, the unrelated subsidiaries were established, which is mainly financed by the internal surplus cash, to create an integrated business so as to improve the ports capability in terms of providing efficient and effective services. Some of them are through acquisition and merger with other companies. IPC created port developer-company to improve port’s accessibility to the hinterland and established Training Centre to continuously improve port staffs’ capabilities. Furthermore, IPC has entered IT industry to obtain knowledge sharing, as the
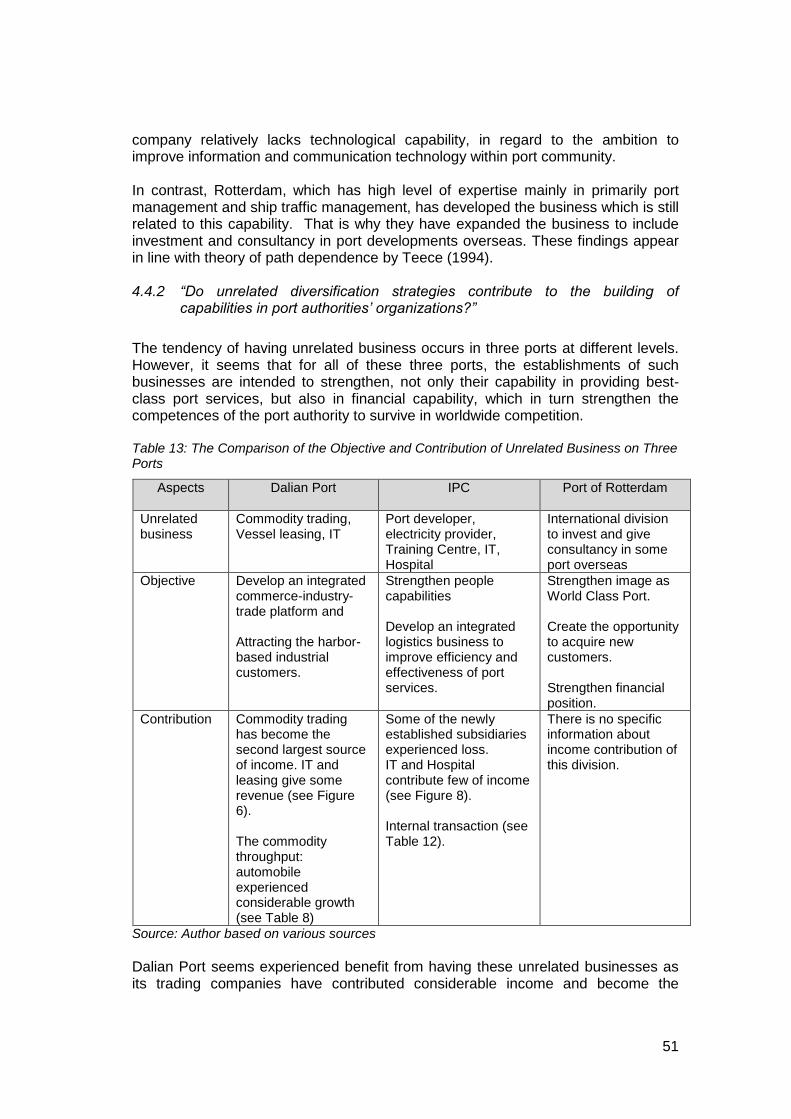
51
company relatively lacks technological capability, in regard to the ambition to improve information and communication technology within port community. In contrast, Rotterdam, which has high level of expertise mainly in primarily port management and ship traffic management, has developed the business which is still related to this capability. That is why they have expanded the business to include investment and consultancy in port developments overseas. These findings appear in line with theory of path dependence by Teece (1994). 4.4.2 “Do unrelated diversification strategies contribute to the building of
capabilities in port authorities’ organizations?”
The tendency of having unrelated business occurs in three ports at different levels. However, it seems that for all of these three ports, the establishments of such businesses are intended to strengthen, not only their capability in providing best-class port services, but also in financial capability, which in turn strengthen the competences of the port authority to survive in worldwide competition. Table 13: The Comparison of the Objective and Contribution of Unrelated Business on Three Ports
Aspects
Dalian Port IPC Port of Rotterdam
Unrelated business
Commodity trading, Vessel leasing, IT
Port developer, electricity provider, Training Centre, IT, Hospital
International division to invest and give consultancy in some port overseas
Objective Develop an integrated commerce-industry-trade platform and Attracting the harbor-based industrial customers.
Strengthen people capabilities Develop an integrated logistics business to improve efficiency and effectiveness of port services.
Strengthen image as World Class Port. Create the opportunity to acquire new customers. Strengthen financial position.
Contribution Commodity trading has become the second largest source of income. IT and leasing give some revenue (see Figure 6). The commodity throughput: automobile experienced considerable growth (see Table 8)
Some of the newly established subsidiaries experienced loss. IT and Hospital contribute few of income (see Figure 8). Internal transaction (see Table 12).
There is no specific information about income contribution of this division.
Source: Author based on various sources
Dalian Port seems experienced benefit from having these unrelated businesses as its trading companies have contributed considerable income and become the

52
second largest source of income. They also contribute to the increasing throughput growth of several commodities, especially automobile. These facts reveal that by managing these trading businesses; Dalian Port try build integrated port-trade services which might represent what the so-called market power (Montgomery, 1994). In the case of IPC, the establishment of some unrelated subsidiaries is aimed to build integrated port services, which are believed, can improve efficiency and effectiveness of the port. Yet, this ultimate impact still needs further research. In terms of financial capability, some of the subsidiaries contribute few of direct income such as hospital and IT companies. In particular, the port company might benefit knowhow sharing from IT companies as to improve port capability in terms of information and communication technology, several improvement projects are e-payment, e-office and port community system. Nonetheless, as mentioned earlier, some of the newly established subsidiaries still experienced loss and depended mostly on the internal transaction within the group. This fact shows us that having a number of subsidiaries can be risky not only because if they lack self-financial capability, but also the port company needs to spend coordination and integration cost (Chakrabarti et al. 2007). The Port of Rotterdam might benefit from its international business in terms of strengthening its image as a world class port. However, in terms of direct income contribution, we assume that the business did not give significant results as the information is not clearly stated in the consolidated financial statement. In summary, the benefits of unrelated diversification in port industry encompass the dimension of income growth and resource and knowhow sharing, which are aimed to improve port capability in providing integrated as well as value-added port services (Notteboom and Wilkelmans, 2001), as in the case of Dalian Port and IPC. The contributions of unrelated business units vary in the three ports. In the case of Dalian Port, its unrelated businesses seem to perform significantly as they contribute considerable income and efficient resource synergies. In IPC, the port company might benefit from knowhow sharing but the income contribution from its unrelated businesses shows not significant as some of the subsidiaries experienced loss. While in PoR, the international division, which is intended to improve financial position of the port authority, appears to also not contribute clearly in terms of direct income. We suggest that the fruitfulness of the contribution of unrelated business might relate to the capability of port companies, as the parent, to maintain diversified businesses, the quality of the resources, and economy growth of the country (Hall, 1995; Wernelfelt, 1984; Bowman and Ambrosini, 2003). These issues should be investigated more deeply for further research.

53
5 Conclusion
5.1 Conclusion This study was guided by the main question of “Do unrelated diversification strategies contribute to the building of capabilities in port authorities’ organizations?” The idea is based on the tendency of some port authorities, especially in China and Indonesia, have several subsidiaries which are to some extent outside the core activities of port industry. In order to provide a detailed analysis the main research questions was subdivided into four sub-research questions. First, we need to figure out the definition of the unrelated diversification strategy, as well as its measurement, its drivers, and its implications, from the strategic management literatures. Our desk research found that unrelated diversification can be defined if a firm diversifies its business units into different areas or industries, through self-establishments, acquisitions or mergers (Anthony and Govindarajan, 2006). However, in the port industry, one should note that there are some port’s functions exist in the world. Thus, in order to determine whether subsidiaries are unrelated or not, this should relate to the core business of the port authorities. We then found that the Entropy Measurement which was developed by Palepu (1985) allows us to obtain the degree of unrelated diversification of port authorities. This method uses the Standard Industrial Classification (SIC) to define whether the business unit is in related or unrelated industry. Previous scholars argued that this model serve as a primary measure considering its technical rigour, strong theoretical base and lack of subjectivity (Sambharya, 2000). With regard to the drivers of such a strategy, it relates to financial performance, institutional context, and risk management (Hall, 1995; Ramachandran, 2013; Rameswamy, 2004; Michel and Shaked, 1984). Moreover, the implications of unrelated strategies can be seen through three perspectives, namely the market-power view, the resource-view, and the agency view. In general, the first two views give positive analysis to the unrelated diversification as this strategy allows the port companies to obtain market power and achieve economies of scales from resources synergies. In contrast, the last view argues that unrelated diversification can reduce firm value considering its monitoring cost (Montgomery, 1994; Pandya and Rao, 1998; Chakrabarti et al. 2007). Second, the path dependence context matters in the sense that previous investments or business determine future behaviour. Previous studies highlight that every firm has its learning process of the capability required in the industry it operates. As a firm become expert in the particular industry, it tends to expand the business which is related to previous activities. Thus, previous scholars argue that a firm which has lack of low path-dependencies tends to expand new business by maintaining contractual agreement with other firms namely conglomerates or highly-diversified companies (Teece et al. 1994). This explains why IPC, which relatively lacks technology knowledge, tried to enter IT market through merger with other company. In contrast, the Port of Rotterdam, with a high level of expertise in port estate management and ship traffic management, has expanded business which is still related to its expertise, namely in inland port and intermodal expansion. Third, there is institutional context issue when a port authority comes to unrelated diversification. First of all, it relates to the port governance of the port authority. This

54
study found that port authorities, as port operator and have self-financing capability, are more likely to expand their business outside the core activities. This is because as port operator, port authority has been involved in wider services which are not only in cargo handling and nautical services, but also other value-added activities (Verhoeven, 2012). As port market becomes more competitive, those facts trigger port authority to strengthen its position by creating an integrated business that requires combination of activities from other industries. Then, we found it relates the tendency in emerging market, which port authorities believe that the independent subsidiaries can be more agile in terms of decision making as well as having self-financing capability. Fourth, this study tried to answer the link between resources and capabilities of port authorities and their unrelated diversification strategy. Our framework proposed that this should relate, first, to the functions of port authorities, namely landlord and port operator, which then determine their resource and capabilities. This study found that port authority, as port operator and with relatively high number of resources, technical, physical or financial, is more likely to have unrelated subsidiaries. In Dalian Port, this decision is influenced by the fact that the port authority has excess capacity of resources as well as the proximity to the hinterland. As a result, they, for instance, entered into vessel leasing and commodity trading business market, which aimed to maintain income growth and pursue integrated trade-port services. Moreover, in the case of IPC, the decision is influenced by its internal surplus cash but relatively lack of technology knowledge. As a result, IPC established a number of unrelated subsidiaries, through acquisition and merger, which aimed to obtain resource sharing among the business unit in order to improve efficiencies and effectiveness of port’s capability. Finally, we investigate the contribution of unrelated diversification to the building of capabilities in port authorities. We summarise that the benefits of unrelated diversification in port industry encompass the dimension of income growth and resource and knowhow sharing, which are aimed to improve port capability in providing integrated as well as value-added port services. The contributions of unrelated business units vary in the three ports. In the case of Dalian Port, its unrelated businesses seem to perform significantly as they contribute considerable income and efficient resource synergies. In IPC, the port company might benefit from knowhow sharing but the income contribution from its unrelated businesses shows not significant as some of the subsidiaries experienced loss. While in PoR, the international division, which is intended to improve financial position of the port authority, appears to also not contribute clearly in terms of direct income.
5.2 Limitation and Further Research Every research has its own limitations. First of all, our archive research, the comparison of characteristics, with respect to unrelated diversification, of ports in several regions, should have been developed in large number of ports, so it can be quite representative. However, it is challenging to find sufficient and comparable data in annual report for several ports in each region. Many of them provide very limited information. As a result, we can only employ 21 port or 7 ports per region as we used 3 regions, which is indeed this number is not quite representative. Thus, further research should expand the number of ports and the regions, as well as the

55
length of period, so the result will be more representative. Nonetheless, one should note about the limitation information that is provided in annual report. As we used container growth as the parameter of port performance, this could lead bias because some ports might have more throughputs in dry or liquid bulk. Therefore, further research will be better to use throughput growth or volume in tons. In addition, we noticed that some ports have other activities not in the form of subsidiaries or division, but they do not always appear in the website or annual reports and the revenue that is derived from such activities are not clearly stated. Thus, in order to obtain sufficient and reliable data, further research need to conduct a detailed survey with all of port authorities or companies. Due to limited time, this research cannot obtain enough primary data especially from the interview. As a result, we draw analysis mainly exploratory from secondary data such as literatures, articles, and annual report, so that the findings will be so much depending on the quality of these data. So, we suggest that for the next research, it can be added by quantitative approach such as regression so the result would become robust. In the case studies, we found that the three ports are not quite comparable as Dalian Port and IPC cannot be classified as port authority. Thus, further research should take this issue into account. Moreover, it is somewhat difficult to determine whether the subsidiaries are unrelated or not since to some extent it appears they are using the same resources and are involved in the port industry. We believe that our framework, which relates it to the core activities of the port function as well as using Standard Industrial Classification (SIC), gives less bias when determining unrelated subsidiaries of the port authority. Therefore, there is a need for a better framework to structure research on unrelated diversification by port authorities. We suggest that taking into account internal management point of view might be the solution to obtain more objective results.


57
Bibliography
Anthony, R.N. & Govindarajan, V., 2007. Management Control Systems. Boston: Irwin McGraw-Hill.
Baixun, W., 2012. Logistics Port Development Strategies in Revitalizing Northeast China A Case Study of Dalian Port, China. Ritsumeikan Asia Pacific University.
Barney, J., 1991. Firm Resources and Sustained Competitive Advantage. Journal of Management, 17(1), pp.99–120.
Berezhnoy, A, 2012.Vertical Integration of Inland Port into Port Network: Case study of Port of Ust-Luga. Erasmus University Rotterdam: Maritime Economics and Logistics.
Bowman, C. & Ambrosini, V., 2003. How the Resource-based and the Dynamic Capability Views of the Firm Inform Corporate-level Strategy. British Journal of Management, 14(4), pp.289–303.
Chairijah, 2003. The legal regime governing shipping in Indonesia. University of Wollongong. Available at: https://www.google.nl/url?sa=t&rct=j&q=&esrc=s&source=web&cd=2&cad=rja&uact=8&ved=0CCcQFjABahUKEwjAx7qTgpfHAhXps3IKHYbJA6A&url=http://ro.uow.edu.au/cgi/viewcontent.cgi?filename=0&article=2861&context=theses&type=additional&ei=fKrEVcCZMOnnygOGk4-ACg&usg=AF [Accessed August 6, 2015].
Chakrabarti, A., Singh, K. & Mahmood, I., 2007. Diversification and performance: evidence from East Asian firms. Strategic Management Journal, 28, pp.101–120.
Chang, S.J. & Hong, J., 2000. Economic Performance of Group-Affiliated Companies in Korea: Intragroup Resource Sharing and Internal Business Transactions. Academy of Management Journal, 43(3), pp.429–448.
Chatterjee, S., 1986. Types of synergy and economic value: The impact of acquisitions on merging and rival firms. Strategic Management Journal, 7(2), pp.119–139. Available at: http://www.jstor.org/stable/2486162.
Christensen, H.K. & Montgomery, C.A., 1981. Corporate Economic Performance: Diversification Strategy Versus Market Structure. Strategic Management Journal, 2(4), pp.327–343.
CIMC Group, The Biggest Container Production Base with Most Advanced Facilities Locates in Shenzhen. Available at: http://www.cimc.com/en/about/newspromotion/news/200910/t20091001_3832.shtml [Accessed July 19, 2015].
Cullinane, K. & Wang, T.F., 2006. Port Governance in China. Research in Transportation Economics, 17(06), pp.331–356.

58
Department of Economic and Social Affairs, 2008. International Standard Industrial Classification of All Economic Activities Rev. 4, New York. Available at: http://unstats.un.org/unsd/publication/seriesM/seriesm_4rev4e.pdf.
Dalian Port (PDA) Company Ltd, Annual Report 2007. Available at: http://www.dlport.cn/Files/DownLoad/E AR 2007.pdf [Accessed August 6, 2015a].
Dalian Port (PDA) Company Ltd, Annual Report 2008. Available at: http://www.dlport.cn/Files/DownLoad/E 08 AR.pdf [Accessed August 6, 2015b].
Dalian Port (PDA) Company Ltd, Annual Report 2009. Available at: http://www.dlport.cn/Files/DownLoad/E 09AR.pdf.
Dalian Port (PDA) Company Ltd, Annual Report 2010. Available at: http://www.dlport.cn/Files/DownLoad/E 2010 Annual Report.pdf [Accessed August 6, 2015d].
Dalian Port (PDA) Company Ltd, Annual Report 2012. Available at: http://www.hkexnews.hk/listedco/listconews/SEHK/2013/0424/LTN20130424249.pdf [Accessed August 6, 2015e].
Dalian Port (PDA) Company Ltd, Annual Report 2014. Available at: http://www.dlport.cn/Files/ew2880AR20150423.pdf [Accessed June 20, 2015f].
Dalian Port (PDA) Company Ltd, Interim Report 2013. Available at: http://www.dlport.cn/Files/ew2880-20130927.pdf.
Dooms, M., van der Lugt, L. & De Langen, P.W., 2013. International strategies of port authorities : The case of the Port of Rotterdam Authority. Research in Transportation Business & Management, 8, pp.148–157.
European Union, European Union - The economy. Available at: http://europa.eu/about-eu/facts-figures/economy/index_en.htm [Accessed July 20, 2015].
Grant, R.M., 1991. The Resource-Based Theory of Competitive Advantage: Implications for Strategy Formulation. California Management Review, pp.114–135. Available at: http://libproxy.tulane.edu:2048/login?url=http://search.ebscohost.com/login.aspx?direct=true&db=bth&AN=4761020&login.asp&site=ehost-live&scope=site.
Halawi, L.A., Aronson, J.E. & McCarthy, R. V, 2005. Resource-Based View of Knowledge Management for Competitive Advantage. The Electronic Journal of Knowledge Management, 3(2), pp.75–86. Available at: http://www.ejkm.com/issue/download.html?idArticle=55.
Hall, E.H., 1995. Corporate Diversification and Performance: An Investigation of Causality. Australian Journal of Management, 20(1), pp.25–42.
59
Hamburg Port Authority, Annual Report 2013. Available at: http://www.hamburg-port-authority.de/de/presse/broschueren-und-publikationen/Documents/finanzbericht_en_web.pdf [Accessed July 12, 2015].
Hitt, M.A. & Ireland, R.D., 1986. Relationships Among Corporate Level Distinctive Competencies, Diversification Strategy, Corporate Structure and Performance. Journal of Management Studies, 23(4), pp.401–416. Available at: http://search.ebscohost.com/login.aspx?direct=true&db=buh&AN=4555864&site=ehost-live.
Hoskisson, R.E. et al., 1993. Construct Validity of an Objective (Entropy) Categorial Measure of Diversification Strategy. Strategic Management Journal1, 14(3), pp.215–235.
Indonesia Port Corporation, Annual Report. Available at: http://www.indonesiaport.co.id/read/annual-report.html [Accessed July 12, 2015].
Javidan, M., 1998. Core Competence: What Does it Mean in Practice? Long Range Planning, 31(1), pp.60–71.
Knock, C.J. & Guillen, M.F., 2001. Strategy and Structure in Developing Countries: Business Groups as an Evolutionary Response to Opportunities for Unrelated Diversitification. Industrial and Corporate Change, 10(1), pp.77–113. Available at: http://www.scopus.com/inward/record.url?eid=2-s2.0-0035073236&partnerID=40&md5=90f1a27213180c8191659fbc3015bbfc.
De Langen, P.W., 2003. The Performance of Seaport Clusters, Rotterdam: Erasmus Research Institute of Management.
De Langen,P.W., and Haezendonck, E. 2012. Port as Clusters of Economic Activity. The Blackwell Companion Maritime Economics. UK: Wiley-Blackwell Publishing.
Li, K.X. et al., 2005. Maritime Policy in China after WTO : Impacts and Implications for Foreign Investment. Journal of Maritime Law & Commerce, 36(1), pp.77–98.
Liu, X, 2015. Interview by the author. Dalian Port, China.
Maritime and Port Authority of Singapore, Annual reports. Available at: http://www.mpa.gov.sg/sites/global_navigation/about_mpa/annual_reports.page [Accessed June 20, 2015].
Michel, A. & Shaked, I., 1984. Does Business Diversification Affect Performance? Financial Management, 13(4), pp.18–25. Available at: http://www.jstor.org/stable/3665297.
Montgomery, C.A., 1994. Corporate diversification. Journal of Economic Perspectives, 8(3), pp.163–178.

60
Montgomery, C.A. & Hariharan, S., 1991. Diversified expansion by large established firms. Journal of Economic Behavior & Organization, 15(1), pp.71–89.
Montgomery, C.A. & Singh, H., 1984. Diversification Strategy and Systematic Risk. Management, 5(2), pp.181–191.
Nachum, L., 1999. Diversification strategies of developing country firms. Journal of International Management, 5, pp.115–140.
Notteboom, T.E. & Winkelmans, W., 2001. Structural changes in logistics: how will port authorities face the challenge? Maritime Policy & Management, 28(1), pp.71–89.
OECD, 2012. OECD Reviews of Regulatory Reform Indonesia: Regulatory and Competition Issues in Ports, Rail and Shipping, Paris: OECD. Available at: http://www.oecd.org/indonesia/Chap 5 - Ports Rail and Shipping.pdf.
OECD, 2010. Transcontinental Infrastructure Needs To 2030 / 2050: North-West Europe Gateway Area - Port of Rotterdam Case Study, Paris: OECD.
Palepu, K., 1985. Diversification Strategy, Profit Performance and the Entropy Measure. Strategic Management Journal, 6(3), pp.239–255.
Pandya, A.M. & Rao, N. V, 1998. Diversification and Firm Performance : an Empirical Evaluation. Journal of Financial and Strategic Decisions, 11(2), pp.67–81.
Parola, F., Satta, G. & Panayides, P.M., 2015. Corporate strategies and profitability of maritime logistics firms. Maritime Economics & Logistics, 17(1), pp.52–78. Available at: http://www.palgrave-journals.com/doifinder/10.1057/mel.2014.18.
Peteraf, M.A., 1993. The Cornerstones of Competitive Advantage: a Resource-Based View. Strategic Management Journal, 14(3), pp.179–191.
Piraeus Port Authority, Annual Reports. Available at: http://www.olp.gr/en/investor-information/annual-reports [Accessed July 12, 2015].
Philippine Ports Authority, Annual Report. Available at: http://www.ppa.com.ph/ [Accessed July 12, 2015].
Port Authority of New York & New Jersey, Annual Report 2013. Available at: https://www.panynj.gov/corporate-information/pdf/annual-report-2013.pdf [Accessed July 12, 2015].
Port Authority of Valencia, Annual Report. Available at: http://www.valenciaport.com/en/VALENCIAPORT/PuertoEnEuros/Paginas/Cuentas-Anuales.aspx [Accessed July 12, 2015].
61
Port Klang Authority, Annual Report. Available at: http://www.pka.gov.my/index.php/download/category/66-anual-report.html [Accessed June 20, 2015].
Port Metro Vancouver, Annual Report. Available at: http://www.portmetrovancouver.com/?attachment_id=2475 [Accessed July 12, 2015].
Port of Antwerp, Annual Report 2013. Available at: http://www.portofantwerp.com/en/annual-report-2013 [Accessed July 12, 2015].
Port of Duisburg, Annual Reports. Available at: http://presse.duisport.de/en/publications/annual-reports.html [Accessed July 12, 2015].
Port of Houston Authority, Annual Report. Available at: http://www.portofhouston.com/inside-the-port-authority/communications/publications/annual-report/ [Accessed July 12, 2015].
Port of Long Beach, Annual Reports. Available at: http://www.polb.com/finance/annualreports.asp [Accessed July 12, 2015].
Port of Rotterdam Authority, Annual Report 2008. Available at: https://www.portofrotterdam.com/sites/default/files/Annual-report-2008.pdf [Accessed August 8, 2015a].
Port of Rotterdam Authority, Annual Report 2009. Available at: https://www.portofrotterdam.com/sites/default/files/Annual-report-2009.pdf [Accessed August 8, 2015b].
Port of Rotterdam Authority, Annual Report 2010. Available at: https://www.portofrotterdam.com/sites/default/files/annual-report-2010- PortofRotterdam-Authority.pdf [Accessed August 8, 2015c].
Port of Rotterdam Authority, Annual Report 2012.
Port of Rotterdam Authority, Annual Report 2013. Available at: https://www.portofrotterdam.com/en/files/annual-report-2013 [Accessed June 20, 2015e].
Port of Salalah, Annual Report. Available at: http://www.salalahport.com/index.php?lang=en&name=Annual Reports&itemid=103 [Accessed July 12, 2015].
Port of Seattle, 2012. Comprehensive Annual Financial Report. , p.181. Available at: http://www.portseattle.org/About/Financial-Info/Documents/CAFR_2013.pdf [Accessed July 12, 2015].
Port of Virginia, Annual Report. Available at: http://www.portofvirginia.com/about/annual-report/ [Accessed July 12, 2015].
62
Porter, M.E., 1980. Competitive Strategy Techniques for Analyzing Industries and Competitors First Edit., New York: First Free Press.
Porter, M.E., Goold, M. & Luchs, K., 1996. From competitive advantage to corporate strategy. In Managing the multibusiness company: Strategic issues for diversified groups. New York, pp. 285–314.
Prahalad, C.K. & Hamel, G., 1990. The Core Competence of the Corporation. Harvard Business Review, 68(3), pp.79–91. Available at: http://www.springerlink.com/index/v1774282g031q747.pdf.
Ramachandran, J., Manikandan, K.S. & Pant, A., 2013. Why Conglomerates Thrives (Outside the U.S.). Harvard Business Review, 91(12), pp.111–120.
Ramaswamy, K., Li, M. & Petitt, B.S.P., 2004. Who drives unrelated diversification? A study of Indian manufacturing firms. Asia Pacific Journal of Management, 21(4), pp.403–423.
Rapoza, K., 2014. The World’s 10 Busiest Ports. Forbes. Available at: http://www.forbes.com/sites/kenrapoza/2014/11/11/the-worlds-10-busiest-ports/ [Accessed July 19, 2015].
Ray, D., 2008. Indonesian Port Sector Reform and the 2008 Shipping Law, Indonesia. Available at: http://pdf.usaid.gov/pdf_docs/Pnadn188.pdf.
Reed, R. & Luffman, G.A., 1986. Diversification: the Growing Confusion. Strategic Management Journal, 7(1), pp.29–35. Available at: http://www.jstor.org/stable/2485965.
Robinson, R. 2002. Ports as Elements in Value-Driven Chain Systems: the New Paradigm. Maritime Policy and Management, 29(3),pp.241-255.
Rodrigue, J.P. and Notteboom, T., 2009. The terminalization of Supply Chain: Reassessing the Role of Terminals in Port/Hinterland Logistical relationship. Maritime Policy and Management,36(2).pp.165-183
Rumelt, R.P., 1982. Diversification Strategy and Profitability. Strategic Management Journal, 3(4), pp.359–369.
Sambharya, R.B., 2000. Assessing the Construct Validity of Strategic and SIC-Based Measures of Corporate Diversification. British Journal of Management, 11, pp.163–173.
Teece, D.J. et al., 1994. Understanding corporate coherence. Journal of Economic Behavior and Organization, 23, pp.1–30.
UNCTAD, 2014. Review of Maritime Transport 2014, New York and Geneva. Available at: http://unctad.org/en/PublicationsLibrary/rmt2014_en.pdf.

63
Van der Lugt, L., Dooms, M. & Parola, F., 2013. Strategy making by hybrid organizations : The case of the port authority. Research in Transportation Business & Management, 8, pp.103–113.
Verhoeven, P., 2010. A review of port authority functions: towards a renaissance? Maritime Policy & Management, 37(3), pp.247–270.
Verhoeven, P., 2011. European Port Governance: Report of an Enquiry into the Current Governance of European Seaports, Bruxelles. Available at: http://www.espo.be/images/stories/Publications/studies_reports_surveys/espofactfindingreport2010.pdf.
Wade, M.R. & Gravill, J.I., 2003. Diversication and performance of Japanese IT subsidiaries : a resource-based view. Information & Management, 40, pp.305–316. Available at: http://www.sciencedirect.com/science/article/pii/S0378720602000125.
Wernerfelt, B., 1984. A Resource-Based View of the Firm. Strategic Management Journal, 5(2), pp.171–180.
World Bank, 2009. World Development Report 2009. Washington DC: World Bank.
World Bank, 2001. World Bank Port Reform Tool Kit, Washington DC: World Bank.
World Bank, 2014. Sri Lanka Overview. , pp.1–16. Available at: http://www.worldbank.org/en/country/srilanka/overview [Accessed July 19, 2015].
Wignal, D, 2015. Interview by the author. Indonesia Port Corporation.
Wikipedia-the free encyclopedia, 2015. Samsung. Available at: https://en.wikipedia.org/wiki/Samsung [Accessed July 17, 2015].
Zepeda, C, 2015. Interview by the author. Port of Rotterdam, the Netherlands


65
Type
Function
Passive real estate “manager”: Active real estate “broker”: Active real estate “developer”
- Continuity and maintenance - Continuity, maintenance, and
improvement
- Continuity, maintenance, and
improvement
- Development broker and investor - Direct investor
- Include urban and environmental
real estate brokerage
- Include urban and
environmental real estate
development
- Financial revenue from real
estate on “tariff” basis
- Financial revenue from real estate
on commercial basis
- Financial revenue from real
estate on commercial basis
- Financial revenue from non-
core activities
- Active pursuit of market
niches
Passive application and
enforcement of rules and
regulation mainly set by other
agencies
Idem facilitator
Provide services in other ports
Economic dimension:
- Solve hinterland bottlenecks
- Provide training and education
- Provide IT services
- Promotion and marketing
- Lobbying
Geographical
Dimension
Local Local + Regional Local + Regional + Global
Provide services of general
economic interest and specialized
commercial services
Provide services of general
economic interest as well as
commercial services
Dynamic use of concession policy,
in combination with real estate
broker role
Dynamic use of concession
policy, in combination with real
estate development role
“Leader in Dissatisfaction” as
regards performance of private port
services providers
Shareholder in private port
service provider
Active application and enforcement
of rules and regulations through
cooperation with local, regional and
national regulatory agencies +
setting of own rules and regulations
Provide assistance to port
community to comply with rules and
regulations
Direct investments in inland port,
dry ports and other seaports
Direct commercial B2B
negotiations with port customers
Idem facilitator + selling
expertise and tools outside the
port
Financial revenue from regulator
role on “tariff” basis
Financial revenue from regulator
role on commercial basis
Financial revenue from regulator role
on “tariff” basis with differential
charging options for sustainability
Entrepreneur
Landlord
Regulator
Operator
Mechanistic application of
concession policy (license-
issuing window)
Community Manager
Not actively developed Idem facilitator type but
economic dimension with more
direct commercial involvement
- Development mainly left to
others (government/private
sector)
Mediator in commercial B2B
relations between service providers
and port customers
Conservator Facilitator
Strategic partnerships with inland
port, dry ports and other seaports
Appendices I. Renaissance Matrix
Table 14: Hypothetical Typology of Port Authorities
Source: Verhoeven (2010), p. 259-260

66
II. Entropy Measurement The following is the entropy measurement formula developed by Palepu (1985). DT = DR + DU
𝐷𝑇 =∑𝐷𝑅𝑗
𝑚
𝑗=1
𝑝𝑗 +∑𝑝𝑗𝑚
𝑗=1
ln(1
𝑝𝑗)
𝐷𝑅𝑗 =∑𝑃𝑖𝑗ln(1/𝑃𝑖
𝑗
𝑖𝜀𝑗
)
Where, m = number of industry groups j = 1… m pj = Share of jth industry group revenue in the total revenue of the firm.
𝑃𝑖𝑗= Share of the segment i of industry group j in total revenue of the group.
Table 15: Data and Results of the Entropy Measurement
1 The Maritime and Port
Authority of Singapore
(Singapore),
Revenue in Singapore Dollar
Asia 279,950,774 Terminal
operation (63)
264,950,410 8,925,067 4,959,818 278,835,295
2 Port of Salalah (Oman),
Revenue in Omani Rial
Asia 58,505,000 Terminal
operation (63)
48,468,000 10,037,000 58,505,000
3 Dalian Port Company Ltd
(China),
Revenue in Renminbi
Asia 3,341,276,785 Terminal
operation (63)
1,535,308,523 101,038,326 252,337,445 1,888,684,294
4 Port Klang Authority
(Malaysia),
Revenue in Ringgit
Asia 217,377,000 Terminal
operation (63)
27,080,000 5,302,000 32,382,000
5 IPC, Tanjung Priok, Jakarta
(Indonesia),
Revenue in Rupiah
Asia 6,116,087,781,383 Terminal
operation (63)
1,278,674,990,564 818,715,720,379 3,684,386,978,499 5,781,777,689,442
6 Sri Lanka Ports Authority
(Sri Lanka),
Revenue in Rupee
Asia 28,279,000,000 Terminal
operation (63)
25,046,000,000 3,233,000,000 28,279,000,000
7 Philippine Port Authority
(Philippine), Revenue in
Peso
Asia 10,915,344,333 Terminal
operation (63)
3,674,739,630 6,380,404,185 537,728,194 10,592,872,009
8 Port of Rotterdam Authority
(the Netherlands), Revenue
in Euro
Europe 639,907,000 Real estate -
lease (70)
624,110,000 15,797,000 624,110,000
9 Hamburg Port Authority
(Germany), Revenue in Euro
Europe 280,680,206 Real estate -
lease (70)
280,680,206 280,680,206
10 Port of Antwerp Authority
(Belgium), Revenue in Euro
Europe 335,641,000 Real estate -
lease (70)
335,641,000 335,641,000
11 Port of Zeebrugge (Belgium),
Revenue in Euro
Europe 13,222,479 Real estate -
lease (70)
13,222,479 13,222,479
12 Port Authority of Valencia
(Spain), Revenue in Euro
Europe 117,609,000 Real estate -
lease (70)
117,609,000 117,609,000
13 Port of Duisburg (Germany),
Revenue in Euro
Europe 159,922,000 Terminal
operation (63)
42,024,000 60,468,000 45,641,000 148,133,000
14 Piraeus Port Authority
(Greece), Revenue in Euro
Europe 108,630,469 Terminal
operation (63)
25,574,046 27,865,867 4,158,703 57,598,616
15 Port of Long Beach (USA),
Revenue in US Dollar
North America 346,244,082 Real estate -
lease (70)
335,869,457 10,374,625 346,244,082
16 The Port Authority of New
York and New Jersey (USA), ,
Revenue in US Dollar
North America 4,184,039,000 Real estate -
lease (70)
2,794,634,000 934,459,000 315,250,935 4,044,343,935
17 Port of Seattle (USA), ,
Revenue in US Dollar
North America 544,502,000 Terminal
operation (63)
99,628,000 414,011,000 513,639,000
18 Port of Oakland (USA), ,
Revenue in US Dollar
North America 318,384,000 Terminal
operation (63)
136,480,000 130,254,000 40,053,000 306,787,000
19 Port of Houston Authority
(USA), , Revenue in US
Dollar
North America 233,673,000 Terminal
operation (63)
233,673,000 233,673,000
20 Virgina Port Authority (USA), ,
Revenue in US Dollar
North America 352,334,153 Terminal
operation (63)
339,460,135 4,903,439 344,363,574
21 Port Metro Vancouver
(Canada), Revenue in
Canadian Dollar
North America 210,900,379 Real estate (70) 101,578,534 74,029,634 12,085,539 187,693,707
Segment 2 Segment 3 Total Revenue
IND 1
Segment 1 No Port Continent Total Revenue (year
2013)
Classification
IND 1
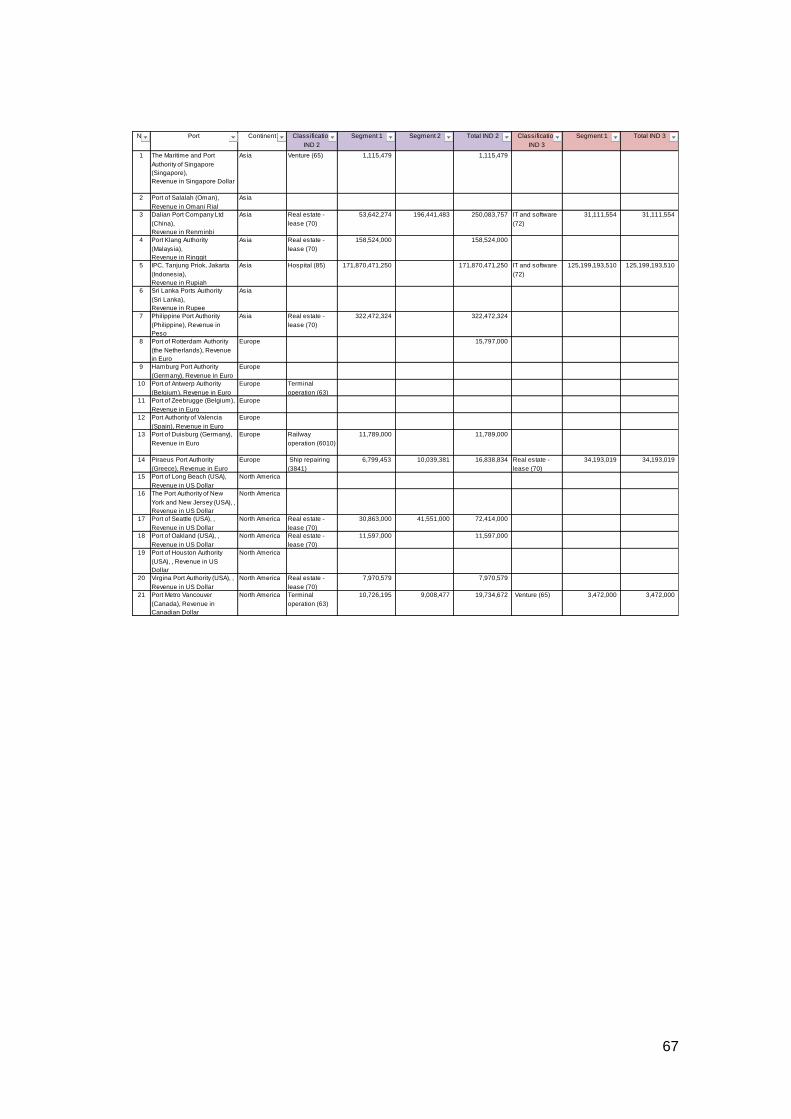
67
1 The Maritime and Port
Authority of Singapore
(Singapore),
Revenue in Singapore Dollar
Asia Venture (65) 1,115,479 1,115,479
2 Port of Salalah (Oman),
Revenue in Omani Rial
Asia
3 Dalian Port Company Ltd
(China),
Revenue in Renminbi
Asia Real estate -
lease (70)
53,642,274 196,441,483 250,083,757 IT and software
(72)
31,111,554 31,111,554
4 Port Klang Authority
(Malaysia),
Revenue in Ringgit
Asia Real estate -
lease (70)
158,524,000 158,524,000
5 IPC, Tanjung Priok, Jakarta
(Indonesia),
Revenue in Rupiah
Asia Hospital (85) 171,870,471,250 171,870,471,250 IT and software
(72)
125,199,193,510 125,199,193,510
6 Sri Lanka Ports Authority
(Sri Lanka),
Revenue in Rupee
Asia
7 Philippine Port Authority
(Philippine), Revenue in
Peso
Asia Real estate -
lease (70)
322,472,324 322,472,324
8 Port of Rotterdam Authority
(the Netherlands), Revenue
in Euro
Europe 15,797,000
9 Hamburg Port Authority
(Germany), Revenue in Euro
Europe
10 Port of Antwerp Authority
(Belgium), Revenue in Euro
Europe Terminal
operation (63)
11 Port of Zeebrugge (Belgium),
Revenue in Euro
Europe
12 Port Authority of Valencia
(Spain), Revenue in Euro
Europe
13 Port of Duisburg (Germany),
Revenue in Euro
Europe Railway
operation (6010)
11,789,000 11,789,000
14 Piraeus Port Authority
(Greece), Revenue in Euro
Europe Ship repairing
(3841)
6,799,453 10,039,381 16,838,834 Real estate -
lease (70)
34,193,019 34,193,019
15 Port of Long Beach (USA),
Revenue in US Dollar
North America
16 The Port Authority of New
York and New Jersey (USA), ,
Revenue in US Dollar
North America
17 Port of Seattle (USA), ,
Revenue in US Dollar
North America Real estate -
lease (70)
30,863,000 41,551,000 72,414,000
18 Port of Oakland (USA), ,
Revenue in US Dollar
North America Real estate -
lease (70)
11,597,000 11,597,000
19 Port of Houston Authority
(USA), , Revenue in US
Dollar
North America
20 Virgina Port Authority (USA), ,
Revenue in US Dollar
North America Real estate -
lease (70)
7,970,579 7,970,579
21 Port Metro Vancouver
(Canada), Revenue in
Canadian Dollar
North America Terminal
operation (63)
10,726,195 9,008,477 19,734,672 Venture (65) 3,472,000 3,472,000
Total IND 2 Classification
IND 3
Segment 1 Total IND 3 Classification
IND 2
Segment 1 Segment 2 No Port Continent
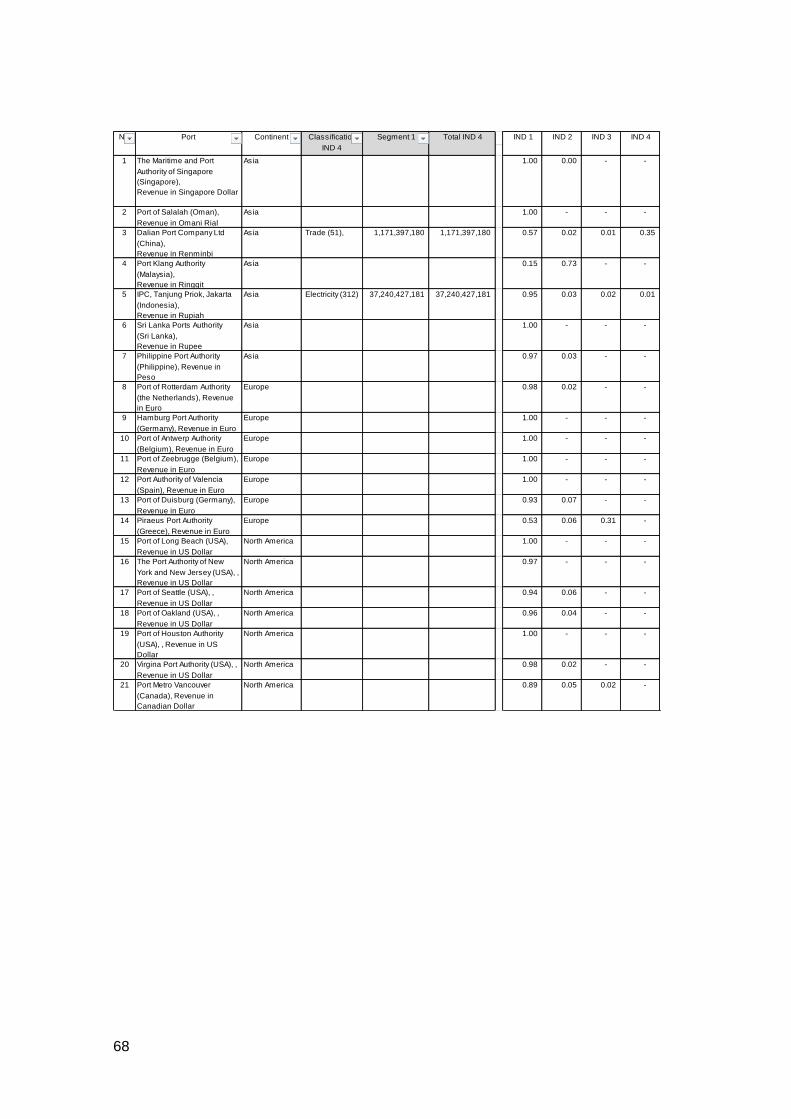
68
1 The Maritime and Port
Authority of Singapore
(Singapore),
Revenue in Singapore Dollar
Asia 1.00 0.00 - -
2 Port of Salalah (Oman),
Revenue in Omani Rial
Asia 1.00 - - -
3 Dalian Port Company Ltd
(China),
Revenue in Renminbi
Asia Trade (51), 1,171,397,180 1,171,397,180 0.57 0.02 0.01 0.35
4 Port Klang Authority
(Malaysia),
Revenue in Ringgit
Asia 0.15 0.73 - -
5 IPC, Tanjung Priok, Jakarta
(Indonesia),
Revenue in Rupiah
Asia Electricity (312) 37,240,427,181 37,240,427,181 0.95 0.03 0.02 0.01
6 Sri Lanka Ports Authority
(Sri Lanka),
Revenue in Rupee
Asia 1.00 - - -
7 Philippine Port Authority
(Philippine), Revenue in
Peso
Asia 0.97 0.03 - -
8 Port of Rotterdam Authority
(the Netherlands), Revenue
in Euro
Europe 0.98 0.02 - -
9 Hamburg Port Authority
(Germany), Revenue in Euro
Europe 1.00 - - -
10 Port of Antwerp Authority
(Belgium), Revenue in Euro
Europe 1.00 - - -
11 Port of Zeebrugge (Belgium),
Revenue in Euro
Europe 1.00 - - -
12 Port Authority of Valencia
(Spain), Revenue in Euro
Europe 1.00 - - -
13 Port of Duisburg (Germany),
Revenue in Euro
Europe 0.93 0.07 - -
14 Piraeus Port Authority
(Greece), Revenue in Euro
Europe 0.53 0.06 0.31 -
15 Port of Long Beach (USA),
Revenue in US Dollar
North America 1.00 - - -
16 The Port Authority of New
York and New Jersey (USA), ,
Revenue in US Dollar
North America 0.97 - - -
17 Port of Seattle (USA), ,
Revenue in US Dollar
North America 0.94 0.06 - -
18 Port of Oakland (USA), ,
Revenue in US Dollar
North America 0.96 0.04 - -
19 Port of Houston Authority
(USA), , Revenue in US
Dollar
North America 1.00 - - -
20 Virgina Port Authority (USA), ,
Revenue in US Dollar
North America 0.98 0.02 - -
21 Port Metro Vancouver
(Canada), Revenue in
Canadian Dollar
North America 0.89 0.05 0.02 -
Classification
IND 4
Segment 1 No Port Continent Total IND 4 IND 1 IND 2 IND 3 IND 4

69
Source: Author via various sources
IND3 IND4 DR3 DR4
P-S1 P-S2 P-S3 P-S1 P-S2 P-S1 P-S1 S1 S2 S3 S1 S2 S1 S1
1 The Maritime and Port
Authority of Singapore
(Singapore),
Revenue in Singapore Dollar
Asia 0.95 0.03 0.02 1.00 - - - 0.05 0.11 0.07 - - - - 0.23 0.00 0.02 - - 0.03
2 Port of Salalah (Oman),
Revenue in Omani Rial
Asia 0.83 0.17 - - - - - 0.16 0.30 - - - - - 0.46 - - - - -
3 Dalian Port Company Ltd
(China),
Revenue in Renminbi
Asia 0.81 0.05 0.13 0.21 0.79 1.00 1.00 0.17 0.16 0.27 0.33 0.19 - - 1.11 0.32 0.07 0.04 0.37 0.80
4 Port Klang Authority
(Malaysia),
Revenue in Ringgit
Asia 0.84 0.16 - 1.00 - - - 0.15 0.30 - - - - - 0.45 0.28 0.23 - - 0.51
5 IPC, Tanjung Priok, Jakarta
(Indonesia),
Revenue in Rupiah
Asia 0.22 0.14 0.64 1.00 - 1.00 1.00 0.33 0.28 0.29 - - - - 0.90 0.05 0.10 0.08 0.03 0.26
6 Sri Lanka Ports Authority
(Sri Lanka),
Revenue in Rupee
Asia 0.89 0.11 - - - - - 0.11 0.25 - - - - - 0.36 - - - - -
7 Philippine Port Authority
(Philippine), Revenue in
Peso
Asia 0.35 0.60 0.05 1.00 - - - 0.37 0.31 0.15 - - - - 0.82 0.03 0.10 - - 0.13
8 Port of Rotterdam Authority
(the Netherlands), Revenue
in Euro
Europe 1.00 - - 1.00 - - - 0.02 0.09 - - - - - 0.12 - - - - -
9 Hamburg Port Authority
(Germany), Revenue in Euro
Europe 1.00 - - - - - - - - - - - - - - - - - - -
10 Port of Antwerp Authority
(Belgium), Revenue in Euro
Europe 1.00 - - - - - - - - - - - - - - - - - - -
11 Port of Zeebrugge (Belgium),
Revenue in Euro
Europe 1.00 - - - - - - - - - - - - - - - - - - -
12 Port Authority of Valencia
(Spain), Revenue in Euro
Europe 1.00 - - - - - - - - - - - - - - - - - - -
13 Port of Duisburg (Germany),
Revenue in Euro
Europe 0.28 0.41 0.31 1.00 - - - 0.36 0.37 0.36 - - - - 1.09 0.07 0.19 - - 0.26
14 Piraeus Port Authority
(Greece), Revenue in Euro
Europe 0.44 0.48 0.07 0.40 0.60 1.00 - 0.36 0.35 0.19 0.37 0.31 - - 1.58 0.34 0.17 0.36 - 0.87
15 Port of Long Beach (USA),
Revenue in US Dollar
North America 0.97 0.03 - - - - - 0.03 0.11 - - - - - 0.13 - - - - -
16 The Port Authority of New
York and New Jersey (USA), ,
Revenue in US Dollar
North America 0.69 0.23 0.08 - - - - 0.26 0.34 0.20 - - - - 0.79 0.03 - - - 0.03
17 Port of Seattle (USA), ,
Revenue in US Dollar
North America 0.19 0.81 - 0.43 0.57 - - 0.32 0.17 - 0.36 0.32 - - 1.17 0.06 0.16 - - 0.22
18 Port of Oakland (USA), ,
Revenue in US Dollar
North America 0.44 0.42 0.13 1.00 - - - 0.36 0.36 0.27 - - - - 0.99 0.04 0.12 - - 0.16
19 Port of Houston Authority
(USA), , Revenue in US
Dollar
North America 1.00 - - - - - - - - - - - - - - - - - - -
20 Virgina Port Authority (USA), ,
Revenue in US Dollar
North America 0.99 0.01 - 1.00 - - - 0.01 0.06 - - - - - 0.07 0.02 0.09 - - 0.11
21 Port Metro Vancouver
(Canada), Revenue in
Canadian Dollar
North America 0.54 0.39 0.06 0.54 0.46 1.00 - 0.33 0.37 0.18 0.33 0.36 - - 1.57 0.10 0.15 0.07 - 0.32
DU4 DU
Tot
DR1 DR2 DR
Tot
DU1 DU2 DU3 IND1 IND2No Port Continent

70
III. Interview Information The type of questions were asked to the responents include the motivation or the objective of the establishment of subsidiaries/divisions as well as unrelated segments, problems and expectation of such business in the future, and other related issues. The level of managerial position of the respondents and type of interaction vary for each port due to limitation in language and time. The following table is some information about the interview. Table 16: Some Information about the Port Representatives
Port Port Representative
Type of Interaction Profile
Dalian Port Xinyao Liu Questionnaire with open questions
Senior staff
Indonesia Port Corporation (IPC)
David Wignall via Skype Vice President
Port of Rotterdam (PoR)
Carlos Zepeda Face to face, via email
Project leader