unpacking the drivers of corporate social performance: a
TRANSCRIPT
Unpacking 1
Unpacking the Drivers of Corporate Social Performance:
A Multilevel, Multistakeholder, and Multimethod Analysis
Abstract
The question of what drives corporate social performance (CSP) has become a vital concern
for many managers and researchers of large corporations. This study addresses this question
by adopting a multilevel, multistakeholder, and multimethod approach to theorize and
estimate the relative influence of macro (national business system and country), meso
(industry), and micro (firm-level) factors on CSP. Applying three different methods of
variance decomposition analysis to an international sample of 2,060 large public companies
over a time span of 5 years, our results show that firm-level factors explain the largest
proportion of variance in aggregate CSP as well as CSP oriented toward communities, the
natural environment, and employees. These results support our hypotheses according to
which CSP is not primarily driven by macrolevel or mesolevel factors, except for shareholder-
oriented CSP, which is relatively more influenced by country-level factors. As a whole, our
findings also point to the value of subdividing CSP into its stakeholder-specific components
as this disaggregation allows for a more careful examination of distinct drivers of distinct
aspects of CSP.
Keywords: Corporate social performance; corporate social responsibility; decomposition of
variance; hierarchical linear modeling; stakeholders; variance components analysis.
Abbreviations: ANOVA = analysis of variance; CSP = corporate social performance; HLM
= hierarchical linear modeling; MLE = maximum likelihood estimation; NBS = national
business system; REMLE = restricted maximum likelihood estimation; VCA = variance
components analysis.
Unpacking 2
Unpacking the Drivers of Corporate Social Performance:
A Multilevel, Multistakeholder, and Multimethod Analysis
As researchers have established the managerial relevance of corporate social
responsibility (e.g., Aguinis & Glavas, 2012; Porter & Kramer, 2011), the study of the factors
that drive corporate social performance has become a key concern in business ethics (Brower
& Mahajan, 2013; Crilly, 2011; Ioannou & Serafeim, 2012).1 Corporate social performance
(CSP) can be defined as the measurement of organizational outcomes in the environmental,
social, and governance (ESG) domains with respect to multiple stakeholders, such as
employees, local communities, or shareholders (Chen & Delmas, 2011; Clarkson, 1995;
Orlitzky, Schmidt, & Rynes, 2003). Scholars have theorized multiple drivers of CSP at
industry, country, and national business system levels (Aguilera, Rupp, Williams, &
Ganapathi, 2007; Campbell, 2007; Matten & Moon, 2008), and prior empirical research
attempted to clarify whether and how these macro-level drivers may interact with specific
firm-level drivers of CSP (Brower & Mahajan, 2013; Crilly, 2011; Udayasankar, 2008).
Missing from this research stream are two important considerations. First, although prior
research has established that CSP drivers operate at the firm, industry, country, or national
business systems (NBS) levels of analysis, surprisingly little is known about the relative
influence of these factors (Aguilera et al., 2007) as well as the influence of time as a potential
driver of CSP. These omissions are detrimental to knowledge about how CSP can become
more strategic and, thus, more conducive to higher corporate financial performance (Orlitzky,
Siegel, & Waldman, 2011; Porter & Kramer, 2006) as well as other important organizational
outcomes across multiple levels and over time (Aguinis & Glavas, 2012). At the same time,
these knowledge gaps limit managers’ understanding of CSP priorities (Smith, 2003),
especially in corporations that operate across multiple industries, countries, or national
1 Strictly speaking, corporate social responsibility differs from corporate social performance (CSP). However,
following previous arguments by Barnett (2007) and Baird and his colleagues (2012), we prefer CSP for
expositional purposes in this empirical study.

Unpacking 3
business systems.
Second, despite the centrality of a stakeholder perspective in the theoretical analysis of
CSP (Carroll, 1991; Clarkson, 1995; Freeman, Harrison, & Wicks, 2007), prior empirical
examinations of CSP drivers rarely made distinctions between the different stakeholder
groups. Rather, empirical investigations focused on CSP breadth (Brower & Mahajan, 2013),
examined only aggregate proxies of CSP (e.g., Surroca, Tribo, & Waddock, 2010), or did not
separately study the different stakeholder foci in CSP (e.g., Ioannou & Serafeim, 2012). As a
result, our current knowledge of the relative influence of the factors that drive CSP across
different stakeholder dimensions remains rather limited.
This study starts addressing these two important limitations. In regard to the first
limitation, our analysis can be considered exploratory as there is at present no theory that
would explain or specify the extent to which the different drivers affect CSP (let alone its
stakeholder dimensions). This means that, like seminal studies taking a similar analytic
approach in strategic management—with a different outcome variable (e.g., Rumelt, 1991),
our study focuses on the magnitude of effect sizes.2 In general, such a descriptive focus on
the magnitude of effect sizes has been recommended as methodological best practice (e.g.,
Cumming, 2012; Hunter, 1997; Kline, 2004; Orlitzky, 2012; Schmidt, 1992). However, most
researchers currently eschew such an emphasis on effect size magnitude in favor of the binary
outcomes of null-hypothesis significance tests (Schmidt, 1996; Ziliak & McCloskey, 2008).
In regard to the second limitation, we rely in this study on disaggregated, stakeholder-
focused measures of CSP not only to be consistent with prior theorizing (e.g., Clarkson, 1995;
Hillman & Keim, 2001), but also to make the findings more operationally meaningful for
managerial practice, as prior studies have shown that managers and employees perceive CSP
mainly through a stakeholder lens (El-Akremi, Gond, Swaen, De Roeck, & Igalens, in press;
2 The outcome variable of choice is profitability in strategic management where largely descriptive studies such
as ours have, for 20 years, been aimed at explaining variance in firm profitability.

Unpacking 4
Lucea, 2010; Turker, 2009). More specifically, the present study presents analyses for these
six stakeholder groups separately: customers, local communities, shareholders, suppliers, the
natural environment, and employees.
In shedding light on the relative importance of CSP drivers across multiple levels of
analysis and for multiple stakeholder groups through the application of various methods, this
study contributes to the literature in three major ways. First, this study advances stakeholder
theory by showing that the relative influence of CSP determinants varies according to the
stakeholder group considered. Our findings show that the firm level accounts for a lot of
variability in CSP focused on local communities, the natural environment, and employees,
whereas macro-level drivers seem more important for shareholder-focused CSP. Second, we
address recurrent calls for multilevel analyses (e.g., Aguilera et al., 2007; Aguinis & Glavas,
2012) in comparing and contrasting the relative importance of three levels of possible sources
of organizations’ variance in CSP: (a) national business systems (country); (b) industry; (c)
firm. We also add to this perspective by considering time (year) as a fourth level, a dimension
that has often been neglected in prior CSP analyses (Griffin & Mahon, 1997). Overall, our
findings point to the primacy of firm-level CSP drivers, but also demonstrate the importance
of higher levels of analysis by showing that national and supranational factors may, to some
extent, affect specific stakeholder components of CSP. Finally, we compare and contrast the
findings of three analytic techniques (analysis of variance, variance components analysis, and
hierarchical linear modeling). As far as we know, this is the first multilevel analysis of CSP
to compare the effect sizes calculated by each of these techniques across levels of analysis.
So, similar to Hough’s (2006) study design for return on assets, this study adopts a
multimethod perspective.
In the following section, we describe the theoretical background of this study and present
three hypotheses regarding the importance of levels of analysis for CSP. To develop these
Unpacking 5
hypotheses, we draw on insights from economics, management, and comparative sociology as
well as the empirical and theoretical CSP literature. We then test our hypotheses using the
SiRi dataset, which allows for the disaggregation of CSP by stakeholder domain. The third
section introduces our methods as well as our sample, measures, and sources of data. The
fourth section of the paper presents our analyses and results. Finally, we discuss the
implications of our findings for theory and practice as well as the limitations of the study and
potential future research directions.
A Multilevel Perspective on Corporate Social Performance
Macrolevel: Country and National Business Systems Factors
Variations in organizational adoption and implementation of CSP can be explained by a
wide range of factors operating at different levels of analysis. First, social macrostructures
have often been emphasized as key determinants of CSP (e.g., Aguilera et al., 2007; Matten &
Moon, 2008). These macrolevel institutions, or national business systems (NBS), capture
institutional nation-state differences in firms’ macroenvironments (Morgan, 2007), which in
turn have been found to affect firm decisions, for example in the automobile industry (Biggart
& Guillén, 1999). Applied to CSP, distinct national policy frameworks that encourage social
and/or environmental initiatives may affect organizations' decisions (Spence, 2007; Tantalo &
Willi, 2012). Accordingly, the country level and the NBS level have both been theorized as
likely to explain part of the CSP variation across firms.
Mesolevel: Industry Factors
Industry forces have also been proposed as constraints on, or enablers of, CSP (Baird et
al., 2012; Hull & Rothenberg, 2008; Orlitzky & Shen, 2013). For example, in industries that
experience economic downturns, discretionary CSP expenditures may be one of the first
corporate spending cuts (Campbell, 2007). Conversely, in highly unionized industry
environments, labor unions may put a lot of pressure on companies to increase the level of

Unpacking 6
CSP exhibited toward workers and insist on the enforcement of “fair trade” standards, which
may create trade barriers in a quest to protect blue-collar workers’ jobs from possibly less
expensive imports (Ederington & Minier, 2003; McWilliams, Van Fleet, & Cory, 2002).
Hence, mesolevel industry factors are also expected to influence CSP variance across firms.
Microlevel: Firm-level Factors
Several authors also theorized that CSP may primarily be determined by firm-level
actions and variables (e.g., McWilliams & Siegel, 2001; Udayasankar, 2008). Often,
organization-level factors constrain firms’ spending on CSP. For example, organizational
efforts to increase CSP may increase transaction and other costs (King, 2007), such as
organizational expenditures associated with identifying partners or stakeholders to be targeted
by CSP, negotiating with these partners or stakeholders, and monitoring and enforcing
compliance (e.g., monitoring of suppliers’ compliance with sustainability programs or
workplace safety). So, because of the inherent costliness of genuine CSP (Friedman, 1970;
Orlitzky, 2013; Windsor, 2001), an important precondition for high CSP is the availability of
slack resources (McGuire, Sundgren, & Schneeweis, 1988; Orlitzky et al., 2003; Waddock &
Graves, 1997). In addition, CSP may be constrained by customers’ reluctance to pay a
premium for a firm’s socially responsible products (Bhattacharya & Sen, 2004; Frazier, 2007)
or investors’ unwillingness to punish irresponsible companies or reward responsible ones
(Rivoli, 2003).
The Relative Influence of Factors across Levels
Although prior theory clearly suggests that each of these three levels of analysis
(NBS/country, industry, and firm) matters, no empirical evidence has provided numerical
estimates of these factors’ relative weights and simultaneous impact. In addition, the time
dimension has often been neglected in prior studies of CSP (Griffin & Mahon, 1997). Rather
than constituting a time-invariant outcome of deterministic firm-, industry-, or country-level

Unpacking 7
influences, CSP may instead represent a highly time-contingent or transient decision process
(e.g., Wang & Choi, 2013). For example, recessions may severely limit the level of funding
available for discretionary social and environmental initiatives as well as determine the
strategic benefits of CSP (Campbell, 2007; Lee, Singal, & Kang, 2013; McWilliams & Siegel,
2001). Coding for year captures this time dimension in the same way as coding for firms
captures all the different firm-level variables that may affect CSP across all years of our time
period (Rumelt, 1991, p. 173). Hence, our overarching research question is aimed at
addressing these multilevel issues. Our overall analytic approach, which is summarized in
Figure 1, can be stated as follows:
Research Question: To what extent do (1) country-level, (2) industry-level, (3) corporate-
level factors, and (4) time account for the variability of different types of corporate social
performance?
(Insert Figure 1 about here.)
Hence, the focus of the present study is on the relative empirical importance of factors at
different levels of analysis—a question that cannot be answered from the conventionally
sizeless and binary hypothesis-testing perspective in the social sciences (Kline, 2004;
Orlitzky, 2012; Schmidt, 1996; Ziliak & McCloskey, 2008). The research question implies
that our perspective is not only descriptive, but also exploratory because so far no theory has
emerged that would specify the magnitude of effect sizes with respect to the different sources
of variability in CSP. Nonetheless, with theoretical guidance from the extant literature, our
study also goes beyond this descriptive perspective by testing three more specific hypotheses
as well as a methodological proposition.
Hypothesis Development
Macrolevel forces undoubtedly influence CSP (Aguilera et al., 2007; Ioannou &
Serafeim, 2012) by shaping the regulations and legal standards that exist in each domain of

Unpacking 8
CSP and hence homogenizing the playing field within which firms compete through CSP.
However, these macroforces are not necessarily homogeneous across CSP stakeholder
domains because the institutional norms regulating what is regarded as appropriate behavior
vis-à-vis each stakeholder group vary nationally and globally (Hall & Soskice, 2001; Jackson
& Deeg, 2008). We argue here that the effects from these higher levels of analysis will pale
in comparison to the interfirm variance in CSP that can be attributed to the firm level, except
in the domain of corporate governance where national legal factors tend to have a prominent
influence (Jensen & Meckling, 1976; La Porta, Lopez-de-Silanes, Shleifer, & Vishny, 2000).
Accordingly, we propose that the firm level is the main determinant of almost all stakeholder
dimensions of CSP, except for shareholders (i.e., corporate governance practices). We now
theorize further the reasons behind these differences.
The Predominance of Firm-Level Factors
Several arguments suggest that firm-level factors may explain a greater proportion of
interfirm variance in CSP relative to other levels. First, CSP is increasingly used strategically
(McWilliams, Siegel, & Wright, 2006; Orlitzky et al., 2011) to differentiate the firm from its
competitors. In such a strategic approach, firm-specific cost-benefit analyses can be assumed
to take center stage (A. Mackey, Mackey, & Barney, 2007; McWilliams & Siegel, 2001).
Let’s first consider the cost side. Implementing CSP is costly because, from an economic
perspective, high CSP reflects a firm voluntarily internalizing its externalities (Lyon &
Maxwell, 2008). Externalities, defined as the results of market transactions that are not
themselves embodied in such transactions (Coase, 1960; Crouch, 2006), are typically not fully
reflected in prices and so lead to a divergence of private and social costs (Dahlman, 1979;
Pigou, 1962). In other words, CSP refers to nonmarket actions by which firms take
“ownership of the externalities they generate” (Crouch, 2006, p. 1534). In addition to the
direct costs associated with CSP (see also Orlitzky, 2013), companies that are committed to

Unpacking 9
CSP also incur transaction costs (Macher & Richman, 2008), which apply not only to
social/environmental partnerships, but also to the adoption of any CSP initiative more broadly
(King, 2007). These additional costs incurred by organizations high in CSP explain why there
is often no short-term strategic incentive for individual companies to increase CSP (Campbell,
2006), especially if intense market competition prevents such an organizational focus on
social and environmental concerns (Doane, 2005; Reich, 2008; Shleifer, 2004; Vogel, 2005).
At the same time, economic rents are often appropriable3 from CSP because, in the long
run, transaction costs and uncertainty can sometimes be reduced by increasing CSP (Hosmer,
1995; Jones, 1995). When rents are appropriable by particular organizations with particular
attributes, firm-level factors are expected to account for most CSP variability. This study is
based on the assumption that profit-seeking economic actors will only make costly decisions
if economic rents are anticipated as a result of those expenditures (Alvarez & Barney, 2004;
Coase, 1937; A. Mackey et al., 2007; Schoemaker, 1990).
Second, arguably even more important in explaining variance of CSP at the firm level is
the fact that, in order to be effective, CSP must be embedded in particular organizational
cultures (Swanson, 2014). In creating the proper firm-specific conditions for meaningful,
value-attuned CSP, the business executive’s mindset becomes highly important: a mindset of
value discovery transcends legal, economic, or social pressures and is able to “engage
employees in the quest for social responsibility” (Swanson, 2014, p. 123). In turn, an
organization’s culture and climate, emphasizing either compliance or values (Collier &
Esteban, 2007; Duarte, 2010), exerts a powerful influence over commitment and engagement
of the entire workforce (Slack, Corlett, & Morris, in press). Other research suggests
organizational culture is causally ambiguous, socially complex (Dierickx & Cool, 1989), path-
dependent (Barney, 1991), and often difficult for rivals to imitate, particularly if it forms part
3 The key point here is that managers anticipate appropriate economic rents from increasing CSP—not that these
economic rents are necessarily forthcoming. Hence, we refer to appropriable rents in this context.

Unpacking 10
of an organization's unique identity orientation in defining its relationships with stakeholders
(Brickson, 2007). Therefore, only if social and environmental initiatives converge around a
set of highly standardized, institutionalized, and therefore relatively homogeneous practices
(Orlitzky, 2013) can we expect higher-level institutional drivers to outweigh the influence of
idiosyncratic firm-level influences of CSP. Based on this theoretical reasoning, our overall
expectation is that, for most aspects of CSP, firm-level factors account for most CSP
variability because they either constitute firm-level economic constraints, predetermine the
strategic/economic opportunities that can be anticipated from CSP, or are deeply, holistically,
and intangibly embedded in each individual firm’s unique DNA.
H1: Most of the interfirm variability in CSP overall as well as its disaggregated
stakeholder-oriented components is attributable to the micro (firm) level.
The Prevalence of Macrolevel Factors for Shareholder-Oriented CSP
Nonetheless, for the specific case of shareholder-oriented CSP, we expect variations in
CSP to be explained more by macrolevel factors than firm-level factors. Three lines of
argument back this hypothesis. First, in essence, good corporate governance involves
organizations satisfying shareholders’ informational, ownership, and other interests that have
not been sanctioned by regulations or the law yet (Macey, 2008). For example, business
executives and directors may decide to forgo pay in favor of organizational reinvestment of
earnings, stock buybacks, or large dividend payments to shareholders. Often, prioritizing
shareholders over other stakeholders (i.e., a strong focus on shareholder-oriented CSP, or
corporate governance reforms) is triggered not so much by firm-specific events, but by
higher-level motivations of stock market revitalization or the withdrawal of the state from
economic activity (i.e., by a countrywide move away from corporatism) (R. E. Meyer &
Höllerer, 2010). This is unsurprising as an enhanced focus on shareholders—or firm
owners—is not necessarily in the best interest of entrenched managers, who make the

Unpacking 11
operational decisions about shareholder-oriented CSP. In contrast, improvements of many
other aspects of CSP often have a direct influence on the attitudes and perceptions of
customers or employees (Bhattacharya, Korschun, & Sen, 2009; El-Akremi et al., in press),
which can be expected to enhance corporate reputations and thus performance (Fombrun,
2005). That is, when executives of large corporations can be assumed to be firmly
entrenched, only macrolevel forces can be expected to affect differences in shareholder-
oriented CSP. National governments and NBS may not only regulate or constrain, but also
enable corporate actions that prioritize the firm owners’ property rights (see also Campbell &
Lindberg, 1990; Davis, 2005).
Second, financial theory strongly suggests that differences across countries largely
account for differences in corporate actions in relation to shareholder management (Jensen &
Meckling, 1976; La Porta et al., 2000). This literature stresses the importance for shareholder
management of macrolevel factors, such as laws protecting shareholders from expropriation,
as well as the effectiveness of the enforcement of these laws across countries (for an
overview, see La Porta et al., 2000). For instance, Doidge, Karolyi, and Stulz (2007)
found that country characteristics accounted for much more variance in firm-level governance
ratings (ranging from 39% to 73%) than observable firm characteristics (ranging from 4% to
22%). If this logic of macrolevel dominance extends not only to core governance practices,
but also more broadly to firms’ management of their relationships with shareholders in the
extrafinancial domain, we should expect macrolevel factors, and in particular country-level
factors, to explain relatively more variation in shareholder-related CSP than in other CSP
dimensions.
Third and finally, this expectation is also in line with managers’ instrumental
considerations. Although effective governance may ultimately lead to more satisfied
shareholders, it is costly. For example, the organizational experience with the Sarbanes-Oxley
Unpacking 12
Act (2002) has shown that (a) governmental regulations may become necessary because
opportunistic managers are exceedingly reluctant to implement voluntary governance reforms
that benefit shareholders and (b) the costs of good corporate governance can be very high
(Chhaochharia & Grinstein, 2007; Zhang, 2007). Other evidence indicates that these costs are
unlikely to be counterbalanced by improved organizational performance. More specifically,
meta-analytic evidence indicates that shareholder-oriented initiatives that are generally
considered good corporate governance are unlikely to increase stock prices or internal
efficiency (Dalton, Daily, Ellstrand, & Johnson, 1998). In this context we can assume that if
large net economic benefits existed for shareholder-oriented CSP (which is focused on
practices of good governance), market signals rather than government regulation would
already have led to more substantial governance reforms. However, the lack of financial
impact of many well-known attributes of “good” corporate governance (Dalton, Daily, Certo,
& Roengpitya, 2003; Dalton et al., 1998), combined with the anticipation of high managerial
costs associated with good governance (e.g., transfer of organizational funds and power from
managers to owners), leads to the expectation of macrolevel (i.e., NBS or country-level)
forces being the primary driver of this type of CSP.
H2: For shareholder initiatives, most of the variance in CSP is attributable to the macro
level (i.e., country and/or NBS factors).
A Multistakeholder Perspective: Accounting for the Stakeholder-Centric Logic of CSP
A key theoretical and empirical motivator of this study is a comparison of variance
decomposition models of CSP centered on a generic and broad responsibility toward society
(see, e.g., Höllerer, 2013) to other models that reflect a stakeholder-centric logic embedded in
theorizing by Freeman (e.g., Freeman, 1984; Freeman et al., 2007), Aguinis and Glavas
(2013), Barnett (2007), Jones (1995), Mitchell, Agle and Wood (1997), and many other

Unpacking 13
scholars. Clarkson (1995) may have captured our reasoning regarding CSP best when he
suggested:
Performance is what counts. Performance can be measured and evaluated. Whether a
corporation and its management are motivated by enlightened self-interest, common
sense, or high standards of ethical behavior cannot be determined by the empirical
methodologies available today. (Clarkson, 1995, p. 105)
Furthermore, evaluations of CSP may be based on proxies of stakeholder satisfaction because
direct, valid measures are very difficult and expensive to obtain (Orlitzky & Swanson, 2012).
Practically, such a focus on primary stakeholders is necessary because each firm faces its own
unique set of nonmarket challenges (Clarkson, 1995). Empirically, this focus is necessary
because overall ratings of CSP often do not seem to pass the most basic measurement hurdle
of forming a coherent or robust construct (Orlitzky, 2013), not even within the same
organization (Strike, Gao, & Bansal, 2006). Although the construct validity of aggregate
measures of CSP seems questionable (e.g., Chatterji & Levine, 2006; Entine, 2003; Porter &
Kramer, 2006), researchers have continued to use them (e.g., Ioannou & Serafeim, 2012;
Surroca et al., 2010). A more charitable interpretation of the lack of a coherent CSP aggregate
is the observation that there is no equivalent aggregate of corporate financial performance,
either. In fact, the evidence suggests that different dimensions of financial performance are in
tension with each other (M. W. Meyer & Gupta, 1994), which is one of the reasons why, for
example, return on assets, return on equity, market share, or Tobin's q are not aggregated to
capture a corporation’s financial performance in one overall number. Based on this reasoning
and previous empirical research (Mattingly & Berman, 2006), we expect large differences
between variance decompositions for the stakeholder dimensions and those for the aggregate
scores of CSP.
H3: The proportions of variance accounted for in decomposition models that examine

Unpacking 14
specific stakeholder dimensions of CSP are expected to differ significantly from those shown
in models of aggregate CSP.
A Multimethod Perspective: Three Different Approaches to Variance Decomposition
Three different analytic techniques of variance decomposition have vigorously been
debated in the field of strategic management (see, e.g., Brush & Bromiley, 1997; Crossland &
Hambrick, 2007; Hough, 2006; McGahan & Porter, 2005; Misangyi, Elms, Greckhamer, &
LePine, 2006; Ruefli & Wiggins, 2003): analysis of variance (ANOVA), variance components
analysis (VCA), and hierarchical linear modeling (HLM). To estimate the sources of the
interfirm variability in CSP, we will compare the results of all three methods, which are
depicted in Figure 1 as horizontal arrows crossing the different levels of analysis. Because the
analytic approaches of ANOVA, VCA, and HLM rely on very different statistical
assumptions and estimation techniques, we do not expect the findings, regarding estimates of
interfirm CSP variance explained, to converge across the three different methods. As this
assumption is based on not so much organization theory or a theory of business ethics but
statistical theory instead, we frame it as the following methodological proposition: Estimates
of the variability in CSP accounted for by the different levels and the different stakeholders
are significantly different across the three different methodological approaches of ANOVA,
VCA, and HLM.
Method
Sample
Our sample of 2,060 corporations (with an average firm size of 91,716 full-time
employees) was drawn from the database compiled by Sustainable Investment Research
International, or SiRi (now known as Sustainanalytics), which is one of the world’s largest
Unpacking 15
firms specializing in research on CSP.4 At the time of the study, the SiRi dataset was
compiled by a network of social rating agencies comprising ten independent research
institutions such as KLD, coordinated from the SiRi headquarters in the Netherlands and
Canada. SiRi aimed to assess the CSP of all the largest stock listed companies worldwide,
aggregating information from various sources, such as company documents and interviews,
media reports, trade unions, NGOs, and other contacts with stakeholders and managers.
Similar samples drawn from the SiRi database have also been used in research published in
other prestigious academic journals (e.g., Ioannou & Serafeim, 2012; Surroca et al., 2010).
Our study covered the 5-year period of 2003 to 2007. In other words, we obtained 10,300
year-observations in total from large public companies headquartered in 21 different
countries: Australia, Austria, Belgium, Canada, Denmark, Finland, France, Germany, Greece,
Ireland, Italy, Japan, Netherlands, Norway, Portugal, South Korea, Spain, Sweden,
Switzerland, United Kingdom, and USA. Appendix A presents descriptive statistics about the
number of firms and their size (in terms of full-time employees) within each country as well
as NBS cluster of countries. Our sample is highly representative of the population to which
we aim to generalize our findings—to the set of very large, public multinational companies
attracting media attention for their financial, social, and environmental performance.
Dependent Variables
We relied on the SiRi database to measure CSP, our dependent variable. SiRi assigns a
rating between 0 and 100, which represents the extent of each firm’s overall, aggregate CSP
with respect to customers, local communities, shareholders (i.e., extent of responsible
corporate governance), suppliers, the natural environment, and employees, respectively. For
the empirical comparisons necessitated by our research question, we also used the overall CSP
4 On its website, Sustainalytics defines itself as “an award-winning global responsible investment research firm
specialized in environmental, social and governance (ESG) research and analysis. The firm offers global
perspectives and solutions that are underpinned by local expertise, serving both values-based and mainstream
investors that integrate ESG information and assessments into their investment decisions” (source: Sustainalytics
website, consulted on the 28/01/2015).

Unpacking 16
score for each firm (see also Surroca et al., 2010 for more details and the suitability of this
dataset more generally). Table 1 presents the means and standard deviations for each
stakeholder dimension of CSP. SiRi offers a truly international cross-industry dataset
capturing companies' CSP with satisfactory measurement properties. Appendix B provides
the main measurement components for each of the six stakeholder dimensions.
Sources of Variation
National business systems (NBS). To code the NBS where our sample companies are
headquartered, we relied on the five institutional country clusters of NBS identified by
Amable (2003). Amable’s varieties of capitalism framework is grounded in institutional
economics and political science and supported by considerable empirical evidence (Jackson &
Deeg, 2008; Morgan, 2007; Tempel & Walgenbach, 2007). Amable’s (2003) extensive and
detailed statistical analysis of a large set of macroeconomic indicators supported the following
five clusters of NBS: Market-Based Capitalism, Coordinated Market Economies, Social-
Democratic Economies, Mixed Market Economies (i.e., Amable’s “Mediterranean Varieties
of Capitalism”), and Asian Collectivist Economies. This clustering of countries has been
shown to be robust for Organization for Economic Cooperation and Development (OECD)
countries (Amable, 2003, pp. 171-181). Amable’s varieties of capitalism were particularly
suitable for this study for three main reasons. First, all companies in our sample were
headquartered in OECD countries and could therefore be categorized according to Amable’s
framework without any need for additional assumptions about institutional classification.
Second, Amable’s model is the most applicable macroinstitutional typology of NBS because
it most closely corresponds to the timeframe of this study: Amable’s (2003) data analyses
ended in 2002, and our CSP dataset covers the years 2003 to 2007. Finally, Amable (2003,
pp. 181-213) established the predictive validity of his NBS framework by examining the
empirical impact of his NBS clusters on other theoretically related variables, such as partisan

Unpacking 17
politics and specialization of scientific, technological, and industrial activity (Amable, 2003,
pp. 181-209). After a thorough review of the NBS literature, we concluded that Amable’s
varieties of capitalism model represented a rigorous and empirically validated typology of
NBS clusters (see also Jackson & Deeg, 2008; Morgan, 2007).
Industry sectors. The ten broad sectors of the Global Industry Classification Standard
(GICS) were used in our coding of industry: energy, materials, industrials, consumer
discretionary, consumer staples, health care, financials, information technology,
telecommunication services, and utilities. Statistically significant chi-square statistics
summarizing the cross-tabulation of companies by industry and NBS suggested the
importance of including industry sectors in our analytic models.
Analytic Models
In general, our analytic model can be formally expressed as:
𝜂𝑖𝑗𝑘𝑡 = 𝜇 + 𝛼𝑖 + 𝛽𝑗 + 𝛾𝑘 + 𝛿𝑡 + 휀𝑖𝑗𝑘𝑡 ;
where ηijkt is CSP in NBS i, in industry j, in firm k, during year t. The dependent variable
ηijkt is a linear combination of the grand mean μ, a NBS effect (α), an industry effect (β), a
firm effect (γ), a year effect (δ), and an error term (εijkt). To estimate the sources of variance
in CSP, three different analytic techniques were used: analysis of variance (ANOVA),
variance components analysis (VCA), and hierarchical linear modeling (HLM). Each of these
data analysis tools comes with its own set of advantages and disadvantages, as briefly
discussed below.
ANOVA. The first analytic technique used in our study was simultaneous ANOVA,
which relies on an ordinary least squares (OLS) algorithm. Several strategy researchers
consider this technique to be superior to sequential ANOVA in the context of components-of-
variance analysis (e.g., Crossland & Hambrick, 2007; McGahan & Porter, 2002). Our OLS
Unpacking 18
calculation of variance components in the unbalanced5 dataset (see also Searle, Casella, &
McCulloch, 1992) followed Marchenko's (2006) specific methodological advice for Stata™
software analyses. In our analyses, firms were conceptualized as nested within NBS. Effects
were entered in the following sequence: year, industry, NBS, and firm.
VCA. This technique addresses the major weakness of ANOVA; in ANOVA the results
are affected by entry order of categories (Bowman & Helfat, 2001; Brush, Bromiley, &
Hendrickx, 1999)—a weakness that even applies to simultaneous ANOVA (Crossland &
Hambrick, 2007, p. 780). The statistical assumptions behind random-effects VCA are
described in further detail in Searle et al. (1992) and Rabe-Hesketh and Skrondal (2012). In
all random-effects VCA, an important precondition for computability is that the underlying
probability distribution of the data is assumed to be normal. The two methods of VCA
estimation are maximum likelihood estimation (MLE) and restricted maximum likelihood
estimation (REMLE). The difference is that MLE provides estimates of fixed effects, whereas
REMLE does not. In other words, REMLE overcomes the weakness of ML estimation of
disregarding the degrees of freedom used for estimating fixed effects, that is, of neither being
minimum variance nor unbiased (in contrast to ANOVA estimates). For unbalanced data (like
ours), statistical experts consider both MLE and REMLE VCA to be superior to the ANOVA
method (Searle et al., 1992, p. 254). However, because of the tendency of VCA to produce
unstable results (Brush & Bromiley, 1997), many strategy researchers still prefer ANOVA to
VCA (Misangyi et al., 2006, p. 573). In line with our methodological proposition, we decided
to report both.
HLM. Most recently, strategy researchers argued that hierarchical linear modeling
(HLM), also known as multilevel modeling, was the best method for examining multilevel
effects (Hough, 2006; Misangyi et al., 2006). Specifically, HLM is generally considered
5 The dataset was unbalanced because the number of firms in each NBS varied (see Appendix A).
Unpacking 19
superior to VCA and ANOVA because HLM (a) permits complex error structures and can
thus model dependence between levels of analysis, (b) has greater statistical power than the
other two methods, and (c) addresses the problem of collinearity between corporations and
industries (Hough, 2006).6 In other words, HLM specifies within-unit factors most accurately
in longitudinal datasets (Rabe-Hesketh & Skrondal, 2012). HLM, however, is not the only
method we reported because, first, ANOVA and VCA have a much longer methodological
tradition than HLM in the business literature and, second and most important, our
methodological proposition aims to compare the results of our multimethod calculations. This
helps us determine whether the findings across the three different techniques are
commensurate. In sum, we believe that a descriptive study like ours, focused on estimating
the proportion of CSP variance accounted for by the various levels of influence, can benefit
from this methodological pluralism.
To test our hypotheses, we adapted Crossland and Hambrick’s (2007) conservative
significance testing procedure (see also Bobko, 2001). First, the partial R2s were converted
into partial r correlation coefficients (by taking the square root). Then, the rs were compared
via Steiger's (1980) Z, which is a simplified version of Dunn and Clark's (1969, 1971) test
proposed for overlapping samples (Kleinbaum, Kupper, & Muller, 1988). We concluded that
H1 or H2 was supported if the relevant difference between the hypothesized dominant (or
highest) and second-highest category in each variance decomposition model was statistically
significant at an alpha probability (p) level of .01 or lower. H3 and the methodological
proposition involved multiple comparisons between parts of our correlation matrices or entire
matrices and, thus, were assessed via overall χ2 tests of difference or fit. For the assessment
of H3 and the methodological proposition, we followed the statistical procedures described by
Steiger (1980).
6 For follow-up studies, HLM would also have the advantage of allowing for the inclusion of continuous—rather
than only dummy/categorical—variables (Misangyi et al., 2006).

Unpacking 20
Results
Table 1 reports means, standard deviations, and bivariate correlations for the year 2005
(unless stated otherwise), the midpoint of our study timeframe. We estimated the reliability of
the dependent variables by calculating the internal consistency (i.e., Cronbach's alpha) of the
SiRi measurement items used for each CSP stakeholder dimension. The items per dimension
ranged from 16 (for customer initiatives) to 37 items (for employee CSP). The calculated
alpha reliability estimates of .77, .81, .83, .85, .76, and .86 for customer, community,
shareholder, employee, supplier, and environmental CSP, respectively, were satisfactory. In
addition, the statistically significant positive correlations between the six stakeholder
dimensions can, at a minimum, be interpreted as generally satisfactory coefficients of
generalizability (Orlitzky & Benjamin, 2001; Traub, 1994). Consistent with other studies
(Chatterji, Levine, & Toffel, 2009; Sharfman, 1996), the significantly positive correlations in
the lower right-hand corner of Table 1 can be interpreted as indicative of the concurrent
validity of the CSP proxies.
(Insert Table 1 about here.)
In the reporting of results, we will first discuss the descriptive findings with respect to our
overarching research question, which focused on effect size magnitudes (i.e., proportion of
variance explained by multiple levels of influence). Then, we will summarize the results of
our hypothesis tests.
Analysis of Variance (ANOVA) and Variance Components Analysis (VCA)
Table 2, which presents the ANOVA and VCA results, indicates that the firm level
explained between 36% and 75% of the variance in our SiRi dataset. Particularly for overall
CSP, the firm level tended to explain a very large proportion of variance, if not the largest
variance, of all dependent variables considered in this study. In general, NBS and industry
membership explained a much smaller proportion of variance in the dependent variables—
Unpacking 21
with only one exception to this general rule: NBS were clearly the second-most important
determinant of CSP protecting shareholder interests (i.e., good corporate governance),
explaining between 21% and 27% of variance, depending on the specific statistical method
used. In contrast, for socially responsible supply-chain initiatives, year-to-year changes
appeared to be the second-most important antecedent, explaining between 22% and 30% of
variance of supplier-focused CSP. Other than that, annual changes (between 2003 and 2007)
accounted for only a negligible fraction of CSP variance.
(Insert Table 2 about here.)
To check the robustness of these conclusions about the predominant attribution of CSP
variation to between-firm differences, we repeated our calculations for each firm
headquarters’ country location (instead of NBS), leaving all other data points unchanged.
Table 3 shows that overall the firm level remained the predominant factor—with one
exception: when either MLE VCA or REMLE VCA was applied, country became the most
important antecedent of shareholder-focused CSP (i.e., scores reflecting good corporate
governance), explaining 41% to 43% of its variance. The comparison of Tables 2 and 3
indicates that country generally explained more variance than NBS. Country location of firm
headquarters also seems to have been quite important for employee-focused CSP, explaining
about 22% of its variance in the context of MLE or REMLE VCA. Industry membership and
temporal change were found to be relatively unimportant—with supplier-oriented CSP the
only exception again (for year-to-year changes).
(Insert Table 3 about here.)
Hierarchical Linear Modeling (HLM)
In our HLM specification, we explicitly modeled the interaction, or covariance, between
firms and industries. That is, this covariance across two different levels of analysis was not
assumed to be zero as in VCA. Many researchers regard REMLE as superior to MLE

Unpacking 22
because, for balanced data, REMLE produces solutions identical to ANOVA, which has
optimal minimum variance properties (Searle et al., 1992, p. 255). Therefore, Table 4 only
presents the REMLE results.7 Our REMLE HLM findings suggest that, again, most variance
in CSP (across the six stakeholder dimensions) is mostly attributable to between-firm
differences rather than NBS or industry variation. In general, the firm effects exceeded NBS
effects and industry effects by factors of 2:1 to 67:1, and 3:1 to 47:1, respectively. Even
larger than these differences in the six stakeholder dimensions were the differences between
firm-level effects and NBS effects, and between firm-level effects and industry effects, for
overall CSP. Substituting country for NBS effects reduced the proportion of CSP variance
explained by firm effects by 13% on average. Country effects, on the other hand, accounted
for 7% to 39% of variance in the dependent variables. In fact, the latter percentage exceeded
variance attributed to firm effects by 9 percentage points in the case of shareholder-focused
CSP (i.e., 39% vs. 30% for variance in good corporate governance as rated by SiRi). Country
effects, which also seemed to be quite important for employee-focused CSP (21%), were
consistently more important than industry effects. Country-level effects also were generally
more important than temporal effects (with the exception of supplier-oriented and customer-
focused CSP). In the HLM, firm effects generally exceeded country effects by factors of 2:1
to 7:1—with, as already noted before in the interpretation of the VCA results, shareholder-
focused CSP as the only exception.
(Insert Table 4 about here.)
Hypothesis Tests
Out of 56 possible tests of H1 (14 tests for ANOVA results plus 28 tests for VCA plus 14
tests for HLM), 53 came out statistically significant at probability level p < .01, consistently
supporting the hypothesis that most of the variance in CSP overall and its stakeholder-
7 The MLE HLM results were very similar to the findings obtained from the REMLE HLM.

Unpacking 23
oriented components is attributable to the firm level. That is, whenever the firm level
explained most variance, it explained significantly more variance than the second-highest
component, which differed from one stakeholder group to another (see Tables 2-4). Notable
exceptions were both VCAs shown in Table 3 and one of the HLMs shown in Table 4, where
the country level of influence, in line with our second hypothesis, accounted for the greatest
proportion in shareholder-oriented CSP (at p<.01).
Overall, H2, which predicted that, for shareholder initiatives, most of the variance in CSP
could be attributed to the country level (national business systems), did not receive the same
level of empirical support as H1. Out of eight possible tests (two tests for the ANOVA tables
plus four tests for VCA plus two tests for HLM), the country level explained (at p<.01) the
highest percentage of CSP variability in three models—the two country-level specifications of
VCA (see Table 3) and the country-level specification of HLM (see Table 4). H2 was not
supported, however, when a NBS specification of each variance decomposition model was
used. That is, in the other five specifications, the firm level remained the predominant factor
explaining specific stakeholder dimensions of CSP variance (see discussion of H1).
H3 proposed that the proportions of variance accounted for in decomposition models
based on a stakeholder logic differed significantly from those shown in models of aggregate
CSP. The critical χ2 value (α = .01) was 13.28 for the ANOVA and VCA comparisons, and
11.34 for the HLM comparisons. All calculated χ2 statistics used for the comparisons to test
H3 were statistically significant (p<.01) for all stakeholder groups, except for two: the model
comparison between environmental CSP and aggregate CSP in the MLE VCA (with country
as highest level) had a χ2 of only 12.33; and the model comparison between community-
oriented CSP and aggregate CSP in the HLM (with NBS as the highest level) had a χ2 of only
9.97. These findings imply that the disaggregation of CSP is important for all stakeholder
groups except for the natural environment and local communities (at least sometimes). In

Unpacking 24
other words, for most stakeholder groups, capturing CSP only at the aggregate level will not
allow for a proper decomposition of its variance.
Finally, the methodological comparisons of matrices implied by the final, methodological
proposition all came out statistically significant. The smallest χ2 was 179.78, for the
comparison between the country-based REMLE VCA and the corresponding country-based
HLM. However, the critical χ2 value for this comparison was 34.81 (α = .01; df = 18). All
other calculated χ2 for all other comparisons of matrices (after converting r into z scores)
exceeded their critical thresholds as well. This means that the method used for decomposing
variance of a focal variable does make a substantive difference; the methods of ANOVA
versus VCA versus HLM are not interchangeable. This finding is consistent with the
conclusions of the methods literature on variance decomposition in strategic management.
However, to the best of our knowledge, this methodological difference has never been
demonstrated empirically or presented in as much statistical detail as in this study.
Discussion
To the extent that the SiRi measures reflect CSP accurately, this study suggests that firm-
level drivers account for the greatest proportion of not only CSP overall, but also most of its
stakeholder-specific dimensions. Our findings indicate that firm-level factors are especially
important for CSP targeted at local communities, the natural environment, and employees,
whereas broader institutional influences (country-level effects or NBS) sometimes seem to be
more important for shareholder-oriented CSP. The three multilevel analyses show that, in
support of H1, the firm level accounts for the largest proportion of variance in CSP across five
of the six stakeholder dimensions. More specifically, in the ANOVA and VCA results, the
firm level consistently seems to have the largest impact on social and environmental
initiatives, explaining between 36% and 75% of variance of CSP stakeholder dimensions.
These firm effects seem to be particularly large for overall CSP and for CSP targeted at local

Unpacking 25
communities, the natural environment, and employees. The relatively large influence of firm-
level factors suggests that, given particular corporate attributes, firms are able to choose
particular CSP initiatives proactively and strategically. Instead of higher-level environmental
forces structuring corporate decisions, there seems to be considerable leeway for economic
agency independent of these higher level factors (Child, 1997; Oliver, 1991); otherwise, the
firm level would explain only a much smaller proportion of the CSP variance. These results
are also consistent with arguments in favor of the alignment of strategy with CSP (Orlitzky et
al., 2011; Porter & Kramer, 2011).
Interestingly, the one exception to this general finding about the importance of firm-level
effects is shareholder-focused CSP, in which country effects predominated in the VCA and
HLM analyses. Interestingly, our findings suggest good (or poor) corporate governance is
systemic—much more so than the other stakeholder dimensions of CSP. The national-level
drivers of shareholder-focused CSP (“good corporate governance”) clearly warrant further
theorizing and empirical study. One possible interpretation of these findings is that when a
country has strong institutions in place to protect a particular stakeholder group, firm-level
agency (for better or worse) will become more limited.8 Furthermore, our findings also
underscore the appropriateness of the decision made by many researchers to exclude
shareholder-oriented CSP from overall CSP deliberately (e.g., Chin, Hambrick, & Treviño,
2013; Di Giuli & Kostovetsky, 2014; Hillman & Keim, 2001; Surroca et al., 2010). From the
viewpoint of stakeholder theory, this common practice of omitting analyses of shareholder
concerns is puzzling (Freeman, 1984, 1994; J. Mackey, 2005); however, based on the
empirical findings of this study, it seems empirically justified after all because the antecedents
of shareholder-oriented CSP seem to come from very different levels than those of all other
CSP dimensions.
8 We are grateful to one of the reviewers for this interpretation. In line with this reviewer's feedback, the results
may simply indicate that the domain of shareholder CSP is more institutionalized in the countries studied, and
therefore firm agency is more limited here than in other CSP domains for this sample of firm-year observations.

Unpacking 26
Furthermore, the findings allude to the persistence of differences in nation-states and/or
business systems—despite the forces of globalization (Gond, Kang, & Moon, 2011; Matten &
Moon, 2008). If there were a global convergence toward an Anglo-American model of
shareholder capitalism, for instance, countries’ lack of variability would be reflected in small
NBS or country effects. However, because NBS or country effects explained up to 43% of
the variability in CSP (in VCA and HLM), this study provides some evidence supporting the
view that NBS still diverge. Only with respect to CSP targeted at suppliers, local
communities, and employees did NBS seem to explain only a negligible amount of variance
in CSP. As a final observation about the macro (institutional) level, the fact that country
effects were generally found to be larger than NBS effects indicates that, contrary to the
arguments by Amable (2003), clusters of institutional similarities may be a level of conceptual
abstraction that is indeed a bit too high.
Overall, a firm’s main industry sector seems to have only a minor effect on CSP across
the six stakeholder dimensions. Industry effects were largest for environmental CSP (varying
between 5% and 13%, depending on the analytic technique used) and CSP shown toward
local communities (varying between 5% and 10%). In contrast, industry differences seem to
matter the least for shareholder-focused CSP and customer-focused CSP. This suggests that
industry self-regulation is not observed to be a driver of changes in governance- or customer-
related aspects of CSP (see also King & Lenox, 2000, on the (in)effectiveness of industry self-
regulation in the environmental arena). Generally, industry differences do not seem a major
explanation of the variability in CSP and most of its stakeholder dimensions.
The fact that, for different aspects of CSP, we find at least some variation in the relative
importance of NBS, country, industry, and firm effects indicates the usefulness of
disaggregating CSP into its various stakeholder group dimensions. The findings summarized
in Tables 2-4 consistently show that differences in sources of CSP would be overlooked if

Unpacking 27
CSP were only calculated at an aggregate level, rather than for each stakeholder dimension
separately. In support of theorizing by Clarkson (1995) and our introduction of H3, CSP may
best be discussed as corporate stakeholder performance. In other words, different corporate
stakeholder responsibilities seem to require different explanations at different levels of
analysis and should therefore be theorized as distinct outcomes. In this context, it should also
be noted that the reliability of overall CSP (.73) was lower than the reliability coefficients of
the stakeholder components of CSP. Lower reliability coefficients are synonymous with
larger measurement errors and more noise (Orlitzky, 2013; Orlitzky & Swanson, 2012).
Thus, the breakdown of CSP into its stakeholder components may also be beneficial for the
interpretation of empirical results. This result is aligned with psychometric findings about
employees’ perceptions of CSR, showing the relevance of a multistakeholder perspective to
CSR assessment (El-Akremi et al., in press; Turker, 2009). Our study suggests the construct
of corporate stakeholder performance may be a helpful complement to CSP.
Practical Implications for Managers and Policy-Makers
For effective organizational and public policy decisions about CSP, managers need to
know the main sources of interfirm differences in CSP. The results of this study imply that by
far the most important source of corporate differences in CSP is due to firm-specific assets,
resources, and mindsets rather than headquarters location, membership in an industry, or year-
to-year adjustments to external pressures. Put differently, firms within a given industry differ
from one another a great deal more than industries or countries do in terms of CSP. So, in
some ways, our findings challenge the importance of institutional and industry-level drivers of
CSP that has been highlighted in previous theory and empirical research (e.g., Campbell,
2006, 2007; Ioannou & Serafeim, 2012). Viewed from an empirical decomposition-of-
variance perspective, firm-level microfactors should be emphasized more in managerial
decision-making than these meso- and macrolevel influences.
Unpacking 28
In a practical context, estimating the relative importance can provide guidance on the
levels of analysis that may be most instrumental for making effective (including strategic)
decisions about CSP. Because generally industry-level effects are small, managers making
decisions about CSP initiatives, such as CSR or sustainability directors, may spend their time
more productively on creating highly integrated, firm-specific configurations of CSP activities
rather than mimicking broad industry standards or trends in CSP (see also Orlitzky, 2013).
The same caveat applies to emulating countrywide trends in CSP because our findings suggest
(with the caveats mentioned in the next section) that these nation-state forces, in general, do
not seem to be the main levers for improving CSP. The one exception that public policy-
makers ought to keep in mind is the greater importance of country effects for corporate
governance than any other dimension of CSP. Thus, our findings allude to the possibility that
government may ultimately be the most appropriate regulator of shareholder-related CSP,
prioritizing the firm owners’ interests over managerial self-interest and entrenchment.
Limitations and Future Research
Like all studies, this one has several weaknesses, which could be addressed in future
research. First, the findings are limited to our particular dataset (SiRi), whose usefulness and
measurement advantages, however, have also been highlighted in a study by Surroca, Tribó,
and Waddock (2010). In future, researchers could analyze other CSP datasets to validate our
findings. For example, cross-validation is required with a sample of smaller, privately held
firms because, as Table 1 shows, the average organizational size in our SiRi was large—
approximately 92,000 employees per firm. More important, though, may be the possibility
that the type of CSP measure used in this study—even when decomposed into its stakeholder
components—is affected by significant biases, conflicts of interest, or validity concerns (e.g.,
Carroll, 2000; Chelli & Gendron, 2013; Graafland, Eijffinger, & SmidJohan, 2004; Igalens &
Gond, 2005; Liston-Heyes & Ceton, 2009; Orlitzky, 2013), so that alternatives (see, e.g.,

Unpacking 29
Chen & Delmas, 2011; Orlitzky & Swanson, 2012; Turker, 2009) should be explored in
future.9
Furthermore, it is important to remember that, in general, studies like this one are unable
to answer questions about the ultimate drivers of CSP. Future studies could, for example,
measure specific CEO or top management team characteristics and use several different
lagged designs (with greater attention to intertemporal effects, i.e., year-to-year variation δ in
the analytic model) to clarify causal effects. Although HLM is able to examine causal
relationships (Hough, 2006), ANOVA and VCA are purely descriptive (McGahan & Porter,
2005; Rumelt, 1991). In terms of causality, many higher-level effects are very likely to be
driven by managerial actions (McGahan & Porter, 2005, pp. 875-876; Ruefli & Wiggins,
2003, pp. 864-865). Conversely, firm effects cannot unambiguously be attributed to
managerial actions.
Finally, future HLM research could transcend the limitation of our study to categorical
effects (dummy variable coding) and investigate the impact of specific continuous variables
on CSP. Such a focus on continuous variables could determine, across different levels of
analysis, what specific variables cause firms to increase or decrease their CSP. Other
researchers (e.g., Ioannou & Serafeim, 2012) have already taken an important step in this
direction—albeit not from the perspective of corporate stakeholder performance. As indicated
by our own supplementary analyses10, the most important antecedents of CSP at the firm level
may include companies’ international scope, firm size, and intangible assets.
Conclusion
This study adopted a multilevel, multistakeholder, and multimethod approach to examine
and unpack the relative influence of CSP drivers at different levels of analysis. More
specifically, it applied to the CSP arena three statistical modeling techniques, which have been
9 We are grateful to one of the reviewers for these points. 10 These supplementary analyses are omitted from this paper, but available in another working paper available
from the authors.
Unpacking 30
widely used in the strategic management literature to analyze the sources of variability in
financial performance. Comparing and contrasting the empirical importance of (a)
institutional/country-level (macro) effects, (b) industry (meso) effects, (c) firm-level (micro)
effects, and (d) time effects by drawing on three distinct statistical techniques, we generally
establish the primacy of firm-level factors. Macrolevel factors seem to exert a primary
influence on only one of our investigated CSP dimensions, namely shareholder-oriented
CSP—and even then only in the context of one specific technique of variance decomposition
analysis. In addition, we showed that the relative impact of the determinants of CSP varied
greatly depending on the stakeholder initiative considered. Specifically, firm-level drivers
seemed to be the most important determinants of CSP for local communities, the natural
environment, and employees as well as a firm’s overall CSP. Thus, future cross-cultural
research of CSP ought to examine not only aggregate CSP, but also distinct stakeholder
groups. Overall, the findings of our study can be interpreted as preliminary evidence that the
choice of an organization’s most effective level of CSP is highly firm-specific, stakeholder-
specific, and probably closely intertwined with the firm’s strategy, identity, and culture.

Unpacking 31
References
Aguilera, R. V., Rupp, D. E., Williams, C. A., & Ganapathi, J. (2007). Putting the S back in
corporate social responsibility: A multilevel theory of social change in organizations.
Academy of Management Review, 32(3), 836-863.
Aguinis, H., & Glavas, A. (2012). What we know and don't know about corporate social
responsibility: A review and research agenda. Journal of Management, 38(4), 932-
968.
Aguinis, H., & Glavas, A. (2013). Embedded versus peripheral corporate social responsibility:
Psychological foundations. Industrial and Organizational Psychology: Perspectives
on Science and Practice, 6(4), 314-332.
Alvarez, S. A., & Barney, J. B. (2004). Organizing rent generation and appropriation: Toward
a theory of the entrepreneurial firm. Journal of Business Venturing, 19, 621-635.
Amable, B. (2003). The diversity of modern capitalism. Oxford, UK: Oxford University Press.
Baird, P. L., Geylani, P. C., & Roberts, J. A. (2012). Corporate social and financial
performance re-examined: Industry effects in a linear mixed model analysis. Journal
of Business Ethics, 109(3), 367-388.
Barnett, M. L. (2007). Stakeholder influence capacity and the variability of financial returns to
corporate social responsibility. Academy of Management Review, 32(3), 794-816.
Barney, J. (1991). Firm resources and sustained competitive advantage. Journal of
Management, 17, 771-792.
Bhattacharya, C., Korschun, D., & Sen, S. (2009). Strengthening stakeholder–company
relationships through mutually beneficial corporate social responsibility initiatives.
Journal of Business Ethics, 85(2), 257-272.
Bhattacharya, C., & Sen, S. (2004). Doing better at doing good: When, why, and how
consumers respond to corporate social responsibility initiatives. California
Management Review, 47(1), 9-24.
Biggart, N. W., & Guillén, M. F. (1999). Developing difference: Social organization and the
rise of the auto industries of South Korea, Taiwan, Spain, and Argentina. American
Sociological Review, 64, 722-747.
Bobko, P. (2001). Correlation and regression: Applications for industrial/organizational
psychology and management (2nd ed.). Thousand Oaks, CA: Sage.
Bowman, E. H., & Helfat, C. E. (2001). Does corporate strategy matter? Strategic
Management Journal, 22(1), 1-23.
Brickson, S. L. (2007). Organizational identity orientation: The genesis of the role of the firm
and distinct forms of social value. Academy of Management Review, 32(3), 864-888.
Brower, J., & Mahajan, V. (2013). Driven to be good: A stakeholder theory perspective on the
drivers of corporate social performance. Journal of Business Ethics, 117(2), 313-331.
Brush, T. H., & Bromiley, P. (1997). What does a small corporate effect mean? A variance
components simulation of corporate and business effects. Strategic Management
Journal, 18(10), 825-835.
Brush, T. H., Bromiley, P., & Hendrickx, M. (1999). The relative influence of industry and
corporation on business segment performance: An alternative estimate. Strategic
Management Journal, 20(6), 519-547.
Campbell, J. L. (2006). Institutional analysis and the paradox of corporate social
responsibility. American Behavioral Scientist, 49(7), 925-938.
Campbell, J. L. (2007). Why would corporations behave in socially responsible ways? An
institutional theory of corporate social responsibility. Academy of Management
Review, 32(3), 946-967.
Unpacking 32
Campbell, J. L., & Lindberg, L. N. (1990). Property rights and the organization of economic
activity by the state. American Sociological Review, 55, 634-647.
Carroll, A. B. (1991). The pyramid of corporate social responsibility: Toward the moral
management of organizational stakeholders. Business Horizons, 34(4), 39-48.
Carroll, A. B. (2000). A commentary and an overview of key questions on corporate social
performance measurement. Business & Society, 39(4), 466-478.
Chatterji, A. K., & Levine, D. (2006). Breaking down the wall of codes: Evaluating non-
financial performance measurement. California Management Review, 48(2), 29-51.
Chatterji, A. K., Levine, D., & Toffel, M. W. (2009). How well do social ratings actually
measure corporate social responsibility? Journal of Economics and Management
Strategy, 18(1), 125-169.
Chelli, M., & Gendron, Y. (2013). Sustainability ratings and the disciplinary power of the
ideology of numbers. Journal of Business Ethics, 112(2), 187-203.
Chen, C. M., & Delmas, M. (2011). Measuring corporate social performance: An efficiency
perspective. Production and Operations Management, 20(6), 789-804.
Chhaochharia, V., & Grinstein, Y. (2007). Corporate governance and firm value: The impact
of the 2002 governance rules. Journal of Finance, 62(4), 1789-1825.
Child, J. (1997). Strategic choice in the analysis of action, structure, organizations and
environment: Retrospect and prospect. Organization Studies, 18(1), 43-76.
Chin, M. K., Hambrick, D. C., & Treviño, L. (2013). Political ideologies of CEOs: The
influence of executives' values on corporate social responsibility. Administrative
Science Quarterly, 58(2), 197-232.
Clarkson, M. B. E. (1995). A stakeholder framework for analyzing and evaluating corporate
social performance. Academy of Management Review, 20(1), 92-117.
Coase, R. H. (1937). The nature of the firm. Economica, 4, 386-405.
Coase, R. H. (1960). The problem of social cost. The Journal of Law and Economics, 3, 1-44.
Collier, J., & Esteban, R. (2007). Corporate social responsibility and employee commitment.
Business Ethics: A European Review, 16(1), 19-33.
Crilly, D. (2011). Predicting stakeholder orientation in the multinational enterprise: A mid-
range theory. Journal of International Business Studies, 42(5), 694-717.
Crossland, C., & Hambrick, D. C. (2007). How national systems differ in their constraints on
corporate executives: A study of CEO effects in three countries. Strategic
Management Journal, 28, 767-789.
Crouch, C. (2006). Modelling the firm in its market and organizational environment:
Methodologies for studying corporate social responsibility. Organization Studies, 27,
1533-1551.
Cumming, G. (2012). Understanding the new statistics: Effect sizes, confidence intervals, and
meta-analysis. New York: Routledge.
Dahlman, C. J. (1979). The problem of externality. Journal of Law and Economics, 22(1),
141-162.
Dalton, D. R., Daily, C. M., Certo, S. T., & Roengpitya, R. (2003). Meta-analyses of financial
performance and equity: Fusion or confusion? Academy of Management Journal,
46(1), 13-26.
Dalton, D. R., Daily, C. M., Ellstrand, A. E., & Johnson, J. L. (1998). Meta-analytic reviews
of board composition, leadership structure, and financial performance. Strategic
Management Journal, 19, 269-290.
Davis, G. F. (2005). New directions in corporate governance. Annual Review of Sociology, 31,
143-162.

Unpacking 33
Di Giuli, A., & Kostovetsky, L. (2014). Are red or blue companies more likely to go green?
Politics and corporate social responsibility. Journal of Financial Economics, 111(1),
158-180.
Dierickx, I., & Cool, K. (1989). Asset stock accumulation and sustainability of competitive
advantage. Management Science, 35, 1504-1511.
Doane, D. (2005, September 1). The myth of CSR. Stanford Social Innovation Review, 23-29.
Doidge, C., Karolyi, G. A., & Stulz, R. M. (2007). Why do countries matter so much for
corporate governance? Journal of Financial Economics, 86(1), 1-39.
Duarte, F. (2010). Working with corporate social responsibility in Brazilian companies: The
role of managers’ values in the maintenance of CSR cultures. Journal of Business
Ethics, 96(3), 355-368.
Dunn, O. J., & Clark, V. A. (1969). Correlation coefficients measured on the same
individuals. Journal of the American Statistical Association, 64, 366-377.
Dunn, O. J., & Clark, V. A. (1971). Comparison of the tests of the equality of dependent
correlation coefficients. Journal of the American Statistical Association, 66, 904-908.
Ederington, J., & Minier, J. (2003). Is environmental policy a secondary trade barrier? An
empirical analysis. Canadian Journal of Economics, 36(1), 137-154.
El-Akremi, A., Gond, J.-P., Swaen, V., De Roeck, K., & Igalens, J. (in press). How do
employees perceive corporate responsibility? Development and validation of a
multidimensional corporate stakeholder responsibility scale. Journal of Management.
Entine, J. (2003). The myth of social investing: A critique of its practices and consequences
for corporate social performance research. Organization & Environment, 16(3), 352-
368.
Fombrun, C. J. (2005). A world of reputation research, analysis and thinking—building
corporate reputation through CSR initiatives: Evolving standards. Corporate
Reputation Review, 8(1), 7-12.
Frazier, M. (2007, March 5). Costly RED campaign reaps meager $18 million. Advertising
Age, 1.
Freeman, R. E. (1984). Strategic management: A stakeholder approach. Marshfield, MA:
Pitman.
Freeman, R. E. (1994). The politics of stakeholder theory: Some future directions. Business
Ethics Quarterly, 4, 409-421.
Freeman, R. E., Harrison, J. S., & Wicks, A. C. (2007). Managing for stakeholders: Survival,
reputation, and success. New Haven, CT: Yale University Press.
Friedman, M. (1970, September 13). The social responsibility of business is to increase its
profits. New York Times Magazine, 33.
Gond, J.-P., Kang, N., & Moon, J. (2011). The government of self-regulation: On the
comparative dynamics of corporate social responsibility. Economy and Society, 40(4),
640-671.
Graafland, J. J., Eijffinger, S. C., & SmidJohan, H. (2004). Benchmarking of corporate social
responsibility: methodological problems and robustness. Journal of Business Ethics,
53(1-2), 137-152.
Griffin, J. J., & Mahon, J. F. (1997). The corporate social performance and corporate financial
performance debate: Twenty-five years of incomparable research. Business & Society,
36(1), 5-31.
Hall, P. A., & Soskice, D. (Eds.). (2001). Varieties of capitalism. Oxford, UK: Oxford
University Press.
Hillman, A. J., & Keim, G. D. (2001). Shareholder value, stakeholder management, and social
issues: What's the bottom line? Strategic Management Journal, 22, 125-139.
Unpacking 34
Höllerer, M. A. (2013). From taken‐for‐granted to explicit commitment: The rise of CSR in a
corporatist country. Journal of Management Studies, 50(4), 573-606.
Hosmer, L. T. (1995). Trust: The connecting link between organizational theory and
philosophical ethics. Academy of Management Review, 20, 379-403.
Hough, J. R. (2006). Business segment performance redux: A multilevel approach. Strategic
Management Journal, 27, 45-61.
Hull, C. E., & Rothenberg, S. (2008). Firm performance: The interactions of corporate social
performance with innovation and industry differentiation. Strategic Management
Journal, 29(7), 781-789.
Hunter, J. E. (1997). Needed: A ban on the significance test. Psychological Science, 8(1), 3-7.
Igalens, J., & Gond, J.-P. (2005). Measuring corporate social performance in France: A
critical and empirical analysis of ARESE data. Journal of Business Ethics, 56, 131-
148.
Ioannou, I., & Serafeim, G. (2012). What drives corporate social performance? The role of
nation-level institutions. Journal of International Business Studies, 43(9), 834-864.
Jackson, G., & Deeg, R. (2008). Comparing capitalisms: Understanding institutional diversity
and its implications for international business. Journal of International Business
Studies, 39(4), 540-561.
Jensen, M. C., & Meckling, R. S. (1976). Theory of the firm: Managerial behavior, agency
costs and ownership structure. Journal of Financial Economics, 3, 305-360.
Jones, T. M. (1995). Instrumental stakeholder theory: A synthesis of ethics and economics.
Academy of Management Review, 20(2), 404-437.
King, A. A. (2007). Cooperation between corporations and environmental groups: A
transaction cost perspective. Academy of Management Review, 32(3), 889-900.
King, A. A., & Lenox, M. J. (2000). Industry self-regulation without sanctions: The chemical
industry's Responsible Care program. Academy of Management Journal, 43(4), 698-
716.
Kleinbaum, D. G., Kupper, L. L., & Muller, K. E. (1988). Applied regression analysis and
other multivariable methods (2nd ed.). Belmont, CA: Duxbury.
Kline, R. B. (2004). Beyond significance testing: Reforming data analysis methods in
behavioral research. Washington, DC: American Psychological Association.
La Porta, R., Lopez-de-Silanes, F., Shleifer, A., & Vishny, R. (2000). Investor protection and
corporate governance. Journal of Financial Economics, 58(1), 3-27.
Lee, S., Singal, M., & Kang, K. H. (2013). The corporate social responsibility–financial
performance link in the US restaurant industry: Do economic conditions matter?
International Journal of Hospitality Management, 32, 2-10.
Liston-Heyes, C., & Ceton, G. (2009). An investigation of real versus perceived CSP in S&P-
500 firms. Journal of Business Ethics, 89(2), 283-296.
Lucea, R. (2010). How we see them versus how they see themselves: A cognitive perspective
of firm–NGO relationships. Business & Society, 49(1), 116-139.
Lyon, T., & Maxwell, J. (2008). Corporate social responsibility and the environment: A
theoretical perspective. Review of Environmental Economics and Policy, 1, 1-22.
Macey, J. R. (2008). Corporate governance: Promises kept, promises broken. Princeton, NJ:
Princeton University Press.
Macher, J. T., & Richman, B. D. (2008). Transaction cost economics: An assessment of
empirical research in the social sciences. Business and Politics, 10(1), 1-63.
Mackey, A., Mackey, T. B., & Barney, J. B. (2007). Corporate social responsibility and firm
performance: Investor preferences and corporate strategies. Academy of Management
Review, 32(3), 817-835.
Mackey, J. (2005). Putting customers ahead of investors. Reason, 37(5), 29-32.

Unpacking 35
Marchenko, Y. (2006). Estimating variance components in Stata. The Stata Journal, 6(1), 1-
21.
Matten, D., & Moon, J. (2008). Implicit and explicit CSR: A conceptual framework for
understanding CSR in Europe. Academy of Management Review, 33(2), 404-424.
Mattingly, J. E., & Berman, S. L. (2006). Measurement of corporate social action:
Discovering taxonomy in the Kinder Lydenberg Domini ratings data. Business &
Society, 45(1), 20-46.
McGahan, A., & Porter, M. E. (2002). What do we know about variance in accounting
profitability? Management Science, 48, 834-851.
McGahan, A., & Porter, M. E. (2005). Comment on 'Industry, corporate and business-segment
effects and business performance: A non-parametric approach' by Ruefli and Wiggins.
Strategic Management Journal, 26, 873-880.
McGuire, J. B., Sundgren, A., & Schneeweis, T. (1988). Corporate social responsibility and
firm financial performance. Academy of Management Journal, 31, 854-872.
McWilliams, A., & Siegel, D. (2001). Corporate social responsibility: A theory of the firm
perspective. Academy of Management Review, 26(1), 117-127.
McWilliams, A., Siegel, D. S., & Wright, P. M. (2006). Corporate social responsibility:
Strategic implications. Journal of Management Studies, 43(1-18).
McWilliams, A., Van Fleet, D. D., & Cory, K. D. (2002). Raising rivals' costs through
political strategy: An extension of resource-based theory. Journal of Management
Studies, 39(5), 707-724.
Meyer, M. W., & Gupta, V. (1994). The performance paradox. Research in organizational
behavior, 16, 309-369.
Meyer, R. E., & Höllerer, M. A. (2010). Meaning structures in a contested issue field: A
topographic map of shareholder value in Austria. Academy of Management Journal,
53(6), 1241-1262.
Misangyi, V. F., Elms, H., Greckhamer, T., & LePine, J. A. (2006). A new perspective on a
fundamental debate: A multilevel approach to industry, corporate, and business unit
effects. Strategic Management Journal, 27, 571-590.
Mitchell, R. K., Agle, B. R., & Wood, D. J. (1997). Toward a theory of stakeholder
identification and salience: Defining the principle of who and what really counts.
Academy of Management Review, 22, 853-886.
Morgan, G. (2007). National business systems research: Progress and prospects. Scandinavian
Journal of Management, 23(2), 127-145.
Oliver, C. (1991). Strategic responses to institutional processes. Academy of Management
Review, 16, 145-179.
Orlitzky, M. (2012). How can significance tests be deinstitutionalized? . Organizational
Research Methods, 15(2), 199-228.
Orlitzky, M. (2013). Corporate social responsibility, noise, and stock market volatility.
Academy of Management Perspectives, 27(3), 238-254.
Orlitzky, M., & Benjamin, J. D. (2001). Corporate social performance and firm risk: A meta-
analytic review. Business & Society, 40(4), 369-396.
Orlitzky, M., Schmidt, F. L., & Rynes, S. L. (2003). Corporate social and financial
performance: A meta-analysis. Organization Studies, 24(3), 403-441.
Orlitzky, M., & Shen, J. (2013). Corporate social responsibility, industry, and strategy.
Industrial and Organizational Psychology: Perspectives on Science and Practice,
6(4), 346-350.
Orlitzky, M., Siegel, D. S., & Waldman, D. A. (2011). Strategic corporate social
responsibility and environmental sustainability. Business & Society, 50(1), 6-27.

Unpacking 36
Orlitzky, M., & Swanson, D. L. (2012). Assessing stakeholder satisfaction: Toward a
supplemental measure of corporate social performance as reputation. Corporate
Reputation Review, 15(2), 119-137.
Pigou, A. C. (1962). The economics of welfare. London: Macmillan.
Porter, M. E., & Kramer, M. R. (2006). Strategy & society: The link between competitive
advantage and corporate social responsibility. Harvard Business Review, 84(12), 78-
92.
Porter, M. E., & Kramer, M. R. (2011). Creating shared value. Harvard Business Review,
89(1/2), 62-77.
Rabe-Hesketh, S., & Skrondal, A. (2012). Multilevel and longitudinal modeling using Stata:
Volume I: Continuous responses. College Station, TX: Stata Press.
Reich, R. (2008). The case against corporate social responsibility (Publication no. GSPP08-
003). Retrieved Sept. 23, 2009, from Goldman School of Public Policy Working
Paper No. GSPP08-003. Available at http://ssrn.com/abstract=1213129
Rivoli, P. (2003). Making a difference or making a statement? Finance research and socially
responsible investment. Business Ethics Quarterly, 13(3), 271-287.
Ruefli, T. W., & Wiggins, R. R. (2003). Industry, coporate and business-segment effects and
business performance: A non-parametric approach. Strategic Management Journal,
24(9), 861-879.
Rumelt, R. P. (1991). How much does industry matter? Strategic Management Journal, 12(3),
167-185.
Schmidt, F. L. (1992). What do data really mean? Research findings, meta-analysis, and
cumulative knowledge in psychology. American Psychologist, 47, 1173-1181.
Schmidt, F. L. (1996). Statistical significance testing and cumulative knowledge in
psychology: Implications for training and researchers. Psychological Methods, 1(2),
115-129.
Schoemaker, P. J. H. (1990). Strategy, complexity and economic rent. Management Science,
36(10), 1178-1192.
Searle, S., Casella, G., & McCulloch, C. (1992). Variance components. New York: Wiley.
Sharfman, M. (1996). The construct validity of the Kinder, Lydenberg & Domini social
performance ratings data. Journal of Business Ethics, 15(3), 287-296.
Shleifer, A. (2004). Does competition destroy ethical behavior? American Economic Review,
94(2), 414-418.
Slack, R., Corlett, S., & Morris, R. (in press). Exploring employee engagement with
(corporate) social responsibility: A social exchange perspective on organisational
participation. Journal of Business Ethics.
Smith, C. (2003). Corporate social responsibility: Whether or how? California Management
Review, 45(4), 52-76.
Spence, L. (2007). CSR and small business in a European policy context: The five "C"s of
CSR and small business research agenda 2007. Business and Society Review, 112(4),
533-552.
Steiger, J. H. (1980). Tests for comparing elements of a correlation matrix. Psychological
Bulletin, 87, 245-251.
Strike, V. M., Gao, J., & Bansal, P. (2006). Being good while being bad: Social responsibility
and the international diversification of US firms. Journal of International Business
Studies, 37, 850-862.
Surroca, J., Tribo, J. A., & Waddock, S. A. (2010). Corporate responsibility and financial
performance: The role of intangible resources. Strategic Management Journal, 31,
463-490.
Unpacking 37
Swanson, D. L. (2014). Embedding CSR into coproate culture: Challenging the executive
mind. New York: Palgrave Macmillan.
Tantalo, C., & Willi, A. (2012). Why? What? How? An exploratory study about the
determinants of CSR in SMEs. Paper presented at the Annual Academy of
Management Conference, Boston, MA.
Tempel, A., & Walgenbach, P. (2007). Global standardization of organizational forms and
management practices? What new institutionalism and the business-systems approach
can learn from each other. Journal of Management Studies, 44(1), 1-24.
Traub, R. E. (1994). Reliability for the social sciences: Theory and applications (Vol. 3).
Thousand Oaks, CA: Sage.
Turker, D. (2009). Measuring corporate social responsibility: A scale development study.
Journal of Business Ethics, 85(4), 411-427.
Udayasankar, K. (2008). Corporate social responsibility and firm size. Journal of Business
Ethics, 83(2), 167-175.
Vogel, D. (2005). The market for virtue: The potential and limits of corporate social
responsibility. Washington, DC: Brookings Institution Press.
Waddock, S. A., & Graves, S. B. (1997). The corporate social performance-financial
performance link. Strategic Management Journal, 18, 303-319.
Wang, H., & Choi, J. (2013). A new look at the corporate social–financial performance
relationship: The moderating roles of temporal and interdomain consistency in
corporate social performance. Journal of Management, 39(2), 416-441.
Windsor, D. (2001). "Corporate social responsibility: A theory of the firm perspective"--some
comments. Academy of Management Review, 26(4), 502-504.
Zhang, I. (2007). Economic consequences of the Sarbanes-Oxley Act of 2002. Retrieved Feb.
1, from Available at SSRN: http://ssrn.com/abstract=961964
http://ssrn.com/abstract=961964
Ziliak, S. T., & McCloskey, D. N. (2008). The cult of statistical significance: How the
standard error costs us jobs, justice, and lives. Ann Arbor, MI: University of
Michigan Press.
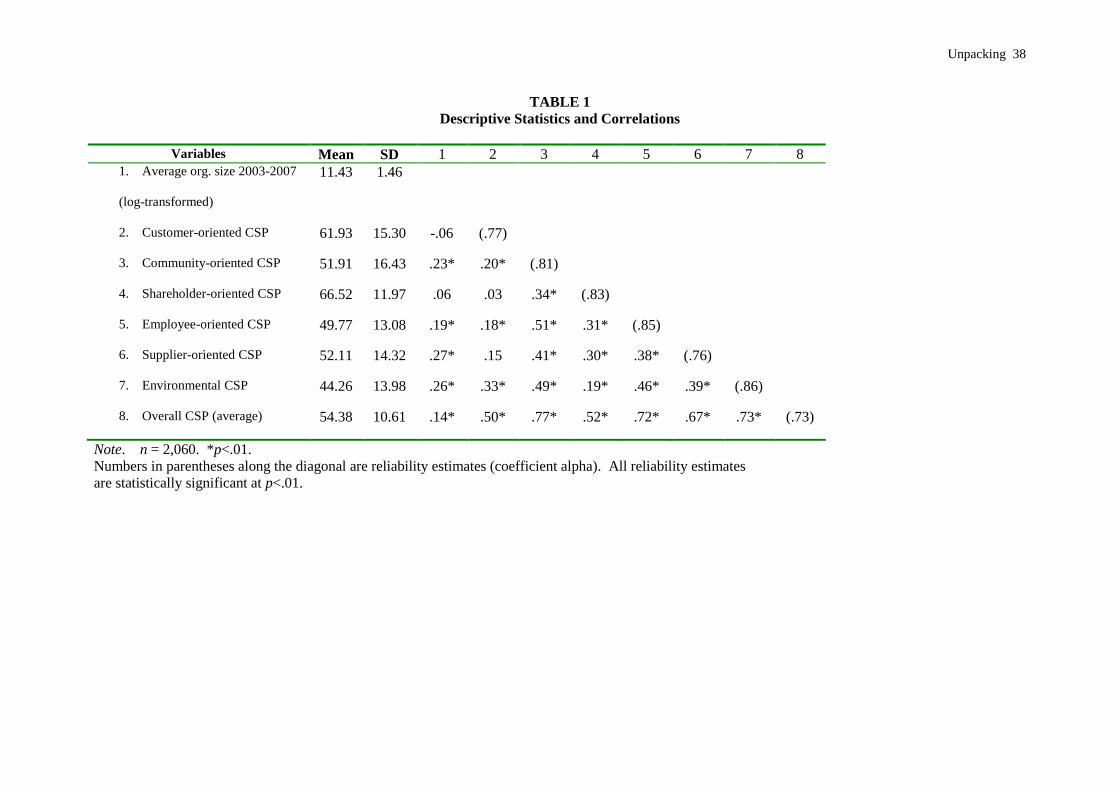
Unpacking 38
TABLE 1
Descriptive Statistics and Correlations
Variables Mean SD 1 2 3 4 5 6 7 8 1. Average org. size 2003-2007
(log-transformed)
11.43 1.46
2. Customer-oriented CSP 61.93 15.30 -.06 (.77)
3. Community-oriented CSP 51.91 16.43 .23* .20* (.81)
4. Shareholder-oriented CSP 66.52 11.97 .06 .03 .34* (.83)
5. Employee-oriented CSP 49.77 13.08 .19* .18* .51* .31* (.85)
6. Supplier-oriented CSP 52.11 14.32 .27* .15 .41* .30* .38* (.76)
7. Environmental CSP 44.26 13.98 .26* .33* .49* .19* .46* .39* (.86)
8. Overall CSP (average) 54.38 10.61 .14* .50* .77* .52* .72* .67* .73* (.73)
Note. n = 2,060. *p<.01.
Numbers in parentheses along the diagonal are reliability estimates (coefficient alpha). All reliability estimates
are statistically significant at p<.01.

Unpacking 39
TABLE 2
ANOVA and Variance Components Analysis
Simultaneous ANOVA
MLE VCA REMLE VCA
DV: Disaggregated and Overall CSP
NBS
(α)
Industry
(β)
Firm
(γ)
Year
(δ)
NBS
(α)
Industry
(β)
Firm
(γ)
Year
(δ)
NBS
(α)
Industry
(β)
Firm
(γ)
Year
(δ)
Customer-oriented CSP
5% 3% 57% 5% 5% 5% 51% 7% 7% 5% 50% 8%
Community-oriented CSP
2% 5% 73% 4% 1% 10% 65% 1% 1% 10% 64% 1%
Shareholder-oriented CSP
21% 1% 48% <.5% 22% 2% 38% 3% 27% 2% 36% 4%
Supplier-oriented CSP
2% 3% 47% 22% 4% 7% 47% 25% 6% 7% 46% 30%
Environmental CSP
5% 6% 70% <.5% 6% 10% 61% 2% 7% 10% 60% 3%
Employee-oriented CSP
2% 5% 70% 2% 4% 7% 61% 1% 5% 7% 60% 2%
Overall CSP
<.5% 5% 75% 9% <.5% 7% 73% 2% <.5% 7% 74% 2%
Note. DV = dependent variable. CSP = corporate social performance. NBS = national business systems. ANOVA = analysis of variance. VCA = Variance
components analysis. MLE = Maximum likelihood estimation. REMLE = Restricted maximum likelihood estimation.
<.5% means that percentage of variance explained is between 0.001% and 0.499%.
Percentages pertaining to residual variances are not reported because they are superfluous; the four columns of each type of analysis plus the residual add up to
100%.
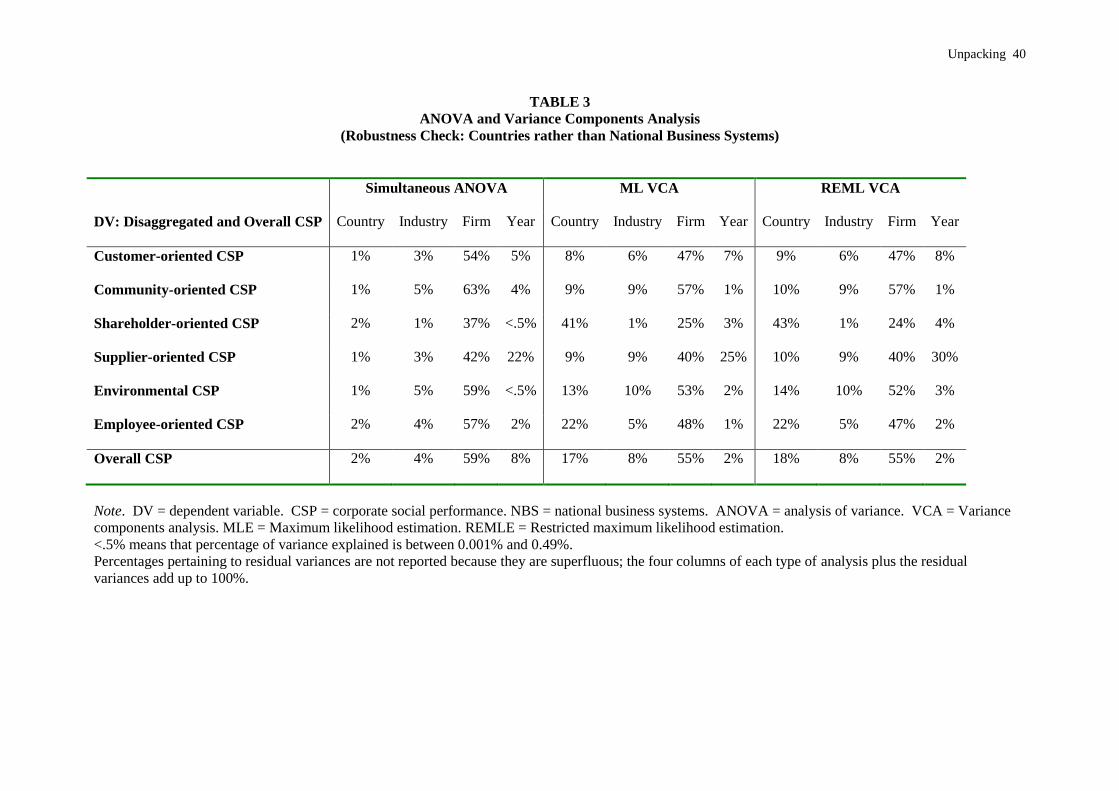
Unpacking 40
TABLE 3
ANOVA and Variance Components Analysis
(Robustness Check: Countries rather than National Business Systems)
Simultaneous ANOVA
ML VCA REML VCA
DV: Disaggregated and Overall CSP
Country Industry Firm Year Country Industry Firm Year Country Industry Firm Year
Customer-oriented CSP
1% 3% 54% 5% 8% 6% 47% 7% 9% 6% 47% 8%
Community-oriented CSP
1% 5% 63% 4% 9% 9% 57% 1% 10% 9% 57% 1%
Shareholder-oriented CSP
2% 1% 37% <.5% 41% 1% 25% 3% 43% 1% 24% 4%
Supplier-oriented CSP
1% 3% 42% 22% 9% 9% 40% 25% 10% 9% 40% 30%
Environmental CSP
1% 5% 59% <.5% 13% 10% 53% 2% 14% 10% 52% 3%
Employee-oriented CSP
2% 4% 57% 2% 22% 5% 48% 1% 22% 5% 47% 2%
Overall CSP
2% 4% 59% 8% 17% 8% 55% 2% 18% 8% 55% 2%
Note. DV = dependent variable. CSP = corporate social performance. NBS = national business systems. ANOVA = analysis of variance. VCA = Variance
components analysis. MLE = Maximum likelihood estimation. REMLE = Restricted maximum likelihood estimation.
<.5% means that percentage of variance explained is between 0.001% and 0.49%.
Percentages pertaining to residual variances are not reported because they are superfluous; the four columns of each type of analysis plus the residual
variances add up to 100%.
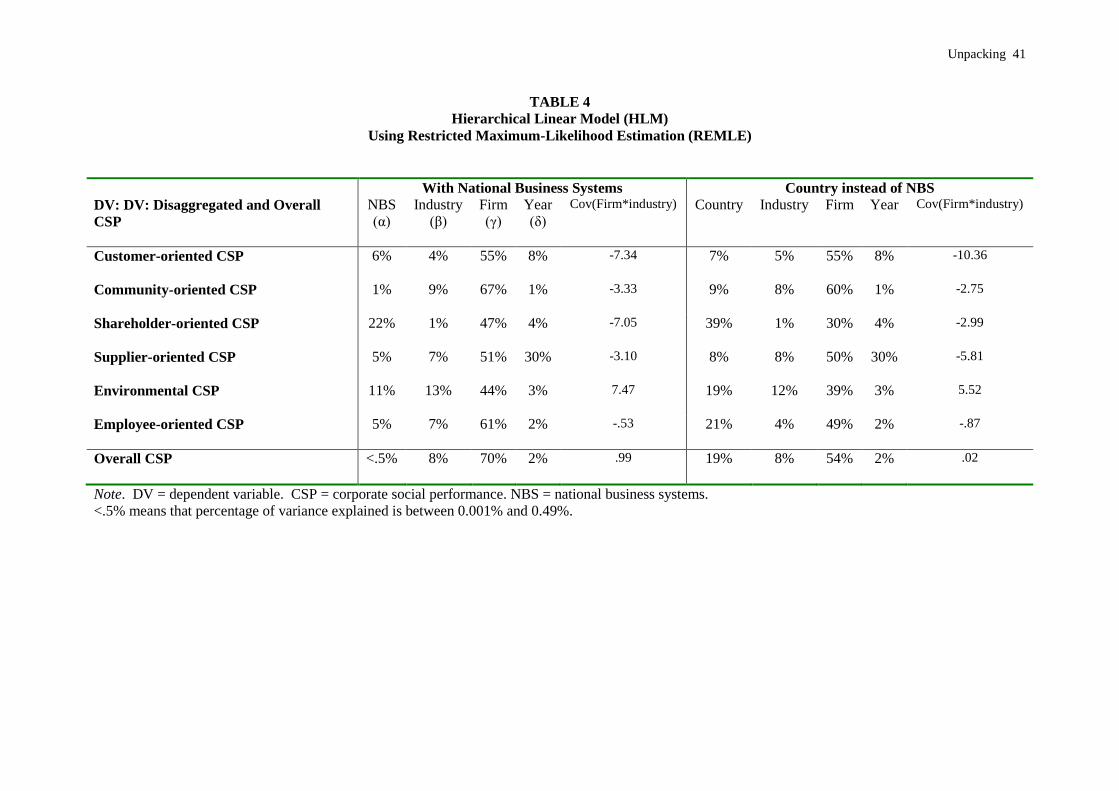
Unpacking 41
TABLE 4
Hierarchical Linear Model (HLM)
Using Restricted Maximum-Likelihood Estimation (REMLE)
With National Business Systems Country instead of NBS
DV: DV: Disaggregated and Overall
CSP
NBS
(α)
Industry
(β)
Firm
(γ)
Year
(δ)
Cov(Firm*industry) Country Industry Firm Year Cov(Firm*industry)
Customer-oriented CSP
6% 4% 55% 8% -7.34 7% 5% 55% 8% -10.36
Community-oriented CSP
1% 9% 67% 1% -3.33 9% 8% 60% 1% -2.75
Shareholder-oriented CSP
22% 1% 47% 4% -7.05 39% 1% 30% 4% -2.99
Supplier-oriented CSP
5% 7% 51% 30% -3.10 8% 8% 50% 30% -5.81
Environmental CSP
11% 13% 44% 3% 7.47 19% 12% 39% 3% 5.52
Employee-oriented CSP
5% 7% 61% 2% -.53 21% 4% 49% 2% -.87
Overall CSP
<.5% 8% 70% 2% .99 19% 8% 54% 2% .02
Note. DV = dependent variable. CSP = corporate social performance. NBS = national business systems.
<.5% means that percentage of variance explained is between 0.001% and 0.49%.
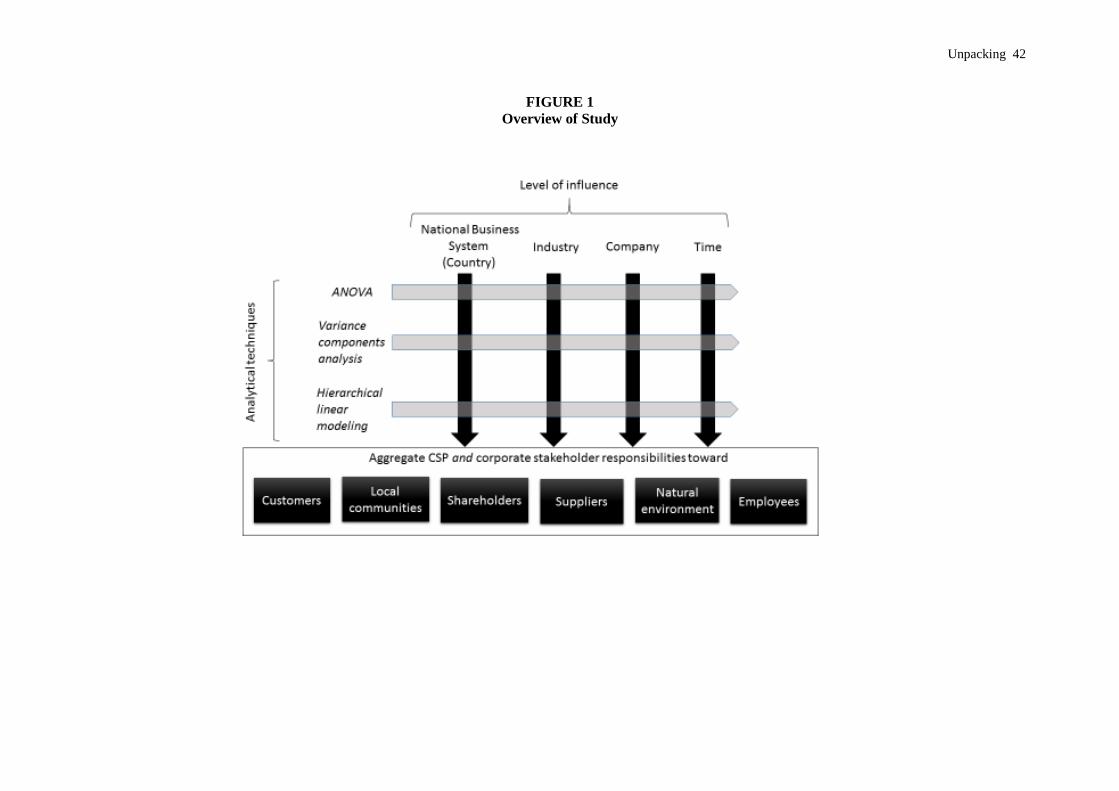
Unpacking 42
FIGURE 1
Overview of Study
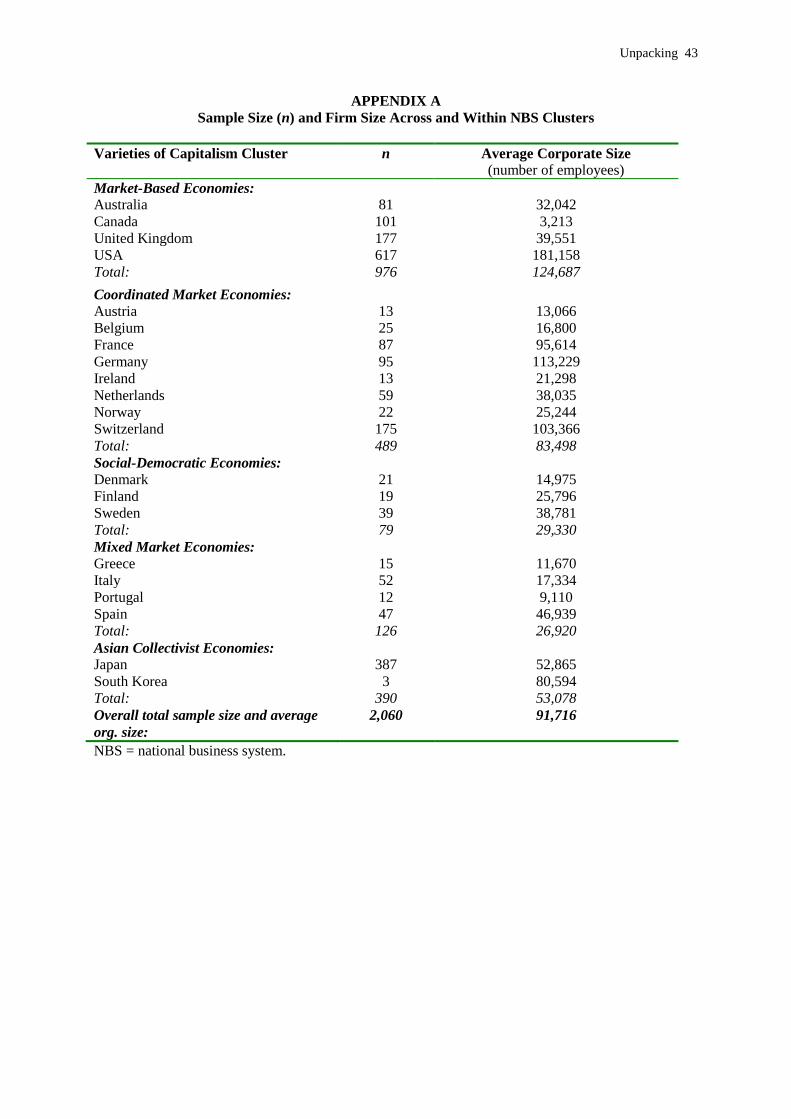
Unpacking 43
APPENDIX A
Sample Size (n) and Firm Size Across and Within NBS Clusters
Varieties of Capitalism Cluster n Average Corporate Size
(number of employees)
Market-Based Economies:
Australia 81 32,042
Canada 101 3,213
United Kingdom 177 39,551
USA 617 181,158
Total: 976 124,687
Coordinated Market Economies:
Austria 13 13,066
Belgium 25 16,800
France 87 95,614
Germany 95 113,229
Ireland 13 21,298
Netherlands 59 38,035
Norway 22 25,244
Switzerland 175 103,366
Total: 489 83,498
Social-Democratic Economies:
Denmark 21 14,975
Finland 19 25,796
Sweden 39 38,781
Total: 79 29,330
Mixed Market Economies:
Greece 15 11,670
Italy 52 17,334
Portugal 12 9,110
Spain 47 46,939
Total: 126 26,920
Asian Collectivist Economies:
Japan 387 52,865
South Korea 3 80,594
Total: 390 53,078
Overall total sample size and average
org. size:
2,060 91,716
NBS = national business system.

Unpacking 44
APPENDIX B
Description and Main Components of SiRi's CSR Ratings
Aspect of CSP Description Main Components
Customer-
focused CSP
This theme provides an overview of the company’s
commitment towards maintaining a high quality of
products and services, reaching high levels of customer
satisfaction, and adhering to ethical marketing practices. It
looks at elements such as quality management systems,
customer relations procedures, and the nature of a firm's
marketing activities. Attention is paid to controversies
that are frequently identified in an area as sensitive to
customer relations: fraudulent, deceptive or controversial
marketing practices as well as price fixing or antitrust
violations.
Quality of management
systems
Customer satisfaction
Competitive practices
Marketing practices
Community-
focused CSP
Refers primarily to the residents of local communities in
which a company operates. It may also refer to the larger
areas, such as a region or nation, to the extent that society
in such larger areas is affected by a company’s operations.
It examines to what extent the company takes into account
the needs, interests, and rights of communities affected by
its operations or planned operations. It pays specific
attention to the ways the company seeks to mitigate its
negative impact on communities and enhance its positive
impact.
Stakeholder consultation
processes
Contribution to the
development of local
communities
Philanthropic activities
Lobbying activities
Involvement in non-
democratic countries
Shareholder-
focused CSP
(good
corporate
governance)
Primarily assesses the organization of the Board of
Directors and examines issues such the independency of
directors and the existence and composition of Board-
specific committees as well as other aspects of good
corporate governance, such as transparency, stock
ownership structure, voting rights, and compensation paid
to senior executives.
Independence of directors
Audit committee
Compensation and
remuneration schemes
Voting rights
Anti-takeover devices
Supplier-
focused CSP
Refers to the employees of the company’s contractors. It
provides an overview of the company’s commitment
towards worldwide fair labor standards and freedom of
association. The evaluation process examines whether the
company implemented a code of conduct that addresses
human and labor rights issues relevant to its operations in
countries with poor human rights records, and whether it
implemented the mechanisms to ensure compliance with
this code. Controversies include, for example, a
company’s complicity in human rights violations, when it
is involved directly or through its major suppliers in the
use of child, forced, or sweatshop labor.
Outsourcing policy
Code of conduct for
contractors
Monitoring of
subcontractors and
company suppliers
Involvement in labor rights
violations of firm
contractors
Environment-
focused CSP
Evaluates the company’s commitment towards the
establishment of sound and appropriate environmental
management systems, increasing efficiency in the use of
resources and energy, and avoidance of harm to the
environment. In assessing each company’s environmental
record, consideration is given to specific elements that can
be categorized under the following headings:
environmental management and reporting systems
the company’s record of compliance with applicable
environmental laws and regulations
methods of use/extraction of natural resources
level of emissions of hazardous or toxic substances
level of emissions of substances that increase the
threat of climate change
firm's impact on natural ecosystems
Resource consumption
Air emissions
Water and soil releases
Waste generation
Product impact

Unpacking 45
measures to reduce the environmental impact of
operations
the ecological impact of the company’s products
Employee-
focused CSP
Provides an overview of the company’s commitment
towards social issues related to the company’s employees,
and chiefly towards health and safety, diversity, and
employee involvement. More specifically, the evaluation
process examines whether the company has implemented
policies and management systems to ensure the respect of
core ILO conventions (forced and child labor, freedom of
association, right to organize, discrimination). Issues such
as health and safety of employees, training and
employability employee ownership, and profit-sharing are
also taken into account in the evaluation process.
Particular attention is paid to the health and safety records
relative to industry counterparts, the quality of relations
with unionized workers, and legal actions related to
discrimination in the workplace or employment equity
issues.
Working conditions
Terms of employment
Working environment
Industrial relations
Employee
involvement/participation
Source: SiRi Research Framework (2006), SiRi internal documents.