unpacking team dynamics with growth modeling: an approach
TRANSCRIPT

1
Unpacking Team Dynamics with Growth Modeling:
An Approach to Test, Refine and Integrate Theory
Catherine G. Collins
University of New South Wales
Cristina B. Gibson
University of Western Australia
Narda Quigley
Villanova University
Sharon K. Parker
University of Western Australia
Accepted for publication in Organizational Psychology Review, Special Issue on
Team Dynamics

2
Running Head: Unpacking Team Dynamics with Growth Modeling
Abstract
In this paper we advocate the use of growth modeling as an approach that is particularly
useful for testing and refining existing theory on team dynamics, as well as integrating
different theoretical perspectives. Quantitative studies that test team theories have typically
included only one or two time points, between-team research designs, and hierarchical
regression-based statistical analyses. Such an approach enables exploration of antecedents to
explain why some teams are more effective than others at specified points in the team task or
lifespan. In contrast, using three or more time points of data and applying growth modeling
statistical analyses is atypical, but can allow for informative investigations of team
trajectories, or patterns of change within teams. We argue that this approach can facilitate
fruitful insights about team dynamics, and we provide guidelines for researchers as to how to
investigate such team dynamics using growth modeling.
Keywords: Team dynamics; team development; team change; team trajectories;
growth modeling; time; latent growth modeling, growth mixture modeling.
3
Unpacking Team Dynamics with Growth Modeling:
An Approach to Test, Refine and Integrate Theory
Team dynamics – or changing relationships in team-level phenomena (Cronin,
Weingart, & Todorova, 2011; McGrath, Arrow, & Berdahl, 2000) – have been theorized
about for decades (e.g., Bennis & Shepard, 1956). This theorizing has included, but is not
limited to, feedback loops (e.g., Ilgen, Hollenbeck, Johnson & Jundt, 2005; McGrath, 1964),
movement between stages or phases as teams mature and develop (e.g., Kozlowski, Gully,
Nason, & Smith, 1999; Tuckman, 1965), and fluctuations in team outcomes driven by
environmental contingencies (e.g., Poole, 1983; Zellmer-Bruhn, Waller, & Ancona, 2004;
Gibson & Dibble, 2013). Many new models of team dynamics have been developed, but less
often have existing theories been empirically tested, refined, or integrated. For example, over
40 years ago Hill and Gruner (1973) noted that there were more than 100 theories about how
dynamics develop in small groups. The problem of untested team theories has proliferated
since that time; Salas, Stagl, Burke and Goodwin (2007) identified that since the early 1980s,
138 team effectiveness models and frameworks have been proposed.
Unfortunately, the amount of empirical evidence on team dynamics has not
experienced the same proliferation, especially longitudinal research needed to understand
teams as dynamic entities (Kozlowski & Bell, 2003). For example, between 1990 and 2001,
only twelve percent of the quantitative team articles published in Journal of Applied
Psychology (JAP), Personnel Psychology and Organizational Behavior and Human Decision
Processes (OBHDP) investigated the team effectiveness input-process-outcome (I-P-O) or
input-mediator-output-input (IMOI) models (Ilgen et al., 2005) using a panel or longitudinal
design (Harrison, Mohammed, McGrath, Florey, & Vanderstoep, 2003). When investigated
across a broader range of top management journals more recently (Academy of Management

4
Journal, Academy of Management Review, Administrative Science Quarterly, JAP, OBHDP,
and Organization Science) the proportions are a little more favorable, but still suggest room
for improvement, with 26 percent of the empirical team studies being longitudinal (Cronin et
al., 2011). Looking more closely, these estimates should be considered generous. Studies
were included if the research design had two time points. With two time points, only a linear
trend can be identified (Chan, 1998). As we will show, exploring teams with three or more
time points allows the opportunity to address additional substantive questions, such as
whether the change is sustained, and whether there are non-linear dynamics, including
inflection or turning points in the pattern of change.
The aim of this paper is to discuss the use of growth modeling for empirically testing
team theories. Specifically, growth modeling provides an analytical tool for testing, refining
and integrating existing theory on team dynamics by juxtaposing alternative theoretical
perspectives about change (i.e., when does linear and non-linear change emerge), and points
of change (e.g., the outset of working together, the rate of change and transition points). Our
goal is to provide a clear set of steps to integrate growth modeling to study team dynamics.
Although growth modeling statistics have been around for some time (Meredith & Tisak,
1990; Muthen, 1991; Stoolmiller, 1994; Willett & Sayer, 1996), including application in
developmental psychology (McArdle & Epstein, 1987), the analytic technique has only been
applied in management scholarship relatively recently (e.g., Ployhart & Hakel, 1998), and is
considered an underutilized tool in management research (Ployhart & Vandenberg, 2010)
especially with respect to teams (Mathieu, Maynard, Rapp, & Gilson, 2008). Indeed, there are
only a few recent publications employing this statistical technique to understand team
dynamics (Davison, Mishra, Bing, & Frink, 2014; Dierdorff, Bell, & Beelohlav, 2011; Hill,

5
Stoeber, Brown, & Appleton, 2014; Li & Roe, 2012; Mathieu & Rapp, 2009; Mathieu &
Schulze, 2006; Quigley, 2013).
More specifically, growth modeling investigates trajectories, the pattern of change in
a construct that emerges for a team over three or more time points (Mathieu & Rapp, 2009).
These trajectories can track team processes (e.g., transition, action, or interpersonal
processes) and/or team outcomes (e.g., performance, team satisfaction) (Dierdorff et al.,
2011; Mathieu & Rapp, 2009; Mathieu & Schulze, 2006; McGrath et al., 2000). Trajectories
focus on the research question ‘what is the direction and shape of change?’ over a task, event,
or longer timeframe such as the team lifespan. For example, do trajectories spiral upward or
downward? And is this change linear or a more complex non-linear change?
Growth modeling investigates two types of trajectories. First are observed trajectories,
or the pattern of change a specific team experiences in the construct of interest (team
processes, performance, etc.). Second are latent trajectories, or the average experiences across
all teams in the population; teams in a population may experience the same overarching latent
trajectory, or alternatively there may be sub-populations with multiple different latent
trajectories. Considering these two types of trajectories allows us to examine whether all
teams undergo the same change pattern, whether there are sub-populations of change, and
what may be instigating the changes in trajectories. Scholars have theorized about many of
these non-linear team dynamics (e.g., Gersick, 1988; Kozlowski et al., 1999; Marks, Mathieu
& Zaccaro, 2001). Empirical work has investigated these frameworks (e.g., for a review and
meta-analysis of the Marks et al. framework, see LePine, Piccolo, Jackson, Mathieu, & Saul,
2008), albeit most of this research has been cross-sectional designs or with two time points,
neither of which captures the sophisticated dynamics these theories have espoused. For
example, some of our thinking about team dynamics has been dominated by metaphors (e.g.,
6
forming – storming – norming – performing; Tuckman, 1965). Descriptive theorizing is not
falsifiable (Mitchell & James, 2001; Pitariu & Ployhart, 2010; Ployhart & Vandenberg,
2010), thus restricting our capability to identify ways to develop and improve team dynamics.
Exploring team dynamics in a growth modeling framework enables theorizing about teams to
be more complex by being more precise about how time is involved in our theories. As
Popper (1959) argues, it is through introducing more complex theory and subjecting it to
empirical verification and falsification, that science grows and develops (Mitchell & James,
2001).
Growth modeling can contribute to the team dynamics literature by providing a more
accurate testing of relationships between multiple dynamic variables. Increasingly
organizational researchers acknowledge that, for many phenomena, more is not necessarily
better, or perhaps is only better up to a point (Grant, 2013). For instance, positive outcomes
(and positive change) might be difficult, if not impossible to sustain over the longer term,
especially unwavering, positive, linear change. Team phenomena maybe more likely to
unfold in non-linear trajectories. Non-linear team patterns could include Hackman’s (1990, p.
481) suggestion that teams develop spirals in which teams’ experiences become self-
reinforcing, “the rich get richer and the poor get poorer.” Alternatively non-linear team
trajectories may emerge when members learn, which may be reflected in a stagnation of team
effectiveness, after which effectiveness propels forward. Such non-linear relationships have
been suggested in studies using cross-sectional data on teams (e.g., Gibson & Dibble, 2013),
but these cross-sectional approaches are limited, saying little about change patterns. The
framework and methods we propose in the current paper enable asking, and assessing
questions such as ‘what is the shape of the team trajectory – that is, does the team phenomena
unfold in a linear or non-linear manner?’ More specifically, ‘shape’ reflects both the direction

7
(i.e., positive, flat, negative, or for non-linear shapes a combination of these directions) and
magnitude (i.e., whether the variable is high or low on, say, a five point Likert scale) of
change. Knowing the shape of change is a precursor to unravelling dynamic interrelationships
between two or more team processes (e.g., transition, action or interpersonal processes)
and/or outcomes (e.g., performance, team satisfaction) over time. Recent team research has
demonstrated that such dynamics within a variable as well as with interrelationships between
variables is common, even in contexts that are not volatile (Cordery, Morrison, Wright, &
Wall, 2010; Mathieu & Rapp, 2009; Cordery, Cripps, Gibson, Soo, Kirkman, & Mathieu,
2014). If there is non-linear shape in one variable, then interrelationships between variables
will be complex and research designs that are cross-sectional or with two time points will
provide an inaccurate abstraction of reality (Mitchell & James, 2001).
To summarize, we argue that the teams literature—specifically that which focuses on
dynamics—would greatly benefit from more studies that adopt a growth modeling approach.
We aim to support this direction in our current paper by taking familiar team theories and
cross-sectional empirical research that tests them, then showing how growth modeling could
be applied to finesse and enhance our understanding of these theories. The paper is divided
into three sections. First, we provide an illustration. Drawing on theory about efficacy spirals,
we explain the different theoretical questions that can be tested when using hierarchical
regression, cross-lagged structural equation modeling, and growth modeling. Second, we
provide a ‘how to’ guide for implementing growth modeling in team dynamics research. We
identify key theoretical, design, statistical and logistical decisions for team researchers when
implementing this approach. In the third section, we discuss possible boundaries with respect
to what theoretical perspectives might and might not be fruitful for the growth modeling
8
approach to understanding team dynamics. Throughout the paper, we provide examples of
research questions that could benefit from the application of the growth modeling approach.
An Illustration: Comparing Growth Modeling with Typical Statistical
Approaches
Suppose we are interested in advancing theory on team efficacy spirals (Lindsley,
Brass, & Thomas, 1995) and have collected three data points for team efficacy and team
performance in a repeated measures research design. Data are from a sales organization that
conducts a quarterly assessment of employee morale using a short team efficacy survey. The
average team efficacy over the three quarters changes on a 5-point Likert scale from 3.5, to
2.5, and then to 3.8. The dependent variable is quarterly team gross profit. How might we
model change in the team efficacy – team performance relationships?
With regression and cross-lagged structural equation modeling (SEM), the more
traditional statistical approaches to examining change, the research question would likely
focus on whether higher levels of team efficacy lead to improved performance, or vice versa,
at different stages of the team task / lifecycle. Researchers could conduct analyses to test the
antecedent—team efficacy at discrete points in time (e.g., the quarterly team efficacy
measure), or between two points in time (e.g., change in team efficacy between quarter one
and two), predicting change in team performance/profit. The dependent variable, change in
team performance/profit, could be operationalized by controlling for gross profit prior to
quarter 1 and considering gross profit after quarter 3 as the dependent variable.
With the typical regression approach, change between each time point is the focus
(e.g., from time one to two in team efficacy, then from time two to three in team efficacy).
More specifically, in hierarchical regression, each independent variable (in this case team
efficacy), is entered into separate steps. The second and third steps become effectively a

9
change score, predicting the dependent variable of profit. So at step 2, time two efficacy
captures the change between times one and two, predicting profit. Similarly, in step 3, time
three team efficacy captures the change between time two and three, predicting profit.
For cross-lagged structural equation modeling (SEM), four sets of relationships are
typically modelled. First are those assessing stability, relationships between times one, two,
and three for team efficacy, and relationships between time one, two, and three for team
performance. Second are the cross-sectional relationships; relationships between time one
team efficacy and team performance, then the same at times two and three. Third are the
lagged relationships from team efficacy predicting performance (i.e., time one team efficacy
predicting time two performance, and time two efficacy predicting time three performance).
Fourth are the lagged relationships from performance predicting team efficacy (i.e., time one
performance predicting time two team efficacy, and time two performance predicting time
three team efficacy). Sometimes in steps three and four, the longer-term lagged relationships
are also of interest, in this case time one team efficacy predicting time three performance, and
vice versa. Steps three and four are of the most interest because they enable an assessment of
whether the stronger relationship is team efficacy predicting team performance, or vice versa,
as well as whether this relationship changes over time.
Both of the above approaches provide insights into the emergence and development of
team dynamics, albeit in a limited way because the focus is on why teams differ at set points
in the team task / lifespan, or in short windows of change between two points in time. As a
result, the research questions are typically whether independent variables such as team
processes that unfold early in the team task or lifespan, predict later team effectiveness, or
vice versa.

10
To investigate how teams regulate their dynamic processes, however, the pattern of
change is of interest (i.e., linear/non-linear, increasing/decreasing); this is the focus in growth
modeling, which takes a repeated measures research design with three or more time points,
then appropriately separates within team, between team, and error variance. With growth
modeling, the initial focus is on identifying a ‘latent’ (or average) trajectory. In the example
sales teams, the team efficacy data points of 3.5 at time one, 2.5 at time two, and then 3.8 at
time three across all teams suggests a significant quadratic trend between times one and three.
Perhaps this quadratic trend is also obtained in team performance, albeit in the quarter
following each team efficacy measurement. The next step in growth modeling is the
determination of whether this average trend reflects the change in all sales teams or whether
there is variation around this trend. There might be only one population, with all teams
generally going through this quadratic journey, albeit with some variation between each
team’s trajectory (i.e., some teams higher and some lower than the latent trajectory).
Alternatively, there may be two subpopulations of sales teams with the sample, each with a
different latent trajectory: a quadratic trend for one subpopulation, and a gradual positive
linear trend for the other subpopulation. If there is variation around the average trend of the
independent and dependent variables, in this case team efficacy and team performance, then
how the change in these two variables are related, whether they co-vary, can be investigated.
Put another way, does the change in team efficacy predict change in team gross profit
performance, and/or vice versa, does the change in team gross profit performance predict
change in team efficacy?
Thus growth modeling can provide more sensitive and richer information than
analyzing the change between two points or aggregating data over time (Mathieu & Rapp,
2009). This point was empirically illustrated by Mathieu and Schulze (2006), who compared

11
a conventional regression approach which averaged multiple time points with results from
growth modeling. The growth modeling approach picked up mediation and moderation
effects that the conventional approach did not (Mathieu & Schulze, 2006). Other studies
utilizing growth models have sought to understand why some teams have a faster rate of
increase in team performance than others (i.e., Dierdorff et al., 2011; Hill et al., 2014;
Mathieu & Rapp, 2009), and researchers have drawn from the literature on individual
differences (Hill et al., 2014), team processes (Dierdorff et al., 2011), and team development
(Mathieu & Rapp, 2009) for theoretical explanations as to why teams experience linear or
non-linear trajectories. However, it should be noted that most typical growth models assume
that all teams come from the same population, so have the same latent (or average) trajectory,
albeit with some variation around this trajectory. This assumption that all teams come from
the same population might, in some situations, limit theorizing. As we elaborate below, even
teams embedded in the same context, such as a single organization, might have very different
team trajectories. A more complex variant of growth modeling, referred to as growth mixture
modeling (GMM), enables different latent trajectories to be investigated in the same
population (Wang & Bodner, 2007).
Applying Growth Modeling to Understand Team Dynamics
Detailed and helpful accounts of how to apply growth modeling to management and
organizational behavior research already exist (e.g., Bliese & Ployhart, 2002; Ployhart, Holtz,
& Bliese, 2002). Our focus here is on explicating how growth modeling can be used to
advance theory on team dynamics in particular. Our aim is to help make this analytic
technique more accessible to team researchers. To that end, we provide a five step ‘how to’
guide to support researchers who seek to implement growth modeling into their research
programs on team dynamics.
12
Step 1: Identify When Growth Modeling of Team Dynamics is Appropriate
Collecting team data is difficult and labor intensive (Arrow, Poole, Henry, Wheelan,
& Moreland, 2004), and that is before even considering collecting repeated measures of team
data over three or more time points, a requirement for growth modeling. Therefore, it is
important to think about when it is most critical to extend valuable research resources to
understand team dynamics using growth modeling.
An extreme argument is that studying team dynamics with growth modeling is always
relevant to implement, no matter what the team research question is. For example, Mitchell
and James (2001) argue that to understand team statics, we need to test for team dynamics.
That is, one cannot argue that a phenomena is static without supporting evidence. A fine-
grained approach to longitudinal data analysis with growth modeling provides this insight,
whether the team phenomena are static or dynamic. The level of detail that the growth
modeling approach provides is without question a major strength of the technique, but
practical considerations with respect to access to an appropriate sample of teams and the
logistics of data collection over time may outweigh the benefits.
A more moderate (and practical) view is that studying team dynamics with growth
modeling is most appropriate when we want to know about how a team construct, or
relationships between constructs, changes over time. There are a variety of theoretical
perspectives that propose such team dynamics; we provide some illustrations in Table 1.
----------------------------------------------------------------------------------------------
Table 1 about here
----------------------------------------------------------------------------------------------
For example, growth modeling certainly helps us understand where teams start out,
addressing such questions as ‘when teams start working together for the first time, are they

13
experiencing similar levels of the variable, or are they starting from a different point?’ This
can be an interesting question, but it is one that can be addressed using simple cross-sectional
comparisons. Growth modeling adds value when we have a theory that teams change in some
systematic way. So growth modeling would be beneficial to understand whether initial
conditions in teams have a lasting impact on team dynamics and outcomes, such as do the
good teams get better, and bad teams get worse (Hackman, 1990)? (see Table 1, row A).
A core question with growth modeling concerns “looking at the team population of
interest, as a whole (or ‘on average’), is there any coherent pattern to how teams change?”
(see Table 1, row B). Or, in fact, is team change totally random and unpredictable, fluctuation
rather than anything more? As we elaborate in subsequent sections, if the answer to this core
question is ‘yes, there is a pattern’ or ‘yes, there are sub-populations with different patterns’,
then we will want a theory for these patterns, that is, how teams change over time, including
the nature and shape of the trajectory / trajectories. Team development theories postulate
different patterns, such as dips, increases (Tuckman & Jensen, 1977) and punctuated
equilibriums (Gersick, 1988).
Then, moving beyond theorizing about teams ‘on average’, we might have a theory
that not all teams change in the same way (see Table 1, row C); this is what team contingency
theories advocate (e.g., Kozlowski et al., 1999; Lindsley et al., 1995; McGrath, 1991; Poole,
1983). Maybe some teams decline in their communication and effectiveness, but some teams
do not. Of course then we might want to understand what causes such team variation. One
might theorize and test different antecedents of variation in team change, such as team size or
team composition (Mathieu, Tannenbaum, Donsbach, & Alliger, 2013). One might even loop
back to the first question we raised about starting points (are teams starting from a different
point?) and ask “do teams who start out differently also change differently?” Perhaps the

14
teams that do not decline in communication and effectiveness are those that already had in
place some minimum level communication processes at the outset of working together?
What comes into particular focus with growth modeling is seeking to understand
multiple variables of interest, including how they inter-relate (see Table 1, row D). So we will
likely to be interested in whether the variables change in the same way, as well as whether
these change trajectories relate to each other. For example, is the change in team processes
related in any systematic way to changes in team outcomes? Perhaps deterioration in team
communication systematically co-varies with later decline in effectiveness. Episodic models
of team effectiveness (Marks et al., 2001) will assist to postulate hypotheses for such
relationships. One can then progress to more complex questions, such as from learning theory
(Edmondson, Dillon & Roloff, 2007), which explores, does double loop learning change the
direction of a team effectiveness trajectory, a change in the direction of change? (See Table
1, row E).
In essence, our contention is that growth modeling will be useful whenever one wants
to develop a more precise understanding of team dynamics. Existing theory may be able to
explain some of these changes. Growth modeling then provides precise language about when
things occur; using this in conjunction with existing team theory will highlight important
gaps in our theorizing about dynamics. Put another way, growth modeling helps us refine
existing theory by identifying holes—it allows us to think about team dynamics over time in
a way that is different, and therefore maybe conducive to some creative theory development.
For example, growth modeling can simultaneously test the different theoretical perspectives
of team dynamics outlined in Table 1, providing a tool for researchers to compare, contrast
and perhaps integrate these theoretical perspectives that are typically explored distinctly (e.g.,

15
Why are there multiple latent trajectories and also variation around these latent trajectories?
What predicts these different forms of change?).
In sum, we suggest that growth modeling will be most important when there is real
(not random) change in teams and existing theory has not been tested dynamically. The
language of this analytic technique that focuses on change and time facilitates more precise
theorizing, and a framework to justify why different theoretical perspectives to understand
change can be investigated simultaneously. We turn to this language next.
Step 2: Use Growth Modeling Concepts to Support Precise Theorizing About Team
Dynamics
If researchers deem the growth modeling approach is conducive to the type of
questions being asked in a given study, a second step is to refine the theorizing in the study
utilizing concepts from this approach. Historically the team development literature has
primarily utilized typologies and metaphors to explain temporal issues in teams (Kirton,
Okhuysen, & Waller, 2004). Such an approach is beneficial for understanding complex,
dynamic environments from multiple perspectives (Conger, 1998); however more precision
about when events occur and explanations of why these change processes occur is necessary
for falsifiable hypotheses (Mitchell & James, 2001; Pitariu & Ployhart, 2010; Ployhart &
Vandenberg, 2010). Drawing upon language and concepts about temporal change from
growth modeling provides a tool to write more precise predictions that refine and extend
theory through empirical hypothesis testing. Statistical concepts have brought precision to our
knowledge in other areas of organizational behavior, such as leadership, by revealing that
previous methodologies had inherent flaws (Monge, 1990).
More specifically, three concepts from growth modeling provide important and
interesting theoretical questions for investigating change: is there one or more latent

16
trajectory/trajectories; does the latent trajectory/trajectories have heterogeneity; and is there a
specific influential change point. Next we demonstrate how these concepts from growth
modeling enable testing theoretical questions about team dynamics.
2a. Identify whether there is one or more latent trajectories that capture shape of team
dynamics
As explained earlier, latent trajectories in the team dynamic construct of interest
provide a description of the average shape – information about the direction of the linear or
non-linear change – for the population of teams being investigated; this may be over a task or
lifecycle. One or more latent trajectories may be theorized to exist within a population. In the
scenario where multiple latent trajectories are theorized, there are sub-populations that
change in different ways; statistically speaking there are latent classes of trajectories.
Predictors can be used to investigate why a team emerges within one class rather than
another.
There are two interconnected defining features of latent trajectories – direction and
shape – which are not necessarily mutually exclusive. The overall direction of change
concerns whether the trajectory slope is generally increasing, decreasing or flat. Direction of
change is fundamental to the typical analytical tools such as regression and cross-lagged
SEM. The difference with growth modeling is that the direction of change is sustained over
three or more time points, and multiple trajectories can be investigated in the same data. As
we explain later, three time points is needed to define a change trend.
Shape reflects the pattern of change or functional form of the trajectory over time.
This is a statistical change concept not typically considered in regression1 and cross-lagged
SEM. Examining the shape of the team trajectory provides additional information about the
team’s change; ‘is it a smooth or bumpy?’, and ‘when do bumps occur?’ At a basic level,

17
shape is concerned with whether the change is linear or non-linear. Linear patterns are the
most simplistic, reflecting a monotonic trend that is irreversible. In other words, there are no
changes in the direction and no changes in the rate of change. Linear change has been
proposed in several reviews of the team development literature (Arrow, 1997; Chang, 2001;
Mennecke, Hoffer, & Wynne, 1992), which argue that teams progress at a steady and
consistent pace through a series of phases or stages. Non-linear shapes have also been noted
in the team dynamics literature, including cubic (Gersick, 1988; Lindsley et al., 1995) and
quadratic (Feltz & Lirgg, 1998) shapes. For these non-linear shapes, the slope is not
consistent. In other words, there is a ‘change in change’ (Poole, 1983); this could be a change
in either the speed (e.g., a positive slow rate of change that shifts into a faster rate of change)
and/or a change in the direction (e.g., from a negative to a positive direction of change).
Figure 1 illustrates how these features of direction and shape in latent trajectories can
combine to create different types of latent trajectories. Next we provide some illustrative
theoretical angles for these three examples in Figure 1.
---------------------------------------------------------------------------------------------
Figure 1a-c about here
---------------------------------------------------------------------------------------------
Figure 1a illustrates upward trajectories. Upward latent trajectories have a positive
slope; these may be linear or non-linear in shape such as, for example, a cubic S-shaped bend.
Such upward trajectories are the most commonly proposed trajectories in the team change
literature, from a variety of different theoretical perspectives, including motivation (e.g.,
Lindsley et al., 1995), learning (for a review see Edmondson et al., 2007), and maturity (e.g.,
Tuckman, 1965). Although some team development theories identify positive linear
trajectories (Hill & Gruner, 1973), such smooth linear upward trajectories are likely to be rare

18
since many scholars argue that sustaining ongoing increases in team effectiveness (or any
other team phenomenon) is difficult. For example, research on interpersonal processes
highlights that the cognitive conflict needed for innovation in teams is highly correlated with
interpersonal conflict, which in turn detracts from team effectiveness (DeDreu & Weingart,
2003). Furthermore, the literature on team learning curves highlights that team performance
often plateaus (Adler, 1990; Darr, Argote, & Epple, 1995; Pisano, Bohmer, & Edmondson,
2001). In addition to the complexity of managing the multiple factors necessary to maintain
positive trajectories of team effectiveness, teams with steadily increasing performance may
also be subject to the overconfidence bias, creating cognitive and emotional challenges (Gist,
1987; Lindsley et al., 1995).
What we already know from the theoretical and empirical literature summarized
above is that the factors listed here – motivation, learning, maturity, and cognitive conflict –
often lead to positive increases in team effectiveness. However, the implications for
sustaining team dynamics over time – such as the trajectory of team effectiveness – have yet
to be considered. Put another way, what do these antecedents do for the team’s journey over
the course of a task, multiple tasks, and/or the team lifespan? Considering the tenants of
learning theory, utilizing a growth modeling perspective can shed additional light on potential
trajectories. For example, the literature on collective cognition indicates that exploration is
not expected to be smooth, but rather is expected to contain errors, from which the team
learns (Gibson, 2001). As a result, team effectiveness may contain periods of stagnation, as
well as dramatic shifts in insights that propel improvement, resulting in an upward trajectory
in team effectiveness. This line of theorizing would suggest a cubic trajectory. More specific
theorizing would be needed taking into account the timescale, team context, and variables of
interest (see research design considerations in step 3 for more details).

19
Figure 1b illustrates downward trajectories. Downward trajectories have an overall
negative direction. Much of the teams literature indicates that such trends occur due to
context in which teams are embedded (e.g., see Maloney, Zellmer-Bruhn, & Bresman, 2014
for a review). For example, when teams have little in the way of overarching organizational
structure, they are self-managed teams with large amounts of autonomy. Whilst autonomy
has generally been identified as a positive antecedent for team effectiveness (e.g., Cordery,
Mueller & Smith, 1991), some research has identified how autonomy can – in particular
circumstances – interact with dysfunctional dynamics, resulting in teams getting into a
negative non-correcting spiral. For example, Morgeson (2005) considered when external
leaders of self-managing teams should intervene in the team’s processes; he concluded that in
novel, complex and disruptive situations, teams need more external leadership (and hence
less autonomy). With little or no structure, teams have difficulty learning, and effectiveness is
likely to decline (Gibson & Vermeulen, 2003). Typically, teams learn and entrain to
externally imposed goals and deadlines (Ancona & Chong, 1996; Kirton et al., 2004;
McGrath & Rotchford, 1983), so teams without these structures can find themselves in a
weak situation in which they are highly susceptible to interpersonal conflict (Felps, Mitchell,
& Byington, 2006) that decreases team effectiveness (Behfar, Peterson, Mannix, & Trochim,
2008). In such situations, a ‘downward spiral’ might occur, and this can be empirically
demonstrated with growth modeling.
Figure 1c illustrates flat trajectories. The teams literature suggests that flat trajectories
may be relatively common among work teams because the status quo has such pull within
these open systems. In any kind of open system like a work team, sustained change is
difficult, due to the fact that systems are self-correcting through feedback (Katz & Kahn,
1966). Indeed, as Kozlowski and Klein (2000, p. 6) noted, open systems import “energy and

20
information from the external environment [and] transform… it to maintain homeostasis.”
From this classic general systems theory perspective, the status quo may actually be difficult
to change, resulting in the flat trajectory of team effectiveness.
These three latent trajectories – upward, downward, and flat – potentially occur in
different environments. For example, as inferred above, positive latent trajectories may be
more likely in supportive work environments such as those identified as “best employers.”
Negative latent trajectories may be more likely when teams have the combination of working
in a highly autonomous environment, but are not embedded in a supportive organization
context (e.g., perhaps consisting of independent actors). These teams may have a
dysfunctional dynamic, such that organizational structure, goals or deadlines are unable to
pull these teams from their slump, as was the case among loosely configured documentary
film making teams (Gibson & Dibble, 2013). Flat trajectories may be more likely in complex
environments, such as hospitals, where change is difficult and path dependence constrains
teams. Though these three trajectories might also emerge in the same organizational setting;
for example, team-level regulation such as efficacy and affect might create sub-populations
of teams with very different latent trajectories. All of these dynamics can be examined and
tested empirically with growth modeling.
Discussion to this point has focused on latent trajectories, averages that represent a
population or a sub-population of teams. The next important research question that can be
addressed with growth modeling is whether all teams in the population being investigated
follow this trajectory, or classes of trajectories.
2b. Identify whether there is significant heterogeneity around the latent trajectory /
trajectories
21
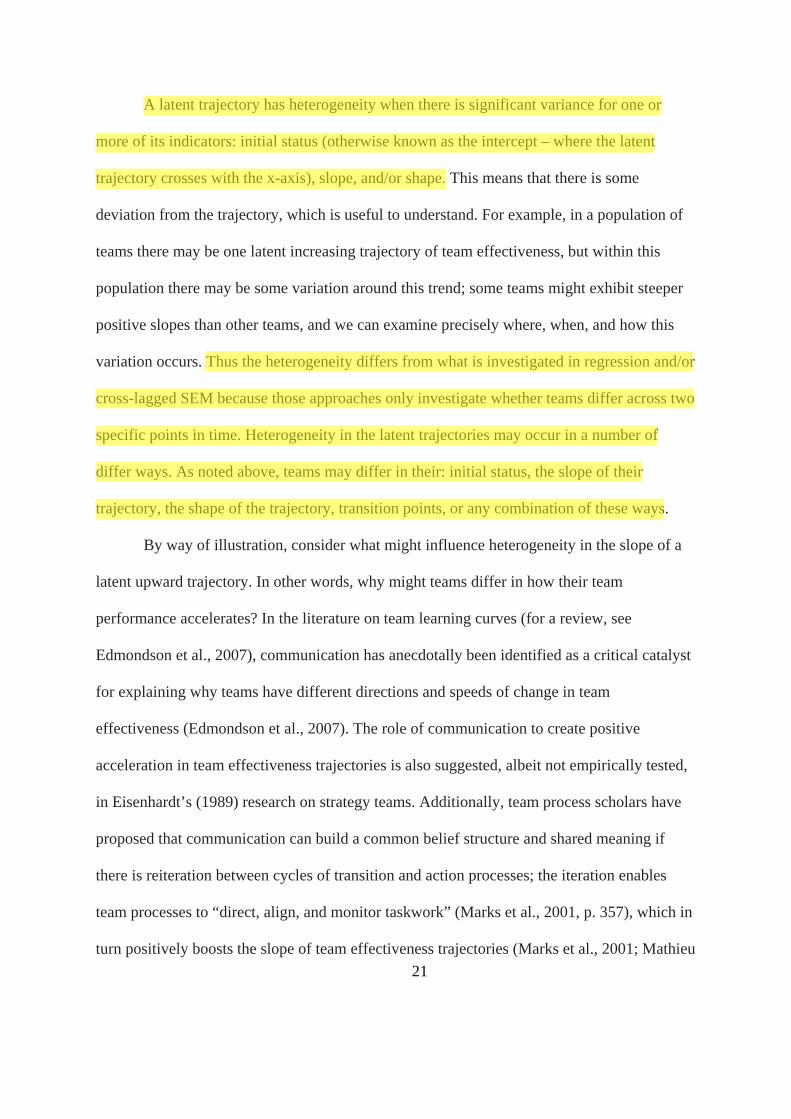
A latent trajectory has heterogeneity when there is significant variance for one or
more of its indicators: initial status (otherwise known as the intercept – where the latent
trajectory crosses with the x-axis), slope, and/or shape. This means that there is some
deviation from the trajectory, which is useful to understand. For example, in a population of
teams there may be one latent increasing trajectory of team effectiveness, but within this
population there may be some variation around this trend; some teams might exhibit steeper
positive slopes than other teams, and we can examine precisely where, when, and how this
variation occurs. Thus the heterogeneity differs from what is investigated in regression and/or
cross-lagged SEM because those approaches only investigate whether teams differ across two
specific points in time. Heterogeneity in the latent trajectories may occur in a number of
differ ways. As noted above, teams may differ in their: initial status, the slope of their
trajectory, the shape of the trajectory, transition points, or any combination of these ways.
By way of illustration, consider what might influence heterogeneity in the slope of a
latent upward trajectory. In other words, why might teams differ in how their team
performance accelerates? In the literature on team learning curves (for a review, see
Edmondson et al., 2007), communication has anecdotally been identified as a critical catalyst
for explaining why teams have different directions and speeds of change in team
effectiveness (Edmondson et al., 2007). The role of communication to create positive
acceleration in team effectiveness trajectories is also suggested, albeit not empirically tested,
in Eisenhardt’s (1989) research on strategy teams. Additionally, team process scholars have
proposed that communication can build a common belief structure and shared meaning if
there is reiteration between cycles of transition and action processes; the iteration enables
team processes to “direct, align, and monitor taskwork” (Marks et al., 2001, p. 357), which in
turn positively boosts the slope of team effectiveness trajectories (Marks et al., 2001; Mathieu

22
& Rapp, 2009). Reflective communication also involves conflict resolution (Behfar et al.,
2008; Marks et al., 2001). Specifically, an equity approach to conflict resolution which
involves “finding an appropriate (not necessarily equal) way for all members to contribute
given their constraints …both a concern for their task and a concern for integrating the
interests of individual members” (Behfar et al., 2008, p. 182) results in increasing and
consistently high performance, as well as satisfaction amongst team members. Yet to our
knowledge, scholars have not investigated communication as a driver of accelerated positive
change. As we have discussed here, by modeling communication as a predictor of the slope
in team effectiveness trajectories, one could empirically investigate this possibility with
growth modeling.
2c. Identify, if appropriate, specific change points of theoretical interest
After considering the latent trajectory and its heterogeneity, more specific points of
change might be of interest. In particular, growth modeling provides a way to assess two
specific change points that other analytical tools are not capable of: transition points, and the
correlation between the initial status and slope.
A common feature among non-linear trajectories is that there is a specific point where
non-linearity starts. Specifically, it could be a change in speed (see Figure 2a), or change in
direction (see Figure 2b). The term we use to refer to these ‘change in changes’ or
discontinuity between phases is transition points. This term suggests a change, whilst also
capturing the team process behaviors that Marks and colleagues (2001) advocate for creating
such change (mission analysis, formulation, and planning; goal specification; and strategy
formulation). Theoretically, identifying transition points and their antecedents is important
because it suggests that the process underlying change has altered—that it is dynamic, rather
than static.

23
A positive transition point refers to the situation where the discontinuity between
phases involves enhanced team dynamics. Positive transition points can occur as some teams
self-correct through psychological processes (e.g., motivation, learning), act on cues in the
external environment (e.g., feedback), or alternatively there might be organizational
interventions that instigate such change (e.g., training, work redesign). A variety of
theoretical perspectives might explain these journeys. Gersick’s (1988) punctuated
equilibrium theory in temporary work teams serves as one good example. The theory
suggests that teams exhibit low levels of activity until the midpoint of their lifespan, when
team members’ concerns about the passage of time and performance expectations drive a
regrouping, planning, and implementation process in preparation for the second half of the
team’s lifespan. Quigley (2013), in a growth modeling-based examination of how individual-
level leadership efficacy and team–level dispersion in leadership efficacy change over time,
argued that Gersick’s theory provides good rationale for why teams would pay careful
attention to feedback received at the midpoint of their lifespans. In her analysis, Quigley
(2013) used midpoint feedback as a main-effect predictor of change in leadership efficacy,
essentially creating another intercept, or starting point, for the second half of teams’ time
together. Mean team performance over time was also used in the analysis as a control
variable in order to account (in part) for the relationship between first-half performance and
midpoint feedback. This illustrates a situation where a theoretical transition point (i.e.,
Gersick’s midpoint) can be modelled in a relatively specific way using growth modeling. The
fact that the midpoint feedback was a significant predictor of leadership efficacy at two levels
of analysis in Quigley’s (2013) findings suggests that the feedback was, indeed, important to
the trajectory of the teams in the sample.

24
Another example involving transition points in speed and direction of a team’s
trajectory can be found in the learning theory literature. Though there is a chance that such a
positive transition point will occur completely spontaneously through unconscious processes,
conscious learning and planning processes are likely to play an important role. For example,
perhaps the depth of learning alters the shape of the transition point. To illustrate, teams that
make efficiency changes, restructuring what they do, are likely to undergo single loop
learning, and might therefore be able to increase their effectiveness more quickly. This type
of process is potentially represented as a change in the speed of improvements. For example,
teams that are already effective might be able to accelerate team effectiveness from a slow to
a fast rate of improvement (see Figure 2a). Whereas teams that undergo radical shifts in
learning, such as via double loop learning (Argyris & Schon, 1978), might have different
dynamics in their team effectiveness, with a change in the direction of their trajectory (a
change in the direction of change). An illustration of radical change might be struggling
teams that, perhaps as a result of a coaching intervention or some other external change, learn
how to work together in a different way (e.g., work reciprocally rather than in pooled
interdependence) in order to move from a negative trend (i.e., decreasing effectiveness) to a
transition point, after which they experience a positive trend (i.e., increasing effectiveness)
(see Figure 2b).
One way to assess transition points is to utilize a specific type of growth model – a
piecewise latent growth model. This has two slopes which connect to create the discontinuity
in the slope. To our knowledge, such a change in trajectory has not yet been documented in
the management literature, although experience tells us that such journeys exist. An exception
is Collins and Gibson (2014), who found that a team work redesign – implementing a
business development manager overseeing a region of teams – provided transformational

25
leadership that bolstered team external learning activities, and in turn created a piecewise
transition point, the intersection of two slopes in different directions, in team performance.
That is, the researchers documented a monumental “turn around” in team performance, as
measured with gross profit, creating a transition point at the time the intervention was
introduced. This novel application of piecewise latent growth models to the team
development literature speaks to the strengths of growth modeling and its potential for
understanding team dynamics. For further examples of piecewise latent growth models, there
are plenty of exemplars in the education and substance abuse literatures (e.g., Chou, Yang,
Pentz, & Hser, 2004; Li, Duncan, & Hops, 2001).
Another specific change point that can be investigated in growth modeling is the
correlation between the initial status (whenever the time one data is collected, for example
during team formation) and slope and/or shape of a trajectory. Although this focus is at first
counterintuitive, investigation of the link between time one and the slope/shape explores
whether there is path dependency in team dynamics. This particular correlation indicates
whether where a team starts out – low or high, perhaps on team effectiveness – influences the
slope / shape of the team trajectory. Hackman’s (1990) team case studies provide an
interesting illustration. He noted that “the rich get richer and the poor get poorer. Groups that
[he observed] somehow got onto a good track tended to perform even better as time passed,
while those that got into difficulty found their problems compounded over time” (pp. 481-2).
However, as discussed earlier, rigorous, quantitative studies that investigate how group
effectiveness changes over the group lifespan are relatively rare; observations such as
Hackman’s remain untested empirically. Growth modeling provides an approach that can
assist in doing so.

26
In this section we have demonstrated how growth modeling concepts support the
identification of precise and testable predictions about team dynamics, including the presence
of latent trajectories, their shape and if heterogeneity surrounds these trajectories, as well as
potentially significant change points. Next, we outline pertinent aspects of research design
that should be considered.
Step 3: Identify a Research Design Appropriate for Growth Modeling Research
Scholars have recently advocated the importance of careful upfront consideration of
research design prior to embarking on research (Aguinis & Vandenberg, 2014). This advice is
especially pertinent when one seeks to investigate team dynamics given the challenges of
collecting nested data (Arrow et al., 2004). As we elaborate next, to support good research
design decisions, researchers need to obtain detailed contextual information so as to
understand what to measure, including the selection of measures and time periods that will be
sensitive to the team dynamics of theoretical interest.
3a. Identify time sensitive measures by understanding the potential constraints from
contextual influences (e.g., the organization and jobs)
Goodman (1979, 1986) found that a psychologically impactful conversation
(analogous to a team level coaching intervention) only had a small positive increase in
mining productivity with self-managed mining teams. Johns (2006) suggested that this
relatively small increase was most likely because organizational resources such as technology
and geology constrained the localized team learning environment. In other words,
organizational and technological contexts might restrain team dynamics; this needs to be
considered at the research design stage. Historically the team literature has had a micro focus
on internal team dynamics (Mathieu et al., 2008), including the team intervention literature
(cf. Shuffler, Diaz Granados & Salas, 2011). However, there is a small yet important body of

27
literature that highlights how team effectiveness is improved by turning teams “inside out”
and intervening by changing the systems, structures and leaders that surround teams (e.g.,
Ancona & Bresman, 2007; Grant, 2011; Morgeson, 2005). Thus it is important for
researchers to, at a minimum, acknowledge how the organizational context would be enabling
or restraining the team dynamics under investigation. This contextual analysis has critical
research design implications, because it identifies where the meaningful variance is likely to
be, and whether this variance is dynamic and changes over time. We recommend that
researchers use interviews and analyze organizational documents to understand what features
of the context might be especially powerful in shaping team dynamics within the specific
situation they are investigating. The purpose is to identify whether the team constructs of
interest are indeed dynamic, or restrained by some higher level, contextual influence.
Some contextual forces might vary across teams, and therefore might best be
conceptualized as antecedents of team dynamics. For example, teams might vary in their
work design (e.g., their level of autonomy) or the specific nature of the work (e.g., the
performance episodes, and the cycles of goal setting, feedback and completion of tasks).
Other contextual factors are important, not so much as antecedents that potentially affect the
theorized team dynamics of interest, but rather as factors that constrain or impact team
dynamics for all teams, and therefore shape the choice of research design. Research design
decisions will be improved if we understand the role of context, because this analysis will
determine if the constructs being investigated have meaningful variance that is dynamic.
Starting with the bottom up processes, a job analysis will enable identification of
aspects in the immediate context that will influence team dynamics. In particular,
performance episodes – cycles of goal setting, feedback and completion of tasks (Marks et
al., 2001) – will impact team effectiveness dynamics. Organizational level influences on

28
teams to investigate include: resources such as levels of organizational support, supply of
potential team members, and training; in addition to organizational structures such as
technology, organizational design (e.g., structure, strategy, reward systems, culture, etc.), and
organizational history (Gladstein, 1984; McGrath et al., 2000; Parker, Wall, & Cordery,
2001). And finally, contextual influences outside the organization also shape team dynamics.
Thus it is also important to cast the net wider to explore whether variables such as the
following constrain or enable the team dynamics phenomena of interest: cultural context
(e.g., values or norms); environmental uncertainty (e.g., market volatility, frequency of
product/service change, etc.); political and labor institutions (e.g., union presence); labor
market (e.g., availability of highly skilled workers); and available technology (e.g., IT
advances that enable changes in tasks) (Gibson, 2003a, 2003b; Parker et al., 2001).
Once the team constructs have been identified and determined as dynamic, a
sufficiently sensitive measure is needed to capture these team dynamics of interest. Malleable
measures will enable the team trajectories to be tracked. For example, sales teams may
change their performance behaviors, such as the number of calls or visits they make to
customers, but sales gross profit percent figures may be constrained by the economic
environment. In this example, team trajectories of sales performance behaviors would capture
the change in team dynamics; team trajectories of gross profit percent may not be sufficiently
sensitive given it is more distal to the dynamics sought to be captured and constrained by the
economic environment. Additionally, gross profit might be more malleable in some
geographic regions than in others if a particular customer base is less impacted by global
economic slumps, or willing to pay more for products (e.g., for engineering products, the
mining sector is willing to pay more than the manufacturing sector). We highlighted these
contextual issues – economic environment and geographic customer differences – as
29
potentially confounding factors, but they could equally be theoretically interesting
antecedents of team dynamics, which could then be incorporated into the growth models.
Thus researchers need to balance identifying a dependent variable that is both
important to the immediate context (e.g., in the academic context, the number of quality
journal publications) and that has a meaningful and realistic timeframe for research (e.g.,
years — rather than days or weeks — to understand a research team’s publication output). In
some situations, more immediate perceptions of effectiveness (e.g., team efficacy, team
behaviors) may serve as appropriate indicators for objective team effectiveness.
3b. Identify the passage of time that is of theoretical interest and practically possible
All research that seeks to understand team dynamics requires selecting a passage of
time that is meaningful; this also applies to the growth modeling methodology. Crafting a
research design that captures theoretically meaningful passages of time requires selecting an
appropriate observation interval – the timing at which measurements (e.g., surveys) are
administered. Observation intervals need to be appropriately spaced as well as sufficient in
number to capture the theoretical phenomena of interest. The selection of observation
intervals is critical, because it is the observations that will reveal the latent team trajectory.
Are observations across hours, days, weeks, months, years, or some other unit? If ill-timed,
observation intervals may obscure the shape of team dynamics. Identifying important events
that define the teamwork episodes, as well as taking into account lag times between task work
and observed changes in the team dynamics of interest, will be critical in selecting
appropriate observation intervals. For example, the amount of time to assess the impact of a
new top management team will wildly differ from tracking team performance in a medical
team.

30
Spacing observation intervals must be aligned with whether the researcher is
interested in team dynamics over a short period of time such as a task or series of tasks, or
longer period of time such as the entire lifespan of the team. The spacing of observation
intervals needs to draw on theoretical knowledge about team performance episodes –
temporal cycles of goal-directed activity that result in performance feedback (e.g., Marks et
al., 2001; Weingert, 1997; Zaheer, Albert, & Zaheer, 1999). For example, if interested in
team dynamics over one task performance episode, observation intervals need to be spread
across the task to include measurement at junctures where change is expected from
performance feedback, capturing the immediate and longer-term change this might instigate.
Understanding the role of deadlines will also be critical (Gersick, 1988). In contrast, for team
dynamics over a lifespan, observation intervals will need to be spread further apart; this wider
lens will skip over more micro dynamics. Team dynamics across a lifespan would look very
different for teams with a single versus multiple performance episodes.
Decisions about spacing observation intervals needs to combine theoretical
knowledge with insights about the industrial and organizational context, which were listed
above. Researchers will need to identify the observation interval that makes most sense for
the team population of interest. For example, dynamics in many workplace teams will be
driven by financial cycles, since that is what instigates goal setting and feedback milestones.
Wider contextual cycles may mean that financial quarters are not equally comparable.
Calendar cycles such as long summer holidays may mean a quieter financial quarter. Industry
cycles will also influence financial quarters; for retail, the Christmas boom and end of
financial year sales are likely to push different team dynamics, whereas other industries, such
as mining, are likely to have longer time horizons than financial quarters. Professional teams
may also have different rhythms. Accounting teams may attune to monthly tax reporting

31
deadlines, whereas for top management teams financial quarters as well as annual budget
cycles are likely to be more salient since goal setting and bonuses flow from feedback with
Boards of Directors at those times. In contrast, for medical employees, nurses and doctors in
wards, much shorter cycles such as a hospital shift are meaningful, because patients’ health is
so volatile, requiring immediate action, and members of the multidisciplinary teams alter
after such cycles.
For the number of observation intervals, to capture team dynamics with growth
modeling, as we have highlighted earlier, a minimum of three time points is necessary (Chan,
1998). However, a larger number of time points is needed for more accurate conclusions
about the shape of change and testing of complicated non-linear trajectories. For example,
four data points will enable testing cubic and quadratic trends, however additional data points
will increase the power of detecting these complexities (Chan, 1998).
All research conclusions are bound to the timing at which measures were taken.
However this point needs emphasizing when theorizing about time comes into focus, such as
with longitudinal research utilizing growth models. Longitudinal research in which the
observation interval does not pick up the dynamics of interest has a fatal flaw. For example,
sales teams are likely to attune to end of the month financial performance goal pressure.
Research in this context would have their team dynamics misrepresented if measures were
only obtained at the beginning of each month. Thus we recommend the collection of
additional data points, where logistically possible, to assure the accuracy of conclusions made
from growth modeling.
Given the serious negative repercussions of missing appropriate observation intervals,
one approach is to space observations more intensively over periods when large changes are
expected in the outcome of interest (e.g., team effectiveness), as well as when the drivers of

32
this change are expected to play out (e.g., team learning processes and organizational
context). For example, research investigating downward spirals (e.g., empirical testing of
Lindsley et al.’s (1995) theory) will require observations for the event that instigates the
downward trajectory, as well as when the spiral is expected to influence team efficacy – team
effectiveness relationships. When teams receive new information about the task (e.g., the
arrival of major feedback, a new task is started) and organization (e.g., new leader or policy
implemented), this is when the context, team efficacy and effectiveness may have the
negative shift. Collecting data before, during and after these junctures of expected change in
the independent and dependent variables will enable falsification of the hypotheses. Although
more observation intervals are better, we recognize the need to be logistically pragmatic; we
recommend identifying the aspects of context surrounding the teams of interest that will have
the most powerful influence on the dynamics being investigated, which should assist in the
decision about when and how many observations to collect.
One important issue about observation intervals for team researchers is whether the
focus is within or between performance episodes. Since goal setting and feedback processes
shift across performance episodes; experience gained from prior performance episodes will
impact future team dynamics. Prior performance episodes are either confounds that need to
be taken into consideration, or a powerful way to extend existing research, exploring whether
theoretical relationships hold over different observation intervals. For example, a comparison
of team trajectories within and between performance episodes would enable exploration of
different time scales — whether dynamics differ across the group task versus the group
lifespan (Chang, Duck, & Bordia, 2003; Waller, Zellmer-Bruhn, & Giambatista, 2002).
For further discussion of observation intervals, refer to the special issue on time in the
Academy of Management Review (2001, 26(4)). Experience sampling research designs will
33
also help provide guidance on the frequency of measurement intervals so as not to exacerbate
the threats to internal validity of sample mortality (e.g., Ohly, Sonnentag, Niessen & Zapf,
2010), an inherent problem in longitudinal research (Arrow et al., 2004).
Step 4: Select Appropriate Growth Modeling Analyses
There are a number of statistical guides about how to conduct growth modeling (e.g.,
Chan, 1998, 2003; Jung & Wickrama, 2008; Ployhardt & Vandenberg, 2010; Singer &
Willett, 2003; Wang & Hanges, 2011). We do not seek to replicate that information here;
rather, we have compiled suggestions that are likely most useful for team scholars, as well as
specific references for navigating the selection of an appropriate growth model to conduct
analysis on team dynamics.
For example, there is an important precursor to conducting growth modeling that is
not typically referred to in the statistical guides (see for exception Chan, 1998). This
precursor is checking that the type of change under investigation pertains to mean level
changes in the response scale, typically a Likert scale. Sometimes this is referred to as alpha
change. To illustrate, if team efficacy trajectories are being investigated, alpha change
focuses on how team efficacy may shift over a month from 3.5, 2.5 and then 3.8 on the 5-
point Likert scale. This statistical assumption – focusing on mean level ‘alpha’ change – is
common in the management literature. For example, regression is only appropriate for alpha
change. However, it is noteworthy that studies in team dynamics which investigate change
across two or three time points typically do not check that alpha change rather than a more
complex form of change is occurring. This is problematic given there is evidence to suggest
that more fundamental forms of change do exist in frequently utilized constructs from the
team effectiveness literature, such as in some measures of team efficacy (Collins & Parker,
2010). Thus it is critical to rule out more fundamental changes in the meaning and calibration
34
of the variables being investigated, referred to as measure invariance, or alternatively beta
and gamma change. Checking this assumption is about ensuring ratings on the response scale
are comparable at each measurement, that they define the same processes, behaviors, or
effectiveness criteria over time.
One can test for alpha change by ruling out other types of change; that is by ruling out
gamma and beta change. Gamma change is when the meaning of the construct changes; this
is ruled out by conducting confirmatory factor analysis, and demonstrating that the same
items load on the construct at each time point. An absence of gamma change is the same
thing as configural invariance. Beta change is when the meaning of the measurement scale
alters over time; this is ruled out by conducting a longitudinal covariance structure model that
compares two nested models, one with the factor loadings freely estimated and the other with
factor loadings constrained to be equal. The second model is nested under the first and a chi-
square statistic is calculated; if not significant, the construct is factorially invariant, indicating
an absence of beta change (Chan, 1998; Golembiewski, Billingsley, & Yeager, 1976).
If gamma and/or beta change emerge, important team dynamics have been identified,
but not the type that can be investigated with growth modeling. Statistically, other methods
need to be applied to understand those more complex forms of change. For examples, see
Vandenberg and Lance (2000) as well as Golembiewski and colleagues (1976) for guidance
on investigation of gamma and beta change. Theoretically, team dynamics are being
measured, though perhaps not the dynamics that were originally set out to be tested. Gamma
and beta change capture recalibrated expectations for the construct of interest, whether team
behavioral and/or effectiveness outcomes. Perhaps double loop learning (Argyris & Schon,
1978; Bateson, 1973), decision making biases such as team polarization (Stoner, 1968),
reference group neglect (Camerer & Lovallo, 1999), or cultural variance in meaning (Gibson

35
& Marcoulides, 1995; Marcoulides et al. 1998) may shed light on understanding these forms
of change.
Detecting gamma or beta change in repeated measures team dynamics data may not
be of theoretical interest. If so, and these more complex forms of change can be identified and
isolated, such as only created by one item, dropping that item, then progressing with
hypotheses about alpha change is a plausible route (for example see Collins & Parker, 2010).
Collins and Parker (2010) also noted that beta change emerged when teams were asked to
make extreme judgments (e.g., team efficacy levels for obtaining high levels of performance).
This suggests growth modeling may be more appropriate for capturing typical team
dynamics, rather than dynamics for extraordinary teams.
Once alpha change has been established as appropriate, growth modeling can proceed.
Table 2 summarizes how the language we discussed in step 2 maps onto different growth
modeling alternatives. Broadly, there are three analytical decisions.
----------------------------------------------------------------------------------------------
Table 2 about here
----------------------------------------------------------------------------------------------
First, the decision is between growth mixture modeling and latent growth modeling.
As seen in Table 2, section A, when multiple latent trajectories (e.g., with different directions
and/or shapes) are expected theoretically, or emerge statistically in the data, growth mixture
modeling (GMM) is necessary. Whereas, if there is one latent trajectory – theoretically and
statistically – then latent growth modeling (LGM) is appropriate, see Table 2, section B;
subsequent analyses for LGM can only predict the variation (if any) around this one latent
trajectory.
36
The second analysis decision for both GMM and LGM is to test and select the
appropriate model based on the principle of parsimony. The list of models for GMM and
LGM are nested, so a variety of fit statistics are used to determine the appropriate model; a
significant chi-square difference test is needed to justify additional complexity (for an
example see Wang, 2007). In the case of GMM the most parsimonious model is the most
restricted model – latent class growth models – in which only the means are allowed to vary;
there is within class homogeneity, no variance. The next most restrictive model is a GMM
where the classes have unique means but similar variance. Table 2 highlights the other more
complex variants of GMM. For LGM, the most parsimonious model is one with no growth, a
flat trajectory with no slope. In LGM models, linear and non-linear functions are then tested.
The third analysis step is to include predictors to understand why there is
heterogeneity in the team trajectories. This step can only proceed if there is variance around
the latent trajectories to predict. For LGMs, predictors can be added for variance in the initial
status, slope, and shape (i.e., if there is a non-linear trend). For GMM, this is more complex
as there are two sources of heterogeneity. One source of heterogeneity is the different latent
trajectory classes. For example, a predictor to explain why three classes emerge: upward,
downward and flat trajectories. A second source of heterogeneity in GMM also exists if there
is variance within these classes. For example, one class may have an upward latent trajectory
of team effectiveness, but still have variance around the upward latent slope such that teams
increase at different rates.
Discussion
Growth modeling provides an analytical tool to test as well as refine theoretical
perspectives on team dynamics. Throughout the paper we have provided exemplars utilizing
perspectives from team dynamics. The core advantage that this analytical approach provides

37
is a capability to understand the shape of dynamics over time. What is the change pattern
teams undergo? By incorporating shape into analysis, two different types of heterogeneity
can be predicted: the latent trajectory/trajectories, as well as variation around this latent
trajectory/trajectories.
A variety of theoretical perspectives such as motivation and learning (Chen & Kanfer,
2006; Marks et al., 2001) has received much attention in prior literature and can be fruitfully
investigated with growth modeling. In particular, growth modeling can assist researchers to
develop theory where there are currently holes in our understanding—it allows us to think
about team dynamics over time in a way that is different, and therefore maybe conducive to
some creative theory refinement. In our discussion of antecedents to team dynamics we have
encouraged future research to take a contextualized, systems perspective; that teams are
entrained by organizational systems and task cycles. Combining the bottom-up (e.g., team
development) and top-down (e.g., systems) theoretical perspectives will be critical for team
dynamics to be thoroughly understood.
Given the variety of ways growth modeling can empirically test change, this statistical
tool is also well placed to empirically compare, contrast and potentially integrate different
theoretical perspectives on team dynamics. By way of a specific example, growth modeling
can enable integration of previously quite disparate literatures on team development and team
effectiveness. Team development theories focus on stage and phase models (e.g., Gersick,
1988; Tuckman & Jensen, 1977), which tend to reflect the question, ‘What is the average
trajectory of team effectiveness?’ (see Table 1, row B). In statistical terms, these theoretical
perspectives seek to understand latent trajectories; identifying patterns of change across a
task, lifespan, or other time interval for a population of teams. Other team development
theories focus on contingency approaches (Lindsley et al., 1995; Marks et al., 2001; Poole,

38
1983), and these perspectives focus on the question, ‘Why do teams undergo different
patterns of team change?’ (see Table 1, row C). In statistical terms, these perspectives
investigate whether contingencies send teams in different trajectories; if so, this creates
significant variance around the latent trajectory. Team effectiveness theories also provide a
rich source of information about why variation emerges in team dynamics. Although these
team effectiveness theories have been espoused to measure team dynamics, little research to
date has examined these relationships from the perspective of trajectories. Growth modeling
provides a statistical approach to integrate these theoretical perspectives in future research as
this approach enables simultaneous investigation of both types of change – latent trajectories
and variation around latent trajectories.
Broader theoretical perspectives from organizational behavior and psychology may
also provide fruitful insights about potential theoretical angles to investigate team temporal
dynamics. For example, researchers in other literatures such as self-efficacy (Yeo & Neal,
2013), retirement (Wang, 2007) and work-life balance (Binnewies, Sonnentag, & Mojza,
2009) have utilized resource allocation theory as a fruitful perspective to unpack how
individuals change in both positive and negative directions. Although our focus here is on the
team as the unit of analysis, resource allocation theory may hold similar promise. Similarly,
socialization theory also provides insightful avenues for theorizing about multiple temporal
dynamics (Chan, 2003; Chen, 2005).
There are boundaries on when growth modeling is appropriate for understanding team
dynamics. Some theoretical perspectives about team dynamics will be better tested with other
analytical tools. For example, there may be situations where the team dynamics are just too
complex to capture with growth modeling! Dynamical systems theory (Katz, & Kahn, 1978;
Von Bertalanffy, 1956), is such an example; this theoretical perspective focuses on predicting

39
‘dynamic homeostasis’, statistically this is a flat trajectory that is hiding more nuanced team
dynamics. From dynamical systems theory, the concept of an attractor helps to explain why
some work teams may maintain a relatively flat trajectory through multiple, mini-fluctuations
despite being in the midst of these large, non-linear changes in their surrounding context. An
attractor, as Vallacher, Coleman, Nowak, and Bui-Wrzosinka (2010, p. 265) noted,
“…attracts the system’s behavior, so that even very different starting states tend to evolve
toward the subset of states defining the attractor.” An example of an attractor that might
result in consistently poor performance, provided by Vallacher et al. (2010), is that of a norm
of protracted, malignant conflict. A work team would likely be severely limited in its ability
to perform when facing such an issue, thus, resulting in a sustained level of effectiveness that
is dramatically below its potential level. Attractors may be somewhat insidious and “hidden”.
This type of dynamic homeostasis trajectory is non-linear and complex; that is the trajectory
is unlikely to conform to long-standing assumptions regarding cause-and-effect in linear
relationships (Vallacher, Read, & Nowak, 2002).2 The mini-fluctuations in dynamical
systems theory may be too granular or complex for growth modeling. Researchers from this
perspective have explored attractors via pattern detection with experimental simulations and
coded qualitative transcriptions (Gorman, Cook, Pedersen, Winner, Andrews & Amazeen,
2006). Similarly, researchers exploring complex adaptive systems theory have utilized
specialist software to differentiate between random and chaotic patterns of change (Ramos-
Villagrasa, Navarro, García-Izquierdo, 2012).
In conclusion, the overarching goal in this paper was to respond to the challenge of
empirically testing and integrating relationships from team dynamics theory (Harrison et al.,
2003; Mathieu et al., 2008; McGrath, 1986). We advocate that by embedding concepts and
language from growth modeling into existing theory on team dynamics, theorizing about

40
types and timing of change becomes more precise, hence empirically tested, compared,
contrasted and potentially integrated. We have highlighted how specific features of team
trajectories might be of interest: latent trajectories (slope and shape), heterogeneity, and
specific change points (transition points, as well as the correlation between initial status and
slope or shape). Examples throughout the paper have advocated how top-down perspectives
such as systems theory (e.g., Denison, Hart, & Kahn, 1996; Hackman, 1987; McGrath, 1964;
Sundstrom, De Meuse, & Futrell, 1990) and can be combined with bottom-up processes as
advocated in more micro perspectives such as learning theory (e.g., Edmondson et al., 2007).
An alternative way to integrate team dynamics theory that we illustrated was that some
perspectives of team development lend more insights to latent trajectories, whereas others,
such as contingency approaches to teams and team effectiveness frameworks, are beneficial
for proposing heterogeneity in latent trajectories. In sum, this paper provides a variety of
conceptual, theoretical and statistical reasons to motivate team dynamics researchers to utilize
growth modeling as well as practical steps about how to instigate such research. We believe
the literature on team dynamics will benefit greatly from such efforts.

41
References
Adler, P. S. (1990). Shared learning. Management Science, 36, 938-957.
Aguinis, H. & Vandenberg, R. J. (2014). An ounce of prevention is worth a pound of cure:
Improving research quality before data collection. Annual Review of Organizational
Psychology and Organizational Behavior, 1, 569-595.
Ancona, D. G., & Bresman, H. (2007). X- Teams. Boston: Harvard Business School Press
Ancona, D., & Chong, C. L. (1996). Entrainment: Pace, cycle, and rhythm in organizational
behavior. Research in Organizational Behavior, 18, 251-284.
Argyris, C., & Schon, D. (1978). Organizational learning: A theory of action perspective.
Reading MA: Addison-Wesley.
Arrow, H. (1997). Stability, bistability and instability in small group influence patterns.
Journal of Personality and Social Psychology, 72, 75-85.
Arrow, H., Poole, M. S., Henry, K. B., Wheelan, S., & Moreland, R. (2004). Time, change,
and development: The temporal perspective on groups. Small Group Research, 35,
73-105.
Bateson, G. (1973). Steps to an ecology of mind. London: Palladin.
Beckman, C. M. 2006. The influence of founding team company affiliations on firm
behaviour. Academy of Management Journal, 49, 741-758.
Behfar, K. J., Peterson, R. S., Mannix E. A., & Trochim, W. M. K. (2008). The critical role of
conflict resolution in teams: A close look at the links between conflict type, conflict
management strategies, and team outcomes. Journal of Applied Psychology, 93, 170-
188.
Bennis, W. G., & Shepard, H. A. (1956). A theory of group development. Human Relations,
9, 415-437.

42
Binnewies, C., Sonnentag, S., & Mojza, E. J. (2009). Daily performance at work: Feeling
recovered in the morning as a predictor of day-level job performance. Journal of
Organizational Behavior, 30, 67-93.
Bliese, P.D., & Ployhart, R. (2002). Growth modeling using random coefficient modeling:
Model building, testing, and illustrations. Organizational Research Methods, 5, 362-
387.
Camerer, C., & Lovallo, D. (1999). Overconfidence and excess entry: An experimental
approach. American Economic Review, 89, 306-413.
Chan, D. (1998). The conceptualization and analysis of change over time: An integrative
approach incorporating longitudinal mean and covariance structures analysis
(LMACS) and multiple indicator latent growth modeling (MLGM). Organizational
Research Methods, 1, 421-483.
Chan, D. (2003). Data Analysis and Modeling Longitudinal Processes. Group and
Organization Management, 28, 341-365.
Chang, A. (2001). Time in groups: Group development, time management, appraised
structured use of time, and group effectiveness. (Unpublished doctoral dissertation).
University of Queensland, Brisbane, Australia.
Chang, A., Duck, J., & Bordia, P. (2003). Punctuated Equilibrium and Linear Progression:
Toward a New Understanding of Group Development. Academy of Management
Journal, 46, 106-117.
Chen, G. (2005). Newcomer adaptation in teams: Multilevel antecedents and outcomes.
Academy of Management Journal, 48, 101-116.
Chen, G., & Kanfer, R. (2006). Toward a systems theory of motivated behavior in work
teams. Research in Organizational Behavior, 27, 223-267.

43
Chou, C. P., Yang, D., Pentz, M. A., & Hser, Y. I. (2004). Piecewise growth curve modeling
approach for longitudinal prevention study. Computational Statistics & Data
Analysis, 46, 213-225.
Collins, C. G. & Gibson, C. B. (2014). Turning Teams Around: Creating Inflection Points in
Team Performance with a Team Work Redesign Intervention. Paper presented at the
Academy of Management Conference, Philadelphia, USA.
Collins, C. G., & Parker, S. K. (2010). Team capability beliefs over time: Distinguishing
between team potency, team outcome efficacy, and team process efficacy. Journal of
Occupational and Organizational Psychology, 83, 1003-1023.
Conger, J. A. (1998). Qualitative research as the cornerstone methodology for understanding
leadership. Leadership Quarterly, 9, 107-121.
Cordery, J.L., Cripps, E., Gibson C.B., Soo, C., Kirkman, B.L., Mathieu, J.M. (2014). The
operational impact of organizational communities of practice: A Bayesian approach to
analysing organizational change. Journal of Management. Advance online
publication. doi: 10.1177/0149206314545087
Cordery, J. L., Morrison, D., Wright, B. M., & Wall, T. D. (2010). The impact of autonomy
and task uncertainty on team performance: A longitudinal field study. Journal of
Organizational Behavior, 31, 240-258.
Cordery, J. L., Mueller, W. S., & Smith, L. M. (1991). Attitudinal and behavioral effects of
autonomous group working: A longitudinal field study. Academy of Management
Journal, 34, 464-476.
Cronin, M. A., Weingart, L. R., & Todorova, G. (2011). Dynamics in groups: Are we there
yet? Academy of Management Annals, 5, 571-612.

44
Darr, E.D., Argote, L., & Epple, D. (1995). The acquisition, transfer, and depreciation of
knowledge in service organizations: Productivity in franchises. Management Science,
14, 1750-1762.
Davison, H.K., Mishra, V., Bing, M.N., & Frink, D.D. (2014). How individual performance
affects the variability of peer evaluations in classroom teams: A distributive justice
perspective. Journal of Management Education, 38, 43-85.
DeDreu, C. K. W., & Weingart, L. R. (2003). Task versus relationship conflict, team
performance, and team member satisfaction: A meta-analysis. Journal of Applied
Psychology, 88, 741-749.
Denison, D., Hart, S., & Kahn, J. (1996). From chimneys to cross-functional teams:
Developing and validating a diagnostic model. Academy of Management Journal, 39,
1005-1023.
Dierdorff, E. C., Bell, S. T., & Beelohlav, J. A. (2011). The Power of “We”: Effects of
psychological collectivism on team performance over time. Journal of Applied
Psychology, 96, 247-262.
Edmondson, A. C., Dillon, J. R., & Roloff, K. S. (2007). Three perspectives on team learning.
The Academy of Management Annals, 1, 269-314.
Eisenhardt, K. (1989). Making fast strategic decisions in high- velocity environments.
Academy of Management Journal, 32, 543-576.
Felps, W. Mitchell, T. R., & Byington, E. (2006). How, when, and why bad applies spoil the
barrel: Negative group members and dysfunctional groups. Research in
Organizational Behavior, 27, 175-222.
Feltz, D. L., & Lirgg, C. D. (1998). Perceived team and player efficacy in hockey. Journal of
Applied Psychology, 83, 557-564.

45
Gersick, C. J. G. (1988). Time and transition in work teams: Toward a new model of group
development. Academy of Management Journal, 31, 1, 9-41.
Gibson, C.B. (2001). From accumulation to accommodation: The chemistry of collective
cognition in work groups. Journal of Organizational Behavior, 22(2), 121-134.
Gibson, C.B. (2003a). Quality of team service: The role of field independent culture, quality
orientation, and quality improvement focus. Small Group Research, 34(5), 619-646.
Gibson, C.B. (2003b). The efficacy advantage: Factors influencing the formation of group-
efficacy across cultures. Journal of Applied Social Psychology, 33(10), 2153-2186.
Gibson, C.B., & Dibble, R. (2013). Excess may due harm: Examining the diminishing returns
of external adjustment in team-based collaborations. Organization Science, 24(3),
687-715.
Gibson, C.B., & Marcoulides, G.A. (1995). The cultural contingency approach to leadership:
Examining the invariance of a leadership model across Four Countries. Journal of
Managerial Issues, 7(2), 176-193.
Gibson, C. B., & Vermeulen, F. (2003). A healthy divide: Subgroups as a stimulus for team
learning behavior. Administrative Science Quarterly, 48, 202-239.
Gist, M. E. (1987). Self- efficacy: Implications for organizational behavior and human
resource management. The Academy of Management Review, 12, 472-485.
Gladstein, D. L. (1984). A model of task group effectiveness. Administrative Science
Quarterly, 29, 499-517.
Golembiewski, R. T., Billingsley, K., & Yeager, S. (1976). Measuring change and persistence
in human affairs: Types of change generated by OD designs. Journal of Applied
Behavioral Science, 12, 133-157.

46
Goodman, P. S. (1979). Assessing organizational change: The Rushton quality of work
experiment. New York: Wiley.
Goodman, P. S. (1986). Impact of task and technology on group performance. In P.S.
Goodman (Ed.), Designing effective work groups (pp. 120-167). San Francisco:
Jossey-Bass.
Gorman, J. C. Cook, N. J., Pedersen, H. K., Winner, J., Andrews, D. H., & Amazeen, P. G.
(2006). Changes in team composition after a break: Building adaptive command-and-
control teams. In Proceedings of the Human Factors and Ergonomics Society 50th
Annual Meeting (pp. 487-492). Santa Monica, CA: Human Factors and Ergonomics
Society.
Grant, A. (2011). How customers can rally your troops: End users can energize your
workforce far better than your managers can. Harvard Business Review, June, 96–
103.
Grant, A. (2013). Rethinking the extraverted sales ideal: The ambivert advantage,
Psychological Science, 24, 1024-1030.
Hackman, J. R. (1987). The design of effective work teams. In J.W. Lorsch (Ed.), Handbook
of Organizational Behavior (pp. 315-342). Englewood Cliffs, NJ: Prentice Hall.
Hackman, J. R. (1990). Groups that work (and those that don't): Creating conditions for
effective teamwork. San Francisco, CA: Jossey-Bass.
Harrison, D. A., Mohammed, S., McGrath J. E., Flory, A. T., & Vanderstoep, S. W. (2003).
Time matters in team performance: Effects of member familiarity, environment, and
task discontinuity on speed and quality. Personnel Psychology, 56, 633-669.

47
Hill, A.P., Stoeber, J., Brown, A., & Appleton, P.R. (2014). Team perfectionism and team
performance: A prospective study. Journal of Sport and Exercise Psychology, 36,
303-325.
Hill, W., & Gruner, L. (1973). A study of development in open and closed groups. Small
Group Behavior, 4, 355-381.
Ilgen, D. R., Hollenbeck, J. R., Johnson, M., & Jundt, D. (2005). Teams in organizations:
From input-process-output models to IMOI models. Annual Review of Psychology,
56, 517-543.
Johns, G. (2006). The essential impact of context on organizational behavior. Academy of
Management Review, 31, 386-408.
Jung, T., & Wickrama, K. A. S. (2008). An introduction to latent class growth analysis and
growth mixture modeling. Social and Personality Psychology Compass, 2, 302-317.
Katz, D. & Kahn, R. L. (1966). The social psychology of organizations. New York: Wiley.
Katz, D., & Kahn, R. L. (1978). The social psychology of organizations. New York: John
Wiley & Sons
Kirton, B., Okhuysen, G. A., & Waller, M. J. (2004). Glossary of temporal terms. In M. A.
Neale, E. A Mannix, & S. Blount (Eds.), Research on managing groups and teams
(Vol.6, pp. 237-266). Greenwich, CT: JAI Press.
Kozlowski, S. W. J., & Bell, B. S. (2003). Work groups and teams in organizations. In W. C.
Borman, D. R. Ilgen, & R. J. Klimski (Eds.), Handbook of psychology: Industrial and
organizational psychology (Vol. 12, pp. 333-376). London: Wiley.
Kozlowski, S. W. J., Gully, S. M., Nason, E. R., & Smith, E. M. (1999). Developing adaptive
teams: A theory of compilation and performance across levels and team. In D. R.
Ilgen & E. D. Pulakos (Eds.), The changing nature of work performance: Implications
48
for staffing, personnel actions, and development (pp. 240-292). San Francisco:
Jossey-Bass.
Kozlowski, S. W. J., & Klein, K. J. (2000). A multilevel approach to theory and research in
organizations: Contextual, temporal, and emergent processes. In K. J. Klein & S. W.
J. Kozlowski (Eds.), Multilevel theory, research, and methods in organizations:
Foundations, extensions, and new directions (pp. 3-90). San Francisco, CA: Jossey-
Bass.
LePine, J. A., Piccolo, R. F., Jackson, C. L., Mathieu, J. E., & Saul, J. R. (2008). A meta‐
analysis of teamwork processes: tests of a multidimensional model and relationships
with team effectiveness criteria. Personnel Psychology, 61(2), 273-307.
Li, F., Duncan, T. E., & Hops, H. (2001). Examining developmental trajectories in adolescent
alcohol use using piecewise growth mixture modeling analysis. Journal of Studies on
Alcohol, 62, 199-210.
Li, J., & Roe, R.A. (2012). Introducing an intrateam longitudinal approach to the study of
team process dynamics. European Journal of Work and Organizational Psychology,
21, 718-748.
Lindsley, D. H., Brass, D. J., & Thomas, J. B. (1995). Efficacy–performance spirals: A
multilevel perspective. Academy of Management Review, 20, 645-678.
Maloney, M., Zellmer-Bruhn, M., & Bresman, H. (2014). Contextualizing teams research: A
look back and a path forward. Paper presented at the Academy of Management
Conference, Philadelphia, US.
Marcoulides, G.A., Yavas, B.F., Bilgin, Z., & Gibson, C.B. (1998). Reconciling the
culturalist and rationalist approaches to international management: Model invariance

49
and discriminant validity of leadership in the U.S. and Turkey. International Business
Review, 40(6), 563-583.
Marks, M. A., Mathieu, J. E., & Zaccaro, S. J. (2001). A temporally based framework and
taxonomy of team processes. Academy of Management Review, 26, 356-376.
Mathieu, J., Maynard, M. T., Rapp, T., & Gilson, L. (2008). Team effectiveness 1997-2007:
A review of recent advancements and a glimpse into the future. Journal of
Management, 34, 410-476.
Mathieu, T. M., & Rapp, T. (2009). Laying the foundation for successful team performance
trajectories: The roles of team charters and performance strategies. Journal of Applied
Psychology, 94, 90-103.
Mathieu, J. E., & Schulze, W. (2006). The influence of team knowledge and formal plans on
episodic team process-performance relationships. Academy of Management Journal,
49, 605-619.
Mathieu, J. E., Tannenbaum, S. I., Donsbach, J. S., & Alliger, G. M. (2013). A review and
integration of team composition models moving toward a dynamic and temporal
framework. Journal of Management, 0149206313503014.
McArdle J. J., & Epstein, D. (1987). Latent growth curves within developmental structural
equation models. Child Development, 58, 110-133.
McGrath, J. E. (1964). Social Psychology: A brief introduction. New York: Holt, Rinehart,
and Winston.
McGrath, J. E. (1986). Studying groups at work: Ten critical needs for theory and practice. In
P. S. Goodman and Associates (Eds.), Designing effective work groups (pp. 362-392).
San Francisco: Jossey-Bass.

50
McGrath, J. E. (1991). Time, interaction and performance (TIP): A Theory of groups.
Small Group Research, 22, 147-174.
McGrath, J. E., Arrow, H., & Berdahl, J. L. (2000). The study of groups: Past, present, and
future. Personality and Social Psychology Review, 4, 95–105.
McGrath, J. E., & Rotchford, N.L. (1983). Time and behavior in organizations. Research in
Organizational Behavior (Vol. 5, pp. 57-101). Greenwich, CN: JAI Press.
Mennecke, B. E., Hoffer, J. A., & Wynne, B. E. (1992). The implications of group
development and history on group support system: Theory and practice. Small Group
Research, 23, 524-572.
Meredith, W. & Tisak, J. (1990). Latent curve analysis. Psychometrika, 55, 107-122.
Mitchell, T. R., & James, L. R. (2001). Building better theory: Time and the specification of
when things happen. Academy of Management Review, 26, 530-547.
Monge, P. R. (1990). Theoretical and analytical issues in studying organizational processes.
Organization Science, 1, 406-430.
Morgeson, F. P. (2005). External leadership of self-managing teams: Intervening in the
context of novel and disruptive events. Journal of Applied Psychology, 90, 497-508.
Muthen, B. O. (1991). Analysis of longitudinal data using latent variable models with varying
parameters. In L. M. Collins & J. L. Horn (Eds.), Best methods for the analysis of
change (pp. 1-17). Washington, DC: American Psychological Association.
Ohly, S., Sonnentag, S., Niessen, C., Zapf, D. (2010). Diary studies in organizational
research. Journal of Personnel Psychology, 9, 79-93.
Parker, S. K., Wall, T. D., & Cordery, J. L. (2001). Future work design research and practice:
Towards an elaborated model of work design. Journal of Occupational and
Organizational Psychology, 74, 413-440.

51
Pisano, G. P., Bohmer, M. J., & Edmondson, A. C. (2001). Organizational differences in rates
of learning: evidence from the adoption of minimally invasive cardiac surgery.
Management Science, 47, 752-768.
Pitariu, A. H., & Ployhart, R. E., (2010). Explaining change: Theorizing and testing dynamic
mediated longitudinal relationships. Journal of Management, 36, 405-429.
Ployhart, R. E., & Hakel, M. D. (1998). The substantive nature of performance variability:
Predicting interindividual differences in intraindividual performance. Personnel
Psychology, 51(4), 859-901.
Ployhart, R.E., Holtz, B.C., & Bliese, P.D. (2002). Longitudinal data analysis: Applications
of random coefficient modeling to leadership research. Leadership Quarterly, 13,
455-486.
Ployhart, R. E., & Vandenberg, R. J. (2010). Longitudinal research. The theory, design, and
analysis of change. Journal of Management, 36, 94-120.
Poole, M. S. (1983). Decision development in small groups: III. A multiple sequence model
of group decision development. Communication Monographs, 50, 321-341.
Popper, K. (1959). The logic of scientific discovery. New York: Basic Books.
Quigley, N. (2013). A longitudinal, multilevel study of leadership efficacy development in
mba teams. Academy of Management Learning & Education, 12, 579-602.
Ramos-Villagrasa, P. J., Navarro, J., & García-Izquierdo, A. L. (2012). Chaotic dynamics and
team effectiveness: Evidence from professional basketball. European Journal of Work
and Organizational Psychology, 21, 778-802.
Salas, E., Stagl, K. C., Burke, C. S., & Goodwin, G. F. (2007). Fostering team effectiveness
in organizations: Toward an integrative theoretical framework. In R. A. Dienstbier, B.
52
Shuart, W. Spaulding, & J. Poland (Eds), Modeling Complex Systems (pp. 185-242).
Nebraska, United States of America: University of Nebraska Press.
Shuffler, M. L., Diaz Granados, D., & Salas, E. (2011). There’s a science for that: Team
development interventions in organizations. Current Directions in Psychological
Science, 20, 365–372.
Singer, J. D., & Willett, J. B. (2003). Applied longitudinal data analysis. New York: Oxford
University Press.
Stoner, J. A. F. (1968). Risky and cautious shifts in group decisions: The influence of widely
held values. Journal of Experimental Social Psychology, 4, 442-459.
Stoolmiller, M. (1994). Antisocial behavior, delinquent peer association and unsupervised
wandering for boys: Growth and change from childhood to early adolescence.
Multivariate Behavioral Research, 29, 263-288.
Sundstrom, E., De Meuse, K. P., & Futrell, D. (1990). Work teams: Applications and
effectiveness. American Psychologist, 45, 120-133.
Tuckman, B. W. (1965). Developmental sequence in small groups. Psychological Bulletin,
63, 384-399.
Tuckman, B. W., & Jensen, M. (1977). Stages of small group development. Group and
Organisational Studies, 2, 419-427.
Vallacher, R. R., Coleman, P. T., Nowak, A. & Bui-Wrzosinka, L. (2010). Rethinking
intractable conflict: The perspective of dynamical systems. American Psychologist,
65, 262-278.
Vallacher, R. R., Read, S. J., & Nowak, A. (2002). The dynamical perspective in personality
and social psychology. Personality and Social Psychology Review, 6, 264-273.
53
Vandenberg, R. J., & Lance, C. E. (2000). A review and synthesis of the measurement
invariance literature: Suggestions, practices, and recommendations for organizational
research. Organizational Research Methods, 3, 4-70.
Von Bertalanffy, L. (1956). General system theory. General systems, 1, 11-17.
Waller, M. J., Zellmer-Bruhn, M., & Giambatista, R. C. (2002). Watching the clock: Group
pacing behavior under dynamic deadlines. Academy of Management Journal, 45,
1046-1055.
Wang, M. (2007). Profiling retirees in the retirement transition and adjustment process:
Examining the longitudinal change patterns of retirees’ psychological well-being.
Journal of Applied Psychology, 92, 455-474.
Wang, M., & Bodner, T. E. (2007). Growth mixture modeling identifying and predicting
unobserved subpopulations with longitudinal data. Organizational Research
Methods, 10, 635-656.
Wang, M., & Hanges, P. J. (2011). Latent class procedures: Applications to organizational
research. Organizational Research Methods, 14, 24-31.
Weingert, L.R. (1997). How did they do that? The ways and means of studying group
process. Research in Organizational Behavior, 18, 189-239.
Willett, J. B. & Sayer, A. G. (1996). Cross-domain analyses of change over time: Combining
growth modeling and covariance structure analysis. In G. A. Marcoulides & R. E.
Schumacker (Eds.), Advanced structural equation modeling: Issues and techniques.
(pp. 125-157). Hillsdale, NJ: Lawrence Erlbaum.
Yeo, G. B., & Neal, A. (2013). Revisiting the functional properties of self-efficacy: A
dynamic perspective. Journal of Management, 39, 1385-1396.

54
Zaheer, S., Albert, S., & Zaheer, A. (1999). Time scales and organization theory. Academy of
Management Review, 24, 725-741.
Zellmer-Bruhn, M., Waller, M. J., & Ancona, D. (2004). The effect of temporal entrainment
on the ability of teams to change their routines. Research on Managing Groups and
Teams, 6, 135-158.

55
Footnotes
1 Shape, such as cubic and quadratic trends, can be investigated through regression
techniques, and has been to investigate the development of team efficacy across a sporting
season (Feltz & Lirgg, 1998). However, through regression only the latent trajectory can be
investigated; other explorations such as whether multiple latent trajectories (i.e.,
subpopulations) -exist in the data, and heterogeneity around the latent trajectories, cannot be
investigated through the regression approach.
2 We thank an anonymous reviewer for drawing our attention to the work of
Vallacher, Read, and Nowak (2002).

56
1a. Upward latent trajectory 1b. Downward latent trajectory, albeit variable 1c. Homeostatic latent trajectory
Figure 1. Illustrative latent team trajectories.
Tea
m
T
Tea
m
T
Tea
m
T

57
2a. Positive transition points – change of speed 2b. Positive transition points – change of
direction
Figure 2. Transition points: Changing speed and/or direction.
Ter
m
Time
Ter
m
Time
Ter
m
Time

58
Table 1
Illustrative theoretical perspectives and research questions conducive to growth modeling
Illustrative theoretical perspectives Illustrative research questions
A. Initial conditions of teamwork (e.g., Beckman, 2006; Hackman, 1990)
Is there variation in teams at a specific point in time, such as at the outset of working together, or do all teams start off the same? Then does this starting point then have a lasting impact on the team? That is, do teams who start out differently also change differently, such as do the good teams get better, and bad teams get worse (Hackman, 1990)?
B. Team development theories (e.g., Gersick,
1988; Tuckman & Jensen, 1977)? What is the nature and shape of change? Are there decreases in team effectiveness due to conflict before optimal team outcomes emerge (Tuckman & Jensen, 1977)? Or are there sudden punctuated equilibriums in team outcomes (Gersick, 1988)?
C. Team contingency theories (e.g., Kozlowski,
Gully, Nason, & Smith, 1999; Lindsley, Brass, & Thomas, 1995; McGrath, 1991; Poole, 1983).
Do all teams change in the same way and if not, how and why do they vary? Is there one overall trajectory for the population of teams with some variation around it? Or are there sub-populations of teams with/without variation around them?
D. Episodic model of team effectiveness (e.g.,
Marks, Mathieu, & Zaccaro, 2001) How do team processes and outcomes change over time? Is there a change in speed or direction in team processes and outcomes? Is the change in team process related in any systematic way to changes in team outcomes or vice versa?
E. Team learning (for a review see Edmondson,
Dillon & Roloff, 2007)
Does double loop learning change the direction of a team effectiveness trajectory, creating a change in the direction of change?

59
Table 2
Conceptual and Analytical Framework for Team Trajectories
Statistical languge to embed in hypotheses
Research question about team dynamics
Statistical analysis
A. Type of Growth Model: Multiple Latent Trajectories
Latent classes of trajectories; heterogenity between classes; heterogenity within classes; intercept; slope; correlation between intercept and slope; transition points
What is the expected number of latent trajectory classes?
Growth mixture modelling from most to least restrictive: Latent class growth model (LCGM): different means & no variance (within-class homogeneity) Growth mixture model: Classes have unique means but similar variance Growth mixture model: Classes have unique means & variance Growth mixture model: Classes have unique patterns (shapes of change - pre-specified or freely
estimated), means & variances
Appropriate selection of the final model occurs when: Model (i.e. from list above with means and variances specified) and antecedents investigated
simultaneously. Antecedents predict both class membership and variance around the latent trajectory
What are the predictors of: (1) the latent class trajectories; and (2) heterogeneity within classes?
B. Type of Growth Model: One Latent Trajectory
Latent trajectory; variation around the trajectory; intercept; slope; correlation between intercept and slope; transition points
What predicts variation in the latent trajectory (e.g., intercept, slope, transition points)?
Latent growth modelling from most to least restrictive: No growth (flat latent trajectory) Linear growth (add latent variable for slope) Non-linear growth (add latent variable for non-linear growth, moving from cubic, quadratic then
higher level functions by adjusting the factor loadings)
Piecewise latent growth model used to assess a transition point.