unpacking pre-2020 climate commitments
TRANSCRIPT

Unpacking Pre-2020 Climate CommitmentsWho Delivered, How Much, and How will the Gaps be Addressed?
Sumit Prasad, Spandan Pandey, and Shikha Bhasin
Report July 2021
Centre forEnergy Finance
An initiative supported by

Unpacking Pre-2020 Climate Commitments: Who Delivered, How Much, and How will the Gaps be Addressed?
Image: iStock
Any additional consumption of carbon space in the pre-2020 period will be required to be addressed in order to limit the temperature below 1.5 degrees by 2100.

ReportJuly 2021ceew.in
Who Delivered, How Much, and How will the Gaps be Addressed?
Unpacking Pre-2020 Climate Commitments
Sumit Prasad, Spandan Pandey, and Shikha Bhasin
Centre forEnergy Finance
An initiative supported by

Unpacking Pre-2020 Climate Commitments: Who Delivered, How Much, and How will the Gaps be Addressed?
Copyright © 2021 Council on Energy, Environment and Water (CEEW).
Open access. Some rights reserved. This work is licenced under the Creative Commons Attribution
Non-commercial 4.0. International (CC BY-NC 4.0) licence. To view the full licence, visit: www.
creativecommons.org/licences/ by-nc/4.0/legalcode.
Suggested citation: Prasad, Sumit, Spandan Pandey, and Shikha Bhasin.2021. Unpacking Pre-2020 Climate Commitments:
Who Delivered, How Much, and How will the Gaps be Addressed? New Delhi: Council on Energy,
Environment, and Water.
Disclaimer: All views and findings in this work are those of the authors’ and do not necessarily reflect the views and
policies of the Council on Energy, Environment and Water.
The views/analysis expressed in this report do not necessarily reflect the views of Shakti Sustainable
Energy Foundation. The Foundation also does not guarantee the accuracy of any data included in this
publication nor does it accept any responsibility for the consequences of its use. For private circulation
only.
Cover image: iStock.
Peer reviewers: Davor Vesligaj, Programme Officer at Transparency Division, UNFCCC; Ruta Bubniene, Programme
Officer, UNFCCC; Dr. Chisa Umemiya, Research Manager, IGES; Dr Vaibhav Chaturvedi, Fellow, CEEW; and
Abinash Mohanty, Programme Lead, CEEW. The reviewers Davor Vesligaj, Ruta Bubniene, and Dr Chisa
Umemiya have not reviewed the section 8.3 (performance ranking of developed countries in the pre-
2020 phase).
The methodology and preliminary outcomes of the pre-2020 research and ranking framework were also
discussed in a stakeholder consultation involving domain experts across the globe. The feedback from
the experts related to approach, assumptions, and findings were duly considered and incorporated in the
report.
Publication team: Alina Sen (CEEW), Venkatesh Krishnamoorthy, Twig Designs, and Friends Digital.
Organisations: The Council on Energy, Environment and Water (CEEW) is one of Asia’s leading not-for-profit policy
research institutions. The Council uses data, integrated analysis, and strategic outreach to explain – and
change – the use, reuse, and misuse of resources. It prides itself on the independence of its high-quality
research, develops partnerships with public and private institutions, and engages with wider public. In
2021, CEEW once again featured extensively across ten categories in the 2020 Global Go To Think Tank
Index Report. The Council has also been consistently ranked among the world’s top climate change
think tanks. CEEW is certified as a Great Place To Work®. Follow us on Twitter @CEEWIndia for the latest
updates.
Shakti Sustainable Energy Foundation seeks to facilitate India’s transition to a sustainable energy
future by aiding the design and implementation of policies in the following areas: clean power, energy
efficiency, sustainable urban transport, climate change mitigation and clean energy finance.
Council on Energy, Environment and Water Sanskrit Bhawan, A-10 Qutab Institutional Area, Aruna Asaf Ali Marg, New Delhi - 110067, India

About CEEW
The Council on Energy, Environment and Water (CEEW) is one of Asia’s leading not-for-profit policy research institutions. The Council uses data, integrated analysis, and strategic outreach to explain — and change — the use, reuse, and misuse of resources. The Council addresses pressing global challenges through an integrated and internationally focused approach. It prides itself on the independence of its high-quality research, develops partnerships with public and private institutions, and engages with the wider public.
The Council’s illustrious Board comprises Mr Jamshyd Godrej (Chairperson), Mr Tarun Das, Dr Anil Kakodkar, Mr S. Ramadorai, Mr Montek Singh Ahluwalia, Dr Naushad Forbes, Ambassador Nengcha Lhouvum Mukhopadhaya, and Dr Janmejaya Sinha. The 120-plus executive team is led by Dr Arunabha Ghosh. CEEW is certified as a Great Place To Work®.
In 2021, CEEW once again featured extensively across ten categories in the 2020 Global Go To Think Tank Index Report, including being ranked as South Asia’s top think tank (15th globally) in our category for the eighth year in a row. CEEW has also been ranked as South Asia’s top energy and resource policy think tank for the third year running. It has consistently featured among the world’s best managed and independent think tanks, and twice among the world’s 20 best climate think tanks. In ten years of operations, The Council has engaged in 278 research projects, published 212 peer-reviewed books, policy reports and papers, created 100+ new databases or improved access to data, advised governments around the world nearly 700 times, promoted bilateral and multilateral initiatives on 80+ occasions, and organised 350+ seminars and conferences. In July 2019, Minister Dharmendra Pradhan and Dr Fatih Birol (IEA) launched the CEEW Centre for Energy Finance. In August 2020, Powering Livelihoods — a CEEW and Villgro initiative for rural start-ups — was launched by Minister Mr Piyush Goyal, Dr Rajiv Kumar (NITI Aayog), and H.E. Ms Damilola Ogunbiyi (SEforAll). The Council’s major contributions include: The 584-page National Water Resources Framework Study for India’s 12th Five Year Plan; the first independent evaluation of the National Solar Mission; India’s first report on global governance, submitted to the National Security Adviser; irrigation reform for Bihar; the birth of the Clean Energy Access Network; work for the PMO on accelerated targets for renewables, power sector reforms, environmental clearances, Swachh Bharat; pathbreaking work for the Paris Agreement, the HFC deal, the aviation emissions agreement, and international climate technology cooperation; the concept and strategy for the International Solar Alliance (ISA); the Common Risk Mitigation Mechanism (CRMM); critical minerals for Make in India; modelling uncertainties across 200+ scenarios for India’s low-carbon pathways; India’s largest multidimensional energy access survey (ACCESS); climate geoengineering governance; circular economy of water and waste; and the flagship event, Energy Horizons. It recently published Jobs, Growth and Sustainability: A New Social Contract for India’s Recovery.
The Council’s current initiatives include: A go-to-market programme for decentralised renewable energy-powered livelihood appliances; examining country-wide residential energy consumption patterns; raising consumer engagement on power issues; piloting business models for solar rooftop adoption; developing a renewable energy project performance dashboard; green hydrogen for industry decarbonisation; state-level modelling for energy and climate policy; reallocating water for faster economic growth; creating a democratic demand for clean air; raising consumer awareness on sustainable cooling; and supporting India’s electric vehicle and battery ambitions. It also analyses the energy transition in emerging economies, including Indonesia, South Africa, Sri Lanka and Vietnam.
The Council has a footprint in 22 Indian states, working extensively with state governments and grassroots NGOs. It is supporting power sector reforms in Uttar Pradesh and Tamil Nadu, scaling up solar-powered irrigation in Chhattisgarh, supporting climate action plans in Gujarat and Madhya Pradesh, evaluating community-based natural farming in Andhra Pradesh, examining crop residue burning in Punjab, promoting and deploying solar rooftops in Delhi, Bihar and Meghalaya.

Acknowledgments
The authors of this report would like to thank the Shakti Sustainable Energy Foundation (SSEF) for their support to carry out the study.
We also thank our reviewers—Davor Vesligaj, United Nations Framework Convention on Climate Change (UNFCCC); Ruta Bubniene, United Nations Framework Convention on Climate Change (UNFCCC); Dr Chisa Umemiya, Research Manager, Institute for Global Environmental Strategies (IGES); Dr Vaibhav Chaturvedi, CEEW; and Abinash Mohanty, CEEW—for their critical comments and feedback, which was of immense help in enhancing the quality of the report.
We conducted stakeholder consultations in the course of finalising this report. We thank the participants in the consultations for their valuable suggestions: Dr Aarti Gupta, Wageningen University; K. S. Aishwarya, Shakti Sustainable Foundation; Dr Chisa Umemiya, Institute for Global Environmental Strategies (IGES); Damandeep Singh, Carbon Disclosure Project (CDP); Davor Vesligaj, United Nations Framework Convention on Climate Change (UNFCCC); Joydeep Gupta, India Climate Dialogue; Dr Nandakumar Janardhanan, Institute for Global Environmental Strategies (IGES); Nidhi Madan, Shakti Sustainable Foundation; Shubhasis Dey, Shakti Sustainable Foundation; and Subrata Chakrabarty, WRI.
We also thank our colleagues at CEEW—Jhalak Aggarwal and Triya Roy (former intern at CEEW)—who provided valuable inputs throughout our research.
Finally, we thank the outreach team at CEEW, for their support in the publication of this report and its outreach.

The authors
Sumit Prasad [email protected]
A public policy researcher at The Council, Sumit possesses a great interest in tracking and resolving complex issues surrounding international climate negotiations. His research areas include pre-2020 climate actions, transparency, capacity building efforts, and other key issues. He has also authored the MRV chapter in India’s second and third Biennial Update Report submitted to UNFCCC.
Spandan Pandey [email protected]
Formerly a research analyst at The Council, Spandan’s research interests lie in international climate policy, global environmental governance, political economy of climate change, and climate ethics. He holds an MSc in Climate Change and Sustainability Studies from the Tata Institute of Social Sciences and BTech in Information Technology from West Bengal University of Technology.
Shikha Bhasin [email protected]
A researcher on climate change mitigation policies at The Council, Shikha has a keen interest in innovation systems of low-carbon technologies. She is currently leading The Council’s research on cooling and phasing down hydrofluorocarbons (HFCs) and also oversees climate negotiations’ research and strategic outreach. A co-author of the India Cooling Action Plan (ICAP), she continues to represent CEEW as a member of ICAP working groups to implement its R&D and servicing sector goals.
“As long as the issues from the pre-2020 period remain unaddressed, it would be difficult to trust the commitments made by developed countries for the post-2020 period.”
“2021 is a critical year in enabling a stronger, more effective, climate regime. For the regime to succeed in solving climate change, it must aim to epitomise transparency, leadership, and trust. This study is an effort to nudge the global community to this end.”
“The burden of the gaps emerging from the pre-2020 period should not be transferred to developing countries but distributed among developed countries.”

Unpacking Pre-2020 Climate Commitments: Who Delivered, How Much, and How will the Gaps be Addressed?
Image: iStock
The fate of the post-2020 climate negotiations critically hinges upon the achievements, gaps, and issues recognised in the pre-2020 period.

Contents
Executive summary
1. Introduction
1.1 History of the pre-2020 regime1.2 Participation and non-participation of Annex I countries 1.3 Purpose of this research
2. Methodology
2.1 Literature review2.2 Summary of the accounting mechanism under the Kyoto Protocol and the Doha Amendment
to the Kyoto Protocol2.3 Data sources2.4 Assumptions regarding data and limitations
3. Base year and targets under the Kyoto Protocol and the Doha Amendment
4. Base year and targets under the Cancun Agreements
5. Analysis of emissions
5.1 Country-wise scenario5.2 Emissions in the commitment periods
6. Analysis of the Kyoto Protocol flexibilities
6.1 Voluntary cancellation and carry-over units
7. Failures and loopholes under the Kyoto Protocol and the Doha Amendment
7.1 Impact of non-participating countries7.2 Presence of hot air7.3 Inclusion of deforestation emissions in the base year
8. Achievements of developed countries in the pre-2020 phase
8.1 Performance of developed countries in the Kyoto Protocol and the Doha Amendment8.2 Progress of developed countries towards Cancun pledges8.3 Performance ranking of developed countries in the pre-2020 phase
Conclusion References Annexure I: Stakeholder consultation
Annexure II: EU emission allowance distribution in the Doha Amendment
Annexure III: Net holdings of Kyoto units
9
101113
1616
2021
35
42
444446
48
5455
34
15
31
23
33
41
43
47
63
65
68
69
70
i

Unpacking Pre-2020 Climate Commitments: Who Delivered, How Much, and How will the Gaps be Addressed?
Tables
Table ES1 Participation of countries in the Kyoto Protocol and the Doha Amendment
Table ES2 Outcomes of the pre-2020 regime
Table ES3 Overall pre-2020 climate action ranking
Table 1 Participation of countries in the Kyoto Protocol and the Doha Amendment
Table 2 KP-LULUCF activities in the Kyoto Protocol and the Doha Amendment
Table 3 Base years of Annex I Parties for greenhouse gases
Table 4 Base year emissions, target, and initial assigned amount units (MtCO2eq)
Table 5 Emissions during the commitment period
Table 6 Hot air analysis
Table 7 Pre-2020 outcomes (in MtCO2eq)
Table 8 Progress against Cancun pledges
Table 9 Indicators: Options and scoring scale
Table 10 Performance ranking of developed countries in the pre-2020 phase
Figures
Figure ES1 Greenhouse gas emissions of Annex I countries without LULUCF (1990–2019)
Figure ES2 Snapshot of ranking indicators
Figure 1 Pre-2020 climate regime
Figure 2 Illustration of the accounting process
Figure 3 Greenhouse gas emissions of Annex I countries without LULUCF (1990–2019)
Figure 4 Non-EIT countries: Percentage change in 2019 emissions from the 1990 levels
Figure 5 EIT countries: Percentage change in 2019 emissions from the 1990 levels
Figure 6 Commitment period emissions versus initial assigned amount units
Figure 7 Share of voluntary cancellation and carry-over units under Kyoto Protocol (2008-2012)
Figure 8 Annex A emission share of participating and non-participating Parties in the base year and commitment period
iii
iii
iv
v
vi
12
11
19
20
33
23
34
26
34
36
35
45
42
50
44
54
56
58

Acronyms
AAU assigned amount units
BAU business as usual
CBDR-RC common but differentiated responsibilities and respective capabilities
CDM clean development mechanism
CER certified emission reduction
COP Conference of the Parties
CP1 first commitment period
CP2 second commitment period
CPR commitment period reserve
CRF common reporting format
ECBI European capacity building initiative
EIT economies in transition
ERU emission reduction unit
ESD effort-sharing decision
ET emissions trading
ETS emissions trading system
EU European Union
IET international emissions trading
ITL international transaction log
IPCC Intergovernmental Panel on Climate Change
IPPU industrial processes and product use
JI joint implementation
LCER long-term certified emission reductions
LULUCF land use, land-use change, and forestry
OECD Organisation for Economic Co-operation and Development
QELRC quantified emission limitation or reduction commitments
QELRO quantified emission limitation or reduction objectives
RMU removal units
SEF standard electronic format
tCER temporary certified emission reductions
UNFCCC United Nations Framework Convention on Climate Change
UNEP United Nations Environment Programme
USD US dollar
Unpacking Pre-2020 Climate Commitments: Who Delivered, How Much, and How will the Gaps be Addressed?
Image: iStock
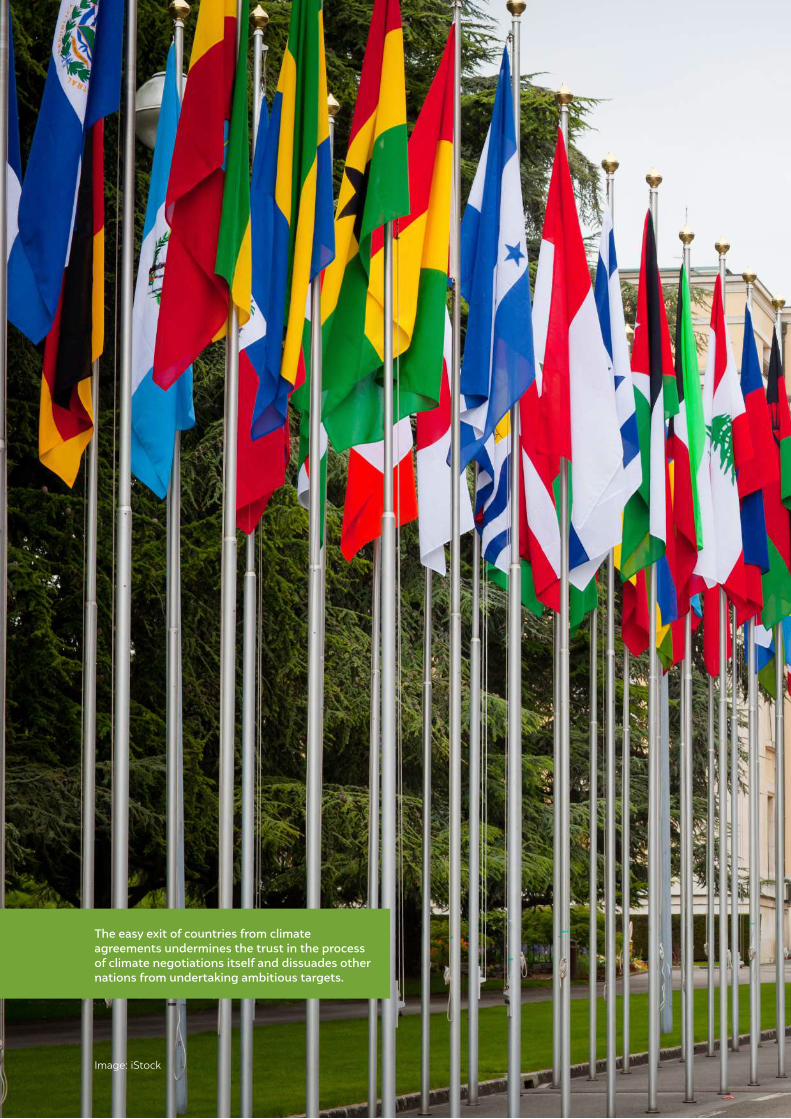
The easy exit of countries from climate agreements undermines the trust in the process of climate negotiations itself and dissuades other nations from undertaking ambitious targets.

i
In the last few years, the discussions on climate ambition have primarily focused on either nationally determined contribution (NDC) targets committed within the framework of
the Paris Agreement, or respective countries’ net-zero commitments. While these mid-century ambitions are essential for achieving the 1.5°C global warming target set in the Paris Agreement, it is equally important to study the outcomes of the emission reduction pledges made by developed countries before the Paris Agreement, in the pre-2020 climate regime. The fate of post-2020 negotiations for climate change crucially hinge upon the achievements, gaps, and issues recognised in the pre-2020 period.
However, post-2020 ambitions announced by developed countries have been set without due consideration of their past performance. Concerns continue to be expressed about the implementation of pre-2020 commitments by developing countries and were most recently emphasised in decision 1/CP.23. The issue was also discussed at the 25th Conference of Parties (COP 25) to the United Nations Framework Convention on Climate Change (UNFCCC).
The cost of unmet climate commitments by developed countriesThe significance of pre-2020 climate actions by developed countries can be broadly encapsulated across three dimensions: environmental, political, and economic.
• Environmental: The World Meteorological Organization highlighted that the global carbon dioxide concentration has already exceeded 410 parts per million (ppm), impacting our ecosystems, marine life, and increasing the global average temperature to record high levels (WMO 2021). There is a 40 per cent chance that the annual average global temperature would exceed 1.5°C above pre-industrial levels in the next five years (WMO 2021). This 1.5°C marker is identified as a key tipping point1 by the Intergovernmental Panel on Climate Change (IPCC) beyond which environmental risks are likely to be extreme (IPCC 2018).
• Political: The gaps in pre-2020 climate actions are also of grave concern from an equity
perspective. The developing countries have concerns of bearing the burden of tackling the mitigation gaps from the pre-2020 period in the future. Furthermore, it has caused a further fissure between the developed and developing country groupings, contributing to a mistrust on the next set of ambitions that were tabled in the negotiations.
i
Executive summary
Post-2020 climate ambitions announced by developed countries have been set without due consideration of their past performance
1. Tipping points are critical thresholds existing in any system, exceeding which can lead to an irreversible change in the state of the system. In this context, we are concerned with the physical climate system, ecosystems, and human systems, which are crucial to understand the different levels of climate change-related risks.

Unpacking Pre-2020 Climate Commitments: Who Delivered, How Much, and How will the Gaps be Addressed?ii
Both Kyoto Protocol (1997) and the Doha Amendment to the Kyoto Protocol (2012), assigned quantified emission reduction targets to developed countries
• Economic: The cost of mitigation efforts is expected to increase significantly in the future compared to the pre-2020 period. According to the World Economic Forum, inactions towards climate change would cost the world USD 1.7 trillion per year by 2050 (Januta 2021).
Based on the principle of equity and common but differentiated responsibilities and respective capabilities (CBDR-RC), the onus to reduce greenhouse gas emissions for a long time was placed on developed countries (also referred to as Annex I Parties). This principle was operationalised within the UNFCCC through two international climate agreements: the Kyoto Protocol (1997) and the Doha Amendment to the Kyoto Protocol (2012). Both these agreements assigned quantified emission reduction targets to developed countries, based on their 1990 emission levels. Under the Kyoto Protocol, an emission reduction target of 5 per cent, based on 1990 levels, was set to be achieved by developed countries in the first commitment period (2008–2012). In contrast, under the Doha Amendment, it was agreed that an emission reduction target of at least 18 per cent would be met by developed countries in the second commitment period (2013–2020).
Mapping emission mitigation achieved by developed countries in the pre-2020 periodResearch focusing on emission reductions in the pre-2020 period has been scarce. As a result, there is little clarity on the performance of developed countries under the Kyoto Protocol and the Doha Amendment. To fill this gap, CEEW has undertaken a review of mitigation outcomes for all developed countries vis-a-vis their overall commitment under the Kyoto Protocol and the Doha Amendment and the results are presented in this report. This first-of-its-kind accounting evaluation conducted in a developing country seeks to provide a clear picture of the performance of developed countries in the pre-2020 era. It does so by identifying areas of accounting concerns, gaps in achievements vis-à-vis set targets, and based on these, sets forth a framework for easy comparisons among mitigation achievements of developed countries. The key findings of our study are highlighted below.
Pre-2020 outcomes characterised by poor participation and performanceThe implementation of the Kyoto Protocol and the Doha Amendment witnessed several setbacks. Several developed countries did not participate in these climate agreement discussions. The lack of participation resulted in the Doha Amendment to the Kyoto Protocol not coming into force for almost its entire duration (before 31 December 2020).
In the first commitment period (2008–2012), a total of 36 Annex I countries and the European Union pledged emission reduction targets. Some of the notable exceptions were the United States and Canada. Furthermore, Cyprus, Malta, and Kazakhstan were not included among Annex I countries during the first commitment period and so have been mentioned among the non-participating countries in Table ES1. In the second commitment period (2013–2020), the participation fell significantly as other large emitters like Japan and the Russian Federation did not accept the new emission reduction targets of at least 18 per cent compared to their base year levels.

iiiExecutive summary
Furthermore, the countries that participated in the discussions on these two agreements also misused the existing accounting provisions to achieve their targets. The outcomes of our study provide a grim picture of the emission reductions that have been achieved by developed countries since 1990. The greenhouse gas emissions from Annex A sources2 for all Annex I Parties (both industrialised and economies in transition [EIT] countries3) declined only by about 14.8 per cent in 2019 compared to their base year emissions levels. This reduction is quite low considering the emission reduction targets were set at a minimum of 18 per cent below the 1990 levels to be achieved by 2020 under the Doha Amendment. More dramatically, the non-EIT Annex I Parties (majorly comprising industrialised countries) witnessed a meagre emission reduction of 3.7 per cent by 2019 compared to their base year emissions levels. Thus, the 14.8 per cent emission reduction was made possible largely due to the contribution of EIT countries, which collectively showed a decline of about 39 per cent below the base year emissions levels.
The impressive 39 per cent reduction in emissions achieved by the EIT countries is not due to emission reduction measures undertaken by them but were due to the economic downturn in the 1990–1997 period, during which the emissions declined by 38 per cent. The economic shock suffered by these countries was the outcome of their transition from a centrally planned economy to a market-based economy. This led to the generation of unearned
Annex I countries Kyoto Protocol (2008–2012) Doha Amendment (2013–2020)
Australia, Austria, Belgium, Bulgaria, Croatia, Czech Republic, Denmark, Estonia, European Union, Finland, France, Germany, Greece, Hungary, Iceland, Ireland, Italy, Japan, Latvia, Liechtenstein, Lithuania, Luxembourg, Monaco, Norway, New Zealand, Poland, Portugal, Romania, Russian Federation, Slovakia, Slovenia, Spain, Sweden, Switzerland, Ukraine, UK
Belarus, Canada, Turkey, United States, Kazakhstan, Cyprus, Malta
Australia, Austria, Belgium, Bulgaria, Croatia, Cyprus, Czech Republic, Denmark, Estonia, European Union, Finland, France, Germany, Greece, Hungary, Iceland, Ireland, Italy, Latvia, Liechtenstein, Lithuania, Luxembourg, Monaco, Malta, Norway, Poland, Portugal, Romania, Slovakia, Slovenia, Spain, Sweden, Switzerland, UK
Belarus, Canada, Japan, Kazakhstan, New Zealand, Russian Federation, Ukraine, Turkey, United States
Participating countries
Non-participating countries
2. The Annex A of the Kyoto Protocol enumerates the emission sources to be considered for compliance. These sources are energy, agriculture, industrial processes and products use, and waste. It does not include emissions from the land use, land-use change, and forestry (LULUCF) sector.
3. Economies in transition (EIT) countries are the countries whose economies are changing from previously being under government control to being a market economy. Some countries were part of the erstwhile Soviet Bloc and others were Central European countries with centrally planned economies.
Source: UNFCCC (2021)
Table ES1 Participation of countries in the Kyoto Protocol and the Doha Amendment
Figure ES1 Greenhouse gas emissions of Annex I countries without LULUCF (1990–2019)
Source: Authors’ analysis
0
5
10
15
20
1990
200
2
1996
200
8
2014
1993
200
5
1999
2011
2017
1991
200
3
1997
200
9
2015
1994
200
6
200
0
2012
2018
1992
200
4
1998
2010
2016
1995
200
7
200
1
2013
2019
14.8%
3.7%
39%
GtC
O2e
q
Base year emissions (Annex I countries)
Annex I countries
Non-EIT countries
EIT countries

Unpacking Pre-2020 Climate Commitments: Who Delivered, How Much, and How will the Gaps be Addressed?iv
emissions allowance4 (equivalent to about 28.4 GtCO2eq) acquired by these countries in the 2008–2020 period. These unearned emissions allowances are also referred to as ‘hot air’, resulting from inflated base year emissions.
Also, the non-participation of the United States in both the commitment periods adversely affected the global climate action in more than one way. The United States emitted about 11 and 26 per cent more than their estimated emission allowance in the Kyoto Protocol and the Doha Amendment,5 respectively. Citing US non-participation as the reason, Canada and Japan also withdrew from the climate agreements. New Zealand and the Russian Federation also did not accept new targets in the Doha Amendment. This led to additional usage of carbon space of about 10.9 GtCO2eq by non-participating countries than their estimated emission allowance in the Kyoto Protocol and the Doha Amendment.2 Also, Annex A emissions from the non-participating countries represented about 47 per cent (41.3 GtCO2eq ) in the first commitment period and 71 per cent (96.1 GtCO2eq) in the second commitment period of the total commitment period emissions by all developed countries (Table ES2).
Source: Authors’ analysis
Note: Numbers in red indicate additional usage of carbon space, while green represents unused carbon space.Assigned amount units (AAUs) represent the emissions allowance issued to a Party for a given commitment period. Each assigned amount unit is equivalent to 1 tCO2eq.
Table ES2 Outcomes of the pre-2020 regime
Agreements AspectsParticipating
countriesAnnex I
countries
Non-participating
countriesNon-EIT
countriesEIT
countries
Kyoto Protocol (2008–2012)
Pre-2020 regime(2008–2020)
Emissions (GtCO2eq)
Emission allowances (billion AAUs)
Unused/additional usage of carbon space (GtCO2eq)
Unearned emission allowance (GtCO2eq)
Net unused/additional usage of carbon space (GtCO2eq)
Emissions (GtCO2eq)
Emission allowances (billion AAUs)
Unused/additional usage of carbon space (GtCO2eq)
Unearned emission allowance (GtCO2eq)
Net unused/additional usage of carbon space (GtCO2eq)
88.0
94.7
6.6
12.4
-5.8
223.2
227.8
4.7
29.8
-25.1
46.7
57.7
10.9
11.1
-0.2
85.8
100.6
14.8
14.4
0.4
41.3
37.0
-4.3
1.2
-5.5
137.4
127.2
-10.2
15.4
-25.5
68.3
64.7
-3.5
0.5
-4.0
173.6
156.0
-17.6
1.4
-19.1
19.8
29.9
10.1
11.9
-1.8
49.6
71.9
22.3
28.4
-6.1
4. Unearned emission allowances are the additional emission allowances a country receives by taking advantage of accounting provisions.
5. Consider the overall target of climate agreement for non-participating countries: 5 per cent reduction in the Kyoto Protocol and 18 per cent reduction in the Doha Amendment.
Doha Amendment(2012–2020)
Emissions (GtCO2eq)
Emission allowances (billion AAUs)
Unused/additional usage of carbon space (GtCO2eq)
Unearned emission allowance (GtCO2eq)
Net unused/additional usage of carbon space (GtCO2eq)
135.1
133.2
-2.0
17.4
-19.4
39.0
42.9
3.9
3.3
0.6
96.1
90.2
-5.9
14.1
-20.0
105.3
91.2
-14.1
1.0
-15.1
29.8
41.9
12.1
16.4
-4.3
Annex I countries
Annex I countries
Downward or upward during
the commitment period
Additional cancellation of Kyoto units at
freewill
Misused accounting
provisions leading to unearned
carbon credits
vExecutive summary
Source: Authors’ analysis
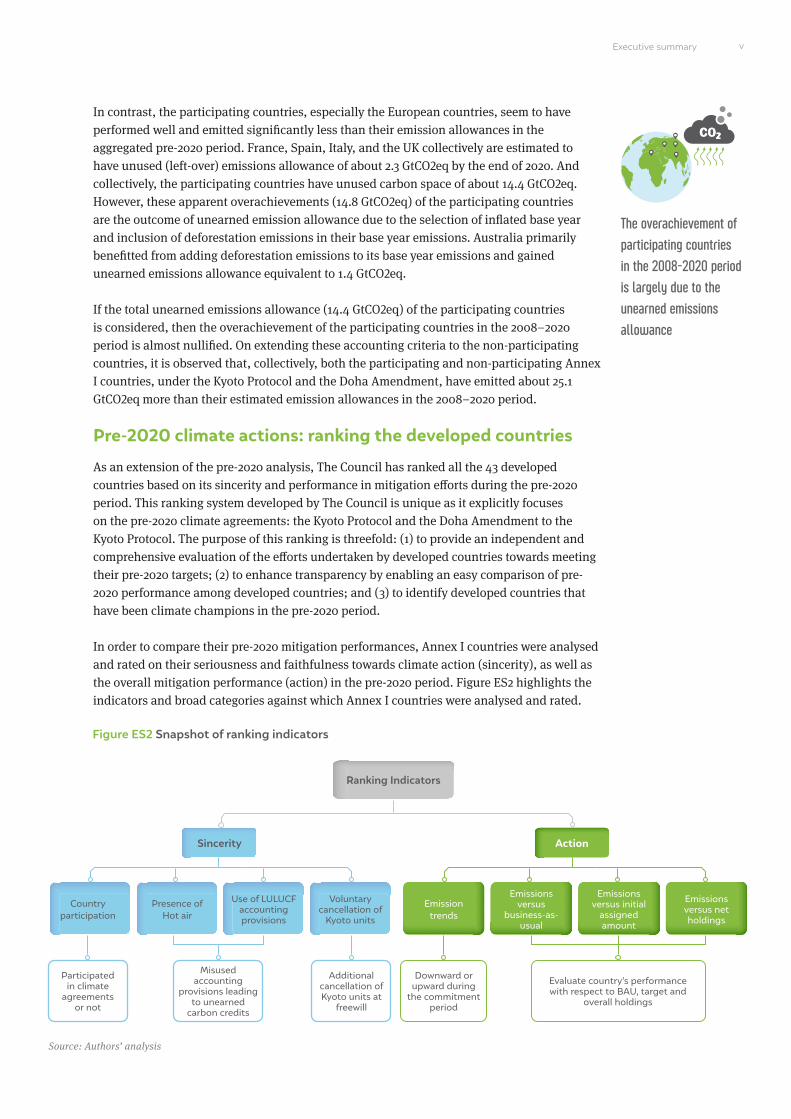
Figure ES2 Snapshot of ranking indicators
In contrast, the participating countries, especially the European countries, seem to have performed well and emitted significantly less than their emission allowances in the aggregated pre-2020 period. France, Spain, Italy, and the UK collectively are estimated to have unused (left-over) emissions allowance of about 2.3 GtCO2eq by the end of 2020. And collectively, the participating countries have unused carbon space of about 14.4 GtCO2eq. However, these apparent overachievements (14.8 GtCO2eq) of the participating countries are the outcome of unearned emission allowance due to the selection of inflated base year and inclusion of deforestation emissions in their base year emissions. Australia primarily benefitted from adding deforestation emissions to its base year emissions and gained unearned emissions allowance equivalent to 1.4 GtCO2eq.
If the total unearned emissions allowance (14.4 GtCO2eq) of the participating countries is considered, then the overachievement of the participating countries in the 2008–2020 period is almost nullified. On extending these accounting criteria to the non-participating countries, it is observed that, collectively, both the participating and non-participating Annex I countries, under the Kyoto Protocol and the Doha Amendment, have emitted about 25.1 GtCO2eq more than their estimated emission allowances in the 2008–2020 period.
Pre-2020 climate actions: ranking the developed countries
As an extension of the pre-2020 analysis, The Council has ranked all the 43 developed countries based on its sincerity and performance in mitigation efforts during the pre-2020 period. This ranking system developed by The Council is unique as it explicitly focuses on the pre-2020 climate agreements: the Kyoto Protocol and the Doha Amendment to the Kyoto Protocol. The purpose of this ranking is threefold: (1) to provide an independent and comprehensive evaluation of the efforts undertaken by developed countries towards meeting their pre-2020 targets; (2) to enhance transparency by enabling an easy comparison of pre-2020 performance among developed countries; and (3) to identify developed countries that have been climate champions in the pre-2020 period.
In order to compare their pre-2020 mitigation performances, Annex I countries were analysed and rated on their seriousness and faithfulness towards climate action (sincerity), as well as the overall mitigation performance (action) in the pre-2020 period. Figure ES2 highlights the indicators and broad categories against which Annex I countries were analysed and rated.
Sincerity
Country participation
Participated in climate
agreements or not
Evaluate country’s performance with respect to BAU, target and
overall holdings
Presence of Hot air
Use of LULUCF accounting provisions
Voluntary cancellation of
Kyoto units
Action
Emission trends
Emissions versus
business-as-usual
Emissions versus initial
assigned amount
Emissions versus net holdings
The overachievement of participating countries in the 2008-2020 period is largely due to the unearned emissions allowance
Ranking Indicators

Unpacking Pre-2020 Climate Commitments: Who Delivered, How Much, and How will the Gaps be Addressed?vi
The ranking reveals that European countries have performed relatively better than non-European countries. Sweden leads the overall action indicator performance with a score of 95 per cent, followed by the UK, Belgium, Denmark, Finland, France, and the Netherlands. While most of the EIT countries fall in the middle of the ranking order, the non-participating developed countries are placed at the bottom. Some major economies such as the Russian Federation, Turkey, Canada, and the United States have scored around 50 per cent and less.
Table ES3 Overall pre-2020 climate action ranking
Rank Country
Sincerity indicators Action indicators Overall
1
2
3
3
4
4
4
5
6
6
7
8
9
10
10
11
11
12
12
12
13
13
13
14
15
15
16
17
18
18
19
Swedende
UKde
Belgiumde
Denmarkde
Finlandde
Francede
Netherlandsde
Switzerlandde
Greecede
Italyde
Liechtenstein
Germanyde
Spainde
Austriade
Norway
Monaco
Luxembourgde
Hungarycde
Romaniacde
Czechiacde
Sloveniacde
Slovakiacde
Portugalde
Ukrainebc
Irelandde
Bulgariacde
Japanb
Estoniacde
Lithuaniacde
Croatiacde
Latviacde
8
8
8
8
8
8
8
8
8
8
8
8
8
8
8
8
8
8
8
8
8
8
8
6
8
8
6
8
8
8
8
7.5
6.5
6.5
6.75
6.5
6.5
6.5
7.25
6.25
6.5
7
6.5
6.5
6.5
7.25
6
5.25
4.5
4.5
4.25
4
4.25
5.25
2
6.25
4.25
4.25
4.25
4.5
4
4
8
8
8
8
8
8
8
8
8
8
8
8
8
8
8
8
8
8
8
8
8
8
8
7
8
8
7
8
8
8
8
7.75
7.75
7.50
7.25
7.25
7.25
7.25
6.25
7.00
6.75
6.00
6.25
5.75
5.25
4.50
5.50
6.25
6.25
6.25
6.50
6.50
6.25
5.25
6.50
3.75
5.75
3.75
5.25
4.75
5.25
4.75
16
16
16
16
16
16
16
16
16
16
16
16
16
16
16
16
16
16
16
16
16
16
16
13
16
16
13
16
16
16
16
15.25
14.25
14
14
13.75
13.75
13.75
13.5
13.25
13.25
13
12.75
12.25
11.75
11.75
11.5
11.5
10.75
10.75
10.75
10.5
10.5
10.5
8.5
10
10
8
9.5
9.25
9.25
8.75
95%
89%
88%
88%
86%
86%
86%
84%
83%
83%
81%
80%
77%
73%
73%
72%
72%
67%
67%
67%
66%
66%
66%
65%
63%
63%
62%
59%
58%
58%
55%
Max Max MaxScore Score Score %

viiExecutive summary
Our ranking makes it clear that developed countries have performed at various levels with respect to their emission reduction targets in the pre-2020 period. Also, the additional consumption of carbon space (25.1 GtCO2eq) is quite significant and needs to be addressed in order to limit the temperature below 1.5oC by 2100. However, the burden of these gaps emerging from the pre-2020 period should not be transferred to developing countries but distributed among developed countries themselves. Hence, the non-EIT Annex I countries, especially the non-participating countries, should consider revising or enhancing their future targets.
Another way to bridge this pre-2020 gap would be developed countries, which did not participate in the Kyoto Protocol and the Doha Amendment, purchasing the unsold certified emission reductions (CERs) and voluntarily cancel the unearned carbon emission allowance. This would be a win-win decision for both developing and developed countries because it would not only increase the demand of CERs in the sluggish market but also help developed countries comply with their pre-2020 targets without carrying them forward (post-2020 period).
Further, it is imperative to strengthen the accounting and compliance mechanism to fill the existing loopholes and ensure misuse of accounting does not occur in the post-2020 climate regimes. The accounting provisions should reflect environmental integrity and should not be curtailed at the convenience of the participating countries.
Finally, the easy exit of countries from climate agreement should be restricted as it not only results in additional burden but also undermines the trust in the process of negotiations itself and dissuades other nations from undertaking ambitious targets.
Source: Authors’ analysis
Note:a Countries that did not participate in the Kyoto Protocol, b Countries that did not participate in the Doha Amendment,c Economies in transition countries, d Part of European Union in the Kyoto Protocol, e Part of European Union in the Doha Amendment
Rank Country
Sincerity indicators
Max Max MaxScore Score Score %
Action indicators Overall
20
21
22
23
24
24
25
26
27
27
28
29
Cyprusae
USAab
New Zealandb
Polandcde
Australia
Icelandde
Maltaae
Russian Federationbc
Canadaab
Belarusabc
Turkeyab
Kazakhstanabc
6
4
6
8
8
8
6
6
4
4
4
4
4
2
4.5
4.5
4.5
6
4
2
2
0
2
0
7
6
7
8
8
8
7
7
6
6
6
6
3.00
3.25
2.25
3.25
2.75
1.25
1.75
2.75
1.00
3.00
0.00
0.00
13
10
13
16
16
16
13
13
10
10
10
10
7
5.25
6.75
7.75
7.25
7.25
5.75
4.75
3
3
2
0
54%
53%
52%
48%
45%
45%
44%
37%
30%
30%
20%
0%
Scoring percentage > 70%
50% <= Scoring percentage < 70%
Scoring percentage < 50%

Unpacking Pre-2020 Climate Commitments: Who Delivered, How Much, and How will the Gaps be Addressed?
Image: iStock
The delay in undertaking climate actions would make it impossible to meet the Paris Agreement goals.

The response to the ongoing COVID-19 pandemic brought the global economic activities in 2020 to a complete standstill (World Bank 2020). As expected, this economic slowdown
led to the largest fall in greenhouse gas emissions since the Second World War (IEA 2021). The last time the world witnessed a decline (in terms of annual percentage) in greenhouse gas emissions was the 1.3 per cent drop in global temperatures in 2009 due to the Global Financial Crisis (Friedlingstein, P; Houghton, R; Marland, G. et al. 2010). In 2020, the overall decline in emissions has been estimated to be around 4–7 per cent below the 2019 levels (World Meteorological Organization 2020). From the perspective of the Paris Agreement goals—limiting the global temperature to 2oC and restricting it to 1.5oC above the pre-industrial levels—this decline has no significant impact. As per the latest Emissions Gap Report (UNEP 2020), the overall reduction in emissions in 2020, at most, would result in 0.01oC decrease in global warming by 2050.
Meanwhile, the average concentration of greenhouse gas emissions continued to rise to record levels in 2020. As a result, 2020 became the third warmest year (2016 and 2019 being the top two) in the last decade (WMO 2021). Based on the current trajectory, it is expected that the global temperature would rise by 3.2oC compared to the pre-industrial levels by 2100 (UNEP 2020). This alarming projection calls for urgent action by all the countries to enhance and implement mitigation actions.
In the past few years, several countries have announced ambitious net-zero targets by 2050 (UNEP 2020) as a step towards mitigating adverse effects of climate change. Currently, 124 countries, which account for 61 per cent of global emissions, have made some kind of commitment towards a net-zero future (Black et al. 2021).
As the current climate negotiations discourse seems to be centred on either nationally determined contributions (NDCs) in accordance with the Paris Agreement or the 2050 net-zero targets, it is important not to lose focus on the outcomes of the emission reduction pledges made by developed countries under the pre-2020 regime. The targets currently announced by developed countries do not reflect their pre-2020 climate action performance and the additional gaps that emerged from it.
However, for post-2020 climate negotiations to move ahead collectively, it is imperative to resolve the unaddressed issues (e.g., emission gaps, unsold CERs, and others) of the pre-2020 period. Even the key negotiated outcome of COP 25—‘Chile Madrid Time of Action’—reiterated the relevance of the pre-2020 implementation and ambition (Streck 2020).
1. Introduction
9
The current discussion on climate negotiations is centred on future commitments with little focus on pre-2020 implementation or achievements

Unpacking Pre-2020 Climate Commitments: Who Delivered, How Much, and How will the Gaps be Addressed?
In 2007, the Intergovernmental Panel on Climate Change’s (IPCC) fourth assessment report had already stated that the emission reduction target needs to be as high as 40% by 2020 compared to 1990 levels in order to limit the global temperature increase to 2°C
10
Before discussing the socioeconomic, environmental, and political importance of pre-2020 climate actions, it is important to provide a context to the pre-2020 regime within the broader history of international climate negotiations. The next section provides a brief overview of the history of the pre-2020 regime; participation and non-participation of developed countries; timeline of the commitments; and finally, the purpose of conducting analysis of the pre-2020 climate action.
1.1 History of the pre-2020 regimeIn 1992, 154 nations came together to create a common legal framework to address climate change with the adoption of the United Nations Framework Convention on Climate Change (UNFCCC). Even after the framework was adopted, the negotiations lasted for over a year and UNFCCC entered into force only in March 1994.6 A total of 197 countries (also referred to as Parties to the Convention) are signatories to this framework so far (UNFCCC 2012b).
Contrary to expectations, the establishment of the UNFCCC did not expedite global progress towards climate action. It was not before the third session of the Conference of the Parties (COP) in 1997 that a consensus was finally reached on an agreement that set, for the first time, binding and quantified emission reduction targets for developed countries, also referred to as ‘Annex I Parties’ (both industrialised and economies in transition [EIT] countries7). This agreement, known as the Kyoto Protocol, also assigned a specific commitment period to Annex I Parties to meet their targets. Despite following a top-down approach, the Kyoto Protocol provided several flexible provisions to Annex I Parties to achieve their compliance. These provisions ranged from selection of the base year, making joint commitments, and market mechanisms.8 However, the guidelines for accounting, monitoring, and compliance procedures to enforce various provisions, compliance issues, and market mechanisms required for the implementation of the Kyoto Protocol could not be finalised before COP-7 (2001) at Marrakesh (UNFCCC 2001).
Eight years after its adoption, the Kyoto Protocol finally entered into force9 in February 2005 (BBC 2005). The first commitment period of the Protocol was set for five years (2008–2012) in which 37 Annex I participating countries were obligated to reduce their emissions by 5 per cent on an average below the 1990 levels (UNFCCC 2012a). However, this overall emission reduction target was criticised from the beginning as it was considered insufficient. In 2007, the Intergovernmental Panel on Climate Change’s (IPCC) fourth assessment report had already stated that the emission reduction target needs to be as high as 40 per cent by 2020 compared to 1990 levels in order to limit the global temperature increase to 2°C (Rosen 2015).
After the completion of the first commitment period, the Doha Amendment to the Kyoto Protocol was adopted for the next eight-year period (2013–2020). The average emission reduction target was further increased to at least 18 per cent by 2020 below the 1990 levels. However, even the new reduction targets (although much higher than the first commitment period) were not consistent with the findings of the IPCC report of limiting the average global temperature to 2oC above pre-industrial levels. As a result, developed countries were requested to revisit their pledges in 2014 and were given voluntary option to enhance their
6. In order to enter into force, the Convention required at least 50 countries to submit the instrument of ratification, acceptance, approval, or accession. This condition was met with the ratification by the 50th country in 1994.
7. Economies in transition countries are the countries whose economies are changing from being under government control to becoming a market economy.
8. The three market-based mechanisms included: (i) international emissions trading (IET) under Article 17; (ii) joint implementation ( JI) under Article 6; and (iii) the clean development mechanism (CDM) under Article 12 of the Kyoto Protocol.
9. The Protocol came into force after the ratification of the treaty by the Russian Federation. It needed ratification by countries representing 55 per cent of the total greenhouse gas emissions.

Copenhagen Accord commitments were formally recognised under the Cancun Agreements as non-binding emission reduction measures
11Introduction
targets by at least 25–40 per cent below the 1990 levels by 2020.10 The Doha Amendment did not come into force for almost its entire duration of commitment (2013–2020) and not before 31 December 2020 due to it not being ratified by at least three-fourths of the Parties to the Kyoto Protocol (144 countries).11
Between the Kyoto Protocol (1997) and the Doha Amendment (2012), the Copenhagen Accord was introduced in December 2009. In contrast to the Kyoto Protocol, the Copenhagen Accord used a bottom-up approach and was aimed at making emission reduction pledges to prevent the rise of average global temperature above 2oC compared to pre-industrial levels. Voluntary pledges were made by both developed as well as developing countries in the Accord. Major emitters such as the United States and Canada, who did not participate in the first and second commitment periods of the Kyoto Protocol, pledged for 17 per cent economy-wide emission reduction target below the 2005 levels in the Copenhagen Accord.
Soon after its adoption, the non-transparent and undemocratic approach adopted for the formulation of the Accord was questioned (IISD 2009). Further, the UNFCCC only took note of (acknowledged) the Copenhagen Accord, and no formal process was adopted. However, the Copenhagen Accord commitments were formally recognised under the Cancun Agreements (2010) as non-binding emission reduction measures by the Parties to the Convention. Furthermore, the Cancun Agreements also ensured greater transparency by all the countries and led to establishing the green climate fund (GCF) to support climate action in developing countries (NRDC 2010).
Thus, the pre-2020 regime primarily incorporates three international climate agreements—the Kyoto Protocol, the Doha Amendment, and the Copenhagen Accord—comprising emission reduction commitments made by developed countries in the pre-2020 period.
1.2 Participation and non-participation of Annex I countries
In the first commitment period (2008–2012), a total of 36 Annex I countries and the European Union pledged emission reduction targets. Some of the notable exceptions were the United States and Canada. Furthermore, Cyprus, Malta, and Kazakhstan were not included among Annex I countries during the first commitment period and so have been mentioned among the non-participating countries in Table 1.
10. Decision 1/CMP 8, paragraph 7.
11. Nigeria became the 144th nation to ratify the Doha Amendment on 2 October 2020. It ratified a day before the agreement was due to expire (Department of Climate Change, Nigeria 2020).
Annex I countries Kyoto Protocol (2008–2012) Doha Amendment (2013–2020)
Australia, Austria, Belgium, Bulgaria, Croatia, Czech Republic, Denmark, Estonia, European Union, Finland, France, Germany, Greece, Hungary, Iceland, Ireland, Italy, Japan, Latvia, Liechtenstein, Lithuania, Luxembourg, Monaco, Norway, New Zealand, Poland, Portugal, Romania, Russian Federation, Slovakia, Slovenia, Spain, Sweden, Switzerland, Ukraine, UK
Belarus, Canada, Turkey, United States, Kazakhstan, Cyprus, Malta
Australia, Austria, Belgium, Bulgaria, Croatia, Cyprus, Czech Republic, Denmark, Estonia, European Union, Finland, France, Germany, Greece, Hungary, Iceland, Ireland, Italy, Latvia, Liechtenstein, Lithuania, Luxembourg, Monaco, Malta, Norway, Poland, Portugal, Romania, Slovakia, Slovenia, Spain, Sweden, Switzerland, UK
Belarus, Canada, Japan, Kazakhstan, New Zealand, Russian Federation, Ukraine, Turkey, United States
Participating countries
Non-participating countries
Source: UNFCCC (2021); Authors’ analysis
Table 1 Participation of countries in the Kyoto Protocol and the Doha Amendment

Unpacking Pre-2020 Climate Commitments: Who Delivered, How Much, and How will the Gaps be Addressed?
Unlike the United States, Canada had initially ratified the Kyoto Protocol in 2002 but decided to eventually withdraw from the agreement in 2011, stating the penalties for not achieving compliance (amounting to $14 billion) would cripple its economy (The Guardian 2011). Also, the Canadian government argued that the Kyoto Protocol was an outdated agreement and an impediment to a global solution to climate change as it did not include participation from large emitters like the United States and China (BBC 2011).
In comparison to the first commitment period, the number of Annex I countries participating in the second commitment period fell significantly. Major emitters such as Japan, Ukraine, New Zealand, and the Russian Federation did not accept the new reduction targets of a minimum of 18 per cent. Similar to Canada, Japan too justified its withdrawal by stating that the second commitment period (2013-2020) was inadequate as it didn’t include the United States and China, which share more than half of the carbon space between them (Vidal 2010). On the other hand, New Zealand decided to commit for this period under the Convention instead of the Kyoto Protocol. By choosing not to be part of the Doha Amendment, New Zealand was able to commit a voluntary emission reduction target of 5 per cent for the 2013–2020 period as well. It also avoided the risk of penalties associated with non-compliance under the Doha Amendment to the Kyoto Protocol (New Zealand Parliament 2015). However, in 2015, New Zealand ratified the agreement in order to help the Doha Amendment come into force without taking the burden of quantified emission reduction commitments upon itself (Ministry for the Environment, New Zealand 2015).
Some countries chose not to participate and did not ratify the agreement, even after being assigned emission reduction targets. For example, the Annex I countries such as Ukraine, Belarus, and Kazakhstan had participated in the negotiations of the Doha Amendment and so were given emission reduction targets for the second commitment period (2013–2020). However, they decided not to ratify the Amendment due to their disagreement with the new provisions (particularly Article 3.7 pertaining to cancellation12) that were brought in to restrict the accumulation of surplus emissions allowance or ‘hot air’ (Kollmus 2013).
12
Figure 1 Pre-2020 climate regime
Source: UNFCCC (2021)
12. As per this rule, the country having made a commitment under the Doha Amendment can have an initial assigned amount units for the 2013–2020 period equal to the average emissions between 2008 and 2010 times the number of years in the commitment period. Any country having assigned emissions allowance above this limit will have to transfer them in their cancellation account.
2008-2012
First commitment period
2009
Copenhagen Accord
2010
Cancun Agreements
2013-2020
Second commitment period
Compared to the first commitment period, the number of Annex I countries participating in the second commitment period fell drastically

Apart from showcasing lack of seriousness to combat climate change, the non-participation of developed countries in the pre-2020 climate agreements had other significant implications as well. For example, the clean development mechanism (CDM), one of the market mechanisms under the Kyoto Protocol, was adversely affected due to non-participation. The basic premise of CDM is to help developed countries earn certified emission reductions (CERs) by investing in emission reduction or removal projects (also referred to as CDM projects) in developing countries. The CERs earned by developed countries through these CDM projects can be used by them to achieve compliance under the Kyoto Protocol and the Doha Amendment.
The non-participation of countries was one of the reasons13 for the reduction in demand for CERs from the industrialised countries. The price of one unit of CER fell from €23 in the early 2008 to less than €0.50 in 2012 (GiZ 2012). The resultant disparity between the supply and demand of the CERs led to the accumulation of millions of unsold CERs. Furthermore, it is estimated that about 3.2 billion additional CERs will be generated between 2020 and 2030 from various CDM projects, which have already been registered or at the validation stage (UNEP 2021).
1.3 Purpose of this researchUnder the UNFCCC, all the Parties (countries) recognised the historical responsibility of developed countries for their contribution to the high concentration of greenhouse gas emissions in the atmosphere. As a result, it was stated in Article 3.4 of the Convention that any climate action should necessary be guided on the principle of equity and common but differentiated responsibilities and respective capabilities (CBDR-RC). Based on their capabilities and responsibilities, developed countries were supposed to take the initiative in mitigation efforts and thus were also given quantified emission reduction targets under the Kyoto Protocol (1997) and Doha Amendment to the Kyoto Protocol (2012). Hence, the scope of this pre-2020 climate action analysis focuses on the commitments and performance of only developed countries.
The importance of analysing pre-2020 climate action of developed countries is manifold.
First, the gaps emerging from the pre-2020 era have economic, environmental, as well as political implications. The mitigation efforts are expected to be costlier in the future, and a further delay in undertaking adequate mitigation efforts would make it quite difficult to limit the average global temperature by 1.5°C above the pre-industrial levels. The political significance is also quite clear when we consider the concerns of developing countries who fear they may be overburdened with the emission reduction gaps from the pre-2020 period.
Second, the future of post-2020 climate negotiations depends on how transparent developed countries have been about their climate change mitigation achievements and gaps in the pre-2020 period. It is important to underline that a measurement, reporting, and verification (MRV) system for the pre-2020 period under the UNFCCC exists. It comprises annual and biennial reporting and review involving experts from both Annex I and non-Annex I countries. However, an independent comprehensive analysis of pre-2020 climate action would further help in recognising the extent to which developed countries have performed so far. As long as the issues from the pre-2020 period remain unaddressed, it would be difficult to trust
13. Other reasons for reduction in demand include the global financial crisis, lack of ambitious emissions reduction commitments, and import restriction of CERs by the EU and other industrialised countries.
An independent comprehensive analysis of pre-2020 climate action would further help in recognising the extent to which developed countries have performed so far
13Introduction

Unpacking Pre-2020 Climate Commitments: Who Delivered, How Much, and How will the Gaps be Addressed?
the commitments made by the developed countries for the post-2020 period. This analysis is aimed at enhancing transparency as well as help in increasing trust on the guiding principle of equity and CBDR-RC.
Third, a comprehensive evaluation of the progress made by the Annex I Parties in meeting their respective emissions reduction targets would be useful in providing recommendations for the post-2020 climate regime. The recommendations can support the formulation of negotiation positions for both developed and developing countries. It can also provide critical inputs to the round table at intersessional COP and other relevant climate change conferences, where countries, along with non-party stakeholders, deliberate on the implementation and ambitions of pre-2020 efforts. Fourth, the outcomes of this research can also provide insights to the upcoming global stocktaking process in the Paris Agreement.
In the subsequent section, the study’s methodology is discussed, which covers the accounting process, data sources, and key assumptions. This is followed by the discussion on each of the accounting components (base and target), analysis on emissions, and Kyoto market mechanisms. The impact of loopholes and the overall achievements or gaps in the pre-2020 period is discussed in detail. Finally, the developed countries are compared and ranked on the basis of their performance in the pre-2020 regime.
14
Outcomes of the pre-2020 research will be critical inputs to the round table at the climate change conferences

2. Methodology
In order to evaluate the mitigation performance of the developed countries in the pre-2020 period, it is important to closely analyse the various components of the accounting
mechanisms and its provisions. This sections highlights the existing methodology used to evaluate the countries performance towards its climate commitments. It summarises the accounting process of the UNFCCC along with various data sources, important assumptions and limitations.
Image: iStock
15
Unpacking Pre-2020 Climate Commitments: Who Delivered, How Much, and How will the Gaps be Addressed?
Image: iStock
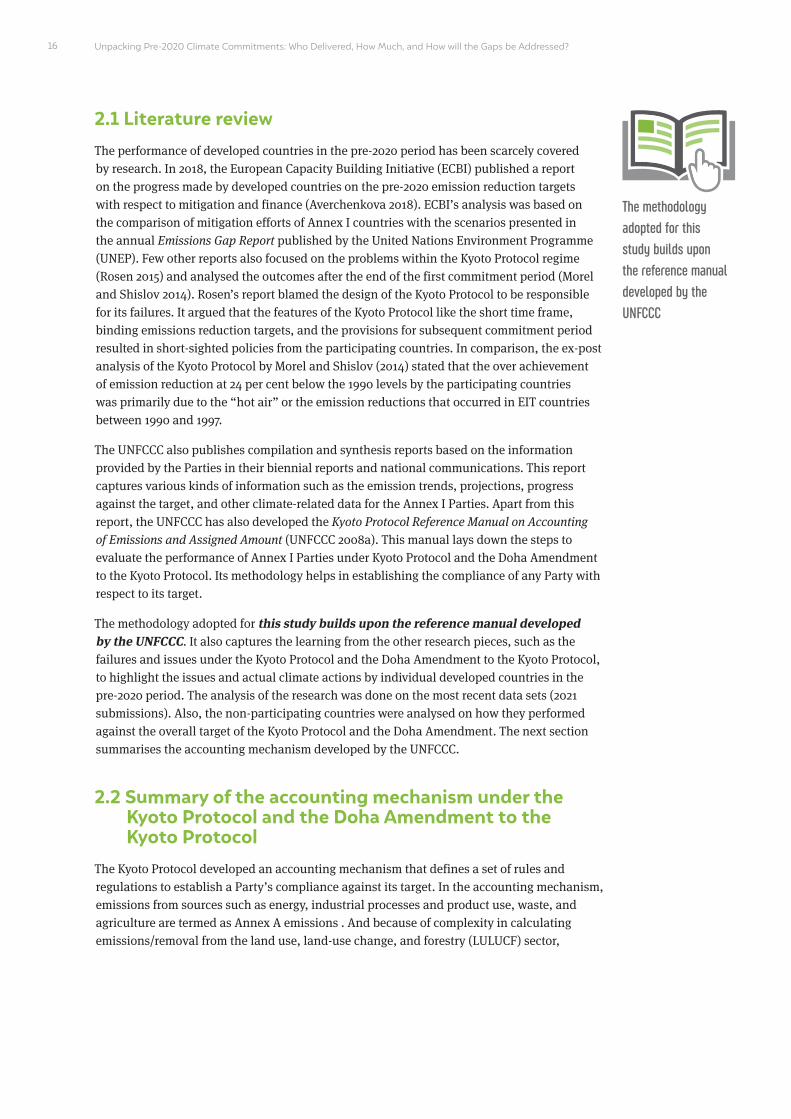
2.1 Literature reviewThe performance of developed countries in the pre-2020 period has been scarcely covered by research. In 2018, the European Capacity Building Initiative (ECBI) published a report on the progress made by developed countries on the pre-2020 emission reduction targets with respect to mitigation and finance (Averchenkova 2018). ECBI’s analysis was based on the comparison of mitigation efforts of Annex I countries with the scenarios presented in the annual Emissions Gap Report published by the United Nations Environment Programme (UNEP). Few other reports also focused on the problems within the Kyoto Protocol regime (Rosen 2015) and analysed the outcomes after the end of the first commitment period (Morel and Shislov 2014). Rosen’s report blamed the design of the Kyoto Protocol to be responsible for its failures. It argued that the features of the Kyoto Protocol like the short time frame, binding emissions reduction targets, and the provisions for subsequent commitment period resulted in short-sighted policies from the participating countries. In comparison, the ex-post analysis of the Kyoto Protocol by Morel and Shislov (2014) stated that the over achievement of emission reduction at 24 per cent below the 1990 levels by the participating countries was primarily due to the “hot air” or the emission reductions that occurred in EIT countries between 1990 and 1997.
The UNFCCC also publishes compilation and synthesis reports based on the information provided by the Parties in their biennial reports and national communications. This report captures various kinds of information such as the emission trends, projections, progress against the target, and other climate-related data for the Annex I Parties. Apart from this report, the UNFCCC has also developed the Kyoto Protocol Reference Manual on Accounting of Emissions and Assigned Amount (UNFCCC 2008a). This manual lays down the steps to evaluate the performance of Annex I Parties under Kyoto Protocol and the Doha Amendment to the Kyoto Protocol. Its methodology helps in establishing the compliance of any Party with respect to its target.
The methodology adopted for this study builds upon the reference manual developed by the UNFCCC. It also captures the learning from the other research pieces, such as the failures and issues under the Kyoto Protocol and the Doha Amendment to the Kyoto Protocol, to highlight the issues and actual climate actions by individual developed countries in the pre-2020 period. The analysis of the research was done on the most recent data sets (2021 submissions). Also, the non-participating countries were analysed on how they performed against the overall target of the Kyoto Protocol and the Doha Amendment. The next section summarises the accounting mechanism developed by the UNFCCC.
2.2 Summary of the accounting mechanism under the Kyoto Protocol and the Doha Amendment to the Kyoto Protocol
The Kyoto Protocol developed an accounting mechanism that defines a set of rules and regulations to establish a Party’s compliance against its target. In the accounting mechanism, emissions from sources such as energy, industrial processes and product use, waste, and agriculture are termed as Annex A emissions . And because of complexity in calculating emissions/removal from the land use, land-use change, and forestry (LULUCF) sector,
16
The methodology adopted for this study builds upon the reference manual developed by the UNFCCC

17
14. The emission reduction targets are referred to as quantified emission limitations or reduction objectives (QELRO) for the first commitment period and quantified emission limitations or reduction commitments (QELRC) for the second commitment period.
it is treated (accounted) differently from the Annex A emissions. Following are the key components of the accounting mechanisms:
• Base year: It is the reference year for a country or Party based on which its emission reduction target is set.
• Base year emissions: It is the emission in the base (reference) year on which the target is set. Majorly, base year emission comprises of Annex A emissions only. However, in some cases, a Party may also include emissions from deforestation activities coming from the LULUCF sector if the Party has gathered data on net emissions from the LULUCF sector in its base year.
• Target: It is the limitation of quantified emissions and reduction objectives/commitments14 vis-à-vis each country’s base year emissions.
• Commitment period: It is the duration within which a Party has to achieve its limitation and reduction objectives/commitments.
• Business-as-usual (BAU) emissions: It is a projection of a Party’s emissions from its base year emissions without considering any of its emission reduction measures. It serves as a reference level or baseline to compare with the existing policy scenario, which includes mitigation policies adopted by the Party under the pre-2020 regime.
• Initial assigned amount units (AAUs): It is the allocated carbon credits or emission allowance issued to a Party for a given commitment period. It is expressed in the form of assigned amount units (AAU), and each AAU is equivalent to 1 tCO2eq (UNFCCC 2008). It is derived from the base year emissions multiplied by the target and number of years in the commitment period. Parties are considered to have complied with their target if their overall emissions at the end of the commitment period are equal to or less than the initial AAUs.
• Kyoto Mechanism: In case a Party emits more than their initial amount unit, it could purchase additional emission allowance (carbon credits) from the market or through flexible mechanisms and meet the difference to comply with its target. The three market mechanisms under the Kyoto Protocol are emissions trading (ET), joint implementation (JI), and clean development mechanism (CDM). These market or flexible mechanisms generate Kyoto units such as certified emission reductions (CERs) from the CDM, emissions reduction units (ERUs) from JI, removal units (RMUs) from voluntary and elected LULUCF activities, and trading of the AAUs. A Party can opt to trade (buy or sell), cancel, or use (retire) these Kyoto units, that is, CERs, ERUs, RMUs, and AAUs.
Methodology
In the Kyoto Protocol’s accounting mechanism, emissions from sources such as energy, industrial processes and product use, waste, and agriculture are termed as Annex A emissions

Unpacking Pre-2020 Climate Commitments: Who Delivered, How Much, and How will the Gaps be Addressed?18
Each participating Party should have a registry at the national level to track the holdings and transactions of these Kyoto units. This registry is linked to the international transaction log (ITL) administered by the UNFCCC secretariat for additional verification of the transactions. A Party’s national registry has to meet the requirements for facilitating different types of transactions and to maintain specific types of accounts for the Kyoto units. The national registry may hold Kyoto units in its one or more accounts. Following are the different types of accounts a Party should maintain to track of transactions of Kyoto units:
• Issuance: This refers to the initial creation of a Kyoto unit (AAU, CER , RMU) by the registry. For ERU, the issuance process does not generate a new unit but converts it from an existing AAU or RMU.
• Addition: This transaction happens when Kyoto units are purchased or acquired by the Party from flexible mechanisms.
• Subtraction: This transaction happens when the Kyoto units are sold or cancelled by the Party.
• External transfer: This transaction refers to the transfer of Kyoto units from the national registry of one party to another.
• Cancellation: This transaction is for the Kyoto units, which are cancelled and can no longer be used to achieve compliance. The cancellation of Kyoto units can be of different types and are internally done by the Party’s national registry. The Kyoto units can be voluntarily cancelled if they are not needed for use under the existing rules and then are internally transferred to the voluntary cancellation account. The Kyoto units whose validity has expired or that are now invalid are transferred to the mandatory cancellation account. The units can also be cancelled by the Party to account for net emissions from its LULUCF activities under Articles 3.3 and 3.4 by transferring them to their net source cancellation account. Finally, the Kyoto units of a Party can be cancelled by the Compliance Committee in case of non-compliance and transferred to non-compliance cancellation account.
• Retirement: This transaction occurs when the Kyoto units are used by the Party to meet its emission reduction commitments. As per Article 3.1 of the Kyoto Protocol, in order to achieve compliance, a Party has to retire Kyoto units equivalent to its overall Annex A emissions in the commitment period. This is done by transferring the units to the Party’s retirement account.
• Carry over: This transaction results in the transfer of Kyoto units that were issued and valid in the first commitment period to remain valid and be carried over to the next commitment period.
After the completion of a particular commitment period, the compliance of a participating Party is ascertained by comparing its emissions from Annex A sources during the commitment period with its net holdings of Kyoto units. The net holdings are the Kyoto units held by a Party to be used for compliance purposes after taking into account all the external transfers and cancellation of units. In this study as well, the same compliance rules are used to evaluate country-wise performance in the pre-2020 period.
At the end of the commitment period, a Party’s compliance is ascertained based on the comparison of its emissions (except LULUCF) against the total number of Kyoto units it can retire

19
BOX 1
BOX 2
Formula associated with key components of accounting mechanism
Illustration of the accounting process
Annex A emissions = Emissions from energy, industrial processes and product use, agriculture, and waste sources
Base year emissions = Annex A emissions in base year + deforestation emissions in base year (in case LULUCF emissions are net positive in base year)
Business-as-usual (BAU) = Base year emissions × Commitment period
Initial assigned amount units (AAUs) = Base year emissions × Target × Commitment period
1 Kyoto unit = 1 AAU = 1 ERU = 1 RMU = 1 CER = 1 tCO2eq
Net Kyoto units = (Total issued and purchased/acquired Kyoto units – Sum of all external transactions of Kyoto units – Sum of all cancelled Kyoto units) = (Sum of all retired Kyoto units + Sum of all Kyoto units that are carried forward)
Condition for compliance with the target: Net holdings of Kyoto units ≥ Overall Annex A emissions during the commitment period
Figure 2 is an illustration for the accounting process used under the Kyoto Protocol and the Doha Amendment to the Kyoto Protocol.
Let us assume that the base year emissions of Party X is 20 ktCO2eq, of which 18 ktCO2eq comes from Annex A emission sources and 2 ktCO2eq is contributed by the deforestation emissions. Furthermore, if we assume the commitment period to be five years, then business-as-usual emissions for the commitment period of the Party is 100 ktCO2eq.
If the target of Party X is to limit its emissions to 70 per cent of its base year emissions (or reduce 30 per cent of its base year emissions), then the initial assignment amount units (emissions allowance) is estimated to be 70 kAAUs (equivalent to 70 ktCO2eq) for the five-year commitment period.
In case the cumulative Annex A emissions of the Party at the end of the commitment period is 80 ktCO2eq, then the Party will have to purchase additional emissions allowance of at least 10k Kyoto units (equivalent to 10 ktCO2eq) and retire all the Kyoto units (purchased and initially assigned) to meet its compliance.
In the illustration (Figure 2), the Party acquires additional 40k Kyoto units (equivalent to 40 ktCO2eq) from the market mechanism and has cumulative holdings of 130k Kyoto units. These additional Kyoto units could be in form of CERs, RMUs, or AAUs.
From this, if the Party voluntary cancels 5k Kyoto units and its net holding is 125k Kyoto units, which the Party uses to comply with its targets by retiring 80k Kyoto units, as well as requests for carry-over of 25k Kyoto units to the next commitment period.
Source: Authors’ analysis
Figure 2 Illustration of the accounting process
1 Ky
oto
unit
= 1
tC
O2e
q =
1 A
AU
Base year
18K2K
100K
70K
40K
Emission Allowance
80K
Annex A Emissions
80K
25K5K
Transactions
Annex A emissions
Deforestation emissions
Initial assigned amount unit
Kyoto units acquired or purchased (AAUs, RMUs, ERUs, CERs)
Commitment period emissions
Retired Kyoto units
Carry forward Kyoto units
Cancelled Kyoto units
Business as usual emissions for commitment period
Methodology

Unpacking Pre-2020 Climate Commitments: Who Delivered, How Much, and How will the Gaps be Addressed?
Table 2 KP-LULUCF activities in the Kyoto Protocol and the Doha Amendment
Source: UNFCCC
*Mandatory if elected in the first commitment period
2.2.1 Kyoto Protocol LULUCF accountingThe LULUCF sector is not included in the Annex A emissions accounting in the Kyoto Protocol and the Doha Amendment to the Kyoto Protocol. This is because of significant uncertainties and different procedural challenges in the accounting of the LULUCF sector (Krug 2018). However, it is accounted for and reported separately for the specific LULUCF activities. These incorporate the emissions and removals from direct human-induced LULUCF activities, mentioned in Articles 3.3 and 3.4 of the Kyoto Protocol. Table 2 showcases mandatory as well as voluntary Kyoto Protocol (KP) LULUCF activities. Parties can opt to report the change in the carbon stock or greenhouse gas emissions for LULUCF activities annually or at the end of the commitment period. If Party elects to report a voluntary LULUCF activity in the first commitment period, it is also required to be reported in the second commitment periods as well.
If a Party’s KP-LULUCF activities result in net removals, it is issued a corresponding amount of removal units (RMUs).15 In contrast, a Party’s net emissions due to KP-LULUCF activities result in an equivalent cancellation of other Kyoto units (AAUs, ERUs, and CERs). The accounting of net removals and net emissions resulting from the above-mentioned LULUCF activities are based on the rules stated in decision 2/CMP.716. This generally involves a comparison of greenhouse gas emissions and removals from activity occurring on land during a particular commitment period relative to a reference. This reference level can be zero, base year, or a selected reference level (UNFCCC 2018).
2.3 Data sourcesAll the Parties included in the Annex I of the Convention are obligated to submit their emissions data to UNFCCC. These data are submitted in the form of reports, such as a Biennial Report or national communications, and in Excel files termed as common reporting format (CRF). Furthermore, the Annex I Parties participating under the Kyoto Protocol and the Doha Amendment are also required to annually report supplementary data on KP-LULUCF activities and the transactions (addition, subtraction, cancellation, or retirement) of the different Kyoto units (CERs, RMUs, ERUs, and AAUs). The information related to emissions and transaction of different Kyoto units comes from national systems of greenhouse gas inventory and national registry, respectively, for each Annex I country.
15. RMU is equivalent to allowance of 1 tCO2e.
16. Decision taken in the seventh session of the Conference of the Parties serving as the meeting of the Parties to the Kyoto Protocol held in 2011.
20
KP-LULUCF activities First commitment period Second commitment period
Mandatory (Article 3.3)
Voluntary (Article 3.4)
Not specified
Mandatory (Article 3.3)
Voluntary (Article 3.4)*
Afforestation
Reforestation
Deforestation
Forest management
Cropland management
Grazing land management
Revegetation
Wetland drainage and rewetting

17. Initial reports contain base year emissions, which are considered by the UNFCCC for establishing AAUs.
21Methodology
In order to undertake a comprehensive evaluation of the past efforts of developed countries, The Council compiled all these data points from the UNFCCC database and country-wise reports such as the initial review report, true-up review reports, and the national inventory report. Apart from the submissions made to the UNFCCC, for EU, various studies related to effort-sharing decision and emission trading system were explored to establish individual EU member target in the Kyoto Protocol and the Doha Amendment to the Kyoto Protocol. For analysing the performance of the Annex I countries as stated under the Cancun Agreements, the study considered the latest available emissions data—2021 national inventory submissions—from their respective base year emissions till 2019. An Excel database was created where all these data sets were compiled and analysed.
2.4 Assumptions regarding data and limitationsWe observed that the emissions data for the historical years does not remain static and is recalculated with every iteration of a Party’s annual inventory submission due to methodological improvements, activity data updates, and expert review recommendations. So, even if a Party had the same base year for both the commitment periods, its value will be different across various inventory submissions. The study considers the inventory submission data selected by the Party while submitting their initial report17 for the first and second commitment periods. For the overall emissions from 1990 till 2019, latest data from the 2021 national inventory submissions are considered. Since data for 2020 was not available, a 4 per cent emission reduction is considered below the 2019 levels. This is based on estimates from the World Meteorological Organization, which has estimated the emission decline in 2020 to be around 4–7 per cent below the 2019 levels.
In the second commitment period, the transaction data of Kyoto units was not complete. As the Doha Amendment was not enforced for almost the entire duration of its commitment period, the data related to RMU units and related transactions of Kyoto units was not available. These include data on issued RMUs due to net removals and the cancelled Kyoto units as a result of net source emissions from the mandatory and elected LULUCF activities. Further, most of the Parties have selected the commitment period for accounting the LULUCF activities, so the data would be available only after the true-up period review in 2021–22.
For the purpose of our analysis, the base year is considered as 1990 for all the greenhouse gases (in both the commitment periods) for the non-participating Annex I Parties whose base year is not given. And their target is considered as per the overall emission reduction objectives of the agreement, that is, 5 and 18 per cent in the Kyoto Protocol and the Doha Amendment, respectively. Also, the data related to CERs, ERUs, and RMUs for non-participating countries is not available (as they are not obligated to report) and they are considered as zero.
In order validate these assumptions and solicit critical feedback on the pre-2020 research, The Council organised a stakeholder consultation. This was a closed-door virtual consultation where experts from across the globe participated and shared their views on the approach, assumptions, and findings. The feedback of the experts were duly considered and are incorporated in the report. The details of the consultation are given in the Annexure I.
For the overall emissions from 1990 till 2019, the latest data from the 2021 national inventory submissions are considered

Unpacking Pre-2020 Climate Commitments: Who Delivered, How Much, and How will the Gaps be Addressed?
Image: iStock
The overall emission reduction targets were set at a minimum of 5% and 18% below the 1990 levels under the Kyoto Protocol (2008-2012) and Doha Amendment (2013-2020), respectively.
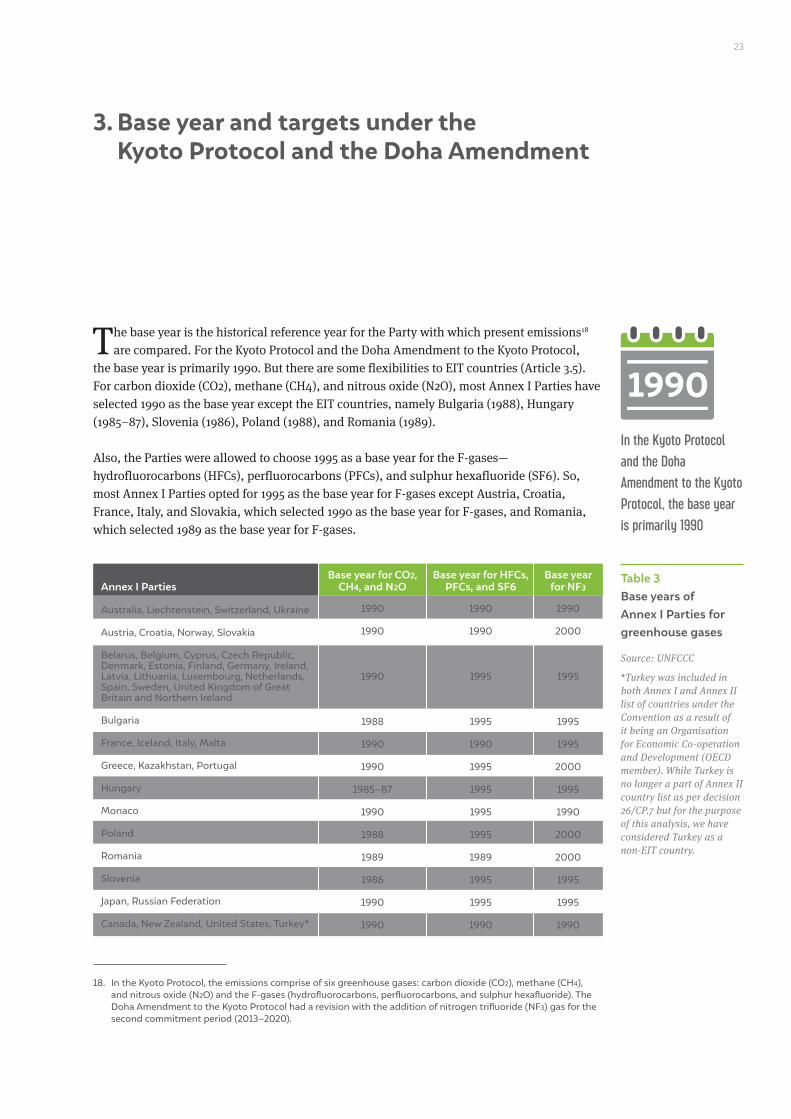
23
The base year is the historical reference year for the Party with which present emissions18 are compared. For the Kyoto Protocol and the Doha Amendment to the Kyoto Protocol,
the base year is primarily 1990. But there are some flexibilities to EIT countries (Article 3.5). For carbon dioxide (CO2), methane (CH4), and nitrous oxide (N2O), most Annex I Parties have selected 1990 as the base year except the EIT countries, namely Bulgaria (1988), Hungary (1985–87), Slovenia (1986), Poland (1988), and Romania (1989).
Also, the Parties were allowed to choose 1995 as a base year for the F-gases—hydrofluorocarbons (HFCs), perfluorocarbons (PFCs), and sulphur hexafluoride (SF6). So, most Annex I Parties opted for 1995 as the base year for F-gases except Austria, Croatia, France, Italy, and Slovakia, which selected 1990 as the base year for F-gases, and Romania, which selected 1989 as the base year for F-gases.
3. Base year and targets under the Kyoto Protocol and the Doha Amendment
In the Kyoto Protocol and the Doha Amendment to the Kyoto Protocol, the base year is primarily 1990
Table 3 Base years of Annex I Parties for greenhouse gases
Source: UNFCCC
*Turkey was included in both Annex I and Annex II list of countries under the Convention as a result of it being an Organisation for Economic Co-operation and Development (OECD member). While Turkey is no longer a part of Annex II country list as per decision 26/CP.7 but for the purpose of this analysis, we have considered Turkey as a non-EIT country.
Annex I PartiesBase year for CO2,
CH4, and N2OBase year for HFCs,
PFCs, and SF6Base year
for NF3
Australia, Liechtenstein, Switzerland, Ukraine
Austria, Croatia, Norway, Slovakia
Belarus, Belgium, Cyprus, Czech Republic, Denmark, Estonia, Finland, Germany, Ireland, Latvia, Lithuania, Luxembourg, Netherlands, Spain, Sweden, United Kingdom of Great Britain and Northern Ireland
Bulgaria
France, Iceland, Italy, Malta
Greece, Kazakhstan, Portugal
Hungary
Monaco
Poland
Romania
Slovenia
Japan, Russian Federation
Canada, New Zealand, United States, Turkey*
1990
1990
1990
1988
1990
1990
1985–87
1990
1988
1989
1986
1990
1990
1990
1990
1995
1995
1990
1995
1995
1995
1995
1989
1995
1995
1990
1990
2000
1995
1995
1995
2000
1995
1990
2000
2000
1995
1995
1990
18. In the Kyoto Protocol, the emissions comprise of six greenhouse gases: carbon dioxide (CO2), methane (CH4), and nitrous oxide (N2O) and the F-gases (hydrofluorocarbons, perfluorocarbons, and sulphur hexafluoride). The Doha Amendment to the Kyoto Protocol had a revision with the addition of nitrogen trifluoride (NF3) gas for the second commitment period (2013–2020).

Unpacking Pre-2020 Climate Commitments: Who Delivered, How Much, and How will the Gaps be Addressed?24
For the second commitment period, another F-gas, nitrogen trifluoride (NF3), was incorporated for which the Parties can choose 1995 or 2000 as the base year. The Annex I Parties that chose 1995 as the base year for NF3 include Norway, Austria, Croatia, Greece, Poland, Portugal, Romania, Slovakia, and Kazakhstan while the remaining ones selected 2000. For the purpose of our analysis, the base year for non-participating Annex I Parties in the both the commitment periods is selected as 1990 for all the greenhouse gases.
The base year selection is significant because it determines the value of a Party’s base year emissions, which in turn is used in the estimation of its emission allowance (initial assigned amount unit) for a given commitment period. The base year emissions for a Party were supposed to only consist of emissions from the Annex A sources. However, Australia pushed for the accommodation of provisions to include emissions from the LULUCF activities (deforestation) in the base year estimation. This resulted in the inclusion of Article 3.7(2), also colloquially referred to as the ‘Australia clause’ (Macintosh 2011), which enabled the Parties to include deforestation emissions in their base year emissions, provided they can prove net emissions from the LULUCF sector for that year. Thus, the base year emissions for an Annex I Party is a sum of Annex A emissions and (if condition of net emissions is met) emissions from deforestation activities from the selected base year.
Apart from Australia, the other Annex I Parties that have used this provision in order to increase their base year emissions were Denmark, Ireland, Liechtenstein, Netherlands, Luxembourg, Portugal, and the United Kingdom of the Great Britain and the Northern Ireland. Out of these Annex I Parties, Denmark, Liechtenstein, and Luxembourg used these provisions only during the second commitment period (2013–2020).
Annex B of the Kyoto Protocol as well as the Doha Amendment lists Annex I Parties together with their quantified emission targets. These targets are expressed in the form of percentage of emissions of their corresponding selected base year emissions. The emission targets for the first commitment period (CP1) were referred to as the quantified emission limitation or reduction objectives (QELRO) and those for the second commitment period were referred to as the quantified emission limitation or reduction commitments (QELRC).
Both the base year emissions as well as the emissions target (QELRO or QELRC) were used to calculate the Party’s initial assigned amount or emission allowance for the five years (first commitment period) and the eight-year period (second commitment period). This initial assigned amount is represented in assigned amount units (AAUs), each of which is equivalent to emission allowance of 1 tCO2e. The estimation of the initial assigned amount or emission allowance for all the Annex I Parties based on the commitment period and emissions target is given in Table 4.
The emission targets for the members of the EU differ from the one mentioned in Annex B of the Kyoto Protocol (or revised Annex B for the Doha Amendment) due to their internal effort-sharing mechanism and emissions trading system (ETS). For example, the joint emissions reduction target of the EU for the second commitment period (CP2) is mentioned as 80 per cent of its base year emissions. This can also be understood as a decrease in the total greenhouse gas emissions by 20 per cent from the 1990 levels. However, the emission reduction targets for the individual EU member states are allocated differently based on the
The base year selected by a Party determines the value of its GHG emissions as a benchmark to estimate emissions’ allowance for a given commitment period

25Base year and targets under the Kyoto Protocol and the Doha Amendment
emission targets under effort-sharing decision (ESD) and their allowances under the EU ETS cap and trade scheme (European Commission 2016). The ESD legislation was established by the EU as part of its 2020 climate energy package. It aimed to assign emission reduction targets for the sectors not covered in the EU ETS such as agriculture, transport, and buildings. The targets under the ESD were set up on the basis of GDP per capita of the EU member states (European Commission 2016).
So, the actual emission targets for EU member states like Austria and Czechia are 116 and 71 per cent, respectively, against their Doha Amendment base year emissions (generally emissions in 1990) instead of the joint 80 per cent target mentioned in the amended Annex B of the Kyoto Protocol (see Table 4). It is these adjusted emission reduction targets for the EU member states that are used in our analysis. Annexure II showcases the distribution of the internal effort-sharing mechanism and ETS among the EU countries.
In the first commitment period, Australia was one of the few Annex I Parties that had an emission target of 108 per cent, which means it was allowed to exceed its 1990 emissions level by 8 per cent. Several EU member states such as Greece, Iceland, Ireland, Spain, and Portugal too were allocated their targets in a manner that allowed them to exceed their own 1990 levels by 2012. However, the allocation was distributed in a manner such that it results in an overall joint reduction target of over 5 per cent for the first commitment period. Even, in the second commitment period (2013–2020), several EU member states are estimated to have been allocated targets that exceeded their 1990 emission levels. EU member states like Cyprus, Spain, and Portugal were given quantified emission reduction targets of 78, 36, and 32 per cent, respectively, above the 1990 levels. For the purpose of our analysis, the target for non-participating Annex I Parties was selected as 5 and 18 per cent as per the Kyoto Protocol and the Doha Amendment, respectively.
For analysis, the target for non-participating Annex I Parties was selected as 5% and 18% as per the Kyoto Protocol and the Doha Amendment, respectively

Unpacking Pre-2020 Climate Commitments: Who Delivered, How Much, and How will the Gaps be Addressed? 2726
S. No Country
Annex A emissions
Annex A emissions
Deforestation emissions
Deforestation emissionsTotal Total
BAU(MtCO2eq)
BAU(MtCO2eq)Target TargetAAU (10^6 AAUs) AAU (10^6 AAUs)
Table 4 Base year emissions, target, and initial assigned amount units (MtCO2eq)
1
2
3
4
5
6
7
8
9
10
11
12
13
14
15
16
17
18
19
20
21
22
23
24
25
26
27
28
29
30
31
Australia
Austriade
Belarusabc
Belgiumde
Bulgariacde
Canadaab
Croatiacde
Cyprusae
Czechiacde
Denmarkde
Estoniacde
Finlandde
Francede
Germanyde
Greecede
Hungarycde
Icelandde
Irelandde
Italyde
Japanb
Kazakhstanabc
Latviacde
Liechtenstein
Lithuaniacde
Luxembourgde
Maltaae
Monaco
Netherlandsde
New Zealandb
Norway
Polandcde
416.16
79.05
137.77
145.73
132.62
594.00
31.32
5.69
194.25
69.98
42.62
71.00
563.93
1232.43
106.99
115.40
3.37
55.60
516.85
1261.33
401.87
25.91
0.23
49.41
13.17
2.57
0.11
213.44
61.91
49.62
563.44
131.54
0.00
0.00
0.00
0.00
0.00
0.00
0.00
0.00
0.00
0.00
0.00
0.00
0.00
0.00
0.00
0.00
0.00
0.00
0.00
0.00
0.00
0.00
0.00
0.00
0.00
0.00
0.04
0.00
0.00
0.00
547.70
79.05
137.77
145.73
132.62
594.00
31.32
5.69
194.25
69.98
42.62
71.00
563.93
1232.43
106.99
115.40
3.37
55.61
516.85
1261.33
401.87
25.91
0.23
49.41
13.17
2.57
0.11
213.03
61.91
49.62
563.44
2738.50
395.25
688.83
728.64
663.09
2969.99
156.61
28.45
971.24
349.89
213.11
355.02
2819.63
6162.15
534.94
576.99
16.84
278.04
2584.25
6306.66
2009.36
129.55
1.15
247.07
65.84
12.85
0.54
1065.17
309.56
248.10
2817.21
108%
87%
92%
93%
92%
94%
95%
95%
92%
79%
92%
100%
100%
79%
125%
94%
110%
113%
94%
94%
95%
92%
92%
92%
72%
95%
92%
94%
100%
101%
94%
2957.58
343.87
633.73
674.00
610.05
2791.79
148.78
27.03
893.54
276.41
196.06
355.02
2819.63
4868.10
668.67
542.37
18.52
314.18
2416.28
5928.26
1908.89
119.18
1.06
227.31
47.40
12.21
0.50
1001.26
309.56
250.58
2648.18
418.62
78.86
133.46
147.81
114.11
612.87
31.20
5.63
198.32
70.79
40.00
71.35
548.06
1253.60
107.56
109.57
3.63
56.42
521.92
1294.86
392.84
26.41
0.23
48.20
12.87
1.97
0.10
223.20
65.83
51.92
580.02
148.16
0.00
0.00
0.00
0.00
0.00
0.00
0.00
0.00
0.01
0.00
0.00
0.00
0.00
0.00
0.00
0.00
0.01
0.00
0.00
0.00
0.00
0.00
0.00
0.27
0.00
0.00
0.75
0.00
0.00
0.00
566.79
78.86
133.46
147.81
114.11
612.87
31.20
5.63
198.32
70.80
40.00
71.35
548.06
1253.60
107.56
109.57
3.63
56.43
521.92
1294.86
392.84
26.41
0.23
48.20
13.14
1.97
0.10
223.95
65.83
51.92
580.02
4534.29
630.84
1067.66
1182.49
912.84
4902.93
249.64
45.02
1586.53
566.42
319.97
570.80
4384.45
10028.79
860.51
876.60
29.07
451.41
4175.36
10358.89
3142.71
211.27
1.85
385.57
105.13
15.80
0.79
1791.61
526.63
415.37
4640.16
99.5%
116%
82%
97%
59%
82%
100%
178%
71%
82%
48%
100%
96%
68%
105%
75%
111%
104%
94%
82%
90%
56%
84%
57%
91%
109%
78%
93%
82%
84%
65%
4511.62
732.58
875.48
1146.53
542.62
4020.40
250.33
80.14
1119.47
463.99
155.18
571.24
4229.59
6786.80
903.37
659.44
32.24
470.05
3918.97
8494.29
2821.84
118.30
1.56
217.95
95.41
17.25
0.62
1671.26
431.83
348.91
3017.54
Base year and targets under the Kyoto Protocol and the Doha Amendment
Base year emission (MtCO2eq) Base year emission (MtCO2eq)
KYOTO PROTOCOL DOHA AMENDMENT

Unpacking Pre-2020 Climate Commitments: Who Delivered, How Much, and How will the Gaps be Addressed? 29Base year and targets under the Kyoto Protocol and the Doha Amendment28
32
33
34
35
36
37
38
39
40
41
42
43
Portugalde
Romaniacde
Russian Federationbc
Slovakiacde
Sloveniacde
Spainde
Swedende
Switzerland
Turkeyab
Ukrainebc
UKde
USAab
59.17
278.23
3323.42
72.05
20.35
289.77
72.15
52.79
219.37
920.84
779.54
6437.00
19682.44
13372.94
6309.50
5806.03
11884.17
7798.27
0.98
0.00
0.00
0.00
0.00
0.00
0.00
0.00
0.00
0.00
0.37
0.00
132.93
132.93
0.00
1.39
132.93
0.00
60.15
278.23
3323.42
72.05
20.35
289.77
72.15
52.79
219.37
920.84
779.90
6437.00
19814.92
13505.43
6309.50
5806.97
12016.66
7798.27
300.74
1391.13
16617.10
360.25
101.77
1448.87
360.76
263.95
1096.84
4604.18
3899.52
32185.00
99074.62
67527.13
31547.49
29034.86
60083.29
38991.33
127%
92%
100%
92%
92%
115%
104%
92%
95%
100%
88%
95%
96%
94%
98%
92%
96%
95%
381.94
1279.84
16617.10
331.43
93.63
1666.20
375.19
242.84
1042.00
4604.18
3412.08
30575.75
94632.14
63777.88
30854.26
26768.34
57640.75
36991.39
60.75
304.92
3744.65
74.27
20.33
283.36
72.06
53.71
207.77
937.95
802.95
6397.14
20182.09
13425.84
6756.24
5870.13
6394.71
13787.37
4.28
0.00
0.00
0.00
0.00
0.00
0.00
0.00
0.00
0.00
0.25
0.00
153.73
153.73
0.00
5.56
153.73
0.00
65.03
304.92
3744.65
74.27
20.33
283.36
72.06
53.71
207.77
937.95
803.19
6397.14
20335.81
13579.57
6756.24
5875.69
6548.44
13787.37
520.22
2439.36
29957.19
594.17
162.62
2266.89
576.46
429.65
1662.19
7503.63
6425.53
51177.16
162686.49
108636.55
54049.94
47005.54
52387.51
110298.98
132%
52%
82%
81%
95%
136%
112%
84%
82%
76%
64%
82%
82%
84%
78%
80%
82%
82%
687.72
1268.16
24564.90
480.08
154.93
3082.71
643.22
361.77
1362.99
5702.76
4087.35
41965.27
133068.68
91119.69
41948.99
37604.43
42828.91
90239.77
Annex I countries
Non-EIT countries
EIT countries
EU countries
Participating countries
Non-participating countries
S. No Country
Annex A emissions
Deforestation emissions
Deforestation emissionsTotal Total
BAU(MtCO2eq)
BAU(MtCO2eq)Target TargetAAU (10^6 AAUs) AAU (10^6 AAUs)
Annex A emissions
Source: Authors’ analysis
Note:a Countries that did not participate in the Kyoto Protocol; b Countries that did not participate in the Doha Amendment; c Economies in transition countries; d Part of the European Union in the Kyoto Protocol; e Part of the European Union in the Doha Amendment
Base year emission (MtCO2eq)Base year emission (MtCO2eq)
DOHA AMENDMENT KYOTO PROTOCOL

Unpacking Pre-2020 Climate Commitments: Who Delivered, How Much, and How will the Gaps be Addressed?
Image: flickr
Cancun Agreements included both the minimum unconditional target and ambitious conditional target for countries.

31
The emissions reduction targets submitted by Annex I countries in the Cancun Agreements were quite diverse and include both the minimum unconditional target and a more
ambitious conditional target that depends on similar emission reduction commitments undertaken by all the other developed countries. Further, the countries were offered flexibilities in terms of selection of their respective base years as well their own emissions targets for 2020. Australia selected 2000 as its base year, while both the United States and Canada chose 2005 as their base year. Most of the Annex I countries including the EU member states, EIT countries (except Kazakhstan19), Japan, Iceland, the Russian Federation, New Zealand, and Norway chose 1990 as their base year.
The EU and its members states pledged emission reduction targets of 20 per cent (unconditional) and 30 per cent (conditional) below the 1990 levels. These targets were similar to the ones made by them for the second commitment period under the Doha Amendment to the Kyoto Protocol (UNFCCC 2012a). Iceland committed to a 30 per cent reduction in emissions jointly with the EU and its member states. Other countries like Japan and the Russian Federation pledged for emission reduction targets of about 15–25 per cent. Both the United States and Canada had set an emission reduction target of 17 per cent below the 2005 levels by 2020. Annexure II presents the targets stated by the countries that were part of the Cancun Agreements.
4. Base year and targets under the Cancun Agreements
Under the Cancun Agreements, the United States and Canada had set emissions target of 17% below 2005 levels by 2020
19. Kazakhstan is the only EIT country to select 1992 as its base year.

Unpacking Pre-2020 Climate Commitments: Who Delivered, How Much, and How will the Gaps be Addressed?22
Image: iStock
The non-EIT Annex I countries showed emissions decline of only 3.7 per cent by 2019 compared to their 1990 levels.

33
The Annex A emission trends for all the Annex I countries for the 1990–2019 period show an overall decline of 14.8 per cent of emissions. The non-EIT countries witnessed only
a 3.7 per cent reduction in emissions by 2019 over their base year emissions levels while the EIT countries, which were part of the erstwhile Soviet Bloc and other Central and Eastern European countries with centrally planned economies, showed a drop of 39 per cent in emissions by 2019. Therefore, the emission trends clearly indicate that the 14.8 per cent overall emission reduction for the Annex I countries between 1990 and 2019 is primarily contributed by the EIT countries.
By including the LULUCF sector, the total aggregate emissions of Annex I countries is seen to decline by around 18.6 per cent till 2019 below their base year emission levels. The non-EIT countries were able to achieve an emission reduction (including LULUCF) of only 5 percent by 2019 below the base year emission levels. On the other hand, the EIT countries achieved a reduction (including LULUCF) of about 47 per cent in emissions till 2019.
Assuming emissions for 2020, for Annex I countries, the emissions (without LULUCF) would reduce by 18.2 per cent by 2020 of their base year emissions levels. The emission reduction in non-EIT Annex I countries is estimated to be around 7.6 per cent by 2020 compared to their base year emissions levels. The EIT countries would witness a decline of about 41 per cent in emissions in the same year.
5. Analysis of emissions
Figure 3 Greenhouse gas emissions of Annex I countries without LULUCF (1990–2019)
Source: Authors’ analysis
0
5
10
15
20
1990
200
2
1996
200
8
2014
1993
200
5
1999
2011
2017
1991
200
3
1997
200
9
2015
1994
200
6
200
0
2012
2018
1992
200
4
1998
2010
2016
1995
200
7
200
1
2013
2019
14.8%
3.7%
39%
GtC
O2e
q
Base year emissions (Annex I countries)
Annex I countries
Non-EIT countries
EIT countries

Unpacking Pre-2020 Climate Commitments: Who Delivered, How Much, and How will the Gaps be Addressed?34
5.1 Country-wise scenarioAmong the non-EIT countries, we observed that 11 developed countries had a positive increase in emissions in the period 1990–2019. Turkey recorded the highest increase in emissions of 130 per cent above the 1990 levels, followed by Cyprus at 59 per cent, Australia at 29 per cent, and Iceland at 28 per cent. Apart from Turkey, the United States and Canada (which did not participate in either of the two commitment periods under the Kyoto Protocol) exceeded their 1990 emissions levels by 2 per cent and 21 per cent, respectively. It is important to underline that 2 per cent increase in emissions for the United States amounts to 128 MtCO2eq and 130 per cent increase in Turkey’s emissions adds up to 285 MtCO2eq.
Further, the emissions in UK show a decline of 43 per cent in 2019 below the 1990 levels. Germany and Sweden also recorded a reduction of 35 and 29 per cent in emissions, respectively, from their 1990 levels. The EIT countries witnessed the highest decline below the 1990 levels (Figure 4). Ukraine achieved the highest decline in emissions of 65 per cent by 2019. The Baltic countries—Latvia, Lithuania, and Estonia—also witnessed a significantly high emission reduction between 55 and 65 per cent compared to their 1990 emission levels. In absolute terms, the Russian Federation achieved the highest emission reduction of 1,039 MtCO2eq.
Figure 4 Non-EIT countries: Percentage change in 2019 emissions from the 1990 levels
Source: Authors’ analysis
Figure 5 EIT countries: Percentage change in 2019 emissions from the 1990 levels
Source: Authors’ analysis
Aus
tral
iaB
elar
us
Bul
gar
ia
Cro
atia
Cze
chia
Esto
nia
Hun
gar
y
Kaz
akhs
tan
Latv
ia
Lith
uani
a
Pol
and
Rom
ania
Rus
sian
Fed
erat
ion
Slov
akia
Slov
enia
Ukr
aine
Can
ada
Cyp
rus
Den
mar
k
Finl
and
Fran
ce
Ger
man
y
Gre
ece
Icel
and
Irel
and
Ital
y
Jap
an
Liec
hten
stei
n
Luxe
mb
ourg
Mal
ta
Mon
aco
Net
herl
and
s
New
Zea
land
Nor
way
Por
tug
al
Spai
n
Swed
en
Swit
zerl
and
Turk
ey
UK
USA
Aus
tria
Bel
giu
m
29%
2%
-20%
-35%
-25%
-38%-32%
-57% -57% -55%
-33%
-46%
-65%
-8% -8%
-18%
-64%
-44%
-37% -35%-25%
-20% -17% -19%
-5% -2%
-18% -18%-29%
-14%
-43%
-16% -16%-20%
2%
21%
59%
28%
10%
26%
130%
8% 8%

35Analysis of emissions
5.2 Emissions in the commitment periodsThe overall Annex A emissions (without LULUCF) for all Annex I countries was about 88 GtCO2eq in the first commitment period. In the second commitment period, the emissions are estimated to be around 135.1 GtCO2eq. Non-EIT countries emitted 68.3 GtCO2eq in the first commitment period and estimated to emit around 105.3 GtCO2eq in the second commitment period. In contrast, the EIT countries emitted about 19.8 GtCO2eq in the first commitment period and are expected to emit 29.8 GtCO2eq in the second commitment period. The country with the highest emissions in both the commitment periods was the United States, representing almost 39 per cent of the total emissions. This was followed by the Russian Federation (12 per cent), Japan (7–8 per cent), Germany (5 per cent), and Canada (4 per cent).
Figure 6 depicts the ratio of Annex A emissions in developed countries with respect to their initial AAUs, that is, initial emission allowance for the given commitment period. We observed that collectively the Annex I countries seem to have emitted less than their emission allowance in the first commitment (93 per cent), but they are estimated to exceed the allowance in the second commitment period by almost 2 per cent. Also, the non-EIT countries emitted more than their initially assigned emission allowance in the both the commitment periods (107 per cent in the first commitment period and 116 per cent in the second commitment period). The EIT countries have emitted significantly less with respect to their assigned emission allowances (64 per cent in the first commitment period and 71 per cent in the second commitment period).
The non-EIT countries such as Australia, Belgium, Finland, France, Greece, Netherlands, Portugal, and UK emitted less than their emission allowances in the both the commitment periods (see Table 5). While Canada, Iceland, Japan, Malta, New Zealand, Norway, Switzerland, Turkey, and the United States have emitted more than their emission allowances in both the commitment periods. All the EIT countries have emitted less than their estimated emission allowance in the first commitment period. While in the second commitment period, Poland is the only EIT that is expected to emit more than its estimated emission allowance.
Figure 6 Commitment period emissions versus initial assigned amount units
Source: Authors’ analysis
The country with the highest emissions in both the commitment periods was the United States, representing almost 39% of the total emissionsAll Annex I countries
Non-EIT countries
EIT countries
Kyoto protocol (2008-2012) Doha Amendment (2013-2020)
93% 102%
107% 116%
64% 71%

Unpacking Pre-2020 Climate Commitments: Who Delivered, How Much, and How will the Gaps be Addressed? 37Analysis of emissions36
Annex A emission**
Annex A emissionKP-LULUCF KP-LULUCF
Annex A emissions versus BAU
Annex A emissions versus BAU
Annex A emissions versus Initial AAUs
Annex A emissions versus Initial AAUs
Table 5 Emissions during the commitment period
2711.2
414.7
444.7
626.3
312.9
3519.5
144.8
47.6
680.1
297.9
95.3
338.4
2538.9
4706.6
598.5
336.0
23.4
308.5
2479.6
6392.4
1462.6
56.5
1.2
109.8
60.1
15.2
0.5
997.1
372.8
266.8
2006.3
145.0
–6.8
1.1
–3.6
–40.4
–29.3
–2.6
2.4
–175.2
–258.6
–250.3
–9.2
–15.8
–3.3
–16.3
–160.4
–246.7
–61.9
–52.0
–0.4
2.1
–70.7
–145.3
–192.8
99%
105%
65%
86%
47%
119%
92%
167%
70%
85%
45%
95%
90%
76%
112%
58%
139%
111%
96%
101%
73%
44%
102%
44%
91%
118%
88%
94%
120%
108%
71%
92%
121%
70%
93%
51%
126%
97%
176%
76%
108%
49%
95%
90%
97%
90%
62%
126%
98%
103%
108%
77%
47%
111%
48%
127%
125%
95%
100%
120%
106%
76%
4297.9
631.0
711.3
935.8
461.1
5753.8
190.3
68.4
1012.2
386.7
151.2
450.0
3620.7
6989.1
745.0
496.0
37.7
481.3
3436.3
10287.0
2755.1
86.7
1.6
161.2
84.4
18.3
0.7
1495.1
642.1
418.0
3174.3
154.2
-42.0
-13.0
-81.2
-51.9
-1.2
-1.5
15.1
-28.7
-270.9
-365.8
-214.9
-16.1
-30.9
-7.7
16.0
-311.7
-327.1
-70.3
-17.8
0.1
-52.1
-3.3
-4.0
-263.0
-142.9
-259.7
95%
100%
67%
79%
51%
117%
76%
152%
64%
68%
47%
79%
83%
70%
87%
57%
130%
107%
82%
99%
88%
41%
84%
42%
80%
116%
86%
83%
122%
101%
68%
95%
86%
81%
82%
85%
143%
76%
85%
90%
83%
97%
79%
86%
103%
82%
75%
117%
102%
88%
121%
98%
73%
100%
74%
88%
106%
110%
89%
149%
120%
105%
Country
Australia
Austriade
Belarusabc
Belgiumde
Bulgariacde
Canadaab
Croatiacde
Cyprusae
Czechiacde
Denmarkde
Estoniacde
Finlandde
Francede
Germanyde
Greecede
Hungarycde
Icelandde
Irelandde
Italyde
Japanb
Kazakhstanabc
Latviacde
Liechtenstein
Lithuaniacde
Luxembourgde
Maltaae
Monaco
Netherlandsde
New Zealandb
Norway
Polandcde
Commitment period emissions**Commitment period emissions
KYOTO PROTOCOL DOHA AMENDMENT
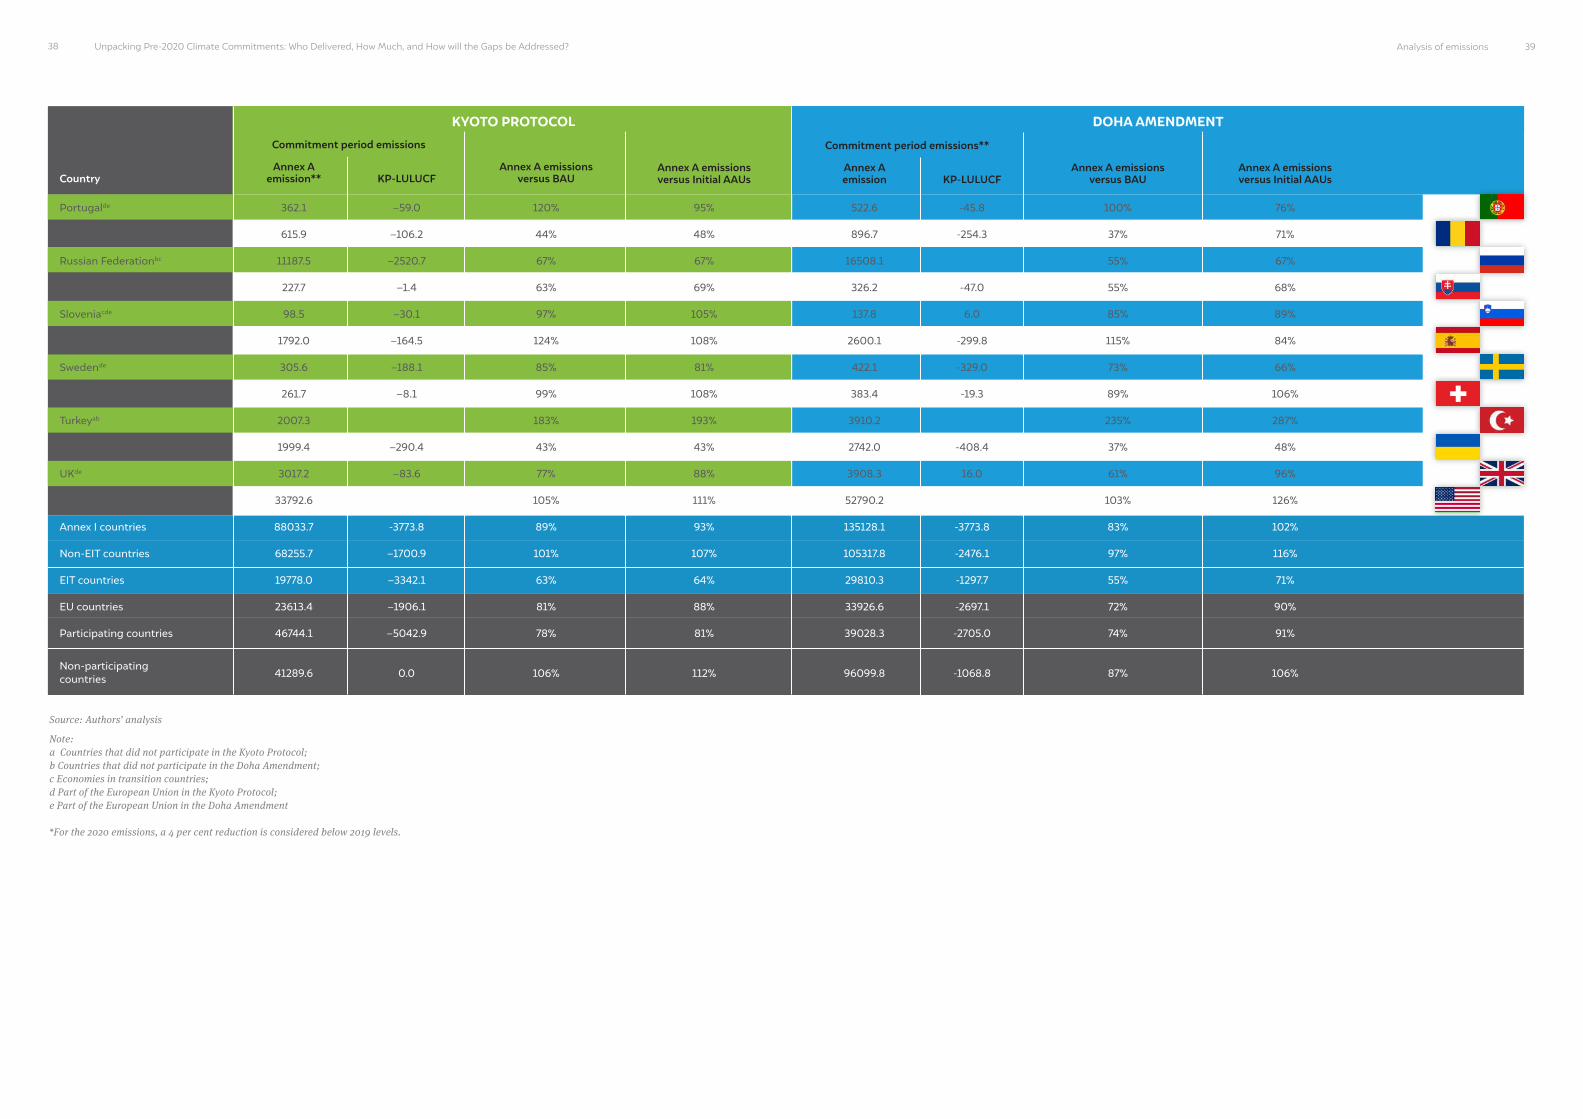
Unpacking Pre-2020 Climate Commitments: Who Delivered, How Much, and How will the Gaps be Addressed?
CountryAnnex A
emission** KP-LULUCF Annex A emissions
versus BAUAnnex A emissions versus Initial AAUs
Portugalde
Romaniacde
Russian Federationbc
Slovakiacde
Sloveniacde
Spainde
Swedende
Switzerland
Turkeyab
Ukrainebc
UKde
USAab
Annex I countries
Non-EIT countries
EIT countries
EU countries
Participating countries
Non-participating countries
362.1
615.9
11187.5
227.7
98.5
1792.0
305.6
261.7
2007.3
1999.4
3017.2
33792.6
88033.7
68255.7
19778.0
23613.4
46744.1
41289.6
–59.0
–106.2
–2520.7
–1.4
–30.1
–164.5
–188.1
–8.1
–290.4
–83.6
-3773.8
–1700.9
–3342.1
–1906.1
–5042.9
0.0
120%
44%
67%
63%
97%
124%
85%
99%
183%
43%
77%
105%
89%
101%
63%
81%
78%
106%
95%
48%
67%
69%
105%
108%
81%
108%
193%
43%
88%
111%
93%
107%
64%
88%
81%
112%
522.6
896.7
16508.1
326.2
137.8
2600.1
422.1
383.4
3910.2
2742.0
3908.3
52790.2
135128.1
105317.8
29810.3
33926.6
39028.3
96099.8
-45.8
-254.3
-47.0
6.0
-299.8
-329.0
-19.3
-408.4
16.0
-3773.8
-2476.1
-1297.7
-2697.1
-2705.0
-1068.8
100%
37%
55%
55%
85%
115%
73%
89%
235%
37%
61%
103%
83%
97%
55%
72%
74%
87%
76%
71%
67%
68%
89%
84%
66%
106%
287%
48%
96%
126%
102%
116%
71%
90%
91%
106%
Annex A emission KP-LULUCF
Annex A emissions versus BAU
Annex A emissions versus Initial AAUs
38 39Analysis of emissions
Commitment period emissions Commitment period emissions**
KYOTO PROTOCOL DOHA AMENDMENT
Source: Authors’ analysis
Note:a Countries that did not participate in the Kyoto Protocol; b Countries that did not participate in the Doha Amendment; c Economies in transition countries; d Part of the European Union in the Kyoto Protocol; e Part of the European Union in the Doha Amendment
*For the 2020 emissions, a 4 per cent reduction is considered below 2019 levels.

Unpacking Pre-2020 Climate Commitments: Who Delivered, How Much, and How will the Gaps be Addressed?3022
Image: iStock
In order to achieve compliance in a particular commitment period, Annex I Parties used Kyoto units acquired through flexible market mechanisms.

41
All the participating Parties took advantage of the Kyoto mechanisms or the flexible (market) mechanisms such as emissions trading (ET), joint implementation (JI), and
clean development mechanism (CDM) to achieve compliance in both the first (2008–2012) and second commitment periods (2013–2020).20
At the end of the first commitment period, in 2012, the participating Annex I Parties had total net holdings of about 54.2 billion assigned amount units (AAUs), 1.4 billion removal units (RMUs), 1.2 billion certified emissions reductions (CERs), and 838 million emission removal units (ERUs). The total net holdings related to CERs, RMUs, and ERUs (3.4 billion units) was equivalent to four times the total base year emissions of Annex I countries that participated in the first commitment period.
The countries that have generated the highest number of RMUs through net removals from LULUCF activities in the first commitment period were the Russian Federation (626 million), Japan (243 million), and New Zealand (80 million). The country that had the highest number of CERs at the end of first commitment period was Germany at 226 million units, followed by Japan (145 million), Spain (124 million), and Italy (101 million). Germany also had the highest amount of ERUs at 195 million units. Other countries that had high amount of ERUs at the end of the first commitment period include the UK (123 million), New Zealand (97 million), and Spain (67 million). The ERUs were sold primarily by the Russian Federation and Eastern European countries to the Western European countries even before the beginning of the first commitment period.
To comply with the target, most of the Parties had retired their AAUs in the first commitment period. In addition to AAUs, some Parties also retired CERs, RMUs, and ERUs in comply with their commitments. Parties such as Liechtenstein, Luxembourg, and Austria retired 18, 10, and 8 per cent CERs of the total retirement needed for compliance, respectively, while New Zealand, Portugal, and Iceland retired 16, 11, and 8 per cent RMUs of the total retirement needed for compliance, respectively. In case of ERUs, New Zealand retired 19 per cent, Slovenia and Denmark retired 5 per cent of the total retirement needed for compliance in the first commitment period.
6. Analysis of the Kyoto Protocol flexibilities
The net holdings related to CERs, RMUs, and ERUs (3.4 billion units) was equivalent to four times the total base year emissions of Annex I countries that participated in the first commitment period
20. The use of the Kyoto mechanisms in the second commitment period has not been confirmed yet.

Unpacking Pre-2020 Climate Commitments: Who Delivered, How Much, and How will the Gaps be Addressed?42
21. The type and quantity of Kyoto units that can be carried over to the next period depends on certain rules and restrictions. RMUs and temporary certified emission reductions (tCERs), long-term certified emission reductions (LCERs), and ERUs from LULUCF projects cannot be carried over to the next commitment period. AAUs can be carried over without any limits. CERs and ERUs can be carried over up to a quantity equal to 2.5 per cent of the Party’s initial assigned amount.
6.1 Voluntary cancellation and carry-over units
A compliance review at the end of the first commitment period showed that many participating Annex I Parties did request to carry-over Kyoto units21 (except for the RMUs) for the subsequent commitment period. The total carry-over by participating countries in the second commitment period was equivalent to about 2.4 GtCO2eq. Few EIT countries such as Bulgaria, Romania, Ukraine, Lithuania have carried over units equal to 48, 44, 35, and 34 per cent of their initial emissions allowance, respectively, for the second commitment period.
Some countries also voluntarily cancelled their Kyoto units that were in addition of what was required to achieve compliance. In the first commitment period, overall voluntary cancellation of Kyoto units was equivalent to 168 MtCO2eq. It was observed that Sweden voluntarily cancelled the highest number of Kyoto units, equivalent to about 77 MtCO2eq (making up 21 per cent of its initial AAUs). Sweden treated this voluntary cancellation as contribution to climate finance. This was followed by Norway, Switzerland, and New Zealand, which cancelled Kyoto units equivalent to 37, 16, and 9 MtCO2eq, respectively.
The voluntary cancellation of Kyoto units was relatively lower for the second commitment period, which might be because of the delayed enforcement (entry into the force) of the Doha Amendment. The overall voluntary cancellation in the second commitment done so far is equivalent to 62 MtCO2eq. Switzerland and Sweden have made the highest voluntary cancellations, equivalent to about 13 MtCO2eq, followed by Australia, UK, and Germany, which have made voluntary cancellation in the range of about 9–13 MtCO2eq individually. The cancellations units comprise primarily of CERs and a small amount of ERUs.
Source: Authors’ analysis
It was observed that Sweden voluntarily cancelled the highest number of Kyoto units, equivalent to about 77 MtCO2eq (making up 21 per cent of its initial AAUs)
Sweden
Norway
Switzerland
New Zealand
Germany
Australia
Rest participating countries
77
37
16
9
7
714
Voluntary cancellation (10^6 AAUs)
Carry-over units (10^6 AAUs)
Romania
Poland
Bulgaria
France
Hungary
Australia
United Kingdom
Rest participating countries
Figure 7 Share of voluntary cancellation and carry-over units under Kyoto Protocol (2008-2012)
559
496
263187
176
149
114
440

43
7. Failures and loopholes under the Kyoto Protocol and the Doha Amendment
The analysis on pre-2020 climate actions is incomplete without considering the impact of the failures or the accounting loop holes. In the Kyoto Protocol and the Doha Amendment,
major emitters did not participate, which is considered as one of its major failures. Also, literature suggests that countries have misused the accounting process to get unearned carbon credits. Hence, it becomes important to reflect on these issues and then discuss the overall achievement and progress made in the pre-2020 era.
Image: iStock
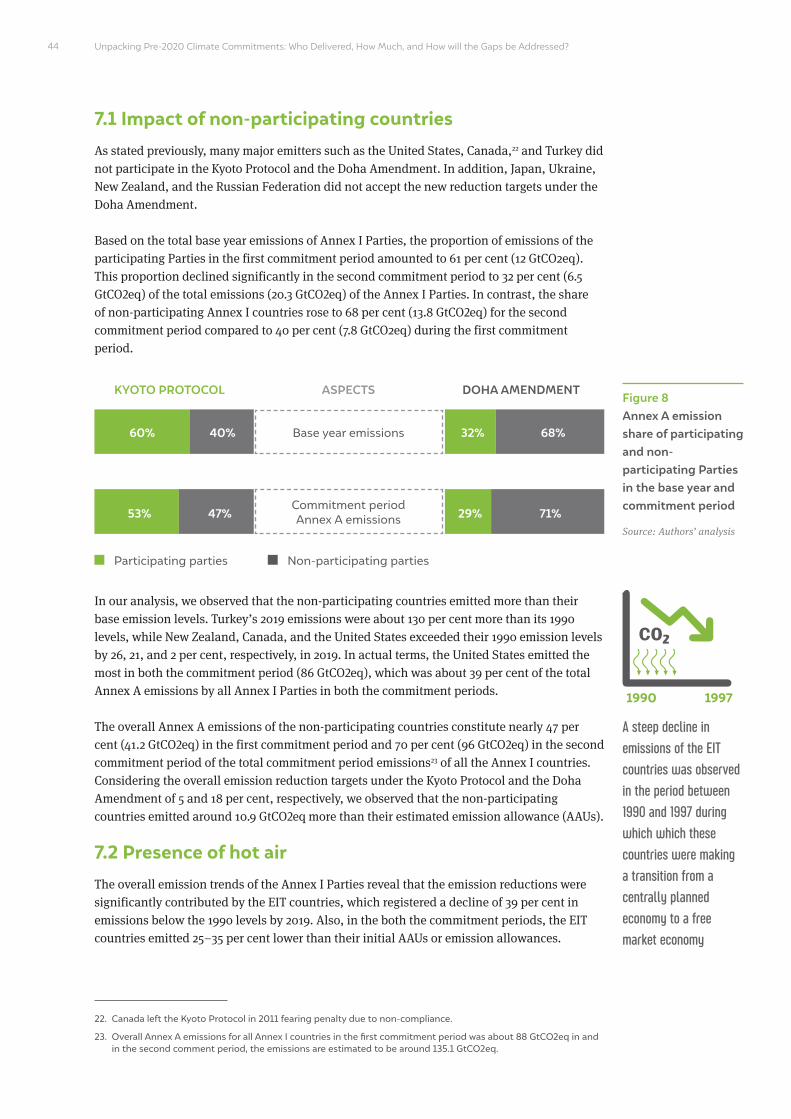
Unpacking Pre-2020 Climate Commitments: Who Delivered, How Much, and How will the Gaps be Addressed?44
7.1 Impact of non-participating countriesAs stated previously, many major emitters such as the United States, Canada,22 and Turkey did not participate in the Kyoto Protocol and the Doha Amendment. In addition, Japan, Ukraine, New Zealand, and the Russian Federation did not accept the new reduction targets under the Doha Amendment.
Based on the total base year emissions of Annex I Parties, the proportion of emissions of the participating Parties in the first commitment period amounted to 61 per cent (12 GtCO2eq). This proportion declined significantly in the second commitment period to 32 per cent (6.5 GtCO2eq) of the total emissions (20.3 GtCO2eq) of the Annex I Parties. In contrast, the share of non-participating Annex I countries rose to 68 per cent (13.8 GtCO2eq) for the second commitment period compared to 40 per cent (7.8 GtCO2eq) during the first commitment period.
In our analysis, we observed that the non-participating countries emitted more than their base emission levels. Turkey’s 2019 emissions were about 130 per cent more than its 1990 levels, while New Zealand, Canada, and the United States exceeded their 1990 emission levels by 26, 21, and 2 per cent, respectively, in 2019. In actual terms, the United States emitted the most in both the commitment period (86 GtCO2eq), which was about 39 per cent of the total Annex A emissions by all Annex I Parties in both the commitment periods.
The overall Annex A emissions of the non-participating countries constitute nearly 47 per cent (41.2 GtCO2eq) in the first commitment period and 70 per cent (96 GtCO2eq) in the second commitment period of the total commitment period emissions23 of all the Annex I countries. Considering the overall emission reduction targets under the Kyoto Protocol and the Doha Amendment of 5 and 18 per cent, respectively, we observed that the non-participating countries emitted around 10.9 GtCO2eq more than their estimated emission allowance (AAUs).
7.2 Presence of hot airThe overall emission trends of the Annex I Parties reveal that the emission reductions were significantly contributed by the EIT countries, which registered a decline of 39 per cent in emissions below the 1990 levels by 2019. Also, in the both the commitment periods, the EIT countries emitted 25–35 per cent lower than their initial AAUs or emission allowances.
A steep decline in emissions of the EIT countries was observed in the period between 1990 and 1997 during which which these countries were making a transition from a centrally planned economy to a free market economy
Figure 8 Annex A emission share of participating and non-participating Parties in the base year and commitment period
Source: Authors’ analysis
22. Canada left the Kyoto Protocol in 2011 fearing penalty due to non-compliance.
23. Overall Annex A emissions for all Annex I countries in the first commitment period was about 88 GtCO2eq in and in the second comment period, the emissions are estimated to be around 135.1 GtCO2eq.
Participating parties
KYOTO PROTOCOL DOHA AMENDMENTASPECTS
Non-participating parties
Base year emissions
Commitment period Annex A emissions
60% 32%
29%53%
40% 68%
71%47%

45Failures and loopholes under the Kyoto Protocol and the Doha Amendment
The choice of late 1980s or 1990s as base years for the EIT countries provides these Parties with inflated base year emissions, resulting in weaker targets that are easily overachieved. This issue of inflated base year is responsible for the generation of unearned carbon credits or emission allowance without any additional emission reductions efforts and following a business-as-usual scenario. Such unearned carbon credits are also referred to as the ‘hot air’ (Dufrasne 2019). The presence of ‘hot air’ credits impedes future mitigation measures because using it results in net emissions, exacerbating the climate change issue.
Source: Authors’ analysis
We also record that much of the decline in emissions for the EIT countries occurred well before the start of the Kyoto Protocol. A steep decline in emissions of the EIT countries was observed in the period between 1990 and 1997 during which these countries were making a transition from a centrally planned economy to a free market economy. So, the emission reductions that occurred during this period was not an outcome of any climate action undertaken by the EIT countries under the Kyoto Protocol or the Doha Amendment (Morel and Shislov 2014).
Countries
% decrease from base year
to 1997
% decrease from base year
to 1997
Difference base year and 1997
(MtCO2eq)
Difference base year and 1997
(MtCO2eq)
Surplus emission allowance
(MtCO2eq)
Surplus emission allowance
(MtCO2eq)
Table 6 Hot air analysis
44%
38%
23%
18%
46%
26%
51%
54%
54%
21%
38%
38%
25%
4%
51%
39%
60.05
50.71
7.23
34.38
19.63
30.57
203.98
14.04
26.70
119.16
105.38
1269.90
18.07
0.81
469.39
2430.00
276.2
233.2
34.4
158.2
90.3
143.7
968.9
64.6
122.8
560.0
484.8
6349.5
83.1
3.7
2346.9
11920.3
35%
38%
23%
23%
49%
30%
50%
53%
52%
23%
42%
40%
27%
3%
47%
39%
47.2
43.2
7.1
44.7
19.4
33.0
194.9
14.1
25.2
131.2
129.4
1483.5
19.9
0.5
441.7
2635.07
309.47
205.63
56.78
252.15
75.35
198.73
1400.31
63.15
114.07
682.38
538.29
9731.54
128.47
4.06
2685.74
16446.11
Belarus
Bulgaria
Croatia
Czechia
Estonia
Hungary
Kazakhstan
Latvia
Lithuania
Poland
Romania
Russian Federation
Slovakia
Slovenia
Ukraine
Total
DOHA AMENDMENTKYOTO PROTOCOL

Unpacking Pre-2020 Climate Commitments: Who Delivered, How Much, and How will the Gaps be Addressed?46
It is argued that the effect of hot air can be negated by not including the emission reduction that took place before 1997. The reasoning given is that after 1997, the economy of the EIT countries had started to recover from its initial shocks (Morel and Shislov 2014). An analysis of hot air emissions (see Table 6) by selecting 1997 as the base year for the EIT countries and comparing its emissions with the emissions of existing base year under the Kyoto Protocol and the Doha Amendment provides notable insights. The 1997 base year emissions for all the EIT Parties amount to 61 and 57 per cent of the existing base year emissions for the first commitment period and second commitment periods, respectively. In other words, the emissions between 1990 and 1997 had declined around 39–43 per cent for the EIT countries. For countries like Estonia, Latvia, Lithuania, Kazakhstan, Ukraine, and Belarus, the drop in emission is between 45 and 55 per cent. The EIT countries with the least inflated base year are Slovenia, Czechia, Croatia, and Poland.
The existing base year emissions of the EIT countries in the Kyoto Protocol itself exceed their 1997 emissions by 2.4 GtCO2eq, resulting in surplus carbon credits amounting to about 12 GtCO2eq in the entire first commitment period. By making a similar comparison of emissions with the base year emissions of the EIT countries as reported in the Doha Amendment, a surplus of 16.4 GtCO2eq of unearned carbon credits is estimated. The EIT countries, with the most surplus hot air credits, include the Russian Federation, Ukraine, and Kazakhstan.
7.3 Inclusion of deforestation emissions in the base yearArticle 3.7(2) of the Kyoto Protocol enabled any Annex I participating country to include deforestation emissions in their base year emissions, provided it can prove net emissions from its LULUCF sector in the base year. This provision was contentious as it gave additional unearned emission allowance to the countries that had more emissions from the LULUCF sector in their respective base years . Also, the windfall or unearned credits due to the inclusion of deforestation emissions helped a country in achieving compliance in a given commitment period without any significant climate action or mitigation efforts.
In the first commitment period, there were five Annex I countries that opted for inclusion of deforestation emissions in their base year including Australia, Ireland, Netherlands, Portugal, and the UK. The participation increased in the second commitment period with eight Annex I countries using this provision including new countries like Liechtenstein, Luxembourg, and Denmark.
We note that Australia, which pushed for this clause, benefitted significantly from this provision as it gained surplus emission allowance up to 24 per cent of its initial AAUs in the first commitment period and 26 percent of its initial AAUs in the second commitment period. In absolute terms, these emission allowances amount to 468 MtCO2eq in the first commitment period and 949 MtCO2eq in the second commitment period. However, the cancellation of Kyoto units due to the deforestation emissions was around 8 per cent of its assigned amount in the first commitment period and 5 per cent in the second commitment period. By using Article 3.7(2), Australia gained surplus emission allowance of about 24 and 26 per cent of its initial assigned amount units in the first and second commitment periods, respectively.
Apart from Australia, Portugal was also found to have acquired surplus emission allowance from this provision to the extent of 4 per cent of its initial emission allowance in the second commitment period.
The existing base year emissions of the EIT countries in the Kyoto Protocol itself exceed their 1997 emissions by 2.4 GtCO2eq

47
8. Achievements of developed countries in the pre-2020 phase
In this section, the achievement of developed countries with respect to the Kyoto Protocol, the Doha Amendment, and the Cancun Agreements is discussed. Also, at the end,
developed countries are ranked based on their performance in the pre-2020 regime.
Image: iStock

Unpacking Pre-2020 Climate Commitments: Who Delivered, How Much, and How will the Gaps be Addressed?48
8.1 Performance of developed countries in the Kyoto Protocol and the Doha Amendment
In the Kyoto Protocol, the Annex I Parties collectively complied with the overall target and in addition ended up with surplus emission allowances of about 6.6 billion AAUs.24 But in the Doha Amendment, without considering the carry-over units from the Kyoto Protocol, the Annex I Parties are estimated to fall short by 2 billion AAUs (emission allowance) from meeting the overall emission reduction target (minimum of 18 per cent from the 1990 levels).
The participating Annex I Parties complied with their targets and are estimated to have left-over emissions allowance of 10.9 and 3.9 billion AAUs at the end of first and second commitment periods, respectively . On the other hand, the non-participating Annex I Parties have emitted more and would need additional emission allowance of about 10.2 billion AAUs (4.3 billion AAUs in the Kyoto Protocol and 5.9 billion AAUs in the Doha Amendment) towards adhering to the overall emission reduction commitments under the pre-2020 regime.
It is important to highlight that the overachievement (left-over emission allowance) from the participating Annex I Parties in both the commitment periods are a result of unearned emission allowance arising from hot air and inclusion of deforestation emissions in the base year. This unearned emission allowance to the participating Annex I Parties were about 11.1 billion AAUs and 3.3 billion AAUs in the first and second commitment periods, respectively. Also, for the non-participating countries, the surplus emission allowance is estimated to be around 1.2 billion AAUs and 14.1 billion AAUs at the end of first and second commitment periods, respectively.
Hence, the overall overachievement (left-over emission allowance) of about 4.7 billion AAUs by Annex I Parties at the end of pre-2020 period is at the cost of the unearned emission allowance of about 29.8 billion AAUs from hot air and inclusion of deforestation emissions in base year.
8.1.1 Non-EIT countriesWe observed that the non-EIT countries have emitted more than their estimated emission allowance in both the commitment periods. Collectively, the non-EIT countries fall short by about 3.5 billion AAUs in the first commitment period and this gap swells to four times (about 14.1 billion AAUs) in the second commitment period.
The non-participating countries25 are primarily responsible for the shortfall of developing countries in achieving their targets. Countries such as the United States, Turkey, and Canada emitted significantly higher than their estimated emission allowances and would need additional emission allowance of about 14, 3.5, and 2.5 billion AAUs, respectively, to meet their overall target of the Kyoto Protocol and the Doha Amendment. Also, Japan, which did not participate in the second commitment period, would need an additional emission allowance of about 1.6 billion AAUs to meet its overall reduction target in the pre-2020 period.
The participating Annex I Parties are estimated to achieve compliance against their targets at the end of both the commitment periods
24. 1 billion AAUs is equivalent to 1 GtCO2eq.
25. Non-participating countries do not have any target under the Kyoto Protocol and the Doha Amendment. However, for the purpose of our analysis, the overall reduction target of the Kyoto Protocol and the Doha Amendment, that is, 5 and 18 per cent, respectively, is considered to evaluate their performance.

49 Achievements of developed countries in the pre-2020 phase
The European countries have emitted less than their emission allowances. France, Spain, Italy, and UK collectively would have left-over emission allowance of about 2.3 billion AAUs at the end of pre-2020. Australia is also estimated to have left-over emission allowance of about 0.4 billion units, but this is at the cost of surplus emissions allowance of about 1.4 billion AAUs from the inclusion of deforestation emission in the base year.
8.1.2 Economies in transition countriesIt is estimated that the EIT countries would collectively have left-over emission allowance of about 10.1 and 12.1 billion AAUs at the end of the first and second commitment periods, respectively. But these countries have also received unearned emission allowance from hot air of about 12 and 16.4 billion AAUs in the first and second commitment periods, respectively.
The Russia Federation gained the most from -it and is estimated to have more than 50 per cent of the total unearned emissions allowance from hot air, which is about 16 billion AAUs for both the commitment periods. This is followed by Ukraine, Kazakhstan, Poland, and Romania, which collectively have about 9.6 billion units of unearned emission allowance from hot air. If we negate the impact of the unearned emission allowance, only Slovenia would be complying with the emission reduction target in the pre-2020 period and the Russia Federation, Poland, and Kazakhstan would need additional emission allowance of almost 5 billion AAUs for meeting their targeted emission reductions.
The EIT countries received unearned carbon credits of about 12 and 16.4 billion AAUs in the first and second commitment periods, respectively

Unpacking Pre-2020 Climate Commitments: Who Delivered, How Much, and How will the Gaps be Addressed?50 51 Achievements of developed countries in the pre-2020 phase
Group/Country
KYOTO PROTOCOL
Emissions Emissions* EmissionsNet
holdingsNet
holdingsNet
holdingsAchievements Achievements AchievementsInflated
AAUsInflated
AAUsInflated
AAUs
Table 7 Pre-2020 outcomes (in MtCO2eq)
Australia
Austriade
Belarusabc
Belgiumde
Bulgariacde
Canadaab
Croatiacde
Cyprusae
Czechiacde
Denmarkde
Estoniacde
Finlandde
Francede
Germanyde
Greecede
Hungarycde
Icelandde
Irelandde
Italyde
Japanb
Kazakhstanabc
Latviacde
Liechtenstein
Lithuaniacde
Luxembourgde
Maltaae
Annex I countries
Non-EIT countries
EIT countries
EU countries
Participating countries
Non-participating countries
88033.7
68255.7
19778.0
23613.4
46744.1
41289.6
2711.2
414.7
444.7
626.3
312.9
3519.5
144.8
47.6
680.1
297.9
95.3
338.4
2538.9
4706.6
598.5
336.0
23.4
308.5
2479.6
6392.4
1462.6
56.5
1.2
109.8
60.1
15.2
135128.1
105317.8
29810.3
33926.6
39028.3
96099.8
4297.9
631.0
711.3
935.8
461.1
5753.8
190.3
68.4
1012.2
386.7
151.2
450.0
3620.7
6989.1
745.0
496.0
37.7
481.3
3436.3
10287.0
2755.1
86.7
1.6
161.2
84.4
18.3
223161.7
173573.4
49588.3
57540.0
85772.3
137389.3
7009.1
1045.6
1155.9
1562.1
774.0
9273.3
335.1
116.0
1692.3
684.6
246.5
788.3
6159.5
11695.7
1343.5
831.9
61.1
789.9
5916.0
16679.4
4217.7
143.2
2.7
271.0
144.5
33.5
94650.2
64727.7
29922.4
26322.2
57658.4
36991.7
2860.6
417.0
633.7
648.1
573.2
2792.1
153.9
27.0
728.4
298.1
117.7
362.1
2726.4
4934.9
643.6
512.2
20.1
320.4
2483.7
6567.3
1908.9
84.7
1.2
184.2
60.7
12.2
133176.3
91228.7
41947.6
37560.5
42933.6
90242.7
4526.5
732.7
875.5
1147.8
542.6
4020.4
250.3
80.1
1119.5
468.1
155.2
574.4
4231.2
6792.8
903.4
659.4
32.2
472.2
3921.9
8497.3
2821.8
118.3
1.9
216.6
96.7
17.3
227826.4
155956.4
71870.0
63882.7
100592.0
127234.4
7387.1
1149.7
1509.2
1796.0
1115.8
6812.5
404.2
107.2
1847.9
766.1
272.9
936.5
6957.6
11727.7
1547.0
1171.6
52.3
792.6
6405.5
15064.6
4730.7
203.0
3.1
400.8
157.4
29.5
–6616.5
3528.0
–10144.5
–2708.8
–10914.3
4297.8
–149.4
–2.3
–189.1
–21.8
–260.4
727.4
–9.0
20.6
–48.3
-0.1
–22.4
–23.8
–187.5
–228.3
–45.1
–176.2
3.3
–11.9
–4.0
–174.9
–446.3
–28.3
0.0
–74.4
-0.6
3.0
1951.8
14089.1
-12137.3
-3633.9
-3905.3
5857.1
-228.6
-101.7
-164.2
-212.0
-81.5
1733.4
-60.1
-11.7
-107.3
-81.4
-4.0
-124.5
-610.5
196.3
-158.4
-163.4
5.5
9.1
-485.5
1789.7
-66.7
-31.6
-0.3
-55.4
-12.3
1.0
-4664.6
17617.0
-22281.7
-6342.7
-14819.6
10154.9
-378.0
-104.0
-353.3
-233.9
-341.8
2460.8
-69.1
8.9
-155.6
-81.5
-26.4
-148.2
-798.0
-32.0
-203.5
-339.7
8.7
-2.8
-489.6
1614.8
-513.0
-59.9
-0.4
-129.8
-13.0
4.0
12388.2
467.8
11920.3
1978.8
11143.0
1245.1
468
0
276
0
233
0
34
0
158
0
90
0
0
0
0
144
0
0
0
0
969
65
0
123
0
0
17420.1
974.0
16446.1
2344.4
3293.1
14127.1
949
0
309
0
206
0
57
0
252
0
75
0
0
0
0
199
0
0
0
0
1400
63
0
114
2
0
29808.2
1441.8
28366.4
4323.2
14436.0
15372.1
1416.4
0.0
585.7
0.0
438.9
0.0
91.1
0.0
410.3
0.0
165.7
0.0
0.0
0.0
0.0
342.4
0.0
0.0
0.0
0.0
2369.2
127.7
0.0
236.9
1.7
0.0
DOHA AMENDMENT PRE 2O20KYOTO PROTOCOL

Unpacking Pre-2020 Climate Commitments: Who Delivered, How Much, and How will the Gaps be Addressed?52 53 Achievements of developed countries in the pre-2020 phase
Group/Country
KYOTO PROTOCOL
EmissionsNet
holdings AchievementsInflated
AAUs
Monaco
Netherlandsde
New Zealandb
Norway
Polandcde
Portugalde
Romaniacde
Russian Federationbc
Slovakiacde
Sloveniacde
Spainde
Swedende
Switzerland
Turkeyab
Ukrainebc
UKde
USAab
0.5
997.1
372.8
266.8
2006.3
362.1
615.9
11187.5
227.7
98.5
1792.0
305.6
261.7
2007.3
1999.4
3017.2
33792.6
0.7
1495.1
642.1
418.0
3174.3
522.6
896.7
16508.1
326.2
137.8
2600.1
422.1
383.4
3910.2
2742.0
3908.3
52790.2
1.2
2492.2
1014.9
684.9
5180.6
884.7
1512.7
27695.6
553.9
236.4
4392.0
727.7
645.2
5917.6
4741.5
6925.5
86582.8
0.5
1031.9
402.2
282.7
2502.7
407.4
1175.1
16967.7
256.3
99.8
1828.3
305.6
269.3
1042.0
4023.9
3406.4
30575.8
0.7
1676.0
431.8
375.1
3017.5
687.7
1268.1
24564.9
480.1
154.9
3087.1
653.6
468.8
1363.0
5702.8
4002.6
41965.3
1.2
2707.9
834.0
657.9
5520.2
1095.2
2443.2
41532.6
736.4
254.7
4915.4
959.2
738.1
2405.0
9726.7
7409.0
72541.0
0.0
–34.8
–29.4
–15.9
–496.5
–45.3
–559.2
–5780.1
–28.6
–1.2
–36.3
0.0
–7.6
965.3
–2024.5
–389.2
3216.9
0.0
-180.9
210.3
42.9
156.8
-165.1
-371.4
-8056.8
-153.8
-17.1
-487.0
-231.5
-85.4
2547.3
-2960.7
-94.4
10824.9
0.0
-215.7
180.9
27.0
-339.6
-210.4
-930.5
-13837.0
-182.5
-18.3
-523.4
-231.5
-93.0
3512.6
-4985.2
-483.6
14041.8
0
0
0
0
560
0
485
6349
83
4
0
0
0
0
2347
0
0
0
0
0
0
682
24
538
9732
128
4
0
0
0
0
2686
0
0
0.0
0.0
0.0
0.0
1242.4
23.7
1023.0
16081.0
211.6
7.8
0.0
0.0
0.0
0.0
5032.7
0.0
0.0
Source: Authors’ analysis
Note:a Countries that did not participate in the Kyoto Protocol; b Countries that did not participate in the Doha Amendment; c Economies in transition countries; d Part of the European Union in the Kyoto Protocol; e Part of the European Union in the Doha Amendment
*For the 2020 emissions, a 4 per cent reduction is considered below 2019 levels.
Inflated AAUsEmissions
Net holdings Achievements Emissions*
Net holdings Achievements
Inflated AAUs
KYOTO PROTOCOL DOHA AMENDMENT PRE 2O20

Unpacking Pre-2020 Climate Commitments: Who Delivered, How Much, and How will the Gaps be Addressed?54
8.2 Progress of developed countries towards Cancun pledges
Source: Author’s analysis
Note: Figures in green represents countries which are on track to achieve their target while red represents non-performer against the target*Emissions for 2020 are assumed as a four per cent reduction below 2019 levels
Countries
LINEAR APPROACH
Base year
Assigned emission
allowance(MtCO2eq)
Unconditional pledges
(minimum target with respect to
base year)Emissions*(MtCO2eq)
Percent change in emissions of 2019 levels with respect
base yearAchievement
(MtCO2eq)
Table 8 Progress against Cancun pledges
Australia
Belarus
Canada
Croatia
EU
Iceland
Japan
Kazakhstan
Liechtenstein
Monaco
New Zealand
Norway
Russian Federation
Switzerland
Ukraine
USA
It is important to highlight that the accounting of Cancun pledges could follow the budgetary as well as the linear approach.26 On analysing the unconditional Cancun pledges (minimum target) made by countries via a linear approach as well as a budgetary approach, it is observed that not only most of the Annex I countries are significantly far from meeting their agreed-upon targets but also, in 2019, several countries actually have emissions higher than their base year emissions (see Table 8). The Annex I countries like Iceland, New Zealand, and Australia recorded an increase in their emissions by 28, 26, and 12 per cent, respectively. Further, some countries did achieve a reduction but are still far away from meeting their
26. The linear approach directly compares the country’s per cent emissions change in 2019 against their respective base year levels to determine whether they have met their minimum targets or not. On the other hand, the budgetary approach involves comparing the emission allowance assigned to each of the country based on their unconditional pledges against their cumulative emissions between 2012 and 2020.
2000
1990
2005
1990
1990
1990
2005
1990
1990
1990
1990
1990
1990
1990
1990
2005
–5%
–5%
–17%
–5%
–20%
–15%
–4%
–15%
–20%
–30%
–5%
–30%
–15%
–20%
–20%
–17%
3707.11
1057.56
4905.09
238.54
36130.50
25.04
10604.42
2618.15
1.46
0.58
494.98
288.26
21479.87
343.24
6032.47
49288.93
4297.93
711.26
5753.81
190.26
33926.62
37.69
10287.01
2755.13
1.56
0.68
642.11
418.03
16508.05
383.44
2742.04
52790.17
-590.82
346.30
-848.72
48.29
2203.88
-12.65
317.41
-136.98
-0.09
-0.11
-147.13
-129.77
4971.82
-40.20
3290.44
-3501.25
(+)12%
–35%
–1%
–25%
–28%
(+)28%
–12%
–8%
–18%
–20%
(+)26%
–2%
–33%
–14%
–65%
–12%
BUDGETARY APPROACH

55 Achievements of developed countries in the pre-2020 phase
27. Likert scale helps to measure opinions, perceptions, and behaviours. It also provides flexibility to have a 5-point or 7-point scoring scale.
Cancun pledges such as Kazakhstan, Monaco, Norway, and the United States. But countries such as Ukraine, the Russian Federation, Japan, the EU, Croatia, and Belarus appear to be on track to achieve their Cancun pledges.
8.3 Performance ranking of developed countries in the pre-2020 phase
In order to evaluate how developed countries have performed individually, they were analysed on eight indicators that capture their mitigation (action) performance as well as their seriousness (sincerity) towards climate action. Each indicator has multiple options, and a scoring system similar to a Likert scale27 is employed to differentiate a country’s performance. The developed countries are analysed across these indicators during the commitment period under the Kyoto Protocol (2008–2012) and the Doha Amendment to the Kyoto Protocol (2013–2020). Our evaluation results in a single meaningful score (a composite score or sum of scores across all the indicators), indicating the pre-2020 performance of the developed country. Ultimately, the countries are ranked based on their estimated overall scores across all the indicators. Details of the indicators, the associated multiple options, and scoring scale are provided in Table 9.
The performance of developed countries are analysed across two categories of indicators during the commitment period under the Kyoto Protocol and the Doha Amendment to the Kyoto Protocol
Image: iStock

Unpacking Pre-2020 Climate Commitments: Who Delivered, How Much, and How will the Gaps be Addressed?56
Source: Authors’ formulation
Note:
*Business as usual (BAU) and initial assigned amount units (AAUs) are calculated on the basis of adjusted/preferred base year emissions, eliminating the effect of surplus emission allowance from hot air and LULUCF accounting.
**Holdings are based on the base year emissions decided under the Convention and cancelling surplus emission allowance from hot air and LULUCF accounting provisions are not considered.
#Indicators which are not applicable to non-participating countries.
Indicators and assumptions
• For the 2020 emissions, a 4 per cent reduction is considered below 2019 levels.• To calculate the Annex A emissions trend (upward/downward) in the Doha Amendment, emissions from 2013 till 2019 are considered.
Sincerity indicators
Action indicators
Options
Options
Score
Score
Table 9 Indicators: options and scoring scale
Country participation in pre-2020 climate agreements
Presence of Hot air
Misuse of LULUCF accounting provisions#
Voluntary cancellation of Kyoto units#
Annex A emissions trend
Annex A emissions versus business as usual (BAUs)*
Annex A emissions versus initial assigned amount units (AAUs)*
Annex A emissions versus holdings **#
1.
2.
3.
4.
1.
2.
3.
4.
Yes
No
Downwards
Upwards
1
0
1
0
Yes
No
80%
80–95%
95–105%
105–115%
115%
1
0.75
0.5
0.25
0
0
1
Yes
No
0
1
1
0.75
0.5
0.25
0
Cancellation percentage w.r.t initial AAU > 10%
5% < Cancellation percentage w.r.t initial AAU <= 10%
1% < Cancellation percentage w.r.t initial AAU <= 5%
0% < Cancellation percentage w.r.t initial AAU <= 1%
No voluntary cancellation
90%
90–100%
100–110%
110-125%
125%
1
0.75
0.5
0.25
0
≤100%
>100%
1
0

57 Achievements of developed countries in the pre-2020 phase
Based on country-wise evaluation, we observe that European countries have performed relatively better than other non-European countries. Sweden leads the pre-2020 climate action ranking, followed by the UK, Belgium, and Denmark, which have scored 88 per cent and above. Seventeen countries out of the 43 developed countries have scored more than 70 per cent, displaying their seriousness towards climate action and ambitious mitigation efforts in particular. These well-performing countries are majorly from the European Union, including Switzerland, Liechtenstein, Monaco, and Norway. Six countries, namely Malta, the Russian Federation, Canada, Belarus, Turkey, and Kazakhstan, are among the least performing countries.
Some countries did quite well on sincerity indicators but not necessarily on the action indicators. The countries with higher sincerity indicator scores than their action indicator ones include Norway, Liechtenstein, Germany, Austria, Ireland, Iceland, Spain, and Switzerland. Similarly, the countries that score high on action indicators compared to their respective sincerity indicator scores include Ukraine, Hungary, Slovenia, Slovakia, Romania, and Bulgaria. To check whether there exists any correlation between the two indicators, the Pearson’s correlation coefficient was employed. A coefficient of 0.64 was obtained, suggesting only a moderately strong correlation between the two sets of indicators.
From the country-wise performance ranking, we observe that the European countries have performed relatively better than other non-European countries
1
0

Unpacking Pre-2020 Climate Commitments: Who Delivered, How Much, and How will the Gaps be Addressed?58 59 Achievements of developed countries in the pre-2020 phase
Rank Country KP KPKP KPKP KPKP KP ActualScore Max PercentageDA DADA DADA DADA DA
Table 10 Performance ranking of developed countries in the pre-2020 phase
1
2
3
3
4
4
4
5
6
6
7
8
9
10
10
11
11
12
12
12
13
13
13
14
15
15
16
17
18
18
19
Swedende
UKde
Belgiumde
Denmarkde
Finlandde
Francede
Netherlandsde
Switzerlandde
Greecede
Italyde
Liechtenstein
Germanyde
Spainde
Austriade
Norway
Monaco
Luxembourgde
Hungarycde
Romaniacde
Czechiacde
Sloveniacde
Slovakiacde
Portugalde
Ukrainebc
Irelandde
Bulgariacde
Japanb
Estoniacde
Lithuaniacde
Croatiacde
Latviacde
Yes
Yes
Yes
Yes
Yes
Yes
Yes
Yes
Yes
Yes
Yes
Yes
Yes
Yes
Yes
Yes
Yes
Yes
Yes
Yes
Yes
Yes
Yes
Yes
Yes
Yes
Yes
Yes
Yes
Yes
Yes
Yes
Yes
Yes
Yes
Yes
Yes
Yes
Yes
Yes
Yes
Yes
Yes
Yes
Yes
Yes
Yes
Yes
Yes
Yes
Yes
Yes
Yes
Yes
No
Yes
Yes
No
Yes
Yes
Yes
Yes
No
No
No
No
No
No
No
No
No
No
No
No
No
No
No
No
No
Yes
Yes
Yes
Yes
Yes
No
Yes
No
Yes
No
Yes
Yes
Yes
Yes
No
No
No
No
No
No
No
No
No
No
No
No
No
No
No
No
No
Yes
Yes
Yes
Yes
Yes
No
Yes
No
Yes
No
Yes
Yes
Yes
Yes
No
No
No
No
No
No
No
No
No
No
No
No
No
No
No
No
No
No
No
No
No
No
No
No
No
No
No
No
No
No
No
No
No
No
No
No
No
No
No
No
No
No
No
No
No
No
No
Yes
No
No
No
No
No
Yes
NA
No
No
NA
No
No
No
No
21%
0%
0%
1%
0%
0%
0%
7%
0%
0%
20%
0%
0%
0%
15%
0%
0%
0%
0%
0%
0%
0%
0%
0%
0%
0%
0%
0%
0%
0%
0%
2%
0%
0%
0%
0%
0%
0%
4%
0%
0%
0%
0%
0%
0%
0%
0%
0%
0%
0%
0%
0%
0%
0%
NA
0%
0%
NA
0%
0%
0%
0%
Downward
Downward
Downward
Downward
Downward
Downward
Downward
Downward
Downward
Downward
Downward
Downward
Downward
Downward
Downward
Downward
Downward
Downward
Downward
Downward
Downward
Downward
Downward
Downward
Downward
Downward
Upward
Upward
Downward
Downward
Downward
Downward
Downward
Downward
Downward
Downward
Downward
Downward
Downward
Downward
Downward
Downward
Downward
Downward
Upward
Downward
Downward
Downward
Upward
Upward
Downward
Downward
Upward
Upward
Downward
Upward
Upward
Downward
Downward
Upward
Downward
Upward
85%
77%
86%
85%
95%
90%
94%
99%
110%
96%
102%
76%
124%
105%
108%
88%
91%
79%
71%
85%
101%
84%
120%
89%
111%
76%
101%
83%
97%
120%
95%
73%
61%
79%
68%
79%
83%
83%
89%
87%
82%
84%
70%
115%
100%
101%
86%
82%
81%
64%
82%
87%
75%
104%
69%
107%
81%
99%
92%
88%
99%
88%
81%
88%
93%
108%
95%
90%
100%
108%
88%
103%
111%
97%
108%
121%
106%
95%
127%
84%
77%
92%
110%
92%
95%
89%
98%
83%
108%
90%
105%
127%
103%
66%
96%
82%
83%
79%
86%
89%
106%
82%
88%
100%
103%
84%
86%
120%
110%
90%
108%
123%
117%
91%
93%
79%
91%
102%
137%
121%
189%
155%
98%
157%
100%
89%
97%
100%
93%
93%
97%
97%
93%
100%
96%
95%
98%
99%
94%
95%
99%
66%
52%
93%
99%
89%
89%
50%
96%
55%
97%
81%
60%
94%
67%
65%
98%
82%
83%
78%
86%
89%
82%
82%
88%
83%
103%
84%
86%
111%
102%
87%
75%
71%
90%
89%
68%
76%
NA
102%
85%
NA
97%
74%
76%
73%
16
16
16
16
16
16
16
16
16
16
16
16
16
16
16
16
16
16
16
16
16
16
16
13
16
16
13
16
16
16
16
15.25
14.25
14
14
13.75
13.75
13.75
13.5
13.25
13.25
13
12.75
12.25
11.75
11.75
11.5
11.5
10.75
10.75
10.75
10.5
10.5
10.5
8.5
10
10
8
9.5
9.25
9.25
8.75
Country’s participation in climate agreement
Presence of Hot air
Misuse of LULUCF accounting provisions
Voluntary cancellation of
Kyoto UnitsCountry’s participation in climate agreement
Presence of Hot air
Misuse of LULUCF accounting provisions
Voluntary cancellation of
Kyoto Units SCORING
95%
89%
88%
88%
86%
86%
86%
84%
83%
83%
81%
80%
77%
73%
73%
72%
72%
67%
67%
67%
66%
66%
66%
65%
63%
63%
62%
59%
58%
58%
55%
ACTION INDICATORSSINCERITY INDICATORS

Unpacking Pre-2020 Climate Commitments: Who Delivered, How Much, and How will the Gaps be Addressed?
No
No
Yes
Yes
Yes
Yes
No
Yes
No
No
No
No
60 61 Achievements of developed countries in the pre-2020 phase
Rank Country KP KPKP KPKP KPKP KP ActualScore Max PercentageDA DADA DADA DADA DA
20
21
22
23
24
24
25
26
27
27
28
29
Cyprusae
USAab
New Zealandb
Polandcde
Australia
Icelandde
Maltaae
Russian Federationbc
Canadaab
Belarusabc
Turkeyab
Kazakhstanabc
Yes
No
No
Yes
Yes
Yes
Yes
No
No
No
No
No
No
No
No
Yes
No
No
No
Yes
No
Yes
No
Yes
No
No
No
Yes
No
No
No
Yes
No
Yes
No
Yes
NA
NA
No
No
Yes
No
NA
No
NA
NA
NA
NA
No
NA
NA
No
Yes
No
No
NA
NA
NA
NA
NA
NA
NA
3%
0%
0%
0%
NA
0%
NA
NA
NA
NA
0%
NA
NA
0%
0%
0%
0%
NA
NA
NA
NA
NA
Downward
Downward
Downward
Upward
Upward
Downward
Upward
Upward
Downward
Downward
Upward
Upward
Upward
Downward
Upward
Upward
Upward
Upward
Downward
Upward
Upward
Downward
Upward
Upward
167%
105%
120%
90%
118%
139%
118%
109%
119%
114%
183%
148%
152%
103%
122%
88%
120%
130%
116%
91%
117%
103%
235%
174%
176%
111%
120%
96%
109%
126%
125%
109%
126%
124%
193%
156%
85%
126%
149%
136%
121%
117%
106%
111%
143%
126%
287%
194%
NA
NA
93%
80%
95%
116%
NA
66%
NA
NA
NA
NA
85%
NA
NA
105%
95%
117%
106%
NA
NA
NA
NA
NA
13
10
13
16
16
16
13
13
10
10
10
10
7
5.25
6.75
7.75
7.25
7.25
5.75
4.75
3
3
2
0
Country’s participation in climate agreement
Presence of Hot air
Misuse of LULUCF accounting provisions
Voluntary cancellation of
Kyoto UnitsCountry’s participation in climate agreement
Presence of Hot air
Misuse of LULUCF accounting provisions
Voluntary cancellation of
Kyoto Units SCORING
54%
53%
52%
48%
45%
45%
44%
37%
30%
30%
20%
0%
Source: Authors’ analysis
Note:a Countries that did not participate in the Kyoto Protocol, b Countries that did not participate in the Doha Amendment,c Economies in transition countries, d Part of European Union in the Kyoto Protocol, e Part of European Union in the Doha Amendment
Scoring percentage > 70%
50% <= Scoring percentage < 70%
Scoring percentage < 50%
KP: KYOTO PROTOCOL DA: DOHA AMENDMENT
ACTION INDICATORSSINCERITY INDICATORS

Unpacking Pre-2020 Climate Commitments: Who Delivered, How Much, and How will the Gaps be Addressed?523022
Image: iStock
Accounting provisions related to the inclusion of deforestation emissions or flexibility towards the selection of base year provide a leeway to budget more emission allowances and conceal the real picture.

63
A comprehensive review of the pre-2020 climate regime reveals that the efforts of developed countries to reduce emissions were limited. Major emitters did not participate in the
legally binding agreements, and the overachievement of participating countries was negated by the unearned emission allowances generated due to ‘hot air’ for the EIT countries. The non-EIT countries witnessed an emission reduction of only about 3.7 per cent by 2019 below the 1990 levels and are set to use around 17.6 GtCO2eq of additional carbon space than their estimated emission allowance for the pre-2020 period. Further, the unearned emission allowance from hot air (of the EIT countries) and inclusion of deforestation emissions in the base year emissions would increase this additional usage of carbon space by 7.5 GtCO2eq. Hence, in real terms, collectively, developed countries have used an additional carbon space of about 25.1 GtCO2eq than their estimated emission allowances for the pre-2020 period. This is about close to 34 GtCO2eq (74 per cent), which is the estimated emissions gap in 2030 based on current policies for achieving the 1.5°C goal (UNEP,2020).
It is clear the mitigation efforts of some of the developed countries in the pre-2020 period were unsatisfactory as they had used additional emission allowance against what was assigned to them. Also, some developed countries took advantage of the existing loopholes in the accounting mechanism to gain unearned emission allowances to achieve compliance, while other countries like Canada and Japan withdrew from the agreement to avoid non-compliance and emit freely without any legal constraints. As these unaddressed issues exist in the pre-2020 period, it becomes difficult to trust the commitments made by developed countries for the post-2020 period. Also, developing countries have reasonable concerns that these gaps from the pre-2020 period would be passed on to them as an additional burden in the future. Hence, it is important to address such gaps in efforts in future negotiations and also strengthen the accounting and compliance mechanisms as the world moves ahead under the Paris Agreement.
Utilising the unsold CERsOne way to minimise the pre-2020 gaps is to utilise the unsold CERs from the CDM. Currently, there are ongoing discussions for transferring these CERs under the Paris Agreement. This can possibly result in an increase in the availability of cheaper emission allowances and reduction in the overall mitigation efforts of countries in the post-2020 period. A better option is the non-participating countries from the pre-2020 period exploring the possibility of purchasing these unsold CERs, thereby increasing their emission allowances. This would help
9. Conclusion
It is important to address the pre-2020 gaps in future negotiations and strengthen the accounting and compliance mechanisms of the post-2020 climate regime
20. The use of the Kyoto mechanisms in the second commitment period has not been confirmed yet.

Unpacking Pre-2020 Climate Commitments: Who Delivered, How Much, and How will the Gaps be Addressed?
in reducing their pre-2020 gaps and achievement of compliance with the overall objectives of the Kyoto Protocol and the Doha Amendment. This also has the potential to address various interdependent issues, as it can boost the demand for CERs, which in turn could restore the faith of private investors who have invested in CDM projects. Ultimately, the question of the transition of CERs from the Kyoto Protocol to the Paris Agreement would not occur, leading to an overall enhancement of ambition in the post-2020 period. Moreover, all developed countries, especially the EIT countries, should also consider voluntary cancellation of surplus emission allowance after complying with their target.
Revisiting post-2020 commitmentsThe pre-2020 gap (25.1 GtCO2eq) is quite significant and needs to be addressed in order to limit the temperature rise to 1.5oC above the pre-industrial levels by 2100. Hence, it is important that the global stocktaking process under the Paris Agreement considers the emission gaps by developed countries in the pre-2020 regime. Deliberations have to specifically address these gaps, for example, the distribution of emission over the targets among developed countries and especially the non-participating countries should consider revising or enhancing their future targets.
Strengthening transparency: accounting and compliance mechanismsIt is important to acknowledge the existing gaps and loopholes in the accounting mechanism. An easy exit from the climate agreement, with no punitive measures in place, not only leads to more emissions from a country but also undermines the trust in the process and discourages other nations from undertaking ambitious climate actions. Accounting provisions related to the inclusion of deforestation emissions or flexibility towards the selection of base year provide a leeway to budget more emission allowances and conceal the real picture. Hence, it is important that enhanced transparency is brought into the process to address these issues and steps taken to show the actual progress made by developed countries. This can be done when the accounting provisions are not curtailed according to the convenience of the participating countries but to reflect environmental integrity.
64

65
Averchenkova, A., and D. Zenghelis. 2018. Pre-2020 Ambition on Climate Change—History, Status, Outlook. Policy Brief, London: European Capacity Building Initiative, 28. Accessed January 2021. https://ecbi.org/sites/default/files/Pre-2020%20Ambition_0.pdf
BBC. 2005. “Kyoto Protocol Comes into Force.” BBC, February 16. Accessed March 1, 2021. http://news.bbc.co.uk/2/hi/science/nature/4267245.stm
BBC. 2011. “Canada to Withdraw from Kyoto Protocol.” BBC, December 13. Accessed February 12, 2021. https://www.bbc.com/news/world-us-canada-16151310
Black, R, K. Cullen, B. Fay, T. Hale, J. Lang, S. Mahmood, and S. M. Smith. 2021. Taking Stock: A Global Assessment of Net Zero Targets. Report, Energy and Climate Intelligence Unit and Oxford Net Zero, Oxford: Energy and Climate Intelligence Unit and Oxford Net Zero, 30. https://eciu.net/analysis/reports/2021/taking-stock-assessment-net-zero-targets
Climate Action Tracker. 2009. Rating System. https://climateactiontracker.org/countries/rating-system/.
Department of Climate Change, Nigeria. 2020. “Nigeria Became the 144th Country to Ratify the Doha Amendment.” October 2. Accessed March 13, 2021. https://climatechange.gov.ng/2020/10/02/nigeria-became-the-144th-country-to-ratify-the-doha-amendment/
Dufrasne, Gilles. 2019. Empty Targets? How to Avoid Trading of Hot Air under the Paris Agreement. Policy Brief. Brussels: Carbon Market Watch, 8. Accessed January 2021. https://carbonmarketwatch.org/wp-content/uploads/2019/12/EMPTY-TARGETS-HOW-TO-AVOID-TRADING-OF-HOT-AIR-UNDER-THE-PARIS-AGREEMENT-2.pdf
European Commission. 2016a. Effort Sharing: Member States’ Emission Targets. November 23. Accessed December 1, 2020. https://ec.europa.eu/clima/policies/effort_en
European Commission. 2016b. Effort Sharing 2021–2030: Targets and Flexibilities. November 23. Accessed March 24, 2021. https://ec.europa.eu/clima/policies/effort/regulation_en
Friedlingstein, P., R. Houghton, G. Marland, et al. 2010. “Update on CO2 Emissions.” Nature Geoscience 811–812.
IEA. 2021. Global Energy Review: CO2 Emissions in 2020. Report. Paris: IEA. Accessed March 2021. https://www.iea.org/articles/global-energy-review-co2-emissions-in-2020
IISD. 2009. Summary Report, 7–19 December 2009, Copenhagen Climate Change Conference–December 2009. December. Accessed March 30, 2021. https://enb.iisd.org/events/copenhagen-climate-change-conference-december-2009/summary-report-7-19-december-2009
IPCC. 2018. IPCC, 2018: Global Warming of 1.5°C. An IPCC Special Report on the Impacts of Global Warming of 1.5°C above Pre-Industrial Levels and Related Global Greenhouse Gas Emission Pathways. Report. Geneva: IPCC, 630. https://www.ipcc.ch/sr15/download/
Januta, Andrea. 2021. “Economists Support ‘Immediate and Drastic Action’ against Climate Change.” April 1. Accessed May 1, 2021. https://www.weforum.org/agenda/2021/04/economists-global-action-climate-change-natural-disasters/
References

Unpacking Pre-2020 Climate Commitments: Who Delivered, How Much, and How will the Gaps be Addressed?66
Kollmus, Anja. 2013. Doha Decisions on the Kyoto Surplus Explained. Policy Brief. Brussels: Carbon Market Watch, 15. Accessed 2020 November. https://carbonmarketwatch.org/wp-content/uploads/2013/03/CarbonMarketWatch-CO18-Surplus_decisions_explained_4March20131.pdf
Krug, Joachim. 2018. “Accounting of GHG Emissions and Removals from Forest Management: A Long Road from Kyoto to Paris.” Carbon Balance and Management (13): 11. doi:https://doi.org/10.1186/s13021-017-0089-6
Macintosh, Andrew. 2011. LULUCF Offsets and Australia’s 2020 Abatement Task. Centre for Law and Policy, Canberra: Baker and Mckenzie, 34. Accessed January 2021. https://law.anu.edu.au/sites/all/files/coast/lulucfoffsets_17_feb_2011.pdf
Ministry for the Environment, New Zealand. 2015. Report upon Expiration of the Additional Period for Fulfilling Commitments by New Zealand. True-up report, Wellington: Ministry for the Environment, New Zealand, 3. https://environment.govt.nz/publications/report-upon-expiration-of-the-additional-period-for-fulfilling-commitments-by-new-zealand/
Morel, Romain, and Igor Shislov. 2014. Ex-post Evaluation of the Kyoto Protocol: Four Key Lessons for the 2015 Paris Agreement. Report, Paris: Institute for Climate Economics, 37. https://www.i4ce.org/download/climate-report-n44-ex-post-evaluation-of-the-kyoto-protocol-four-key-lessons-for-the-2015-paris-agreement-2/
New Zealand Parliament. 2015. National Interest Analysis—Doha Amendment to the Kyoto Protocol. Report, Wellington: New Zealand Parliament, 8. https://www.parliament.nz/resource/en-nz/00DBSCH_ITR_66164_1/940ce51dd897cfb0ba6c2492218eea49e09fcbbd
NRDC. 2010. “How Are the Cancun Agreements Different than the Copenhagen Accord: Q&A.” December. Accessed March 30, 2021. https://www.nrdc.org/experts/jake-schmidt/how-are-cancun-agreements-different-copenhagen-accord-qa
Rosen, Amanda M. 2015. “The Wrong Solution at the Right Time: The Failure of the Kyoto Protocol on Climate Change.” Politics & Policy 43 (1): 30–58. doi:10.1111/polp.12105.
Streck, Charlotte. 2020. “The Mirage of Madrid: Elusive Ambition on the Horizon.” Climate Policy 143–148. doi:10.1080/14693062.2020.1726564.
The Guardian. 2011. “Canada Pulls Out of Kyoto Protocol.” December 13. Accessed March 11, 2021. https://www.theguardian.com/environment/2011/dec/13/canada-pulls-out-kyoto-protocol
UNEP. 2020. Emissions Gap Report 2020. Report, Nairobi: United Nations Environment Programme, 128. Accessed December 2020. https://www.unep.org/emissions-gap-report-2020
UNEP. 2021. UNEP DTU CDM/JI Pipeline Analysis and Database. Accessed March 31, 2021. http://cdmpipeline.org/index.htm
UNFCCC. 2000. Review of the Implementation of Commitments. Reporting Guidelines. Bonn: UNFCCC, 122. https://unfccc.int/resource/docs/cop5/07.pdf
UNFCCC. 2001. Decisions—Marrakech Climate Change Conference—October 2001. Accessed March 1, 2021. https://unfccc.int/process-and-meetings/conferences/past-conferences/marrakech-climate-change-conference-october-2001/decisions-marrakech-climate-change-conference-october-2001
UNFCCC. 2008. “On Accounitng of Emissions and Assigned Amount.” Kyoto Protocol Reference Manual. Bonn: UNFCCC, 130. November. Accessed May 24, 2021. https://unfccc.int/sites/default/files/08_unfccc_kp_ref_manual.pdf
UNFCCC. 2012a. What is the Kyoto Protocol? December 21. Accessed January 1, 2021. https://unfccc.int/kyoto_protocol

67References
UNFCCC. 2012b. What Is the United Nations Framework Convention on Climate Change? Bonn: UNFCCC. Accessed January 2021. https://unfccc.int/process-and-meetings/the-convention/what-is-the-united-nations-framework-convention-on-climate-change
UNFCCC. 2018. Support Material for Non-LULUCF Experts—Accounting of Activities under Article 3, Paragraphs 3 and 4, of the Kyoto Protocol in the Second Commitment Period. Bonn: UNFCCC, 25. Accessed January 2020. https://unfccc.int/sites/default/files/resource/Supportive%20material_ver.2_final%20201807_posted.pdf
UNFCCC. 2020. Compilation and Synthesis of Fourth Biennial Reports of Parties Included in Annex I to the Convention. Report. Bonn: UNFCCC, 22. https://unfccc.int/documents/266353
Vidal, John. 2010. Cancún Climate Change Summit: Japan Accused of Threatening Kyoto Protocol. December 2. Accessed March 1, 2021. https://www.theguardian.com/environment/2010/dec/02/japan-stance-kyoto-protocol
WMO. 2021. “2020 Was One of Three Warmest Years on Record.” January 15. https://public.wmo.int/en/media/press-release/2020-was-one-of-three-warmest-years-record
WMO. 2021. State of the Global Climate 2020. Climate Report, Geneva: WMO, 56. https://public.wmo.int/en/our-mandate/climate/wmo-statement-state-of-global-climate
World Bank. 2020. The Global Economic Outlook during the COVID-19 Pandemic: A Changed World. June 8. https://www.worldbank.org/en/news/feature/2020/06/08/the-global-economic-outlook-during-the-covid-19-pandemic-a-changed-world
World Meteorological Organization. 2020. United in Science 2020 A Multi-Organization High-Level Compilation of the Latest. Geneva: World Meteorological Organization, 28. Accessed November 2020. https://public.wmo.int/en/resources/united_in_science

Unpacking Pre-2020 Climate Commitments: Who Delivered, How Much, and How will the Gaps be Addressed?
Snapshot of stakeholder consultation on unpacking the pre-2020 climate actions
68
Annexure I Stakeholder consultation
The Council on Energy, Environment and Water (CEEW), with support from Shakti Sustainable Energy Foundation (SSEF), organised a stakeholder consultation on 25 March 2021. This was a closed-door virtual consultation organised to solicit a critical feedback on pre-2020 research from the experts. During the meeting, The Council presented the research methodology and key findings on pre-2020 climate actions. Inputs were received from the stakeholders on the overall approach, assumptions, and results related to the emission scenario and inflated base year. Experts also deliberated on strengthening accountability in the Paris Agreement and on approaches to bridge the gaps in pre-2020 climate regime. The recommendations from the experts have helped in strengthening the research outcomes. The following experts participated in the discussion:
1. Aarti Gupta, Wageningen University
2. K. S. Aishwarya, Shakti Sustainable Foundation
3. Chisa Umemiya, IGES
4. Damandeep Singh, CDP
5. Davor Vesligaj, UNFCCC
6. Jihye Choi, UNFCCC
7. Joydeep Gupta, India Climate Dialogue
8. Nandakumar Janardhanan, IGES
9. Nidhi Madan, Shakti Sustainable Foundation
10. Shikha Bhasin, CEEW
11. Shubhashis Dey, Shakti Sustainable Foundation
12. Spandan Pandey, CEEW
13. Subrata Chakrabarty, WRI
14. Sumit Prasad, CEEW
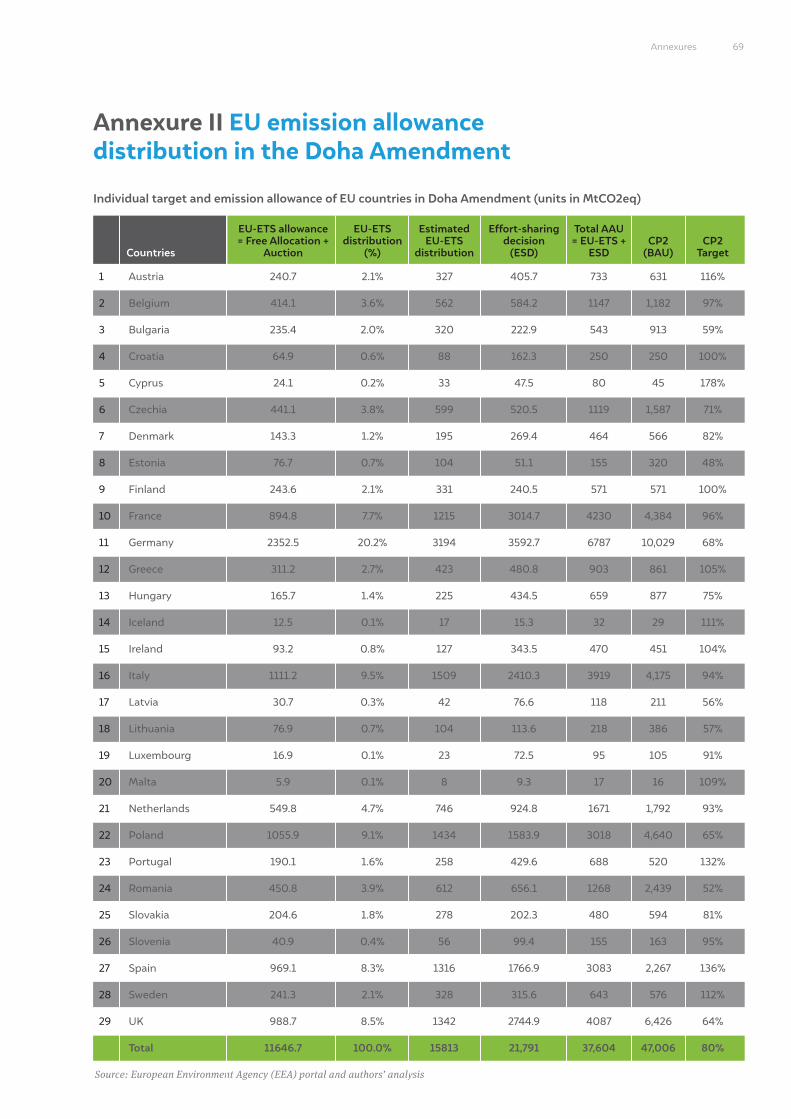
Annexure II EU emission allowance distribution in the Doha Amendment
69Annexures
Countries
EU-ETS allowance = Free Allocation +
Auction
EU-ETS distribution
(%)
Estimated EU-ETS
distribution
Effort-sharing decision
(ESD)
Total AAU = EU-ETS +
ESDCP2
(BAU)CP2
Target
1
2
3
4
5
6
7
8
9
10
11
12
13
14
15
16
17
18
19
20
21
22
23
24
25
26
27
28
29
Austria
Belgium
Bulgaria
Croatia
Cyprus
Czechia
Denmark
Estonia
Finland
France
Germany
Greece
Hungary
Iceland
Ireland
Italy
Latvia
Lithuania
Luxembourg
Malta
Netherlands
Poland
Portugal
Romania
Slovakia
Slovenia
Spain
Sweden
UK
Total
240.7
414.1
235.4
64.9
24.1
441.1
143.3
76.7
243.6
894.8
2352.5
311.2
165.7
12.5
93.2
1111.2
30.7
76.9
16.9
5.9
549.8
1055.9
190.1
450.8
204.6
40.9
969.1
241.3
988.7
11646.7
2.1%
3.6%
2.0%
0.6%
0.2%
3.8%
1.2%
0.7%
2.1%
7.7%
20.2%
2.7%
1.4%
0.1%
0.8%
9.5%
0.3%
0.7%
0.1%
0.1%
4.7%
9.1%
1.6%
3.9%
1.8%
0.4%
8.3%
2.1%
8.5%
100.0%
327
562
320
88
33
599
195
104
331
1215
3194
423
225
17
127
1509
42
104
23
8
746
1434
258
612
278
56
1316
328
1342
15813
405.7
584.2
222.9
162.3
47.5
520.5
269.4
51.1
240.5
3014.7
3592.7
480.8
434.5
15.3
343.5
2410.3
76.6
113.6
72.5
9.3
924.8
1583.9
429.6
656.1
202.3
99.4
1766.9
315.6
2744.9
21,791
733
1147
543
250
80
1119
464
155
571
4230
6787
903
659
32
470
3919
118
218
95
17
1671
3018
688
1268
480
155
3083
643
4087
37,604
631
1,182
913
250
45
1,587
566
320
571
4,384
10,029
861
877
29
451
4,175
211
386
105
16
1,792
4,640
520
2,439
594
163
2,267
576
6,426
47,006
116%
97%
59%
100%
178%
71%
82%
48%
100%
96%
68%
105%
75%
111%
104%
94%
56%
57%
91%
109%
93%
65%
132%
52%
81%
95%
136%
112%
64%
80%
Individual target and emission allowance of EU countries in Doha Amendment (units in MtCO2eq)
Source: European Environment Agency (EEA) portal and authors’ analysis

Unpacking Pre-2020 Climate Commitments: Who Delivered, How Much, and How will the Gaps be Addressed?
Annexure III Net holdings of Kyoto units
Countries
Net holding of Kyoto Units (units in 10^6)
AAUs AAUsERUs ERUsRMUs CERs CERsTotal Total
2838.8
362.5
633.7
592.4
544.8
2791.8
148.1
27.0
675.1
257.4
110.7
318.6
2613.2
4473.9
616.8
492.0
18.4
288.0
2259.3
6155.4
1908.9
76.7
1.0
168.9
53.2
12.2
0.5
948.2
308.1
259.2
0.0
12.0
0.0
12.7
15.9
0.0
0.5
0.0
25.1
14.5
6.4
7.0
24.7
194.9
14.8
5.0
0.0
4.4
47.8
22.4
0.0
0.5
0.0
5.8
0.4
0.0
0.0
33.5
107.3
8.8
0.0
6.8
0.0
0.0
3.6
0.0
5.1
0.0
6.6
8.7
0.0
17.4
23.6
39.7
2.1
7.3
1.5
16.3
75.3
243.6
0.0
6.2
0.0
5.9
0.4
0.0
0.0
0.0
80.6
1.8
21.8
35.7
0.0
43.0
10.7
0.3
0.2
0.0
21.7
17.0
0.7
19.1
64.8
226.4
21.0
7.8
0.1
13.0
101.2
145.0
0.0
1.3
0.2
3.6
6.8
0.0
0.0
50.2
16.3
12.8
2860.6
417.0
633.7
648.1
574.9
2792.1
153.9
27.0
728.4
297.6
117.7
362.1
2726.4
4934.9
654.6
512.2
20.1
321.7
2483.7
6566.5
1908.9
84.7
1.2
184.2
60.7
12.2
0.5
1031.9
512.3
282.7
4511.6
732.6
875.5
1146.5
542.6
4020.4
250.3
80.1
1119.5
464.0
155.2
571.2
4229.6
6786.8
903.4
659.4
32.2
470.1
3919.0
8494.3
2821.8
118.3
1.6
218.0
95.4
17.3
0.6
1671.3
431.8
348.9
0.0
0.0
0.0
0.0
0.0
0.0
0.0
0.0
0.0
0.0
0.0
0.0
0.0
0.0
0.0
0.0
0.0
0.0
0.0
0.0
0.0
0.0
0.0
-1.3
0.0
0.0
0.0
0.0
0.0
-5.4
14.9
0.1
0.0
1.3
0.0
0.0
0.0
0.0
0.0
4.1
0.0
3.2
1.6
6.0
0.0
0.0
0.0
2.2
2.9
3.0
0.0
0.0
0.3
0.0
1.3
0.0
0.1
4.8
0.0
31.6
4526.5
732.7
875.5
1147.8
542.6
4020.4
250.3
80.1
1119.5
468.1
155.2
574.4
4231.2
6792.8
903.4
659.4
32.2
472.2
3921.9
8497.3
2821.8
118.3
1.9
216.6
96.7
17.3
0.7
1676.0
431.8
375.1
Australia
Austriade
Belarusabc
Belgiumde
Bulgariacde
Canadaab
Croatiacde
Cyprusae
Czechiacde
Denmarkde
Estoniacde
Finlandde
Francede
Germanyde
Greecede
Hungarycde
Icelandde
Irelandde
Italyde
Japanb
Kazakhstanabc
Latviacde
Liechtenstein
Lithuaniacde
Luxembourgde
Maltaae
Monaco
Netherlandsde
New Zealandb
Norway
70
KYOTO PROTOCOL DOHA AMENDMENT

Source: Authors’ analysis
Note:
a Countries that did not participate in the Kyoto Protocol, b Countries that did not participate in the Doha Amendment,c Economies in transition countries, d Part of European Union in the Kyoto Protocol, e Part of European Union in the Doha Amendment
Countries
Net holding of Kyoto Units (units in 10^6)
AAUs AAUsERUs ERUsRMUs CERs CERsTotal Total
2358.7
343.3
1117.4
16329.4
238.1
86.8
1584.4
295.5
242.7
1042.0
4000.5
3169.4
30575.8
91338.6
54347.2
36991.4
62448.9
28889.8
24211.7
44.5
5.2
22.4
11.8
2.3
4.7
67.2
2.1
0.6
0.0
0.5
123.0
0.0
848.8
848.8
0.0
703.4
145.4
697.3
27.8
44.8
18.0
626.5
1.4
6.6
52.8
0.0
8.3
0.0
22.9
14.2
0.0
1375.6
1375.6
0.0
637.8
737.8
391.9
71.8
14.3
17.3
0.0
14.5
1.7
123.9
8.0
17.9
0.0
0.0
99.8
0.0
1209.9
1209.5
0.3
1058.6
151.3
995.5
2502.7
407.4
1175.1
16967.7
256.3
99.8
1828.3
305.6
269.3
1042.0
4023.9
3406.4
30575.8
94772.9
57781.1
36991.7
64848.7
29924.2
26296.5
3017.5
687.7
1268.2
24564.9
480.1
154.9
3082.7
643.2
361.8
1363.0
5702.8
4087.4
41965.3
133068.7
42828.9
90239.8
91119.7
41949.0
37604.4
0.0
0.0
0.0
0.0
0.0
0.0
0.0
0.0
78.9
0.0
0.0
-75.3
0.0
-3.0
-3.0
0.0
-1.7
-1.3
-76.6
0.0
0.0
0.0
0.0
0.0
0.0
4.4
10.4
28.1
0.0
0.0
-9.4
0.0
110.7
107.7
3.0
110.7
-0.1
32.7
3017.5
687.7
1268.1
24564.9
480.1
154.9
3087.1
653.6
468.8
1363.0
5702.8
4002.6
41965.3
133176.3
42933.6
90242.7
91228.7
41947.6
37560.5
Polandcde
Portugalde
Romaniacde
Russian Federationbc
Slovakiacde
Sloveniacde
Spainde
Swedende
Switzerland
Turkeyab
Ukrainebc
UKde
USAab
Annex I countries
Participating countries
Non-participating countries
Non-EIT countries
EIT
EU countries
71Annexures
KYOTO PROTOCOL DOHA AMENDMENT

Unpacking Pre-2020 Climate Commitments: Who Delivered, How Much, and How will the Gaps be Addressed?58
The strengthening of the accounting and compliance mechanisms is crucial for the success of the post-2020 period.

Image: iStock

Unpacking Pre-2020 Climate Commitments: Who Delivered, How Much, and How will the Gaps be Addressed?
COUNCIL ON ENERGY, ENVIRONMENT AND WATER (CEEW)
Sanskrit Bhawan, A-10, Qutab Institutional AreaAruna Asaf Ali Marg, New Delhi - 110067, IndiaT: +91 (0) 11 4073 3300
[email protected] | ceew.in | @CEEWIndia | ceewindia