university place city council regular council meeting...
TRANSCRIPT

UPTV Note: Times are approximate and subject to change.
UNIVERSITY PLACE CITY COUNCILRegular Council Meeting AgendaTuesday, July 5, 2016, 6:00 p.m.
Town Hall Meeting Room 3715 Bridgeport Way West
6:00 pm 1. CALL REGULAR MEETING TO ORDER
2. ROLL CALL
3. PLEDGE OF ALLEGIANCE – Councilmember McCluskey
4. APPROVAL OF AGENDA
6:05 pm 5. PUBLIC COMMENTS – (At this time, citizens have three minutes to address the Council on any matter not scheduled for Public Hearing or Council Consideration. State law prohibits the use of this forum to promote or oppose any candidate for public office, or ballot measure. Public comments are limited to three minutes. Please provide your name and address for the record.)
6:10 pm 6A-6C.
CONSENT AGENDA Motion: Approve or Amend the Consent Agenda as Proposed
The Consent Agenda consists of items considered routine or have been previously studied and discussed by Council and for which staff recommendation has been prepared. A Councilmember may request that an item be removed for the Consent Agenda so that the Council may consider the item separately. Items on the Consent Agenda are voted upon as one block and approved with one vote. A. Receive and File: Payroll and Claims. B. Receive and File: 2015 Comprehensive Annual Financial Report. C. Pass an Ordinance amending Ordinance No. 623, amending Title14, Chapter 14.05 related to Building and
Construction to comply with RCW 19.27 the State Building Code by adopting the 2015 Edition of the International Code, 2015 Edition of the State Energy Code and the 2015 Edition of the Uniform Plumbing Code.
6:15 pm 7. COUNCIL COMMENTS/REPORTS
RECESS TO STUDY SESSION – (At this time, Council will have the opportunity to study and discuss business issues with staff prior to its consideration. Citizen comment is not taken at this time; however, citizens will have the opportunity to comment on the following item(s) at future Council meetings.)
6:20 pm 8. MARIJUANA ORDINANCE REVIEW/RECOMMENDATION (SECOND STUDY)
7:20 pm 9. TREE PRESERVATION ORDINANCE (FOURTH STUDY)
9:00 pm 10. ADJOURNMENT

City Council Meeting Agenda July 5, 2016, Page 2
*PRELIMINARY CITY COUNCIL AGENDA
July 18, 2016 Regular Council Meeting
August 1, 2016
Regular Council Meeting
August 15, 2016 Regular Council Meeting
September 6, 2016
Regular Council Meeting
Preliminary City Council Agenda subject to change without notice* Complete Agendas will be available 24 hours prior to scheduled meeting.
To obtain Council Agendas, please visit www.cityofup.com.
American Disability Act (ADA) Accommodations Provided Upon Advance Request Call the City Clerk at 253-566-5656

APPROVAL OF
CONSENT AGENDA

City of University Place
6

06/28/2016
Check List
City of University Place
1
2:30:18PM
Page:apChkLst Final
Bank : bofa BANK OF AMERICA
Check TotalAmount PaidDescriptionInv DateInvoiceVendorDateCheck #
MAY16 6/16/2016 MAY16/B&O TAX/SWM FEES 17,425.82WA STATE DEPT OF REVENUE0020726/16/2016 18272004 17,425.82
Voucher: 40800
9487836 6/1/2016 JUN16/JANITORIAL SERVICES 3,831.65ABM JANITORIAL SERVICES0257156/30/2016 51978316 3,831.65
Voucher: 40725
1478219 5/31/2016 MAY16/OFFSITE RECORDS STOARGE 376.05ACCESS INFORMATION MANAGEMENT0251796/30/2016 51978317 376.05
Voucher: 40726
7199 6/1/2016 JUNE16/ALARM MONITORING 358.00ALARM WORKS NW0010046/30/2016 51978318 358.00
Voucher: 40727
TM-158193 6/2/2016 TYPE 2 BARRICADE/BARRICADE LIGHT 2,625.26ALPINE PRODUCTS INC0017016/30/2016 51978319 2,625.26
Voucher: 40728
S45700015 5/13/2016 CONSTRUCTION MONITORING/BP LOW IMPACT PR 24,155.88AMEC FOSTER WHEELER ENV & INF0234186/30/2016 51978320 24,155.88
Voucher: 40729
1462946 5/27/2016 ADD DOCUMENTS/ADDENDUM #1/27TH ST IMPROV 111.46AMERICAN REPROGRAPHICS COMPANY0020756/30/2016 51978321 111.46
Voucher: 40730
15210 6/1/2016 SURVEY/BROOKRIDGE TRAIL EASEMENT 3,500.00BASELINE ENGINEERING INC0021676/30/2016 51978322 3,500.00
Voucher: 40731
REIMB/LODGING 6/8/2016 RECONCILIATION/ICSC ANNUAL SPRING CONVEN 302.45BRISKE, KEVIN0226286/30/2016 51978323 302.45
Voucher: 40732
REIMB 6/8/2016 REIMB/3 CODE BOOKS/R. BRUNK 146.83BRUNK, ROB0219266/30/2016 51978324 146.83
Voucher: 40733
1050786 6/8/2016 PUBLISH PROJECTS ONLINE/27TH ST IMPROVEM 5.90BUILDERS EXCHANGE OF WA. INC0244376/30/2016 51978325 5.90
Voucher: 40734
253-565-9558 6/14/2016 PW PUMP CALLOUT LINECENTURYLINK0011526/30/2016 51978326 41.67
206-Z20-0051 6/20/2016 PHONES/CITY WIDE 40735 2,400.00Voucher:
253-564-1992 6/11/2016 PHONE/SR CENTER 2,688.80 247.13
MC-00084 6/10/2016 JUN16/COURT SERVICES 12,304.00CITY OF LAKEWOOD0030566/30/2016 51978327 12,304.00
Voucher: 40736
1Page:

06/28/2016
Check List
City of University Place
2
2:30:18PM
Page:apChkLst Final
Bank : bofa BANK OF AMERICA (Continued)
Check TotalAmount PaidDescriptionInv DateInvoiceVendorDateCheck #
100086155 6/3/2016 POWER/7801 40TH ST WCITY TREASURER0010246/30/2016 51978330 3.72
100079031 6/3/2016 POWER/3715 BP WAY W, #D4 40737 19.16Voucher:
100802489 6/3/2016 POWER/3904 BP WAY W 14.48
100083325 6/17/2016 POWER/4910 BRISTONWOOD DR W 300.00
100079046 6/3/2016 POWER/3715 BP WAY W, #D5 19.00
100172057 6/17/2016 POWER & WATER/3920 GRANDVIEW DR W 179.87
100668522 6/6/2016 WATER/8902 CHAMBERS CREEK RD 39.68
100312905 6/3/2016 POWER/3715 BP WAY W, #A-3A 22.00
100077151 6/13/2016 POWER/4000 OLYMPIC BLVD W 10.10
100077140 6/13/2016 POWER/2900 GRANDVIEW DR W 8.63
100089560 6/17/2016 POWER/4317 GRANDVIEW DR W 49.03
100089555 6/13/2016 POWER/4526 GRANDVIEW DR W 24.52
100357178 6/10/2016 POWER/2620 BP WAY W 32.38
100089550 6/13/2016 POWER/4704 GRANDVIEW DR W 18.39
100089528 6/13/2016 POWER/3912 GRANDVIEW DR W 30.64
100072286 6/13/2016 POWER/8501 40TH ST W 8.63
100072254 6/13/2016 POWER/8417 40TH ST W 8.63
100324281 6/13/2016 POWER/7820 CIRQUE DR W 103.06
100072268 6/13/2016 POWER/8901 40TH ST W 8.63
100263915 6/13/2016 WATER & POWER/7250 CIRQUE DR W 1,002.81
100955345 6/3/2016 WATER/3715 BP WAY W 199.40
100578632 6/3/2016 WATER/7450 MARKET SQ W 547.48
100939530 6/3/2016 POWER/3555 MARKET PL W 845.88
100131881 6/20/2016 POWER/4523 97TH AVE W 34.47
100798512 6/20/2016 POWER/4402 97TH AVE W H1 ST 83.94
100093125 6/25/2016 POWER/8513 33RD ST W #A 38.00
100333844 6/17/2016 WATER/4951 GRANDVIEW DR W 324.60
100933758 6/21/2016 POWER/7203 44TH ST W 53.97
100094683 6/17/2016 POWER/4758 BRISTONWOOD DR W 98.06
100080586 6/17/2016 POWER/4951 GRANDVIEW DR W 68.34
100315888 6/6/2016 POWER/7401 CHAMBERS LN W 38.00
100083115 6/23/2016 POWER/4000 67TH AVE W 44.89
100864411 6/23/2016 POWER/6730 40TH ST CT W 72.80
100668518 6/6/2016 WATER/9600 64TH ST W 501.14
100895144 6/15/2016 POWER/8300 CIRQUE DR W 103.06
2Page:

06/28/2016
Check List
City of University Place
3
2:30:18PM
Page:apChkLst Final
Bank : bofa BANK OF AMERICA (Continued)
Check TotalAmount PaidDescriptionInv DateInvoiceVendorDateCheck #
100439837 6/3/2016 POWER/3501 72ND AVE CT W 16.61
100668505 6/6/2016 WATER/8102 CHAMBERS CREEK RD W 103.89
100068203 5/31/2016 POWER/3715 BP WAY W 1,524.83
100101800 6/6/2016 POWER/6318 GRANDVIEW DR W 140.89
100306925 6/6/2016 POWER/8020 CHAMBERS CK RD W 41.78
100142834 6/3/2016 WATER/3715 BP WAY W 162.52
100306924 6/6/2016 POWER/8900 CHAMBERS CK RD W 41.85
100122800 6/3/2016 POWER/4398 BP WAY W 341.45
100302273 6/3/2016 POWER/3715 BP WAY W, #D2 19.31
100495884 6/3/2016 POWER/3625 DREXLER DR W 63.24
100617905 6/3/2016 POWER/3525 BP WAY W 146.90
100657111 6/3/2016 WATER/3626 DREXLER DR W 417.24
100156353 6/3/2016 POWER/4720 BP WAY W 34.05
100087691 6/3/2016 POWER/3697 BP WAY W 184.60
100086165 6/3/2016 POWER/7813 44TH ST W 3.72
100673072 6/10/2016 WATER/8300 40TH ST W 394.62
100346073 6/13/2016 WATER/7250 CIRQUE DR W 74.26
100611293 6/13/2016 WATER/5200 BP WAY W 505.08
100089583 6/13/2016 POWER/4016 GRANDVIEW DR W 18.39
100668502 6/13/2016 WATER/7820 CIRQUE DR W 137.86
100057075 6/13/2016 POWER/4100 GRANDVIEW DR W 23.74
100089578 6/13/2016 POWER/4116 GRANDVIEW DR W 36.77
100775637 6/13/2016 POWER/7001 CIRQUE DR W 194.19
100890034 6/1/2016 WATER/7299 57TH ST CT W 308.16
100077160 6/14/2016 POWER/5202 67TH AVE W 247.71
100890035 6/14/2016 WATER/8399 CIRQUE DR W 202.86
100344745 6/13/2016 POWER/6810 CIRQUE DR W 40.91
100940204 6/16/2016 WATER/7299 44TH ST W 134.91
100751205 6/3/2016 WATER/3555 MARKET PL W/HSE ACCT 165.52
100714386 6/3/2016 POWER/3609 MARKET PL W, #201 52.76
100312961 6/3/2016 POWER/3715 BP WAY W, #A3 66.49
100312960 6/3/2016 POWER/3715 BP WAY W, #A2 51.29
100105615 6/3/2016 POWER/3503 BP WAY W 46.24
100577102 6/3/2016 POWER/7450 MARKET ST W 172.79
100312900 6/3/2016 POWER/3715 BP WAY W, #E3 33.41
3Page:

06/28/2016
Check List
City of University Place
4
2:30:18PM
Page:apChkLst Final
Bank : bofa BANK OF AMERICA (Continued)
Check TotalAmount PaidDescriptionInv DateInvoiceVendorDateCheck #
100955346 6/3/2016 POWER/3715 BP WAY W #D HSE 31.94
100955347 6/3/2016 POWER/3715 BP WAY W #E HSE 55.39
100052902 6/3/2016 POWER/3715 BP W WAY W/HOUSE ACCTS 28.18
100961315 6/14/2016 WATER/4399 ELWOOD DR W 55.55
100110228 6/3/2016 POWER/3715 BP WAY W, #B5 839.31
100668517 6/16/2016 WATER/4300 BP WAY W 421.02
100668504 6/6/2016 WATER/7401 CHAMBERS LN W 158.46
100185134 6/21/2016 POWER/4401 67TH AVE W 48.13
100951901 6/6/2016 POWER/7723 CHAMBERS CREEK RD W 243.78
100895151 6/16/2016 POWER/7901 CIRQUE DR W 37.65
100101775 6/7/2016 POWER/5250 GRANDVIEW DR W 148.62
100032203 6/8/2016 POWER & WATER/2534 GRANDVIEW DR W 340.99
100668524 6/8/2016 WATER/4999 ALAMEDA AVE W 290.21
100092335 6/8/2016 POWER/3050 BP WAY W 175.61
100820972 6/8/2016 POWER/2700 SUNSET DR W 33.27
100905391 6/9/2016 POWER/9313 56TH ST W 74.69
100101783 6/9/2016 POWER/5520 GRANDVIEW DR W 85.66
100664580 6/9/2016 WATER/6000 GRANDVIEW DR W 1,613.83
100664578 6/9/2016 WATER/5300 GRANDVIEW DR W 1,626.79
100109710 6/10/2016 POWER/8902 40TH ST W 9.19
100081728 6/10/2016 POWER/6701 BP WAY W 164.26
100679491 6/10/2016 POWER/8002 40TH ST W 102.77
100138171 6/3/2016 POWER/3998 BP WAY W 61.37
100897062 6/3/2016 WATER/3600 DREXLER DR W 100.43
100312959 6/3/2016 POWER/3715 BP WAY W, #A1 22.00
100668521 6/8/2016 WATER/3000 BP WAY W 274.25
100386367 6/23/2016 POWER/7223 40TH ST W 148.20
100165190 6/23/2016 POWER/3761 BP WAY W 41.67
100565439 6/23/2016 WATER/3761 BP WAY W 407.73
100358203 6/13/2016 POWER/7150 CIRQUE DR W 19,490.77 741.59
90699130 6/14/2016 2ND HALF 2016/SEMI ANNUAL ATTACHMENT FEECITY TREASURER0011406/30/2016 51978331 1,886.82
2,129.1590697471 6/2/2016 MAY16/HYDRANT USE/BRISTONWOOD DR 40738 242.33Voucher:
129335 6/7/2016 DTA RECEIVERS/SR CENTERCITY TREASURER0251616/30/2016 51978332 8.27
92.62130297 6/7/2016 DTA RECEIVERS/CITY HALL 40739 84.35Voucher:
4Page:

06/28/2016
Check List
City of University Place
5
2:30:18PM
Page:apChkLst Final
Bank : bofa BANK OF AMERICA (Continued)
Check TotalAmount PaidDescriptionInv DateInvoiceVendorDateCheck #
84983501009448766/15/2016 JUN25-JUL25/INTERNET/CITY HALLCOMCAST0245656/30/2016 51978333 140.79
84983501007357046/10/2016 MODEMS/REMOTE SURVEILLANCE/CIRQUE PARK 40740 80.84Voucher:
84983501007357126/10/2016 MODEMS/REMOTE SURVEILLANCE/CIRQUE PARK 80.84
84983501009443636/10/2016 JUN19-JULY18/INTERNET/PW SHOP 137.56
84983501009444136/10/2016 JUNE19-JULY18/ INTERNET/SR CENTER 537.59 97.56
1387590-0 6/15/2016 PAPER/HIGHLIGHTER/NOTE PAD/FINANCECOMPLETE OFFICE SOLUTIONS,CORP0237826/30/2016 51978334 46.03
1379926-0 5/27/2016 SORTER/TAPE/ENGINEERING 40741 36.74Voucher:
1381283-0 6/1/2016 EXPO MARKERS 11.25
1380335-0 5/31/2016 TONER CARTRIDGES 1,087.85 993.83
INV1390943 5/31/2016 MAY28-JUN27/BASE RATE/APR28-MAY27/OVERAGCOPIERS NORTHWEST, INC.0243476/30/2016 51978335 100.43
INV1395806 6/10/2016 MAY4-JUN3/OVERGE CHARGE/CITY HALL 40742 476.37Voucher:
INV1395805 6/10/2016 MAY9-JUN8/OVERAGE CHARGE/CITY HALL 45.09
INV1398011 6/14/2016 JUN11-JULY10/CONTRACT LEASE CHARGE/RECRE 32.31
INV1398012 6/14/2016 MAY11-JUN10/OVERAGE CHARGE/RECREATION 666.92 12.72
JUN16 6/17/2016 JUN16/YOGA CLASSES/#5259,#5256 612.00DIANE DEMARS0024316/30/2016 51978336 612.00
Voucher: 40743
098466 6/7/2016 BULK FUEL/PW SHOPDON SMALL & SONS OIL DIST CO0017376/30/2016 51978337 2,281.30
2,347.00138896 6/2/2016 2 DRUMS/PW SHOP 40744 65.70Voucher:
70807 6/1/2016 CORE DRILL HOLE/3600 BLOCK OF DREXLER 421.19EVERGREEN CONCRETE CUTTING INC0259456/30/2016 51978338 421.19
Voucher: 40745
077467 5/31/2016 ROOT CUTTING/STORMLINE/5601 BP WAY 828.75EVERSON'S ECONO VAC INC.0032036/30/2016 51978339 828.75
Voucher: 40746
WATA146967 6/10/2016 MISC PARTS/PW SHOP 42.97FASTENAL COMPANY0241136/30/2016 51978340 42.97
Voucher: 40747
0000131312 6/1/2016 PROMOTIONAL BROCHURES/GET FIT PUNCH CARD 13.07FEDEX OFFICE0010716/30/2016 51978341 13.07
Voucher: 40748
634556 6/15/2016 08 SILVERADO REPAIRS 403.32GILCHRIST CHEVROLET CORP.0013986/30/2016 51978342 403.32
Voucher: 40749
10103 6/1/2016 CAFR CONSULTING 2,590.00GRAY CPA CONSULTING, PC0259366/30/2016 51978343 2,590.00
Voucher: 40750
72249 7/17/2016 BRASS TAG/SPLIT RINGGUARDIAN SECURITY GROUP INC0014066/30/2016 51978344 85.99
310.2672160 6/8/2016 REPAIR DOOR LOCK/MTG ROOM/REC DEPT 40751 224.27Voucher:
REIMB 6/7/2016 REIMBURSEMENT/BANNERS/CIDER SQUEEZE 70.09GURLEY, SUE0258516/30/2016 51978345 70.09
Voucher: 40752
5Page:

06/28/2016
Check List
City of University Place
6
2:30:18PM
Page:apChkLst Final
Bank : bofa BANK OF AMERICA (Continued)
Check TotalAmount PaidDescriptionInv DateInvoiceVendorDateCheck #
REIMB/TUITION 6/20/2016 REIMB/TUITION/BUSINESS CALCULUS 588.25HANDS, LISA0022206/30/2016 51978346 588.25
Voucher: 40753
RETAINAGE 6/27/2016 RETAINAGE RELEASE/UP MAIN ST REDEVELOPME 37,236.02JR ABBOTT CONSTRUCTION INC0257846/30/2016 51978347 37,236.02
Voucher: 40754
2016SP-F86 6/20/2016 SPRING 2016/SOCCER CLINICS 5,880.00KIDZ LOVE SOCCER0232896/30/2016 51978348 5,880.00
Voucher: 40755
MILEAGE 6/20/2016 MILEAGE REIMB/MAY & JUN 2016 47.15KLEBER, AMANDA0258416/30/2016 51978349 47.15
Voucher: 40756
REIMB 6/7/2016 REIMB/POSTERS & FLYERS/SQUEEZE & CONCERT 707.37KLOSOWSKI, DEBBIE0010726/30/2016 51978350 707.37
Voucher: 40757
471516 5/23/2016 BLADES/SCREWS/PW SHOP 209.17LAKEWOOD HARDWARE & PAINT0028736/30/2016 51978351 209.17
Voucher: 40758
060316 6/3/2016 8 SHEETS 60X120/CUT TO WINDOW SIZE 3,250.00LAKEWOOD IRON WORKS0019876/30/2016 51978352 3,250.00
Voucher: 40759
REFUND 6/24/2016 REFUND/PAID TO CITY OF UP IN ERROR 9.84LAKEWOOD MUNICIPAL COURT0253426/30/2016 51978353 9.84
Voucher: 40760
0516T16088 5/31/2016 TESTING & INSPECTION/ELWOOD DR PROJECT 4,239.75MAYES TESTING ENGINEERS,INC.0242176/30/2016 51978354 4,239.75
Voucher: 40761
1476500 6/9/2016 SINGLE PASS CRUSHED ROCK/STORM DRAIN MAI 103.32MILES RESOURCES, LLC0013526/30/2016 51978355 103.32
Voucher: 40762
REIMB 6/16/2016 REIMB/MILEAGE/CITY BUSINESS 8.51MOERKE, BRENDA0259986/30/2016 51978356 8.51
Voucher: 40763
264994 5/31/2016 14 GA SQUARE STREET SIGN POSTS~NATIONAL BARRICADE CO,LLC0031456/30/2016 51978357 4,550.49
6,202.43264993 5/31/2016 TRAFFIC CONES 40764 1,651.94Voucher:
I02475211-052820165/28/2016 FLYER BOARD/DUCK DAZENEWS TRIBUNE0010956/30/2016 51978358 37.50
I02475211-052920165/29/2016 FLYER BOARD/DUCK DAZE 40765 142.54Voucher:
I02430634-050420165/4/2016 ORDINANCE PUBLICATION/ORD #667 107.89
I02457321-051820165/18/2016 ORDINANCE PUBLICATION/ORD #668 156.13
I02475211-052720165/27/2016 FLYER BOARD/DUCK DAZE 37.50
I02412572-042620164/26/2016 BID AD/27TH ST W 912.47
I02475211-052620165/26/2016 FLYER BOARD/DUCK DAZE 1,431.53 37.50
8356 6/2/2016 JUN3 ISSUE/UP PRESS CONTRACT 1,846.15P.C.COMMUNITY NEWSPAPER GROUP0241396/30/2016 51978359 1,846.15
Voucher: 40766
062016 6/20/2016 CONSULTING SERVICE/COUNCIL VISIONING PRO 2,095.13PACIFIC NORTHWEST CONSULTING0251726/30/2016 51978360 2,095.13
Voucher: 40767
6Page:

06/28/2016
Check List
City of University Place
7
2:30:18PM
Page:apChkLst Final
Bank : bofa BANK OF AMERICA (Continued)
Check TotalAmount PaidDescriptionInv DateInvoiceVendorDateCheck #
REFUND 6/27/2016 REFUND/SR. CENTER RENTAL DEPOSIT 200.00PAVONE, CANCACE0260006/30/2016 51978361 200.00
Voucher: 40768
CI-217202 6/1/2016 APR16/TRAFFIC OPER MAINTENANCEPIERCE COUNTY BUDGET & FINANCE0011096/30/2016 51978362 3,887.61
CI-217267 6/6/2016 JULY16-DEC16/EMERGENCY MANAGEMENT SERVIC 40769 13,481.00Voucher:
CI-217689 6/9/2016 JUNE16/POLICE SERVICES 272,946.98
CI-217823 6/15/2016 2016 OPEN SPACE AGREEMENT/CHAMBERS CREEK 325,315.59 35,000.00
312226 6/3/2016 #9205/CIRQUE PARKPIERCE COUNTY SECURITY, INC.0246986/30/2016 51978363 150.00
312017 6/3/2016 #10740/MAY16/PARADISE POND 40770 73.00Voucher:
312286 6/3/2016 #9206/MAY16/KOBAYASHI 373.00 150.00
6 6/16/2016 BRIDGEPORT LID PROJECT 150,003.97PIVETTA BROTHERS CONST.,INC.0238826/30/2016 51978364 150,003.97
Voucher: 40771
4 6/15/2016 ELWOOD SAFE ROUTES 280,527.03PUGET PAVING AND CONSTRUCTION0254456/30/2016 51978365 280,527.03
Voucher: 40772
16-091S/2ND QTR1612/30/2015 2NDQTR/CLEAN AIR ASSESS/STATE MANDATED 5,191.25PUGET SD CLEAN AIR AGENCY CORP0016306/30/2016 51978366 5,191.25
Voucher: 40773
1 6/16/2016 MILDRED/67TH ROADWAY IMPROVEMENTS 163,640.00R W SCOTT CONSTRUCTION CO INC0018546/30/2016 51978367 163,640.00
Voucher: 40774
379105 6/7/2016 CLEAN CRUSHED ROCK/WATERFALL/CIVIC BLDGRANDLES SAND & GRAVEL INC0012956/30/2016 51978368 119.67
241.45378967 5/31/2016 OVERSIZE ROCK//WATERFALL/CIVIC BLDG 40775 121.78Voucher:
1-59564 6/11/2016 FLAT REPAIR/WHEEL CHANGE/SWEEPERS & S TIRE SERVICE INC0022066/30/2016 51978369 121.75
2,432.001-62301 4/29/2016 BACKHOE/REPAIRS 40776 2,310.25Voucher:
1095041 6/10/2016 RESTROOM SUPPLIESSARCO SUPPLY0217126/30/2016 51978370 146.31
208.061094868 6/3/2016 SUPPLIES/SOAP DISPENSER 40777 61.75Voucher:
8147100120606 6/5/2016 81-471-0012-0/SHELL 102.67SHELL FLEET CARD SERVICES0013286/30/2016 51978371 102.67
Voucher: 40778
103929 6/1/2016 JUNE16/LANDSCAPE MAINTENANCE 11,056.10SIGNATURE LANDSCAPE SERVICES0258156/30/2016 51978372 11,056.10
Voucher: 40779
ITAC045776 5/31/2016 INSULATED GLASS/WINDOW/DEPUTY CM OFFICE 744.49SOUND GLASS SALES, INC0018596/30/2016 51978373 744.49
Voucher: 40780
19679 6/8/2016 CORRUGATED PLASTIC SHEETS/OFFICE USE/ENG 790.48SPECTRUM SIGN COMPANY, INC.0014266/30/2016 51978374 790.48
Voucher: 40781
2890906 6/7/2016 PEST CONTROL/WMVSPRAGUE PEST SOLUTIONS INC.0030086/30/2016 51978375 98.46
311.792890907 6/7/2016 PEST CONTROL/WMV 40782 213.33Voucher:
7Page:

06/28/2016
Check List
City of University Place
8
2:30:18PM
Page:apChkLst Final
Bank : bofa BANK OF AMERICA (Continued)
Check TotalAmount PaidDescriptionInv DateInvoiceVendorDateCheck #
55743 6/15/2016 OFFICE MAT RENTAL/PW SHOPSUPERIOR LINEN SERVICE,INC.0026136/30/2016 51978376 89.00
52775 6/1/2016 OFFICE MAT RENTAL/PW SHOP 40783 89.00Voucher:
CREDIT 3/2/2016 CREDIT/DUPLICATE PAYMENT/INV 088936 89.00-89.00
30785830 6/15/2016 ELK RIVER & SHOCK ABSORB LANYARDS 152.52TACOMA SCREW PRODUCTS INC0020976/30/2016 51978377 152.52
Voucher: 40784
027964-00 5/26/2016 IRRIGATION SUPPLIES/PW SHOP USE 217.48TACOMA WINSUPPLY, INC.0253116/30/2016 51978378 217.48
Voucher: 40785
8584 6/15/2016 CREDIT/INVOICE #0516-8584RV/CIVIC ELEVATTHOMPSON ELECTRICAL CONSTRUCT.0028236/30/2016 51978379 -194.62
0616-8555CG 6/15/2016 TROUBLE SHOOT/REPLACE TRANSFORMER 40786 225.36Voucher:
0616-8540CG 6/2/2016 ELECTRICAL WORK/WATER FEATURE PUMPS/CIVI 778.90 748.16
834084188 6/1/2016 MAY16/WEST INFORMATION CHARGES 653.09THOMSON REUTERS - WEST0016366/30/2016 51978380 653.09
Voucher: 40787
137406362-001 5/25/2016 REPLACED O-RING & UPPER CONTROL BOX/GENI 490.59UNITED RENTALS NW INC0013946/30/2016 51978381 490.59
Voucher: 40788
47697 5/31/2016 BP WAY PH 4A/ROW & AQUISITION/MAY16 722.83UNIVERSAL FIELD SERVICES, INC.0253766/30/2016 51978382 722.83
Voucher: 40789
910590 6/22/2016 JULY16/BILLING PERIOD/COMPACTORUNIVERSITY PLACE REFUSE SV,INC0013316/30/2016 51978383 988.08
1,535.06910581 6/22/2016 JULY16/BILLING PERIOD/REFUSE SERVICE 40790 546.98Voucher:
F22587 6/10/2016 MAY16/CURTIS JH GYM USE/MOTHER SON SPORT 30.00UNIVERSITY PLACE SCHOOL DIST.0011516/30/2016 51978384 30.00
Voucher: 40791
16736 6/17/2016 FORD ESCAPE/OIL & FILTER SERVICE/ENGINEE 35.60UNIVERSITY PLACE TIRE CENTER0013326/30/2016 51978385 35.60
Voucher: 40792
JB8277 6/16/2016 DUMP TRUCK CAB/CHASSIS/REPLACING 1998 VE 65,604.95VALLEY FREIGHTLINER INC.0227086/30/2016 51978386 65,604.95
Voucher: 40793
9767013699 6/12/2016 CELL PHONES/PW & PARKS MAINTVERIZON WIRELESS,LLC.0011536/30/2016 51978387 767.34
2,470.059766352947 6/1/2016 MAY16/CELL PHONES/CITYWIDE 40794 1,702.71Voucher:
REFUND 6/13/2016 REFUND/SR. DAY TRIP CANCELLED/#5263 10.00VIETENHANS, VIANNA0259926/30/2016 51978388 10.00
Voucher: 40795
REFUND 6/13/2016 REFUND/SR. DAY TRIP CANCELLED/#5263VORISE, KITTIE0258896/30/2016 51978389 10.00
32.50REFUND 6/22/2016 REFUND/SR DAY TRIP CANCELLED/#5327 40796 22.50Voucher:
2016050077 6/1/2016 MAY16/TELECOMMUNICATIONS SERVICE 196.52WA STATE0010326/30/2016 51978390 196.52
Voucher: 40797
L115441 6/9/2016 AUDIT PERIOD/14-15WA STATE AUDITORS OFFICE0015126/30/2016 51978391 1,675.80
31,280.14L115220 6/9/2016 AUDIT PERIOD/15-15 40798 29,604.34Voucher:
8Page:

06/28/2016
Check List
City of University Place
9
2:30:18PM
Page:apChkLst Final
Bank : bofa BANK OF AMERICA (Continued)
Check TotalAmount PaidDescriptionInv DateInvoiceVendorDateCheck #
2016-RS-WAR0450215/3/2016 REGIONAL STORMWATER MONITORING PERMIT 21,730.00WA STATE DEPT OF ECOLOGY0018096/30/2016 51978392 21,730.00
Voucher: 40799
RE-313-ATB606141016/14/2016 PROJ MGMNT/MILDRED & 67TH ROADWAYWA STATE DEPT OF TRANSPORT.0225906/30/2016 51978393 234.66
454.74RE-313-ATB606141036/14/2016 PROJ MGMNT/BP WAY IMPROVEMENTS PH5 40801 220.08Voucher:
I6008123 6/1/2016 MAY16/BACKGROUND CHECKS 216.00WA STATE PATROL0013896/30/2016 51978394 216.00
Voucher: 40802
0182830 6/13/2016 SIGNS/CIVIC BUILDING 347.45ZUMAR INDUSTRIES INC0013576/30/2016 51978395 347.45
Voucher: 40803
Sub total for BANK OF AMERICA: 1,231,515.57
9Page:

06/28/2016
Check List
City of University Place
10
2:30:18PM
Page:apChkLst Final
checks in this report. Grand Total All Checks: 79 1,231,515.57
10Page:

#6B


CITY OF UNIVERSITY PLACE, WASHINGTON
COMPREHENSIVE ANNUAL FINANCIAL REPORT
FOR THE FISCAL YEAR ENDED DECEMBER 31, 2015
PREPARED BY THE FINANCE DEPARTMENT
ERIC FAISONExecutive Director, Finance and Administrative Services
LESLIE BLAISDELLDeputy Finance Director/Risk Manager
STACY LEWISFinance Operations Manager
LISA HANDSPayroll/Benefits Supervisor
JENNIFER ROBINSONFinance Analyst
BRENDA MOERKEFinance Specialist

The City of University Place
Incorporated in 1995, University Place ranks 35th in population in the State of Washington with a population of approximately 31,270. University Place encompasses an area of 8.4 square miles and is a mostly suburban residential city located on the picturesque Puget Sound just south of Tacoma. In addition to its proximity to Tacoma, University Place offers easy accessibility to Seattle, Olympia, and the Puget Sound peninsulas. University Place is easily accessible by Interstate 5 or Highway 16.
The City has a Council/Manager form of government. The City Council consists of seven council members, each of whom is elected at-large. The Council elects the Mayor from its members. The City Manager serves as the chief executive officer and is responsible for daily administration of personnel, policies and programs. The City Manager is appointed by, reports directly to, and serves at the pleasure of the Council.

City of University PlaceTABLE OF CONTENTS
I. INTRODUCTORY SECTION
Letter of Transmittal................................................................................................................................................................................................................................................................................................................................................................................................................................................................................................................................9Certificate of Achievement................................................................................................................................................................................................................................................................................................................................................................................................................................................................................................................................16Elected Officials and Executive Staff................................................................................................................................................................................................................................................................................................................................................................................................................................................................................................................................17City Organizational Chart................................................................................................................................................................................................................................................................................................................................................................................................................................................................................................................................18
II. FINANCIAL SECTION
Independent Auditor's Report................................................................................................................................................................................................................................................................................................................................................................................................................................................................................................................................22
A. MANAGEMENT DISCUSSION AND ANALYSIS (required supplementary information)................................................................................................................................................................................................................................................................................................................................................................................................................................................................................................................................25 - 32
B. BASIC FINANCIAL STATEMENTS
Government-Wide Financial StatementsStatement of Net Position................................................................................................................................................................................................................................................................................................................................................................................................................................................................................................................................33Statement of Activities................................................................................................................................................................................................................................................................................................................................................................................................................................................................................................................................34
Fund StatementsGovernmental Fund Financial Statements
Balance Sheet................................................................................................................................................................................................................................................................................................................................................................................................................................................................................................................................35Reconciliation of the Governmental Fund Balances to Net Position of Governmental Activities................................................................................................................................................................................................................................................................................................................................................................................................................................................................................................................................36Statement of Revenues, Expenditures, and Changes in Fund Balances - Governmental Funds................................................................................................................................................................................................................................................................................................................................................................................................................................................................................................................................37Reconciliation of the Statement of Revenues, Expenditures, and Changes in Fund Balances
of Governmental Funds to the Statement of Activities................................................................................................................................................................................................................................................................................................................................................................................................................................................................................................................................38
Proprietary Fund Financial StatementsStatement of Net Position - Proprietary Funds................................................................................................................................................................................................................................................................................................................................................................................................................................................................................................................................39Statement of Revenues, Expenses, and Changes in Fund Net Position - Proprietary Funds................................................................................................................................................................................................................................................................................................................................................................................................................................................................................................................................40Statement of Cash Flows - Proprietary Funds................................................................................................................................................................................................................................................................................................................................................................................................................................................................................................................................41
Notes to the Financial Statements................................................................................................................................................................................................................................................................................................................................................................................................................................................................................................................................42 - 68
C. REQUIRED SUPPLEMENTAL INFORMATION OTHER THAN MD&A
Budgetary Comparison Schedule - General Fund································································································································································································································································································································································································································································································································69Budgetary Comparison Schedule - LRF Fund································································································································································································································································································································································································································································································································70Schedule of Proportionate Share of the Net Pension Liability
Public Employee's Retirement System Plan 1································································································································································································································································································································································································································································································································71Schedule of Proportionate Share of the Net Pension Liability
Public Employee's Retirement System Plans 2 and 3································································································································································································································································································································································································································································································································72Schedule of Employer Contributions
Public Employee's Retirement System Plans 2 and 3································································································································································································································································································································································································································································································································73
Notes to the Required Supplementary Information................................................................................................................................................................................................................................................................................................................................................................................................................................................................................................................................74
D. COMBINING & INDIVIDUAL FUND STATEMENTS & SCHEDULES
Non-Major Funds - Other Governmental FundsCombining Balance Sheet - Nonmajor Governmental Funds................................................................................................................................................................................................................................................................................................................................................................................................................................................................................................................................77Combining Statement of Revenues, Expenditures, and Changes in Fund
Balances - Nonmajor Funds................................................................................................................................................................................................................................................................................................................................................................................................................................................................................................................................78Combining Balance Sheet - Nonmajor Governmental Funds................................................................................................................................................................................................................................................................................................................................................................................................................................................................................................................................79Combining Statement of Revenues, Expenditures, and Changes in Fund
Balances - Nonmajor Funds................................................................................................................................................................................................................................................................................................................................................................................................................................................................................................................................80Combining Balance Sheet - Nonmajor Capital Projects Fund................................................................................................................................................................................................................................................................................................................................................................................................................................................................................................................................81Combining Statement of Revenues, Expenditures, and Changes in Fund
Balances - Nonmajor Capital Projects Fund................................................................................................................................................................................................................................................................................................................................................................................................................................................................................................................................82

City of University PlaceSchedule of Revenues, Expenditures and Changes in Fund Balance - Budget and Actual
Street Fund................................................................................................................................................................................................................................................................................................................................................................................................................................................................................................................................84Arterial Street Fund................................................................................................................................................................................................................................................................................................................................................................................................................................................................................................................................85Real Estate Excise Tax Fund................................................................................................................................................................................................................................................................................................................................................................................................................................................................................................................................86Traffic Impact Fee Fund................................................................................................................................................................................................................................................................................................................................................................................................................................................................................................................................87Transportation Benefit District................................................................................................................................................................................................................................................................................................................................................................................................................................................................................................................................88Paths and Trails Reserve Fund................................................................................................................................................................................................................................................................................................................................................................................................................................................................................................................................89Donations Fund................................................................................................................................................................................................................................................................................................................................................................................................................................................................................................................................90Parks Capital Improvement Fund................................................................................................................................................................................................................................................................................................................................................................................................................................................................................................................................91Public Works Capital Improvement Fund................................................................................................................................................................................................................................................................................................................................................................................................................................................................................................................................92Municipal Facilities Capital Improvement Fund................................................................................................................................................................................................................................................................................................................................................................................................................................................................................................................................93Debt Service Fund................................................................................................................................................................................................................................................................................................................................................................................................................................................................................................................................94Parks and Recreation Fund................................................................................................................................................................................................................................................................................................................................................................................................................................................................................................................................95Development Services Fund................................................................................................................................................................................................................................................................................................................................................................................................................................................................................................................................96Police and Public Safety Fund................................................................................................................................................................................................................................................................................................................................................................................................................................................................................................................................97Strategic Reserve Fund................................................................................................................................................................................................................................................................................................................................................................................................................................................................................................................................98
Internal Service FundsCombining Statement of Net Position................................................................................................................................................................................................................................................................................................................................................................................................................................................................................................................................100Combining Statement of Revenues, Expenses, and Changes in Fund Net Position................................................................................................................................................................................................................................................................................................................................................................................................................................................................................................................................101Combining Statement of Cash Flows................................................................................................................................................................................................................................................................................................................................................................................................................................................................................................................................102
E. SUPPLEMENTAL INFORMATION
SchedulesSchedule of Expenditures of Federal Awards................................................................................................................................................................................................................................................................................................................................................................................................................................................................................................................................104Schedule of State and Local Financial Assistance................................................................................................................................................................................................................................................................................................................................................................................................................................................................................................................................105
III. STATISTICAL SECTION
Table 1 - Net Position by Component, Last Ten Fiscal Years................................................................................................................................................................................................................................................................................................................................................................................................................................................................................................................................106Table 2 - Changes in Net Position, Last Ten Fiscal Years................................................................................................................................................................................................................................................................................................................................................................................................................................................................................................................................107Table 3 - Program Revenues by Function/Program................................................................................................................................................................................................................................................................................................................................................................................................................................................................................................................................109Table 4 - Fund Balances, Governmental Funds................................................................................................................................................................................................................................................................................................................................................................................................................................................................................................................................110Table 5 - Changes in Fund Balances, Governmental Funds................................................................................................................................................................................................................................................................................................................................................................................................................................................................................................................................111Table 6 - Tax Revenue by Source, Last Ten Years................................................................................................................................................................................................................................................................................................................................................................................................................................................................................................................................112Table 7 - Assessed and Estimated Actual Value of Taxable Property - Current Year................................................................................................................................................................................................................................................................................................................................................................................................................................................................................................................................113Table 8 - Property Tax Levies - Direct and Overlapping Governments................................................................................................................................................................................................................................................................................................................................................................................................................................................................................................................................114Table 9 - Principal Taxpayers, Current and Nine Years Ago................................................................................................................................................................................................................................................................................................................................................................................................................................................................................................................................115Table 10 - Property Tax Levies and Collections................................................................................................................................................................................................................................................................................................................................................................................................................................................................................................................................116Table 11 - Taxable Sales by Category................................................................................................................................................................................................................................................................................................................................................................................................................................................................................................................................117Table 12 - Direct and Overlapping Sales Tax Rates................................................................................................................................................................................................................................................................................................................................................................................................................................................................................................................................118Table 13 - Sales Tax Payers, Current and Nine Years Ago................................................................................................................................................................................................................................................................................................................................................................................................................................................................................................................................119Table 14 - Ratios of Outstanding Debt by Type................................................................................................................................................................................................................................................................................................................................................................................................................................................................................................................................120Table 15 - Ratio of Net General Bonded Debt to Assessed Value
and Net Bonded Debt per Capita................................................................................................................................................................................................................................................................................................................................................................................................................................................................................................................................121Table 16 - Computation of Direct and Overlapping Debt................................................................................................................................................................................................................................................................................................................................................................................................................................................................................................................................122Table 17 - Computation of Limitation of Indebtedness................................................................................................................................................................................................................................................................................................................................................................................................................................................................................................................................123Table 18 - Compilation of General Obligation Debt Capacity, Last Ten Years................................................................................................................................................................................................................................................................................................................................................................................................................................................................................................................................124Table 19 - Demographic Statistics................................................................................................................................................................................................................................................................................................................................................................................................................................................................................................................................125Table 20 - Principal Employers, Current and Nine Years Ago................................................................................................................................................................................................................................................................................................................................................................................................................................................................................................................................126Table 21 - Full Time Equivalent Employees by Function, Last Ten Years................................................................................................................................................................................................................................................................................................................................................................................................................................................................................................................................127Table 22 - Operating Indicators by Function/Program, Last Ten Years................................................................................................................................................................................................................................................................................................................................................................................................................................................................................................................................128Table 23 - Capital Asset Statistics by Function/program, Last Ten Years................................................................................................................................................................................................................................................................................................................................................................................................................................................................................................................................129


This page intentionally left blank

INTRODUCTORY SECTION
Letter of TransmittalGFOA Certificate of Achievement
List of Elected and Appointed Officials2015 Organizational Chart


June 14, 2016
Mayor Figueroa,The University Place City Council, andCitizens of University Place, Washington:
This letter transmits the Comprehensive Annual Financial Report of the City of University Place for the fiscal year ended December 31, 2015. This report is published annually as the official annual financial report and complies with State law (RCW 43.09.230) requiring annual reports for Washington municipal governments to be certified and filed with the State Auditor’s Office in a timely fashion.
The management of the City is responsible for the accuracy of the data, and the completeness and fairness of the presentation, including all disclosures. We believe the enclosed data is accurate in all material respects and is reported in a manner designed to accurately present the financial position and results of operations of the various funds of the City of University Place. The report includes all disclosures necessary to enable readers to understand the City’s financial activities.
This report has been prepared in accordance with accounting principles generally accepted in the United States of America as prescribed by all Governmental Accounting Standards Board (GASB) pronouncements.
This report includes all funds of the City in conformance with Governmental Accounting and Financial Reporting Standards. It includes all funds, agencies, and boards controlled by or dependent on the City of University Place. To aid the reader, the major sections of this report are segregated by divider pages, which provide introductions to the sections.
Generally Accepted Accounting Principles (GAAP) requires management to provide a narrative introduction, overview, and analysis within a Management’s Discussion & Analysis (MD&A) to accompany the basic financial statements. This letter of transmittal is designed to complement, and be read in conjunction with, the MD&A. The City of University Place’s MD&A can be found immediately following the independent auditor’s report.
REPORTING ENTITY AND ITS SERVICES
The City of University Place is located on the picturesque Puget Sound halfway between the state capitol of Olympia and the state’s largest city, Seattle. Boasting beautiful scenic views of the Olympic Mountains, Mount Rainier, and the Puget Sound, University Place is easily accessible by Interstate 5 or Highway 16. Including 8.4 square miles, the City is a lovely community in which its 31,720 residents can live, work, and play.
Page 9

The City of University Place incorporated on August 31, 1995. The City is a non-charter Optional Code City with a Council-Manager form of government. The City Council consists of seven Councilmembers, each of whom is elected at-large. The Council elects the Mayor from its members. The City Manager serves as the chief executive officer and is responsible for daily administration of personnel, policies, and programs. The City Manager is appointed by, reports directly to, and serves at the pleasure of the Council.
At the direction of Council, the City maintains a relatively small staff (currently 48 full time equivalents) for a city its size and contracts with public and private entities for many services. City services provided include: police protection, jail services, municipal court, animal control, construction and maintenance of streets, surface water management, building inspection, planning and zoning, park maintenance, recreation programs, and general administration.
The City Manager coordinates the work of the City staff utilizing a flat and flexible organizational structure. Maintaining a flat organization allows staff to work interdepartmentally as needed, while continuing to focus on performing quality work in their primary departments. The City departments include: Finance, Public Safety, Development Services, Engineering, Parks & Public Works, and the City Manager’s Department. The City Manager’s Department includes the City Manager’s Office, the Deputy City Manager for Finance and Administrative Services and the Deputy City Manager for Community and Economic Development. The City Attorney’s Office is also separate from other departments, and reports to the City Manager. See the Organizational Chart for more details.
The City contracts with Pierce County for law enforcement, animal control and jail services. West Pierce Fire and Rescue provides fire protection and emergency medical services. Court services are contracted with the City of Lakewood. Tacoma Public Utilities delivers water and electric services. Pierce County Public Works and Utilities provide sewer services. Pierce Transit offers public transportation services. The Pierce County Library District makes library and reference services available to residents. The University Place School District (UPSD) No. 83 and the Tacoma School District provide educational programs for kindergarten through high school students.
ECONOMIC CONDITIONS AND OUTLOOK
Nation and RegionBoth the national economy and the Puget Sound region continue to recover from the recession. The US Bureau of Economic Analysis reported that the Real Gross Domestic Product increased by 2.4 percent in 2015, the same rate as in 2014. The Bureau of Labor Statistics reported that the consumer price index (CPI) increased by 0.7 percent in 2015, compared to 0.8 percent increase for 2014.
In 2015 University Place housing prices rose by 4.8% over 2014 prices and an additional increase of 3.5% is predicted for 2016. A shortage of inventory in the areas is driving prices up. Sales continue to increase due in large part to low mortgage rates. Most forecasters agree housing prices will continue to rise in 2016but sales may slow because of the limited supply. Locally, the City issued 14 new single family residential permits in 2015, compared to 50 issued in 2014.
The national unemployment rate decreased to 5.0 percent by December, 2015, down from 5.6 percent in December, 2014. Unemployment in the Seattle-Tacoma-Bellevue increased slightly in 2015. The unemployment rate in the Metropolitan Statistical Area (MSA) was 5.0 percent at the end of the year, upfrom 4.9 percent in 2014.
Page 10

Local The local economy saw continued economic recovery in 2015. City of University Place revenues increased slightly, but its residents and businesses continued to contain their spending in order to weather the crisis. Real estate excise taxes continued to increase in 2015 by 25 percent over 2014.
In 2015 the number of licensed businesses in the City totaled 1,309, a decrease from the 2014 total of 1,334. This total includes home occupancy businesses. The ten employers providing the most jobs in the City in 2015 were:
1. University Place School District 6. Pierce County Government2. Franciscan Health System 7. Charles Wright Academy3. Fred Meyer Stores 8. Kemper Sports4. Soundcare, Inc. 9. Safeway Stores, Inc.5. Whole Foods 10. McDonald’s Restaurants
To address a revenue reductions resulting from the recession, the City substantially reduced staff and expenditures in 2009. The City has maintained reduced service levels through 2015. To ensure that the City has resources sufficient to meet all of its financial and legal obligations the City maintains a five year financial forecast, which it updates annually.
The City’s financial forecast shows that the City will have sufficient revenues to meet all of its obligations through the forecasted period. However, expenses are projected to exceed revenues by $900,000 annually. We recognize that additional service level reductions will be needed without new revenue. The first step in addressing the shortfall was taken in October, 2015 when the City Council passed a resolution eliminating funding of the city’s Recreation programs beginning in 2017. This action addresses approximately $400,000 of the shortfall. The City Council continues to evaluate other options to address the remaining $500,000. Options being considered include new revenue sources as well as service level cuts.
SIGNIFICANT EVENTS AND ACCOMPLISHMENTS
2015 continued to be a year of transition for the City of University Place. As the City celebrated its 20-year anniversary, the fruits of its long-term efforts to transform into a community with a more distinctive character and sustainable economy were on clear display.
The past year demonstrated continued success in the redevelopment of the City’s downtown. The City celebrated with great fanfare the opening of the first Whole Foods in Pierce County – the only Whole Foods between Seattle and Vancouver, Washington. There also was time to celebrate the completed construction of a second 5-story mixed-use building in the City’s downtown, and the start of construction on an enlarged parking garage and third mixed-use building. The City expects continued development within the area over the next several years, which will create a visible “city center” for the community.
The City also hosted the first U.S. Open in the Northwest. The 2015 U.S. Open, held at Pierce County’s Chambers Bay Golf Course, was a huge success. Chambers Bay, a links-style course located along the shores of the City’s Puget Sound coastline, was the center of the media world for a week in June. Controversy surrounding the golfers’ play, along with stunning shots of the Course, the City and the region during warm, sunny summer days, were great marketing for future events at the Course. The success of the event also helped the City financially – generating over $1.2 million in sales and admissions tax revenue.
Despite this success, the struggles of this year in transition also were evident. While the City has a long-term plan to diversify and expand its tax base, the City is committed to addressing its financial challenges immediately. The City provided voters with an opportunity to maintain and expand police services. When
Page 11

voters rejected the ballot measure, the City Council took decisive action in 2015 to make the reductions necessary to create a sustainable Public Safety budget. Similarly, the Council adopted a resolution in 2015 to eliminate the City’s recreation program beginning in 2017 – saving the City almost $400,000 a year. The City Council is now in the process of considering several other final changes that would ensure that the City can responsibly provide limited, but high quality services to our residents through a fiscally responsible, sustainable budget.
The combination of these great successes and the Council’s commitment to responsible governance have already produced results. The City’s finances are on stronger ground than they have been in a decade. We fully expect that this dramatic turnaround will continue in 2016 and beyond, and the City will continue to be a community of choice in Pierce County.
COUNCIL GOALS FOR 2015-2016 BIENNIUM
While recognizing the profound changes in the economic picture from two years ago when these goals were originally set, the City Council and staff nonetheless continue to work vigorously towards achieving the outcomes identified with each of the goals. The recession did not dampened the desire of the City Council to transform University Place into a regional destination for retail, dining, and entertainment.
Goal: A Safer, More Livable Community.x Improved Parks and Recreation
o Consider a Resolution directing the administration to work with a professional consultant and the PARC commission to develop a Master Plan for Creekside Park.
x Better Infrastructure o Complete Surface Water Management Plan Update.o Schedule study session(s) to review options for sustainable funding for street maintenance and upon
completion of study, determine to conclude the topic, or adopt legislation achieving the outcome or identifying next steps toward achieving the outcome.
o Construct pavement overlay of Cirque Drive between Bridgeport Way and Grandview Drive.o Construct Market Court between Bridgeport Way and Drexler Drive.o Construct pavement overlay of Drexler Drive between 37th and 35th Streets.o Construct curb, gutter, sidewalk, bike lanes and streetlights along Mildred Avenue between 19th
Street and Regents Boulevard.o Construct curb, gutter, sidewalk and streetlights along the north side of 44th Street between
Bridgeport Way and 67th Avenue.o Construct curb, gutter, sidewalk and streetlights along the south side of Cirque Drive between
Orchard Street and 67th Avenue.x More Beautiful City
o Schedule study session(s) to review feasibility of undergrounding utility poles and upon completion of study, determine to conclude the topic, or adopt legislation achieving the outcome or identifying next steps toward achieving the outcome.
o Consider a Resolution adopting a Gateway Signage Plan. x A Full-Service, Self-Sufficient Community
o Schedule study session(s) to review options for sustainable funding for Council-approved City events, and upon completion of study, determine to conclude the topic, or adopt legislation achieving the outcome or identifying next steps toward achieving the outcome.
o Schedule study session(s) to identify any gaps in City services and available resources to meet any service gaps, and upon completion of study, determine to conclude the topic, or adopt legislation achieving the outcome or identifying next steps toward achieving the outcome.
Page 12

Goal: Increased Community Economic Vitality.x Improved business climate
o Consider a Resolution directing the Planning Commission in consultation with the Economic Development Commission to prepare a Sub-Area Plan for the Town Center Zone.
o Consider a Resolution directing the Planning Commission in consultation with the Economic Development Commission to prepare a Sub-Area Plan for the 27th Street Corridor.
o Consider a Resolution directing the Planning Commission in consultation with the Economic Development Commission to prepare a Sub-Area Plan for the Mildred Corridor.
o Consider a Resolution directing the Economic Development Commission in consultation with the Planning Commission to review city-wide zoning for economic development opportunities (e.g., waterfront and business park zoning).
Goal: Better Financial Conditions.x Increased City Financial Stability
o Consider a Resolution to enhance City’s reserves.o Review policies for debt reduction.
Goal: Greater Citizen Trust and Confidence.x Improved public understanding of Council initiatives
o Adopt a Communications Strategy.o Schedule study session(s) to explore new or additional opportunities for citizen feedback, and upon
completion of study, determine to conclude the topic, or adopt legislation achieving the outcome or identifying next steps toward achieving the outcome.
FINANCIAL INFORMATION
The City of University Place is responsible for establishing and maintaining an internal control structure designed to ensure that the assets of the City are protected from loss, theft, or misuse, and to ensure that adequate accounting data are compiled to allow for the preparation of financial statements in conformity with generally accepted accounting principles. The internal control structure is designed to provide reasonable, but not absolute, assurances that these objectives are being met. The concept of reasonable assurance recognizes that: 1) the cost of a control should not exceed the benefits likely to be derived; and 2) the evaluation of the relative cost and benefits of the control system requires estimates and judgments by management.
Single Audit
As a recipient of federal, state, and county financial assistance, the City is required to maintain an adequate internal control structure to ensure compliance with applicable laws and regulations. This internal control structure is subject to periodic evaluation by management and the State Auditor’s Office.
As part of the City’s single audit, tests are performed to determine the adequacy of the internal control structure, including that portion related to federal financial assistance programs, as well as the government’s compliance with applicable laws and regulations. The results of the City’s single audit for the year ended December 31, 2015 indicated that there were no material weaknesses in the internal control structure.
Budgetary Controls
The City maintains budgetary controls in accordance with the revised Code of Washington (RCW 35A.34). The objectives of these budgetary controls are to ensure compliance with legal provisions embodied in the annual appropriated budget approved by the City Council. Activities of the General Fund, Special Revenue
Page 13

Funds (except the Donations Fund), and Debt Service Funds are included in the annual appropriated budget. The level of budgetary control at which expenditures cannot legally exceed the appropriated amount is established at the individual fund level. The Internal Service Funds are management budgets only and are therefore not presented in the CAFR.
The Parks and Recreation and Development Services Funds were established to identify revenues and expenditures related to the operation of those divisions. Recreation is being funded primarily through user fees from the programs, donations and revenue from fundraising events. The administration of Recreation is funded by a transfer from the General fund. Parks Maintenance and the non-fee supported activities in Development Services are also funded by transfers from the General Fund.
In August, 2010, the City Council approved a resolution dedicating the property tax to public safety and defined public safety expenses. The Police and Public Safety Fund was established in 2012 to identify revenues and expenditures related to the operation of police services, court services, jail, city attorney’s office, crime prevention, animal control, code enforcement and emergency management. Revenues supporting this fund include property taxes, revenues identified by state statutes collected in support of public safety, fines and forfeitures, pet license fees, and grants.
The City also maintains an encumbrance accounting system as one technique of accomplishing budgetary control. All appropriations lapse at year-end with the exception of multi-year capital improvement projects. As demonstrated by the statements and schedules included in the financial section of this report, the City continues to meet its responsibility for sound financial management.
INDEPENDENT AUDIT
State law requires an annual audit of all City books of account, financial records, and transactions by the State Auditor, an independently elected State official. The 2015 audit of the City has been completed in conformance with generally accepted auditing standards. The financial statements of all City funds have been included in this audit. The City has been given an unqualified opinion for 2015. The State Auditor’s report on the General Purpose Financial Statements is included in the financial section of this report.
AWARDS
The Government Finance Officers Association of the United States and Canada (GFOA) awarded the Certificate of Achievement for Excellence in Financial Reporting to the City of University Place for its Comprehensive Annual Financial Report for the year ended December 31, 2014. This was the eighteenth consecutive year that the City has achieved this prestigious award.
In order to be awarded a Certificate of Achievement, a governmental entity must publish an easily readable and efficiently organized comprehensive annual financial report. This report must satisfy both generally accepted accounting principles and applicable legal requirements.
A Certificate of Achievement is valid for a period of one year only. We believe that our current comprehensive annual financial report continues to meet the Certificate of Achievement Program’s requirements and we are submitting it to the GFOA to determine its eligibility for another certificate.
Page 14

ACKNOWLEDGEMENTS
The preparation of this report was made possible by the dedicated service of the Finance Department staff, especially Leslie Blaisdell, Deputy Finance Director and Stacy Lewis, Finance Operations Manager.
In addition, staff in all City departments and outside agencies should be recognized for responding so positively to requests for the detailed information that accompanies each annual audit. The role of the State Auditor’s Office should also be acknowledged for their significant contribution to this report.
Finally, we wish to express our appreciation to the Mayor and City Council for their ongoing support and for providing their encouragement, interest, and assistance in conducting the financial operations of the City in a sound and progressive manner.
Respectively submitted,
Stephen P. Sugg, P.E. Eric FaisonCity Manager Executive Director/Finance and Admin. Services
Page 15

Page 16

CITY OF UNIVERSITY PLACEELECTED & APPOINTED OFFICIALSDecember 31, 2015
ELECTED OFFICIALS
Denise McCluskey MayorJavier Figueroa Mayor Pro TemCaroline Belleci CouncilmemberKen Grassi CouncilmemberKent Keel CouncilmemberChris Nye CouncilmemberSteve Worthington Councilmember
APPOINTED OFFICIALS
City Manager Stephen P. SuggExecutive Director/Communications & Economic Development Mariza CraigExecutive Director/Finance and Administration Eric Faison City Attorney Steve Victor City Engineer Jack EcklundParks/Public Works Director Gary CooperPolice Chief Mike BlairDevelopment Services Director David Swindale
Page 17

ORGANIZATIONAL STRUCTURECity of University Place
Finance & Administrative
ServicesFinance, City Clerk,
Reception, UPTV, IT
Citizen Advisory Board &
CommissionsPlanning, Parks &
Recreation, COPS, and Economic Development
City ManagerCity Administration
Policy AnalysisRegional Initiatives &
Partnerships
City CouncilCity Legislation
Policy Development
City AttorneyLegal Services
EngineeringEngineering Services
Capital Projects
Citizens ofUniversity Place
Community & Economic
DevelopmentEconomic
Development
Development Services
Permits, Planning, Building
Human ResourcesEmployment, Benefits & Compensation, Labor
Relations
Public Works, Parks & Recreation
Public Works, Parks Maint, Recreation,
Property Management
Police/Public SafetyPolice, Crime Prevention, Jail, Court, EOC, Animal
Control,Code Enforcement
Page 18


This page intentionally left blank

FINANCIAL SECTION
Independent Auditor’s ReportManagement’s Discussion and Analysis
Basic Financial StatementsRequired Supplemental Information
Combining & Individual Fund Statements and SchedulesSupplemental Information

Homestead Park Playground
Completed in 2015
Cirque Dr. SafeRoutes to Schools
Completed in 2015

INDEPE1'(17�$8',725¶6�5(32RT ON FINANCIAL STATEMENTS
June 14, 2016
City CouncilCity of University PlaceUniversity Place, Washington
REPORT ON THE FINANCIAL STATEMENTS
We have audited the accompanying financial statements of the governmental activities, the business-type activities, each major fund and the aggregate remaining fund information of the City of University Place, Pierce County, Washington, as of and for the year ended December 31, 2015, and the related notes to the ILQDQFLDO�VWDWHPHQWV��ZKLFK�FROOHFWLYHO\�FRPSULVH�WKH�&LW\¶V�EDVLF�ILQDQFLDO�VWDWHPHQWV�DV�OLVWHG�LQ�WKH�WDEOH�of contents.
0DQDJHPHQW¶V�5HVSRQVLELOLW\�IRU�WKH�)LQDQFLal Statements
Management is responsible for the preparation and fair presentation of these financial statements in accordance with accounting principles generally accepted in the United States of America; this includes the design, implementation, and maintenance of internal control relevant to the preparation and fair presentation of financial statements that are free from material misstatement, whether due to fraud or error.
$XGLWRU¶V�5HVSRQVLELOLW\
Our responsibility is to express opinions on these financial statements based on our audit. We conducted our audit in accordance with auditing standards generally accepted in the United States of America and the standards applicable to financial audits contained in Government Auditing Standards, issued by the Comptroller General of the United States. Those standards require that we plan and perform the audit to obtain reasonable assurance about whether the financial statements are free from material misstatement.
An audit involves performing procedures to obtain audit evidence about the amounts and disclosures in the ILQDQFLDO�VWDWHPHQWV���7KH�SURFHGXUHV�VHOHFWHG�GHSHQG�RQ�WKH�DXGLWRU¶V�MXGJPHQW��LQFOXGLQJ�WKH�DVVHVVPHQW�of the risks of material misstatement of the financial statements, whether due to fraud or error. In making those risk assessments, the auditor considers internal control relevant to the &LW\¶Vpreparation and fair presentation of the financial statements in order to design audit procedures that are appropriate in the circumstances, but not for the purpose of expressing an opinion on the effectiveness of the &LW\¶Vinternal control. Accordingly, we express no such opinion. An audit also includes evaluating the appropriateness of accounting policies used and the reasonableness of significant accounting estimates made by management, as well as evaluating the overall presentation of the financial statements.
Washington State Auditor¶V�2IILFH
Page 22

We believe that the audit evidence we have obtained is sufficient and appropriate to provide a basis for our audit opinions.
OpinionIn our opinion, the financial statements referred to above present fairly, in all material respects, the respective financial position of the governmental activities, the business-type activities, each major fund and the aggregate remaining fund information of the City of University Place, Pierce County, Washington, as of December 31, 2015, and the respective changes in financial position and, where applicable, cash flows thereof for the year then ended in accordance with accounting principles generally accepted in the United States of America.
Matters of Emphasis
As described in Note 1, during the year ended December 31, 2015, the City has implemented the Governmental Accounting Standards Board Statement No. 68, Accounting and Financial Reporting for Pensions ± an amendment of GASB Statement No. 27. Our opinion is not modified with respect to this matter.
Other Matters
Required Supplementary Information
$FFRXQWLQJ�SULQFLSOHV�JHQHUDOO\�DFFHSWHG�LQ�WKH�8QLWHG�6WDWHV�RI�$PHULFD�UHTXLUH�WKDW�WKH�PDQDJHPHQW¶V�discussion and analysis on pages 23 through 30, budgetary comparison information on pages 67 through 68 and pension plan information on pages 69 through 72 be presented to supplement the basic financial statements. Such information, although not a part of the basic financial statements, is required by the Governmental Accounting Standards Board who considers it to be an essential part of financial reportingfor placing the basic financial statements in an appropriate operational, economic or historical context. We have applied certain limited procedures to the required supplementary information in accordance with auditing standards generally accepted in the United States of America, which consisted of inquiries of management about the methods of preparing the information and comparing the information for consistency ZLWK�PDQDJHPHQW¶V� UHVSRQVHV�WR� RXU� LQTXLULHV�� WKH� EDVLF� ILQDQFLDO� VWDWHPHQWV�� DQG� RWKHU�NQRZOedge we obtained during our audit of the basic financial statements. We do not express an opinion or provide any assurance on the information because the limited procedures do not provide us with sufficient evidence to express an opinion or provide any assurance.
Supplementary and Other Information
Our audit was conducted for the purpose of forming opinions on the financial statements that collectively FRPSULVH� WKH� &LW\¶V� EDVLF� ILQDQFLDO� VWDWHPHQWV�� � 7KH� DFFRPSDQ\LQJ� LQIRUPDWLRQ� OLVWHG� DV� FRPELQLQJ�financial statements and supplementary information on pages 75 through 103 is presented for purposes of additional analysis and is not a required part of the basic financial statements. Such information is the responsibility of management and was derived from and relates directly to the underlying accounting and other records used to prepare the financial statements. This information has been subjected to auditing procedures applied in the audit of the basic financial statements and certain additional procedures, including comparing and reconciling such information directly to the underlying accounting and other records used to prepare the financial statements or to the financial statements themselves, and other additional procedures
Page 23

in accordance with auditing standards generally accepted in the United States of America. In our opinion, the information is fairly stated, in all material respects, in relation to the basic financial statements taken as a whole.
The information identified in the table of contents as the Introductory and Statistical Sections is presented for purposes of additional analysis and is not a required part of the basic financial statements of the City. Such information has not been subjected to the auditing procedures applied in the audit of the basic financial statements and, accordingly, we do not express an opinion or provide any assurance on it.
OTHER REPORTING REQUIRED BY GOVERNMENT AUDITING STANDARDS
In accordance with Government Auditing Standards, we will also issue our report dated June 14, 2016 on RXU�FRQVLGHUDWLRQ�RI�WKH�&LW\¶V�LQWHUQDO�FRQWURO�RYHU�ILQDQFLDO�UHSRUWLQJ�DQG�RQ�RXU�WHVWV�RI�LWV�FRPSOLDQFH�with certain provisions of laws, regulations, contracts and grant agreements and other matters. That report ZLOO�EH� LVVXHG�XQGHU�VHSDUDWH�FRYHU�LQ�WKH�&LW\¶V�6LQJOH�$XGLW�5HSRUW�� �7KH�SXUSRVH�RI� WKDW�UHSRUW� LV� WR�describe the scope of our testing of internal control over financial reporting and compliance and the results of that testing, and not to provide an opinion on internal control over financial reporting or on compliance. That report is an integral part of an audit performed in accordance with Government Auditing Standards in FRQVLGHULQJ�WKH�&LW\¶V�LQWHUQDO�FRQWURO�RYHU�ILQDQFLDO�UHSRUWLQg and compliance.
Sincerely,
TROY KELLEY
STATE AUDITOR
OLYMPIA, WA
Page 24

City of University PlaceManagement's Discussion and Analysis
The management of the City of University Place offers readers of its financial statements this narrative overview and analysisof the financial activities of the City for the fiscal year ended December 31, 2015. The intent of this discussion and analysis isto look at the City’s financial performance as a whole. It is designed to assist the reader in focusing on significant financialissues, provide an overview of the City’s financial activity, identify changes in the City’s financial positions, and identify fundissues or concerns. Since the Management Discussion and Analysis (MD&A) is designed to focus on the report year’sactivities, resulting changes, and currently known facts. We encourage readers to consider the information presented here inconjunction with the additional information furnished in the Letter of Transmittal in the introductory section and the FinancialStatements that follow.
Financial Information
The City’s government-wide financial statements have been prepared on the full-accrual basis of accounting in conformitywith generally accepted accounting principles (GAAP). The City’s fund financial statements for governmental funds (General,Special Revenue, Debt Service, and Capital Projects) have been prepared on the modified accrual basis of accounting inconformity with GAAP. The City’s proprietary funds (Internal Service) are accounted for on the accrual basis. A detaileddiscussion on government-wide and fund financial statements is provided later in this report.
Financial Highlights
Net Position - The assets of the City of University Place exceeded its liabilities at the close of the most recent fiscal year by$67,538,905. Of this amount, $13,702,560 may be used to meet the government’s ongoing obligations to citizens andcreditors.
Change in Net Position – The City’s total net position increased by $6,365,860. The continued economic recovery hasbrought growth in construction and higher assessed property values, both of which result in an increase in revenues. The Cityalso benefited from $223,364 in additional admissions tax revenues and $193,918 in sales tax revenue generated by the 2015US Open golf tournment. Additionally, University Place has been the recipient of capital construction grants which haveoffset a significant amount of the cost of construction for various projects.
As of the close of the current fiscal year, the City’s governmental funds reported combined ending fund balances of$14,047,437, an increase of $2,287,053 in comparison with the prior year. Of this amount, $6,253,110 is available forspending at the government’s discretion (unassigned fund balance) and $4,421,475 is restricted by legislation to specificpurposes. The committed classification is established by Council ordinance for specific uses. There were no committed fundbalances at the end of the 2015 fiscal year. Assigned classifications total $3,372,850. Committed, assigned and unassignedmonies have been designated by management to address budget amendments, equipment replacement, street improvements,facility repairs, and property acquisitions. These monies assist to minimize future debt and are intended to provide a cushionagainst significant downturns in revenue and to maintain sufficient working capital and cash flow to meet daily financialneeds.
From the Statement of Revenues, Expenditures and Changes in Fund Balances-Governmental Funds, revenues, receivedprimarily from property, sales, utility and general taxes, were used to support the major activities of the City government:
General Government – Administration, Finance, Human Resources, City Clerk, Community Information andOutreach, and Court Services;
Public Safety – Police, Jail, Crime Prevention, Emergency Operations and Animal Control;
Economic Environment – Planning, Development Services, Code Enforcement, and Economic Development;
Transportation – Public Works, Streets, and Surface Water Management;
Physical Environment – Building Maintenance and Property Management
Overview of the Financial Statements
This discussion and analysis is intended to serve as an introduction to the City of University Place basic financial statements.The statements are comprised of three components: 1) government-wide financial statements, 2) fund financial statements,and 3) notes to the financial statements. The report also contains other supplementary information in addition to the basicfinancial statements. The financial statement’s focus is on both the City as a whole (government-wide) and on the major
Page 25

individual funds. Both perspectives allow the user to address relevant questions, broaden a basis for annual comparisons orcomparability with other governments, and enhances the City’s accountability.
GOVERNMENT-WIDE FINANCIAL STATEMENTS
The government-wide financial statements are designed to provide readers with a broad overview of the finances in a mannersimilar to a private-sector business.
The Statement of Net Position presents information on all of the City of University Place assets and liabilities, and deferredinflows/outflows of resources with the difference between the four reported as net position. Over time, increases or decreasesin net position may serve as a useful indicator of whether the financial position of the City of University Place is improving ordeteriorating. The focus of the Statement of Net Position is designed to be similar to a bottom line for the City and itsgovernmental and business-type activities. This statement combines and consolidates governmental fund’s current financialresources (short-term spendable resources) with capital assets and long-term obligations.
The Statement of Activities presents information showing how the City’s net position changed during the most recent fiscalyear. All changes in net position are reported as soon as the underlying event giving rise to the change occurs, regardless ofthe timing of related cash flows. Thus, revenues and expenses are reported in this statement for some items that will onlyresult in cash flows in future fiscal periods (e.g. uncollected taxes and earned but unused vacation leave). This is intended tosummarize and simplify the user’s analysis of costs of various governmental services and/or subsidy to various business-typeactivities. The Governmental Activities reflects the City of University Place’s basic functions: General Government; PublicSafety; Physical Environment; Transportation; Economic Environment; and Culture and Recreation. Property, sales, andutility taxes finance the majority of these functions.
The government-wide financial statements include not only the City of University Place itself (known as the primarygovernment), but also legally separate Local Revitalization Financing (LRF) and University Place Transportation BenefitDistrict (UPTBD) blended component units. Financial information for these component units is reported as part of thefinancial information presented for the primary government itself. Additional information about the LRF and UPTBDcomponent units can be found in the Notes to Financial Statements.
FUND FINANCIAL STATEMENTS
Traditional users of governmental financial statements will find the fund financial statements presentation more familiar. Afund is a group of related accounts that is used to maintain control over resources that have been segregated for specificactivities or objectives. The City of University Place, like other state and local governments, uses fund accounting to ensureand demonstrate compliance with finance-related legal requirements. All of the funds of the City can be divided into twocategories: governmental funds and proprietary funds. The focus is on Major Funds, rather than types. A Major Fund isdefined in the following manner:
Total assets, liabilities, revenues, or expenditures/expenses of that individual governmental or enterprise fund are atleast ten percent (10%) of the corresponding total (assets, liabilities, etc.) for all funds of that category or type (thatis, total governmental or total enterprise funds); and
Total assets, liabilities, revenues, or expenditures/expenses of the individual government fund or enterprise fund areat least five percent (5%) of the corresponding total for all governmental and enterprise funds combined; or
Any other governmental or enterprise fund the government’s officials believe is particularly important to financialstatement users.
Governmental Funds are used to account for essentially the same functions reported as governmental activities in thegovernment-wide financial statements. However, unlike the government-wide financial statements, governmental fundfinancial statements focus on near-term inflows and outflows of spendable resources, as well as on balances of spendableresources available at the end of the fiscal year. The flow and availability of liquid resources is a clear and appropriate focusof any analysis of government. Such information may be useful in evaluating a government’s near-term financialrequirements.
Because the focus of governmental funds is narrower than that of the government-wide financial statements, it is useful tocompare the information presented for governmental funds with similar information presented for governmental activities inthe government-wide financial statements. By doing so, readers may better understand the long-term impact of the City’s nearterm financial decisions. Both the governmental fund balance sheet and governmental fund statement of revenues,expenditures, and change in fund balances provide a reconciliation to facilitate this comparison between governmental fundsand governmental activities.
Funds are established for various purposes and the Fund Financial Statement allows for the demonstration of sources and usesPage 26

and/or budgeting compliance associated therewith. These statements begin in the required supplemental information section.The maintains twelve individual governmental funds. Information is presented separately in the governmental fund balancesheet and in the governmental fund statement of revenues, expenditures, and changes in fund balances for the General Fund,Public Works Capital Improvement Fund, LRF Fund and Debt Service Fund. All of these funds are considered to be majorfunds. Data from the other non-major governmental funds are combined into a single aggregated presentation. Individual funddata for each of the non-major governmental funds is provided in the form of combining statements in the othersupplementary information described below.
The City of University Place adopts a biennial appropriated budget for its general fund. A budgetary comparison statementhas been provided for the general fund to demonstrate compliance with this budget.
Proprietary Funds maintained by the City include an enterprise fund and three internal service funds. The enterprise fund isused to report the same functions presented as business-type activities in the government-wide financial statements. The Cityof University Place uses an enterprise fund to account for its Storm Water Management. Internal service funds are used toaccumulate and allocate costs internally among the City’s various functions. The City uses internal service funds to accountfor its fleet of vehicles and equipment, information and technology systems, and risk management activities. Because theseservices benefit governmental functions they have been included within governmental activities in the government-widefinancial statements.
The Notes to the Basic Financial Statements provide additional information that is essential to a full understanding of theinformation provided in the government-wide and fund financial statements.
Required Supplementary Information includes financial information and disclosures that are required by the GovernmentalAccounting Standards Board (GASB) but are not considered a part of the basic financial statements. Budgetary comparisonschedules for certain major governmental funds are presented immediately following the notes to the basic financialstatements.
Other Supplementary Information includes the combining statements for the non-major capital projects funds andbudgetary comparison schedules for non-major capital projects funds and sub funds. These are presented immediatelyfollowing the required supplementary information.
Government-wide Financial Analysis
The City has prepared the financial statements in accordance with Generally Accepted Accounting Principles (GAAP). TheCity’s Proprietary Funds include all Internal Service Funds and an Enterprise Fund which are included in the governmentalactivities and business-type activities for the entity-wide statements. The following table reflects a Summary of Net Positionfor the fiscal year 2015 with comparative totals for 2014.
Page 27

Table 1Statement of Net Position
Governmental Activities Business-type Activities Total Primary Government2015 2014 2015 2014 2015 2014
AssetsCurrent and other assets $ 15,718,606 $ 14,002,595 $ 4,935,469 $ 4,972,444 $ 20,654,075 $ 18,975,039Capital assets 102,528,864 100,005,400 - - 102,528,864 100,005,400Deferred outflows of resources 356,015 - 51,131 - 407,146 -
Total assets and deferred outflows of resources 118,603,485 114,007,995 4,986,600 4,972,444 123,590,085 118,980,439
LiabilitiesOther liabilities 1,704,830 2,154,701 18,120 27,702 1,722,950 2,182,403Non-current liabilities 53,015,885 51,716,184 797,402 458,030 53,813,287 52,174,214Deferred inflows of resources 450,275 - 64,668 - 514,943 -
Total liabilities and deferred inflows of resources 55,170,990 53,870,885 880,190 485,732 56,051,180 54,356,617
Net positionNet investment in capital assets 53,836,345 50,158,131 - - 53,836,345 50,158,131Restricted for
Debt service - 875,636 - 411,283 - 1,286,919Local revitalization area construction 1,570,408 892,390 - - 1,570,408 892,390Surface and storm water management - - 4,106,410 4,075,429 4,106,410 4,075,429Capital facilities plan financing 960,329 515,614 - - 960,329 515,614Traffic impact-roadway improvements 554,482 1,210,993 - - 554,482 1,210,993Parks capital improvement 712,394 449,292 - - 712,394 449,292Other - 264,068 - - - 264,068
Unrestricted 5,798,537 5,770,986 - - 5,798,537 5,770,986Total net position $ 63,432,495 $ 60,137,110 $ 4,106,410 $ 4,486,712 $ 67,538,905 $ 64,623,822
There are five basic (normal) transactions that will affect the comparability of the Statement of Net Position summarypresentation.
Net Result of Activities – which will impact (increase/decrease) current assets and unrestricted net position.
Borrowing for Capital – which will increase current assets and long-term debt.
Spending Borrowed Proceeds on New Capital – which will reduce current assets and increase capital assets. Thereis a second impact, which is an increase in related net debt that will not change the net investment in capital assets.
Principal Payment on Debt – which will reduce current assets and reduce long-term debt, and will reduceunrestricted net position and increase net investment in capital assets.
Reduction of Capital Assets through Depreciation – which will reduce capital assets and net investment in capitalassets.
As noted earlier, net position may serve over time as a useful indicator of a government’s financial position. In the case of theCity of University Place, assets and deferred outflows exceeded liabilities and deferred inflows by $67,538,905 at the close ofthe most recent fiscal year.
By far the largest portion of the City of University Place net position (79.71 percent) reflects its investment in capital assets(e.g. land, buildings, machinery, and equipment) less any related debt used to acquire those assets that is still outstanding. TheCity uses these capital assets to provide services to citizens; consequently, these assets are not available for future spending.Although the City investment in its capital assets is reported net of related debt, it should be noted that the resources needed torepay this debt must be provided from other sources, since the capital assets themselves cannot be used to liquidate theseliabilities.
The remaining balance of $13,702,560 may be used to meet the City’s ongoing obligations to citizens and creditors.
As previously reported, City of University Place net position increased by $6,365,860.
City revenues are tracking as forecasted and the City is meeting, and will continue to meet, all operational and debtobligations according to the adopted budget. In December of 2014 Standard & Poor’s Ratings Services raised its long-termrating on the City of University Place’s outstanding general obligation (GO) bonds to AA-/ Outlook Stable from A+/OutlookStable.
Page 28

Table 2Changes in Net Position
Governmental Activities Business-type Activities Total Primary Government2015 2014 2015 2014 2015 2014
RevenuesProgram revenuesCharges for services $ 2,253,746 $ 5,156,443 2,770,459 2,747,343 $ 5,024,205 $ 7,903,786Operating grants and contributions 1,188,004 316,874 11,133 23,510 1,199,137 340,384Capital grants and contributions 3,308,256 3,559,535 - - 3,308,256 3,559,535General revenue
TaxesReal and personal property 4,125,973 4,063,189 - - 4,125,973 4,063,189Sales 4,661,338 4,123,518 - - 4,661,338 4,123,518Utility 2,323,109 1,287,561 - - 2,323,109 1,287,561Excise 428,404 2,357,963 - - 428,404 2,357,963Other 2,616,995 1,624,610 - - 2,616,995 1,624,610
Investment earnings 42,489 27,445 - - 42,489 27,445Licenses and permits 2,881,674 - - - 2,881,674 -Fines and penalties 23,519 - - - 23,519 -Miscellaneous revenues 253,239 100,615 - - 253,239 100,615Proceeds from sale of capital assets 135,529 122,791 - - 135,529 122,791
Total general revenue 24,242,275 22,740,544 2,781,592 2,770,853 27,023,867 25,511,397
ExpensesGeneral government 5,341,577 4,823,886 - - 5,341,577 4,823,886Public safety 4,313,235 3,772,857 - - 4,313,235 3,772,857Utilities - 229 - - - 229Transportation 4,185,572 4,475,924 - - 4,185,572 4,475,924Natural and economic environment 1,359,236 19,861 - - 1,359,236 19,861Health and human services 104,130 1,577,764 - - 104,130 1,577,764Culture and recreation 1,304,953 1,162,238 - - 1,304,953 1,162,238Interest on long-term debt 2,694,094 2,566,304 - - 2,694,094 2,566,304Water - - 1,355,210 1,497,100 1,355,210 1,497,100
Total expenses 19,302,797 18,399,063 1,355,210 1,497,100 20,658,007 19,896,163Excess (deficiency) before contributions, special items, and transfers 4,939,478 4,341,481 1,426,382 1,273,753 6,365,860 5,615,234
Transfers 1,367,936 669,985 (1,367,936) (669,985) - -Insurance recoveries 27,768 - - - - -Special item - sale of land - (2,736,739) - - - -
Change in net position 6,335,182 2,274,727 58,446 603,768 6,365,860 5,615,234Beginning net position 60,137,110 57,862,383 4,486,712 3,882,944 64,623,822 61,745,327
Prior period adjustments & change in accounting principleChange in accounting principal GASB 68 (226,878) - (438,748) - (665,626) -Change in accounting principle GASB 68 (2,828,098) - - - (2,828,098) -Prior period adjustment 20,493 - - - 20,493 -Prior Period Adjustments (5,314) - - - (5,314) -Total Prior period adjustments & change in accounting principle (3,039,797) - (438,748) - (3,478,545) -Beginning net postion restated 57,097,313 57,862,383 4,047,964 3,882,944 61,145,277 61,745,327End of net position $63,432,495 $60,137,110 $ 4,106,410 $ 4,486,712 $67,511,137 $67,360,561
Page 29

Page 30

Financial Analysis of the City's Funds
Governmental funds. The focus of the governmental funds is to provide information on near-term inflows, outflows, andbalances of spendable resources. Such information is useful in assessing the City of University Place’s financingrequirements. In particular, fund balance may serve as a useful measure of a government’s net resources available forspending at the end of the fiscal year.
Fund balances of governmental funds are classified according to five specifically defined categories. In order from mostrestrictive to least restrictive, these categories are Nonspendable, Restricted, Committed, Assigned and Unassigned. Theclassifications reflect the extent to which a government is bound to observe constraints imposed upon the use of the resourcesreported in governmental funds. At the end of the fiscal year, the City of University Place governmental funds reportedcombined ending fund balances of $14,047,435. This represents an increase of $2,220,516 from 2014. This increase was dueprimarily to an increase in taxes and license and permit revenues.
The General Fund is the chief operating fund of the City. At the end of 2015, the fund balance of the general fund was$8,494,225, an increase of $1,843,316 from 2014. This change in fund balance is the result, primarily of increased tax, licenseand permit revenues.
The General Fund had a significant increase in taxes of $785,643 over the adopted budget due to an increase in sales taxcollected from construction projects during the revitalization of the town center district as well as US Open relatedconstruction.
The decrease of $218,111 in the LRF fund balance from 2014 is due to principle and interest debt payments of $397,913 andtransfers of $345,136 to reimburse the Public Works Capital Improvement Fund for LRF related capital project expenditures.
Proprietary funds. As previously noted, the City’s proprietary funds are comprised of three internal service funds and oneenterprise fund. The increase in the Surface Water Management (SWM) Fund balance is due primarily to fees collected thatexceeded expenditures.
Budgetary Information
While the City utilizes a two-year or biennial budget, each fiscal year is considered on its own merits for financial purposes.The 2015 budget is the first year of the current biennial budget cycle.
During 2015 the City anticipated sale of one of the town center properties which has been delayed until 2016 causing avariance between actual and final budget of proceeds from sale of assets of $1,013,235 also effecting transfers out by the offsetting amount due to the funds not being available.
Capital Asset and Debt Administration
Capital assets. The City of University Place investment in capital assets for its governmental activities as of December 31,2015 amounts to $260,922,457 (net of accumulated depreciation), which is an increase of $160,916,912 from 2014. Thisinvestment in capital assets includes land, buildings, machinery, equipment and software, infrastructure and construction inprogress. The following table summarizes capital assets for the current fiscal year and a comparison with fiscal year 2014.
Table 3Capital Assets at Year-End
(Net of Depreciation)
2015 TotalGovernmental
Activities
2014 TotalGovernmental
ActivitiesLand $ 26,789,357 $ 26,789,357Easement 1,976,875 1,702,904Buildings & improvements 37,895,158 30,404,529Equipment 3,418,798 815,217Infrastructure 182,525,926 30,711,638Construction in progress 8,316,343 9,581,900
Total $ 260,922,457 $ 100,005,545
Additional information on the City's capital assets can be found in Note IV of the Notes to the Financial Statements.
Page 31

Long-term debt. At the end of the fiscal year, the City of University Place had total long-term debt outstanding of$50,473,998 which includes revenue bonds with an outstanding principal balance of $5,345,000. The City has three types ofoutstanding debt: general obligation bonds, public works trust fund loans, and compensated absences. The outstandingrevenue bonds are related to the State Local Revitalization Financing projects for which a separate Authority was established.The City has no liability for these bonds. Bond holders look solely to the finances of the Authority for repayment. Furtherinformation regarding the Authority is disclosed in the Notes to the Financial Statements.
The following table summarizes long-term debt for the current fiscal year and a comparison with fiscal year 2014.Table 4
Outstanding Debt at Year-End
2015 2014
GovernmentalGeneral obligation bonds $ 43,355,000 $ 44,645,000Revenue bonds payable 5,345,000 5,495,000Public works trust fund loan 964,334 1,155,599Compensated absences 431,615 420,587
Total $ 50,095,949 $ 51,716,186
Business-type ActivitiesPublic works trust fund loan $ 330,077 $ 411,283Compensated absences 47,972 46,747
Total $ 378,049 $ 458,030
Washington State law provides a maximum debt limit for general obligations. A city may incur debt equal to 1.5% of theCity’s assessed value without a vote of the people and debt for general government equal to 2.5% of the assessed value with avote of the people. An additional 2.5% of assessed value may be incurred to finance water, sewer, and parks projects, alsowith a vote of the people. Based on the assessed value of property in University Place, the City’s outstanding debt, subject tothe State of Washington constitutional limits, was below capacity on December 31, 2015 and the City may issue non-voteddebt at this time.
Note IV of the Basic Financial Statements identifies the City’s long-term debt and provides additional detail regarding theCity’s outstanding debt.
Economic Factors and the Next Year's Budgets and Rates
The State of Washington, by constitution, does not have a state personal income tax and therefore the state operates primarilyusing property, sales, business and occupation, and gasoline taxes. Local governments (cities, counties, school districts)primarily rely on property and a limited array of other taxes (sales, utility, admission, and business and occupation) and fees(franchise, licenses, development services, etc.) for their governmental activities. There are a limited number of state-sharedrevenues (i.e., gas taxes, liquor excise taxes, liquor profits taxes, etc.) and recurring and non-recurring grants from both thestate and federal government.
For the business-type and certain governmental activities (permitting, recreation programs, etc.) the user pays a related fee orcharge associated therewith.
The level of taxes, fees and charges for services (including development related mitigation fees) will have a bearing on thespecific City’s competitive ability to encourage retail, office, residential, and industrial development to locate in theirjurisdiction. The City places significant emphasis on encouraging economic development.
In November 2015 City Council approved a measure to eliminate the City's recreation program beginning in 2017. This willsave the City's General Fund approximately $400,000 a year.
City Council took action in 2015 to make reductions in the Police/Public Safety Fund by eliminating two positions to create asustainable Public Safety budget.
Requests for Information
This financial report is designed to provide a general overview of the City of University Place’s financial condition. Questionsconcerning any of the information provided in this report or requests for additional financial information should be addressedto the City of University Place Finance Department, 3715 Bridgeport Way West, Suite B-1, University Place, WA 98466,telephone 253-566-5656, or visit the City’s website at www.cityofup.com.
Page 32

City of University PlaceStatement of Net PositionAs of December 31, 2015
Primary GovernmentGovernmental
ActivitiesBusiness-Type
Activities Total
AssetsCash and cash equivalents $ 13,141,736 $ 4,948,404 $ 18,090,140Receivables - net 609,814 - 609,814Internal balances 95,506 (95,506) -Long-term receivables 720,000 - 720,000Due from other governments 1,151,550 82,571 1,234,121Capital assets
Capital assets, not being depreciated 37,082,575 - 37,082,575Capital assets, being depreciated 65,446,289 - 65,446,289
Total capital assets 102,528,864 - 102,528,864Total assets 118,247,470 4,935,469 123,182,939
Deferred outflows of resourcesDeferred outflows for employer contributions 356,015 51,131 407,146
Total deferred outflows of resources 356,015 51,131 407,146
LiabilitiesCurrent liabilites
Accounts payable 424,888 7,262 432,150Accured payroll and employee benefits 53,861 10,355 64,216Interest payable 227,932 505 228,437Retainage payable 65,695 - 65,695Unearned revenue 923,462 - 923,462Other current liabilites 8,992 - 8,992
Non-current liabilitiesDue in less than 1 year 1,620,109 97,218 1,717,327Due in more than 1 year 48,475,840 280,831 48,756,671Net pension liability 2,919,936 419,353 3,339,289
Total liabilities 54,720,715 815,524 55,536,239
Deferred inflows of resourcesDeferred inflows for employer contributions 450,275 64,668 514,943
Total deferred inflows of resources 450,275 64,668 514,943Total liabilities 55,170,990 880,192 56,051,182
Net positionNet investment in capital assets 53,836,345 - 53,836,345Restricted for
Local revitalization area construction 1,570,408 - 1,570,408Surface and storm water management - 4,106,408 4,106,408Capital facilities plan financing 960,329 - 960,329Traffic impact-roadway improvements 554,482 - 554,482Parks capital improvement 712,394 - 712,394
Unrestricted 5,798,537 - 5,798,537Total net position $ 63,432,495 $ 4,106,408 $ 67,538,903
The accompanying notes are an integral part of these financial statements.Page 33

City of University PlaceStatement of Activities
For the Year Ended December 31, 2015
Program RevenuesNet (Expenses) Revenues and
Changes in Net PositionOperating Capital Primary Government
ExpensesCharges for
ServicesGrants and
ContributionsGrants and
ContributionsGovernmental
ActivitiesBusiness-type
Activities Total
Function/Programs
Primary Government:Governmental activities:
General government $ 5,341,577 $ 486,337 $ - $ 25,000 $ (4,830,240) $ - $ (4,830,240)Public safety 4,313,235 79,377 287,738 - (3,946,120) - (3,946,120)Utilities - 432,920 - - 432,920 - 432,920Transportation 4,185,572 265,791 - 3,283,256 (636,525) - (636,525)Natural and economic
environment 1,359,236 619,785 5,333 - (734,118) - (734,118)Health and human services 104,130 - 894,933 - 790,803 - 790,803Culture and recreation 1,304,953 369,536 - - (935,417) - (935,417)Interest on long-term debt 2,694,094 - - - (2,694,094) - (2,694,094)
Total governmental activities 19,302,797 2,253,746 1,188,004 3,308,256 (12,552,791) - (12,552,791)Business-type activities:
Water management 1,355,212 2,770,459 11,133 - - 1,426,380 1,426,380
Total business-type activities 1,355,212 2,770,459 11,133 - - 1,426,380 1,426,380
Total primary government $ 20,658,009 $ 5,024,205 $ 1,199,137 $ 3,308,256 $ (12,552,791) $ 1,426,380 $ (11,126,411)
General Revenues:Taxes
Real and personal property $ 4,125,973 $ - $ 4,125,973Sales 4,661,338 - 4,661,338Utility 2,323,109 - 2,323,109Excise 428,404 - 428,404Other 2,616,995 - 2,616,995
Licenses and permits 2,881,674 - 2,881,674Fines and penalties 23,519 - 23,519Miscellaneous revenues 253,239 - 253,239Investment earnings 42,489 - 42,489Proceeds from sale of capital assets 135,529 - 135,529
Total general revenues 17,492,269 - 17,492,269Transfers 1,367,936 (1,367,936) -Insurance recoveries 27,768 - 27,768
Change in net position 6,335,182 58,444 6,393,626Net position, beginning of year 60,137,110 4,486,712 64,623,822
Change in Accounting principle GASB 68 (3,054,976) (438,748) (3,493,724)
Prior period adjustments 15,179 - 15,179
Net position, beginning of year restated 57,097,313 4,047,964 61,145,277Net position, end of year $ 63,432,495 $ 4,106,408 $ 67,538,903
The accompanying notes are an integral part of these financial statements.Page 34

City of University PlaceBalance Sheet
Governmental FundsDecember 31, 2015
General FundsPublic Works
CIP Debt Service LRF
NonmajorGovernmental
Funds
TotalGovernmental
Funds
AssetsCash and equivalents $ 8,052,316 $ 663,256 $ - $ 1,572,523 $ 2,812,439 $ 13,100,534Accounts receivables 511,068 2,515 - - 96,230 609,813Due from other government units 388,563 646,999 - - 115,987 1,151,549
Total assets $ 8,951,947 $ 1,312,770 $ - $ 1,572,523 $ 3,024,656 $ 14,861,896
Liabilities, deferred inflows and fundbalance
LiabilitiesAccounts payable $ 176,419 $ 163,901 $ - $ 2,115 $ 77,819 $ 420,254Accrued salaries and wages 41,767 2,625 - - 6,407 50,799Accrued liabilities 1,587 - - - - 1,587Retainage payable 65,695 - - - - 65,695Unearned revenue 106,995 14,509 - - 89,363 210,867
Total liabilities 392,463 181,035 - 2,115 173,589 749,202
Deferred inflows of resourcesUnavailable revenue-property taxes 65,259 - - - - 65,259
Total deferred inflows of resources 65,259 - - - - 65,259
Fund balancesRestricted
Local revitalization area constructionprojects - - - 1,570,408 - 1,570,408
Arterial street maintenance - - - - 16,519 16,519Capital facilities plan financing - - - - 960,329 960,329Traffic impact-roadway improvements - - - - 778,332 778,332Transportation improvement projects - - - - 392,213 392,213Donations - - - - 34,180 34,180Parks capital improvement - - - - 669,494 669,494
AssignedUnanticipated emergency 856,934 - - - - 856,934Public works capital improvement - 1,131,735 - - - 1,131,735Public safety 1,384,181 - - - - 1,384,181Unassigned
Unassigned 6,253,110 - - - - 6,253,110Total fund balances 8,494,225 1,131,735 - 1,570,408 2,851,067 14,047,435Total liabilities, deferred inflows
and fund balance $ 8,951,947 $ 1,312,770 $ - $ 1,572,523 $ 3,024,656 $ 14,861,896
The accompanying notes are an integral part of these financial statements.Page 35

City of University PlaceReconciliation of Governmental Fund Balances
To Net Position of Governmental ActivitiesDecember 31, 2015
Total fund balances - governmental funds $ 14,047,435
The total net position reported for governmental activities in the Statement of NetPosition are different because:
Capital assets used in governmental activities are not financial resources and therefore arenot reported in the governmental funds. (See Note IV.C)
Capital assets, not being depreciated 37,082,575Capital assets being depreciated 223,839,882Accumulated depreciation (158,393,593)
102,528,864Deferred inflows of resources are not reported in the governmental funds:
Related to pension (450,275)Related to pension for ISF - (450,275)
Internal service fund costs of certain activities, such as insurance, technology servicesand fleet operations to individual governmental funds. The assets, deferred outflows ofresources, liabilities, and deferred inflows of resources of the internal service funds areincluded in governmenntal activities in the Statement of Net Position 675,220
Deferred outflows of resources are not reported in the governmental funds:Deferred outflows for employer contributions 356,015
Other assets not available in the current period and therefore are not reported in thegovernmental funds:Internal balances 95,506Long-term receivables 720,000 -
815,506
Long-term liabilities and related accrued interest are not due and payable in thecurrent and therefore are not reported in the governmental funds:
Debt and notes payableGeneral obligation bonds (43,355,000)Revenue bonds payable (5,345,000)Public works trust fund loan (964,334)Compensated absences (431,615)Unearned revenue (923,462)Interest payable (227,932)Adjustment (307,772)Net pension liability (2,919,936) -
- (54,475,051)Deferred inflows reported in the funds are considered financial resources for governmental
activitiesUnavailable revenue-property taxes (65,259) (65,259)
Net Position of Governmental Activities $ 63,432,455
The accompanying notes are an integral part of these financial statements.Page 36

City of University PlaceStatement of Revenues, Expenditures, and Changes in Fund Balances
Governmental FundsFor the Year Ended December 31, 2015
General FundsPublic Works
CIP Debt Service LRF
NonmajorGovernmental
Funds
TotalGovernmental
Funds
RevenuesTaxes $ 10,948,525 $ - $ - $ 522,937 $ 2,305,503 $ 13,776,965Licenses and permits 2,881,674 - - - - 2,881,674Intergovernmental 597,797 4,171,188 - - - 4,768,985Charges for services 1,198,362 - - - 501,932 1,700,294Miscellaneous
Fines and forfeitures 19,701 - - - - 19,701Rental, concessions and sales 94,233 - - - 320 94,553Investment earnings 42,489 - 1 - - 42,490Contribution in aid for constructions - - - - 25,000 25,000Contributions 14,055 - - - 20,691 34,746Other revenues 7,106 88,671 - - 28,163 123,940Federal grants 10,414 - - - - 10,414State grants and entitlements - - - - 5,333 5,333
Total revenues 15,814,356 4,259,859 1 522,937 2,886,942 23,484,095
ExpendituresCurrent
General government 3,237,225 21,794 - - 41,829 3,300,848Public safety 3,923,198 - - - - 3,923,198Transportation 390,207 503,341 - - 1,253,552 2,147,100Natural and economic environment 1,251,028 108,480 - - 307 1,359,815Culture and recreation 996,154 - - - 22,039 1,018,193Health and human services 93,348 - - - - 93,348
Capital outlay - 6,138,495 - - 174,001 6,312,496Debt service
Principal retirement - - 1,481,239 150,000 - 1,631,239Interest - - 2,296,182 247,913 - 2,544,095
Total expenditures 9,891,160 6,772,110 3,777,421 397,913 1,491,728 22,330,332Excess (deficiency) of revenues over
expenditures 5,923,196 (2,512,251) (3,777,420) 125,024 1,395,214 1,153,763
Other financing sources/usesTransfers in 7,309 2,675,969 3,777,419 2,001 556,684 7,019,382Transfers out (4,120,159) - - (345,136) (1,568,565) (6,033,860)Insurance recovery - - - - 27,768 27,768Proceeds from sale of assets 120,000 - - - - 120,000
Total other financing sources/uses (3,992,850) 2,675,969 3,777,419 (343,135) (984,113) 1,133,290Net change in fund balances 1,930,346 163,718 (1) (218,111) 411,101 2,287,053Fund balances, beginning of year 6,650,909 968,017 1 1,768,026 2,439,966 11,826,919Prior period adjustments (87,030) - - 20,493 - (66,537)Fund balances, beginning of year restated 6,563,879 968,017 1 1,788,519 2,439,966 11,760,382Fund balances, end of year $ 8,494,225 $ 1,131,735 $ - $ 1,570,408 $ 2,851,067 $ 14,047,435
The accompanying notes are an integral part of these financial statements.Page 37

City of University PlaceReconciliation of The Statement of Revenue, Expenditures,
And Changes In Fund Balances of Governmental FundsTo the Statement of Activities
For the Year Ended December 31, 2015
Net changes in fund balances - total governmental funds $ 2,287,053
Amounts reported for governmental activities in the statement of activities are differentbecause:
Governmental funds report capital outlays as expenditures. However, in the statement ofactivities the cost of those assets are allocated over their estimated useful lives asdepreciation expense. Amounts related to capital assets are:Capital asset purchases capitalized 6,312,496Depreciation expense (3,808,597)Pension expense adjustment (24,330)Proceeds from sale of capital assets (15,529)Internal service fund adjustments for look back for governmental funds 7,913Expenses not recorded on fund statements recorded on government funds 27,414Internal service look back adjustment to zero out enterprise funds 9,857 -
2,509,224Expenses for compensated absences reported in the statement of activities do not require
the use of current financial resources and therefore are not reported as expenditures ingovernmental funds. 9,353
The issuance of long-term debt provides current financial resources to governmental funds,while the repayment of the principal of long-term debt consumes the current financialresources of governmental funds. Neither transaction has any effect on net position. Thisis the amount of the net effect of these differences in the treatment of long-term debt andrelated items.Principal payments on debt service costs 1,631,239Interest expense (146,557) -
- 1,484,682Deferred inflows reported in the funds are considered financial resources for governmental
activities. (20,341)
Internal service funds are used by management to charge the costs of insurance andinformation services to individual funds. The net revenue of the internal service funds isreported with the governmental activities.
Change in net position after adjustments for enterprise funds 65,211
Change in net position of governmental activities $ 6,335,182
The accompanying notes are an integral part of these financial statements.Page 38

City of University PlaceStatement of Net Position
Proprietary FundsDecember 31, 2015
Business-Type Activities - EnterpriseFunds
Major Fund
Surface WaterMgmt Total
Gov. ActivitiesInternal Service
Funds
AssetsCurrent assets
Cash and equivalents $ 4,948,404 $ 4,948,404 $ 41,202Due from other government units 82,571 82,571 -
Total current assets 5,030,975 5,030,975 41,202Noncurrent assetsCapital assets
Depreciable assets - - 1,804,685Less: accumulated depreciation - - (973,581)
Total noncurrent assets - - 831,104Total assets $ 5,030,975 $ 5,030,975 $ 872,306
Deferred outflows of resourcesDeferred outflows for pension contributions 51,131 51,131 19,263
Total deferred outflows of resources 51,131 51,131 19,263
LiabilitiesCurrent liabilities
Accounts payable 7,080 7,080 4,634Accrued salaries and wages 10,355 10,355 3,062Accrued liabilities 182 182 -Accrued interest payable 505 505 -Compensated absences 15,990 15,990 -Current-bonds, notes, and loans payable 81,228 81,228 -
Total current liabilities 115,340 115,340 7,696Noncurrent Liabilities
Compensated absences 31,982 31,982 26,298Bonds, notes, and loans payable 248,849 248,849 -Net pension liability 419,353 419,353 157,991
Total noncurrent liabilities 700,184 700,184 184,289Total liabilities 815,524 815,524 191,985
Deferred inflows of resourcesDeferred inflows for employer contributions 64,668 64,668 24,364
Total deferred inflows of resources 64,668 64,668 24,364
Net positionInvested in capital assets - - 675,220Restricted net position 330,077 330,077 -Unrestricted net position 3,871,837 3,871,837 -
Total net position $ 4,201,914 4,201,914 $ 675,220
Reconciliation to government-wide statement of net position:Adjustment to report the cumulative internal balance for the net effect of the activity
between the internal service funds and the enterprise funds over time. (95,506)Net position of business-type activities $ 4,106,408
The accompanying notes are an integral part of these financial statements.Page 39

City of University PlaceStatement of Revenues, Expenses, and Changes in Fund Net Position
Proprietary FundsDecember 31, 2015
Business-Type Activities - EnterpriseFunds
Major Fund
Surface WaterMgmt Total
Gov. ActivitiesInternal Service
Funds
Operating Revenues:Charges for services $ 2,770,459 $ 2,770,459 $ 618,664Intergovernmental - - (99)
Total operating revenues 2,770,459 2,770,459 618,565
Operating Expenses:Salaries and employee benefits 679,001 679,001 240,188Materials and supplies 57,530 57,530 110,698Services and charges 607,321 607,321 297,669Insurance claims and expenses 18,533 18,533 122,499Depreciation and amortization - - 155,067
Total operating expenses 1,362,385 1,362,385 926,121Operating income (loss) 1,408,074 1,408,074 (307,556)
Nonoperating revenue (expenses):Interest (3,443) (3,443) -Insurance recovery - - 15,529State grants and entitlements 11,133 11,133 -
Total nonoperating revenue (expenses) 7,690 7,690 15,529Income (loss) before transfers 1,415,764 1,415,764 (292,027)
Transfers in - - 382,415Transfers out (1,367,936) (1,367,936) -Change in net position 47,828 47,828 90,388Net position, beginning of year 4,592,834 772,662Change in accounting principle GASB 68 (438,748) - (165,297)Prior period adjustment - - (22,532)Net position, beginning of year restated 4,154,086 - 584,833Net position, end of year $ 4,201,914 $ - $ 675,221
Reconciliation to government-wide statement of net position:Adjustment for the net effect of the current year activity between the internal service
funds and the enterprise funds. 10,616Change in net assets of business-type activities $ 58,444
The accompanying notes are an integral part of these financial statements.Page 40

City of University PlaceStatement of Cash Flows
Proprietary FundsDecember 31, 2015
Business-Type Activities -Enterprise Funds
Major Fund
Surface WaterMgmt Total
Gov. ActivitiesInternal Service
Funds
Cash flows from operating activities:Cash receipts from customers $ 2,770,460 $ 2,770,460 $ 618,663Cash paid to employees for services (478,336) (478,336) (176,886)Cash paid to suppliers for goods and services (673,703) (673,703) (421,593)Cash paid for employee benefits (205,949) (205,949) (58,834)Cash paid for Insurance (18,533) (18,533) (122,499)
Net cash provided (used)by operating activities 1,393,939 1,393,939 (161,149)
Cash flows from noncapital financing activites:Cash receipts from grants and contributions 34,587 34,587 -Cash receipts from transfers from other funds (1,367,936) (1,367,936) 382,415
Net cash provided (used) by noncapital financing activities (1,333,349) (1,333,349) 382,415
Cash flows from capital and related financing activities:Proceeds/(loss) from retirement of assets - - 15,529Payments for capital acquisition - - (236,978)Debt principal payments (81,206) (81,206) -Interest paid on debt (3,521) (3,521) -
Net cash (used) by capital and related financing activities (84,727) (84,727) (221,449)Net increase (decrease) in cash and cash equivalents (24,137) (24,137) (183)Cash and cash equivalents, beginning of year 4,972,541 4,972,541 41,385Cash and cash equivalents, end of year 4,948,404 4,948,404 41,202
Reconciliation of operating income (loss)to net cash provided (used) by operating activities:
Operating Income (Loss) 1,408,074 1,408,074 (307,556)Adjustments to reconcile operating income to net cash provided (used)
by operating activities:Depreciation - - 155,067Changes in assets and liabilities:
Increase (decrease) in accounts payable (8,850) (8,850) (13,130)Increase (decrease) in accrued salaries and wages - - 326Increase (decrease) in accrued liabilities (652) (652) -Increase (decrease) in compensated absences 1,225 1,225 6,349Increase (decrease) in deferred Inflows/outflows 13,537 13,537 5,101Increase (decrease) in net pension liability (19,395) (19,395) (7,306)
Net cash provided by operating activities $ 1,393,939 $ 1,393,939 $ (161,149)
The accompanying notes are an integral part of these financial statements.Page 41

CITY OF UNIVERSITY PLACENOTES TO THE FINANCIAL STATEMENTS
NOTE I. SUMMARY OF SIGNIFICANT ACCOUNTING POLICIES
The financial statements of the City of University Place have been prepared in conformity with generally accepted accountingprinciples (GAAP) as applied to governmental units. The Governmental Accounting Standards Board (GASB) is the acceptedstandard setting body for establishing governmental accounting and financial reporting principles. The significant accountingpolicies are described below.
A. Reporting Entity
The City of University Place, Pierce County, Washington was incorporated on August 31, 1995 and operates under the lawsof the State of Washington applicable to an Optional Municipal Code City (RCW 35A) with a Council-Manager form ofgovernment. As required by the generally accepted accounting principles the financial statements present The City ofUniversity Place, the primary government, and its component units. The component units discussed below are included in theCity of University Place reporting entity because of the significance of its operational or financial relationship with the City.
Local Revitalization Financing (LRF) has been presented in the Financial Statements as a blended component unit. The LRFFund is governed by the seven-member board appointed by the City Council. Although it is legally separated from the City,the Local Revitalization Financing is reported as if it were part of the primary government because its sole purpose is tofinance and construct City infrastructure.
The University Place Transportation Benefit District (UPTBD) has been presented in the Financial Statements as a blendedcomponent unit. The current members of the City Council are the governing board of the UPTBD. Although it is legallyseparated from the City, the University Place Transportation Benefit District is reported as if it were part of the primarygovernment because its sole purpose is to finance street maintenance.
B. Implementation of New Accounting Statements
For year 2015, the City has implemented the following new statements of financial accounting standards issued by theGovernmental Accounting Standards Board.
Statement No. 68, Accounting and Financial Reporting for Pensions, an amendment of GASB Statement No. 27. GASB 68establishes standards for pension accounting and financial reporting for governments (“employers”) which sponsor pensionbenefits. Under GASB 68, the employer must report the net pension liability, pension expense and related deferred inflowsand outflows of resources associated with providing retirement benefits to their employees (and former employees) in theirbasic financial statements. In addition, extensive note disclosures and related Required Supplementary Information are alsorequired.
Statement No. 71, Pension Transition for Contributions Made Subsequent to the Measurement Date, an amendment of GASBStatement No. 68. GASB Statement 71 addresses paragraph 137 in GASB 68, Accounting and Financial Reporting forPensions, concerning transition provisions related to certain pension contributions made to defined benefit pension plans priorto implementation of that Statement by employer and nonemployer contributing entities. The requirements of the Statementapply to all state and local governments that are required to apply the provisions of Statement 68 for defined benefit pensions.
The City’s pension plan, Washington State Department of Retirement Systems, did not provide member governments withbeginning balances of deferred inflows or outflows of resources, which is permitted by GASB Statement 68. At the beginningof the initial period of GASB 68, the City removed the net pension obligation balance determined in accordance withStatement 27, as amended, from beginning net position and recorded the beginning net pension liability. Per the requirementsof Statement 71, the City recorded a beginning deferred outflow of resources for contributions made between the start of themeasurement period of the pension system and the City’s prior fiscal year-end. These two items result in an adjustment tobeginning net position of the governmental activities and the business activities in the Government-Wide Financial Statementsand the Statement of Revenues Expenses and Changes in Fund Net Position– Proprietary Funds. Retroactively applying thesechanges results in the adjustment below:
Page 42

CITY OF UNIVERSITY PLACENOTES TO THE FINANCIAL STATEMENTS
B. Implementation of New Accounting Statements
Government WideStatement of Activities
ProprietaryStatement ofRevenues,
Expenses, andChanges in Net
Position
Internal ServiceStatement of
Revenues,Expenses, andChanges in Net
Position
GovernmentalActivities
BusinessActivities
Surface WaterManagement
InformationTechnologies and
ServicesNet position as of 1/1/15 $ 60,137,110 $ 4,486,712 $ 4,592,834 $ 146,904Change in reporting for net pension liability (3,039,068) (438,642) (438,748) (165,297)Net position as restated for GASB 68 1/1/15 $ 57,098,042 $ 4,048,070 $ 4,154,086 $ (18,393)
C. Government-Wide and Fund Financial Statements
The government-wide financial statements (i.e. the statement of net position and the statement of activities) report informationon all of the activities of the primary government and its component units. For the most part, the effect of interfund activityand activity of the internal service funds has been removed from these statements. Governmental activities, which normallyare supported by taxes and intergovernmental revenues, are reported separately from business-type activities, which rely to asignificant extent on fees and charges for support.
The Statement of Activities demonstrates the degree to which the direct expenses of a given function or segment is offset byprogram revenues. Direct expenses are those that are clearly identifiable with a specific function or segment. Programrevenues include charges to customers or applicants who purchase, use, or directly benefit from goods, services, or privilegesprovided by a given function or segment and grants and contributions that are restricted to meeting the operational or capitalrequirements or a particular function or segment. Taxes and other items not properly included among program revenues arereported instead as general revenues.
Separate fund financial statements are provided for governmental funds and proprietary funds, Major individual governmentalfunds and major individual enterprise funds are reported as separate columns in the fund financial statements.
D. Measurement Focus, Basis of Accounting, and Financial Statement Presentation
The government-wide financial statements are prepared using the economic resources measurement focus and the accrualbasis of accounting, as are the proprietary fund financial statements. Revenues are recorded when earned and expenses arerecorded when a liability is incurred, regardless of the timing of related cash flows. Property taxes are recognized as revenuesin the year for which they are levied. Grants and similar items are recognized as revenue as soon as all eligibility requirementsimposed by the provider have been met.
Governmental fund financial statements are reported using the current financial resources measurement focus and themodified accrual basis of accounting. Revenues are recognized as soon as they are both measurable and available. Revenuesare considered to be available when they are collectible within the current period or soon enough thereafter to pay liabilitiesof the current period. For this purpose, the City considers revenues to be available if they are collected within 60 days of theend of the current fiscal period. The City considers property taxes as available if they are collected within 60 days after yearend. Expenditures generally are recorded when a liability is incurred, as under accrual accounting. However, debt serviceexpenditures, as well as expenditures related to compensated absences and claims and judgments, are recorded only whenpayment is due.
Property taxes, licenses, and interest associated within the current period are all considered to be susceptible to accrual and sohave been recognized as revenues of the current fiscal period. Only the portion of special assessment receivable due withinthe current fiscal period is considered to be susceptible to accrual as revenue of the current period. All other revenue items areconsidered to be measurable and available only when cash is received by the City.
During the year, the City segregates transactions related to certain City functions or activities in separate funds in order to aidfinancial management and to demonstrate legal compliance. Fund financial statements are designed to present financial
Page 43

CITY OF UNIVERSITY PLACENOTES TO THE FINANCIAL STATEMENTS
information of the City at this more detailed level. The focus of governmental and enterprise fund financial statements is onmajor funds. Each major fund is presented in a separate column. Non-major funds are aggregated and presented in a singlecolumn. Internal service funds are combined and the totals are presented in a single column on the face of the proprietary fundstatements.
The accounts of the City are organized on the basis of funds. Each fund is a separate accounting entity with a self-balancingset of accounts. The City’s resources are allocated to and accounted for in individual funds according to the purpose for whichthey are spent and how they are controlled. There are two categories of funds – governmental and proprietary. A descriptionof the fund categories is provided below.
The City reports the following major governmental funds:
General FundThe City of University Place’s General (or current expense) Fund accounts for all current financial resources notrequired by law or administrative action to be accounted for in another fund. It is the largest accounting entity in theCity and provides for most of the general government operations. The major revenue sources to the fund are generaltax revenues. Licenses and permits, charges for services, and investment interest also provide support.
Debt Service FundThe Debt Service Fund accounts for the accumulation of resources for and the payment of principal and interest forCouncil-approved general obligation bonds, letters of credit, and Public Works Trust Fund loans. The City ofUniversity Place pledges its full faith and credit for payment of these obligations.
Public Works Capital Improvement FundThe Public Works Capital Improvement Fund was established to account for receipts and disbursements related tothe acquisition, design, construction, and any other related street, traffic, or surface water management projectexpenditures. Revenues supporting this fund’s activities include bond proceeds, grant proceeds, interfund transfersand other revenue sources as may be authorized by the City Council.
LRF FundThis fund was established to account for receipt and disbursement transactions associated with local revitalizationfinancing. The City established, by ordinance, a separate Authority which is authorized to undertake a “localrevitalization financing” by using revenues received from a local option sales and use tax imposed pursuant to RCW82.14.510 to pay the principal of and interest on revenue bonds issued to finance “public improvements” within alocal revitalization area. The City has no liability for the bonds. Bond holders look solely to the finances of theAuthority for repayment. This fund is presented in the City’s financial statements as a blended component unit.
Details on the State’s Local Revitalization Financing program may be found online atwww.dor.w.gov/Content/DoingBusiness/LocalRevitalizationFinancing.aspx.
The City reports the following major enterprise fund:
Surface Water Management FundThe Surface Water Management Fund was established to administer and account for all receipts and expendituresrelated to the City’s surface and storm water management system. Activities that are primarily supported by user feesinclude administration, billings and collections, engineering, construction, operation, maintenance, and repairs.
The City reports the following non-major governmental funds:
Capital Project FundsThese funds are used to account for financial resources to be used for the capital maintenance or construction of Cityparks and other facilities.
Special Revenue FundsThese funds account for revenues derived from specific taxes or other earmarked revenue sources, including stategas tax and state revenue sharing entitlements, which are legally restricted to expenditures for specified purposes.
Page 44

CITY OF UNIVERSITY PLACENOTES TO THE FINANCIAL STATEMENTS
The City reports the following three proprietary funds on a consolidated basis.
Internal Service FundsThese funds (Fleet and Equipment, Information Technology and Services, and Risk Management) are used toaccount for the financing of goods or services provided by one department or agency to other departments oragencies of the City, on a cost reimbursement basis.
As a general rule the effect of the inter-fund activity has been eliminated for the government-wide financialstatements.
Amounts reported as program revenues include 1) charges to customers, 2) operating grants and contributions, and3) capital grants and contributions, including special assessments. Internally dedicated resources are reported asgeneral revenues rather than program revenues. General revenues include all taxes.
Proprietary funds distinguish operating revenues and expenses from non-operating items. Operating revenues andexpenses generally result from providing services and producing and delivering goods in connection with aproprietary fund’s principal ongoing operations. Internal service funds include the cost of services, administrativeexpenses, and depreciation on capital assets. All revenues and expenses not meeting this definition are reported asnon-operating revenues and expenses.
The Fleet and Equipment Fund is an internal service fund which accounts for the costs of maintaining and replacingthe majority of the City’s vehicles and auxiliary equipment. All equipment costs, including depreciation, are factorsin calculating the rates that are charged to each user department.
The Information Technology and Services Fund is an internal service fund which accounts for all costs associatedwith data processing, telecommunications, cable, postal operations, copier and duplication services, and theGeographical Information System (GIS). This fund owns and depreciates all non-proprietary fund assets related tothese functions, and charges users for both maintenance and operation costs and equipment replacement chargesbased on depreciation schedules.
The Risk Management Fund is an internal service fund which accounts for the City’s risk financing activitiesestablished to minimize the adverse effects of losses associated with property and casualty, medical and dental,unemployment, and worker’s compensation claims. Both risk control (to minimize the losses that strike anorganization) and risk financing (to obtain finances to provide for or restore the economic damages of those losses)are involved. The City is a member of Washington Cities Insurance Authority (WCIA), which offers a combinationof self-insurance, or standard insurance to cover liability and property risks. The City is currently only self-insuringState Unemployment Compensation.
The Strategic Reserve Fund was established by Ordinance 179 to set aside financial resources for mitigating adversesituations caused by severe short-term revenue shortfalls, expenditures resulting from emergencies, or as otherwise designatedby the City Council. The fund is financed by transferring unassigned fund balance in the General Fund at the end of eachcalendar year or by other appropriation, as deemed appropriate by the City Council. This fund is a recourse of last resort andshall be used only when no other reasonable financial management alternative exists.
All governmental funds are accounted for using a flow of current financial resources measurement focus. With thismeasurement focus, only current assets and current liabilities generally are included on the balance sheet. The statement ofrevenues, expenditures and changes in fund balances reports on the sources (i.e., revenues and other financing sources) anduses (i.e., expenditures and other financial uses) of current financial resources. This approach differs from the manner inwhich the governmental activities of the government-wide financial statements are prepared. Governmental fund financialstatements therefore include a reconciliation with brief explanations to better identify the relationship between thegovernment-wide statements and statements for governmental funds.
Like the government-wide statements, all proprietary fund types are accounted for on a flow of economic resourcesmeasurement focus. All assets and all liabilities associated with the operation of these funds are included on the statement ofnet position. The statement of changes in fund net position presents increases (i.e., revenues) and decreases (i.e., expenses) innet total position. The statement of cash flows provides information about how the City finances and meets the cash flowneeds of its proprietary activities.
Page 45
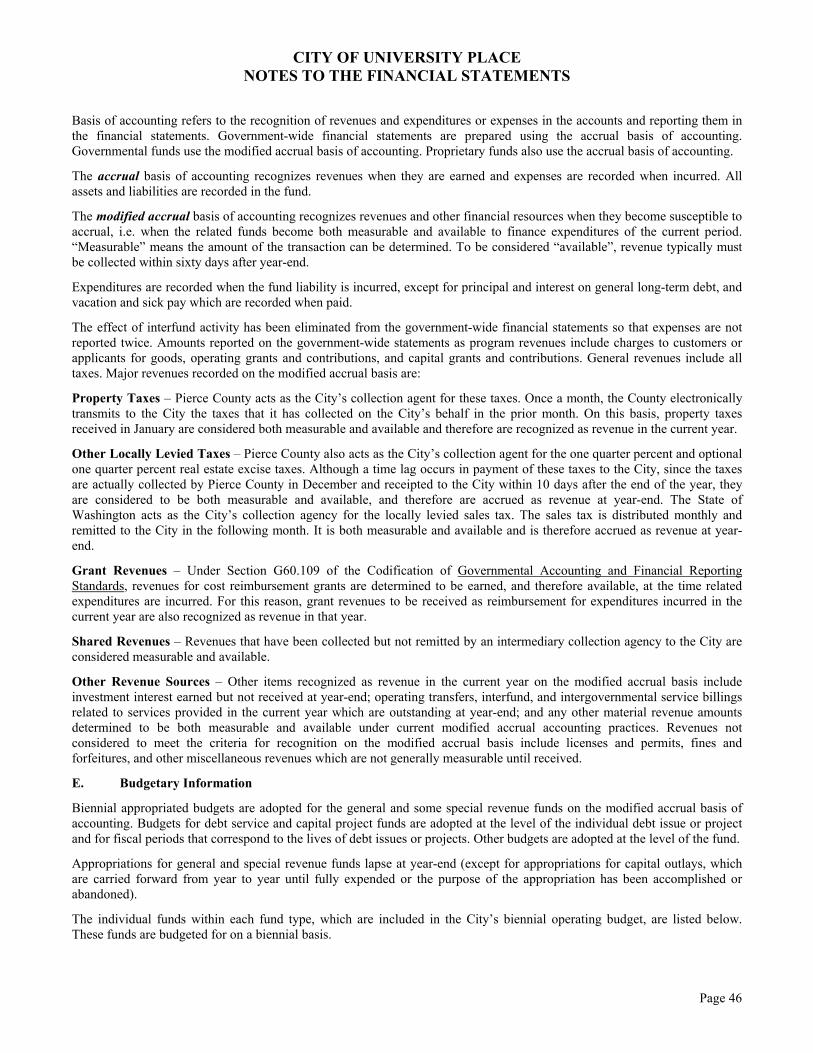
CITY OF UNIVERSITY PLACENOTES TO THE FINANCIAL STATEMENTS
Basis of accounting refers to the recognition of revenues and expenditures or expenses in the accounts and reporting them inthe financial statements. Government-wide financial statements are prepared using the accrual basis of accounting.Governmental funds use the modified accrual basis of accounting. Proprietary funds also use the accrual basis of accounting.
The accrual basis of accounting recognizes revenues when they are earned and expenses are recorded when incurred. Allassets and liabilities are recorded in the fund.
The modified accrual basis of accounting recognizes revenues and other financial resources when they become susceptible toaccrual, i.e. when the related funds become both measurable and available to finance expenditures of the current period.“Measurable” means the amount of the transaction can be determined. To be considered “available”, revenue typically mustbe collected within sixty days after year-end.
Expenditures are recorded when the fund liability is incurred, except for principal and interest on general long-term debt, andvacation and sick pay which are recorded when paid.
The effect of interfund activity has been eliminated from the government-wide financial statements so that expenses are notreported twice. Amounts reported on the government-wide statements as program revenues include charges to customers orapplicants for goods, operating grants and contributions, and capital grants and contributions. General revenues include alltaxes. Major revenues recorded on the modified accrual basis are:
Property Taxes – Pierce County acts as the City’s collection agent for these taxes. Once a month, the County electronicallytransmits to the City the taxes that it has collected on the City’s behalf in the prior month. On this basis, property taxesreceived in January are considered both measurable and available and therefore are recognized as revenue in the current year.
Other Locally Levied Taxes – Pierce County also acts as the City’s collection agent for the one quarter percent and optionalone quarter percent real estate excise taxes. Although a time lag occurs in payment of these taxes to the City, since the taxesare actually collected by Pierce County in December and receipted to the City within 10 days after the end of the year, theyare considered to be both measurable and available, and therefore are accrued as revenue at year-end. The State ofWashington acts as the City’s collection agency for the locally levied sales tax. The sales tax is distributed monthly andremitted to the City in the following month. It is both measurable and available and is therefore accrued as revenue at year-end.
Grant Revenues – Under Section G60.109 of the Codification of Governmental Accounting and Financial ReportingStandards, revenues for cost reimbursement grants are determined to be earned, and therefore available, at the time relatedexpenditures are incurred. For this reason, grant revenues to be received as reimbursement for expenditures incurred in thecurrent year are also recognized as revenue in that year.
Shared Revenues – Revenues that have been collected but not remitted by an intermediary collection agency to the City areconsidered measurable and available.
Other Revenue Sources – Other items recognized as revenue in the current year on the modified accrual basis includeinvestment interest earned but not received at year-end; operating transfers, interfund, and intergovernmental service billingsrelated to services provided in the current year which are outstanding at year-end; and any other material revenue amountsdetermined to be both measurable and available under current modified accrual accounting practices. Revenues notconsidered to meet the criteria for recognition on the modified accrual basis include licenses and permits, fines andforfeitures, and other miscellaneous revenues which are not generally measurable until received.
E. Budgetary Information
Biennial appropriated budgets are adopted for the general and some special revenue funds on the modified accrual basis ofaccounting. Budgets for debt service and capital project funds are adopted at the level of the individual debt issue or projectand for fiscal periods that correspond to the lives of debt issues or projects. Other budgets are adopted at the level of the fund.
Appropriations for general and special revenue funds lapse at year-end (except for appropriations for capital outlays, whichare carried forward from year to year until fully expended or the purpose of the appropriation has been accomplished orabandoned).
The individual funds within each fund type, which are included in the City’s biennial operating budget, are listed below.These funds are budgeted for on a biennial basis.
Page 46

CITY OF UNIVERSITY PLACENOTES TO THE FINANCIAL STATEMENTS
General Fund
Special Revenue Funds: Managerial Funds:Street Fund Strategic Reserve FundArterial Street Fund Parks and Recreation FundReal Estate Excise Tax Fund Development Services FundTransportation Benefit District Police/Public SafetyLocal Revitalization Financing Fund Traffic Impact Fees FundPaths and Trails FundDonations Fund Enterprise Funds:
Surface Water Management FundCapital Projects Funds:
Parks Capital Projects Fund Debt Service Funds:Debt Service Fund
Procedures for Adopting the Budget
The City’s budget process and the time limits under which the budget must be prepared are defined by the Revised Code ofWashington (RCW) 35A.34. The procedures followed in establishing the biennial budget are described below:
By late May, the official budget call is made by the Finance Director for current level service budgets and apreliminary financial forecast.
By late July, departments submit their preliminary expenditure estimates and the Finance Department updatesthe preliminary revenue estimates to define resources available to finance coming year expenditure programs.
Prior to the first Tuesday in October, the City Manager submits the proposed budget to the City Council. Thisbudget is based on priorities established by the Council and estimates provided by the City departments duringthe preceding months, and balanced with revenue estimates made by the Finance Director.
By October 1, the City Manager files a preliminary budget with the City Clerk. Copies of the preliminarybudget are provided to staff and the City Council and are made available to the public.
During the first two weeks of October, the City Clerk publishes a notice of the filing of the preliminary budgetand notices of public hearings to be held during preliminary budget deliberations.
City Council conducts workshops and two public hearings on the proposed budget between October andDecember. Final hearing on the budget must begin on or before the first Monday of December, and maycontinue until the 25th day prior to the beginning of the next fiscal year.
In early December, the City Council adopts an ordinance to establish the amount of property taxes to be leviedin the coming year.
By December 31, the City Council makes its adjustments to the proposed budget and adopts a final budget byordinance.
The final operating budget, as adopted, is published and distributed within the first three months of thefollowing year. Copies of the adopted budget are made available to the public.
By September 1 after the start nor later than December 31 of the first year of the fiscal biennium, the Cityprovides for a mid-biennium review including the preparation of proposed budget modifications and providesfor publication of notice of public hearings.
Amending the Budget
The City Manager is authorized to transfer budgeted amounts between departments within any fund; however, any revisionsthat alter the total expenditures of a fund or that affect the number of authorized employee positions, salary ranges, hours orother conditions of employment must be approved by the City Council.
Page 47

CITY OF UNIVERSITY PLACENOTES TO THE FINANCIAL STATEMENTS
When the City Council determines that it is in the best interest of the City to increase or decrease the appropriation for aparticular fund, it may do so by ordinance approved by a simple majority after holding public hearing(s).
The budget amounts shown in the financial statements are the final authorized amounts as revised during the year.
The financial statements contain the original and final budget information. The original budget is the first completeappropriated budget. The final budget is the original budget adjusted by all reserves, transfers, allocations, supplementalappropriations, and other legally authorized changes applicable for the fiscal year.
The budget for the donations fund is established only at the end of the fiscal year. Therefore, there is no original budget in theSchedule of Revenues, Expenditures, and Changes in Fund Balance-Budget and Actual in page 79.
F. Assets, Liabilities, Fund Balance, Net Position, and Deferred Outflows/Inflows of Resources
1. Cash and Cash Equivalents
It is the City’s policy to invest all temporary cash surpluses. At December 31, 2015, the City was holding $18,090,140 inshort-term residual investments of surplus cash. This amount is classified on the balance sheet as cash and cash equivalents invarious funds. The interest on these investments is held in the General Fund.
For purposes of the statement of cash flows, the City considers all highly liquid investments (including restricted assets) witha maturity of three months or less when purchased to be cash equivalents.
2. Investments
Investments are valued at fair market value. The fair value of the City’s position in the state investment pool is the same as thevalue of the pool shares. See Note IV, Deposits and Investments.
3. Receivables
Taxes receivable consists of property taxes and related interest and penalties (See Property Taxes Note No. V. A.) Accruedinterest receivable consists of amounts earned on investments, notes and contracts at the end of the year.
4. Amounts Due to and From Other Funds and Governments, Interfund Loans and Advances Receivable
Activities between funds that are representative of lending/borrowing arrangements outstanding at the end of the fiscal yearare referred to as either interfund loans receivable/payable or advances to/from other funds. All other outstanding balancesbetween funds are reported as due to/from other funds. Any residual balances outstanding between the governmental activitiesand business-type activities are reported in the government-wide financial statements as internal balances. A separate scheduleof interfund loans receivable and payable is furnished in Note IV. F. Interfund Balances and Transfers.
Advances between funds, as reported in the fund financial statements, are offset by a fund balance reserve account inapplicable governmental funds to indicate that they are not available for appropriation and are not expendable availablefinancial resource.
5. Capital Assets (See Note IV C. Capital Assets)
Capital assets, which include property, plant, equipment and software, and infrastructure assets (e.g., roads, bridges,sidewalks, and similar items), are reported in the applicable governmental or business-type columns in the government-widefinancial statements, Capital assets are defined by the City as assets with an initial, individual cost and an estimated usefullife. Capitalization thresholds and estimated useful lives of capital assets are as follows:
Page 48

CITY OF UNIVERSITY PLACENOTES TO THE FINANCIAL STATEMENTS
CapitalizationThreshold
EstimatedUseful Life
Buildings and improvements $ 15,000.00 10-100 YearsEquipment and software 5,000.00 4-12 YearsRoads - collectors and residential 15,000.00 7-40 Years
Such assets are recorded at historical cost or estimated historical cost if purchased or constructed. Donated capital assets arerecorded at estimated fair market value at the date of donation.
Costs for additions or improvements to capital assets are capitalized when they increase the effectiveness or efficiency of theasset.
The costs for normal maintenance and repairs are not capitalized.
Major outlays for capital assets and improvements are capitalized as projects are constructed. Interest incurred during theconstruction phase of the capital assets of business-type activities is included as part of the capitalized value of the assetsconstructed. There was no interest incurred by the City during the current fiscal year.
Property, plant, and equipment of the primary government is depreciated using the straight-line method over their estimateduseful lives.
Net investment in capital assets reported on the Statement of Net Position is calculated by subtracting outstanding debt (lessunspent revenue bond proceeds of $959,791) from capital assets.
6.Asset Impairments and Insurance Recoveries
The City has recorded insurance recoveries related to the impairment of capital assets as Program Revenue at the government-wide level, as Other Financing Sources in the Governmental Funds and as Other Nonoperation Revenues in the EnterpriseFunds. For the year ended December 31, 2015, the City received $27,768 in insurance recoveries
7. Compensated Absences
Compensated absences are absences for which employees will be paid, such as vacation leave and sick leave. All vacation andsick pay is accrued when incurred in the government-wide and proprietary fund financial statements.
There is no maximum on the vacation balance an employee may carry. However, the maximum vacation balance that anemployee may cash out at termination is 240 hours. Vacation pay is payable to the maximum upon resignation, retirement orthe death of an employee.
A non-exempt employee may request compensatory time in lieu of overtime payment. Compensatory time is accrued at a rateof one and one-half hours for each hour of overtime worked, accruable to a maximum of 80 hours.
Sick leave accumulation is unlimited. Effective January 1, 2005 any employee in good standing with at least five (5) years ofregular employment with the City may cash out up to 40 hours of sick leave per year for 50% of its value at the employee’scurrent hourly wage if their remaining sick balance is over 100 hours. As of January 1, 2007 employees in good standing withseven (7) or more years of regular employment with the City may cash out up to 80 hours for 75% of its value at their currenthourly wage as long as their sick leave balance remains over 100 hours. Other sick leave is only payable upon resignation,retirement or the death of an employee. An employee who has been with the City for at least two years may receive twenty-five percent of accumulated sick leave up to a maximum balance of 960 hours.
In accordance with GASB Statement 16, the City accrues vacation pay and no liability is recorded for non-vestingaccumulating rights to receive sick pay benefits. However, a liability is recognized for that portion of accumulating sick leavebenefits that is estimated will be taken as termination leave prior to resignation. This provides for the termination pay foreligible employees vacation and twenty-five percent of their sick leave to a maximum of 960 hours accrued.
The entire compensated absence liability is reported on the government-wide financial statements as it meets the criteriaidentified in the 2005 GAAFR. In the proprietary funds, the amount of compensated absences related to internal service fundsis reported as a liability.
Page 49

CITY OF UNIVERSITY PLACENOTES TO THE FINANCIAL STATEMENTS
8. Unearned Revenues
Unearned revenues consist of amounts collected before revenue recognition criteria are met. Unearned revenue of $210,867was reported in the 2015 Governmental Funds Balance Sheet. Of this amount, $720,000 is the remaining sales contractamount for 15,000 square feet of space within the Civic Building of which the Pierce County Library will take ownershipupon payment in full in seven years. The City received $47,019 in unearned revenue in 2015 for registrations to participate inRecreation programs scheduled for 2016, $770 for facility rentals, $75 for permits, $2,017 was received in 2015 for petlicenses due in 2016 and Traffic Impact Fees totaled $83,068. Deposits in the amount of $77,918 also remained at the end of2015.
9.Deferred Outflows/Inflows of Resources
In addition to assets, the Statement of Net Position and or Balance Sheet will sometimes report a separate section of deferredoutflows of resources. This separate financial statement element, deferred outflows of resources, represents a consumption ofnet position that applies to a future period(s) and so will not be recognized as an outflow of resources (expenses/expenditure)until then. The deferred outflows of resources are reported in the government-wide statement of net position for governmentaland business activities and the fund level for the proprietary statement of net position. The City has two items that qualify forreporting in this category. First, , the City’s pension plan contributions made from the measurement date of the pension planto the current fiscal year end are deferred and will be recognized in the subsequent fiscal year. Second, the difference betweenprojected and actual earnings on pension plan investments are deferred and recognized as pension plan expense over a closedfive-year period as required by GASB 68. In addition to liabilities, the Statement of Net Position and or Balance Sheet willsometimes report a separate section for deferred inflows of resources. This separate financial statement element, deferredinflows of resources, represents an acquisition of net position that applies to a future period(s) and so will not be recognizedas an inflow of resources (revenues) until that time. The City has two items that qualify for reporting in this category. At thegovernmental fund level, revenues that have been billed but not yet collected are reported as unavailable revenues. Theseamounts are deferred and recognized as an inflow of resources in the period they become available to the City. A deferredinflow of resources is recognized in the government-wide statement of net position for governmental and business activitiesand the fund level for the proprietary statement of net position for the difference between the expected experience and theactual experience in the actuarial measurement of the total pension liability not recognized in the current year. The amount isdeferred and amortized over a period of years determined by the plan actuary. The amortization period is based on theestimated average remaining service lives of employees that are provided with a pension through the pension plan (active andinactive employees) for the City determined as of the beginning of the measurement date.
10. Accrued Liabilities and Noncurrent Liabilities
All payables, accrued liabilities, and noncurrent liabilities are reported in the government-wide financial statements and on theproprietary fund financial statements.
In general, governmental fund payables and accrued liabilities once incurred are paid in a timely manner and in full fromcurrent financial resources and are reported as obligations of the funds. Bonds, capital leases and long-term loans arerecognized as a liability on the governmental fund financial statements when due.
11. Fund Balance
The City of University Place implemented Governmental Accounting Standards Board Statement No. 54. For governmentalfund financial statements fund balances are reported in five classifications.
a. Non-spendable: Fund balance amounts that cannot be spent because they are either not in spendable form orthey are legally or contractually required to remain intact. The City has no non-spendable fund balances at thistime.
b. Restricted: Fund balance amounts that are constrained for specific purposes which are externally imposed bycreditors, grantors, contributors, or laws or regulations of other governments, or by law through constitutionalprovisions or enabling legislation.
c. Committed: Fund balance amounts that are constrained for specific purposes which are internally imposed bythe City Council through an ordinance which must be approved by the affirmative vote of a majority of the CityCouncil in a public meeting. Such an ordinance can only be repealed or amended by the affirmative vote of amajority of the City Council in a public meeting.
Page 50

CITY OF UNIVERSITY PLACENOTES TO THE FINANCIAL STATEMENTS
d. Assigned: Fund balance amounts that are constrained by the City Council’s intent to be used for specificpurposes, but are neither restricted nor committed. This category of fund balance represents amounts the CityCouncil has authorized the City Manager to assign, through resolution or through the ordinance adopting theCity’s budget, to be used for a specific purpose. Once assigned, the limitation imposed by the ordinance orresolution remain in place until a similar action is taken (the adoption of an ordinance or passing of aresolution) to remove or revise the limitation.
e. Unassigned: Fund balance amounts that represent residual positive fund balance within the General Fund thathas not been classified as restricted, committed, or assigned, and negative fund balances in other governmentalfunds.
The City considers restricted amounts to have been spent first when expenditures are incurred for purposes for which bothrestricted and unrestricted fund balances are available. When expenditures of unrestricted fund balance are incurred, the Cityconsiders committed amounts spent first, then assigned amounts, and lastly unassigned amounts.
A minimum fund balance has been established through Resolution 702 Section 3: The City shall attempt to maintain a cashreserve of five to fifteen percent (5%-15%) of its operating budget.
G. Pensions
For purposes of measuring the net pension liability, deferred outflows of resources and deferred inflows of resources relatedto pensions, and pension expense, information about the fiduciary net position of all state sponsored pension plans andadditions to/deductions from those plans’ fiduciary net position have been determined on the same basis as they are reportedby the Washington State Department of Retirement Systems. For this purpose, benefit payments (including refunds ofemployee contributions) are recognized when due and payable in accordance with the benefit terms. Investments are reportedat fair value.
NOTE II. RECONCILIATION OF GOVERNMENT-WIDE AND FUND FINANCIALSTATEMENTS
A. Explanation of Certain Differences Between the Governmental Fund Balance Sheet and the Government-wide Statement of Net Position
The governmental fund balance sheet includes a reconciliation between fund balance- total governmental funds and netposition - governmental activities as reported in the government-wide statement of net position. One element of thatreconciliation explains that "Certain liabilities, such as bonds payable and accrued expenses, are not reported in this fundfinancial statement because they are not due and payable, but they are presented in the statement of net position."
The details of this difference are as follows:
2015
General obligation bonds $ 43,355,000Revenue bonds payable 5,345,000Public works trust fund loan 964,334Compensated absences 431,615Subtotal debt 50,095,949Interest payable (227,932)Total $ 49,868,017
One element of the reconciliation explains that internal service funds are used to charge the costs of services to individualfunds. The assets and liabilities of the internal service funds are not reported in this fund financial statement but they arereported in the statement of net position. This difference is $675,220.
Page 51

CITY OF UNIVERSITY PLACENOTES TO THE FINANCIAL STATEMENTS
Internal service funds net position $ 675,220Add debt reported above:
NOTE III. STEWARDSHIP, COMPLIANCE, AND ACCOUNTABILITY
During 2015, there have been no material violations of finance-related legal or contractual provisions.
NOTE IV. DETAILED NOTES ON ALL FUNDS
A. Deposits and Investments
Deposits
As required by state law, all deposits and investments of the City’s funds are entirely covered by federal depository insurance(FDIC) or by collateral held in a multiple financial institution collateral pool administered by the Washington Public DepositProtection Commission (WPDPC).
Investments
On December 31, 2015, the City had the following investments:
Investment Fair ValueState Investment Pool $ 15,392,256Federal Home Loan Bank $ 999,630
The LGIP is an un-rated 2a-7 like pool, as defined by GASB 31. Accordingly, participants’ balances in the LGIP are notsubject to interest rate risk, as the weighted average maturity of the portfolio will not exceed 90 days. Per GASB 40guidelines the balances are also not subject to custodial credit risk. The credit risk of the LGIP is limited as most investmentsare either obligations of the US government, government sponsored enterprises, or insured demand deposit accounts andcertificates of deposit.
The State’s Local Government Investment Pool is managed by the Washington State Treasurer’s Office. The LGIP is not SECregistered but has oversight provided by the following sources: 1) annually audited by the Office of the State Auditor; 2)annually audited by an outside, independent auditor; 3) an Advisory Committee meets quarterly to advise the State Treasureron issues regarding the LGIP; 4) monthly statement enclosures detailing portfolio breakdown and earnings information sent toparticipants; and, 5) quarterly newsletters that include a compliance report and quarterly financials. The fair value of theCity’s position in the pool is the same as the value of the pool shares. Financial reports are available at the State Treasurer’sOffice, P.O. Box 40200, Olympia, Washington, 98504-2000. The City’s Investment Policy allows for investment in theState’s Local Government Investment Pool.
The Federal Nation Mortgage Assoc. investment was rated Aaa by Moody’s and AA+ by Standard and Poors.
Page 52

CITY OF UNIVERSITY PLACENOTES TO THE FINANCIAL STATEMENTS
B. Receivables and Due from Other Governments
The following is an analysis of the accounts receivable and amounts due from other governments for 2015:
Accounts receivableProperty tax $ 65,259Utility company taxes and ROW use fees 433,692Gambling and admissions taxes 7,529TIF Deferral 83,068Miscellaneous receivables 20,265
Total $ 609,813
Due from other governmentsDue from other governments $ 575,714Grants receivable 658,408
Total $ 1,234,122
C. Capital Assets
Capital assets are tangible or intangible assets having initial useful lives extending beyond a single reporting period. The Cityhas included intangible assets for a number of years and is in compliance with GASB 51. Capital assets activity forgovernmental activities for the year ended December 31, 2015 is as follows:
BeginningBalance Increases Decreases Ending Balance
Governmental Activities:Capital Assets, Not Being DepreciatedLand $ 26,789,357 $ - $ - $ 26,789,357Easement 1,702,904 273,971 - 1,976,875Construction in progress 9,581,900 5,927,263 (7,192,819) 8,316,344Total capital assets, not being depreciated 38,074,161 6,201,234 (7,192,819) 37,082,576
Capital Assets, Being DepreciatedBuildings $ 37,895,158 - - 37,895,158Infrastructure 175,333,107 7,192,819 - 182,525,926Equipment and Software 3,234,658 237,118 (52,979) 3,418,797Total capital assets, being depreciated 216,462,923 7,429,937 (52,979) 223,839,881
Less Acummulated Depreciated forBuildings $ (7,490,629) (1,284,796) - (8,775,425)Infrastructure (144,621,469) (2,453,307) - (147,074,776)Equipment and Software (2,419,583) (176,788) 52,979 (2,543,392)Total accumulated depreciation being depreciated (154,531,681) (3,914,891) 52,979 (158,393,593)
Total capital assets, being depreciated, net 61,931,242 3,515,046 - 65,446,288
Governmental activities capital assets, net $ 100,005,403 $ 9,716,280 $ (7,192,819) $ 102,528,864
Depreciation expense was charged to functions/programs of the primary government as follows:
Page 53

CITY OF UNIVERSITY PLACENOTES TO THE FINANCIAL STATEMENTS
Functions/Programs:General government $ 1,191,363Transportation 2,502,080Health and Human Services 10,782Cultural and Recreation 259,439
Total depreciation expense $ 3,963,664
D. Long-Term Debt
The various categories of long-term debt reflected on the City’s financial statements are briefly described in the followingparagraphs.
General Obligation Bonds are a direct obligation of the City for which its full faith and credit are pledged. Proceeds are usedfor the acquisition or construction of major capital facilities or equipment. “Councilmanic Bonds” are general obligationbonds issued by City Council without voter approval. Under State law, repayment of these bonds must be financed fromgeneral City revenues since no additional property taxes can be levied to support related debt service payments. AlthoughGeneral Obligation Bonds may be issued to support proprietary fund activity, the City has issued these bonds for generalgovernment purposes only.
The 2005 bonds were issued for the purpose of refinancing of bonds issued in 1996 and 1997. Those bonds were issued forvarious purposes including the purchase of Windmill Village/City Hall, Windmill Village remodel, Grandview Avenue CIP,arterial lighting CIP and park land acquisition.
The 2007 Series A bond s were issued to make street improvements and sewer improvements, construct a portion of a transitcenter garage and construct other public capital projects related to the Town Center project. The Series B bonds were issuedto repay the bond anticipation note in the principle amount of $12.3 million that was used to finance the acquisition ofproperty within the Town Center of the City. The Series C were issued to finance certain road projects, including: Bridgeport3A, neighborhood capital improvement projects, 19th Street retrofit, Alameda bike and pedestrian path, 40th Street bike andpedestrian path and Civic Building Design and other capital projects of the City. The Series D bonds were issued to finance aportion of a garage in the Town Center area of the City.
The 2009 Series A bonds were issued to finance a portion of the costs of completing the core and shell of a civic building,including the library. Proceeds of the 2009 Series B bonds were used to pay a portion of the costs of completing the CivicBuilding and to pay taxable lines of credit entered into in connection with the Town Square project.
The 2012 Series A and Series B bonds were issued to refinance the 2007 Series B ($12,445,000) and the remaining principalon the 2001 LTGO ($1,685,000). The 2001 LTGO bonds were issued for the purpose of park and recreation improvements atthe Cirque and Bridgeport Park site.
General Obligation Bonds approved by the voters are typically repaid through an annual “excess” property tax levyauthorized for this purpose by State statute. At year-end 2015 the City had no voter-approved bonds outstanding.
Local Revitalization Revenue Bonds were issued in 2011 in the amount of $5,885,000. The City established, by ordinance, aseparate Authority which is authorized to undertake a “local revitalization financing” by using revenues received from a localsales and use tax imposed pursuant to RCW 82.14.510 to pay the principal of and interest on revenue bonds issued to finance“public improvements” within a local revitalization area. The City has no liability for the bonds. Bond holders look solely tothe finances of the Authority for repayment.
State of Washington Public Works Trust Fund Loans (PWTF) are a direct responsibility of the City. University Placecurrently has five such loans. The first PWTF loan with a balance of $201,827 was used for Grandview Drive Westimprovements. The second PWTF loan with a balance of $178,939 was used for Sunset Drive West improvements. The thirdPWTF loan with a balance of $257,370 was used for Bridgeport Way West improvements between 40th Street West andCirque Drive West. The fourth PWTF loan with a balance of $200,522 was used for improvements on Bridgeport Way andthe Streetscape in the Town Center Project. The fifth PWTF loan with a balance of $455,754 was used for improvements onCirque Drive West. All loan agreements provide for interest at 1% or 2% per annum on the outstanding loan balance. Afterthe first loan repayment, subsequent repayments are due June 30th of each year and will consist of 1/19th of the outstandingprincipal plus interest on the unpaid balance of the loan. The terms of the loans will not exceed twenty years.
Page 54

CITY OF UNIVERSITY PLACENOTES TO THE FINANCIAL STATEMENTS
Long-term debt activity for the year ended December 31, 2015 follows:
Description Date of Issue Maturity Date
AmountOriginally
Issued
BeginningOutstanding
DebtAmountIssued
Amount tobe
Redeemed
EndingOutstanding
Debt
Governmental ActivityGeneral obligation bonds
2007 refunding 11-Apr-05 1-Dec-17 $ 5,670,000 $ 1,640,000 $ - $ 600,000 $ 1,040,0002007 Series A 25-Jul-07 I-Dec-29 3,575,000 3,575,000 - - 3,575,0002007 Series C 1-Dec-07 1-Dec-27 3,065,000 3,065,000 - 185,000 2,880,0002007 Series D 1-Dec-07 1-Dec-15 1,015,000 350,000 - 350,000 -2009 Series A 24-Aug-09 1-Dec-25 14,685,000 14,685,000 - - 14,685,0002009 Series B 24-Aug-09 1-Dec-34 7,760,000 7,760,000 - - 7,760,0002012 Series A 20-Nov-12 1-Dec-37 6,250,000 5,970,000 - 155,000 5,815,0002012 Series B (taxable) 20-Nov-12 1-Dec-37 7,880,000 7,600,000 - - 7,600,000
Subtotal 49,900,000 44,645,000 - 1,290,000 43,355,000
Revenue bond20II local option sales 11-Jul-11 1-Oct-37 5,885,000 5,495,000 - 150,000 5,345,000
Subtotal 5,885,000 5,495,000 - 150,000 5,345,000Other debtPublic works trust fund loans
PW-97-791-033 1-Jul-98 1-Jul-17 1,240,991 199,623 - 66,540 133,083PW-00-691-059 1-Jul-01 1-Jul-20 345,508 109,100 - 18,183 90,917PW-00-691-060 1-Jul-01 1-Jul-20 665,280 214,029 - 35,672 178,357PW-00-691-058 1-Jul-02 1-Jul-20 495,132 175,740 - 29,290 146,450PW-05-691-PRE-145 1-Jul-06 1-Jul-25 766,983 457,080 - 41,553 415,527
Subtotal 3,513,894 1,155,572 - 191,238 964,334Total governmental activity general obligation
bonds & other debt $ 59,298,894 $ 51,295,572 $ - $ 1,631,238 $ 49,664,334
Business-type Activity
Other debtPublic works trust fund loans
PW-97-791-033 1-Jul-98 1-Jul-17 641,009 103,106 - 34,369 68,737PW-00-691-059 1-Jul-01 1-Jul-20 334,492 105,628 - 17,606 88,022PW-00-691-060 1-Jul-01 1-Jul-20 294,720 94,813 - 15,802 79,011PW-00-691-058 1-Jul-02 1-Jul-20 136,012 48,272 - 8,045 40,227PW-05-691-PRE-145 1-Jul-06 1-Jul-25 99,762 59,479 - 5,407 54,072
Subtotal 1,505,995 411,298 - 81,229 330,069
Total business-type activity other-debt $ 1,505,995 $ 411,298 $ - $ 81,229 $ 330,069
Page 55

CITY OF UNIVERSITY PLACENOTES TO THE FINANCIAL STATEMENTS
Annual debt service requirements to maturity for general obligation debt are as follows:
General Obligation BondsGovernmental Activities Business-type Activities
Year Principal Interest Total Principal Interest Total
2016 1,130,000 2,231,168 3,361,168 - - -2017 1,165,000 2,191,783 3,356,783 - - -2018 1,215,000 2,145,638 3,360,638 - - -2019 1,270,000 2,089,060 3,359,060 - - -2020 1,330,000 2,029,099 3,359,099 - - -
2021-2025 7,810,000 8,992,739 16,802,739 - - -2026-2030 10,125,000 6,636,640 16,761,640 - - -2031-2035 13,055,000 3,746,145 16,801,145 - - -2036-2037 6,255,000 473,227 6,728,227 - - -
Total $ 43,355,000 $ 30,535,499 $ 73,890,499 $ - $ - $ -
Public Works Trust Fund LoansGovernmental Activities Business-type Activities
Year Principal Interest Total Principal Interest Total
2016 $ 191,239 $ 7,566 $ 198,805 $ 81,230 $ 3,030 $ 84,2602017 191,239 5,861 197,100 81,230 2,245 83,4752018 124,697 4,156 128,853 46,861 1,460 48,3212019 124,697 3,117 127,814 46,861 1,018 47,8792020 124,697 2,078 126,775 46,861 577 47,438
2020-2025 207,764 3,116 210,880 27,036 406 27,442Total $ 964,333 $ 25,894 $ 990,227 $ 330,079 $ 8,736 $ 338,815
LFR Revenue BondGovernmental Activities Business-type Activities
Year Principal Interest Total Principal Interest Total
2016 $ 155,000 $ 241,413 $ 396,413 $ - $ - $ -2017 160,000 236,763 396,763 - - -2018 165,000 231,963 396,963 - - -2019 170,000 227,013 397,013 - - -2020 175,000 221,488 396,488 - - -
2021-2025 985,000 997,390 1,982,390 - - -2026-2030 1,235,000 752,327 1,987,327 - - -2031-2035 1,560,000 425,788 1,985,788 - - -2036-2037 740,000 56,000 796,000 - - -
Total $ 5,345,000 $ 3,390,145 $ 8,735,145 $ - $ - $ -
Page 56

CITY OF UNIVERSITY PLACENOTES TO THE FINANCIAL STATEMENTS
E. Long-Term Liabilities
Long-term liability activity for the year ended December 31, 2015 is as follows:
Governmental ActivitiesBeginningBalance Additions Reductions
EndingBalance
Due in OneYear
Due in Morethan One Year
Bonds and Loans PayableGeneral obligation bonds $ 44,645,000 $ - $ (1,290,000) $43,355,000 $ 1,130,000 $ 42,225,000Revenue bonds 5,495,000 - (150,000) 5,345,000 155,000 5,190,000Public works trust fund loans 1,155,572 - (191,238) 964,334 191,239 773,095
Total bonds and loans payable 51,295,572 - (1,631,238) 49,664,334 1,476,239 48,188,095
Compensated absences 420,587 191,409 (180,381) 431,615 143,870 287,745Net pension liability* 3,204,365 - (284,429) 2,919,936 - 2,919,936
Government activities, long-termliabilities $ 54,920,524 $ 191,409 $ (2,096,048) $53,015,885 $ 1,620,109 $ 51,395,776
Business-type ActivitiesBeginningBalance Additions Reductions
EndingBalance
Due in OneYear
Due in Morethan One Year
Bonds and loans payablePublic works trust fund loans $ 411,298 $ - $ (81,229) $ 330,069 $ 81,230 $ 248,839
Total bonds and loans payable 411,298 - (81,229) 330,069 81,230 248,839
Compensated absences 46,747 21,274 (20,049) 47,972 15,990 31,982Net pension liability* 438,642 - (19,289) 419,353 - 419,353
Government activities, long-termliabilities $ 896,687 $ 21,274 $ (120,567) $ 797,394 $ 97,220 $ 700,174
*Net pension liability beginning balance has been adjusted for the implementaiton of GASB 68 and 71.
The general fund and internal service funds typically have been used in prior years to liquidate the liability for compensatedabsences.
F. Transfers
Transfers are legally authorized contributions of resources from one fund to another to subsidize designated activities orexpenditures. Transfers are accounted for as “Other Financing Sources and Uses”. The City transferred funds for variousconstruction projects, to the debt service fund as principle and interest payments become due and to finance various programsaccounted for in other funds in accordance with budgetary authorizations. The following transfers were recorded during 2015:
Page 57

CITY OF UNIVERSITY PLACENOTES TO THE FINANCIAL STATEMENTS
2015Fund Category Transfer in Transfer out
General $ 7,310 $ 4,120,160Surface water management - 1,367,936Public works capital improvement 2,675,969 -Nonmajor capital project funds 67,288 -Debt service 3,777,420 -Nonmajor special revenue fund 489,395 1,568,565LRF 2,000 345,136Internal service 382,415 -
Total $ 7,401,797 $ 7,401,797
G. Construction and other significant commitments
Construction Commitments - The City has active public works capital improvement construction projects as of December 31,2015. The projects include street construction and widening, parks and trails, general government facilities, technologyupgrades and waterworks system improvements. At December 31, 2015, the City’s construction commitments were $189,946.
Construction CommitmentsProject RemainingBridgeport Phase 5 $ 72,133Mildred/67th 20,021Soundview Drive/SWM 10,945Olympic Dr. W/SWM 10,945Tahoma Place/SWM 10,945SafeRoutes Elwood 2,000Bridgeport 4A 24,069Cirque Dr. Overlay 20,000Garage Painting 18,888
Total $ 189,946
Encumbrances – Encumbrances (e.g., purchase orders, contracts) accounting is employed in governmental funds.Encumbrance accounting is utilized to the extent necessary to assure effective budgetary control and accountability and tofacilitate effective cash planning and control. At the year end the amount of encumbrances expected to be honored uponperformance by the vendor in the next year were as follows:
General funds $ 142,397Total $ 142,397
NOTE V. PENSION PLANS
The following table represents the aggregate pension amounts for all plans subject to the requirements of the GASB Statement68, Accounting and Financial Reporting for Pensions for the year 2015:
Aggregate Pension Amounts - All PlansPension liabilities $ 3,339,289Pension assets $ -Deferred outflows of resources $ 407,146Deferred inflows of resources $ 514,943Pension Expense/Expenditures $ 329,312
Page 58

CITY OF UNIVERSITY PLACENOTES TO THE FINANCIAL STATEMENTS
State Sponsored Pension Plans
Substantially all of the City of University Place's full-time and qualifying part-time employees participate in one of thefollowing statewide retirement systems administered by the Washington State Department of Retirement Systems, under cost-sharing, multiple-employer public employee defined benefit and defined contribution retirement plans. The state Legislatureestablishes, and amends, laws pertaining to the creation and administration of all public retirement systems.
The Department of Retirement Systems (DRS), a department within the primary government of the State of Washington,issues a publicly available comprehensive annual financial report (CAFR) that includes financial statements and requiredsupplementary information for each plan. The DRS CAFR may be obtained by writing to:
Department of Retirement SystemsCommunications UnitP.O. Box 48380Olympia, WA 98540-8380
Or the DRS CAFR may be downloaded from the DRS website at www.drs.wa.gov.
Public Employees' Retirement System (PERS)
PERS members include elected officials; state employees; employees of the Supreme, Appeals and Superior Courts;employees of the legislature; employees of district and municipal courts; employees of local governments; and highereducation employees not participating in higher education retirement programs. PERS is comprised of three separate pensionplans for membership purposes. PERS plans 1 and 2 are defined benefit plans, and PERS plan 3 is a defined benefit plan witha defined contribution component.
PERS Plan 1 provides retirement, disability and death benefits. Retirement benefits are determined as two percent of themember’s average final compensation (AFC) times the member’s years of service. The AFC is the average of the member’s24 highest consecutive service months. Members are eligible for retirement from active status at any age with at least 30 yearsof service, at age 55 with at least 25 years of service, or at age 60 with at least five years of service. Members retiring fromactive status prior to the age of 65 may receive actuarially reduced benefits. Retirement benefits are actuarially reduced toreflect the choice of a survivor benefit. Other benefits include duty and non-duty disability payments, an optional cost-of-living adjustment (COLA), and a one-time duty-related death benefit, if found eligible by the Department of Labor andIndustries. PERS 1 members were vested after the completion of five years of eligible service. The plan was closed to newentrants on September 30, 1977.
Contributions
The PERS Plan 1 member contribution rate is established by State statute at 6 percent. The employer contribution rate isdeveloped by the Office of the State Actuary and includes an administrative expense component that is currently set at 0.18percent. Each biennium, the state Pension Funding Council adopts Plan 1 employer contribution rates. The PERS Plan 1required contribution rates (expressed as a percentage of covered payroll) for 2015 were as follows:
PERS Plan 1Actual Contribution Rates: Employer Employee*
January through June 2015 %9.21 %6.00July through December 2015 %11.18 %6.00
* For employees participating in JBM, the contribution rate was 12.26%
The city's actual contributions to the plan were $0 for the year ended December 31, 2015.
PERS Plan 2/3 provides retirement, disability and death benefits. Retirement benefits are determined as two percent of themember’s average final compensation (AFC) times the member’s years of service for Plan 2 and 1 percent of AFC for Plan 3.The AFC is the average of the member’s 60 highest-paid consecutive service months. There is no cap on years of servicecredit. Members are eligible for retirement with a full benefit at 65 with at least five years of service credit. Retirement beforeage 65 is considered an early retirement. PERS Plan 2/3 members who have at least 20 years of service credit and are 55 yearsof age or older, are eligible for early retirement with a benefit that is reduced by a factor that varies according to age for eachyear before age 65. PERS Plan 2/3 members who have 30 or more years of service credit and are at least 55 years old canretire under one of two provisions:
Page 59

CITY OF UNIVERSITY PLACENOTES TO THE FINANCIAL STATEMENTS
With a benefit that is reduced by three percent for each year before age 65; or
With a benefit that has a smaller (or no) reduction (depending on age) that imposes stricter return-to-work rules.
PERS Plan 2/3 members hired on or after May 1, 2013 have the option to retire early by accepting a reduction of five percentfor each year of retirement before age 65. This option is available only to those who are age 55 or older and have at least 30years of service credit. PERS Plan 2/3 retirement benefits are also actuarially reduced to reflect the choice of a survivorbenefit. Other PERS Plan 2/3 benefits include duty and non-duty disability payments, a cost-of-living allowance (based on theCPI), capped at three percent annually and a one-time duty related death benefit, if found eligible by the Department of Laborand Industries. PERS 2 members are vested after completing five years of eligible service. Plan 3 members are vested in thedefined benefit portion of their plan after ten years of service; or after five years of service if 12 months of that service areearned after age 44.
PERS Plan 3 defined contribution benefits are totally dependent on employee contributions and investment earnings on thosecontributions. PERS Plan 3 members choose their contribution rate upon joining membership and have a chance to changerates upon changing employers. As established by statute, Plan 3 required defined contribution rates are set at a minimum of 5percent and escalate to 15 percent with a choice of six options. Employers do not contribute to the defined contributionbenefits. PERS Plan 3 members are immediately vested in the defined contribution portion of their plan.
PERS Plan 2/3Actual Contribution Rates: Employer 2/3 Employee 2*
January through June 2015 %9.21 %4.92July through December 2015 %11.18 %6.12Employee PERS Plan 3 Varies
* For employees participating in JBM, the contribution rate was 15.30%
The city's actual contributions to the plan were $372,832 for the year ended December 31, 2015.
Actuarial Assumptions
The total pension liability (TPL) for each of the DRS plans was determined using the most recent actuarial valuationcompleted in 2015 with a valuation date of June 30, 2014. The actuarial assumptions used in the valuation were based on theresults of the Office of the State Actuary’s (OSA) 2007-2012 Experience Study.
Additional assumptions for subsequent events and law changes are current as of the 2014 actuarial valuation report. The TPLwas calculated as of the valuation date and rolled forward to the measurement date of June 30, 2015. Plan liabilities wererolled forward from June 30, 2014, to June 30, 2015, reflecting each plan’s normal cost (using the entry-age cost method),assumed interest and actual benefit payments.
Inflation: 3% total economic inflation; 3.75% salary inflation
Salary increases: In addition to the base 3.75% salary inflation assumption, salaries are also expected to grow bypromotions and longevity.
Investment rate of return: 7.5%
Mortality rates were based on the RP-2000 report’s Combined Healthy Table and Combined Disabled Table, published by theSociety of Actuaries. The OSA applied offsets to the base table and recognized future improvements in mortality byprojecting the mortality rates using 100 percent Scale BB. Mortality rates are applied on a generational basis; meaning, eachmember is assumed to receive additional mortality improvements in each future year throughout his or her lifetime.
There were minor changes in methods and assumptions since the last valuation.
The OSA updated demographic assumptions, consistent with the changes from the 2007-2012 Experience StudyReport, used when valuing the PERS 1 and TERS 1 Basic Minimum COLA.
The OSA corrected how valuation software calculates a member’s entry age under the entry age normal actuarialcost method. Previously, the funding age was rounded, resulting in an entry age one year higher in some cases.
Page 60

CITY OF UNIVERSITY PLACENOTES TO THE FINANCIAL STATEMENTS
For purposes of calculating the Plan 2/3 Entry Age Normal Cost contribution rates, the OSA now uses the currentblend of Plan 2 and Plan 3 salaries rather than using a long-term membership assumption of two-thirds Plan 2members and one-third Plan 3 members.
The OSA changed the way it applies salary limits, as described in the 2007-2012 Experience Study Report.
Discount Rate
The discount rate used to measure the total pension liability for all DRS plans was 7.5 percent.
To determine that rate, an asset sufficiency test included an assumed 7.7 percent long-term discount rate to determine fundingliabilities for calculating future contribution rate requirements. (All plans use 7.7 percent.) Consistent with the long-termexpected rate of return, a 7.5 percent future investment rate of return on invested assets was assumed for the test.Contributions from plan members and employers are assumed to continue being made at contractually required rates(including PERS 2/3, PSERS 2, SERS 2/3, and TRS 2/3 employers, whose rates include a component for the PERS 1, andTRS 1 plan liabilities). Based on these assumptions, the pension plans’ fiduciary net position was projected to be available tomake all projected future benefit payments of current plan members. Therefore, the long-term expected rate of return of 7.5percent was used to determine the total liability.
Long-Term Expected Rate of Return
The long-term expected rate of return on the DRS pension plan investments of 7.5 percent was determined using a building-block-method. The Washington State Investment Board (WSIB) used a best estimate of expected future rates of return(expected returns, net of pension plan investment expense, including inflation) to develop each major asset class. Thoseexpected returns make up one component of WSIB’s capital market assumptions. The WSIB uses the capital marketassumptions and their target asset allocation to simulate future investment returns at various future times. The long-termexpected rate of return of 7.5 percent approximately equals the median of the simulated investment returns over a 50-yeartime horizon.
Estimated Rates of Return by Asset Class
Asset ClassTarget
Allocation
% Long-TermExpected RealRate of Return
ArithmeticFixed income %20.00 %1.70Tangible assets %5.00 %4.40Real estate %15.00 %5.80Global equity %37.00 %6.60Private equity %23.00 %9.60
%100.00 %28.10
Sensitivity of NPL
The table below presents the City of University Place's proportionate share of the net pension liability calculated using thediscount rate of 7.5 percent, as well as what the city's proportionate share of the net pension liability would be if it werecalculated using a discount rate that is 1-percentage point lower (6.5 percent) or 1-percentage point higher (8.5 percent) thanthe current rate.
1% Decrease(6.5%)
CurrentDiscount Rate
(7.5%)1% Increase
(8.5%)PERS 1 $ 2,159,680 $ 1,773,861 $ 1,442,091PERS 2/3 $ 4,577,392 $ 1,565,428 $ (740,720)
Page 61

CITY OF UNIVERSITY PLACENOTES TO THE FINANCIAL STATEMENTS
Pension Plan Fiduciary Net Position
Detailed information about the State’s pension plans’ fiduciary net position is available in the separately issued DRS financialreport.
Pension Liabilities (Assets), Pension Expense, and Deferred Outflows of Resources and Deferred Inflows ofResources Related to Pensions
At June 30, 2015, the City of University Place reported a total pension liability of $3,339,289 for its proportionate share ofthe net pension liabilities as follows:
PERS 1 $ 1,773,861PERS 2/3 $ 1,565,428
At June 30, the city's proportionate share of the collective net pension liabilities was as follows:Proportionate
Share6/30/2014
ProportionateShare
6/30/2015Change inProportion
PERS 1 %0.033220 %0.033911 %0.000691PERS 2/3 %0.042771 %0.043812 %0.001041
Employer contribution transmittals received and processed by the DRS for the fiscal year ended June 30 are used as the basisfor determining each employer’s proportionate share of the collective pension amounts reported by the DRS in the Schedulesof Employer and Nonemployer Allocations for all plans.
The collective net pension liability (asset) was measured as of June 30, 2015, and the actuarial valuation date on which thetotal pension liability (asset) is based was as of June 30, 2014, with update procedures used to roll forward the total pensionliability to the measurement date.
Pension Expense
For the year ended December 31, 2015 the city recognized pension expense as follows:Pension Expense
PERS 1 $ (11,821)PERS 2/3 341,133TOTAL $ 329,312
Deferred Outflows of Resources and Deferred Inflows of Resources
At December 31, 2015, the city reported deferred outflows of resources and deferred inflows of resources related to pensionsfrom the following sources:
DeferredOutflows ofResources
DeferredInflows ofResources
Differences between actual and experience PERS 2/3 $ 166,405 $ 417,893Change of assumptions pers 2/3 2,522 -Changes in proportion and differences between contributions and proportionate share
of contributions PERS 2/3 33,495 -Contributions subsequent to the measurement date PERS 2/3 204,724 -Total PERS 2/3 $ 407,146 $ 417,893Differences between actual and experience PERS 1. - 97,050Total all plans $ 407,146 $ 514,943
Deferred outflows of resources related to pensions resulting from the city's contributions subsequent to the measurement datewill be recognized as a reduction of the net pension liability in the year ended December 31, 2015. Other amounts reported asdeferred outflows and deferred inflows of resources related to pensions will be recognized in pension expense as follows:
Page 62

CITY OF UNIVERSITY PLACENOTES TO THE FINANCIAL STATEMENTS
2016 $ 9,8522017 $ 9,8522018 $ 9,8522019 $ 3,9402020 $ -Thereafter $ -
Other Local Government Pension Systems - City of University Place Employee's Retirement Plan
The City Council established a defined contribution retirement plan called the University Place Retirement Plan effectiveAugust 31, 1995 (the date of incorporation) in accordance with Internal Revenue Code Section 401(a). The plan wasestablished as an alternative to the Federal Social Security System and is authorized by the Federal Social Security Act (42USCA, Section 418(g)). In accordance with the provisions of GASB Statement 32, plan balances and activities are notreflected in the financial statements of the City. The City Council is authorized under RCW 41.48.050 to establish or amendthe plan’s provisions and contribution requirements.
The plan is currently administered by ICMA Retirement Corporation. The City Manager is the appointed Trustee of the plan.Covered payroll for 2015 was $3,335,836 and total City payroll for benefit covered employees was $3,746,366. The City’scontribution was $206,822 and the employee’s contribution was $227,444. During 2015, there were a total of 49 individualscovered by this plan. As of the end of the year, 45 remained as active employees of the City. The three inactive employeeshave left the City’s employment and either had been reimbursed their contributions or reimbursement was pending. Sixemployees are on a union retirement plan.
The pension benefits a participant will receive depend only on the amount contributed to the participant’s account andearnings on investments of these contributions. Employees’ self-direct investment amounts to various investment options forboth employee and employer contributions. All contributions are invested in instruments arranged through the ICMARetirement Corporation. The plan assets are not the property of the City and are not subject to the claims of the City’s generalcreditors.
All regular, non-represented employees are required to participate in the City’s 401(a) defined contribution retirement plan.The employee contributes a minimum of 6.0% up to 18.0%, and the City provides a matching contribution of 6.2%.Contributions into the plan are tax deferred. Vesting for the City share of the 401(a) contribution is 33.3%
International Union of Operating Engineers (IUOE)
Employees represented by the bargaining unit of International Union of Operating Engineers (IUOE) participate in the IUOEpension plan. Per collective bargaining agreement, the City contributes 13.7% to the IUOE pension plan and no employeecontribution is required.
NOTE VI. OTHER INFORMATION
A. Other Employee Benefits
Health and Welfare
The City of University Place is a member of the Association of Washington Cities Employee Benefit Trust Health CareProgram (AWC Trust HCP). Chapter 48.62 RCW provides that two or more local government entities may, by Interlocalagreement under Chapter 39.34 RCW, form together or join a pool or organization for the joint purchasing of insurance,and/or joint self-insurance, to the same extent that they may individually purchase insurance, or self-insure.
An agreement to form a pooling arrangement was made pursuant to the provisions of Chapter 39.34 RCW, the InterlocalCooperation Act. The AWC Trust HCP was formed on January 1, 2014 when participating cities, towns, and non-city entitiesof the AWC Employee Benefit Trust in the State of Washington joined together by signing an Interlocal GovernmentalAgreement to jointly self-insure certain health benefit plans and programs for participating employees, their covereddependents and other beneficiaries through a designated account within the Trust.
As of December 31, 2015, 263 cities/towns/non-city entities participate in the AWC Trust HCP.
The AWC Trust HCP allows members to establish a program of joint insurance and provides health and welfare services toall participating members. The AWC Trust HCP pools claims without regard to individual member experience. The pool is
Page 63

CITY OF UNIVERSITY PLACENOTES TO THE FINANCIAL STATEMENTS
actuarially rated each year with the assumption of projected claims run-out for all current members. The AWC Trust HCPincludes medical insurance through Regence BlueShield and Asuris Northwest Health, dental insurance through Delta Dentalof Washington, and vision insurance through Vision Service Plan. Eligible members are cities and towns within the state ofWashington. Non-City Entities (public agency, public corporation, intergovernmental agency, or political subdivision withinthe state of Washington) are eligible to apply for coverage into the AWC Trust HCP, submitting application to the Board ofTrustees for review as required in the Trust Agreement.
Participating employers pay monthly premiums to the AWC Trust HCP. The AWC Trust HCP is responsible for payment ofall covered claims. The AWC Trust HCP purchases stop loss insurance for Regence/Asuris plans at an Individual Stop Loss(ISL) of $1.5 million through Life Map, and Group Health ISL at $750,000 through Sun Life. The aggregate policy is for200% of expected medical claims.
Participating employers contract to remain in the AWC HCP for a minimum of three years. Participating employers with over250 employees must provide written notice of termination of all coverage a minimum of 12 months in advance of thetermination date, and participating employers with under 250 employees must provide written notice of termination of allcoverage a minimum of 6 months in advance of termination date. When all coverage is being terminated, termination willonly occur on December 31. Participating employers terminating a group or line of coverage must notify the HCP a minimumof 60 days prior to termination. A participating employer’s termination will not obligate that member to past debts, or furthercontributions to the HCP. Similarly, the terminating member forfeits all rights and interest to the HCP Account.
The operations of the Health Care Program are managed by the Board of Trustees or its delegates. The Board of Trustees iscomprised of four regionally elected officials from Trust member cities or towns, the Employee Benefit Advisory CommitteeChair and Vice Chair, and the AWC Board of Directors President and Vice President. The Trustees or its appointed delegatesreview and analyze Health Care Program related matters and make operational decisions regarding premium contributions,reserves, plan options and benefits in compliance with Chapter 48.62 RCW. The Board of Trustees has decision authorityconsistent with the Trust Agreement, Health Care Program policies, Chapter 48.62 RCW and Chapter 200-110-WAC.
The accounting records of the Trust HCP are maintained in accordance with methods prescribed by the State Auditor’s officeunder the authority of Chapter 43.09 RCW. The Trust HCP also follows applicable accounting standards established by theGovernmental Accounting Standards Board (“GASB”). Year-end financial reporting is done on an accrual basis andsubmitted to the Office of the State Auditor as required by Chapter 200-110 WAC. The audit report for the AWC Trust HCPis available from the Washington State Auditor’s office.
For the employees of the City of University Place, per the contract through the Trust to the insurance company, the employermust pay 50% of the premium for medical insurance however the employer does not have a requirement to pay a minimumlevel for dependents. For dental (WDS/Willamette) the Trust requires the employer to pay 75% of the employee, spouse, anddependent premium. For vision (VSP) the Trust requires the employer to pay 100% of the employee premium. Since this isfull family coverage, the payment actually is the same for the employee and anyone in the family that is covered. The City’scontributions to the Trust for the year ended December 31, 2015 were $662,488 for Medical, $67,106 for Dental and $10,008for Vision which equaled the required contributions of that year.
Long-term Disability
The City also provides insurance payments (approximately 1%) for all full-time employees for long-term disability, survivor,accidental death and dismemberment, and lump sum death benefit coverage.
Deferred Compensation
The City offers employees a deferred compensation plan created in accordance with Internal Revenue Code Section 457.These plans permit City employees to defer a portion of their salary into future years. The deferred compensation is notavailable until termination, retirement, death, or unforeseeable emergency. Employees may choose to have their planadministered by the State of Washington Deferred Compensation Program (DCP), ICMA Retirement Corporation,Nationwide Retirement Solutions, or Teachers Insurance and Annuity Association/College Retirement Equity Fund (TIAA-CREF). The plan became effective June 14, 1995.
In accordance with GASB Statement 32, the assets of the deferred compensation plans are no longer presented in the City’sfinancial statements. Due to recent changes in the tax law as set forth in the Internal Revenue Code, these assets are not theproperty of the City or subject to the claims of the City’s general creditors.
Page 64

CITY OF UNIVERSITY PLACENOTES TO THE FINANCIAL STATEMENTS
B. Other Post-Employment Benefits
Association of Washington Cities Benefit Trust ("Trust")
Trust Description. The City is a Participating Employer in the Association of Washington Cities Employee Benefit Trust(“Trust”), a cost-sharing multiple-employer welfare benefit plan administered by the Association of Washington Cities. TheTrust provides medical benefits to certain eligible retired employees of Participating Employers and their eligible familymembers. Under Article VII of the Trust document, the Trustees have the authority and power to amend the amount and thenature of the medical and other benefits provided by the Trust. The Trust issues a publicly available financial report includesfinancial statements and requires supplementary information for Trust. That report along with a copy of the Trust documentmay be obtained by writing to Trust at 1076 Franklin Street SE, Olympia, WA 98501-1346 or by calling 1-800-562-8981.
Funding Policy. The Trust provides that contribution requirements of Participating Employers and of participating employees,retirees and other beneficiaries, if any, are established and may be amended by the Board of Trustees of the Trust. Retirees ofthe City receiving medical benefits from the Trust contribute the following monthly amounts:
Health First - 1000 Health First - 2500$871.51 for non-Medicare enrolled retiree coverage $760.96 for non-Medicare enrolled retiree coverage$879.12 for non-Medicare enrolled spouse coverage $766.49 for non-Medicare enrolled spouse coverageN/A for Medicare enrolled retiree coverage N/A for medicare enrolled retiree coverageN/A for non-Medicare enrolled spouse coverage N/A for non-Medicare enrolled spouse coverage
Participating Employers are not contractually required to contribute at the rates assessed each year for non-LEOFF I retirees.The retiree pays for 100% of the premium.
Retirement Health Savings
The city also offers employees a Retirement Health Savings (RHS) plan for all benefit eligible employees. RHS is a plan toprovide tax-free savings during employment for payment of medical insurance premiums and other qualified post-employmentmedical expenses allowable under IRC Section 213. The RHS plan is considered to be an HRA (Health ReimbursementAccount), and as such Retirement Health Savings plans are unique. As compared to other retirement fund accounts, RHSaccumulates on a tax deferred basis and the proceeds are tax free upon withdrawal.
The plan is administered by ICMA Retirement Corporation. The City Manager is the appointed Trustee of the plan.
Until 2007, an employee could make the individual choice to join RHS and determine the amount to be contributed into theaccount. In April of 2007, the Internal Revenue Service issued a revenue ruling that created a uniform rule set for all HRAaccounts. As a result of this ruling, the City had to organize itself into several groups and the affected employees within eachgroup had to decide if they wanted to opt in at a predetermined amount or completely opt out of the system. The City wasorganized into the following groups: executive team, management team, union staff, line staff, and finally the City Council.
A mandatory city-wide vote was conducted to determine if employees would participate in RHS. This vote was finalized onDecember 6, 2007. With the exception of the City Council group, which opted out of RHS, groups had over a 60% consensusfor opting into the RHS program. The resolution was then brought before the City Council on December 17, 2007 and wasunanimously passed. The revised RHS plan took effect on January 1, 2008. A vote was taken again in 2011 and allparticipating groups opted to continue their participation at the existing rates. The following is a breakdown of what percentof salary each group decided to participate at:
Executive team %3.5Management team %3.0Union staff %2.0Line staff %1.5
The total amount contributed by employees in 2015 was $96,585.
Page 65

CITY OF UNIVERSITY PLACENOTES TO THE FINANCIAL STATEMENTS
C. Property Taxes
The County Treasurer acts as an agent to collect property taxes levied in the County for all taxing authorities. Collections aredue on approximately the 10th of each month for the prior month’s collections.
Property Tax CalendarJanuary 1 Taxes are levied and become an enforceable lien against properties.February 14 Tax bills are mailed.April 30 First of two equal installment payments is due.May 31 Assessed value of property is established for next year's levy at 100 percent of market value.October 31 Second installment is due.
During the year, property tax revenues are recognized when payments are received from the County. At year end, property taxrevenues are recognized for collections expected to occur within 60 days. Unpaid property taxes are recorded as delinquenttaxes receivable, offset by deferred inflows. No allowance for uncollectible taxes is established because delinquent taxes areconsidered fully collectible. The City may levy up to $3.60 per $1,000 of assessed valuation for general governmentalservices, subject to two limitations:
Washington State (RCW 84.55.010) limits the growth of regular property taxes to six percent per year, after adjustmentfor new construction. If the assessed valuation increases by more than six percent due to reevaluation, the levy rate willbe reduced.
The Washington State Constitution limits the total regular property taxes to one percent of assessed valuation or $10 per$1,000 of value. If the taxes of all districts exceed this amount, each is proportionately reduced until the total is at orbelow the 1 percent limit.
Special property tax levies approved by the voters are not subject to the above limitations.
The City's regular tax levy for 2015 was $1.35 per $1,000 on an assessed valuation of $3,006,817,787 for a total regular levyof $4,045,432.
D. Risk Management
The City of University Place is a member of the Washington Cities Insurance Authority (WCIA).
Utilizing Chapter 48.62 RCW (self-insurance regulation) and Chapter 39.34 RCW (Interlocal Cooperation Act), nine citiesoriginally formed WCIA on January 1, 1981. WCIA was created for the purpose of providing a pooling mechanism for jointlypurchasing insurance, jointly self-insuring, and/or jointly contracting for risk management services. WCIA has a total of 175members.
New members initially contract for a three-year term, and thereafter automatically renew on an annual basis. A one-yearwithdrawal notice is required before membership can be terminated. Termination does not relieve a former member from itsunresolved loss history incurred during membership.
Liability coverage is written on an occurrence basis, without deductibles. Coverage includes general, automobile, police,public officials’ errors or omissions, stop gap, and employee benefits liability. Limits are $4 million per occurrence self-insured layer and $16 million per occurrence in the re-insured excess layer. The excess layer is insured by the purchase ofreinsurance and insurance. Total limits are $20 million per occurrence subject to aggregate sub limits in the excess layers. TheBoard of Directors determines the limits and terms of coverage annually.
Insurance coverage for property, automobile physical damage, fidelity, inland marine, and boiler and machinery are purchasedon a group basis. Various deductibles apply by type of coverage. Property insurance and auto physical damage are self-fundedfrom the members’ deductible to $750,000, for all perils other than flood and earthquake, and insured above that amount bythe purchase of insurance.
In-house services include risk management consultation, loss control field services, claims and litigation administration, andloss analyses. WCIA contracts for the claims investigation consultants for personnel issues and land use problems, insurancebrokerage, and lobbyist services.
WCIA is fully funded by its members, who make annual assessments on a prospectively rated basis, as determined by anoutside, independent actuary. The assessment covers loss, loss adjustment, and administrative expenses. As outlined in the
Page 66

CITY OF UNIVERSITY PLACENOTES TO THE FINANCIAL STATEMENTS
interlocal, WCIA retains the right to additionally assess the membership for any funding shortfall.
An investment committee, using investment brokers, produces additional revenue by investment of WCIA’s assets in financialinstruments which comply with all State guidelines.
A Board of Directors governs WCIA; which is comprised of one designated representative from each member. The Boardelects an Executive Committee and appoints a Treasurer to provide general policy direction for the organization. The WCIAExecutive Director reports to the Executive Committee and is responsible for conducting the day-to-day operations of WCIA.
The City’s industrial insurance is provided by Washington State and is administered by the Department of Labor andIndustries. Coverage is purchased by means of standard rates per working hour and is computed by the total number of hoursworked by employees multiplied by the basic premium rate assigned to the business risk classification. The following arebenefits provided by industrial insurance: medical services, damaged clothing, travel expenses, time-loss payments,vocational rehabilitation, partial disability awards, pension awards, and survivor benefits.
The City is self-insured for unemployment insurance purposes. The City’s plan is administered through Washington StateEmployment Security Department, which provides partial compensation to workers who are temporarily and involuntarilyunemployed. The City reimburses the Washington State Employment Security Department in full for any payments made toformer employees.
Risk Management Fund
The City established the Risk Management Fund as an Internal Service Fund to pay insurance premiums, claims, anddeductibles for the above areas of risk, as well as to establish reserves for self-insurance and uncovered losses. City operatingfunds contribute to the Insurance Fund based on information from the contributing funds past claims experience and lossexposures. In the past three years, none of the settlements exceeded the City’s insurance coverage. The Risk ManagementFund reserves for December 31, 2015 and 2014 were as follows:
2015 2014Beginning of year $ - $ -Additions 124,123 116,474Deletions (124,123) (116,474)End of Year $ - $ -
E. Estimated Arbitrage Rebate
The Federal Tax Reform Act of 1986 requires issuers of tax-exempt debt of over $5 million to make payments to the UnitedStates Treasury of investment interest received at yields that exceed the issuer’s tax-exempt borrowing rates. Payments ofarbitrage rebate amounts due under these regulations must be made to the U.S. Treasury every five years. The City’sestimated rebatable arbitrage amount as of December 31, 2015 is $0 for its tax-exempt general obligation bond issues subjectto the Tax Reform Act issued through that date.
F. Contingent Liabilities
Amounts received or receivable from grant agencies are subject to audit and adjustment by grantor agencies, principally thefederal government. Any disallowed claims, including amounts already collected, may constitute a liability of the applicablefunds. The amount, if any, of expenditures that may be disallowed by the grantor cannot be determined at this time, althoughthe government expects such amounts, if any, to be immaterial.
At the close of 2015, there were a small number of claims for damages and lawsuits pending against the City. Although theoutcome of these lawsuits is not presently determinable, in the opinion of the City’s counsel, the resolution of these matterswill not have a material adverse effect on the financial condition of the government.
G. Transportation Benefit District
In 1987, the State Legislature created Transportation Benefit Districts (TBDs) as an option for local governments to fundtransportation improvements. Chapter 36.73 of the Revised Code of Washington provides for the establishment of TBD bycities and counties for the sole purpose of acquiring, constructing, improving, providing, and funding transportationimprovements within the district.
The University Place Transportation Benefit District (UPTBD) was created on December 2, 2013. The UPTBD GoverningBoard is comprised of all University Place City Councilmembers. The University Place Transportation Benefit District Board
Page 67

CITY OF UNIVERSITY PLACENOTES TO THE FINANCIAL STATEMENTS
authorized a vehicle license fee of $20. In July of 2014, the Washington State Department of Licensing began collecting thevehicle license fee on behalf of the UPTBD to fund maintenance, preservation, and safety enhancements to University Place’sexisting transportation network.
The 2015 Legislature adopted Second Engrossed Substitute Senate Bill (“2ESSB”) 5987 which authorizes any city in which atransportation benefit district (“TBD”) has been established pursuant to chapter 36.73 RCW with boundaries coterminouswith the boundaries of the city to assume the rights, powers, functions, and obligations of the TBD, by adoption of anordinance or resolution of the city legislative authority.
On November 16, 2015 the City Council passed Ordinance 660 assuming the rights, powers, functions and obligations of theUniversity Place Transportation Benefit District. The ordinance did not change any collection amounts or the use of the fundsas originally adopted by the City Council.
Note VII. BEGINNING NET POSITION AND FUND BALANCE ADJUSTMENTS AND OTHER CHANGES
The City's Fund balance, beginning of year for the General fund has been restated in the statement of Revenues, Expenditures,and Changes in Fund Balances Governmental Funds, to account for a correction in the amount accrued for deferred revenue atthat date. The deferred revenue accrual was determined to be overstated by $87,030, resulting in an overstatement of theCity's fund balance of an equal amount. This restatement effects the governmental fund financial statements only becauseunavailable revenue from property taxes are not considered revenue until collectable under its modified accrual basisapproach and the City-wide financial statements, which uses a full accrual basis approach considers available revenue forproperty taxes financial resources for governmental activities.
The City's LRF fund's beginning fund balance was restated due to an error in recording accured interest payable on the fundfinancial statements in error. This should only be recorded on the City-wide statements which uses a full accrual basisapproach considers dunavailable revenue for property taxes financial resources for governmental activities
The City's Fleet & Equipment fund and Information Technology & Services funds beginning net position has been restatedbecasue of an error in overstating accumulated depreciation and depreciation expense. These funds beginning net positionhave increased by $45,109 and $22,576 respectively.
All additional prior period adjustment amounts are explained in Note 1B with the implementation of GASB 68 & 71.
Page 68

City of University PlaceSchedule of Revenues, Expenditures, and Changes in Fund Balances
Budget (GAAP Basis) and ActualGeneral Fund
For the Year Ended December 31, 2015
Budgeted Amounts
Original Final Actual
Variance withFinal Budget
Positive(Negative)
RevenuesTaxes $ 5,269,750 $ 5,328,750 $ 6,114,393 $ 785,643Licenses and permits 2,278,200 2,485,095 2,614,487 129,392Intergovernmental 248,870 248,870 437,338 188,468Charges for services 430,073 430,073 397,322 (32,751)Miscellaneous
Fines and forfeitures - - 361 361Rental, concessions and sales 69,350 69,350 52,928 (16,422)Investment earnings 20,300 20,300 42,489 22,189Other revenues 6,001 6,001 4,972 (1,029)
Total revenues 8,322,544 8,588,439 9,664,290 1,075,851
ExpendituresCurrent
General government 3,012,742 3,084,096 2,547,087 537,009Public safety - - 3,231 (3,231)Transportation 268,951 268,951 265,632 3,319Natural and economic environment 462,449 711,511 349,449 362,062Culture and recreation 123,410 123,410 96,591 26,819
Total expenditures 3,867,552 4,187,968 3,261,990 925,978Excess (deficiency) of revenues over expenditures 4,454,992 4,400,471 6,402,300 149,873
Other financing sources/usesTransfers out (4,340,789) (5,335,329) (3,993,956) 1,341,373Proceeds from sale of assets 120,000 1,133,235 120,000 (1,013,235)
Total other financing sources/uses (4,220,789) (4,202,094) (3,873,956) 328,138Net change in budgetary fund balances 234,203 198,377 2,528,344 478,011Fund balances, beginning of year 1,101,982 1,398,892 5,633,563 4,234,671Prior period adjustments - - (88,659) (88,659)
Fund balance, beginning of year restated 1,101,982 1,398,892 5,544,904 4,146,012Fund balances, end of year $ 1,336,185 $ 1,597,269 8,073,248 $ 4,624,023
Perspective Difference Reconciliation:Actual fund balance-general fund schedule of revenues, expenditures, and changes infund balance $ 8,073,248The following funds were budgeted as special revenue fundsbut do not meet the definition of a special revenue fundunder GASB Statement 54 and therefore are accounted forwithin the General Fund
Police and Public Safety 1,471,411Parks and Recreation (1,176,580)Development Service Fund (730,788)Strategic Reserve Fund 856,934
Total fund balance - general fund balance sheet for governmental funds $ 8,494,225
Page 69

City of University PlaceSchedule of Revenues, Expenditures, and Changes in Fund Balances
Budget (GAAP Basis) and ActualLRF
For the Year Ended December 31, 2015
Budgeted Amounts
Original Final Actual
Variance withFinal Budget
Positive(Negative)
RevenuesTaxes $ 500,000 $ 500,000 $ 522,937 $ 22,937
Total revenues 500,000 500,000 522,937 22,937
ExpendituresDebt service
Principal retirement 150,000 150,000 150,000 -Interest 252,000 252,200 247,913 4,287
Total expenditures 402,000 402,200 397,913 4,287Excess (deficiency) of revenues over
expenditures 98,000 97,800 125,024 18,650
Other financing sources/usesTransfers in - - 2,001 2,001Transfers out (98,000) (1,886,320) (345,136) 1,541,184
Total other financing sources/uses (98,000) (1,886,320) (343,135) 1,543,185
Net change in fund balances - (1,788,520) (218,111) 1,561,835Fund balances, beginning of year - (1) 1,768,026 1,768,027LRF Prior Period Adjustments - - 20,493 -
Fund balances, beginning of year restated - (1) 1,788,519 1,768,027Fund balances, end of year $ - $ (1,788,521) $ 1,570,408 $ 3,329,862
Page 70

City of University PlaceSchedule of Proportionate Share of the Net Pension Liability
Public Employee's Retirement System Plan 1As of June 30, 2015
Last 10 Fiscal Years*
2015Employer's proportion of the net pension liability (asset) %0.033911Employer's proportionate share of the net pension liability $ 1,565,428
Total $ 1,565,428
Employer's covered employee payroll $ 3,880,652Employer's proportionate share of the net pension
liability as a percentage of covered employee payroll %40.34Plan fiduciary net position as a percentage of the total pension liability %89.20
* Until a full 10-year trend is compiled, the City will not represent informationfor those years for which information is not available.
Page 71

City of University PlaceSchedule of Proportionate Share of the Net Pension Liability
Public Employee's Retirement System Plans 2 and 3As of June 30, 2015
Last 10 Fiscal Years*
2015Employer's proportion of the net pension liability (asset) %0.043812Employer's proportionate share of the net pension liability $ 1,565,428
Total $ 1,565,428
Employer's covered employee payroll $ 3,880,652Employer's proportionate share of the net pension
liability as a percentage of covered employee payroll %40.34Plan fiduciary net position as a percentage of the total pension liability %89.20
* Until a full 10-year trend is compiled, the City will not represent informationfor those years for which information is not available
Page 72

City of University PlaceSchedule of Employer Contributions
Public Employee's Retirement System Plans 2 and 3As of December 31, 2015
Last 10 Fiscal Years*
2015Statutorily or contractually required contributions $ 372,832Contributions in relation to the statutorily or contractually required contributions $ (372,832)
Contribution deficiency (excess) $ -
Covered employee payroll $ 3,830,087Contributions as a percentage of covered payroll %9.73
* Until a full 10-year trend is compiled, the City will not represent informationfor those years for which information is not availabl.
Page 73

City of University PlaceNotes to the Required Supplementary Information
Budgetary InformationThe City's biennial budget is adopted on a basis consistent with Generally Accepted Accounting Principles (GAAP) for allgovernmental funds.
Public Employee's Retirement System Plan 1 The City had no Plan 1 contributions during 2015 and therefore has omitted the schedule of employer contributions for Plan1.
Page 74


Fund Financial Statements
Non-Major Governmental Funds
Special Revenue FundsThese funds account for the proceeds of specific revenue sources other than special assessments, expendable trust, or majorcapital projects. These revenues finance particular activities or functions as required by law or administrative regulations. TheCity of University Place’s Non-major Special Revenue Funds are summarized below.
Street FundThe Street Fund was established in accordance with RCW 35A.37.010 to account for maintenance and improvement of theCity’s street and traffic control systems.
Arterial Street FundThe Arterial Street Fund was established in accordance with RCW 82.36.020 for the administration of the State-levied motorvehicle fuel tax. These revenues are to be used for the construction, improvement, chip sealing, seal coating, and repair ofarterial highways and city streets, or for the payment of related municipal debt.
Real Estate Excise Tax FundThe REET fund accounts for the receipt and disbursement of the .25% real estate excise tax that is dedicated for capitalpurposes including public buildings and facilities, parks and debt service associated with such capital oriented projects. Thefund also accounts for the receipt and expenditure of the additional .25% real estate excise tax authorized by the GrowthManagement Act. These revenues are restricted to financing capital projects that are specified in the capital facilities plan.
Traffic Impact Fee FundThe Traffic Impact Fee Fund was established in accordance with RCW 82.02.050 to account for fees received fromdevelopers whose projects trigger the imposition of these fees. The fees pay for the incremental impact of the traffic generatedby that construction. The funds are restricted for use in construction of specific roadway improvements identified in theenabling ordinances.
Transportation Benefit District FundThe Transportation Benefit District Fund was established to account for vehicle license fees collected. The fees are collectedto fund maintenance, preservation, and safety enhancements to University Place’s existing transportation network.
Path and Trails Reserve FundThe Path and Trails Reserve Fund was established in accordance with State law to accumulate unexpended proceeds of theCity’s one-half percent motor vehicle fuel tax receipts that are restricted in use to the construction and maintenance of pathand trails within City right-of-way.
Donations FundThe Donations Fund was established to receive donations designated for specific purposes identified by the donor.
Capital Projects FundsThese funds are used to account for the acquisition or development of major facilities, except those projects financed byproprietary funds. Sources of these funds include general obligation bond proceeds, federal and state grants, general propertytaxes, interest earnings, and transfers from other funds.
Parks Capital Projects FundThe Parks Capital Projects Fund accounts for receipts and disbursements related to acquisitions, design, construction, and anyother related park capital project expenditures. Fund appropriations do not lapse at the end of any calendar year, but remain ineffect until such projects are complete. All Parks costs associated with acquisitions, improvements, issuance of bonds, andother costs shall be paid by this fund.
Municipal Facilities Capital Projects FundThe Municipal Facilities Capital Projects Fund was established to account for receipts and disbursements of bond proceedsfrom the 1996 Limited Tax General Obligation Bond approved by Council.
Page 76

City of University PlaceCombining Balance Sheet
Nonmajor Governmental FundsDecember 31, 2015
(Unaudited)Total NonmajorSpecial Revenue
Funds
Total NonmajorCapital Projects
Funds
Total NonmajorGovernmental
Funds
AssetsCash and equivalents $ 2,118,955 $ 693,483 $ 2,812,438Accounts receivables 84,694 11,537 96,231Due from other government units 115,987 - 115,987
Total assets $ 2,319,636 $ 705,020 $ 3,024,656
Liabilities and fund balanceLiabilities
Accounts payable $ 48,588 $ 29,232 $ 77,820Accrued salaries and wages 6,407 - 6,407Unearned revenue 83,068 6,294 89,362
Total liabilities 138,063 35,526 173,589
Fund balancesRestricted
Arterial street maintenance 16,519 - 16,519Capital facilities plan financing 960,329 - 960,329Traffic impact-roadway improvements 778,332 - 778,332Transportation improvement projects 392,213 - 392,213Donations 34,180 - 34,180Parks capital improvement - 669,494 669,494
Total fund balances 2,181,573 669,494 2,851,067Total liabilities and fund balance $ 2,319,636 $ 705,020 $ 3,024,656
Page 77

City of University PlaceCombining Statement of Revenues, Expenditures, and Changes in Fund Balances
Nonmajor Governmental FundsFor the Year Ended December 31, 2015
(Unaudited)Total NonmajorSpecial Revenue
Funds
Total NonmajorCapital Projects
Funds
Total NonmajorGovernmental
Funds
RevenuesTaxes $ 2,305,503 $ - $ 2,305,503Charges for services 231,843 270,089 501,932Miscellaneous
Rental, concessions and sales 320 - 320Contribution in aid for constructions - 25,000 25,000Contributions 20,691 - 20,691Other revenues 28,163 - 28,163State grants and entitlements - 5,333 5,333
Total revenues 2,586,520 300,422 2,886,942
ExpendituresCurrent
General government 41,829 - 41,829Transportation 1,253,552 - 1,253,552Natural and economic environment 307 - 307Culture and recreation 20,764 1,275 22,039
Capital outlay - 174,001 174,001Total expenditures 1,316,452 175,276 1,491,728
Excess (deficiency) of revenues over expenditures 1,270,068 125,146 1,395,214
Other financing sources/usesTransfers in 489,396 67,288 556,684Transfers out (1,568,565) - (1,568,565)Insurance recovery - 27,768 27,768
Total other financing sources/uses (1,079,169) 95,056 (984,113)
Net change in fund balances 190,899 220,202 411,101
Fund balances, beginning of year 1,990,674 449,292 2,439,966Fund balances, end of year $ 2,181,573 $ 669,494 $ 2,851,067
Page 78

City of University PlaceCombining Balance Sheet
Nonmajor Special Revenue FundsDecember 31, 2015
(Unaudited)
StreetArterialStreet
Real EstateExcise Tax
TrafficImpact Fees
TransportationBenefitDistrict
Path andTrails
ReserveFund
DonationsFund
TotalNonmajor
SpecialRevenue
Funds
AssetsCash and equivalents $ 59,098 $ - $ 926,929 $ 736,225 $ 361,978 $ - $ 34,724 $ 2,118,954Accounts receivables 1,483 - - 83,068 - - 142 84,693Due from other government units 35,834 16,519 33,400 - 30,235 - - 115,988
Total assets $ 96,415 $ 16,519 $ 960,329 $ 819,293 $ 392,213 $ - $ 34,866 $ 2,319,635
Liabilities and fund balanceLiabilities
Accounts payable $ 47,901 $ - $ - $ - $ - $ - $ 686 $ 48,587Accrued salaries and wages 6,407 - - - - - - 6,407Unearned revenue - - - 83,068 - - - 83,068
Total liabilities 54,308 - - 83,068 - - 686 138,062
Fund balancesRestricted
Arterial street maintenance - 16,519 - - - - - 16,519Capital facilities plan financing - - 960,329 - - - - 960,329Traffic impact-roadway improvements 42,107 - - 736,225 - - - 778,332Transportation improvement projects - - - - 392,213 - - 392,213Donations - - - - - - 34,180 34,180
Total fund balances 42,107 16,519 960,329 736,225 392,213 - 34,180 2,181,573
Total liabilities and fund balance $ 96,415 $ 16,519 $ 960,329 $ 819,293 $ 392,213 $ - $ 34,866 $ 2,319,635
Page 79

City of University PlaceCombining Statement of Revenues, Expenditures, and Changes in Fund Balances
Nonmajor Special Revenue FundsFor the Year Ended December 31, 2015
(Unaudited)
StreetArterialStreet
Real EstateExcise Tax
TrafficImpact Fees
TransportationBenefitDistrict
Path andTrails
ReserveFund
DonationsFund
TotalNonmajor
SpecialRevenue
Funds
RevenuesTaxes $ 456,030 $ 207,227 $ 1,238,266 $ 9,268 $ 394,713 $ - $ - $ 2,305,504Charges for services 175,626 - - 56,112 - - 105 231,843Miscellaneous
Rental, concessions and sales - - - - - - 320 320Contributions - - - - - - 20,691 20,691Other revenues 28,163 - - - - - - 28,163
Total revenues $ 659,819 $ 207,227 $ 1,238,266 $ 65,380 $ 394,713 $ - $ 21,116 $ 2,586,521
ExpendituresCurrent
General government $ 39,329 $ - $ - $ - $ 2,500 $ - $ - $ 41,829Transportation 1,077,926 - - - 175,626 - - 1,253,552Natural and economic environment - - - - - - 307 307Culture and recreation - - - - - - 20,764 20,764
Total expenditures 1,117,255 - - - 178,126 - 21,071 1,316,452Excess (deficiency) of revenues over
expenditures (457,436) 207,227 1,238,266 65,380 216,587 - 45 1,270,069
Other financing sources/usesTransfers in 489,395 - - - - - - 489,395Transfers out - (206,855) (793,551) (530,000) - - (38,159) (1,568,565)
Total other financing sources/uses 489,395 (206,855) (793,551) (530,000) - - (38,159) (1,079,170)
Net change in fund balances 31,959 372 444,715 (464,620) 216,587 - (38,114) 190,899
Fund balances, beginning of year 10,148 16,147 515,614 1,200,845 175,626 - 72,294 1,990,674
Prior period adjustmentsFund balances, end of year $ 42,107 $ 16,519 $ 960,329 $ 736,225 $ 392,213 $ - $ 34,180 $ 2,181,573
Page 80

City of University PlaceCombining Balance Sheet
Nonmajor Capital Projects FundsDecember 31, 2015
(Unaudited)
Parks CIPMunicipal
Facilities CIP
Total NonmajorCapital Projects
Funds
AssetsCash and equivalents $ 693,483 $ - $ 693,483Accounts receivables 11,537 - 11,537
Total assets $ 705,020 $ - $ 705,020
Liabilities and fund balanceLiabilities
Accounts payable $ 29,232 $ - $ 29,232Unearned revenue 6,294 - 6,294
Total liabilities 35,526 - 35,526
Fund balancesRestricted
Parks capital improvement 669,494 - 669,494
Total fund balances 669,494 - 669,494
Total liabilities and fund balance $ 705,020 $ - $ 705,020
Page 81

City of University PlaceCombining Statement of Revenues, Expenditures, and Changes in Fund Balances
Nonmajor Capital Projects FundsDecember 31, 2015
(Unaudited)
Parks CIPMunicipal
Facilities CIP
Total NonmajorCapital Projects
Funds
RevenuesCharges for services $ 270,089 $ - $ 270,089Miscellaneous
Contribution in aid for constructions 25,000 - 25,000State grants and entitlements 5,333 - 5,333
Total revenues 300,422 - 300,422
Expenditures
CurrentCulture and recreation 1,275 - 1,275
Capital outlay 144,872 29,129 174,001Total expenditures 146,147 29,129 175,276
Excess (deficiency) of revenues over expenditures 154,275 (29,129) 125,146
Other financing sources/usesTransfers in 38,159 29,129 67,288Insurance recovery 27,768 - 27,768
Total other financing sources/uses 65,927 29,129 95,056Net change in fund balances 220,202 - 220,202
Fund balances, beginning of year 449,292 - 449,292Fund balances, end of year $ 669,494 $ - $ 669,494
Page 82

Budgetary Comparison Schedule
Non-Major Governmental Funds
Non-Major Governmental Budgetary Comparison Statements include the following:
Special Revenue Funds Street Fund Arterial Street Fund Real Estate Excise Tax Fund Traffic Impact Fund Transportation Benefit District Path and Trails Reserve Fund Donations Fund
Capital Project Funds Parks Capital Projects Fund Public Works Capital Projects Fund Municipal Facilities Capital Projects Fund
Debt Service FundManagerial Funds for Budgetary Purposes
These funds account for the proceeds of specific revenue sources other than special assessments, expendable trust, or majorcapital projects. These revenues finance particular activities or functions as required by law or administrative regulations. TheCity of University Place’s Managerial Funds that are not classified as Special Revenue Funds are summarized below.
Parks and Recreation FundThe Parks and Recreation Fund was established to identify revenues and expenditures related to the operation of Parks andRecreation. Recreation is being funded primarily through user fees from the programs, donations and revenue fromfundraising events. The administration of Recreation is funded by a transfer from the General Fund. Parks maintenance isfunded through a transfer from the General Fund.
Development Services FundThe Development Services Fund was established to identify revenues and expenditures related to planning, building andengineering associated with private development. Non fee supported activities (including, but not limited to, long rangeplanning, customer service, general administration and special projects management) are funded by a transfer from theGeneral Fund.
Police and Public Safety FundThe Police and Public Safety Fund was established to identify revenues and expenditures related to police services, courtservices, jail services, city attorney’s office, crime prevention, animal control, code enforcement, and emergencymanagement. It is funded through property taxes, revenues identified by state statutes collected in support of public safety,fines and forfeitures, pet license fees, and grants.
Strategic Reserve FundThe Strategic Reserve Fund was established by ordinance to set aside financial resources for mitigating adverse situationscaused by severe short-term revenue shortfalls, expenditures resulting from emergencies, or as otherwise designated by theCity Council. Per City Ordinance 179, the fund is financed by transferring undesignated and unreserved fund balance, (nowclassified as unassigned fund balance by GASB 54) in the General Fund at the end of each calendar year or by otherappropriation, as deemed appropriate by the City Council. This fund is a recourse of last resort and shall be used only whenno other reasonable financial management alternative exists.
Page 83

City of University PlaceSchedule of Revenues, Expenditures, and Changes in Fund Balances
Budget (GAAP Basis) and ActualStreet
For the Year Ended December 31, 2015
Budgeted Amounts
Original Final Actual
Variance withFinal Budget
Positive(Negative)
RevenuesTaxes $ 448,300 $ 448,300 $ 456,030 $ 7,730Charges for services - 175,626 175,626 -Miscellaneous
Other revenues 10,000 10,000 28,163 18,163Total revenues 458,300 633,926 659,819 25,893
ExpendituresCurrent
General government 45,277 45,277 39,329 5,948Transportation 1,066,201 1,131,014 1,077,926 53,088
Total expenditures 1,111,478 1,176,291 1,117,255 59,036Excess (deficiency) of revenues over
expenditures (653,178) (542,365) (457,436) (33,143)
Other financing sources/usesTransfers in 653,178 532,216 489,395 (42,821)
Total other financing sources/uses 653,178 532,216 489,395 (42,821)
Net change in fund balances - (10,149) 31,959 (75,964)Fund balances, beginning of year - - 10,148 10,148Fund balances, end of year $ - $ (10,149) $ 42,107 $ (65,816)
Page 84

City of University PlaceSchedule of Revenues, Expenditures, and Changes in Fund Balances
Budget (GAAP Basis) and ActualArterial Street
For the Year Ended December 31, 2015
Budgeted Amounts
Original Final Actual
Variance withFinal Budget
Positive(Negative)
RevenuesTaxes $ 212,000 $ 212,000 $ 207,227 $ (4,773)
Total revenues 212,000 212,000 207,227 (4,773)
ExpendituresExcess (deficiency) of revenues over
expenditures 212,000 212,000 207,227 (4,773)
Other financing sources/usesTransfers out (212,000) (212,000) (206,855) 5,145
Total other financing sources/uses (212,000) (212,000) (206,855) 5,145
Net change in fund balances - - 372 372Fund balances, beginning of year - 3,736 16,147 12,411Fund balances, end of year $ - $ 3,736 $ 16,519 $ 12,783
Page 85

City of University PlaceSchedule of Revenues, Expenditures, and Changes in Fund Balances
Budget (GAAP Basis) and ActualReal Estate Excise Tax
For the Year Ended December 31, 2015
Budgeted Amounts
Original Final Actual
Variance withFinal Budget
Positive(Negative)
RevenuesTaxes $ 630,000 $ 630,000 $ 1,238,266 $ 608,266
Total revenues 630,000 630,000 1,238,266 608,266
ExpendituresExcess (deficiency) of revenues over
expenditures 630,000 630,000 1,238,266 608,266
Other financing sources/usesTransfers out (694,323) (794,323) (793,551) 772
Total other financing sources/uses (694,323) (794,323) (793,551) 772
Net change in fund balances (64,323) (164,323) 444,715 609,038Fund balances, beginning of year 21,830 1,465,477 515,614 (949,863)Fund balances, end of year $ (42,493) $ 1,301,154 $ 960,329 $ (340,825)
Page 86

City of University PlaceSchedule of Revenues, Expenditures, and Changes in Fund Balances
Budget (GAAP Basis) and ActualTraffic Impact Fees
For the Year Ended December 31, 2015
Budgeted Amounts
Original Final Actual
Variance withFinal Budget
Positive(Negative)
RevenuesTaxes $ - $ - $ 9,268 $ 9,268Charges for services 120,000 120,000 56,112 (63,888)
Total revenues 120,000 120,000 65,380 (54,620)
ExpendituresExcess (deficiency) of revenues over
expenditures 120,000 120,000 65,380 (54,620)
Other financing sources/usesTransfers out (450,000) (530,000) (530,000) -
Total other financing sources/uses (450,000) (530,000) (530,000) -
Net change in fund balances (330,000) (410,000) (464,620) (54,620)Fund balances, beginning of year 947,588 880,347 1,200,845 320,498Fund balances, end of year $ 617,588 $ 470,347 $ 736,225 $ 265,878
Page 87

City of University PlaceSchedule of Revenues, Expenditures, and Changes in Fund Balances
Budget (GAAP Basis) and ActualTransportation Benefit District
For the Year Ended December 31, 2015
Budgeted Amounts
Original Final Actual
Variance withFinal Budget
Positive(Negative)
RevenuesTaxes $ - $ 293,600 $ 394,713 $ 101,113Charges for services 293,600 - - -
Total revenues 293,600 293,600 394,713 101,113
ExpendituresCurrent
General government 5,900 5,900 2,500 3,400Transportation - 175,626 175,626 -
Total expenditures 5,900 181,526 178,126 3,400Excess (deficiency) of revenues over
expenditures 287,700 112,074 216,587 97,713
Other financing sources/usesTransfers out (146,000) - - -
Total other financing sources/uses (146,000) - - -
Net change in fund balances 141,700 112,074 216,587 97,713Fund balances, beginning of year - 146,000 175,626 29,626Fund balances, end of year $ 141,700 $ 258,074 $ 392,213 $ 127,339
Page 88

City of University PlaceSchedule of Revenues, Expenditures, and Changes in Fund Balances
Budget (GAAP Basis) and ActualPath and Trails Reserve Fund
For the Year Ended December 31, 2015
Budgeted Amounts
Original Final Actual
Variance withFinal Budget
Positive(Negative)
Revenues
ExpendituresNet change in fund balances $ - $ - $ - $ -Fund balances, beginning of year 2,563 2,759 - (2,759)Fund balances, end of year $ 2,563 $ 2,759 $ - $ (2,759)
Page 89

City of University PlaceSchedule of Revenues, Expenditures, and Changes in Fund Balances
Budget (GAAP Basis) and ActualDonations Fund
For the Year Ended December 31, 2015
Budgeted Amounts
Original Final Actual
Variance withFinal Budget
Positive(Negative)
RevenuesCharges for services $ - $ - $ 105 $ 105Miscellaneous
Rental, concessions and sales - - 320 320Contributions - - 20,691 20,691
Total revenues - - 21,116 21,116
ExpendituresCurrent
General government - 1,153 - 1,153Natural and economic environment - 931 307 624Culture and recreation - 32,052 20,764 11,288
Total expenditures - 34,136 21,071 13,065Excess (deficiency) of revenues over
expenditures - (34,136) 45 8,051
Other financing sources/usesTransfers out - (38,159) (38,159) -
Total other financing sources/uses - (38,159) (38,159) -
Net change in fund balances - (72,295) (38,114) 8,051Fund balances, beginning of year 67,505 67,505 72,294 4,789Fund balances, end of year $ 67,505 $ (4,790) $ 34,180 $ 12,840
Page 90

City of University PlaceSchedule of Revenues, Expenditures, and Changes in Fund Balances
Budget (GAAP Basis) and ActualParks CIP
For the Year Ended December 31, 2015
Budgeted Amounts
Original Final Actual
Variance withFinal Budget
Positive(Negative)
RevenuesCharges for services $ 40,000 $ 40,000 $ 270,089 $ 230,089Miscellaneous - - - -
Contribution in aid for constructions - - 25,000 25,000State grants and entitlements - - 5,333 5,333
Total revenues 40,000 40,000 300,422 260,422
ExpendituresCurrent - - - -
Culture and recreation - - 1,275 (1,275)Capital outlay 247,900 343,443 144,872 198,571
Total expenditures 247,900 343,443 146,147 197,296Excess (deficiency) of revenues over
expenditures (207,900) (303,443) 154,275 63,126
Other financing sources/usesTransfers in - 38,159 38,159 -Insurance recovery - - 27,768 27,768
Total other financing sources/uses - 38,159 65,927 27,768
Net change in fund balances (207,900) (265,284) 220,202 90,894Fund balances, beginning of year - (93,502) 449,292 542,794Fund balances, end of year $ (207,900) $ (358,786) $ 669,494 $ 633,688
Page 91

City of University PlaceSchedule of Revenues, Expenditures, and Changes in Fund Balances
Budget (GAAP Basis) and ActualPublic Works CIP
For the Year Ended December 31, 2015
Budgeted Amounts
Original Final Actual
Variance withFinal Budget
Positive(Negative)
RevenuesIntergovernmental $ 2,883,250 $ 11,377,125 $ 4,171,188 $ (7,205,937)Miscellaneous
Other revenues 45,150 236,092 88,671 (147,421)Total revenues 2,928,400 11,613,217 4,259,859 (7,353,358)
ExpendituresCurrent
General government - - 21,794 (21,794)Transportation 2,116,333 3,220,005 503,341 2,716,664Natural and economic environment - 112,672 108,480 4,192
Capital outlay 4,517,569 16,303,650 6,138,495 10,165,155Total expenditures 6,633,902 19,636,327 6,772,110 12,864,217Excess (deficiency) of revenues over
expenditures (3,705,502) (8,023,110) (2,512,251) (20,217,575)
Other financing sources/usesTransfers in 3,661,438 7,055,092 2,675,969 (4,379,123)
Total other financing sources/uses 3,661,438 7,055,092 2,675,969 (4,379,123)
Net change in fund balances (44,064) (968,018) 163,718 (24,596,698)Fund balances, beginning of year - - 968,017 968,017Fund balances, end of year $ (44,064) $ (968,018) $ 1,131,735 $ (23,628,681)
Page 92

City of University PlaceSchedule of Revenues, Expenditures, and Changes in Fund Balances
Budget (GAAP Basis) and ActualMunicipal Facilities CIP
For the Year Ended December 31, 2015
Budgeted Amounts
Original Final Actual
Variance withFinal Budget
Positive(Negative)
Revenues
ExpendituresCurrent
General government $ - $ 100,000 $ - $ 100,000Capital outlay 913,235 938,235 29,129 909,106
Total expenditures 913,235 1,038,235 29,129 1,009,106Excess (deficiency) of revenues over
expenditures (913,235) (1,038,235) (29,129) (1,009,106)
Other financing sources/usesTransfers in - 1,038,235 29,129 (1,009,106)
Total other financing sources/uses - 1,038,235 29,129 (1,009,106)
Net change in fund balances (913,235) - - (2,018,212)Fund balances, beginning of year - - - -Fund balances, end of year $ (913,235) $ - $ - $ (2,018,212)
Page 93

City of University PlaceSchedule of Revenues, Expenditures, and Changes in Fund Balances
Budget (GAAP Basis) and ActualDebt Service
For the Year Ended December 31, 2015
Budgeted Amounts
Original Final Actual
Variance withFinal Budget
Positive(Negative)
RevenuesInvestment earnings $ - $ - $ 1 $ 1
Total revenues - - 1 1
ExpendituresDebt service
Principal retirement 1,481,240 1,481,240 1,481,239 (1)Interest 2,296,684 2,296,684 2,296,182 (502)
Total expenditures 3,777,924 3,777,924 3,777,421 (503)Excess (deficiency) of revenues over
expenditures (3,777,924) (3,777,924) (3,777,420) 504
Other financing sources/usesTransfers in 3,777,924 3,777,924 3,777,420 (504)
Total other financing sources/uses 3,777,924 3,777,924 3,777,420 (504)
Net change in fund balances - - - -Fund balances, beginning of year - - - -Fund balances, end of year $ - $ - $ - $ -
Page 94

City of University PlaceSchedule of Revenues, Expenditures, and Changes in Fund Balances
Budget (GAAP Basis) and ActualParks and Recreation
For the Year Ended December 31, 2015
Budgeted Amounts
Original Final Actual
Variance withFinal Budget
Positive(Negative)
RevenuesTaxes $ 224,220 $ 224,220 $ 278,851 $ 54,631Charges for services 280,550 280,550 368,806 88,256Miscellaneous
Rental, concessions and sales 25,700 25,700 41,305 15,605Contributions - - 14,055 14,055Other revenues - - 955 955
Total revenues 530,470 530,470 703,972 173,502
ExpendituresCurrent
General government 94,610 94,610 72,818 21,792Transportation 11,246 11,246 9,468 1,778Culture and recreation 896,720 896,720 900,988 (4,268)Health and human services 108,723 110,215 93,348 16,867
Total expenditures 1,111,299 1,112,791 1,076,622 36,169Excess (deficiency) of revenues over
expenditures (580,829) (582,321) (372,650) 137,333
Other financing sources/usesTransfers out (126,203) (126,203) (126,203) -
Total other financing sources/uses (126,203) (126,203) (126,203) -
Net change in fund balances (707,032) (708,524) (498,853) 137,333Fund balances, beginning of year 501 1 (677,727) (677,728)Fund balances, end of year $ (706,531) $ (708,523) $ (1,176,580) $ (540,395)
Page 95

City of University PlaceSchedule of Revenues, Expenditures, and Changes in Fund Balances
Budget (GAAP Basis) and ActualDevelopment Services
For the Year Ended December 31, 2015
Budgeted Amounts
Original Final Actual
Variance withFinal Budget
Positive(Negative)
RevenuesLicenses and permits $ 609,000 $ 609,000 $ 209,359 $ (399,641)Charges for services 60,970 60,970 293,629 232,659Miscellaneous
Fines and forfeitures - - 1,840 1,840Other revenues 25,000 25,000 1,173 (23,827)
Total revenues 694,970 694,970 506,001 (188,969)
ExpendituresCurrent
General government 124,090 124,090 94,218 29,872Public safety 62,699 62,699 48,652 14,047Transportation 4,850 4,850 1,986 2,864Natural and economic environment 1,015,425 971,361 901,579 69,782
Total expenditures 1,207,064 1,163,000 1,046,435 116,565Excess (deficiency) of revenues over
expenditures (512,094) (468,030) (540,434) (305,534)
Other financing sources/usesTransfers in 15,000 15,000 7,310 (7,690)
Total other financing sources/uses 15,000 15,000 7,310 (7,690)
Net change in fund balances (497,094) (453,030) (533,124) (313,224)Fund balances, beginning of year - 24,891 (197,664) (222,555)Fund balances, end of year $ (497,094) $ (428,139) $ (730,788) $ (535,779)
Page 96

City of University PlaceSchedule of Revenues, Expenditures, and Changes in Fund Balances
Budget (GAAP Basis) and ActualPolice/Public Safety Fund
For the Year Ended December 31, 2015
Budgeted Amounts
Original Final Actual
Variance withFinal Budget
Positive(Negative)
RevenuesTaxes $ 4,415,364 $ 4,415,364 $ 4,555,281 $ 139,917Licenses and permits 63,500 63,500 57,828 (5,672)Intergovernmental 137,728 143,428 160,459 17,031Charges for services 125,387 125,387 138,604 13,217Miscellaneous
Fines and forfeitures 2,010 2,010 17,500 15,490Other revenues - - 6 6Federal grants 10,414 10,414 10,414 -
Total revenues 4,754,403 4,760,103 4,940,092 179,989
ExpendituresCurrent
General government 656,135 582,513 523,102 59,411Public safety 4,106,647 4,145,661 3,871,315 274,346Transportation 120,068 120,068 113,121 6,947Culture and recreation - - (1,425) 1,425
Total expenditures 4,882,850 4,848,242 4,506,113 342,129
Net change in fund balances (128,447) (88,139) 433,979 (162,140)Fund balances, beginning of year 57,787 569,765 1,035,803 466,038Prior period adjustment 635,058 - 1,629 1,629
Fund balances, beginning of year restated 692,845 569,765 1,037,432 467,667Fund balances, end of year $ 564,398 $ 481,626 $ 1,471,411 $ 305,527
Page 97

City of University PlaceSchedule of Revenues, Expenditures, and Changes in Fund Balances
Budget (GAAP Basis) and ActualStrategic Reserve
For the Year Ended December 31, 2015
Budgeted Amounts
Original Final Actual
Variance withFinal Budget
Positive(Negative)
Revenues
ExpendituresNet change in fund balances $ - $ - $ - $ -Fund balances, end of year 856,934 856,934 856,934 -Fund balances, beginning of year $ 856,934 $ 856,934 $ 856,934 $ -
Page 98

Non-Major Funds
Proprietary Funds
Internal Service FundsThese funds are used to account for the financing of goods or services provided by one department or agency to otherdepartments or agencies of the City, on a cost reimbursement basis.
The Fleet and Equipment Fund accounts for the costs of maintaining and replacing the majority of City vehicles andauxiliary equipment. All equipment costs, including depreciation, are factors in calculating the rates that are charged to eachuser department.
The Information Technology and Services Fund accounts for all costs associated with data processing,telecommunications, cable, postal operations, copier and duplication services, and the Geographical Information System(GIS). This fund owns and depreciates all non-proprietary fund assets related to these functions, and charges users for bothmaintenance and operating costs and equipment replacement charges based on depreciation schedules.
The Risk Management Fund accounts for the City’s risk financing activities established to minimize the adverse effects oflosses associated with property and casualty, medical and dental, unemployment, and worker’s compensation claims. Bothrisk control (to minimize the losses that strike an organization) and risk financing (to obtain finances to provide for or restorethe economic damages of those losses) are involved. The City is a member of Washington Cities Insurance Authority(WCIA), which offers a combination of self-insurance, or standard insurance to cover liability and property risks. The City iscurrently self-insuring only State Unemployment Compensation. Related premiums received by the fund are used toreimburse the unemployment benefits paid to eligible individuals and to establish reserves for the payment of estimated futureunemployment claims liability.
Page 99

City of University PlaceCombining Statement of Net Position
Internal Service FundsDecember 31, 2015
Govt. Activities
Fleet &Equipment
InformationTechnology &
ServicesRisk
ManagementTotal InternalService Funds
AssetsCurrent assets
Cash and equivalents $ 1,968 $ 39,235 $ - $ 41,203Total current assets 1,968 39,235 - 41,203
Noncurrent AssetsCapital assets
Machinery and equipment 1,330,751 463,891 10,043 1,804,685Less: accumulated depreciation (715,572) (253,991) (4,018) (973,581)
Total noncurrent assets 615,179 209,900 6,025 831,104Total assets $ 617,147 $ 249,135 $ 6,025 $ 872,307
Deferred outflows of resourcesDeferred outflows for pension contributions - 19,263 - -
Total deferred outflows of resources - 19,263 - -
Liabilities, deferred inflows and net positionCurrent liabilities
Accounts payable $ 1,968 $ 2,666 $ - $ 4,634Accrued salaries and wages - 3,062 - 3,062
Total current liabilities 1,968 5,728 - 7,696Noncurrent Liabilities
Compensated absences - 26,298 - 26,298Net pension liability - 157,991 - 157,991
Total noncurrent liabilities - 184,289 - 184,289Total liabilities 1,968 190,017 - 191,985
Deferred inflows for employer contributions - 24,364 - -
Net positionInvested in capital assets 615,179 54,017 6,025 675,221
Total deferred gain on bond refunding 615,179 54,017 6,025 675,221Total liabilities, deferred inflows and net
position $ 617,147 $ 268,398 $ 6,025 $ 867,206
Page 100

City of University PlaceCombining Statement of Revenues, Expenses, and Changes in Fund Net Position
Internal Service FundsFor the Year Ended December 31, 2015
Govt. Activities
Fleet &Equipment
InformationTechnology &
ServicesRisk
ManagementTotal InternalService Funds
Operating Revenues:Charges for services $ 100,022 $ 394,518 $ 124,123 $ 618,663Intergovernmental (99) - - (99)
Total operating revenues 99,923 394,518 124,123 618,564
Operating Expenses:Salaries and employee benefits $ - $ 240,188 $ - $ 240,188Materials and supplies 46,650 62,424 1,624 110,698Services and charges 53,274 244,395 - 297,669Insurance claims and expenses - - 122,499 122,499Depreciation and amortization 102,645 50,413 2,009 155,067
Total operating expenses 202,569 597,420 126,132 926,121Operating income (loss) (102,646) (202,902) (2,009) (307,557)
Nonoperating revenue (expenses):Insurance recovery 15,529 - - 15,529
Total nonoperating revenue (expenses) 15,529 - - 15,529Income (loss) before transfers (87,117) (202,902) (2,009) (292,028)
Transfers in 129,682 252,735 (1) 382,416Change in net position 42,565 49,833 (2,010) 90,388Net position, beginning of year 617,723 146,904 8,035 772,662Change in accounting principle GASB 68 - (165,297) - (165,297)Prior period adjustment (45,109) 22,577 - (22,532)Net position, beginning of year restated 572,614 4,184 8,035 584,833
Net position, end of year $ 615,179 $ 54,017 $ 6,025 $ 675,221
Page 101

City of University PlaceCombining Statement of Cash Flows
Internal Service FundsFor the Year Ended December 31, 2015
Govt. Activities
Fleet &Equipment
InformationTechnology &
ServicesRisk
ManagementTotal InternalService Funds
Cash flows from operating activities:Cash receipts from customers $ 100,022 $ 394,518 $ 124,123 $ 618,663Payments for employees for services - (176,886) - (176,886)Payments for goods and service (103,887) (316,082) (1,624) (421,593)Payments for employee benefits - (58,834) - (58,834)Cash paid for Insurance - - (122,499) (122,499)
Net cash provided (used) by operating activities (3,865) (157,284) - (161,149)
Cash flows from noncapital financing activites:Cash receipts from transfers from other funds $ 129,680 $ 252,734 $ - $ 382,414
Net cash provided (used) by noncapitalfinancing activities 129,680 252,734 - 382,414
Cash flows from capital and related financingactivities:Proceeds/(loss) from retirement of assets 15,529 - - 15,529Payments for capital acquisitions (145,067) (91,908) - (236,975)
Net cash provided (used) by capital and relatedfinancing activities (129,538) (91,908) - (221,446)
Net increase (decrease) in cash and cashequivalents (3,723) 3,542 - (181)
Cash and cash equivalents, beginning of year 5,691 35,693 - 41,384Cash and cash equivalents, end of year 1,968 39,235 - 41,203
Reconciliation of operating income (loss) to netcash provided (used) by operating activities:Operating income (loss) (102,646) (202,902) (2,009) (307,557)
Adjustments to reconcile operating income to netcash provided (used) by operating activities:Depreciation Exp 102,645 50,413 2,009 155,067
Change in assets and liabilitiesIncrease (decrease) in accounts payable (3,864) (9,265) - (13,129)Increase (decrease) in accrued salaries - 326 - 326Increase (decrease) in compensated absences - 6,349 - 6,349(Increase) decrease in deferred Inflows/outflows - 5,101 - 5,101(Increase) decrease in net pension liability - (7,306) - (7,306)
Net cash provided by operating activities $ (3,865) $ (157,284) $ - $ (161,149)
Page 102

This page intentionally left blank


City of University PlaceSchedule of Expenditures of Federal Awards
For the Year Ended December 31, 2015
ExpendituresFederal Agency
Name/Pass-Through Agency Name
Federal ProgramName
CFDANumber Other I.D. Number
From Pass-ThroughAwards
From DirectAwards Total
PassedThrough to
Subrecipients
Foot-NoteRef.
U.S. Department ofHUD/Pass-Through PierceCounty Department ofCommunity Services
CommunityDevelopment BlockGrants/EntitlementGrants 14.218 97979-0 $ 223,300 $ - $ 223,300
Subtotal 223,300 - 223,300 0 1,2,7U.S. Department ofTransportation(NHTSA)/PassThrough WashingtonTrafficSafety Commission
State andCommunityHighway SafetyAlcohol ImpairedDriving 20.600 N/A 5,328 - 5,328
20.600 N/A 613 - 613
20.616 N/A 594 - 594
Subtotal 6,535 - 6,535 0U.S. Department of Justice Edward Byrne 16.738 2011-DJ-BX-3262 - 10,414 10,414Bureau of JusticeAssistance Memorial Justice - - -
Assistance GrantProgran - - -
Subtotal - 10,414 10,414 0 1,2,7
U.S. Department ofHighway Planningand 20.205 SPUL-2947(011) 466,972 - 466,972
Transportation/PassThrough Construction STPUL-CM-2947(014) 152,772 - 152,772from WSDOT STPUL-CM-2957(006) 57,333 - 57,333
SRTS-3236(009) 1,042 - 1,042
SRTS-3239(001) 163 - 163
SRTS-3212(001) 682,198 - 682,198
SRTS-1343(003) 229,093 - 229,093
STPUL-3200(003) 679,907 - 679,907
CM-3236(012) 1,422 - 1,422
STPUL-2947(018) 2,149 - 2,149
STPUL-3200(004) 671,633 - 671,633
SRTS-9927(058) 48,048 - 48,048
STPUL-3200(002) 68,400 - 68,400
Subtotal 3,061,132 - 3,061,132 $ 0 1,2,7TOTAL FEDERALAWARDS EXPENDED $ 3,290,967 $ 10,414 $ 3,301,381 $ 0
Note 1. - Basis of AccountingThe Schedule of Financial Assistance is prepared on the same basis of accounting as the City of University Place's governmental fund financial statements.The City uses the modified accrual basis of accounting, which is the basis adapted to governmental fund-type measurement focus. All grants reported onthis schedule have been accounted for in governmental fund types. Grant revenues are determined to be earned and available at the time relatedexpenditures are incurred. For this reason, grant revenues to be received as reimbursement for expenditures incurred in the current year are also recognizedas revenue in that year.
Note 2 - Program CostsThe amounts shown as current year expenditures represent only the federal grant portion of the program costs. Entire program costs, including the City ofUniversity Place's portion, are more than shown. Such expenditures are recognized following, as applicable, either the cost principles in the OMB CircularA-87, Cost Principles for State, Local, and Indian Tribal Governments, or the cost principles contained in Title 2 U.S. Code of Federal Regulations Part 200,Uniform Administrative Requirements, Cost Principles, and Audit Requirements for Federal Awards, wherein certain types of expenditures are notallowable or are limited as to reimbursement.
Note 7 - Indirect Cost RateThe City of University Place has not elected to use the 10-percent de minimis indirect cost rate allowed under the Uniform Guidance.
Page 104

City of University PlaceSchedule of State and Local Financial Assistance
For the Year Ended December 31, 2015
Grantor/Program Title Identification NumberCurrent YearExpenditures
Washington State Department of EcologyUniversity Place Local Government Storm Water Grant 2013 EG160499 $ 11,133
Total Washington State Department of Ecology 11,133
Washington State Department of CommerceMain Street Redevelopment CD14-951-021 933,987
Total Washington State Department of Transportation 933,987
Washington State Transportation Improvement Board27th Street W/Regents Boulevard 8-1-203(005)-1 21,014
Total Washington State Department of Transportation 21,014
TOTAL STATE ASSISTANCE 966,134
TOTAL STATE AND LOCAL ASSISTANCE $ 966,134
Note 1.-BASIS OF ACCOUNTINGThe Schedule of Financial Assistance is prepared on the same basis of accounting as the City ofUniversity Place'sgovernmental fund financial statements. The City uses the modified accrual basisof accounting, which is the basis adapted togovernmental fund-type measurement focus. All grantsreported on this schedule have been accounted for in governmentalfund types. Grant revenues are determined to be earned and available at the time related expenditures are incurred. For thisreason, grant revenues to be received as reimbursement for expenditures incurred in the current year are alsorecognized asrevenue in that year.
Page 105


This page intentionally left blank

STATISTICAL SECTION
Financial Trends - These schedules contain trend information to help the reader understand how the city’s financial performance and fiscal health has changed over time.
Entity Wide PerspectiveTable 1 - Net Position by Component, Last Ten YearsTable 2 - Changes in Net Position, Last Ten YearsTable 3 - Program Revenues by Function/Program, Last TenYearsFund PerspectiveTable 4 - Fund Balances, Governmental FundsTable 5 - Changes in Fund Balances, Governmental Funds
Revenue Capacity - These schedules contain information to help the reader assess the City’s most significant revenue sources, property tax and retail sales tax.
Table 6 - Tax Revenue by SourceTable 7 - Assessed and Estimated Actual Value of Taxable Property – Current Year Table 8 - Property Tax Levies - Direct and Overlapping GovernmentsTable 9 – Principal Taxpayers, Current and Nine Years AgoTable 10 – Property Tax Levies and CollectionsTable 11 – Sales Tax by CategoryTable 12 – Direct and Overlapping Sales Tax RatesTable 13 – Sales Tax Payers, Current and Nine Years Ago
Debt Capacity - These schedules present information used in assessing the current level of outstanding debt and the City’s ability to issue additional debt in the future.
Table 14 – Ratios of Outstanding Debt by TypeTable 15 – Ratio of Net General Bonded Debt to Assessed Value and Net Bonded Debt per
CapitaTable 16 – Computation of Direct and Overlapping DebtTable 17 – Computation of Limitation of IndebtednessTable 18 – Compilation of General Obligation Debt Capacity
Demographic Statistics - These schedules offer demographic and economic indicators to help the reader understand the environment in which the City’s financial activities take place.
Table 19 – Demographic StatisticsTable 20 – Principal Employers, Current and Nine Years Ago
Operating Information - These schedules offer operating data to help the reader understand how the information in the City’s financial report relates to the services it provides and the activities it performs.
Table 21 – Full Time Equivalent Employees by FunctionTable 22 – Operating Indicators by Function/ProgramTable 23 – Capital Asset Statistics by Function/Program


City of University PlaceNet Position by Component
Last Ten Fiscal Year
TABLE 12006 2007 2008 2009 2010 2011 2012 2013 2014 2015
Total Governmental ActivitiesNet investment in capital assets $ 66,373,349 $ 58,517,697 $ 47,943,516 $ 47,536,216 $ 53,973,837 $ 52,262,278 $ 54,839,331 $ 51,594,485 $ 50,158,131 $ 53,836,345Restricted - - - - - - - 4,977,561 4,207,993 3,797,613Unrestricted 5,905,689 7,196,584 6,222,745 7,576,258 2,854,864 7,662,636 8,335,771 1,290,337 5,770,986 5,798,537
Total governmental activities net position $ 72,279,038 $ 65,714,281 $ 54,166,261 $ 55,112,474 $ 56,828,701 $ 59,924,914 $ 63,175,102 $ 57,862,383 $ 60,137,110 $ 63,432,495
Business-type activitiesUnrestricted net position - - - - - - - 3,882,944 4,486,712 4,106,408
Total business-type activities net position $ - $ - $ - $ - $ - $ - $ - $ 3,882,944 $ 4,486,712 $ 4,106,408
Primary GovernmentNet investment in capital assets $ 66,373,349 $ 58,517,697 $ 47,943,516 $ 47,536,216 $ 53,973,837 $ 52,262,278 $ 54,839,331 $ 51,594,485 $ 50,158,131 $ 53,836,345Restricted for - - - - - - - 8,860,505 8,694,705 7,904,021Unrestricted 5,905,689 7,196,584 6,222,745 7,576,258 2,854,864 7,662,636 8,335,771 1,290,337 5,770,986 5,798,537
Total primary government net position $ 72,279,038 $ 65,714,281 $ 54,166,261 $ 55,112,474 $ 56,828,701 $ 59,924,914 $ 63,175,102 $ 61,745,327 $ 64,623,822 $ 67,538,903
Source: City of University Place CAFR 2006-2015
Page 106

City of University PlaceChanges in Net Position
Last Ten Fiscal Years
TABLE 22006 2007 2008 2009 2010 2011 2012 2013 2014 2015
Expenses
Governmental activitiesGeneral government $ 5,286,655 $ 4,273,648 $ 4,093,015 $ 4,396,297 $ 4,528,050 $ 5,583,679 $ 4,078,073 $ 4,135,066 $ 4,838,826 $ 5,341,577Public safety 3,822,617 4,168,495 4,415,728 4,363,210 3,685,338 3,885,010 4,116,238 3,610,062 3,772,857 4,313,235Utilities 224,425 171,685 196,215 164,811 171,793 235,696 (740) 1,501 229 -Transportation 8,900,904 13,502,539 17,268,094 13,323,599 6,784,584 4,994,721 5,614,993 4,118,244 4,487,987 4,185,572Natural and economic environment 1,510,664 1,616,339 1,654,342 1,396,164 265,265 233,781 1,229,910 1,531,871 1,562,354 1,359,236Health and human services - - - - - - - - 19,861 104,130Culture and recreation 1,198,216 1,445,780 1,468,448 1,510,424 1,276,647 571,511 921,633 1,103,983 1,162,408 1,304,953Interest on long-term debt 974,856 1,159,880 1,519,783 1,842,624 2,661,848 2,707,817 2,868,939 2,750,344 2,566,304 2,694,094
Total governmental activities 21,918,337 26,338,366 30,615,625 26,997,129 19,373,525 18,212,215 18,829,046 17,251,071 18,410,826 19,302,797
Business-type activitiesWater management - - - - - - - 1,559,845 1,497,100 1,355,212
Total business-type activities - - - - - - - 1,559,845 1,497,100 1,355,212
Total primary government 21,918,337 26,338,366 30,615,625 26,997,129 19,373,525 18,212,215 18,829,046 18,810,916 19,907,926 20,658,009
Program revenues
Governmental activitiesCharges for services
General government 1,902,981 1,997,227 2,121,795 2,210,936 2,632,389 2,421,481 2,884,980 3,432,163 3,258,958 486,337Public safety 84,848 90,766 - - - - 129,907 92,195 88,198 79,377Utilities - - - - - - 2,699,026 79,288 1,221 432,920Transportation - - - - - - - 44,434 233,384 265,791Natural and economic environment 3,158,802 3,523,400 3,412,101 3,838,012 3,558,410 3,626,800 714,299 736,287 1,200,882 619,785Culture and recreation 285,472 316,778 317,266 298,612 425,709 991,715 586,405 397,062 373,800 369,536
Operating grants and contributions 28,016 81,710 69,944 215,309 174,078 116,833 2,642,625 763,943 316,874 1,188,004Capital grants and contributions 303,089 1,744,611 1,597,628 5,644,741 2,211,066 2,468,217 621,526 2,816,307 3,571,298 3,308,256
Total governmental activities 5,763,208 7,754,492 7,518,734 12,207,610 9,001,652 9,625,046 10,278,768 8,361,679 9,044,615 6,750,006
Business-type activitiesCharges for services - - - - - - - - - 2,770,459Operating grants and contributions - - - - - - - 2,819,837 2,747,343 11,133Capital grants and contributions - - - - - - - 158,308 23,510 -
Total business-type activities - - - - - - - 2,978,145 2,770,853 2,781,592
Total primary government 5,763,208 7,754,492 7,518,734 12,207,610 9,001,652 9,625,046 10,278,768 11,339,824 11,815,468 9,531,598
Net (expense)/revenueGovernmental activities $ (16,155,129) $ (18,583,874) $ (23,096,891) $ (14,789,519) $ (10,371,873) $ (8,587,169) $ (8,550,278) $ (8,889,392) $ (9,366,211) $ (12,552,791)Business-type activities - - - - - - - 1,418,300 1,273,753 1,426,380
Total primary government net expenses (16,155,129) (18,583,874) (23,096,891) (14,789,519) (10,371,873) (8,587,169) (8,550,278) (7,471,092) (8,092,458) (11,126,411)
Page 107

City of University PlaceChanges in Net Position
Last Ten Fiscal Years
TABLE 22006 2007 2008 2009 2010 2011 2012 2013 2014 2015
General Revenues and Other Changes in Net Assets
Governmental activitiesTaxes:
Real and personal property 3,483,775 3,576,794 3,665,872 3,742,760 3,727,676 3,780,850 3,856,992 4,012,030 4,063,189 4,125,973Sales 2,628,659 2,784,774 2,992,380 2,781,426 2,541,251 2,714,260 3,093,414 3,419,454 4,123,518 4,661,338Excise and other taxes 3,640,096 4,419,504 4,099,633 3,952,390 3,920,987 3,776,208 4,295,915 4,185,622 5,270,134 5,368,508
Investment earnings 354,323 342,243 134,029 48,676 16,551 12,689 10,558 13,400 27,445 42,489Intergovernmental revenues 1,299,051 803,917 514,261 535,300 634,122 506,098 - - - -Other revenue 3,756,020 91,885 142,696 575,180 1,247,513 893,277 955,057 1,068,493 893,391 4,661,897Capital contributions to other governments - - - - - - - (1,764,902) - -Special item - sale of land - - - - - - - - (2,736,739) -
Total governmental activities 15,161,924 12,019,117 11,548,871 11,635,732 12,088,100 11,683,382 12,211,936 10,934,097 11,640,938 18,860,205
Business-type activitiesTransfers - - - - - - - (801,248) (669,985) (1,367,936)
Total business-type activities - - - - - - - (801,248) (669,985) (1,367,936)
Total primary government 15,161,924 12,019,117 11,548,871 11,635,732 12,088,100 11,683,382 12,211,936 10,132,849 10,970,953 17,492,269
Change in net positionGovernmental activities (993,205) (6,564,757) (11,548,020) (3,153,787) 1,716,227 3,096,213 3,661,658 2,044,705 2,274,727 6,307,414Business-type activities - - - - - - - 617,052 603,768 58,444
Total primary government $ (993,205) $ (6,564,757) $ (11,548,020) $ (3,153,787) $ 1,716,227 $ 3,096,213 $ 3,661,658 $ 2,661,757 $ 2,878,495 $ 6,365,858
Source: City of University Place CAFR 2006-2015City adopted GASB 34 in Fiscal Year 2003
Page 108

City of University PlaceProgram Revenues by Function / Program
Last Ten Fiscal Year
TABLE 32006 2007 2008 2009 2010 2011 2012 2013 2014 2015
Governmental activitiesGeneral government $ 1,904,781 $ 2,078,937 $ 2,123,400 $ 2,291,621 $ 2,714,295 $ 2,438,729 $ 5,246,885 $ 3,557,528 $ 3,473,156 $ 511,337Public safety 111,064 90,766 4,985 72,674 34,722 23,906 233,760 261,793 264,184 367,116Utilities - - - - - - 2,782,067 520,034 1,221 432,920Transportation 275,421 1,744,611 1,620,982 5,706,691 2,268,516 2,365,099 621,696 2,860,741 3,703,981 3,549,048Natural and economic environment 3,158,802 3,523,400 3,452,101 3,838,012 3,558,410 3,678,741 743,867 736,287 1,200,882 625,118Health and human services - - - - - - - - - 894,933Culture and recreation 313,140 316,778 317,266 298,612 425,709 1,118,571 650,493 425,296 401,191 369,536
Total governmental activities $ 5,763,208 $ 7,754,492 $ 7,518,734 $ 12,207,610 $ 9,001,652 $ 9,625,046 $ 10,278,768 $ 8,361,679 $ 9,044,615 $ 6,750,008
Business-type activitiesWater management - - - - - - - 2,978,145 2,770,853 2,781,592
Total business-type activities $ - $ - $ - $ - $ - $ - $ - $ 2,978,145 $ 2,770,853 $ 2,781,592
Total primary government $ 5,763,208 $ 7,754,492 $ 7,518,734 $ 12,207,610 $ 9,001,652 $ 9,625,046 $ 10,278,768 $ 11,339,824 $ 11,815,468 $ 9,531,600
Source: City of University Place CAFR 2006-2015City adopted GASB 23 in Fiscal Year 2003
Page 109

City of University PlaceFund Balances - Governmental Funds
Last Ten Fiscal Years
TABLE 42006 2007 2008 2009 2010 2011 2012 2013 2014 2015
General FundUnreserved $ 2,648,493 $ 3,594,805 $ 2,195,696 $ 4,034,602 $ 587,584 $ - $ - $ - $ - $ -Assigned - - - - - 870,804 1,114,750 1,543,822 1,892,740 2,241,116Unassigned - - - - - 9,349 1,652,292 2,575,720 4,758,169 6,253,110
Total general fund $ 2,648,493 $ 3,594,805 $ 2,195,696 $ 4,034,602 $ 587,584 $ 880,153 $ 2,767,042 $ 4,119,542 $ 6,650,909 $ 8,494,226
All Other Governmental FundsReserved 563,855 265,549 887,001 833,058 614,876 - - - - -Unreserved:
Designated for Capital Project Funds 1,022,635 1,684,996 1,223,506 1,495,449 480,312 - - - - -Designated for Special Revenue Funds 746,150 797,245 814,386 820,922 823,154 - - - - -Designated for Debt Service Funds 138,077 256,012 334,950 257,404 205,731 - - - - -Restricted - - - - - 8,293,069 8,681,487 4,977,561 4,207,993 4,421,476Committed - - - - - 7,210 2,737 - - -Assigned - - - - - 17,077 305,820 630,218 968,017 1,131,735Unassigned - - - - - (1,697,949) - - - -
Total all other governmental funds 2,470,717 3,003,802 3,259,843 3,406,833 2,124,073 6,619,407 8,990,044 5,607,779 5,176,010 5,553,211
Total governmental funds $ 5,119,210 $ 6,598,607 $ 5,455,539 $ 7,441,435 $ 2,711,657 $ 7,499,560 $ 11,757,086 $ 9,727,321 $ 11,826,919 $ 14,047,437
Source: City of University Place CAFR 2006-2015(1) GASB 54 implemented new fund balance classification in 2011
Page 110

City of University PlaceChanges in Fund Balances - Governmental Funds
Last Ten Fiscal YearsTABLE 5
2006 2007 2008 2009 2010 2011 2012 2013 2014 2015Revenues
Taxes $ 9,752,530 $ 10,781,077 $ 10,757,885 $ 10,476,576 $ 10,189,914 $ 10,271,318 $ 10,844,349 $ 10,882,470 $ 13,458,468 $ 13,776,967Licenses and permits 1,902,981 1,997,227 2,121,795 2,210,936 2,632,389 2,421,481 2,704,465 2,721,159 3,046,342 2,881,674Intergovernmental 1,630,156 803,917 2,181,833 6,395,350 2,902,639 3,091,150 3,792,019 4,162,096 3,750,035 4,768,985Charges for services 3,524,742 3,925,144 3,589,931 4,132,634 3,980,008 3,928,812 4,078,935 1,958,444 2,023,177 1,700,294Miscellaneous
Fines and forfeitures 4,380 5,800 5,825 3,990 4,111 4,141 3,603 11,902 5,240 19,701Rental, concessions and sales - - - - - - - - - 94,553Investment earnings - - - - - - - - - 42,489Contribution in aid for constructions - - - - - - - - - 25,000Contributions 307,556 282,922 112,865 40,530 14,677 11,333 15,779 - 6,097 34,746Other revenues - - - - - - - - - 123,940Federal grants 850,827 1,855,093 142,696 575,180 1,238,752 889,478 456,112 304,003 341,786 10,414State grants and entitlements - - - - - - - - - 5,333
Total revenues 17,973,172 19,651,180 18,912,830 23,835,196 20,962,490 20,617,713 21,895,262 20,040,074 22,631,145 23,484,095Expenditures
CurrentGeneral government 3,502,791 3,580,314 3,661,944 3,907,983 3,920,952 4,273,709 2,479,311 3,046,198 3,275,889 3,300,848Public safety 3,831,846 4,168,495 4,415,728 4,363,210 3,685,338 3,885,010 4,161,087 3,611,011 3,770,125 3,923,198Utilities 224,425 171,685 196,215 164,811 171,793 235,696 - - - -Transportation 2,309,236 2,692,047 2,040,884 5,233,942 2,903,748 2,661,714 3,360,629 1,625,130 1,979,723 2,147,100Natural and economic environment 1,640,871 1,616,339 1,654,342 1,396,164 265,265 233,781 1,347,956 1,513,284 1,563,013 1,359,815Culture and recreation 1,309,183 1,410,074 1,468,448 1,510,424 990,394 1,037,499 1,063,147 1,098,592 1,164,493 1,018,193Health and human services - - - - - - - - - 93,348Capital outlay 6,413,978 12,108,484 17,510,515 13,137,380 10,317,388 4,301,893 2,119,023 3,700,702 5,296,863 6,312,496
Debt servicePrincipal retirement 716,000 13,079,722 804,722 18,847,468 872,468 1,897,468 15,152,467 1,306,240 1,726,239 1,631,239Interest 974,856 1,159,880 1,519,783 1,842,624 2,664,922 2,707,817 2,824,585 2,662,644 2,632,559 2,544,095Debt issue costs - - - - - - 107,650 - - -
Total expenditures 20,923,186 39,987,040 33,272,581 50,404,006 25,792,268 21,234,587 32,615,855 18,563,801 21,408,904 22,330,332
Excess (deficiency) of revenue over (under) expenditures (2,950,014) (20,335,860) (14,359,751) (26,568,810) (4,829,778) (616,874) (10,720,593) 1,476,273 1,222,241 1,153,763Other Financing Sources (Uses)
Bond proceeds - 20,100,000 - 22,077,647 - 5,885,000 14,130,000 - - -Bond anticipation note 1,620,526 1,379,474 13,000,000 6,000,000 - - - - - -Bond issuance costs - - - - - (392,239) - - - -PWTF loan proceeds 650,059 - 216,686 - - - - - - -Intergovernmental loan proceeds - (164,227) - - - - - - - -Proceeds from sale of assets - - - - - - 600,000 120,000 546,000 120,000Insurance recovery - - - - - - - - - 27,768Transfers in 4,173,273 17,228,009 7,048,217 22,691,706 12,714,924 8,568,568 23,376,320 5,190,609 7,150,777 7,019,382Transfers out (4,340,923) (16,728,009) (7,048,217) (22,214,646) (12,614,924) (8,656,552) (23,128,200) (4,934,568) (6,819,421) (6,033,860)
Total other financing sources (uses) 2,102,935 21,815,247 13,216,686 28,554,707 100,000 5,404,777 14,978,120 376,041 877,356 1,133,290Net change in fund balances $ (847,079) $ 1,479,387 $ (1,143,065) $ 1,985,897 $ (4,729,778) $ 4,787,903 $ 4,257,527 $ 1,852,314 $ 2,099,597 $ 2,287,053Fund balances, beginning of year $ 5,966,289 $ 5,119,220 $ 6,598,604 $ 5,455,538 $ 7,441,435 $ 2,711,657 $ 7,499,558 $ 7,875,008 $ 9,727,322 $ 11,760,382Fund balances, end of year $ 5,119,210 $ 6,598,607 $ 5,455,539 $ 7,441,435 $ 2,711,657 $ 7,499,560 $ 11,757,085 $ 9,727,322 $ 11,826,919 $ 14,047,435Debt services as a percentage of non-capital expenditures %11.65 %51.08 %14.75 %55.52 %22.86 %27.20 %58.95 %26.70 %27.05 %18.78
Source: City of University Place, CAFR 2006-2015Page 111

City of University PlaceTax Revenue by Source Last Ten Years
General, Special Revenue, and Debt Service FundsLast Ten Fiscal Years
TABLE 6
Fiscal Year
GeneralProperty
TaxesGeneral
Sales TaxUtilitiyTaxes
(a)Miscellaneous
Other Taxes andAssessments Total Taxes
2006 $ 3,483,775 $ 2,628,659 $ 2,201,047 $ 1,439,049 $ 9,752,530
2007 3,576,794 2,784,774 2,389,972 2,029,532 10,781,072
2008 3,665,872 2,992,380 2,474,650 1,624,983 10,757,885
2009 3,742,760 2,781,426 2,516,672 1,435,718 10,476,576
2010 3,727,676 2,541,251 2,432,540 1,488,447 10,189,914
2011 3,780,850 2,493,549 2,493,179 1,503,740 10,271,318
2012 3,856,992 2,552,103 2,456,160 1,979,094 10,844,349
2013 3,924,801 3,419,454 2,410,110 1,128,108 10,882,473
2014 4,063,189 4,123,518 2,357,963 2,913,798 13,458,468
2015 4,125,973 4,661,338 428,404 4,561,252 13,776,967
Change2006 - 2015 %118.43 %177.33 %19.46 %316.96 %141.27
Source: City of University Place, CAFR 2006-2015(a) Includes real estate exicse, gambling excise, admissions, fuel excise and leasehold excise tax
Page 112

City of University PlaceAssessed Value and Actual Value of Taxable Property
Last Ten Fiscal Years
TABLE 7
Fiscal YearReal
PropertyPersonalProperty
State PublicService Property Total
Assessed ValueAs a Percent ofActual Value
TotalDirect
Tax Rate2006 2,532,785,820 21,821,293 12,049,984 2,566,657,097 %100.0 1.36
2007 3,152,199,908 23,811,652 22,528,555 3,198,540,115 %100.0 1.12
2008 3,434,005,020 25,441,289 24,873,860 3,484,320,169 %100.0 1.05
2009 3,451,322,426 46,707,420 23,748,622 3,521,778,468 %100.0 1.06
2010 3,266,641,553 48,768,711 25,013,932 3,340,424,196 %100.0 1.12
2011 3,018,686,530 53,748,116 26,258,631 3,098,693,277 %100.0 1.23
2012 2,836,789,663 30,980,728 24,309,053 2,892,079,444 %100.0 1.33
2013 2,602,333,635 28,645,527 24,091,119 2,655,070,281 %100.0 1.47
2014 2,723,191,741 31,063,512 25,276,770 2,779,532,023 %100.0 1.43
2015 2,951,603,991 28,717,012 26,496,784 3,006,817,787 %100.0 1.35
Source: City of University Place, CAFR 2006-2015Tax rates per $1,000 of Assessed Value
Page 113

City of University PlaceProperty Tax Levies
Direct and Overlapping GovernmentsLast Ten Fiscal Years
(Unaudited)
TABLE 8
Fiscal Year
City ofUniversityPlace (1)
PierceCounty
U.P.School
District #83Port ofTacoma
LibraryDistrict
FireDisctrict #3
State ofWashington Total Taxes
Tax Rates Per $1,000 Assessed Valuation
2006 1.36 1.38 5.30 0.19 0.40 2.66 2.64 13.93
2007 1.12 1.14 5.68 0.19 0.48 2.21 2.29 13.11
2008 1.06 1.08 5.51 0.19 0.44 2.34 2.07 12.69
2009 1.06 1.08 5.42 0.18 0.44 2.37 2.02 12.57
2010 1.12 1.16 5.92 0.18 0.47 2.86 2.07 13.78
2011 1.23 1.29 6.60 0.18 0.50 2.88 2.27 14.95
2012 1.33 1.42 6.93 0.18 0.50 3.11 2.41 15.88
2013 1.47 1.69 7.47 0.18 0.50 3.29 2.63 17.23
2014 1.43 1.66 7.17 0.18 0.50 3.52 2.53 16.99
2015 1.35 1.58 7.17 0.18 0.50 3.42 2.39 16.59
Detail of Tax Rates for 2015
Basic Rate 1.35 1.58 - 0.18 0.50 2.00 2.39 8.00
Voted Rate - - 7.17 - - 1.42 - 8.59
Source: City of University Place, CAFR 2006-2015(1) Note: The City's direct rate consists wholly of the regular levy; there are no voted excess levies.
Page 114

City of University PlacePrinciple Property Taxpayers
Current Year and Nine Years Ago
TABLE 9
Tax Payer Type of Business2015 Assessed
Valuation Rank
Percentageof TotalAssessed
Valuation*2006 Assessed
Valuation
Percentageof TotalAssessed
Valuation*Chambers Creek 433 LLC Apartment Complex 33,601,400 1 $ 1.12 24,779,000 $ 29.72
Fred Meyer Commercial/Retail 21,784,172 2 0.72 16,275,253 19.52
KW University Place, LLC Apartment Complex 20,192,100 3 0.67 - 0.00
PMF Investments Inc. LLC. Commercial/Retail 17,163,900 4 0.57 17,017,400 20.41
Clearview Mixed Use Building LLC Retail/Apartment Complex 12,590,200 5 0.42 - 0.00
Peach Creek LLC Real Estate/Homes 11,957,300 6 0.40 10,932,900 13.11
27th and Grandview LLC Apartment Complex 11,921,600 7 0.40 7,519,100 9.02
Puget Sound Energy Gas Utility 10,658,332 8 0.35 6,861,614 8.23
UP Cornerstone LLC Commercial Developer 10,515,800 9 0.35 - 0.00
Ridgedale Associates LLC Commercial Property 10,402,800 10 0.35 - 0.00
Abbey Lane Apartments LLC Apartment Complex 9,347,800 11 0.31 - 0.00
C F C Management Corp Apartment Complex 9,104,800 12 0.30 - 0.00
Hidden Vale Apartments LLC Apartment Complex 8,843,500 13 0.29 - 0.00
Orchard Crest Apartments Apartment Complex 8,757,800 14 0.29 - 0.00
Dominion-Valley View Assoc LLC Apartment Complex 8,350,700 15 0.28 - 0.00
205,192,204 6.82 83,385,267 2.61
* Total assessed value for the City 3,006,817,787 3,198,540,115
Source: City of University Place, CAFR 2006-2015Information not available for assessed valuations for all of 2006
Page 115

City of University PlaceProperty Taxes Levies and Collections
Last Ten Fiscal Years
TABLE 10
Fiscal YearTaxes Levied for
Fiscal YearCurrent TaxCollections
Percentage ofLevy
Collections inSubsequent
Years
Total TaxCollections to
DatePercentage of
Levy2006 3,496,175 3,428,559 %98.1 67,934 3,496,493 %100.0
2007 3,608,645 3,509,566 %97.3 68,481 3,578,047 %99.2
2008 3,678,101 3,605,479 %98.0 74,961 3,680,440 %100.1
2009 3,748,944 3,673,364 %98.0 71,788 3,745,152 %99.9
2010 3,745,905 3,660,227 %97.7 77,670 3,737,897 %99.8
2011 3,804,780 3,714,341 %97.6 67,600 3,781,941 %99.4
2012 3,857,832 3,779,775 %98.0 70,456 3,850,231 %99.8
2013 3,908,520 3,849,279 %98.5 51,006 3,900,285 %99.8
2014 3,980,549 3,924,947 %98.6 36,460 3,961,407 %99.5
2015 4,045,432 3,998,753 %98.8 - 3,998,753 %98.8
Source: City of University Place, CAFR 2006-2015Note:(1) Original amount levied for the fiscal year(2) Includes levy adjustments, penalties, interest and subsequent year tax collections
Page 116

City of University PlaceSales Taxes Collected by Category
Last Ten Fiscal Years
TABLE 11
FiscalYear Retail Services Contracting
TransportationCommunication
Utilities Wholesale Manufacturing
FinanceInsurance
Real Estate Government Other Total2006 1,004,150 125,849 399,049 122,824 54,930 45,692 58,263 12,332 86,916 1,910,005
2007 1,200,959 147,174 412,579 87,872 51,863 45,892 56,853 4,264 68,994 2,076,450
2008 1,113,441 115,868 666,236 46,430 86,453 41,113 65,562 1,478 154,361 2,290,942
2009 742,216 392,867 543,758 137,508 96,155 30,870 148,193 31,930 66,016 2,189,513
2010 765,846 380,332 328,776 157,421 84,238 28,408 72,569 31,069 77,842 1,926,501
2011 763,223 397,122 289,103 141,609 63,401 27,293 63,781 30,888 108,403 1,884,823
2012 777,709 396,690 319,888 143,633 62,961 37,136 65,966 38,436 88,153 1,930,572
2013 806,134 379,997 521,074 148,118 75,150 27,248 77,041 42,368 104,726 2,181,856
2014 834,377 403,291 1,043,529 165,136 95,020 36,009 88,272 39,996 98,489 2,804,119
2015 1,082,718 522,239 1,163,135 163,109 89,831 39,999 128,819 50,652 124,985 3,365,487
Source: City of University Place, CAFR 2006-2015Does not include Local Revitalization Financing Sales Tax Revenue, Park Sales Tax Revenue or Criminal Justice Sales TaxRevenue
Page 117

City of University PlaceDirect and Overlapping Sales Tax Rates
TABLE 12
Fiscal Year StatePierceTransit
PierceCity Jail
CriminalJustice
RegionalTransit
PierceCounty
911Comm Parks
PublicTransport
StateAdm Fee City Total
2006 %6.50 %0.30 %0.10 %0.10 %0.40 %0.15 %0.00 %0.10 %0.30 %0.01 %0.84 %8.80
2007 %6.50 %0.30 %0.10 %0.10 %0.40 %0.15 %0.00 %0.10 %0.30 %0.01 %0.84 %8.80
2008 %6.50 %0.30 %0.10 %0.10 %0.40 %0.15 %0.00 %0.10 %0.30 %0.01 %0.84 %8.80
2009 %6.50 %0.30 %0.10 %0.10 %0.90 %0.15 %0.00 %0.10 %0.30 %0.01 %0.84 %9.30
2010 %6.50 %0.30 %0.10 %0.10 %0.90 %0.15 %0.00 %0.10 %0.30 %0.01 %0.84 %9.30
2011 %6.50 %0.30 %0.10 %0.10 %0.90 %0.15 %0.00 %0.10 %0.30 %0.01 %0.84 %9.30
2012 %6.50 %0.30 %0.10 %0.10 %0.90 %0.15 %0.10 %0.10 %0.30 %0.01 %0.84 %9.40
2013 %6.50 %0.30 %0.10 %0.10 %0.90 %0.15 %0.10 %0.10 %0.30 %0.01 %0.84 %9.40
2014 %6.50 %0.30 %0.10 %0.10 %0.90 %0.15 %0.10 %0.10 %0.30 %0.01 %0.84 %9.40
2015 %6.50 %0.30 %0.10 %0.10 %0.90 %0.15 %0.10 %0.10 %0.30 %0.01 %0.84 %9.40
Source: City of University Place, CAFR 2006-2015
Page 118

City of University PlaceSales Tax Payers by Industry
Last Ten Fiscal Years
TABLE 13
Industry2015 TaxLiability
Percentage ofLevy
2006 TaxLiability
Percentage ofLevy
Retail Trade $ 1,082,718 %32.17 $ 1,004,150 %52.57
Contracting 1,163,135 %34.56 399,049 %20.89
Services 522,239 %15.52 125,849 %6.59
Transportation, Communication, Utilities 163,109 %4.85 122,824 %6.43
Finance, Insurance, Real Estate 128,819 %3.83 58,263 %3.05
Wholesale 89,831 %2.67 54,930 %2.88
Manufacturing 39,999 %1.19 45,692 %2.39
Government 50,652 %1.51 12,332 %0.65
Other 124,985 %3.71 86,916 %4.55
Total $ 3,365,487 %100.00 $ 1,910,005 %100.00Source: City of University Place, CAFR 2006-2015
Page 119

City of University PlaceRatios of Outstanding Debt by Type
Last Ten Fiscal Years
TABLE 14
Fiscal Year
GeneralObligation
Bonds
Public WorksTrust Fund
Loans GeneralGovt
PublicWorks TrustFund Loans
BusinessType
RevenueBonds
Letter ofCredit
CapitalLeases Total Debt
Percent ofTaxableValue
Percentage ofPersonalIncome
Debt perCapita
2006 7,975,000 3,441,334 - - 11,020,526 - 22,436,860 %0.70 $ 1.97 721
2007 27,555,000 3,181,613 - - - - 30,736,613 %0.96 2.51 987
2008 27,010,000 3,201,690 - - 13,000,000 - 43,211,690 %1.23 3.35 1,374
2009 48,880,000 2,929,222 - - 1,000,000 11,097 52,820,319 %1.58 4.25 1,677
2010 48,280,000 2,656,754 - - 1,000,000 6,165 51,942,919 %1.68 4.07 1,646
2011 47,655,000 2,384,286 - 5,885,000 - - 55,924,286 %1.93 4.38 1,796
2012 47,005,000 2,111,818 - 5,785,000 - - 54,901,818 %2.07 4.04 1,756
2013 46,035,000 1,839,350 492,513 5,640,000 - - 53,514,350 %1.93 3.88 1,708
2014 44,645,000 1,566,882 411,283 5,495,000 - - 51,706,882 %1.72 3.77 1,646
2015 43,355,000 1,294,412 330,078 5,345,000 - - 49,994,412 %1.58 $ N/A 1,576
Source: City of University Place, CAFR 2006-2015 Pierce County Assessor/Treasurer(1) Note: 2015 data not yet available
Page 120

City of University PlaceRatio of Net General Bonded Debt to Assessed Value
And Net Bonded Debt per CapitaLast Ten Fiscal Years
TABLE 15
Fiscal Year(a)
Population
(b)Assessed
ValueGeneral
Bonded Debt
Ratio of NetBonded Debtto Assessed
Value
Net BondedDebt perCapita
2006 31,140 3,198,540,115 7,975,000 0.25% 256.102007 31,300 3,484,320,167 27,555,000 0.79% 880.352008 31,440 3,521,778,468 27,010,000 0.77% 859.102009 31,500 3,340,414,196 49,880,000 1.49% 1,583.492010 31,550 3,098,693,277 48,280,000 1.56% 1,530.272011 31,144 2,892,079,444 47,655,000 1.65% 1,530.152012 31,270 2,655,070,281 47,005,000 1.77% 1,503.202013 31,340 2,779,532,023 46,035,000 1.66% 1,468.892014 31,420 3,006,817,787 44,645,000 1.48% 1,420.912015 31,720 3,159,537,693 43,355,000 1.37% 1,366.80
(a) Source: Washington State Office of Financial Management.(b) The assessed value if the final certified Regular Levy assessed value of taxable property which was used by Pierce County
Assessor's Office for use in calculating levy rates for the 2015 tax levy.
Page 121

City of University PlaceComputation of Direct and Overlapping Debt
TABLE 16(a)
Gross GeneralObligation Debt
Outstanding
(b)Percentage
Applicable toCity
AmountApplicable to
University Place
Direct DebtCity of University Place $ 49,664,334 %100.00 $ 49,664,334
Overlapping DebtWest Pierce Fire and Rescue 8,290,000 %36.29 3,008,441
Pierce County 154,086,008 %3.82 5,886,086
Tacoma School District No. 10 574,370,000 %2.13 12,234,081
University Place School District No. 83 66,182,738 %93.73 62,033,080
Clover Park School District No. 400 137,830,000 %0.005 6,892
Steilacoom Historical School District No. 1 51,090,000 %0.11 56,199
Port of Tacoma 179,575,000 %3.82 6,859,765
Pierce County Rural Library District - %5.55 -
Total overlapping debt $ 1,171,423,746 $ 90,084,544
Total Direct and Overlapping Debt $ 1,221,088,080 %11.44 $ 139,692,476
(a) Total general obligation bonds outstanding on December 31, 2015, exclusive of refunded bonds.Source: West Pierce Fire District, Pierce County Finance and Budget Office, Tacoma School District, Clover Park SchoolDistrict, Port of Tacoma & Pierce County Library
(b) Determined by ratio of assessed valuation of property subject to taxation in overlapping unit to valuation of propertysubject to taxation in reporting unit.Source: Pierce County Assessor-Treasurers Office
Page 122

City of University PlaceComputation of Limitation of Indebtedness
TABLE 17
Total Taxable Property Value (Assessed at 100% taxes payable in 2015) $ 3,159,537,693
General Purpose IndebtednessNon-Voted General Purpose Indebtedness and Capital Leases (Councilmanic)
Legal Limit 1.5% of Total Taxable Property Value 47,393,065
Less: outstanding debt 45,128,999Less: contracts payable -
Less: excess of debt with a vote -Add: available assets -
Remaining Non-Voted Debt Capacity - General Purposes $ 2,264,066
Total General Purpose Indebtedness with a 3/5 Vote of the People (includes non-voted)Legal Limit 2.5% of Total Taxable Property Value 78,988,442
Less: indebtedness incurred - non-voted 45,128,999Less: outstanding debt - voted -
add: available assets -
Total Remaining Debt Capacity - General Purposes $ 33,859,443
Utility Purpose IndebtednessIndebtedness for Utility Purposes with a 3/5 Vote of the People
Legal Limit 2.5% of Total Taxable Property Value 78,988,442
Less: outstanding debt -Less: contracts payable -
Add: available assets -
Remaining Debt Capacity - Utility Purposes $ 78,988,442
Open Spaces and Parks Facilities IndebtednessIndebtedness for Open Spaces and Parks Facilities with 3/5 Vote of the People
Legal Limit 2.5% of Total Taxable Property Value 78,988,442
Less: outstanding debt -Less: contracts payable -
Add: available assets -
Remaining Debt Capacity - Open Spaces and Parks Facilities $ 78,988,442
SummaryTotal indebtedness allowable
Legal Limit 7.5% of Total Taxable Property Value 236,965,327Less: indebtedness incurred - general purposes 45,128,999
Less: indebtedness - utility purposes -Less: indebtedness incurred - open spaces and parks facilities -
Add: Assets available -
Remaining Debt Capacity $ 191,836,328
Legal Debt Margin to the Debt Limit (%) %80.96Total Net Debt Applicable to the Debt Limit (%) %19.04
Page 123
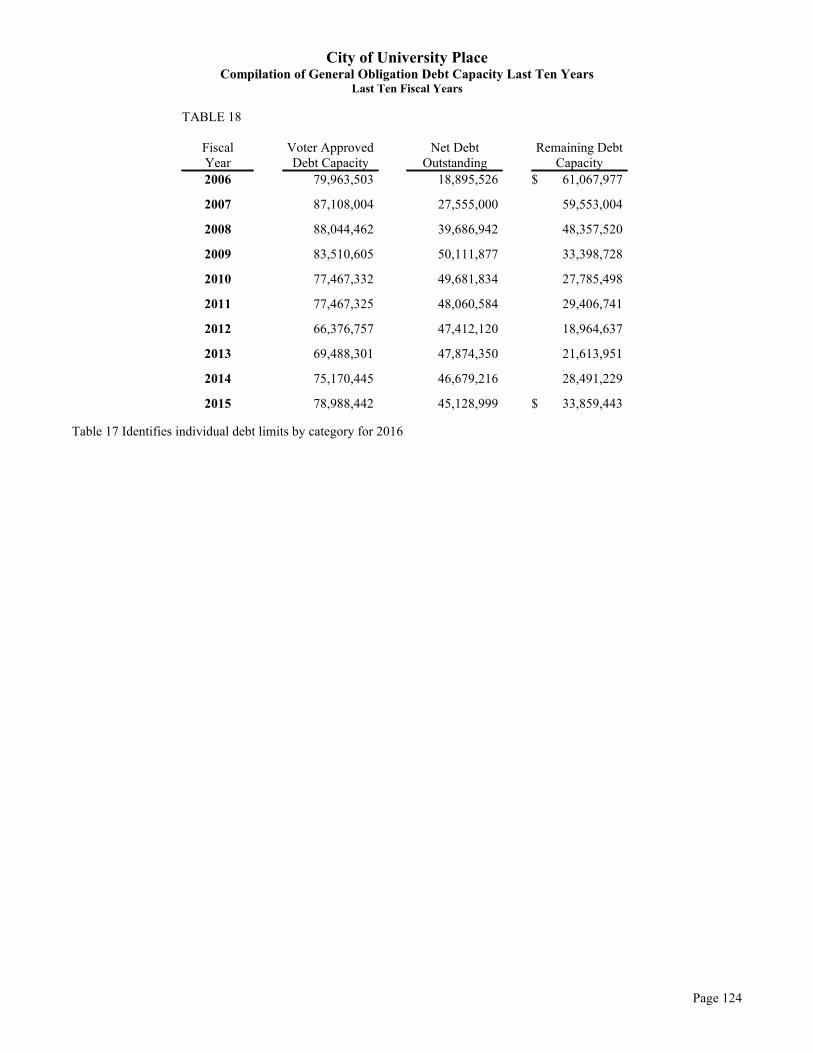
City of University PlaceCompilation of General Obligation Debt Capacity Last Ten Years
Last Ten Fiscal Years
TABLE 18
FiscalYear
Voter ApprovedDebt Capacity
Net DebtOutstanding
Remaining DebtCapacity
2006 79,963,503 18,895,526 $ 61,067,977
2007 87,108,004 27,555,000 59,553,004
2008 88,044,462 39,686,942 48,357,520
2009 83,510,605 50,111,877 33,398,728
2010 77,467,332 49,681,834 27,785,498
2011 77,467,325 48,060,584 29,406,741
2012 66,376,757 47,412,120 18,964,637
2013 69,488,301 47,874,350 21,613,951
2014 75,170,445 46,679,216 28,491,229
2015 78,988,442 45,128,999 $ 33,859,443
Table 17 Identifies individual debt limits by category for 2016
Page 124

City of University PlaceDemographic Statistics
Last Ten Fiscal YearsTABLE 19
Fiscal Year PopulationTotal PersonalIncome (1) (2)
Per CapitaPersonal
Income (1) (2)Median Age
(1)School
EnrollmentUnemployment
Rate (1)2006 31,140 $ 27,915,787,000 $ 36,567 36.5 5,427 %5.2
2007 31,300 $ 30,164,757,000 $ 39,049 36.2 5,380 %4.7
2008 31,440 $ 32,198,440,000 $ 40,996 36.4 5,178 %5.3
2009 31,500 $ 31,395,360,000 $ 39,417 35.3 5,424 %6.6
2010 31,550 $ 32,212,709,000 $ 40,500 38.0 5,632 %11.2
2011 31,144 $ 33,117,849,000 $ 40,992 39.4 5,577 %8.6
2012 31,270 $ 35,232,946,000 $ 43,407 36.3 5,670 %8.4
2013 31,340 $ 36,054,002,000 $ 43,982 36.5 5,655 %6.6
2014 31,420 $ 36,282,818,000 $ 43,613 36.8 5,634 %6.3
2015 31,720 $ - $ - - 5,646 %5.9
Sources: U.S. Bureau of Economic Analysis Washington State Office of Financial Management Washington State Office of Superintendent of Public Instruction Washington State Employment Security(1) Note: Based on data for Pierce County(2) Note: 2015 data not yet available
Page 125

City of University PlacePrinciple Employers
Current Year and Nine Years Ago
TABLE 20
EmployerRanking
2015Employees
2015 (a)% of TotalEmployees
Ranking2006 (b)
Employees2006
University Place School District 1 542 25.76% 1 497Franciscan Health System 2 330 15.68% 3 177Fred Meyer Stores 3 259 12.31% 6 135Soundcare, Inc 4 198 9.41% 4 143Whole Foods 5 170 8.08% N/A N/APierce County Government 6 159 7.56% 2 218Charles Wright Academy 7 134 6.37% 5 139Kemper Sports 8 125 5.94% N/A N/ASafeway Stores, Inc. 9 110 5.23% N/A N/AMcdonald's Restaurants 10 77 3.66% 8 86Total Employees 2,104
Source:(a) Tacoma-Pierce County Economic Development Board(b) Only data available for prior years is the Tacoma area
Page 126

City of University PlaceFull Time Equivalent City Employees by Function
Last Ten Fiscal Years
Table 21
Fiscal YearCity
ManagerCity
AttorneyAdministrative
ServicesPublicWorks
DevelopmentServices Engineering Finance Total
2006 3.60 2.00 18.06 20.00 11.50 6.50 6.00 67.662007 2.60 2.00 16.63 21.00 15.00 5.00 6.00 68.232008 3.10 2.00 17.25 21.00 14.00 6.00 6.00 69.352009 2.60 2.00 17.25 21.00 11.00 6.00 6.00 65.852010 2.50 2.00 11.72 16.00 6.25 4.66 4.90 48.032011 1.90 2.00 12.48 16.00 6.50 4.75 4.50 48.132012 1.90 2.00 12.48 16.00 6.50 4.75 4.00 47.632013 1.90 2.00 11.48 16.00 6.50 4.75 4.00 46.632014 2.00 2.00 10.98 16.00 7.00 6.75 4.00 48.732015 2.00 2.00 11.98 14.00 7.50 7.00 4.50 48.98
Source: City of University Place Budgets 2006-2015 Total does not include Council Members or contract Police Officers
Page 127

City of University PlaceOperating Indicators by Function
Last Ten Fiscal YearsTABLE 22
2006 2007 2008 2009 2010 2011 2012 2013 2014 2015
General GovernmentBuilding Permits Issued 338 967 653 646 707 630 715 735 822 752
PolicePart 1 Crimes* 1,262 1,075 950 960 1,079 884 1,026 882 815 824DUI Arrests 121 132 133 101 76 86 69 41 51 53Other Traffic Arrests 177 305 259 225 129 209 266 192 154 132
Fire**Emerygency Medical Responses 2,543 2,418 2,482 2,612 2,736 8,412 8,716 8,961 9,128 10,545Fire Responses 195 85 145 146 104 284 312 298 286 448Other 659 685 767 797 914 4,063 4,564 4,306 4,593 4,465
Source: City of University Place City Manager's Office* Part 1 Crimes includes violent crime (aggravated assault,murder,rape, robbery) and property crime (arson motor vehicle theft burglary and theft)** In March, 2011, the University Place Fire District merged with the Lakewood Fire District to form West Pierce Fire. As a result, the 2011 through 2014 statistics reflect thetotal for West Pierce Fire.
Page 128

City of University PlaceCapital Asset Statistics by Function/Program
Last Ten Fiscal Years
Table 23
Fiscal YearGeneral
GovernmentCulture andRecreation Streets/Transportation
Construction inProgress Total
2006 25,759,552.00 13,025,413.00 160,116,840.00 5,708,396.00 204,610,201.00
2007 26,469,578.00 13,728,768.00 163,151,059.00 10,090,618.00 213,440,023.00
2008 38,715,053.00 14,432,836.00 163,495,034.00 6,919,066.00 223,561,989.00
2009 38,533,785.00 14,798,988.00 163,495,034.00 19,871,562.00 236,699,369.00
2010 38,588,153.00 14,798,988.00 163,780,609.00 29,849,005.00 247,016,755.00
2011 39,614,405.00 14,841,746.00 170,451,913.00 27,187,141.00 252,095,205.00
2012 39,735,243.00 14,841,746.00 172,701,448.00 26,957,875.00 254,236,312.00
2013 55,107,519.00 15,108,936.00 174,264,047.00 7,880,766.00 252,361,268.00
2014 54,286,309.00 15,456,923.00 175,333,107.00 9,460,746.00 254,537,085.00
2015 54,286,309.00 15,456,923.00 175,333,107.00 9,460,746.00 254,537,085.00
Source: City of University Place CAFR 2006-2015.City implemented GASB 34 in 2003.
Page 129


Business of the City Council City of University Place, WA
Expenditure Amount Appropriation Required: $0.00 Budgeted: $0.00 Required: $0.00
SUMMARY / POLICY ISSUES Every three years the State Building Code Council (SBCC) advises the State Legislature on updates to the State Building Code. Since 2003 the SBCC has advised the State Legislature to adopt the International Code developed by the International Code Council (ICC) as the State Building Code. The ICC develops the codes and standards used to construct residential and commercial buildings including homes and schools. The International Codes or I-Codes provide the minimum safeguards for people at home, at school, and in the workplace. The I-Codes are a complete set of comprehensive, coordinated building safety and fire prevention codes. Fifty states and the District of Columbia have adopted the I-Codes at the state or jurisdictional level.
ALTERNATIVES CONSIDERED The Revised Code of Washington Chapter 19.27 RCW the State Building Code requires the State Building Code be in effect in all counties and all cities in the State.
BOARD OR COMMITTEE RECOMMENDATION The City Council reviewed the proposed amendments during a study session on June 20, 2016 and directed staff to bring the proposed amendments forward for consideration on July 5, 2016.
RECOMMENDATION/MOTION MOVE TO: Pass an Ordinance Amending Ordinance No. 623, Amending Title14, Chapter 14.05 related to Building and Construction to comply with RCW 19.27 the State Building Code by adopting the 2015 Edition of the International Code, 2015 Edition of the State Energy Code and the 2015 Edition of the Uniform Plumbing Code.
Agenda No: 6C
Dept. Origin: Planning & Development Services
For Agenda of: July 5, 2016
Exhibits: Proposed Ordinance Exhibit A Concurred by Mayor: __________ Approved by City Manager: __________ Approved as to form by City Atty.: __________ Approved by Finance Director: __________ Approved by Department Head: __________
Proposed Council Action: Adopt an ordinance amending Ordinance No. 623, amending Title14, Chapter 14.05 related to Building and Construction to comply with RCW 19.27 the State Building Code by adopting the 2015 Edition of the International Code, 2015 Edition of the State Energy Code and the 2015 Edition of the Uniform Plumbing Code.

ORDINANCE NO. _____
AN ORDINANCE OF THE CITY COUNCIL OF THE CITY OF UNIVERSITY PLACE, WASHINGTON, RELATING TO BUILDING AND CONSTRUCTION CODES, AMENDING TITLE 14 OF THE UNIVERSITY PLACE MUNICIPAL CODE BY AMENDING CHAPTER 14.05, EXCEPT FOR VESTED PERMIT APPLICATIONS, AND BY ADOPTING A NEW CHAPTER 14.05, BUILDING AND CONSTRUCTION CODES, WHICH SHALL APPLY TO NEW PERMIT APPLICATIONS
WHEREAS, the Revised Code of Washington Chapter 19.27 RCW the State Building Code
requires the State Building Code be in effect in all counties and all cities in the State; and
WHEREAS, RCW 19.27.040 authorizes cities to amend the State Building Code as it applies within their jurisdiction; and
WHEREAS, the City Council finds that the public health, safety, and general welfare are best served by adopting and enforcing building and construction codes that require minimum performance standards for construction and construction materials, consistent with accepted standards of engineering, fire and life safety, and to permit the use of modern technical methods, devices and improvements.
NOW, THEREFORE, THE CITY COUNCIL OF THE CITY OF UNIVERSITY PLACE, WASHINGTON, HEREBY DOES ORDAIN AS FOLLOWS:
Section 1. Preserving Vested Permit Applications, the City’s Authority to Enforce Prior Building
and Construction Codes. The amendment of Chapter 14.05, Uniform Codes, of the University Place Municipal Code as provided for in Section 2 shall not apply: (1) to any vested permit application that is lawfully entitled to be processed under the prior Building and Construction Code; or (2) to any enforcement action taken by the City to enforce the provisions of prior Building and Construction Code.
Section 2. Amend Chapter 14.05, Building and Construction Code, to the University Place
Municipal Code. The University Place Municipal Code, Chapter 14.05, Building and Construction Code, is hereby amended as shown in Exhibit A.
Section 3. Severability. If any section, sentence, clause or phrase of this Title shall be held to be invalid or unconstitutional by a court of competent jurisdiction, such invalidity or unconstitutionality shall not affect the validity or constitutionality of any other section, sentence, clause or phrase of this Title.
Section 4. Publication and Effective Date. A summary of this ordinance consisting of its title shall be published in the official newspaper of the City. This Ordinance shall take effect five (5) days after publication.
PASSED BY THE CITY COUNCIL ON JULY 5, 2016. _______________________________________ Javier H. Figueroa, Mayor

ATTEST: _________________________________ Emelita Genetia, City Clerk APPROVED AS TO FORM: _________________________________ Steve Victor, City Attorney Published: xx/xx/xx Effective Date: xx/xx/xx

University Place Municipal Code Chapter 14.05 BUILDING AND CONSTRUCTION CODE
Exhibit A Page 1/10
Chapter 14.05
BUILDING AND CONSTRUCTION CODE
Sections: 14.05.010 Short title. 14.05.020 Purpose. 14.05.030 Adoption of codes by reference. 14.05.040 Conflicts between codes. 14.05.050 Fire Code Official designated. 14.05.060 Fees. 14.05.070 Hours of construction. 14.05.080 Codes – Copies on file. 14.05.090 Administrative provisions. 14.05.100 Building code amendments. 14.05.110 Fire code amendments. 14.05.120 Violations and penalties. 14.05.130 Liability. 14.05.140 Hearings Examiner – Powers and duties.
14.05.010 Short title. This chapter is known as and may be referred to as the “building and construction code.”
(Ord. 623 § 2 (Exh. A), 2013; Ord. 570 § 2, 2010; Ord. 497 § 3, 2007; Ord. 408 § 3, 2004).
14.05.020 Purpose. The purpose of the codes and regulations adopted in this title is to provide minimum standards to safeguard life, health, property and public welfare by regulating and controlling the design, construction, quality of materials, use and occupancy, location and maintenance of all buildings and structures within the City of University Place. It is not the purpose or intent to create or designate any particular class or group of persons to be especially protected or benefited, nor is it intended to create any special relationship with any individual.
(Ord. 623 § 2 (Exh. A), 2013; Ord. 570 § 2, 2010; Ord. 497 § 3, 2007; Ord. 408 § 3, 2004).
14.05.030 Adoption of codes by reference. The following codes are hereby adopted by this reference as if fully set forth in this chapter and as specifically modified or amended as set forth in this chapter:
A. The 2012 2015 Edition of the International Building Code, including Appendix Chapter E, and ICC/ANSI A117.1-2009, and the 2015 International Existing Building Code and International Swimming Pool and Spa Code published by the International Code Council is hereby adopted by reference with the exceptions noted in Chapter 51-50 WAC and subsequently amended by this chapter.
B. The 2012 2015 Edition of the International Residential Code including Appendices F, G, R and SQ as published by the International Code Council is hereby adopted as amended by the Washington State Building Code Council in Chapter 51-51 WAC and as subsequently amended by this chapter; provided, that Chapters 11 and 25 through 43 of this code are not adopted.
C. The 2012 2015 Edition of the International Mechanical Code including adoption of 2015 International Fuel Gas Code, published by the International Code Council and 2014 NFPA 58 & 2014 NFPA 54, published by the National Fire Protection Association is hereby adopted by reference with the exceptions noted in Chapter 51-52 WAC.
D. The 2012 2015 Edition of the International Fire Code published by the International Code Council is hereby adopted by reference with the additions, deletions, and exceptions contained in Chapter 51-54A WAC, including Appendices B, C, D (Sections 105 and 106 only), E, F and G.

University Place Municipal Code Chapter 14.05 BUILDING AND CONSTRUCTION CODE
Exhibit A Page 2/10
E. The 2012 2015 Edition of the Uniform Plumbing Code, including Appendices A, B and I, published by the International Association of Plumbing and Mechanical Officials, is hereby adopted by reference with the additions, deletions and exceptions contained in Chapter 51-56 WAC; provided, that Chapters 12 and 15 of this code are not adopted; provided further, that those requirements of the Uniform Plumbing Code relating to venting and combustion air of fuel-fired appliances as found in Chapter 5 and those portions of the code addressing building sewers are not adopted.
F. The 2015 Edition of the Washington State Energy Code including commercial and residential provisions and appendices, is hereby adopted by reference with the additions, deletions and exceptions contained in Chapters 51-11C and 51-11R WAC,
F. The 2012 Edition of the International Conservation Code, Commercial, as amended by the Washington State Building Code Council in Chapter 51-11C WAC, is hereby adopted.
G. The 2012 Edition of the International Conservation Code, Residential, as amended by the Washington State Building Code Council in Chapter 51-11R WAC, is hereby adopted.
H. The 2012 Edition of the International Existing Buildings Code, published by the International Code Council, as amended by the Washington State Building Code Council in Chapter 51-50 WAC, is hereby adopted.
IG. The National Electrical Code, published by the National Fire Protection Association, as adopted and enforced by Tacoma Public Utilities, is hereby adopted.
J. The 2013 National Fire Protection Association Standards, 13, 13D, 13R and 72 are hereby adopted.
(Ord. 623 § 2 (Exh. A), 2013; Ord. 591 § 1, 2011; Ord. 587 § 2, 2011*; Ord. 570 § 2, 2010; Ord. 497 § 3, 2007; Ord. 408 § 3, 2004).
*Code reviser’s note: Section 1 of Ordinance 587 states: “The amendment of Chapter 14.05 Building and Construction Code of the University Place Municipal Code as provided for in Section 2 shall not apply: (1) to any vested permit application that is lawfully entitled to be processed under the prior Building and Construction Code; or (2) to any enforcement action taken by the City to enforce the provisions of prior Building and Construction Code.”
14.05.040 Conflicts between codes. In case of conflict among the building code, the residential code, the mechanical code, the fire code, and the plumbing code, the first named code shall govern over those following. In case of conflicts between other codes and provisions adopted by this chapter, the code or provision that is most specific, as determined by the Building Official, shall apply.
(Ord. 623 § 2 (Exh. A), 2013; Ord. 570 § 2, 2010; Ord. 497 § 3, 2007; Ord. 408 § 3, 2004).
14.05.050 Fire Code Official designated. Inspections and code enforcement of the fire code shall be conducted by the University Place Fire Code Official. Conflicts of code interpretation shall be determined by the Building Official.
(Ord. 662 § 1 (Exh. A), 2015; Ord. 623 § 2 (Exh. A), 2013; Ord. 570 § 2, 2010; Ord. 497 § 3, 2007; Ord. 408 § 3, 2004).
14.05.060 Fees. Any fee schedule in the codes listed in UPMC 14.05.030 shall be void. All fee schedules shall be listed in a fee resolution adopted by the City Council of the City of University Place.
(Ord. 623 § 2 (Exh. A), 2013; Ord. 570 § 2, 2010; Ord. 497 § 3, 2007; Ord. 408 § 3, 2004).
14.05.070 Hours of construction. Except as otherwise provided in this chapter and in UPMC 9.05.040, the activities regulated by this chapter shall be limited to the following hours:

University Place Municipal Code Chapter 14.05 BUILDING AND CONSTRUCTION CODE
Exhibit A Page 3/10
A. Monday through Saturday: 7:00 a.m. to 7:00 p.m.
B. Sunday and legal holidays: 8:00 a.m. to 5:00 p.m.
(Ord. 623 § 2 (Exh. A), 2013; Ord. 570 § 2, 2010; Ord. 497 § 3, 2007; Ord. 408 § 3, 2004).
14.05.080 Codes – Copies on file. The City Clerk is to maintain one copy on file of each of the codes adopted by this chapter for public inspection and photocopying. These copies may be kept in the care of the Building Official.
(Ord. 623 § 2 (Exh. A), 2013; Ord. 570 § 2, 2010; Ord. 497 § 3, 2007; Ord. 408 § 3, 2004).
14.05.090 Administrative provisions. The administrative provisions as specified in Chapter 1 of the International Building Code as adopted and as subsequently amended by this chapter shall be used as the general administrative provisions for the codes listed in UPMC 14.05.030. As such, these provisions shall supersede conflicting provisions listed in other adopted codes.
(Ord. 623 § 2 (Exh. A), 2013; Ord. 570 § 2, 2010; Ord. 497 § 3, 2007; Ord. 408 § 3, 2004).
14.05.100 Building code amendments. The following sections in the adopted International Building Code are hereby amended:
A. Section 105.2, item #4 is amended to read:
Retaining walls which are not over 4 feet (1,219 mm) in height measured from the bottom of the footing to the top of the wall, provided the wall is set back from any adjacent property lines or structures a distance at least equal to the height of the wall and the material retained slopes 1:2 (or less) up and away from the wall, unless supporting a surcharge or impounding Class I, II or II-A liquids.
B. Section 111.2 is amended to read:
After the building official inspects the building or structure and finds no violations of the provisions of the codes adopted by Chapter 14.05 UPMC or other pertinent laws that are enforced by the jurisdiction, the building official shall issue a certificate of occupancy on a form developed by the City to display the information pertinent to identify the facility and code requirements.
C. Section 903.2 is amended by the addition of the following paragraphs:
The provisions of this Section shall apply to existing buildings which are altered, repaired or remodeled to more than fifty percent of its county assessment value at the time of the first permit application, or within any seventy month period of time thereafter. Any additions to an existing structure shall be considered new construction and subject to the requirements of this Section.
D. Appendix Chapter J of the International Building Code is hereby amended as follows:
A grading permit shall not be required for the following:
Mining, quarrying, excavation, processing or stock piling rock, sand, gravel aggregate or clay controlled by other regulation, provided such operations do not affect the lateral support of, or significantly increase stresses in, soil on adjoining properties or cause erosion or sedimentation on adjoining properties.
E. The following sections in the adopted International Residential Code are hereby amended:

University Place Municipal Code Chapter 14.05 BUILDING AND CONSTRUCTION CODE
Exhibit A Page 4/10
1. Section 105.2 of the International Residential Code (Work exempt from a permit) is hereby deleted and replaced with Section 105.2 (Work exempt from a permit) of the International Building Code.
2. Appendix S of the International Residential Code is hereby amended by adding the following:
An approved automatic fire sprinkler system shall be installed throughout every building which is a group of townhouses as defined in the 2012 International Residential Code, which contains three (3) or more townhouse units.
3. Appendix R of the International Residential Code is hereby amended by deleting Section 29104.1.1 Exception 4.
(Ord. 623 § 2 (Exh. A), 2013; Ord. 591 § 2, 2011; Ord. 570 § 2, 2010; Ord. 497 § 3, 2007; Ord. 463 § 1, 2005; Ord. 408 § 3, 2004).
14.05.110 Fire code amendments. The following sections in the International Fire Code are hereby amended:
A. Section 105.2 is amended by addition of a new subsection 105.2.15 to read:
Permit Fees. The City or Fire District shall collect fees for permits, plan review and inspection services as prescribed in the City of University Place “Fee Schedule.”
B. Section 202 is amended as follows:
Fire Wall. A fire-resistance-rated wall having protected openings, which restricts the spread of fire and extends continuously from the foundation to or through the roof, with sufficient structural stability under fire conditions to allow collapse of construction on either side of the wall without collapse of the wall. A Fire Wall shall not be allowed to create a separate building that avoids the requirement for approved automatic fire sprinkler systems.
C. A new Section 503.2.1.1 is added as follows:
Number of Accesses. More than one Emergency Vehicle Access may be required for commercial developments when it is determined that an access by a single street may be impaired by vehicle congestion, condition of terrain, climatic conditions or other factors that could limit access, unless acceptable mitigation is provided.
D. The following new subsections are added to Section 503.3:
503.3.1 Striping. Painted lines of red traffic paint shall mark fire apparatus access six (6) inches in width to show the boundaries of the lane. The words “NO PARKING FIRE LANE” shall appear in four (4) inches of white letters at 25 feet intervals on the red border markings along both sides of the fire lanes. Where a curb is available, the striping shall be on the vertical face of the curb.
503.3.2 Signs. Signs shall read “NO PARKING FIRE LANE” and shall be twelve (12) inches wide and eighteen (18) inches high. The signs shall have letters and background of contrasting colors, readily legible from a fifty (50) foot distance. Signs shall be permanently affixed to a stationary post and bottom of the sign shall be six feet, six inches (6'6") above finished grade. Signs shall be spaced not more than fifty (50) feet apart. Signs may be installed on permanent buildings or walls or as approved by the code official.
E. Section 505.1 is amended as follows:
New and existing commercial/multifamily buildings shall have approved address numbers, building numbers or approved building identification placed high on the building to be plainly legible and visible for the street or road fronting the property. These numbers shall contrast

University Place Municipal Code Chapter 14.05 BUILDING AND CONSTRUCTION CODE
Exhibit A Page 5/10
with the background. Address numbers shall be Arabic numerical or alphabet letters. Numbers shall be a minimum of twelve (12) inches high. Individual unit/suite or space numbers or letters shall be 4" in size and contrasting with the background and visible for the approach side or angle.
New and existing residential structures shall have approved address numbers placed in a position that is plainly legible and visible for the street or road fronting the property. These numbers shall contrast with the background. Address numbers shall be a minimum of four (4) inches high with a minimum stroke of (.05) inch for buildings that are under fifty (50) from the street, six (6) inches high with a minimum stroke of (.05) inch for buildings that are more than fifty (50) from the street. Where access is by means of a private road or driveway and the structure can't be viewed from a public way, a monument, pole or other sign shall be used to identify the structure.
F. A new Section 507.5.4.1 is added reading:
Fire protection equipment and fire hydrants. Fire protection equipment and fire hydrants shall be clearly identified in an approved manner to prevent obstruction by parking or other obstruction. A minimum unobstructed distance of 15 feet shall be maintained on both sides of a fire hydrant along the access roadway.
G. Section 601 is amended by the addition of a new Subsection 601.1.1 as follows:
601.1.1 Commercial Kitchen Hoods. All kitchen hoods and cooking surfaces where grease-laden vapors are produced shall be protected by an approved UL300 system by January 1, 2012.
H. Section 901 is amended by the addition of a new Section 901.118.2 to read:
In the event of more than two false alarms in any 90-day period the Chief may charge a fee for fire department response as specified in the City of University Place “Fee Schedule.”
EXCEPTIONS: False alarms resulting from the failure of a fire alarm service technician notifying the central proprietary or remote monitoring station shall be billed at the rate specified in the City of University Place “Fee Schedule.”
For the purpose of this Section, a false alarm shall be defined as any unintentional activation of the fire alarm or detection system which is the result of improper installation, maintenance or use of that system.
Fire alarm system control units shall be provided with an approved sign indicating such fees will be imposed.
I. Section 903.2.8 is amended by the addition of a new Section 903.2.8.1 reading:
All Group R-3 occupancies requiring 2,000 gallons per minute of fire flow per Appendix B of the International Fire Code shall install an approved fire sprinkler system.
J. Section 903.2.1 is amended to read as follows:
903.2.1 Group A. An approved automatic sprinkler system shall be provided throughout buildings and portions thereof as provided in 903.2.1.1 – 903.2.1.3 below. For group A-5 occupancies, the automatic sprinkler system shall be provided in the spaces indicated in Section 903.2.1.5.
K. Section 903.2.1.1 is amended to read as follows:

University Place Municipal Code Chapter 14.05 BUILDING AND CONSTRUCTION CODE
Exhibit A Page 6/10
903.2.1.1 Group A-1. An approved automatic sprinkler system shall be provided for Group A-1 where one of the following conditions exists:
1. The building exceeds 5,000 square feet;
2. The building has an occupant load of 300 or more;
3. The building contains a multi-theater complex.
4. The fire area is located on a floor other than a level of exit discharge serving such occupancies.
L. Amend Section 903.2.1.2 to read as follows:
903.2.1.2 Group A-2. An approved automatic sprinkler system shall be provided for Group A-2 occupancies where one of the following conditions exists:
1. The building exceeds 5,000 square feet;
2. The building has an occupant load of 100 or more.
3. The fire area is located on a floor other than a level of exit discharge serving such occupancies.
M. Amend Section 903.2.1.3 to read as follows:
903.2.1.3 Group A-3. An approved automatic sprinkler system shall be provided for Group A-3 occupancies where one of the following conditions exists:
1. The building exceeds 5,000 square feet;
2. The building has an occupant load of 300 or more.
3. The fire area is located on a floor other than a level of exit discharge serving such occupancies.
N. Amend Section 903.2.1.4 to read as follows:
903.2.1.4 Group A-4. An approved automatic sprinkler system shall be provided for Group A-4 occupancies where one of the following conditions exists:
1. The building exceeds 5,000 square feet;
2. The building has an occupancy load of 300 or more.
3. The fire area is located on a floor other than a level of exit discharge serving such occupancies.
O. Amend Section 903.2.2 with a new subsection 903.2.2.1 to read as follows:
903.2.2.1 Group B. An approved automatic sprinkler system shall be provided for Group B occupancies where one of the following conditions exists:
1. The building exceeds 5,000 square feet.
Exception: Building containing Group B occupancies and with construction Type IA/IB, Type IIA/IIB, Type IV/VA, or Type IIB/IIIB; and the building does not exceed 12,000 square feet.
P. Amend Section 903.2.3 to read as follows:
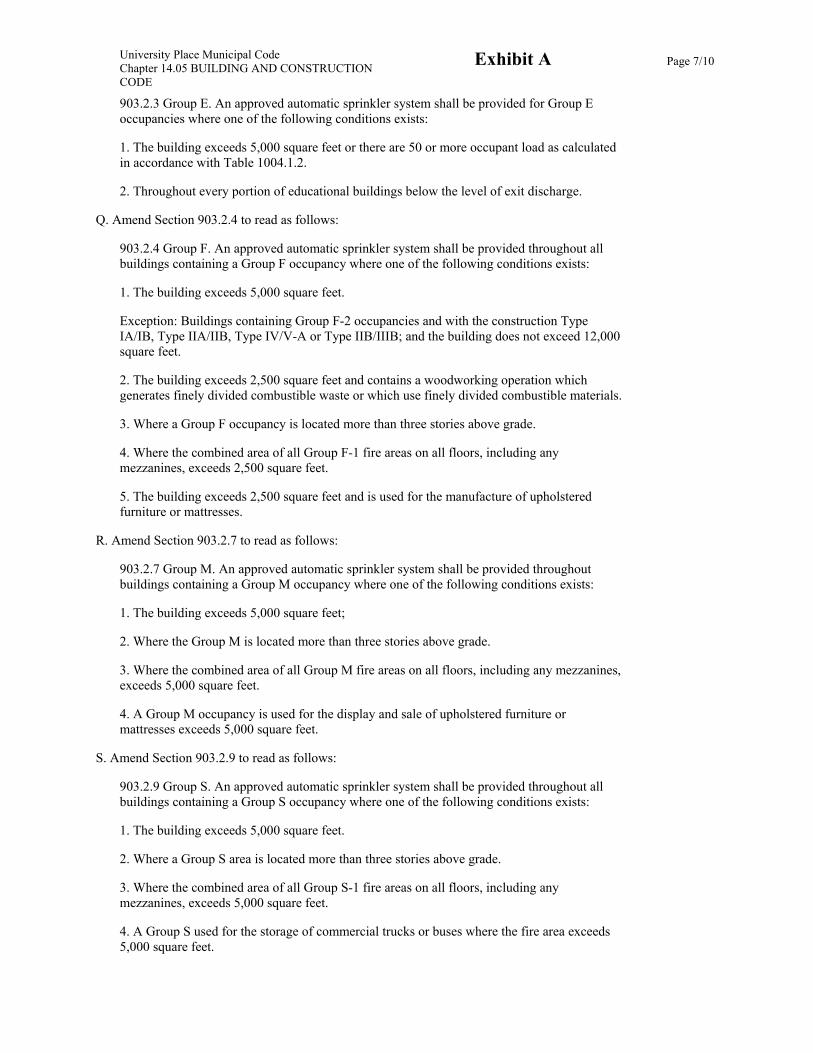
University Place Municipal Code Chapter 14.05 BUILDING AND CONSTRUCTION CODE
Exhibit A Page 7/10
903.2.3 Group E. An approved automatic sprinkler system shall be provided for Group E occupancies where one of the following conditions exists:
1. The building exceeds 5,000 square feet or there are 50 or more occupant load as calculated in accordance with Table 1004.1.2.
2. Throughout every portion of educational buildings below the level of exit discharge.
Q. Amend Section 903.2.4 to read as follows:
903.2.4 Group F. An approved automatic sprinkler system shall be provided throughout all buildings containing a Group F occupancy where one of the following conditions exists:
1. The building exceeds 5,000 square feet.
Exception: Buildings containing Group F-2 occupancies and with the construction Type IA/IB, Type IIA/IIB, Type IV/V-A or Type IIB/IIIB; and the building does not exceed 12,000 square feet.
2. The building exceeds 2,500 square feet and contains a woodworking operation which generates finely divided combustible waste or which use finely divided combustible materials.
3. Where a Group F occupancy is located more than three stories above grade.
4. Where the combined area of all Group F-1 fire areas on all floors, including any mezzanines, exceeds 2,500 square feet.
5. The building exceeds 2,500 square feet and is used for the manufacture of upholstered furniture or mattresses.
R. Amend Section 903.2.7 to read as follows:
903.2.7 Group M. An approved automatic sprinkler system shall be provided throughout buildings containing a Group M occupancy where one of the following conditions exists:
1. The building exceeds 5,000 square feet;
2. Where the Group M is located more than three stories above grade.
3. Where the combined area of all Group M fire areas on all floors, including any mezzanines, exceeds 5,000 square feet.
4. A Group M occupancy is used for the display and sale of upholstered furniture or mattresses exceeds 5,000 square feet.
S. Amend Section 903.2.9 to read as follows:
903.2.9 Group S. An approved automatic sprinkler system shall be provided throughout all buildings containing a Group S occupancy where one of the following conditions exists:
1. The building exceeds 5,000 square feet.
2. Where a Group S area is located more than three stories above grade.
3. Where the combined area of all Group S-1 fire areas on all floors, including any mezzanines, exceeds 5,000 square feet.
4. A Group S used for the storage of commercial trucks or buses where the fire area exceeds 5,000 square feet.

University Place Municipal Code Chapter 14.05 BUILDING AND CONSTRUCTION CODE
Exhibit A Page 8/10
5. A Group S occupancy is used for the display and sale of upholstered furniture or mattresses exceeds 2,500 square feet.
Exception: Buildings containing Group S-2 occupancies and with the construction Type IA/IB, Type IIA/IIB, Type IV/V-A or Type IIB/IIIB; and the building does not exceed 12,000 square feet except as provided in Section 903.2.9.
T. Amend Section 903.2.9.1 to read as follows:
903.2.9.1 Repair garages. An approved automatic sprinkler system shall be provided throughout all buildings used as repair garages in accordance with International Building Code to read as follows:
1. Buildings exceeding 5,000 square feet.
2. Buildings with a repair garage servicing vehicles parked in the basement.
3. A Group S used for the repair of commercial trucks or buses where the fire area exceeds 5,000 square feet.
U. Amend Section 903.2.9.2 to read as follows:
Buildings and structures where the area used for the storage of tires exceeds 20,000 cubic feet shall or 5,000 square feet shall be equipped throughout with an automatic fire sprinkler system in accordance with 903.3.1.1.
V. Add Section 903.2.13 to read as follows:
903.2.13 Spray booths and rooms. New and existing spray booths and spraying rooms shall be protected by an approved automatic fire-extinguishing system.
W. Amend Section 903.3.1.1.1 to read as follows:
903.3.1.1.1 Exempt locations. Sprinklers shall not be omitted from any room merely because it is damp, or has fire-resistance rated construction or contains electrical equipment. The following conditions may be exempt if approved by the fire code official.
1. Any room where the application of water, or flame and water, constitutes a serious threat to life or fire hazard.
2. Any room or space where sprinklers are considered undesirable because of the nature of the contents in the room or space.
3. Generator and transformer rooms separated from the remainder of the building by walls and floor/ceiling or roof/ceiling assemblies having a fire-resistance rating of not less than 2 hours.
X. Add Section 907.1.4 to read as follows:
907.1.4 Fire alarm control panel. Information provided by the fire alarm control panel when a signal(s) is/are received from a device or other system equipment shall include the location of the signal(s) in a manner as specific as the fire alarm system allows. The location description of the signal(s) shall be written in English, not code, and provide the location of the device to fire department personnel.
Y. Add Section 907.1.5 to read as follows:
907.1.5 Design standards. All alarm systems, new or replacement, serving 30 or more alarm actuating devices, shall be addressable fire detection systems. Alarm systems serving more

University Place Municipal Code Chapter 14.05 BUILDING AND CONSTRUCTION CODE
Exhibit A Page 9/10
than seventy-five (75) smoke detectors or more than 200 total alarm activating devices shall be analog intelligent fire detection systems. EXCEPTIONS:
1. Existing systems need not comply unless the total system remodel or expansion initiated after adoption of this code exceeds thirty (30) percent of the building.
2. When building remodel or expansion exceeds fifty (50) percent, the building must comply within 18 months of permit application.
Z. Section 901.7.0.1, Fire watch, is amended to add a new subsection:
The Fire Chief, or his or her designee, shall determine when Fire Department personnel must conduct a fire watch due to code requirements, excessive occupant load, the unusual nature of the event, the use of pyrotechnics or fireworks, the existence of hazardous condition, the inoperability of the fire protection system, or other conditions affecting safety at the event or at the property. The person responsible for the facility shall pay a fee per the fee schedule for associated costs. If more than one person is required for the fire watch, the person responsible for the facility shall pay a fee per the fee schedule. The Fire Chief or designee may notify the responsible person of the period of the fire watch and the resulting fee prior to the event.
AA. Amend Section 907.5 to add:
5. Where a new building has installed a fire suppression system, an occupant notification alarm system shall also be installed. Tenant improvements in sprinklered buildings shall require that space to provide an occupant notification system.
(Ord. 623 § 2 (Exh. A), 2013; Ord. 570 § 2, 2010; Ord. 497 § 3, 2007; Ord. 408 § 3, 2004).
14.05.120 Violations and penalties. A. Civil Violation. Except as otherwise provided in this chapter, any violation of any of the provisions of this chapter shall constitute a civil violation subject to the penalties and abatement process detailed in Chapter 1.20 UPMC.
B. Criminal Penalty. Except as otherwise provided, in addition to or as an alternative to any other penalty provided for in this chapter, any person, partnership, firm, association, or corporation violating any of the provisions of this chapter shall be guilty of a misdemeanor punishable as provided for in RCW 9A.20.021.
C. Additional Remedies. In addition to any other remedies provided by this chapter, the City may initiate injunction or abatement proceedings or any other appropriate action in the courts against any person, partnership, firm, association, or corporation who violates or fails to comply with any provision of this chapter, or any code adopted herein, to prevent, enjoin, abate, or terminate such violation or to restore a condition which existed prior to the violation. In all injunction, abatement and nuisance proceedings, the violator shall be required, in addition to any other relief, to pay the costs of such action, including reasonable attorneys’ fees.
(Ord. 623 § 2 (Exh. A), 2013; Ord. 570 § 2, 2010; Ord. 497 § 3, 2007; Ord. 408 § 3, 2004).
14.05.130 Liability. The express intent of the City of University Place is that the responsibility for compliance with the provisions of this chapter shall rest with the permit applicant and their agents.
(Ord. 623 § 2 (Exh. A), 2013; Ord. 570 § 2, 2010; Ord. 497 § 3, 2007; Ord. 408 § 3, 2004).
14.05.140 Hearings Examiner – Powers and duties. All appeals authorized by the international codes as to suitability of alternate materials and methods of construction and from other rulings, interpretations or enforcement actions of those officials charged with enforcing the codes shall be to the City’s Hearings Examiner as established by Chapter 2.20 UPMC. The Hearings Examiner shall utilize the procedures and penalties set forth in Chapter 1.20 UPMC. The Hearings Examiner shall serve in lieu of all boards of appeals mentioned or described in the international codes as adopted and amended by the City.

University Place Municipal Code Chapter 14.05 BUILDING AND CONSTRUCTION CODE
Exhibit A Page 10/10
(Ord. 623 § 2 (Exh. A), 2013; Ord. 570 § 2, 2010; Ord. 497 § 3, 2007; Ord. 408 § 3, 2004).

STUDY SESSION

Memo
DATE: July 5, 2016
TO: Mayor Javier Figueroa Members of the City Council Steve Sugg, City Manager
FROM: Steve Victor, City Attorney
SUBJECT: Marijuana Recommendation
Introduction
Mayor and Members of the City Council,
I would like to recommend changes to the City’s 2014 marijuana ordinance which would allow State-licensed and regulated marijuana business(es) within the City where permitted by State and local siting criteria.
Current U.P. Marijuana Ordinance
The City’s current marijuana ordinance (No. 637), UPMC Chapter 5.35, was adopted in 2014, after two six-month moratoriums, and it prohibits all marijuana businesses not licensed by the State and also provides that:
No application for a State-licensed marijuana business shall be accepted by University Place until such time as the federal law is amended to allow marijuana production, processing, and retail sale for recreational use in the State of Washington.
Changes to federal law
1. Rohrabacher-Farr - CJS amendment
In 2014 and 2015, Congress approved a bi-partisan budget amendment that prohibits Justice Department funds from being used to prevent states from implementing state cannabis laws. This law has been interpreted by lower federal courts to mean that federal agencies may not engage in enforcement against marijuana-related activities that comply with state laws. Known as the Rohrabacher-Farr - CJS amendment, its restrictions on federal enforcement are part of the 2016 funding bill for the Commerce-Justice-Science (CJS) budgets and expire at the end of the fiscal year, September 30, 2016. However, it may be renewed and is indicative of a change in federal politics on this issue.
#8

Page 2
2. Potential Change in Marijuana on Controlled Substances Act (CSA) Schedule
Controlled substances may have their CSA schedule status changed or be removed from CSA regulation entirely either administratively by the Drug Enforcement Agency (DEA), or by an act of Congress.
Under the CSA, drugs, substances, and certain chemicals used to make drugs are classified into five (5) distinct categories or “Schedules” depending upon the drug’s acceptable medical use and the drug’s abuse or dependency potential, with Schedule 1 containing those deemed most dangerous. Marijuana is currently listed on Schedule 1.
Since 2011, the DEA has been reviewing a petition initiated by then-Governors Christine Gregoire of Washington, and Lincoln Chafee of Rhode Island to remove marijuana from Schedule 1. The DEA went on record stating that it had all the information it needed to make a decision on the petition in September of 2015. More recently, the DEA informed federal lawmakers that it was prepared to issue a decision in 2016.
Though the DEA has made no indication of its likely response, the potentials include moving marijuana from Schedule 1 to another Schedule, which would not make it legal for “recreational” use but would allow medical research and prescription use, or removal from the Schedules and CSA entirely.
Changes to State Law
Subsequent to the adoption of the City’s 2014 ordinance, Washington courts have conclusively determined that Washington’s local governments have clear legal authority to ban marijuana stores outright. In addition, the State legislature in 2015 adopted substantial reforms to the State marijuana laws. Those amendments definitively close the much-argued issue of unlicensed, untaxed, medical marijuana dispensaries. The new laws and regulations effective this year definitively prohibit such unlicensed “green cross” storefronts. The amendments also put limits on odors from marijuana businesses which will allow for local regulation of marijuana odors.
Conclusion
Based on the Council’s legislative findings, the underlying basis for the City’s 2014 marijuana ordinance was a concern over the conflict with federal law, and a concern over the potential for proliferation of unlicensed, unregulated “medical marijuana dispensaries” which were arguably allowed under the old State marijuana law. Today, neither of those concerns is practically operative. It is clear that aggressive federal enforcement to end state marijuana legalization is not going to materialize in any realistic future scenario. In addition, the new Washington State marijuana laws preclude, and allow for easy enforcement against, any marijuana businesses not licensed and regulated by the State.
Based on the foregoing, it is my recommendation as the City’s chief law enforcement official that the Council remove the federal law-based restriction from the City’s marijuana ordinance which would then allow for the potential operation of a State-licensed and regulated marijuana business(es) in the City. The State Liquor and

Page 3
Cannabis Board has allocated only one available license for University Place, but could change that in future rulemaking without City consent. The City’s current marijuana ordinance was carefully crafted to provide effective zoning and regulatory control over licensed marijuana stores, in the event of a change in federal marijuana law, and it should serve the City well.
I must add, however, that under current State law, Washington cities and counties still have a legal right to ban all marijuana businesses within their jurisdiction, so a complete ban remains an option. Should a majority or more of the Council desire to continue a ban, I recommend considering the adoption of a simpler prohibition ordinance with new legislative findings which do not reference those on which we relied in 2014.
Potential Legislative Options
1. Amend the existing ordinance to remove the federal law reference. This would allow a State-licensed, regulated and taxed marijuana retail business(es) to open in the City under the existing City regulations, if the business can secure an allowable location.
2. Prior to considering amending the existing ordinance to remove the federal law reference, refer the topics of permitting requirements and whether to reduce buffer widths, where allowed under State law, to the Planning Commission for study and recommendations. The ultimate decision of whether to allow marijuana businesses would remain a City Council legislative decision.
3. In either of the above scenarios, refer the topic of permitting and zoning requirements for producers and processors of marijuana to the Planning Commission for study and recommendations.
4. Amend the existing City marijuana ordinance to make it a simple ban, with new legislative findings.

Business of the City Council City of University Place, WA
Expenditure Amount Appropriation Required: $0.00 Budgeted: $0.00 Required: $0.00
SUMMARY / POLICY ISSUES
On July 29, 2012, the City Council held a study session to discuss the protection of scenic views and raised questions concerning the City’s tree retention provisions. The Council requested Planning Commission review of existing regulations and adopted Resolution No. 698, which directed the Commission to recommend language to clarify existing Zoning Code provisions regarding: a. The number of trees that property owners are allowed to cut down in a three-year period; and b. City staff’s availability to consult on the determination of what constitutes a dangerous or hazardous tree. The proposed amendments address the City Council Resolution by: Authorizing staff to make certain hazard tree determinations without the need of a certified urban forester; and Allowing smaller, invasive and nuisance trees to be removed without a tree removal permit, thereby allowing
additional, but less significant, trees to be cut within a three year period. The amendments would add or modify a number of tree retention provisions, including: definitions; the size threshold for regulated trees; options for determining tree retention; the process for evaluating trees, designing projects around them, and protecting retained trees during construction; and nuisance and invasive tree provisions. They would provide consistency with the newly updated comprehensive plan by supporting policies to “protect and enhance the natural green and wooded character of the city by retaining an abundance of mature trees”. The amendments would reduce unintended consequences such as the retention of trees having little aesthetic or ecological value by providing more flexibility for developers to work with staff in developing plans that focus on protecting larger and more beneficial trees rather than smaller and less desirable trees.
BOARD OR COMMITTEE RECOMMENDATION The Planning Commission recommends approval of amendments to UPMC Chapter 19.65 Landscaping/Trees. These amendments are contained in Proposed Ordinance Exhibit A attached to this Council Bill, with modifications to the enforcement and penalties section as requested by Council at its June 20, 2016 meeting.
RECOMMENDATION / MOTION MOVE TO: Pass an Ordinance amending Chapter 19.65 Landscaping/Trees of the University Place Municipal Code
pertaining to Purpose, Enforcement and Penalties, Definitions, Exemptions, Maintenance, Urban Forest Management, Tree Retention, Tree Retention Plans, Tree Removal in Subdivisions, Tree Replacement, Tree Maintenance and Pruning, and Other Related Provisions.
Agenda No: 9
Dept. Origin: Planning & Development Services
For Agenda of: July 5, 2016
Exhibits: Proposed Ordinance Exhibit A – Proposed Amendments Concurred by Mayor: __________ Approved by City Manager: __________ Approved as to form by City Atty.: __________ Approved by Finance Director: __________ Approved by Department Head: __________
Proposed Council Action: Pass an Ordinance amending Chapter 19.65 Landscaping/Trees of the University Place Municipal Code pertaining to Purpose, Enforcement and Penalties, Definitions, Exemptions, Maintenance, Urban Forest Management, Tree Retention, Tree Removal in Subdivisions, Tree Replacement, Tree Maintenance and Pruning, and Other Related Provisions.

1
ORDINANCE NO. _____
AN ORDINANCE OF THE CITY OF UNIVERSITY PLACE, WASHINGTON, AMENDING TITLE 19 CHAPTER 19.65 LANDSCAPING/TREES OF THE UNIVERSITY PLACE MUNICIPAL CODE PERTAINING TO PURPOSE, ENFORCEMENT AND PENALTIES, DEFINITIONS, EXEMPTIONS, MAINTENANCE, URBAN FOREST MANAGEMENT, TREE RETENTION, REMOVAL IN SUBDIVISIONS, TREE REPLACEMENT, TREE MAINTENANCE AND PRUNING, AND OTHER RELATED PROVISIONS
WHEREAS, in enacting the Growth Management Act (Chapter 36.70A RCW, hereafter GMA) the
Legislature found that "uncoordinated and unplanned growth, together with a lack of common goals expressing the public's interest in the conservation and the wise use of our lands, pose a threat to the environment, sustainable economic development, and the health, safety, and high quality of life enjoyed by residents of this state"; and
WHEREAS, the GMA requires that local governments meeting certain criteria, including the City of
University Place, adopt development regulations to guide development subject to state regulations, multi-county and countywide planning policies, and comprehensive plan goals and policies; and
WHEREAS, the City Council established and appointed the Planning Commission to advise the
City Council on the following topics: growth management; general land use and transportation planning; long range capital improvement plans; and other matters as directed by the City Council; and
WHEREAS, the Planning Commission is charged with holding hearings on and preparing
development regulations for the City and making recommendations to the City Council on amendments to these regulations; and
WHEREAS, On August 20, 2012, the Council requested the Planning Commission review existing
tree preservation regulations and adopted Resolution No. 698, which directed the Commission to recommend language to clarify existing provisions regarding the number of trees that property owners are allowed to cut down in a three-year period and staff’s availability to consult on the determination of what constitutes a dangerous or hazardous tree; and
WHEREAS, On September 23, 2015, the City submitted a set of draft amendments to the
Department of Commerce to initiate the mandatory 60-day state agency review period; and WHEREAS, the state agency review period ended on November 22, 2015 and no agency
comments were received; and WHEREAS, the City issued a SEPA Determination of Non-significance on September 23, 2015
with a 14-day comment period ending October 6, 2015, and no adverse comments were received; and WHEREAS, the City published a Notice of Public Hearing in the Tacoma News Tribune on
September 23, 2015 regarding an October 7, 2015 Planning Commission public hearing to be held on the draft code amendments; and
WHEREAS, the Planning Commission conducted a public hearing on October 7, 2015 to consider
written and oral public comments on the draft amendments, considered the approval criteria listed in UPMC 19.90.030, and voted unanimously to recommend to the City Council approval of the draft amendments; and
WHEREAS, the City Council conducted a public review the recommended amendments at meetings held on January 19, 2016 and June 20, 2016; and

2
WHEREAS, the City Council has considered the approval criteria listed in UPMC 19.90.030 and adopted the following findings in support of the amendments:
1. The proposed tree retention amendments reflect, and respond to, changes that have occurred
in University Place since incorporation in 1995. The amendments will ensure consistency with University Place Comprehensive Plan goals, objectives and policies, including the following:
GOAL CC6 Promote the planning, management and preservation of a safe and healthy urban forest that
reflects community character goals by establishing effective programs, practices, landscaping standards, and guidelines.
Policy CC6A Encourage the use of native, drought-tolerant plants to provide for an attractive urban setting;
support the urban citywide tree canopy and wildlife; buffer the visual impacts of development; help reduce storm water runoff; and, contribute to the planting, maintenance, and preservation of a stable and sustainable urban forest. Require landscaping with a drought-tolerant native plant component (trees, shrubs and groundcovers) to be installed when development activities, including new construction and substantial alterations of existing structures, parking areas, streets and sidewalks, take place.
Policy CC6B Ensure that City landscaping standards and guidelines promote plant retention, selection,
installation and maintenance. These standards are intended to maintain existing trees when practicable, more effectively ensure that plants survive and thrive, minimize conflicts with infrastructure, and in some cases provide a substantial visual screen or buffer. The City should periodically review the effectiveness of its landscaping and tree retention requirements and amend them as necessary to ensure they will achieve desired urban forest goals and objectives.
GOAL EN3 Protect and improve the essential livability of the urban environment. TREES AND LANDSCAPING Policy EN3K Protect and enhance the natural green and wooded character of University Place. Retain an
abundance of mature trees and a healthy understory to maintain community identity and contribute to a healthy environment by cleaning the air, producing oxygen, reducing surface water run-off, providing wildlife habitat, absorbing sound and masking noise, and reducing energy costs through shading and windbreak functions.
Policy EN3L Encourage preservation of significant trees and planting of new trees in locations that allow normal
growth patterns, support energy conservation and complement view access, light, privacy and safety needs. Plant deciduous trees where summer shade, winter solar gain, and seasonal change will be beneficial or desired. Plant evergreen trees where year-around beauty, visual screening and noise buffering are desired. Require street trees along all new and substantially modified arterial, collector and local streets.
Policy EN3O Require tree surveys for new developments to identify healthy significant trees that should be
preserved. Focus tree retention on the perimeter of a development site where building setbacks already preclude construction while also preserving significant trees in the interior of a site. Protect trees designated for preservation from development impacts. Require replacement trees if the requisite number of trees cannot be preserved.

3
2. The proposed amendments are in the best interest of the citizens and property owners of the City as the amended regulations will more carefully direct growth and manage change in the community with respect to tree retention in a manner consistent with community aspirations;
3. The proposed amendments enhance the public health, safety, comfort, convenience or general
welfare by refining tree retention regulations that will more effectively implement Comprehensive Plan objectives and directives supported by the community;
NOW, THEREFORE, THE CITY COUNCIL OF THE CITY OF UNIVERSITY PLACE,
WASHINGTON, DOES ORDAIN AS FOLLOWS: Section 1. University Place Municipal Code Title 19 Zoning Amendments Adopted. The City of
University Place Municipal Code is hereby amended as indicated in Exhibit “A” attached. Section 2. Severability. If any section, sentence, clause or phrase of this Title shall be held to be
invalid or unconstitutional by a court of competent jurisdiction, such invalidity or unconstitutionality shall not affect the validity or constitutionality of any other section, sentence, clause or phrase of this Title.
Section 3. Publication and Effective Date. A summary of this ordinance, consisting of its title,
shall be published in the official newspaper of the City. This ordinance shall be effective five (5) days after its publication.
PASSED BY THE CITY COUNCIL ON _____________, 2016.
_______________________________________ Javier H. Figueroa, Mayor ATTEST: _________________________________ Emelita Genetia, City Clerk APPROVED AS TO FORM: _________________________________ Steve Victor, City Attorney Published: xx/xx/xx Effective Date: xx/xx/xx

1
City of University Place
Tree Retention Code Amendments
Chapter 19.65 Landscaping/Trees 19.65.010 Purpose.
The purposes of this chapter are:
A. To implement the City’s vision statement and the goals and policies of the Comprehensive
Plan;
B. To protect and enhance the natural green and wooded character of University Place for
aesthetics and community ;enjoyment;
C. To promote the compatibility between land uses and zones by reducing the visual, noise and
lighting impacts of development on users of the site and abutting uses;
D. To protect critical areas from the impacts of development, by facilitating aquifer recharge,
protecting urban wildlife habitat, reducing stormwater runoff and pollution of surface waters,
and controlling dust, erosion and sedimentation;
E. To promote the use and protection of vegetation native and common to the Puget Sound
region;
F. To promote the application of water‐efficient techniques in the design, installation and
maintenance of landscaping; and
G. To provide physical safety of pedestrians and motorists through the proper location and
placement of vegetation;.
H. To protect public health through the absorption of air pollutants and contamination, and by
capturing carbon dioxide;
I. To provide visual screening and summer cooling;
J. To reduce energy demand and urban heat island impacts; and
K. To enhance property values; and.
L To preserve scenic views, including views from public property and the City right‐of‐way.
19.65.020 Authority.
The Department shall review and may approve, disapprove or approve with modification all
permits, site plans, and/or landscape plans for all uses and developments which are required to
comply with the provisions of this section. This section includes landscaping requirements and
urban forest management. Chapter 76.09 RCW and Chapter 222‐20 WAC authorize the urban
forest management provisions of this chapter.

2
19.65.030 Disclaimer of liability.
The City is not liable for any damage to property or injury to persons that results because of
landscaping or trees that must be retained as required by this section whether by natural
and/or other causes. It shall be the responsibility of property owners to question the safety of
landscape requirements or the health and safety of trees and to request modification of
landscape requirements or review of diseased and/or dangerous trees as provided for in this
section.
19.65.040 Enforcement and penalties.
A. It shall be unlawful to remove any tree or vegetation in a manner inconsistent with this
chapter, an approved tree preservation plan and/or a plat note which requires the preservation
of trees and/or vegetation.
B. In addition to any other sanction or penalty or any remedial or administrative procedure
available under the University Place Municipal Code or State law for a violation of any provision
of this chapter or failure to comply with any permit or other written order or decision issued
pursuant to this chapter, a monetary penalty of one thousand dollars for each tree cleared, cut,
damaged or removed, or for each act of clearing, cutting, damaging, or removing
shallvegetation, shall be assessed. that is the greater of:
1. One thousand dollars for each tree cleared, cut, damaged or removed, or for each act of
clearing, cutting, damaging, or removing vegetation; or
2. Triple the value of each tree cleared, cut, damaged or removed, or of the vegetation cleared,
cut, damaged, or removed. The replacement value shall be determined using the methods
described in the Guide for Plant Appraisal published by the International Society of
Arboriculture, most current edition; or
3. An amount reasonably determined by the Director to be equivalent to the economic benefit
that the violator derives from the violation as measured by the greater of the resulting increase
in market value of the property or the value received by the violator, or savings of construction
costs realized by the violator.
C. In the case of urban forest management, the City mayshall impose a six‐year moratorium on
the development of the subject property when a property owner either fails to obtain a tree
removal permit or violates the provisions of a valid tree removal permit, including failure to
disclose the intended use of the property.
D. In addition to the monetary penalties above, each tree illegally removed shall be replaced
with new trees of the same species at a replacement rate of three trees for every tree removed.
The City may authorize an alternative species or cultivar if it would be a more suitable and
beneficial selection for a specific location given unique site characteristics.

3
19.65.050 Permits.
A. Tree Removal Permit. A tree removal permit is required to cut or otherwise remove six or
more trees in any consecutive 36‐month period. An application for a tree removal permit and
any information required by this section shall be submitted for any tree removal activity not
exempt by this section. If six or more trees are to be removed, a tree removal permit
application shall be submitted at the same time an application for a building permit,
development permit or land use permit is submitted. The application shall be on a form
provided by the City and shall be accompanied by documents and information as are
determined to be necessary by the Director. Notification of abutting and adjacent property
owners is required.
B. The City may refer applications to an urban forester for comments. Any permit granted shall
expire one year from the date of issuance. Upon a showing of good cause, a permit may be
extended by the Director for one six‐month period. The permit may be suspended or revoked
by the Director because of incorrect information supplied or any violation of the provisions of
this chapter. No work shall begin until a public notice has been posted on the subject site in a
conspicuous location. The notice shall remain posted until the project has been completed.
19.65.060 Definitions.
“Brushing” means the practice of removing significant groundcover by hand or hand‐operated
equipment to create better visibility on a property for purposes such as marketing or surveying
of said property.
“Christmas tree” means any evergreen tree or the top thereof, commonly known as a
Christmas tree, with limbs and branches, with or without roots including fir, pine, spruce, cedar
and other coniferous species.
“Clearing” means the cutting, moving on site, or removal of standing or fallen timber (including
stumps); the removal or moving on site of stumps; or the cutting or removal of brush, grass,
groundcover, or other vegetative matter from a site in a way which exposes the earth’s surface
of the site.
“Conversion” means converting the use of land from forestry to non‐forestry uses.
“Critical root zone” is an area where the tree’s roots are located. This root zone is generally the
area surrounding a tree at a distance which is equal to one‐foot radius for every diameter‐inch
measured at breast height (DBH) or four and one‐half feet above ground.
“Crown” is the area of a tree containing leaf‐ or needle‐bearing branches.
“Development” is the division of a parcel of land into two or more parcels; the construction,
reconstruction, conversion, structural alteration, relocation, or enlargements of any structure;
any mining, excavation, landfill, stockpiling, clearing or land disturbance; and any use or
extension of use of the land.

4
“Diameter at breast height” (DBH) is a tree’s diameter in inches at four and one‐half feet above
the ground. On multi‐stemmed or multi‐trunked trees, the diameter shall be the diameter
equivalent to the sum of trunk areas measured at four and one‐half feet above ground.
“Drip line” of a tree means an imaginary line on the ground created by the vertical projection of
the foliage at its greatest circumference.
“Forest practices” means any activity relating to growing trees and harvesting or processing
timber including but not limited to road and trail construction; harvesting; thinning;
reforestation, fertilization, prevention and suppression of diseases and insects; salvage of trees;
and brush control.
“Groundcover” means types of vegetation which are normally terrestrial such as shrubs, vines,
grasses, and herbaceous plants.
“Hazard tree” is any tree with a structural defect and/or disease which makes it subject to a
high probability of failure and with a proximity to persons or property that makes it an
imminent threat.
“Invasive tree” is a species that was introduced by humans to locations outside of their native
range that spread and persist over large areas. Invasive species negatively impact natural
ecosystems by displacing native species, reducing biological diversity, and interfering with
natural succession. Tree species known to be invasive in the Pacific Northwest are listed in
UPMC 19.65.330.
“Limited tree removal” is the removal of five trees or less in any 36 consecutive months for the
purposes of property development, solar access, general property and utility maintenance,
landscaping or gardening. Tree removal in a landslide and erosion hazard area, a wildlife habitat
area or a wetland or wetland buffer is prohibited unless specified otherwise.
“Nuisance tree” is a species that is known to be weak‐wooded and unstable, or one that
exhibits other traits that render it prone to creating nuisance conditions for persons and
property located in close proximity to such trees. Tree species categorized as nuisance trees in
University Place are listed in UPMC 19.65.340.
“Outdoor storage area” means an area on a site where materials, merchandise and/or
equipment is stored outdoors.
“Remove” or “removal” is the act of removing a tree by digging up, cutting down, or any act
which causes the tree to die within a period of three years, including, but not limited to,
damage inflicted on the root system by machinery, storage of materials, or soil compacting, or
changing the ground level in the area of the tree’s root system; damage inflicted on the tree
permitting infections or infestation; excessive pruning; topping; paving with concrete, asphalt,
or other impervious material within the drip line; or any other action which is deemed harmful
to the tree.

5
“Replacement tree” means any self‐supporting perennial woody plant that matures at a height
greater than six feet and measures at least six feet in height at the time of planting and at 24
inches above the root ball has a diameter of at least three inches for evergreen trees, and is
fully branched and has a minimum caliper of two inches and a minimum height of 10 feet at
time of plantingone and one‐half inches for deciduous trees.
“Significant tree” means a tree identified on the City’s inventory of significant trees.
“Tree” means any living woody plant characterized by one or more main stems or trunks and
many branches, with the trunk or at least one main stem having a diameter of at least twelvesix
inches DBH or more at breast height (DBH) for evergreen trees and at least nine inches DBH for
deciduous trees. Invasive, nuisance or hazard trees, of any size, as determined by the City, are
not considered trees for the purposes of this chapter.
“Tree removal permit” means a permit issued by the City to permit clearing and/or tree
removal pursuant to the provisions of this chapter.
“Tree Topping” is an extreme form of crown reduction that removes whole tops of trees or
large branches and/or trunks from the tops of trees, leaving stubs or lateral branches that are
too small to assume the role of a terminal leader – the vertical stem at the top of the trunk.
Tree topping severely cuts back large trees to a predetermined size in a manner that:
• leaves large exposed wounds that can become infested; ruins tree structure;
removes too much foliage, disrupting the tree’s energy storage;
stimulates vigorous new growth, which is prone to breakage;
increases tree maintenance costs; and
destroys a tree’s appearance and value.
“Understory” means small trees and shrubs growing below the canopy of larger trees.
“Urban forest management” means the management of trees in the City, whether on public or
private property, for the purposes of but not limited to maintaining the wooded character of
the City and property values; providing wildlife habitat, buffering, and wind protection;
facilitating aquifer recharge and slope stabilization and enhancing our healthy, safe, and
attractive environment.
“Urban forester” is a licensed professional approved by the City with academic and/or field
experience that makes him or her a recognized expert in tree preservation and management.
For City approval, an urban forester shall be a Society of American Foresters (SAF) Certified
Forester, a certified arborist with the an International Society of Arboriculture (ISA) Certified
Arborist, or an American Society of Consulting Arborists (ASCA) Registered Consulting Arborist.
Submittal of additional credentials including those of a registered arborist with the American
Association of Consulting Arborists is encouraged. An urban forester shall have the necessary

6
training and experience to use and apply the International Society of Arboriculture’s guide to
evaluation and management of trees, “Guide to the Evaluation of Hazard Trees in Urban Areas,”
and to successfully provide the necessary expertise relating to management of trees specified
in this chapter.
19.65.070 Exemptions.
The following shall be exempt from the tree removal permit requirements of this chapter but
shall satisfy all standards and requirements of UPMC 19.65.240 and other sections as noted
below. Except for limited tree removal, a written exemption must be obtained from the City
prior to commencing any clearing or tree removal.
A. Limited tree removal except in the following critical areas: landslide and erosion hazard area,
fish and wildlife habitat area or its buffer, and/or wetland or wetland buffer ‐‐ unless authorized
pursuant to Title 17 Critical Areasotherwise specified. City notification is required to assist in
record keeping.
B. Removal of trees where the trunks are located and groundcover in conjunction with new
construction within a maximum of 10 feet of an existingthe perimeter of the new building that
will remain on a site.and any area proposed to be cleared for driveway and septic purposes as
indicated on a plot plan submitted with a building permit application; provided, however, the
Director may require minor modifications in siting and placement of driveways, utilities and
septic tank drain field systems where such modifications will promote the goals of this chapter
and still satisfy the need and function of improvements. This exemption does not allow tree
removal prior to preliminary plat, final plat, or short plat approval.
C. Removal of hazard trees and groundcover in emergency situations involving immediate
danger to life or property or substantial fire hazards as determined by the City. Replacement of
any trees removed is required in accordance with the replacement provisions of this chapter.
D. Removal of a hazard tree(s) following an affirmative recommendation by an ISA‐ Certified
Arborist or ASCA Registered Consulting Arborist that the tree is a safety hazard and should be
removed. The Certified arborist shall conduct an assessment in accordance with ANSI A300
(Part 9) – 2011 Tree Risk Assessment and provide a written report that includes: identification
and location of the specified trees; a description of the methods used; tree risk assessment
data; recommendations for mitigating risk or additional assessments; and, recommendations
for monitoring and follow‐up. The arborist performing this work shall have a Tree Risk
Assessment Qualification (TRAQ) or equivalent. The City may, at its discretion and in
consideration of ISA tree risk assessment guidance, waive the certified or registered arborist
requirement if City staff conducts an on‐site inspection and determines that a tree clearly and
obviously constitutes a hazard. City staff should consider the following conditions when
conducting a tree risk assessment:
Is the tree dead, diseased, decayed, burned or otherwise damaged;

7
Are there multiple weak branch attachments, broken and/or hanging limbs;
Is the foliage sparse, and/or discolored;
Is there evidence of root rot/exposed, undermined or pruned roots or a restricted root area;
If leaning what is the degree of lean. Are roots broken or is the soil heaving or cracking;
Is the top broken on conifers; and
Are there targets such as buildings, parking, or traffic or pedestrian facilities below the tree? Can the target(s) be moved
Upon such inspection, staff may determine that further review by a certified or registered
arborist is required before making a determination as to whether a tree constitutes a hazard.
use the most recent edition of the Photographic Guide to the Evaluation of Hazard Trees in
Urban Areas and the Tree Hazard Evaluation Form published by the International Society of
Arboriculture.
E. Removal of obviously dead or diseased groundcover or windthrowtrees. Replacement of any
trees removed is required in accordance with the replacement provisions of this chapter.
F. Emergencies. Removal of trees necessary to protect public safety or public or private
property from imminent danger in response to emergencies declared by the City, County, State
or Federal governments. In the case of a declared emergency, the written approval
requirement shall be waived.
G. Removal of street trees, when performed by or on behalf of the City to maintain rights‐of‐
way and in the interest of public safety.
H. Removal of trees that interfere with existing utility transmission lines when pruning is not
sufficient to alleviate the interference condition. Topping is prohibited. Utility pruning shall be
conducted in accordance with the latest edition of the United States Department of
Agriculture’s Publication NA‐FR‐01‐95 How to Prune Trees available on‐the web, except that
tree pruning for utilities shall be conducted in accordance with the latest edition of the
International Society of Arboriculture’s Best Management Practices – Utility Pruning of Trees.
19.65.080 Required water conservation.
During periods when water conservation is required, new landscaping and maintenance of
existing required landscaping shall not be required. However, following the lifting of water
restrictions, any landscaping required during the period of the required conservation shall be
installed and all required landscaping shall be restored to a healthy condition. Any required
landscaping that has died shall be replaced in accordance with UPMC 19.65.220.
19.65.090 Landscaping.
Landscaping shall be located along street frontages, around the perimeter, in parking areas
and/or on other areas of a site in accordance with the following sections and the landscape
tables in UPMC 19.65.150(A) and (B). This subsection shall apply to the following:

8
A. New Development. All new uses shall provide landscaping in accordance with the
requirements of this chapter. The landscape tables indicate the particular landscape category
which applies to proposed uses. The tables and other sections of this chapter shall be used as
standards when landscaping requirements are imposed as part of a discretionary permit review
process.
B. Expansions of or Alterations to Existing Uses. The requirements of this section shall apply to
remodeling or expansion of existing uses under either of the following conditions: (1) when the
remodeling or expansion results in the remodeling of or addition of 10 percent or more of the
gross floor area of the existing principal building or, collectively, to any principal buildings in a
development projectcommercial center; or (2) when the remodeling or expansion results in
cumulative improvements to the interior and/or exterior of a structure (except for normal
maintenance, repair, and life/safety improvements including but not limited to reroofing,
painting, recarpeting, fire sprinkler installation, and improved exiting and accessibility), which
within a 12‐month period exceeds a cumulative value of 10 percent of the assessed value of the
structure as assessed by the Pierce County Assessor’s Office. All landscape requirements of this
section shall apply to the entire property. The landscape tables indicate the particular
landscape category which applies to proposed expansion or alteration. Where conformance
with this section would create a nonconformity of parking standards or would conflict with the
location of existing buildings on the lot, the Director shall determine how the code is to be
applied. The Director shall use landscape averaging by requiring more landscaping in one area
and reducing it in another. In determining how to apply the landscaping requirements in such
circumstances, the Director shall use the following criteria in deciding which of the landscaping
requirements to adjust, listed in the order of highest importance:
1. Compliance with street frontage landscaping standards;
2. Compliance with perimeter landscaping standards;
3. Compliance with internal area of parking lot standards;
4. Compliance with other landscaping standards of this title.
C. Change of Use or Occupancy. When the use of a building or lot changes to another use which
does not involve expansion or remodeling as provided in subsection (B) of this section, such use
need not provide additional landscaping except under the following circumstances:
1. Additional off‐street parking is required, in which case the landscaping required by UPMC
19.65.110 shall be required for all new parking spaces or parking facilities provided.
2. The use is subject to special use permit in which case the review authority shall establish the
minimum landscape requirements for the specific use.
3. New uses, storage or other activities will take place outdoors, in which case the requirements
of UPMC 19.65.120 shall apply.

9
4. The previous use did not comply with the requirements of the landscaping regulations in
effect at the time it was established.
5. Difference of Standards. Where there is a difference in the standards listed in this section
and the specific requirements listed for specific uses, the more stringent will apply. The Director
may permit alternative landscaping, as provided in UPMC 19.65.170, when the overall site
development plan proposed provides equivalent or better results than required by this title.
6. If contiguous lots are developed jointly, the requirement for perimeter buffering between
the jointly developed lots shall not be required.
7. No street frontage landscaping is required for single‐family or duplextwo‐family dwellings
constructed on a lot of record that existed on the effective date of this code.
19.65.095 Difference of standards.
Where there is a difference between the standards listed in this chapter and the specific
requirements listed for specific uses, the more stringent will apply. Landscaping design
standards and guidelines specified for small lot development, multifamily development, and
projects located within the Town Center, Mixed Use, Mixed Use – Office, Mixed Use –
Maritime, or Community Commercial zones shall prevail when conflicts between this chapter
and these specific requirements exist. The Director may permit alternative landscaping, as
provided in UPMC 19.65.170, when the overall site development plan proposed provides
equivalent or better results than required by this title.
19.65.100 Street frontage landscaping.
Any portion of any use, except individual single‐family or duplextwo‐family lots, that abuts a
public right‐of‐way shall install Level III landscaping unless otherwise specified. See Figure 1 in
UPMC 19.65.140.
19.65.105 Transition landscaping requirements.
Development or redevelopment of uses not permitted in the R1 or R2 zones on those portions
of properties that abut or are across a local street (as defined in Chapter 13.20 UPMC) from an
R1 or R2 zoned property shall:
A. Install Level I landscaping within the front yard setback abutting all local streets. See Figure
13 in UPMC 19.65.140.
B. Install a solid 100 percent sight‐obscuring six‐foot‐high fence or wall within or along the
required setback along all local streets. The location of the fence or wall shall be approved by
the Director. For the purposes of this section, a cyclone fence with slats is not a sight‐obscuring
fence.

10
19.65.110 Parking lot and impervious surface area landscaping.
A. The intent of this section is to break up and reduce the barren appearance of parking,
circulation, loading, storage and other large impervious surface areas of a site. To the extent
practicable, landscaped areas shall be dispersed throughout the impervious surface area.
B. Perimeter Street Landscaping. Any portion of a parking lot, outdoor sales area or other large
impervious surface area that is within 20 feet of a public road right‐of‐way shall install Level III
landscaping along that portion of the parking lot perimeter. See Figure 3 in UPMC 19.65.140.
C. Interior Landscaping. All surface parking lots with 10 or more spaces or combined outdoor
sales areas greater than 1,600 square feet must provide interior landscaping as follows:
1. Row Requirement. The maximum number of consecutive vehicle parking or sales display
spaces without an intervening island or peninsula is 10, unless the row fronts on a landscaping
area with a minimum planting width of eight feet. For such rows, the maximum consecutive
parking spaces without an intervening island or peninsula is 20 spaces. A landscaping island or
peninsula is required at the end of each row of four or more automobile parking spaces that
terminates within a parking or circulation area.
2. Island/Peninsula Requirement. Landscape islands and peninsulas shall have a minimum
planting width and length of eight feet and minimum planting area of 120 square feet. There
shall be at least one tree planted on every island and peninsula.
3. Planting Type and Density. The following landscaping is the minimum required for each 300
square feet of impervious surface landscaping: one two‐inch caliper deciduous tree or one six‐
foot‐tall evergreen tree; five five‐gallon shrubs; and groundcover. There shall be a minimum of
one deciduous canopy tree per four parking spaces or vehicle storage or sales display spaces.
Deciduous canopy trees shall be selected in accordance with the Approved Street Tree Palette
provided in the streetscape standards adopted pursuant to Chapter 19.54 UPMC.
4. Curb/Curb Edge. Planting areas shall be fully protected by curbs as a means of preventing
injury to plants from pedestrian or vehicular traffic and to prevent landscaping material from
entering the storm drainage system. No trees or shrubs shall be planted within two feet of a
curb edge. Groundcover is required within this two‐foot area.
19.65.120 Perimeter landscape buffering.
A. Intent. The intent of this section is to provide for a physical, visual and noise buffer and
transition between uses. Different landscape/buffer levels are used to address different uses,
compatibility and in conjunction with new subdivisions.
B. General Requirements. Refer to the tables in UPMC 19.65.150(A) and (B) for the landscape
level required by the proposed use, expansion or alteration. Each lot line will have a required
landscape level based on the abutting land use except that, when two or more properties abut
and share a common driveway or parking area, perimeter landscaping along the shared

11
property line may be waived. Pedestrian walkways shall be permitted to cross required
landscape areas. Refer to Figures 1, 2, and 3 in UPMC 19.65.140 for illustration of perimeter
landscaping requirements.
C. If contiguous lots are developed jointly, the requirement for perimeter buffering between
the jointly developed lots shall not apply.
D.Maintenance: Where landscaping has been required or a natural buffer has been set aside,
no other use including, but not limited to, the construction of structures is allowed unless
authorized by the original permit.
19.65.125 Residential development canopy tree requirement.
A minimum of one deciduous tree per 3,000 square feet of lot area shall be planted on each
new single‐family or duplex lot created through the short plat or conventional preliminary
plat/final plat process after the effective date of the ordinance codified in this section. In
addition, a minimum of one deciduous or evergreen tree per 2,000 square feet of dedicated
common open space shall be planted within a project’s open space area. If the calculation of
the number of trees results in a fraction of one‐half or greater, the fraction and the number of
trees shall round up to the next whole number. If this calculation results in a fraction of less
than one‐half, the fraction and the number of trees shall round down to the previous whole
number.
Planting on an individual lot shall occur prior to the building permit being finaled for a new
dwelling unit on the lot. Trees required under this provision shall be in addition to any street
trees required to be planted within a public street right‐of‐way or replacement trees required
to be planted in accordance with UPMC 19.65.310. This section shall not apply to small lot
developments designed in accordance with Chapter 19.53 UPMC.
19.65.130 Interior landscaping/site stabilization.
All interior portions of lots, parcels or tracts which are not developed with buildings, parking
areas and/or accessory uses or where other more specific landscaping regulations are required
shall be landscaped with Level IV landscaping, unless native vegetation already exists, and shall
be maintained. This includes temporary stabilization of development sites.
19.65.140 Landscape levels.
A. Level I: Visual Screen. Level I landscaping is intended to provide a very dense sight barrier to
significantly separate uses and zoning districts. It shall generally consist of a mix of
predominantly evergreen plantings including living trees, shrubs and groundcovers. The choice
and spacing of plantings shall be such that they will form a dense hedge sufficient to obscure
sight through the screen within three years after planting. Where a sight‐obscuring fence is
required, chain‐link fencing with slats shall not be considered to be sight‐obscuring. Level I
landscaping shall consist of the following:

12
1. A minimum of two staggered rows of evergreen trees planted along the entire length of the
required buffer. Trees shall be chosen and spaced so as to form an effective visual screen,
which creates a solid sight‐obscuring barrier within three years of planting. Evergreen trees
shall be planted no greater than 15 feet on center in each row.
2. The width of a Level I landscape buffer shall be no less than 20 feet. The area which is not
planted with trees shall be planted with shrubs and groundcover. Shrubs shall be spaced no
greater than five feet on center. Shrubs and groundcover shall be planted to attain a coverage
of 90 percent of the planting area within three years.
3. Lawns may be used to cover up to 75 percent of the landscape area which is not planted with
trees or shrubs.
Figure 1. Landscaping Level I, Visual Screen
B. Level II: See‐Through Buffer. Level II landscaping is intended to create a visual separation
between uses and zones. Level II landscaping shall consist of:
1. A mix of evergreen and deciduous trees, with no more than 30 percent being deciduous. All
trees shall be planted at intervals no greater than 10 feet on center.
2. The width of a Level II landscape buffer shall be no less than 12 feet. The area which is not
planted with trees shall be planted with a mix of evergreen and deciduous shrubs, with not
more than 30 percent being deciduous, planted at a density of seven per 100 square feet of
planting area, together with other living groundcover planted to attain a coverage of 90 percent
within three years of planting.

13
Figure 2. Landscaping Level II, See‐Through Buffer
C. Level III: Ornamental Effects Landscaping. Level III landscaping is intended to provide a visual
separation of uses from streets; and visual separation of compatible uses so as to soften the
appearance of the development from public streets and soften the appearance of parking
areas, buildings, and other improvements. Level III landscaping shall consist of:
1. Canopy‐type deciduous trees or spreading evergreen trees planted in clumps or strips with a
mix of living evergreen and deciduous groundcovers and low shrubs. Up to 100 percent of the
trees may be deciduous. Trees shall be spaced at intervals no greater than 30 feet on center.
2. The width of a Level III landscape buffer shall be no less than five feet. The area which is not
planted with trees shall be planted with shrubs and living groundcover chosen and planted to
attain a coverage of 90 percent within three years of planting. Shrubs shall be planted at a
density of five shrubs per 100 square feet of that portion of the landscape area which is not
planted in lawn. Lawn may be used for up to 75 percent of the required groundcover.
3. Landscaping located within public rights‐of‐way shall be approved by the Department, prior
to planting, as part of the review of landscape plans required by UPMC 19.65.200. Landscaping
in the public right‐of‐way shall be in accordance with the “Design Standards and Guidelines for
Streetscape Elements” adopted pursuant to Chapter 19.54 UPMC.
Figure 3. Landscaping Level III, Ornamental Effects
D. Level IV: Soil Stabilizing Vegetation/Landscaping. Level IV landscaping is intended to provide
soil stability, prevent erosion and prevent sedimentation of off‐site properties and
improvements. Level IV landscaping shall consist of lawn, other living groundcover, shrubs and

14
trees with a root structure which stabilizes soil where necessary to prevent erosion and
sedimentation. Type IV landscaping may include other organic and/or inorganic soil‐stabilizing
materials such as rockeries, retaining walls or other similar slope and soil stabilization devices.
Level IV landscaping shall be established on all portions of development sites that are or have
remained undeveloped for a period of six months.
Figure 4. Landscaping Level IV, Soil Stabilizing
19.65.150 Perimeter landscape tables.
A. Residential, Commercial and Industrial Table.
Existing Uses
School
or Park
Single‐ or
Two‐
Family or
Duplex
Dwellings
Multifamily
and Senior
Housing
Offices
and
Services
Commercial
Uses
Industrial
Uses
Proposed Uses
Single‐ or Two‐Family or
Duplex Subdivisions
L3 X L3 L1 L1 L1
Short Plats** L3 L3 L3 L3 L3
Multifamily and Senior
Housing*
L1 L1 L2 L1 L1 L1
Mixed Use L1 L1 L1/L2*** L3 L3 L2
Religious Assembly and
Day Care
L1 L1 L2 L1 L1 L1
Offices and Services L1 L1 L1 L3 L3 L2
Commercial Uses L1 L1 L1 L3 L3 L2
Industrial Uses L1 L1 L1 L2 L2 L3
*Includes mobile home parks

15
**Required on newly created vacant lots only as a condition of building permit issuance.
Installation required prior to building permit final.
***Mixed use projects that are predominantly commercial shall use an L1 buffer. Mixed use
projects that are predominantly residential shall use an L2 buffer.
Note: Perimeter landscaping not required when development is adjacent to vacant land.
B. Public Facilities and Utilities Table.
Existing Uses
Single‐ or
Two‐
Family or
Duplex
Dwellings
Single‐ or
Two‐Family
or Duplex
Subdivisions
Multifamily
and Senior
Housing
Offices
and
Services
Commercial
Uses
Industrial
Uses
Proposed Uses
Government and Utility
Offices
L1 L1 L1 L3 L3 L2
Schools and Parks L1 L1 L1 L2 L2 L1
Government and Utility
Maintenance Facilities
L1 L1 L1 L2 L2 L3
Sewage Treatment
Plants
L1 L1 L1 L1 L1 L1
Accessory Utility
Facilities
L2 L2 L2 L3 L3 L3
19.65.160 Not required in wetlands or across streams.
The landscape requirements of this chapter are not required in a wetland, wetland buffer, fish
and wildlife buffers or across streams.
19.65.170 Modification of landscaping requirements.
A. Upon written request supported by one or more of the following instances the Director may
authorize a reduced width of planting or waive some or all of the landscaping requirements:
1. Where, except those areas where Level IV landscaping is required, the requirement of this
chapter would require more than 50 percent of the site area (excluding parking lots) to be
landscaped, the Director may modify the requirements so that not more than 50 percent of the
site area (excluding parking lots) must be landscaped. The Director may require more intensive

16
landscaping if the reduction in the required planting area would reduce the effectiveness of the
landscaping to a point where the intent of the landscape level cannot be satisfied.
2. When the inclusion of existing vegetation on the site would result in landscaping equivalent
to or better than the requirements of this chapter in achieving the intent of the required
landscape level.
3. When existing conditions on or abutting the site, including, but not limited to, differences in
elevation, existing vegetation, location of buildings or utilities would render the requirements
of this chapter ineffective.
4. When Level I visual screening is required, an applicant may request to use plantings that can
be expected to form a healthy sight‐obscuring evergreen hedge within three years in lieu of two
rows of trees. In reviewing such a request for modification, the Director shall consider the
applicant’s request in light of the intent of Level I landscaping and the nature of the use or
development which is being screened.
5. When the applicant proposes an alternative method of landscaping that would achieve the
intent and purpose of the landscaping required in this chapter and which the Director
determines to provide superior quality through the use of native vegetation existing on site,
preservation of groves of trees, preservation of wetlands and/or wildlife habitat, increasing
perimeter landscape width in strategic locations, providing unique focal points of interest, or
through other means.
6. When development will occur in phases and development of subsequent phases will result in
removal of landscaping required by this title.
B. When approving a request for a modification of landscaping requirements, the Director shall
issue findings upon which the approval is based. The Director may attach conditions to any such
approval of a request for modification of landscaping requirements if necessary to assure that
the intent of the landscape level and any modification thereof is maintained.
19.65.180 Planter boxes.
In limited circumstances the director may approve the use of planter boxes in lieu of Level III
landscaping where such planter boxes will not obstruct sight distance.
19.65.190 Sizes and types of landscaping.
Landscape areas required pursuant to UPMC 19.65.090 through 19.65.150 shall conform to the
following standards. All plant material shall meet or exceed ANSI Z60.1‐1996 American
Standards for Nursery Stock.
A. Trees, Evergreen. Size: Coniferous and broadleaf evergreen trees may be comprised of a
mixture of sizes but shall not be less than six feet in height at time of planting. Tree material at

17
time of planting shall be of a sufficient size to meet applicable the minimum height and
landscape buffer or screening requirements within 10 years of installation.
B. Trees, Deciduous. Size: Deciduous trees may be comprised of a mixture of sizes but shall be
fully branched, have a minimum caliper of two inches and a minimum height of 10 feet at time
of planting unless the City determines that a particular species or cultivar, which is available
only in a smaller size, is the preferred selection for a specific location. Tree material at time of
planting shall be of a sufficient size to meet any applicable the minimum height and landscape
buffer or screening requirements within 10 years of installation.
C. Shrubs and Hedges. Size: Shrubs may be comprised of a mixture of sizes but shall not be less
than 24 inches at time of planting. Shrub and hedge material at time of planting shall be of a
sufficient size to meet the minimum height and screening requirements within three years of
installation.
D. Groundcover, Vegetative. Size: Groundcover shall be planted to achieve a minimum planting
area coverage of 90 percent of required coverage within three years of installation and shall
achieve 100 percent of required coverage within five years of installation.
E. Groundcover, Inert. Wood chips, bark, decorative rock or other appropriate inert organic
material may be used.
F. Lawn Sodded and Seeded. Newly seeded lawns or installed sod shall be comprised of
drought‐resistant and hardy varieties which, when properly installed and maintained, are
capable of surviving under conditions of restricted water use.
19.65.200 Landscape plans.
A. A Landscape plan includes a planting plan and an irrigation plan and is required to be
prepared for any landscape areas required in UPMC 19.65.100 through 19.65.130 including
active recreation areas in formal subdivisions and short subdivisions. Other areas require only a
planting plan. Plans shall be submitted to the Department for review and approval.
B. Landscape plans shall be prepared by a Washington State registered landscape architect, a
Washington State certified nurseryperson, or a Washington State certified landscaper, except
that landscape plans for short subdivisions and for street tree requirements may be prepared
by the applicant. A certified irrigation designer shall prepare the irrigation plan.
C. A planting plan is required to ensure that the proposed plantings are in conformance with
the standards and requirements of this chapter. A planting plan drawn to the same scale as the
other development plans shall include, at a minimum, the following components:
1. The location of existing vegetation to be retained, proposed vegetation, property lines,
impervious surfaces, existing or proposed buildings, natural or manmade water features or
bodies, existing or proposed fences and retaining walls, critical lands and associated buffers,
and designated recreational open space areas.

18
2. A plant schedule containing the botanical and common names of the new plant material,
existing plant material proposed to be retained, the planting size of the material, the number of
each plant, and any special planting instructions.
3. Whenever possible the landscape plan shall incorporate the recommendations contained in
the City’s publication on root control, water conservation and suggested plant material.
D. An irrigation plan is required to ensure that the planting will be watered at a sufficient level
to ensure plant survival and healthy growth. All landscaped areas must provide an irrigation
method as stated below:
1. Option 1. A permanent underground irrigation method with an automatic controller plus an
overriding rain switch.
2. Option 2. An irrigation method which provides sufficient water to ensure that the plants will
become established. The method shall be required to be permanent unless the plant materials
selected are determined to be drought‐tolerant by the Department, in which case irrigation
standards shall be required only during the first growing season following installation. Even if
drought‐tolerant plants are used in the landscape design, there must be an identified method
to easily provide water to the plants in the case of a prolonged drought. Any automatic/
mechanical system designed under this option shall be fitted with an overriding rain switch.
E. Planting is encouraged to take place in the spring or fall planting season following final
development permit approval, and shall be completed prior to final occupancy approval of the
building. The Director may allow a postponement of the landscaping due to weather conditions,
with appropriate financial guarantees to ensure completion, but in no case shall planting be
postponed beyond 90 days after the certificate of occupancy is issued or final inspection.
However, the Director may approve an alternative timeline associated with a phased project.
F. Following installation of the landscaping and irrigation, the person or persons who prepared
the planting and irrigation plans shall submit, within 30 days, a signed affidavit that the
landscaping and irrigation system has been installed per the approved plans. The City will
conduct an inspection prior to final approval of the landscape plan.
19.65.210 Maintenance.
A. The following standards shall be followed for all required landscaping:
1. The property owner shall maintain all landscaping for the life of the land use.
2. All landscape materials shall be pruned and trimmed as necessary to maintain a healthy
growing condition or to prevent primary limb failure. Tree pruning shall be accomplished in
accordance with the latest edition of the United States Department of Agriculture’s Publication
NA‐FR‐01‐95 How to Prune Trees available on‐the web.
3. All landscape areas shall be kept free of trash.

19
B. Uses permitted by special use permits issued before the City’s incorporation where
landscaping was required as a condition of approval shall be subject to the maintenance
provisions of this section.
19.65.220 Replacement.
The following standards apply to the replacement of vegetation within required landscape
areas:
A. Any installed plant material located within required landscape areas which dies shall be
replaced during the spring or fall growing season following plant loss but not greater than 180
days from time of loss. This standard applies for the life of the project.
B. Any tree existing on site at the time of development, greater than four inches DBH, located
within a required perimeter landscape buffer or parking lot landscape areas, shall be replaced
during the spring or fall growing season following death or following a determination by an
urban forester or the City that the tree is diseased or damaged and has a significant chance of
toppling in high winds, but not greater than 180 days from time of loss. The existing tree shall
be replaced on a two‐for‐one basis. Any future replacement of the initial replacement trees
shall occur at a one‐for‐one ratio. This standard applies for the life of the project.
19.65.230 Financial guaranty.
A. Performance bonds or other appropriate security (including but not limited to an assignment
of funds) in the amount of 125 percent of the approved estimated landscaping cost shall be
required if landscaping is not installed. The financial guaranty shall be provided prior to
issuance of occupancy, for nonresidential building permits, before final inspection of residential
construction, and prior to final subdivision or short plat approval, whichever is applicable. Prior
to accepting a financial guaranty, the City shall have approved the landscape plans and a cost
estimate for completing the landscaping. The cost estimate shall include the cost of plant
material, irrigation and labor, installation, and materials.
B. For all projects which require landscaping except short plats, an 18‐month landscaping
maintenance guaranty equal to the cost of the landscaping less the irrigation system shall be
required prior to final project approval or release of the landscape performance bond. At the
end of the 18‐month period, the applicant shall request that the City inspect the landscaping to
ensure all planted material is alive and healthy. Any plant material needing replacement shall
be replaced in accordance with UPMC 19.65.220 and inspected prior to the release of the
maintenance guaranty. After the maintenance bond is released, landscaping shall be
maintained in accordance with UPMC 19.65.210.
19.65.240 Urban forest management.
The intent of this section is best stated in Comprehensive Plan policy EN3IG, which states,
“Protect and enhance the natural green and wooded character of University Place.” Therefore,

20
projects shall be designed around existing trees, preserving the maximum numberamount of
significant trees and retaining existing native vegetation to the extent as possible. The intent is
not to discourage allow clear‐cutting of a project site, mass grading and reliance on then
replanting with smaller trees as mitigation for the loss of tree canopy. Forest practices except
for Christmas tree cultivation are prohibited in University Place. Because of the likelihood that
much of the remaining undeveloped privately‐owned all lands within the City will be converted
to urban development in the foreseeablenear future, all trees shall be managed in accordance
with this chapter.
19.65.250 City tree account.
Funds kept for planting and maintenance of trees on City property and in public rights‐of‐way
shall be kept in a City tree account. Funds shall be placed in the account by the City Council,
from fines collected as a result of violations of this chapter, from payments in lieu of
replacement trees, from private donations and from grants and loans for the purpose of
establishing and maintaining trees in the City. A schedule of tree costs including tree purchase,
installation and maintenance is adopted by separate resolution.
19.65.260 Significant trees.
The City may maintain an inventory of significant trees.
19.65.270 Tree retention in development situations.
A. This section regulates the removal of trees associated with the development process to
encourage development, where practicable, to incorporate existing trees, particularly high
quality or larger trees, into a design. It is the intent of these provisions to lessen the aesthetic
and ecological impacts of tree removal.
A. Except as provided in subsection (C) of this section, a maximum of five trees may be removed
within a 36‐month period without a permit. Additional trees can only be removed in
accordance with this chapter.
B. The following trees shall be retained: The applicant must show how existing trees,
excluding invasive trees, nuisance trees and hazard trees, will be preserved by choosing one of
the following options to identify those trees to be retained. Trees located within a critical area
or associated buffer are excluded from the following calculations:
1. Preserve at least 35% of the trees located on the site;
2. Preserve all trees ≥ 20 inches DBH and at least 20% of the total tree diameter on the site,
where there are at least 4 trees ≥ 20 inches DBH on the site;
3. Preserve at least 50% of all trees ≥ 20 inches DBH and at least 25% of the total tree diameter
on the site, where there are at least 4 trees ≥ 20 inches DBH on the site;

21
4. Preserve at least 30% of the total tree diameter on the site, where all trees are < 20 inches
DBH; or
5. Preserve at least 35% of the total regulated tree canopy area on the site, if the site is larger
than two acres.
1. The maximum number of trees located within any required perimeter landscaping area and
in no case less than 75 percent;
2. Twenty‐five percent of the trees located in the interior of the lot, excluding critical areas or
their buffers;
C. In addition to those trees identified for retention in subsection B, the following trees shall be
retained:
31. All trees within a critical area including wetlands or wetland buffers, fish and wildlife
habitat buffers, or landslide and erosion hazard areas with slopes requiring preservation, (trees
and vegetation shall be maintained in these critical areas in accordance with unless removal is
authorized pursuant to UPMC Title 17). If the city determines that a tree located within a
critical area is a hazard, the city may authorize conversion of the tree to a “habitat snag” by
cutting the tree at the highest point possible that still eliminates a tree’s hazard risk. The lower
portion of the tree remains in place as a habitat snag to provide habitat value for fish and
wildlife. In addition, the upper portion of the tree is usually left on the ground to provide extra
habitat value. Also, in order to compensate for the loss in habitat value, additional tree
plantings in the critical area and/or buffer may be required as mitigation;
42. All trees within an identified scenic road corridor, wildlife corridor, or scenic trail identified
in the City’s pParks, and rRecreation and Open Space pPlan or the Comprehensive Plan;
53. All significant trees; and
64. Trees located within a shoreline vegetation conservation area except when their removal is
authorized in accordance with UPMC 18.25.100(F) and (G).
CD. Except as provided in subsection (C)(1)(B)(3) of this section, trees to be retained shall not
include hazard trees that are determined to be exempt under UPMC 19.65.070(D)., following
inspection and a report in the format recommended by the International Society of
Arboriculture’s Guide to the Evaluation of Hazard Trees in Urban Areas prepared by an urban
forester and reviewed and approved by the City, are determined to be: Hazard trees may
include:
1. Damaged or diseased trees;
2. Trees that pose a safety hazard due to potential root, trunk or primary limb failure;, or

22
3. exposure of mMature trees that which have grown in a closed, forested situationdense stand
of trees and recently become exposed to windthrow due to nearby development activity.
D. The urban forester shall use the most recent guidelines established by the International
Society of Arboriculture in its guide to the professional evaluation of landscape trees, shrubs
and evergreens to make the determination that a tree is either damaged, diseased and/or a
safety hazard.DE. At the discretion of the City, damaged or standing dead trees may be retained
and counted toward the tree requirement, if demonstrated that such trees will provide
important wildlife habitat and are not classified as hazard trees.
E. A tree removal permit is required when the development activity will result in the removal of
more than five trees. Up to 5 trees may be removed in development situations before
calculating the number of trees that shall be retained as set forth in UPMC 19.65.270(B).
19.65.275 Tree retention – No Associated Development.
A. The purpose of this section is to manage and conserve the urban forest when
development activity is neither proposed nor occurring.
B. Trees listed in UPMC 19.65.270(C) shall be retained.
C. A maximum of five trees not listed in UPMC 19.65.270(C) may be removed within a 36‐month
period without a tree removal permit. In addition, trees determined to be hazard trees as
provided in UPMC 19.65.270(D), invasive trees as provided in UPMC 19.65.330, and nuisance
trees as provided in UPMC 19.65.340 may be removed and will not count toward the five‐tree
limit.
D. Removal of additional trees beyond those provided for in subsection B may only be
authorized through issuance of a tree removal permit in accordance with the tree retention
standards set forth in UPMC 19.65.270 and this chapter.
19.65.280 Tree retention plans.
On timbered property greater in size than one‐half acre or commercial property with more than
15 trees, or other sites the City deems it necessary because of special circumstances or
complexity, the City shall review the site and be involvedThe City shall participate in the
following three phases of tree retention described below. The City may retain an urban forester
consulting arborist to work on the City’s behalf. The urban foresterconsulting arborist shall be
paid by the City and the applicant shall reimburse the City for all urban foresterconsulting
arborist costs. Urban foresterConsulting arborist expenses shall be reimbursed prior to the
issuance of any building permits or final approval, whichever is first required following the work
done by the urban foresterconsulting arborist.
A. Survey and Evaluation Planning Phase.

23
1. Individual tree survey. The applicant shall provide a survey of the location of all trees and
place them on the site plan. If there is an overwhelming number of trees, the City may do a
preliminary site evaluation to delineate where the better trees are located based on species,
condition, size, soils, and exposure.2. All trees located near existing and proposedfuture
buildings, roads, common open space areas, and high to moderately used areas other activity
areas shall be evaluated. The tree identification number, species, size, condition, vigor,
structure, risk of failure, and maintenance recommendations shall be documented in the plan.
2. Statistical sampling. For large stands of trees proposed to be retained in their entirety or
largely in their entirety, statistical sampling may be used to estimate the total tree DBH and
total number of trees present. Sampling must be carried out by an SAF Certified Forester based
on standard methodologies. Statistical sampling may be used in these stands in lieu of
individual tree survey.
3. Tree canopy. When calculating the amount of regulated tree canopy on a site, the total
canopy area must be based on the most recent aerial photograph available. The aerial
photograph must be no more than five years old. Other data such as LiDAR may be used to
help in calculating tree canopy as appropriate. Regulated tree canopy excludes invasive trees,
nuisance trees, hazard trees and trees within critical areas or their buffers.
3. once the survey and evaluation is completed, the applicant can begin to plan the project to
avoid the more favorable trees and vegetation. The applicant shall work with the City to help
determine which trees can be preserved based on location, grade changes, and proposed uses
and improvements.
B. Planning and Design Phase.
1. Detailed planning and design should not proceed until the survey and evaluation phase is
completed so that the project design may achieve the most beneficial tree retention plan from
the standpoint of maximizing ecological and aesthetic benefit to the community. The applicant
shall work with the City to determine which trees can be preserved based on location, grade
changes, and proposed uses and improvements.
21. The critical root zone (CRZ) of all trees to be retained near clearing, grading, or other
disturbances shall be shown on all site plan construction documents. Any grading, construction,
or utility installation within the CRZ shall be called out on the plan. Required work in these
areas shall be under the direction or instruction of the City.
32. The locations of the tree protection barriers shall be shown on the clearing and grading
plans. The tTree protection barriers shall be shown along the edge of the CRZ or adjusted under
the direction of the City.
C. Construction Phase.

24
1. A preconstruction meeting is required before any clearing takes place. The City shall point
out retained trees to the general contractor, review tree preservation guidelines, and answer
questions regarding tree protection.
2. The City shall inspect and approve the tree protection barrier prior to any work on the site,
make adjustments where necessary, and discuss techniques to work within CRZs as needed.
3. The City shall establish a schedule to periodically monitor the tree retention plan based on
the number of trees and difficulty of protecting trees during construction.
4. When clearing and grading activities are completed, the applicant shall request an
inspection. The City may require tree maintenance and remedial action to improve tree health
and vigor. If any unauthorized trees are removed, the City shall take action in accordance with
UPMC 19.65.040.
19.65.290 Tree protection.
A. To provide the best protection for remaining trees:
1. No tree removal that requires a permit shall be allowed on a site until approval of the tree
removal permit.
2. An area free of disturbance, generally corresponding to the CRZ of each tree, shall be
identified on the site plan. During construction a temporary five‐foot‐high chain link or plastic
net fence shall be installed around the trees or group of trees to be retained.
3. No impervious surfaces, fill, excavation, or storage of construction materials shall be
permitted within the area enclosed by such fencing.
4. A rock wall shall be constructed if the grade level around a tree is to be raised by more than
one foot. The inside diameter of the wall shall be equal to the diameter of the drip line of the
tree.
5. The grade level shall not be lowered within the larger of the two areas defined as follows:
a. The drip line of the tree(s); or
b. An area around the tree equal to one‐foot diameter or each inch of tree trunk diameter
measured four feet above the ground.
B. The City may approve use of tree protection techniques, other than those listed above, if the
trees will be protected to an equal or greater degree than by the techniques listed above.
Alternative techniques shall be those recommended by an urban forester.
C. No impervious surface or fill shall be placed within the drip line of the tree unless the City
determines that the long‐term health of the tree will not be significantly harmed.

25
19.65.300 Tree removal in subdivisions.
When subdividing property by preliminary plat, trees and groundcover shall not be removed
prior to preliminary plat approval. When subdividing property by either short or preliminary
plat, no clearing of trees or groundcover may take place until a tree preservation plan and site
development permit have been approved by the City. Road locations must be staked prior to
clearing. Prior to issuance of a building permit, a title notification shall be recorded that states:
Trees which are required to remain on this lot pursuant to the city’s tree preservation
regulations (Chapter 19.65 UPMC) shall not be removed for a period of three years from the
date of original purchase by individual lot owners except as provided for in UPMC
19.65.270(CD) and only then following consent by the city. Regulated trees removed
subsequent to this three year period shall be replaced in accordance with UPMC 19.65.190 and
UPMC 19.65.310.
19.65.310 Tree replacement.
A. When the required number of trees cannot be retained as determined at the sole discretion
of the City, trees that are removed shall be replaced with new trees of the same species in
accordance with UPMC 19.65.220, at a replacement rate of three trees for every tree removed.
The City may authorize an alternative species or cultivar if it would be a more suitable and
beneficial selection for a specific location given unique site characteristics.
B. When the required number of trees cannot be physically retained or replaced on site, the
applicant has the option of:
1. Planting the required number of replacement trees at locations approved by the City prior to
the time of occupancy of the building or final approval of the subdivision at the same rate as
the replacement rate required for on‐site replacement of trees; or
2. Payment in lieu of replacement may be made to the City tree account for planting of trees in
priority off‐site locations various areas ofwithin the City. These are public street rights‐of‐way,
public parks, and other public open spaces. The payment is an equivalent amount to the
estimated cost of buying and planting the trees that would otherwise have been required to be
planted on site, as determined by the City’s tree replacement cost schedule. The payment in
lieu of planting trees on site shall be made prior to the issuance of any building permit or final
subdivision approval.
19.65.320 Tree Maintenance and Pruning
Trees which are required to be maintained and replacement trees shall be pruned and trimmed
as necessary to maintain a healthy growing condition or to prevent primary limb failure. Tree
pruning shall be accomplished in accordance with the latest edition of the United States
Department of Agriculture’s Publication NA‐FR‐01‐95 How to Prune Trees available on‐the web,
except that tree pruning for utilities shall be conducted in accordance with the latest edition of

26
the International Society of Arboriculture’s Best Management Practices – Utility Pruning of
Trees.
19.65.3320 Common area management plans.
In those cases where a subdivision or plannedresidential development has common areas that,
which are managed by a homeowner’s association, a common area management plan may be
developed in lieu of obtaining consecutive tree removal permits. A common area management
plan shall be developed by a certified or registered arborist and submitted to the City for review
and approval.
19.65.3340 Invasive tree species list.
Tree species known to be invasive in the Pacific Northwest are listed below. The City may
determine that additional tree species should be classified as invasive if the species clearly
exhibits the detrimental characteristics of invasive species.
Common Name Species Name
Norway maple Acer platanoides
Sycamore maple Acer pseudoplatanus
Horse chestnut Aesculus hippocastanum
Tree‐of‐heaven Ailanthus altissima
European white birch Betula pendula
English/European hawthorn Crataegus monogyna
English holly Ilex aquifolium
Princess tree Paulownia tomentosa
White poplar Populus alba
Sweet cherry Prunus avium
Cherry laurel Prunus laurocerasus
Portugal Prunus lusitanica
Black locust Robinia pseudoacacia
European mountain ash Sorbus aucuparia
Siberian elm Ulmus pumila

27
19.65.3450 Nuisance tree species list.
Tree species categorized as nuisance trees in University Place are listed below. The City may
determine that additional tree species should be classified as nuisance trees if the species
clearly exhibits the detrimental characteristics of nuisance species.
Common Name Species Name
Red alder Alnus rubra
Black cottonwood Populus trichocarpa

M:\RES\2012\698-View Protection 1
RESOLUTION NO. 698
A RESOLUTION OF THE CITY COUNCIL OF THE CITY OF UNIVERSITY PLACE, WASHINGTON, REQUESTING THE CITY PLANNING COMMISSION STUDY, DEVELOP, AND RECOMMEND ACTIONS TO HELP MAINTAIN SCENIC VIEWS THAT ARE OBSTRUCTED BY VEGETATION AND TO CLARIFY EXISTING PROVISIONS REGARDING TREE REMOVAL
WHEREAS, on July 29, 2012 the City Council of the City of University Place held a study
session to discuss protecting scenic views that are obstructed by vegetation, and,
WHEREAS, the City of University Place is located on the south Puget Sound where hundreds of homes facing west have scenic views to the Puget Sound and the Olympic Mountains, and,
WHEREAS, other properties in the City that face east have views of Mt. Rainier and the Cascade Mountain Range, and,
WHEREAS, in the time since many of these homes were developed trees and other vegetation
has grown tall obstructing the scenic views these homes had when built or purchased, and WHEREAS, many of these homes are valued and assessed on the basis of their location in a
view area but which have little or no view because of tall vegetation located on the private and public property including the City’s rights-of-ways, and
WHEREAS, the owners of these homes enjoy and value the scenic views from their property
and disfavor the tall vegetation that obstructs the views they would otherwise enjoy were it not for tall vegetation obstructing their view, and
WHEREAS, the City Council expressed their desire to have the City’s Planning Commission
study, develop, and recommend actions to protect scenic views that are obstructed by vegetation in the City including:
a. Polices regarding trees in the City’s right-of-way and on City property, b. Protecting views along select view corridors or from specific points, c. Regulating the types of vegetation planted during new construction, and d. Instituting an educational program to encourage property owners in view-sensitive areas
to be mindful of the vegetation they plant and maintain on their private properties, and
WHEREAS, on the same evening the City Council also expressed their desire to have the City’s Planning Commission recommend language that would help clarify that property owners are allowed to cut down up to five trees in a three-year period and that the City staff is available to consult with on the determination of what constitutes a dangerous or hazardous tree, and
WHEREAS, in accordance with Ordinance 338 the purpose of the Planning Commission is to
advise the City Council on the following topics: growth management; general land use and transportation planning; long range capital improvement plans; and other matters as directed by the City Council.
NOW, THEREFORE, BE IT RESOLVED BY THE CITY COUNCIL OF THE CITY OF
UNIVERSITY PLACE, WASHINGTON, AS FOLLOWS:
Section 1. Protection of Scenic Views that are Obstructed by Vegetation. The City Council directs the City’s Planning Commission to study, develop, and recommend actions to protect scenic views that are obstructed by vegetation in the City including:
a. Polices regarding trees in the City’s right-of-way and on City property,

M:\RES\2012\698-View Protection 2
b. Protecting views along select view corridors or from specific points, c. Regulating the types of vegetation planted during new construction, and d. Instituting an educational program to encourage property owners in view sensitive areas
to be mindful of the vegetation they plant and maintain on their private properties.
Section 2. Tree Removal. The City Council directs the City’s Planning Commission to recommend language to clarify existing Zoning Code provisions regarding:
a. The number of trees that property owners are allowed to cut down in a three-year period,
and b. That the City staff is available to consult with on the determination of what constitutes a
dangerous or hazardous tree. Section 3. Effective Date. This Resolution shall take effect immediately upon its adoption.
ADOPTED BY THE CITY COUNCIL AUGUST 20, 2012. ______________________________________ Ken Grassi, Mayor ATTEST: _______________________________ Emelita Genetia, City Clerk APPROVED AS TO FORM: _______________________________ Steve Victor, City Attorney