university of washington master plan - seattle.gov home
TRANSCRIPT
University of Washington Master Plan
Seattle Campus
S E M I - A N N U A L R E P O R T
A P R I L 2 0 0 4
Preface This document is the first Semi-Annual Report on the development of the Seattle Campus under the University of Washington Master Plan, Seattle Campus as approved with conditions by the Seattle City Council in December of 2003. In addition to reporting on the conditions of approval as outlined by the Campus Master Plan (CMP), it also responds to the reporting requirements as directed by Ordinance 121193, the First Amendment to the 1998 City University Agreement adopted by the City Council in June of 2003. This report covers the entire year of 2003. Future reports will cover six month periods from January to June and July to December.
Annual reports regarding the development on the Seattle Campus have been issued each year since the adoption of the first General Physical Development Plan (GPDP) in 1985. Pursuant to the passage of the CMP and the First Amendment to the 1998 Agreement, the reports will now be issued on a semi-annual basis from 2003 until 2007 and will be issued on an annual basis thereafter. As directed by the ordinance, the reports will be submitted to the Seattle Department of Planning and Design, the City Council and the City University Community Advisory Committee (CUCAC). This report was compiled by staff in the Office of Regional Affairs and the University of Washington Capital Projects Office.
For questions or comments please contact Susan Folk in the Office of Regional Affairs, 221-4183 or [email protected]
This report can be printed from the web and is posted on the web at www.washington.edu/community
[ 2 ]

Table of Contents
The 1998 City-University Agreement, as amended, outlines the information to be included in the semi-annual reports. The information to be included in the report is as follows: Section 1: DEVELOPMENT Page 5
A. Status report on all ongoing development 1. Capital Budget Request 2. Sites chosen for development under the CMP 3. Sites under construction or projects completed during reporting period
B. Proposed project development changes and major and minor plan amendments 1. Proposed Project Changes 2. Major and Minor Plan Amendments
C. Identified changes in environmental impacts as a result of changes to the proposed development schedule set forth in the Campus Master Plan
Section 2: HOUSING AND JOBS Page 8
A. The number of jobs added through UW leasing in the UDNUCV B. A description of efforts the UW has made to facilitate, influence, promote
and encourage the creation of housing including faculty and staff housing options
C. City’s report on the progress of housing developed in the UDNUCV Section 3: TRANSPORTATION Page 11
A. Results of the annual campus traffic counts and survey results for the campus and biennial University District area estimates
B. Progress made in the transportation management program Section 4: LEASING, PURCHASING AND GIFTS OF REAL PROPERTY Page 14
A. City report on commercial real estate conditions and UDNUCV progress towards reaching the housing plan goals
B. Purchases completed and proposed uses of property located within primary and secondary impact zones
C. Gifts of real property and proposed uses of such property located within primary and secondary impact zones
D. Summary of all leases within the City of Seattle, both inside and outside the primary and secondary impact zones. This list will include the location, amount of space, amount of residential space within the building, use, term, known plans for additional leases, underlying zone designation, identification of which leases and associated uses are for street-level spaces, and which leases are within the UDNUCV
Section 5: UNIVERSITY IN THE COMMUNITY Page 19
A. Development of the Housing Quality complaint program and completion of the “Guide to Student Community Relations – Neighbor to Neighbor Expectations”
B. Description of how UW leasing & development is consistent with applicable neighborhood plans
[ 3 ]
List of Appendices
Appendix A MAP OF UDNUCV Page 21 Appendix B UW LEASING SUMMARY Page 22 Appendix C LIST OF ERRORS IN THE CAMPUS MASTER PLAN Page 23
[ 4 ]
S E C T I O N 1
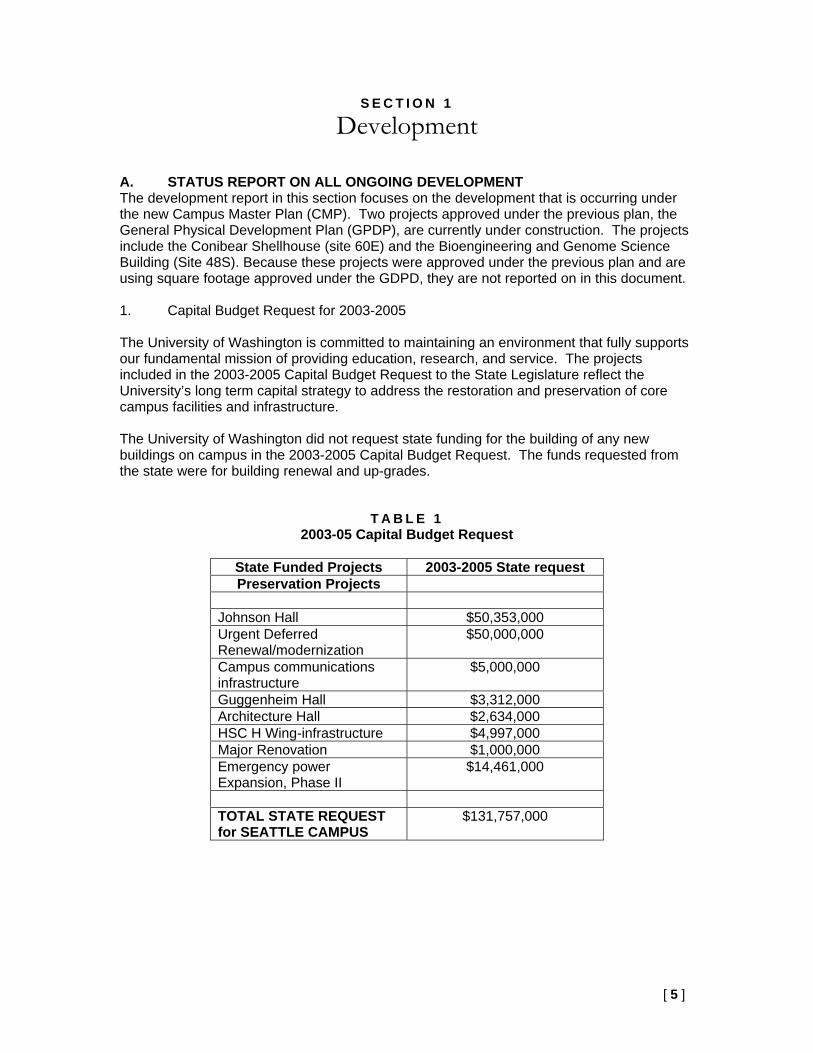
Development A. STATUS REPORT ON ALL ONGOING DEVELOPMENT The development report in this section focuses on the development that is occurring under the new Campus Master Plan (CMP). Two projects approved under the previous plan, the General Physical Development Plan (GPDP), are currently under construction. The projects include the Conibear Shellhouse (site 60E) and the Bioengineering and Genome Science Building (Site 48S). Because these projects were approved under the previous plan and are using square footage approved under the GDPD, they are not reported on in this document. 1. Capital Budget Request for 2003-2005
The University of Washington is committed to maintaining an environment that fully supports our fundamental mission of providing education, research, and service. The projects included in the 2003-2005 Capital Budget Request to the State Legislature reflect the University’s long term capital strategy to address the restoration and preservation of core campus facilities and infrastructure. The University of Washington did not request state funding for the building of any new buildings on campus in the 2003-2005 Capital Budget Request. The funds requested from the state were for building renewal and up-grades.
T A B L E 1 2003-05 Capital Budget Request
State Funded Projects 2003-2005 State request Preservation Projects
Johnson Hall $50,353,000 Urgent Deferred Renewal/modernization
$50,000,000
Campus communications infrastructure
$5,000,000
Guggenheim Hall $3,312,000 Architecture Hall $2,634,000 HSC H Wing-infrastructure $4,997,000 Major Renovation $1,000,000 Emergency power Expansion, Phase II
$14,461,000
TOTAL STATE REQUEST for SEATTLE CAMPUS
$131,757,000
[ 5 ]
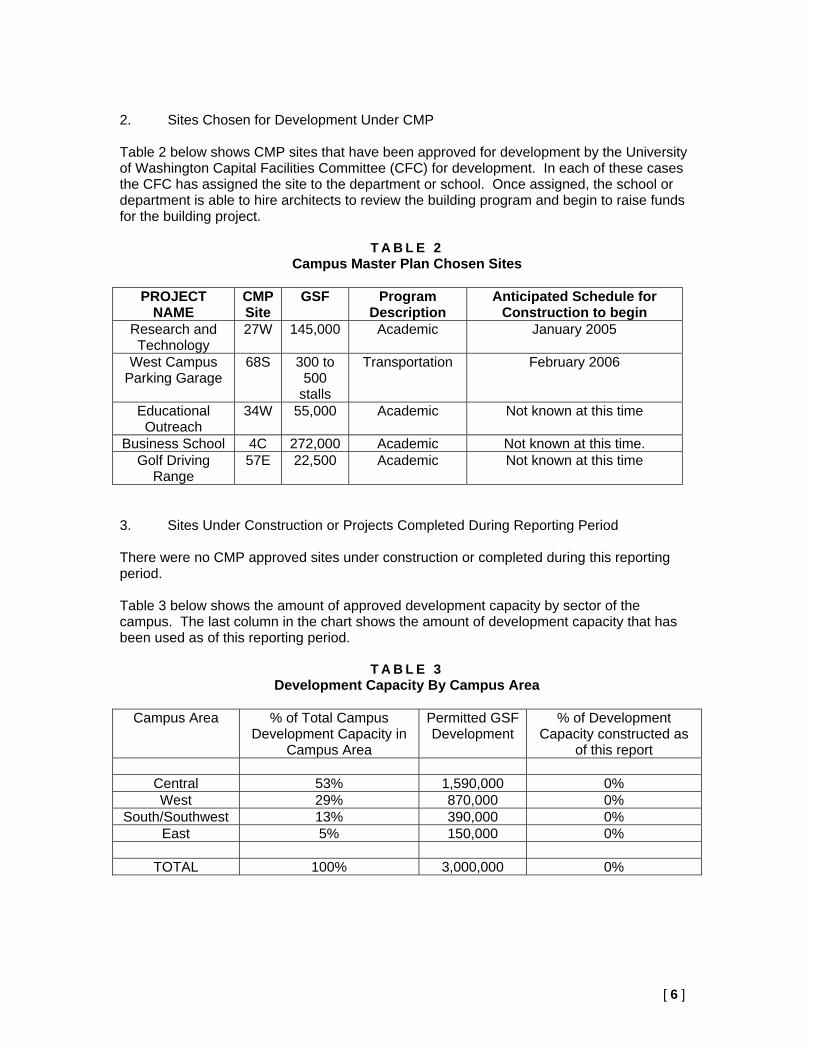
2. Sites Chosen for Development Under CMP Table 2 below shows CMP sites that have been approved for development by the University of Washington Capital Facilities Committee (CFC) for development. In each of these cases the CFC has assigned the site to the department or school. Once assigned, the school or department is able to hire architects to review the building program and begin to raise funds for the building project.
T A B L E 2 Campus Master Plan Chosen Sites
PROJECT
NAME CMP Site
GSF Program Description
Anticipated Schedule for Construction to begin
Research and Technology
27W 145,000 Academic January 2005
West Campus Parking Garage
68S 300 to 500
stalls
Transportation February 2006
Educational Outreach
34W 55,000 Academic Not known at this time
Business School 4C 272,000 Academic Not known at this time. Golf Driving
Range 57E 22,500 Academic Not known at this time
3. Sites Under Construction or Projects Completed During Reporting Period There were no CMP approved sites under construction or completed during this reporting period. Table 3 below shows the amount of approved development capacity by sector of the campus. The last column in the chart shows the amount of development capacity that has been used as of this reporting period.
T A B L E 3 Development Capacity By Campus Area
Campus Area % of Total Campus
Development Capacity in Campus Area
Permitted GSF Development
% of Development Capacity constructed as
of this report
Central 53% 1,590,000 0% West 29% 870,000 0%
South/Southwest 13% 390,000 0% East 5% 150,000 0%
TOTAL 100% 3,000,000 0%
[ 6 ]

B. PROPOSED PROJECT DEVELOPMENT CHANGES AND MAJOR AND MINOR PLAN AMENDMENTS
1. Proposed Project Changes
There have been no project changes during this reporting period.
2. Major and Minor Plan Amendments There have been no major or minor plan amendments to the CMP during this reporting period. C. IDENTIFIED CHANGES IN ENVIRONMENTAL IMPACTS AS A RESULT OF
CHANGES TO THE PROPOSED DEVELOPMENT SCHEDULE SET FORTH IN THE MASTER PLAN
The approval of the CMP gave the University the ability to develop 3 million square of feet of space during the life of the plan. Page 84 of the CMP describes the development process and discusses the difficulty in determining a development time table for projects and which site will be developed during what time period on the campus over the life of the plan. The development schedule as set forth in the CMP says the following:
“Based on past development trends, need and funding sources, it is anticipated that during the life of the plan the University will build approximately 600,000 gsf of new buildings every biennium up to 3 million gsf. However, there may be some biennia where the development is less than 600,000 gsf or more than 600,000 gsf.”
The development schedule, as anticipated in the EIS and defined in the CMP above, has been followed and consequently no direct, indirect or cumulative adverse environmental impacts have occurred.
[ 7 ]
S E C T I O N 2
Housing and Jobs
A. THE NUMBER OF JOBS ADDED THROUGH UW LEASING IN THE UDNUCV In 2003 the University added 15,884 square feet of space to its leasing inventory within the Primary and Secondary Impact Zones. At the end of 2002, the University leased 532,634 gsf and at the end of 2003 the number was 548,518. Eighty-six percent (86%) of University leasing within the Primary and Secondary Impact Zones is within the University District Northwest Urban Center (UDNUCV). The additional square footage of space leased by the University during 2003 brought an additional 67 employees into the district, bringing the total number of UW employees working in leased space in the UDNUCV to 1,744. The employment estimate above is based on a survey of all occupants of leased space within the UDNUCV. For those occupants who did not respond to the survey, employee counts were estimated based on the square feet per employee for other respondents. This employment estimate is based on head counts. B. A DESCRIPTION OF EFFORTS THE UW HAS MADE TO FACILITATE,
INFLUENCE, PROMOTE AND ENCOURAGE THE CREATION OF HOUSING INCLUDING FACULTY AND STAFF HOUSING OPTIONS
The University has made several efforts in the past year to further the development of more housing in the U-District: 1. The University testified in favor of extending the Multifamily Tax Credits to the
University District. Over 1/3 of University faculty and staff have household incomes at 60-80% of median income. These tax credits could help stimulate production of much needed housing for this group of employees.
2. The University surveyed all faculty and staff about their interest in employee housing. The survey found that affordability & proximity to campus were the two most critical factors for employees when deciding where to live. Seventeen percent of respondents said that they would be interested in purchasing a condominium in the U-District. The final report on this survey will be done in April of 2004 and will be shared with housing developers and community members to show that there is an interest and a market for development of work force housing in the University District.
3. The University recently signed a letter of intent to lease space within a new building developed by UNICO at 42nd & 15th. This building will include 32-64 housing units with rents that will be attractive to faculty and staff. The University’s role as an anchor tenant helps to make construction of this building financially feasible and enables these new housing units to be built.
4. The University participates in the Hometown Home Loan Program. This program offers UW employees a series of discounts on loan fees, escrow, title, and related financing costs. Additional benefits are available to households with modest incomes and located in the City of Seattle. Since bringing this program to campus in 1998, more than 1500 UW employees have taken part. Over 70 of these were first time home buyers.
[ 8 ]
C. CITY’S REPORT ON THE PROGRESS OF HOUSING DEVELOPMENT IN THE UDNUCV
Section II.D.2 of the 1998 Agreement as amended, requires that the City provide to UW the following information for inclusion in UW’s semiannual reports to the Department of Design Construction and Land Use, the City Council, and the City/University Community Advisory Committee:
• a report on the progress of housing development in the UDNUCV, including the number and type of units built, the jobs/housing balance in the area, and progress in meeting City housing and jobs targets in the UDNUCV
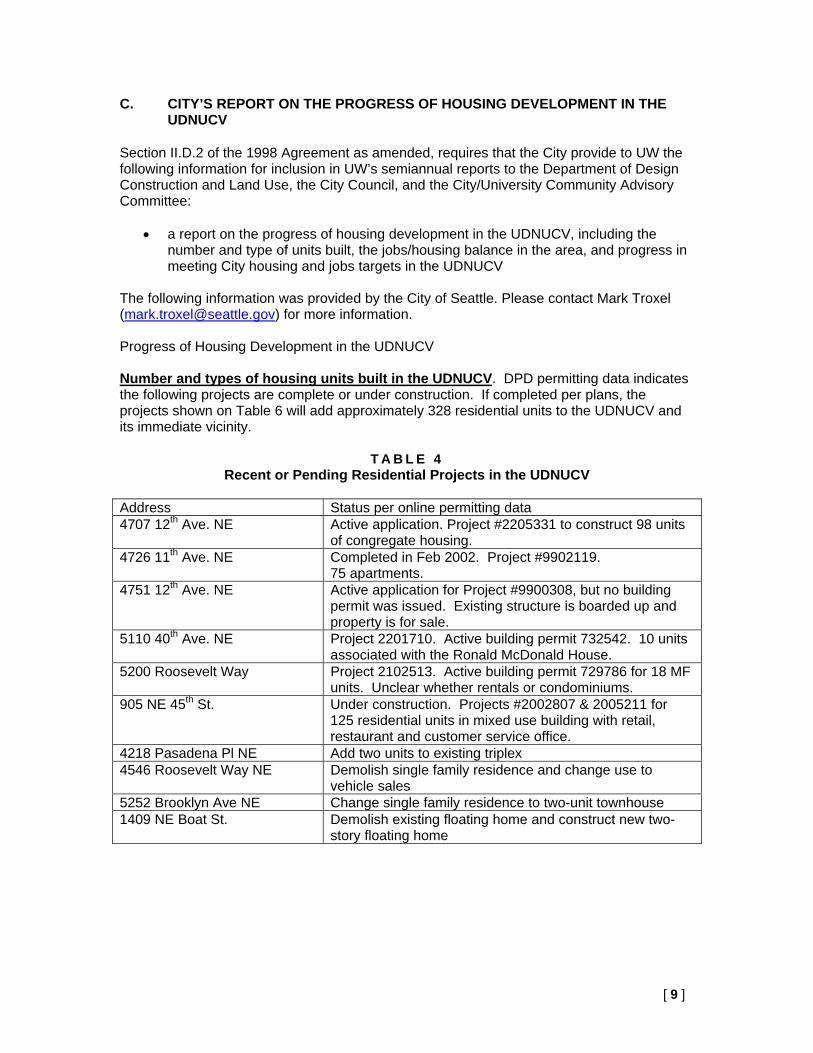
The following information was provided by the City of Seattle. Please contact Mark Troxel ([email protected]) for more information. Progress of Housing Development in the UDNUCV Number and types of housing units built in the UDNUCV. DPD permitting data indicates the following projects are complete or under construction. If completed per plans, the projects shown on Table 6 will add approximately 328 residential units to the UDNUCV and its immediate vicinity.
T A B L E 4 Recent or Pending Residential Projects in the UDNUCV
Address Status per online permitting data 4707 12th Ave. NE Active application. Project #2205331 to construct 98 units
of congregate housing. 4726 11th Ave. NE Completed in Feb 2002. Project #9902119.
75 apartments. 4751 12th Ave. NE Active application for Project #9900308, but no building
permit was issued. Existing structure is boarded up and property is for sale.
5110 40th Ave. NE Project 2201710. Active building permit 732542. 10 units associated with the Ronald McDonald House.
5200 Roosevelt Way Project 2102513. Active building permit 729786 for 18 MF units. Unclear whether rentals or condominiums.
905 NE 45th St. Under construction. Projects #2002807 & 2005211 for 125 residential units in mixed use building with retail, restaurant and customer service office.
4218 Pasadena Pl NE Add two units to existing triplex 4546 Roosevelt Way NE Demolish single family residence and change use to
vehicle sales 5252 Brooklyn Ave NE Change single family residence to two-unit townhouse 1409 NE Boat St. Demolish existing floating home and construct new two-
story floating home
[ 9 ]
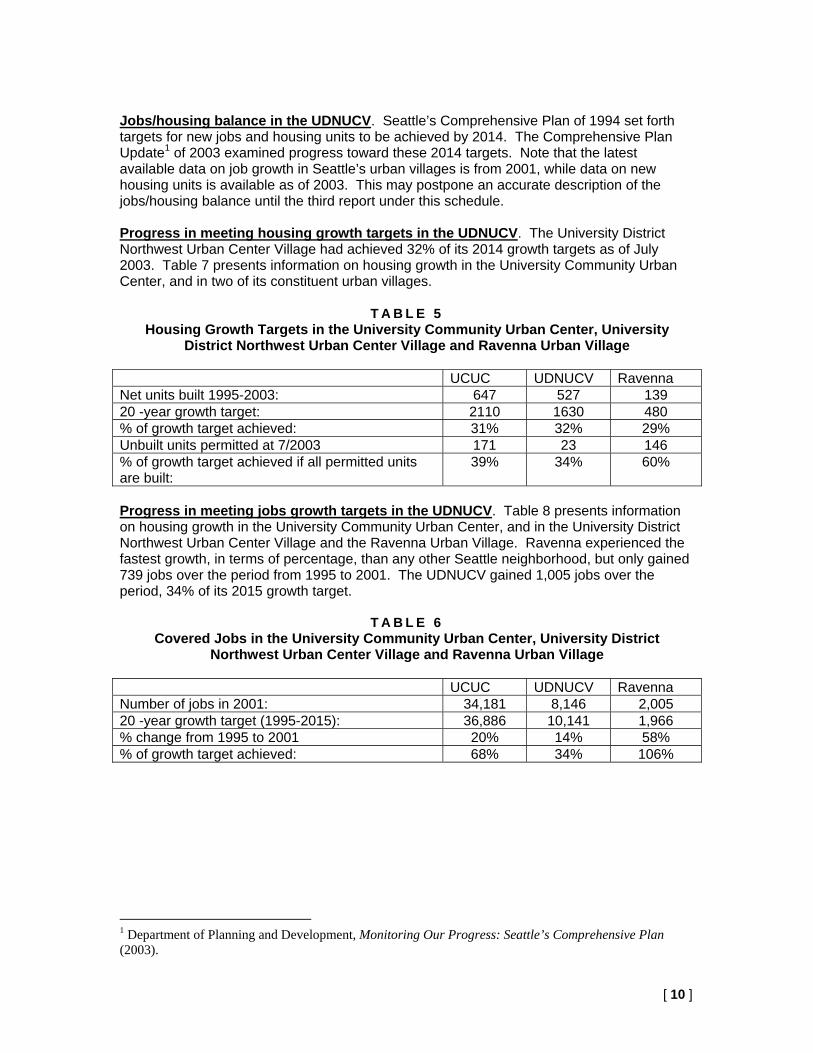
Jobs/housing balance in the UDNUCV. Seattle’s Comprehensive Plan of 1994 set forth targets for new jobs and housing units to be achieved by 2014. The Comprehensive Plan Update1 of 2003 examined progress toward these 2014 targets. Note that the latest available data on job growth in Seattle’s urban villages is from 2001, while data on new housing units is available as of 2003. This may postpone an accurate description of the jobs/housing balance until the third report under this schedule. Progress in meeting housing growth targets in the UDNUCV. The University District Northwest Urban Center Village had achieved 32% of its 2014 growth targets as of July 2003. Table 7 presents information on housing growth in the University Community Urban Center, and in two of its constituent urban villages.
T A B L E 5 Housing Growth Targets in the University Community Urban Center, University
District Northwest Urban Center Village and Ravenna Urban Village
UCUC UDNUCV Ravenna Net units built 1995-2003: 647 527 139 20 -year growth target: 2110 1630 480 % of growth target achieved: 31% 32% 29% Unbuilt units permitted at 7/2003 171 23 146 % of growth target achieved if all permitted units are built:
39% 34% 60%
Progress in meeting jobs growth targets in the UDNUCV. Table 8 presents information on housing growth in the University Community Urban Center, and in the University District Northwest Urban Center Village and the Ravenna Urban Village. Ravenna experienced the fastest growth, in terms of percentage, than any other Seattle neighborhood, but only gained 739 jobs over the period from 1995 to 2001. The UDNUCV gained 1,005 jobs over the period, 34% of its 2015 growth target.
T A B L E 6 Covered Jobs in the University Community Urban Center, University District
Northwest Urban Center Village and Ravenna Urban Village UCUC UDNUCV Ravenna Number of jobs in 2001: 34,181 8,146 2,005 20 -year growth target (1995-2015): 36,886 10,141 1,966 % change from 1995 to 2001 20% 14% 58% % of growth target achieved: 68% 34% 106%
1 Department of Planning and Development, Monitoring Our Progress: Seattle’s Comprehensive Plan (2003).
[ 10 ]

S E C T I O N 3
Transportation A. RESULTS OF THE ANNUAL CAMPUS TRAFFIC COUNTS AND SURVEY
RESULTS FOR THE CAMPUS AND BIENNIAL UNIVERSITY DISTRICT AREA ESTIMATES
1. Annual Campus Traffic Counts
Since 1983, the number of vehicles entering and exiting campus has been monitored for one week in October each year. Historically, this was done to determine the University’s adherence to the 1983 agreement with the City of Seattle, which placed limits on the total number of vehicles that could enter campus during the morning peak period, the total number of vehicles that could exit campus during the afternoon peak period, and the total number of vehicles entering and exiting campus over a 24 hour period. Beginning in 2003, following the adoption of the Campus Master Plan (CMP), new limits were placed on campus vehicle trips replacing the old limits. Whereas the 1983 agreement limited the total number of vehicle trips to and from campus, the CMP limits the trips of faculty, staff, and students. The 2003 Campus Master Plan specifies a set of monitoring and reporting activities that should be undertaken to measure performance of the University’s Transportation Management Program (TMP). This program includes the Annual Campus Traffic Count, the results of which can be found at www.washington.edu/upass/. This seventy page report retains continuity with past reports. However, in 2003 there was an increase in the number of locations in East Campus included in the count. The extent to which apparent trip growth is attributable to this change in methodology is described in the report. In 2003 there were 7,010 morning peak period inbound vehicle trips (of those 210 were from new locations in East Campus) and 9,290 afternoon peak period outbound trips (of these 374 were from new locations in East Campus). The total 24-hour count was 62,370 (with 3,686 of these trips associated with new locations in East Campus.) As the figure on page 2 of the Annual Campus Traffic Count report shows, the 2003 24-hour count of vehicle trips surpassed the 2002 24-hour count. However, this apparent increase was due to the change in methodology, which added new locations in East Campus to the locations counted in previous years. Without the change in methodology, the number of vehicle trips to and from campus in a 24-hour period decreased between 2002 and 2003.
2. Campus and Biennial University District Area Estimates
The CMP was approved by the City in June of 2003 with conditions limiting vehicle trips and monitoring of those trips. In general, these conditions were consistent with those placed on the earlier University of Washington General Physical Development Plan. A change in the conditions is that the CMP vehicle trip cap will limit only vehicle trips of faculty, staff and student in the peak periods, peak directions. Previous limitations and monitoring were focused on all vehicle trips in the peak periods, peak directions. This change in conditions requires a change in the vehicle estimation mechanisms. A CMP vehicle trip model that uses information about travel and parking behavior of employees and students was developed to estimate the commute trips to the U District in 1990 and to compare them with subsequent years. The model uses information about the
[ 11 ]
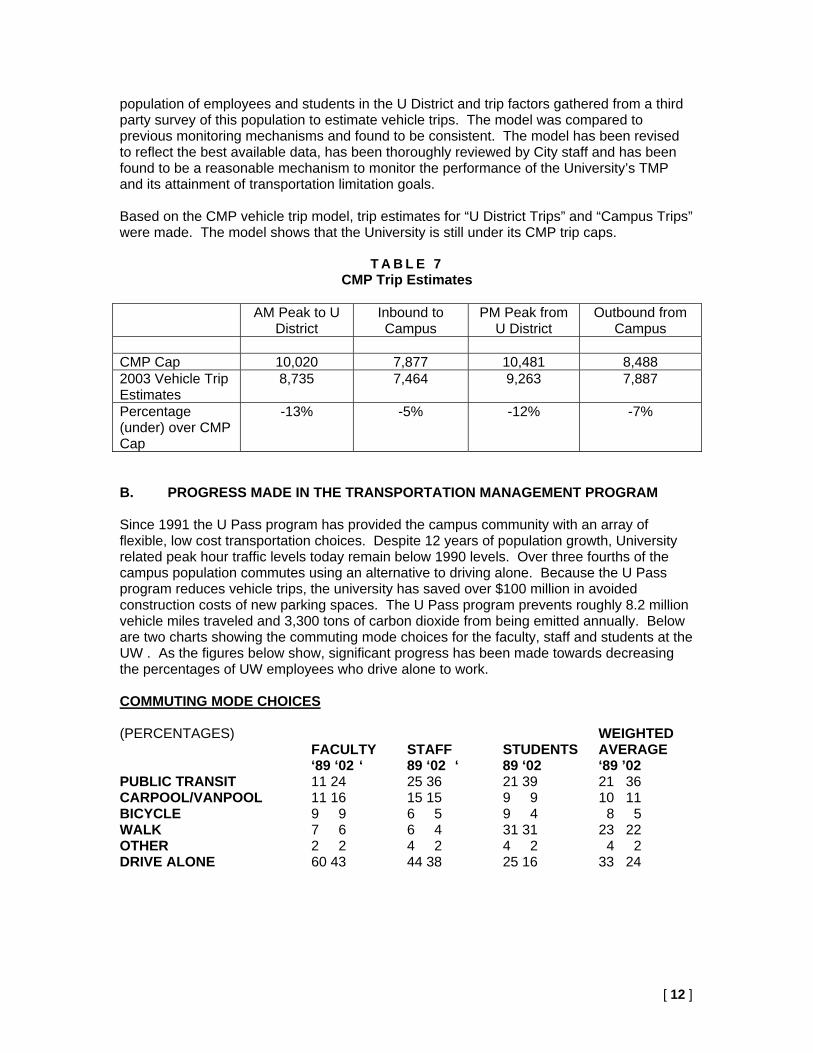
population of employees and students in the U District and trip factors gathered from a third party survey of this population to estimate vehicle trips. The model was compared to previous monitoring mechanisms and found to be consistent. The model has been revised to reflect the best available data, has been thoroughly reviewed by City staff and has been found to be a reasonable mechanism to monitor the performance of the University’s TMP and its attainment of transportation limitation goals. Based on the CMP vehicle trip model, trip estimates for “U District Trips” and “Campus Trips” were made. The model shows that the University is still under its CMP trip caps.
T A B L E 7 CMP Trip Estimates
AM Peak to U
District Inbound to Campus
PM Peak from U District
Outbound from Campus
CMP Cap 10,020 7,877 10,481 8,488 2003 Vehicle Trip Estimates
8,735 7,464 9,263 7,887
Percentage (under) over CMP Cap
-13% -5% -12% -7%
B. PROGRESS MADE IN THE TRANSPORTATION MANAGEMENT PROGRAM
Since 1991 the U Pass program has provided the campus community with an array of flexible, low cost transportation choices. Despite 12 years of population growth, University related peak hour traffic levels today remain below 1990 levels. Over three fourths of the campus population commutes using an alternative to driving alone. Because the U Pass program reduces vehicle trips, the university has saved over $100 million in avoided construction costs of new parking spaces. The U Pass program prevents roughly 8.2 million vehicle miles traveled and 3,300 tons of carbon dioxide from being emitted annually. Below are two charts showing the commuting mode choices for the faculty, staff and students at the UW . As the figures below show, significant progress has been made towards decreasing the percentages of UW employees who drive alone to work. COMMUTING MODE CHOICES (PERCENTAGES) WEIGHTED
FACULTY STAFF STUDENTS AVERAGE ‘89 ‘02 ‘ 89 ‘02 ‘ 89 ‘02 ‘89 ’02
PUBLIC TRANSIT 11 24 25 36 21 39 21 36 CARPOOL/VANPOOL 11 16 15 15 9 9 10 11 BICYCLE 9 9 6 5 9 4 8 5 WALK 7 6 6 4 31 31 23 22 OTHER 2 2 4 2 4 2 4 2 DRIVE ALONE 60 43 44 38 25 16 33 24
[ 12 ]
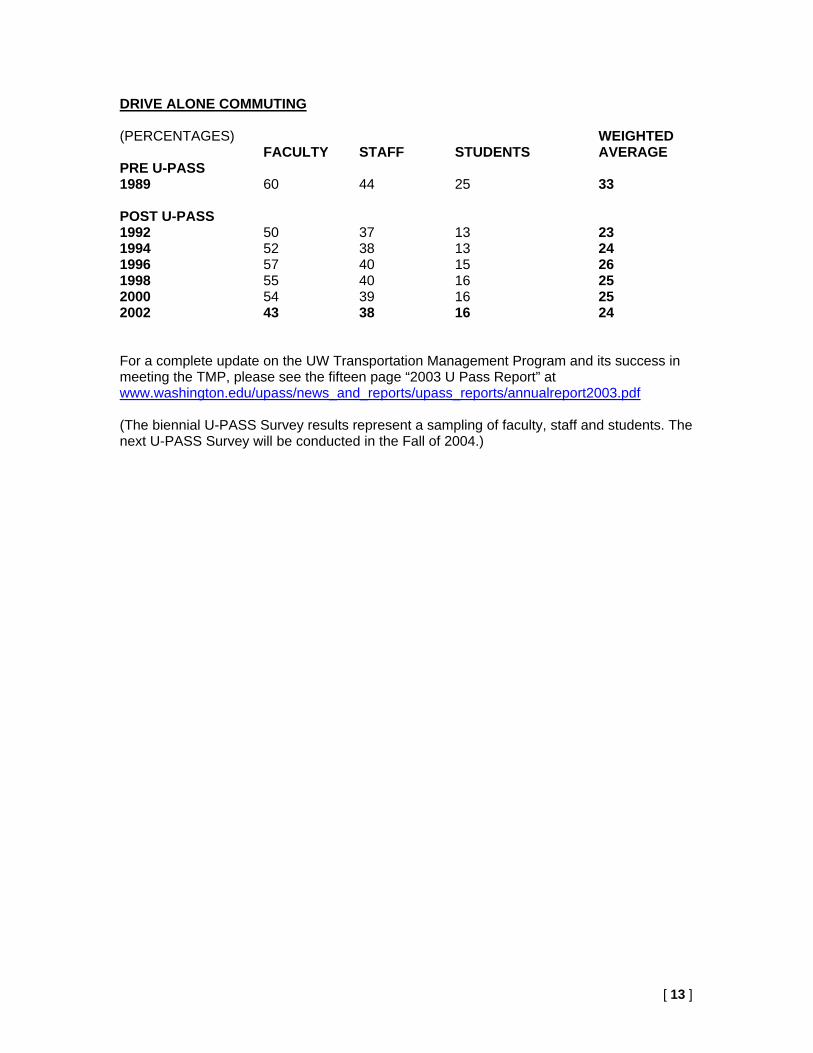
DRIVE ALONE COMMUTING (PERCENTAGES) WEIGHTED
FACULTY STAFF STUDENTS AVERAGE PRE U-PASS 1989 60 44 25 33 POST U-PASS 1992 50 37 13 23 1994 52 38 13 24 1996 57 40 15 26 1998 55 40 16 25 2000 54 39 16 25 2002 43 38 16 24 For a complete update on the UW Transportation Management Program and its success in meeting the TMP, please see the fifteen page “2003 U Pass Report” at www.washington.edu/upass/news_and_reports/upass_reports/annualreport2003.pdf (The biennial U-PASS Survey results represent a sampling of faculty, staff and students. The next U-PASS Survey will be conducted in the Fall of 2004.)
[ 13 ]
S E C T I O N 4
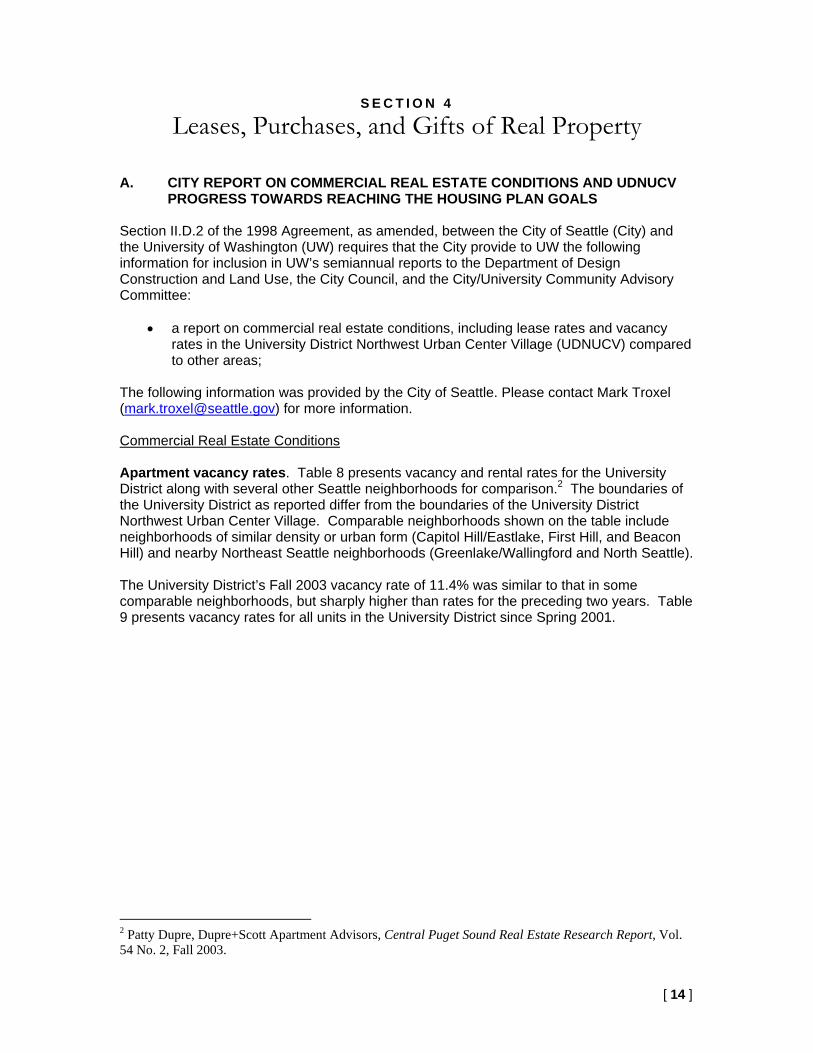
Leases, Purchases, and Gifts of Real Property A. CITY REPORT ON COMMERCIAL REAL ESTATE CONDITIONS AND UDNUCV
PROGRESS TOWARDS REACHING THE HOUSING PLAN GOALS Section II.D.2 of the 1998 Agreement, as amended, between the City of Seattle (City) and the University of Washington (UW) requires that the City provide to UW the following information for inclusion in UW’s semiannual reports to the Department of Design Construction and Land Use, the City Council, and the City/University Community Advisory Committee:
• a report on commercial real estate conditions, including lease rates and vacancy rates in the University District Northwest Urban Center Village (UDNUCV) compared to other areas;
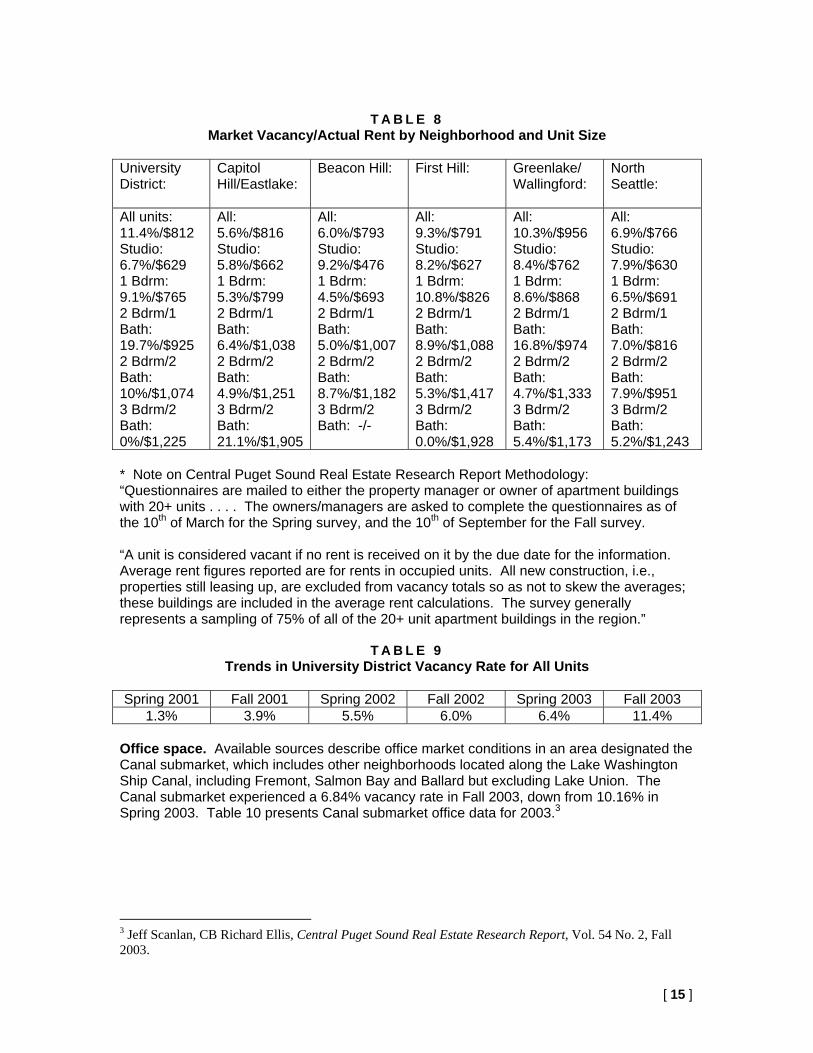
The following information was provided by the City of Seattle. Please contact Mark Troxel ([email protected]) for more information. Commercial Real Estate Conditions Apartment vacancy rates. Table 8 presents vacancy and rental rates for the University District along with several other Seattle neighborhoods for comparison.2 The boundaries of the University District as reported differ from the boundaries of the University District Northwest Urban Center Village. Comparable neighborhoods shown on the table include neighborhoods of similar density or urban form (Capitol Hill/Eastlake, First Hill, and Beacon Hill) and nearby Northeast Seattle neighborhoods (Greenlake/Wallingford and North Seattle). The University District’s Fall 2003 vacancy rate of 11.4% was similar to that in some comparable neighborhoods, but sharply higher than rates for the preceding two years. Table 9 presents vacancy rates for all units in the University District since Spring 2001.
2 Patty Dupre, Dupre+Scott Apartment Advisors, Central Puget Sound Real Estate Research Report, Vol. 54 No. 2, Fall 2003.
[ 14 ]
T A B L E 8
Market Vacancy/Actual Rent by Neighborhood and Unit Size University District:
Capitol Hill/Eastlake:
Beacon Hill:
First Hill:
Greenlake/ Wallingford:
North Seattle:
All units: 11.4%/$812 Studio: 6.7%/$629 1 Bdrm: 9.1%/$765 2 Bdrm/1 Bath: 19.7%/$925 2 Bdrm/2 Bath: 10%/$1,074 3 Bdrm/2 Bath: 0%/$1,225
All: 5.6%/$816 Studio: 5.8%/$662 1 Bdrm: 5.3%/$799 2 Bdrm/1 Bath: 6.4%/$1,038 2 Bdrm/2 Bath: 4.9%/$1,251 3 Bdrm/2 Bath: 21.1%/$1,905
All: 6.0%/$793 Studio: 9.2%/$476 1 Bdrm: 4.5%/$693 2 Bdrm/1 Bath: 5.0%/$1,007 2 Bdrm/2 Bath: 8.7%/$1,182 3 Bdrm/2 Bath: -/-
All: 9.3%/$791 Studio: 8.2%/$627 1 Bdrm: 10.8%/$826 2 Bdrm/1 Bath: 8.9%/$1,088 2 Bdrm/2 Bath: 5.3%/$1,417 3 Bdrm/2 Bath: 0.0%/$1,928
All: 10.3%/$956 Studio: 8.4%/$762 1 Bdrm: 8.6%/$868 2 Bdrm/1 Bath: 16.8%/$974 2 Bdrm/2 Bath: 4.7%/$1,333 3 Bdrm/2 Bath: 5.4%/$1,173
All: 6.9%/$766 Studio: 7.9%/$630 1 Bdrm: 6.5%/$691 2 Bdrm/1 Bath: 7.0%/$816 2 Bdrm/2 Bath: 7.9%/$951 3 Bdrm/2 Bath: 5.2%/$1,243
* Note on Central Puget Sound Real Estate Research Report Methodology: “Questionnaires are mailed to either the property manager or owner of apartment buildings with 20+ units . . . . The owners/managers are asked to complete the questionnaires as of the 10th of March for the Spring survey, and the 10th of September for the Fall survey. “A unit is considered vacant if no rent is received on it by the due date for the information. Average rent figures reported are for rents in occupied units. All new construction, i.e., properties still leasing up, are excluded from vacancy totals so as not to skew the averages; these buildings are included in the average rent calculations. The survey generally represents a sampling of 75% of all of the 20+ unit apartment buildings in the region.”
T A B L E 9 Trends in University District Vacancy Rate for All Units
Spring 2001 Fall 2001 Spring 2002 Fall 2002 Spring 2003 Fall 2003
1.3% 3.9% 5.5% 6.0% 6.4% 11.4% Office space. Available sources describe office market conditions in an area designated the Canal submarket, which includes other neighborhoods located along the Lake Washington Ship Canal, including Fremont, Salmon Bay and Ballard but excluding Lake Union. The Canal submarket experienced a 6.84% vacancy rate in Fall 2003, down from 10.16% in Spring 2003. Table 10 presents Canal submarket office data for 2003.3
3 Jeff Scanlan, CB Richard Ellis, Central Puget Sound Real Estate Research Report, Vol. 54 No. 2, Fall 2003.
[ 15 ]

T A B L E 1 0 Canal Submarket Office Market Data
# of
Buildings Square Footage
Vacancy Rate
Vacancy w/oSublease
Vacancy Class A
Vacancy Class B
Vacancy Class C
Fall 2003 27 1,179,095 6.84% 5.27% 4.41% 8.86% 15.14% Spring2003 26 1,157,095 10.16% 7.14% 9.02% 14.12% 2.43%
Placing these numbers in a context over time, Table 11 shows vacancy rates and net rentable area for the Canal submarket since Spring 2001.
T A B L E 1 1
Trends in Canal Submarket Office Market Data (vacancy rate and net rentable area)
Spring 2001 Fall 2001 Spring 2002 Fall 2002 Spring 2003 Fall 2003
2.03% 720,255sf
6.43% 850,313
21.02% 836,450
10.26% 1,132,095
10.16% 1,157,095
6.84% 1,157,095
T A B L E 1 2 Vacancy Rates in Adjacent Office Submarkets (vacancy rate and net rentable area)
for Fall 2003
Central Business District
Denny Regrade Lake Union Uptown Pioneer Square
15.18% 18,576,568sf
14.41% 5,203,813sf
24.58% 2,421,130sf
20.63% 2,547,998sf
18.59% 3,382,653sf
B. PURCHASES COMPLETED AND PROPOSED USES OF PROPERTY LOCATED
WITHIN PRIMARY AND SECONDARY IMPACT ZONES 7/1/03 – 12/31/03: None. C. GIFTS OF REAL PROPERTY AND PROPOSED USES OF SUCH PROPERTY
LOCATED WITHIN PRIMARY AND SECONDARY IMPACT ZONES 7/1/03-12/31/03: None.
[ 16 ]
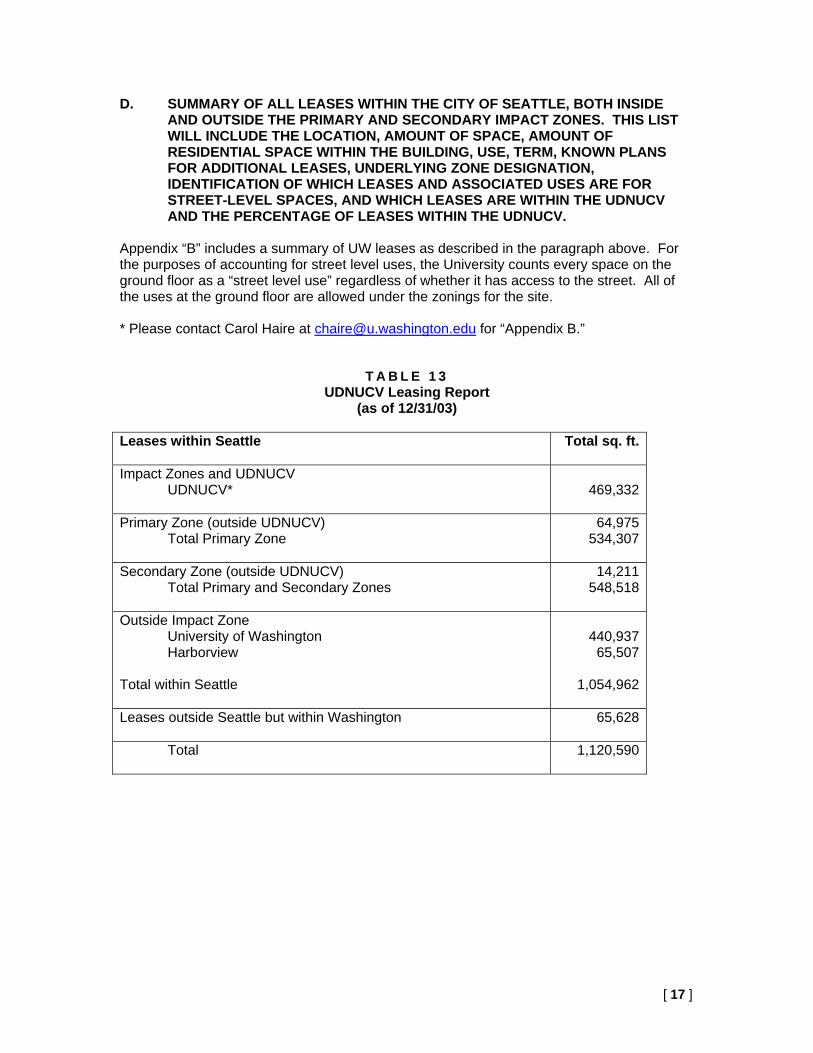
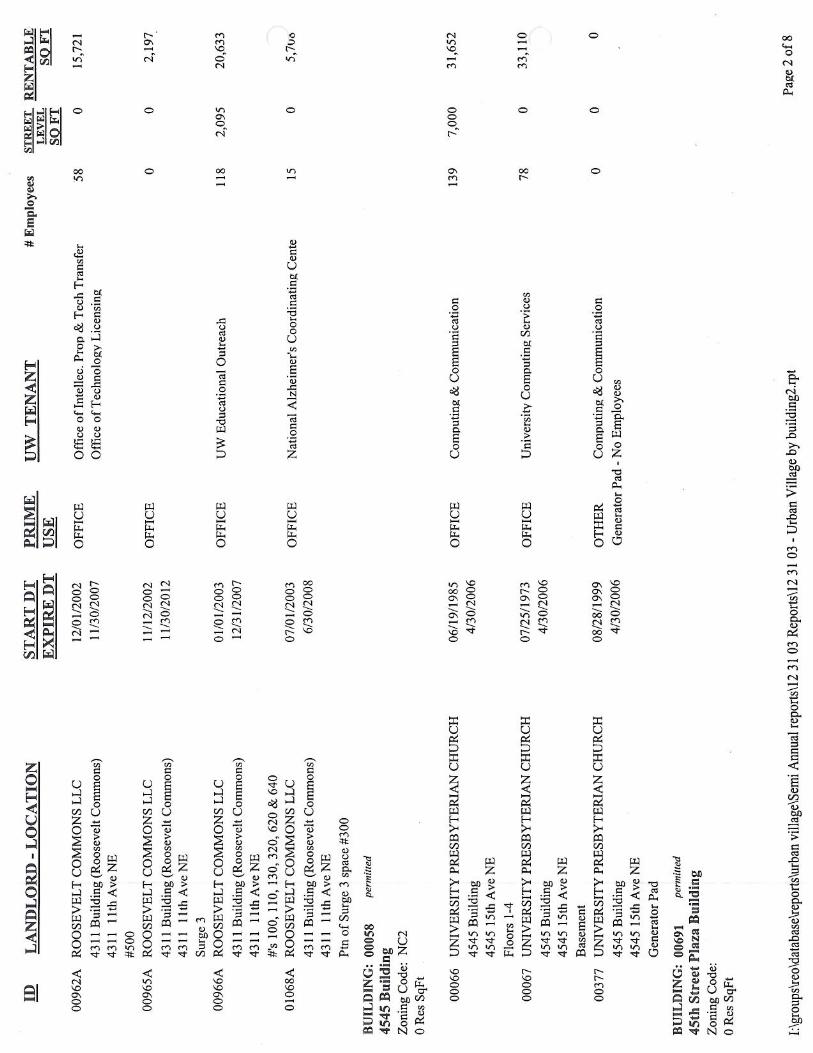
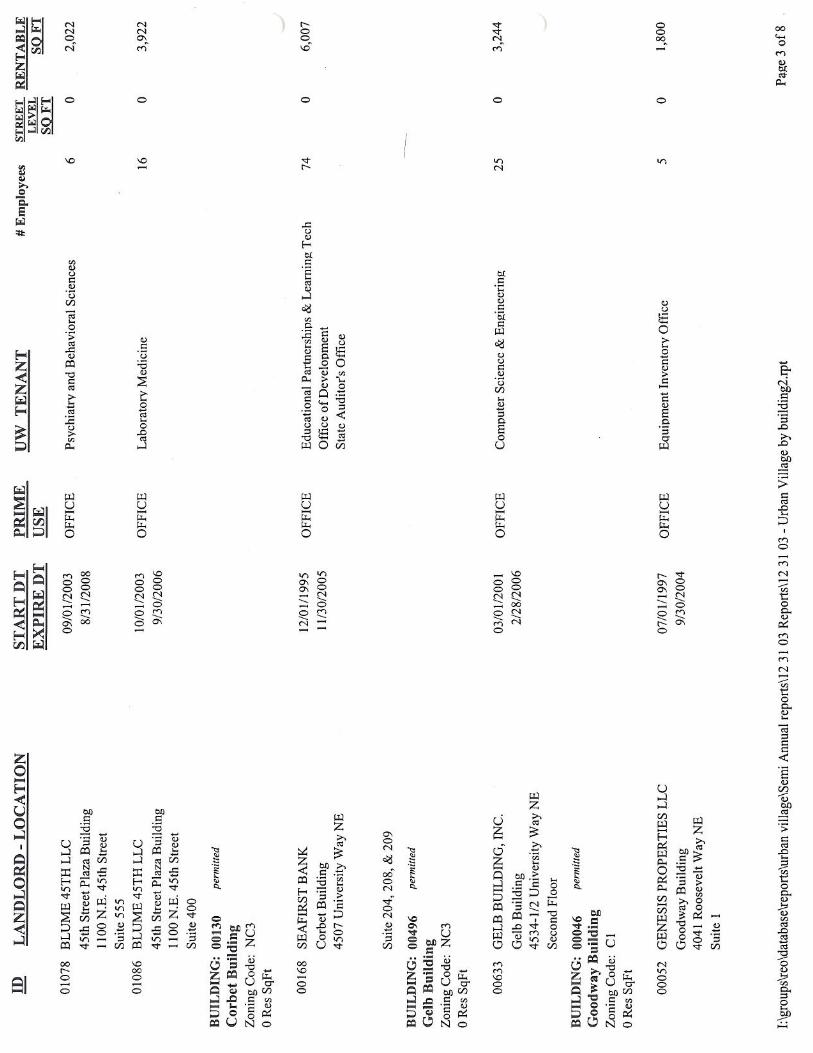
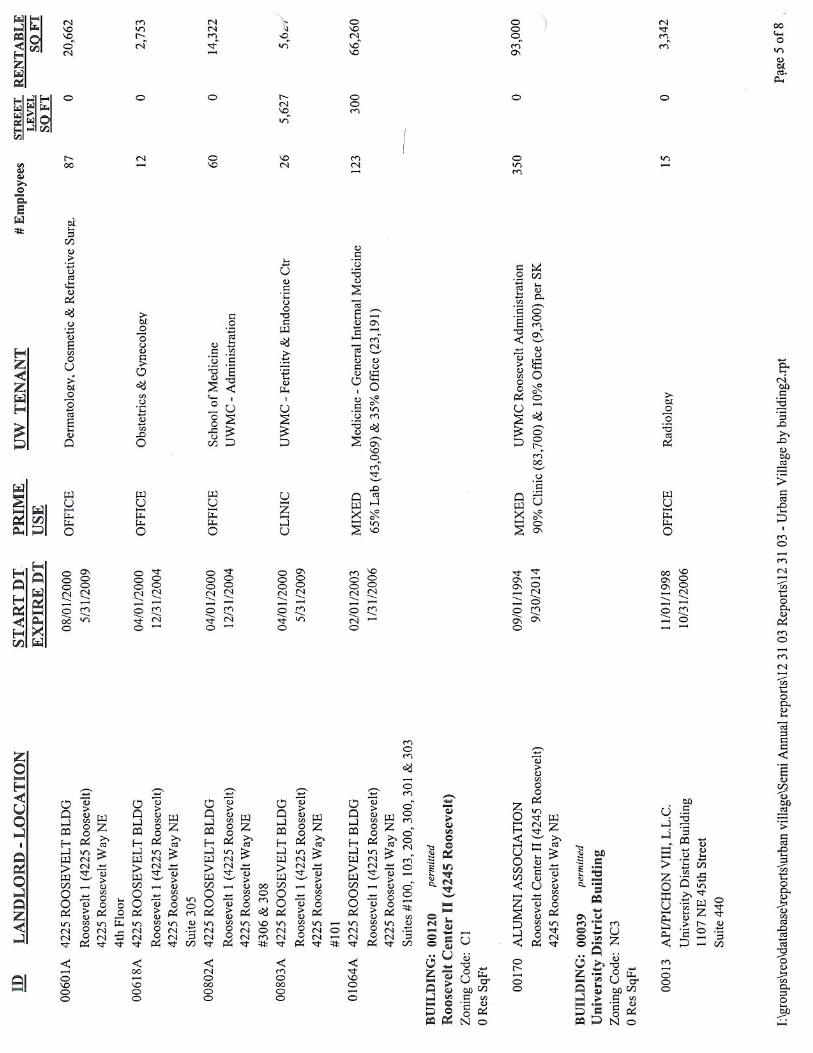
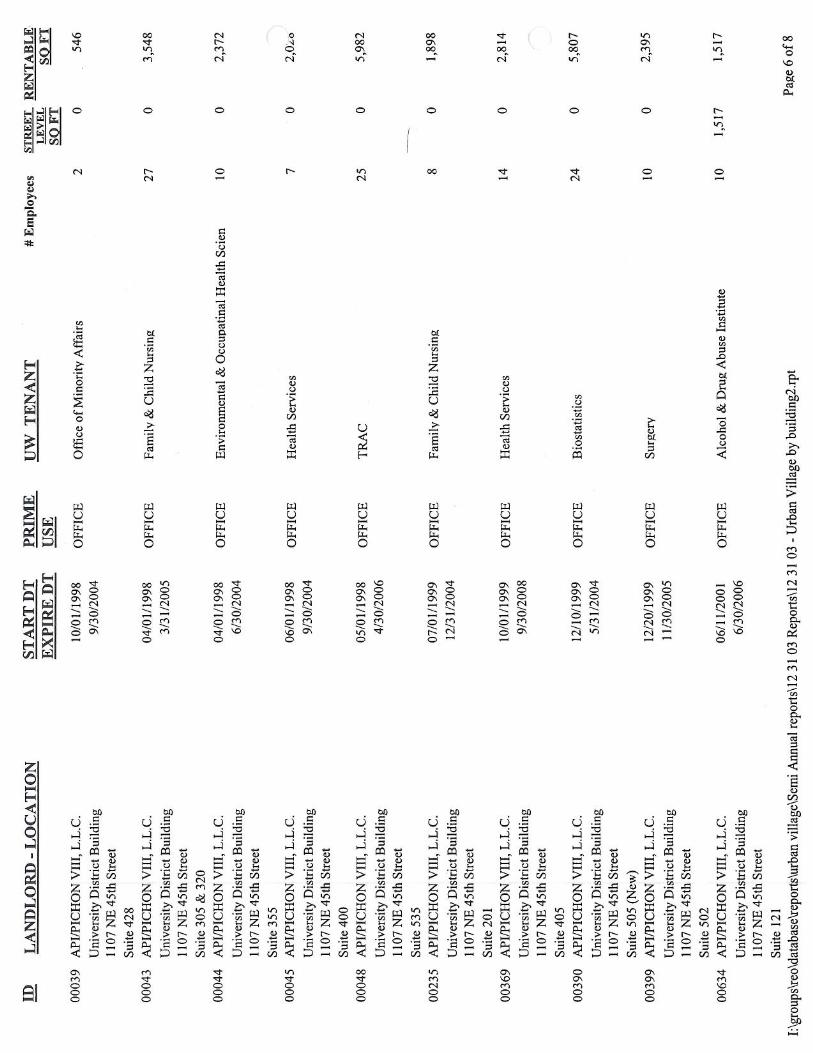
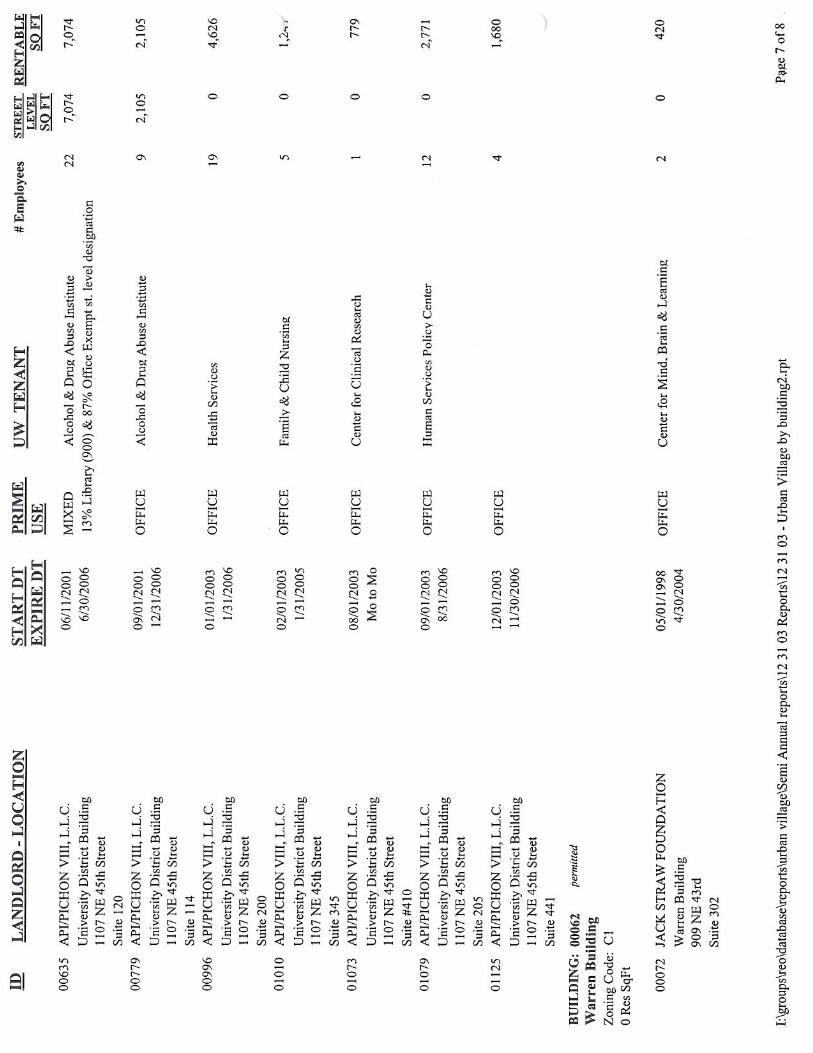
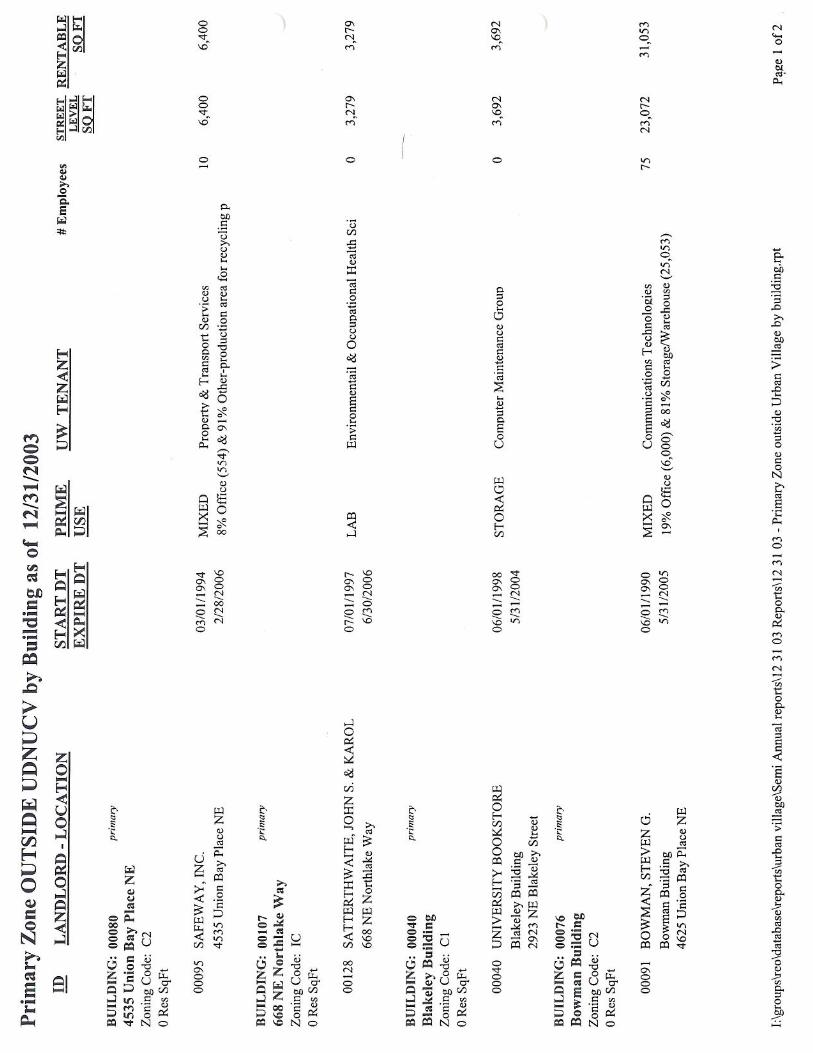
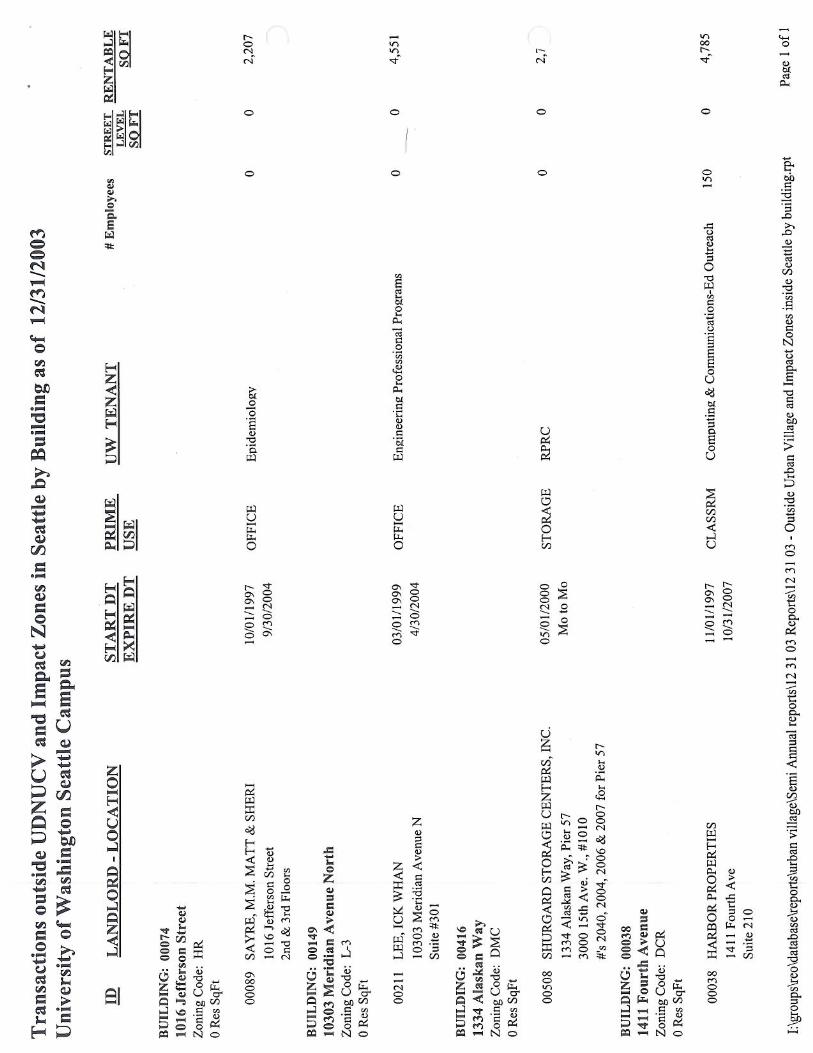
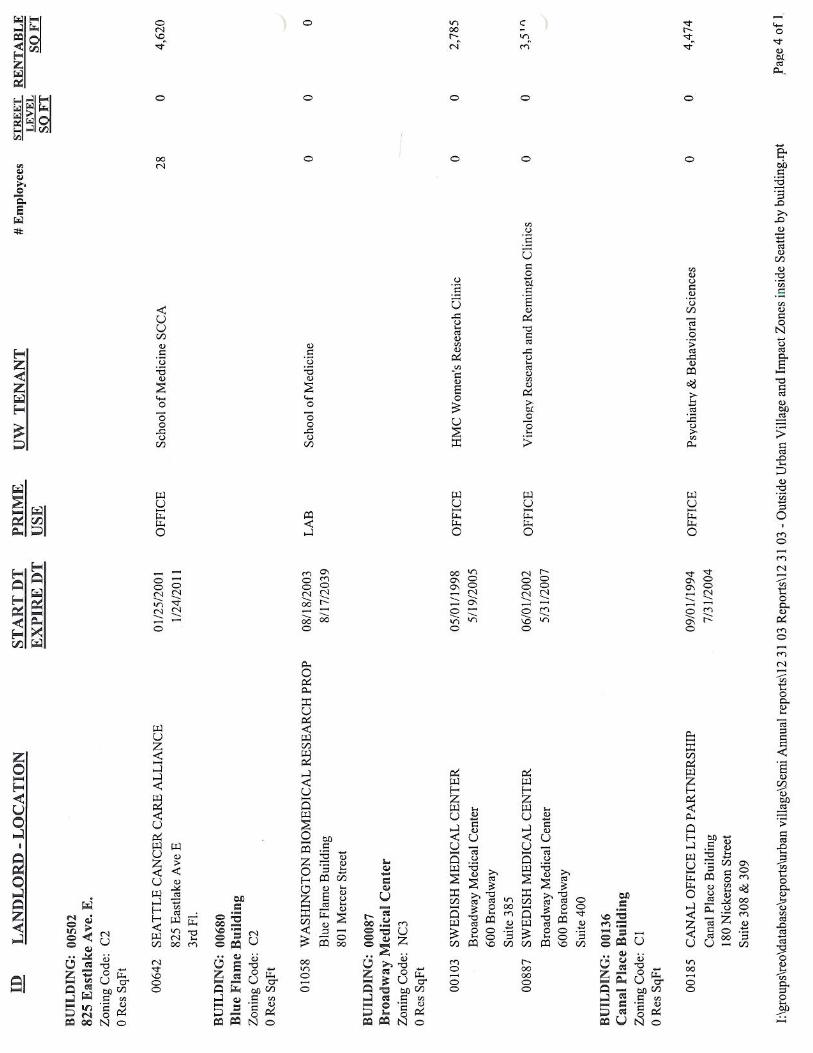
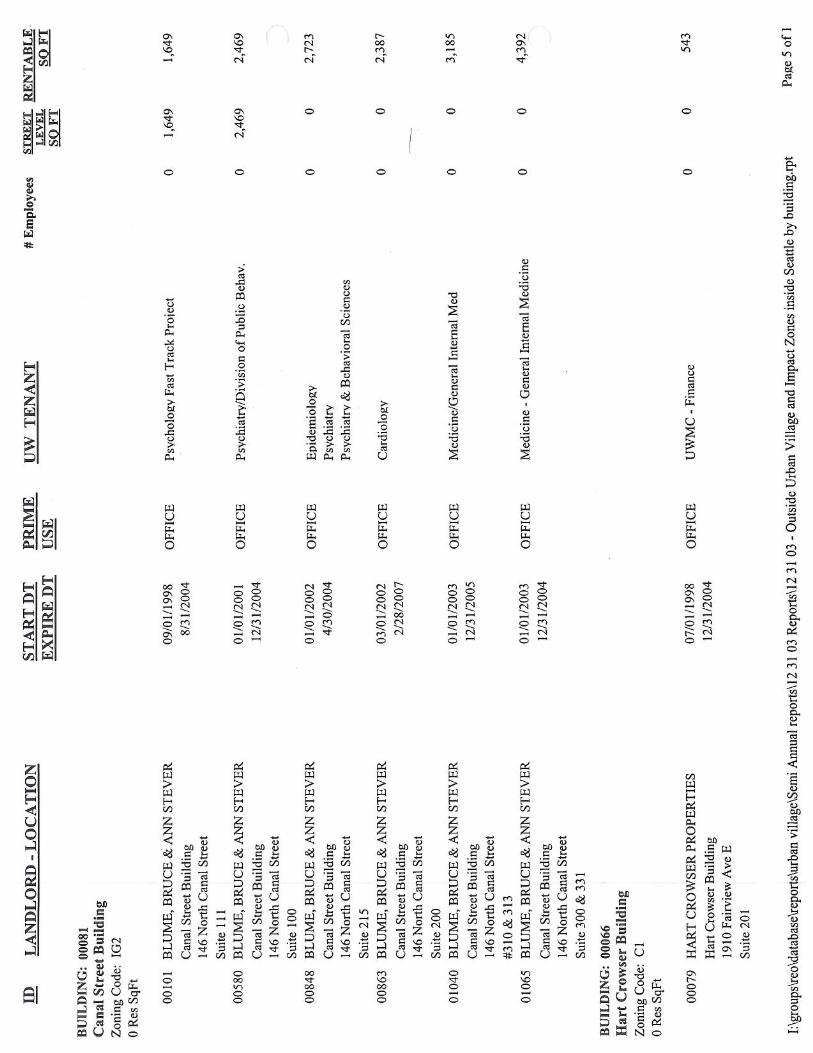
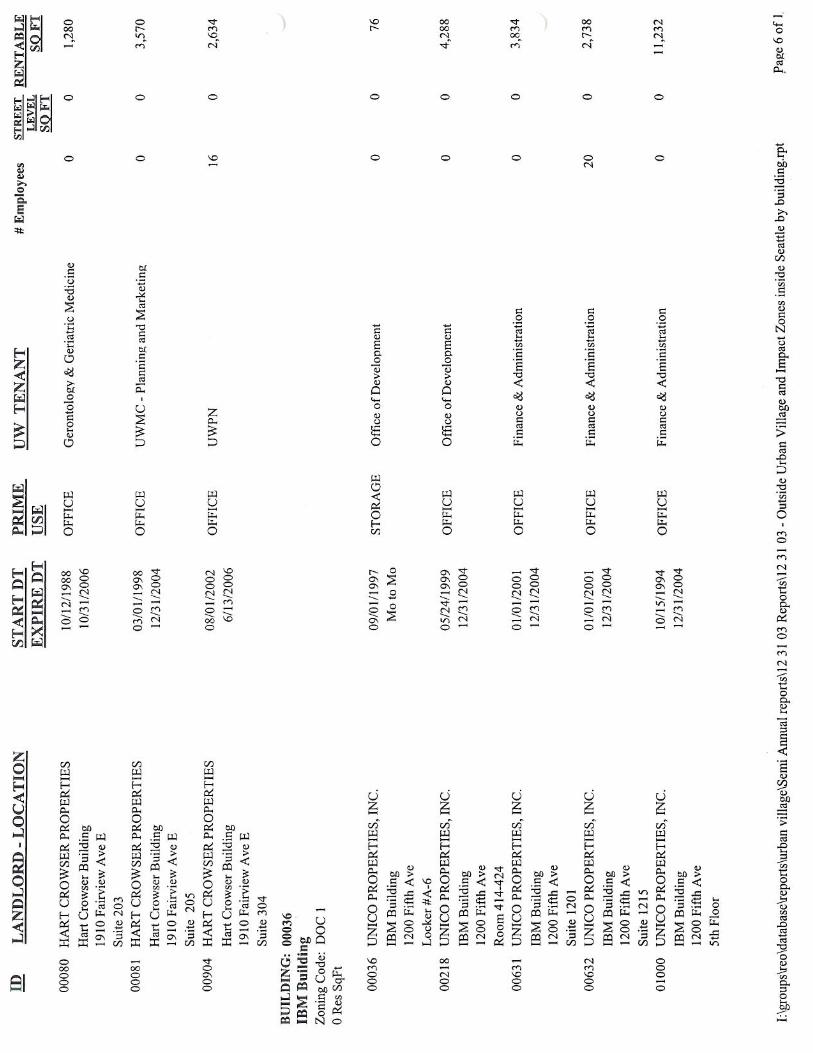
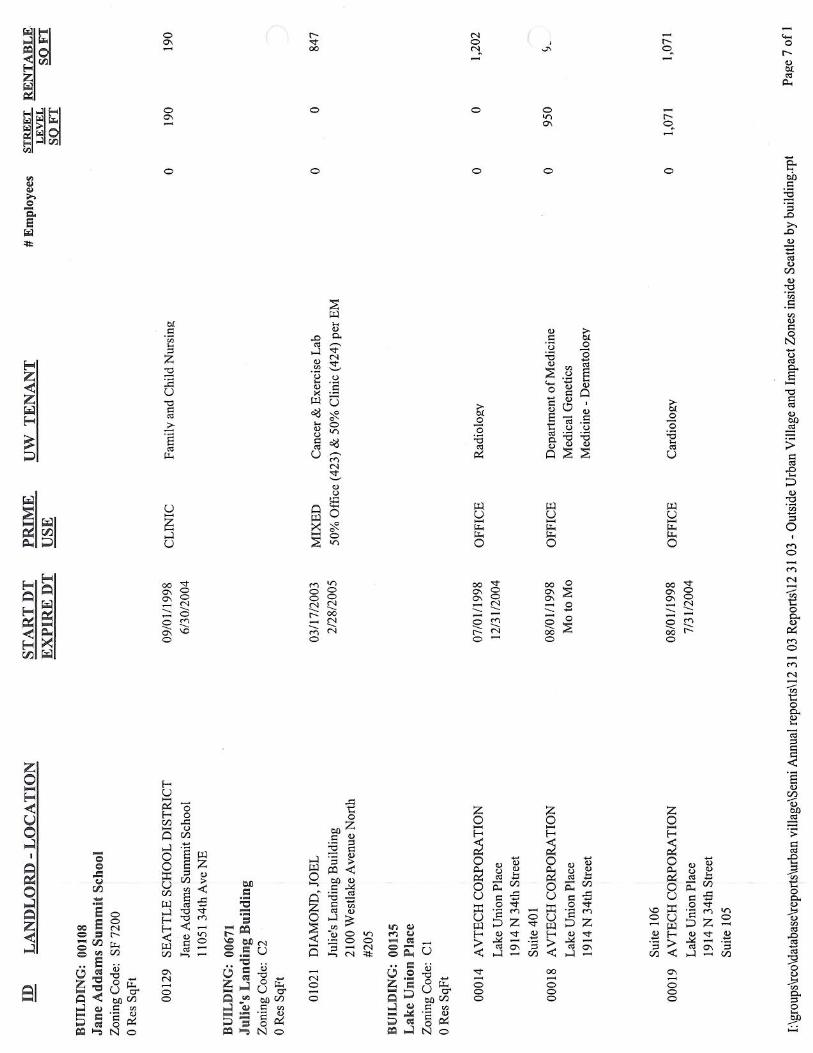
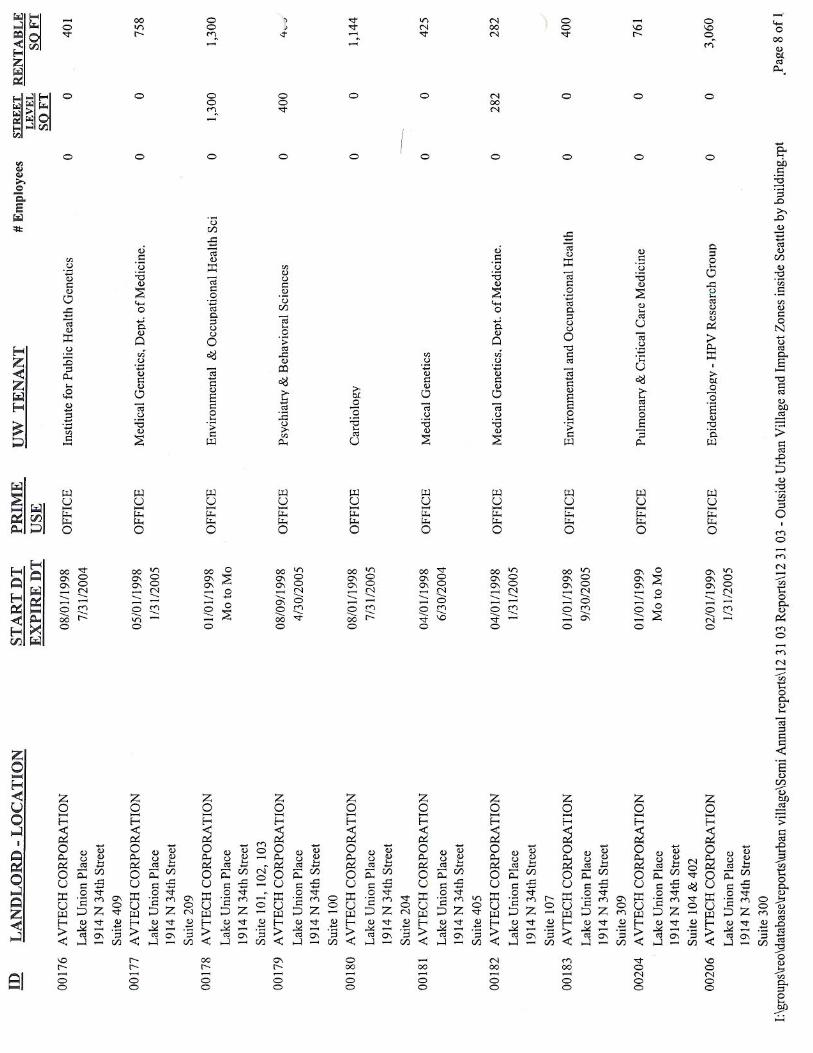
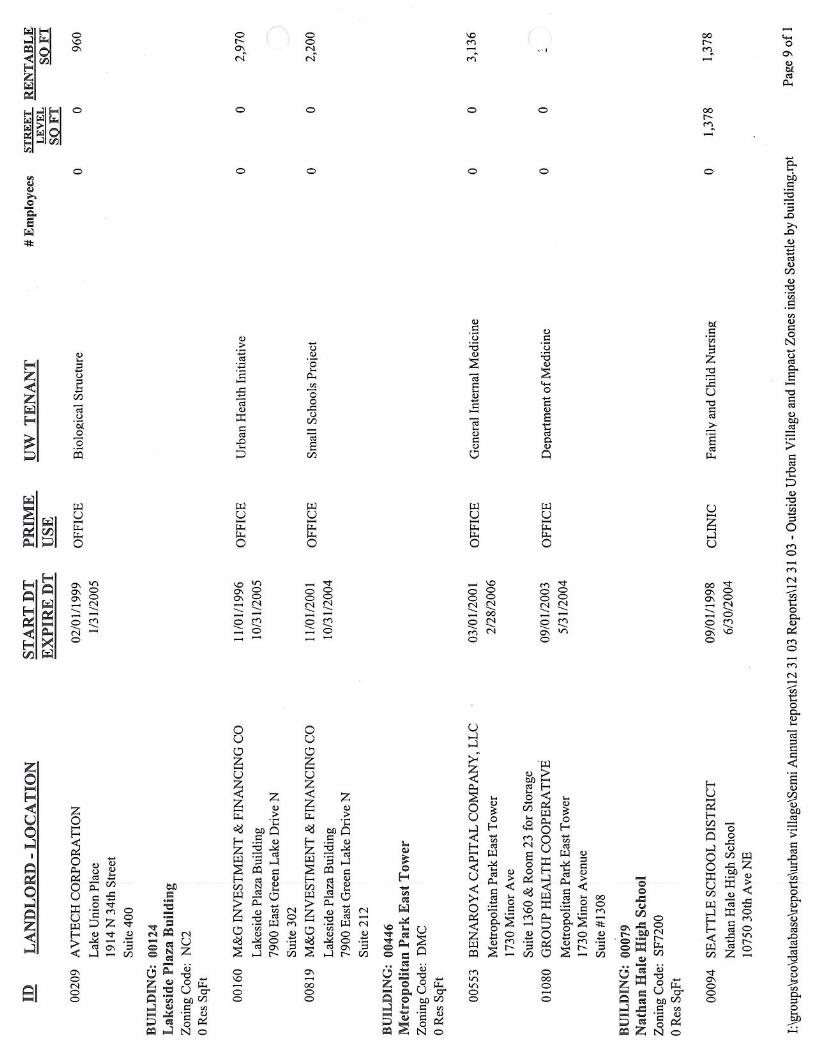
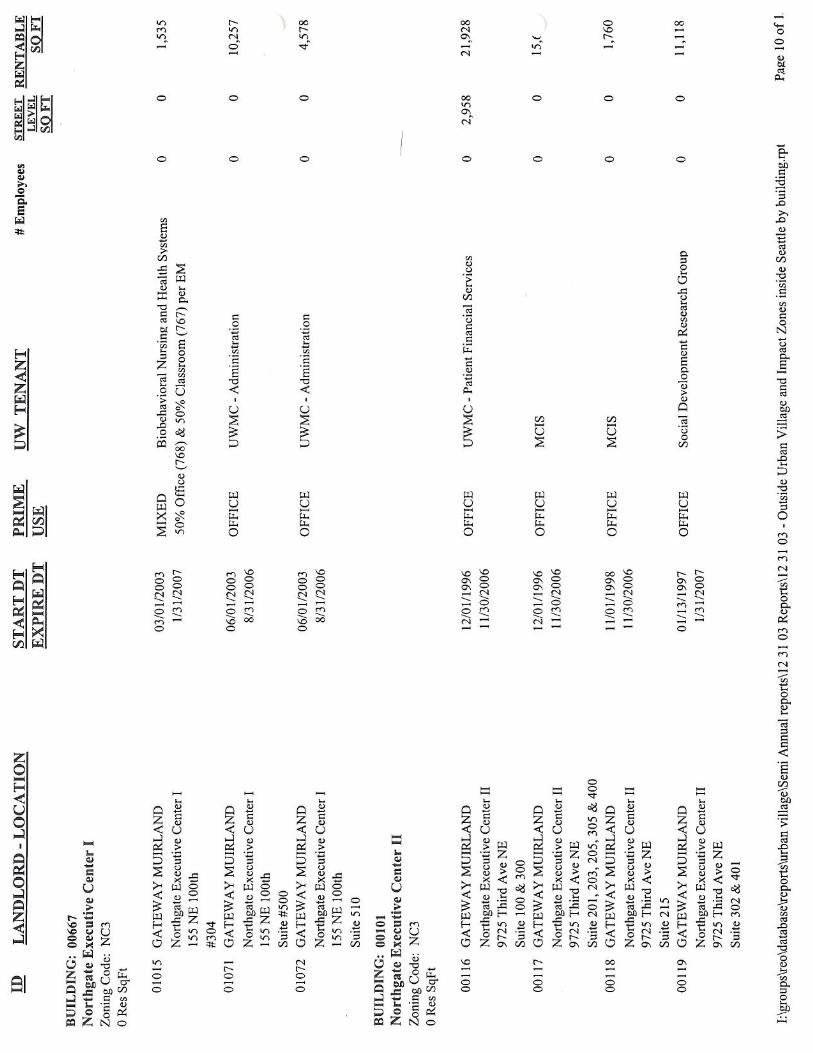
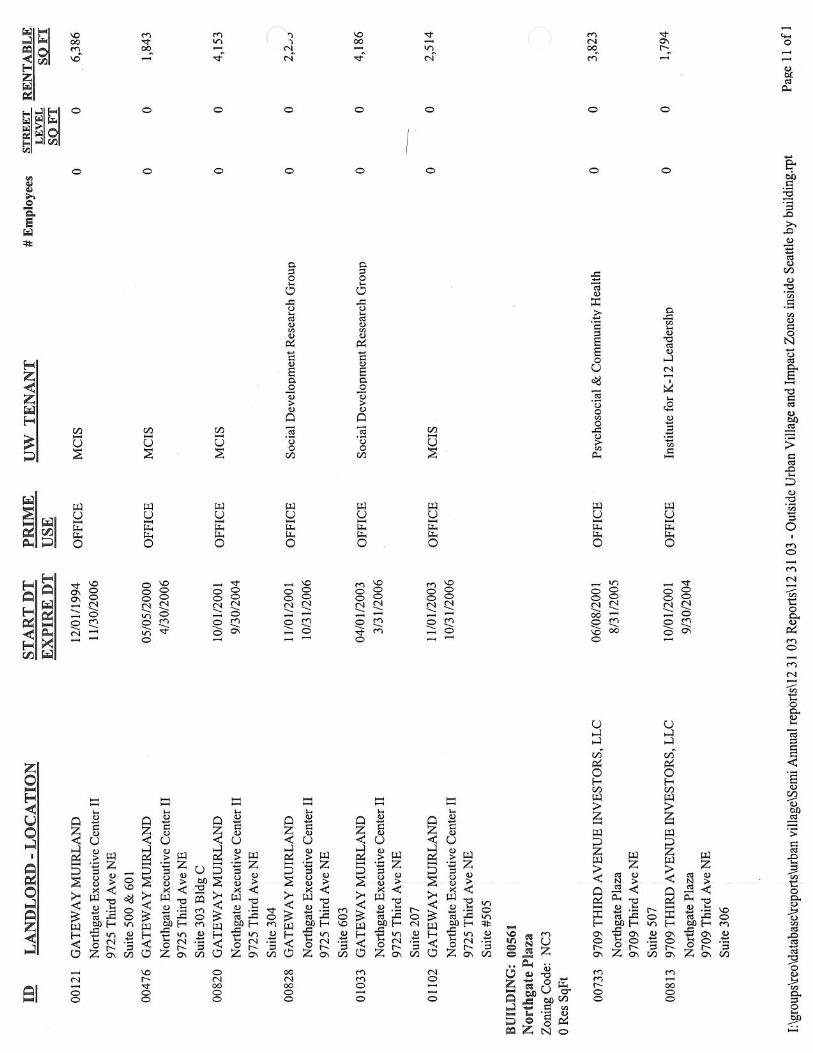
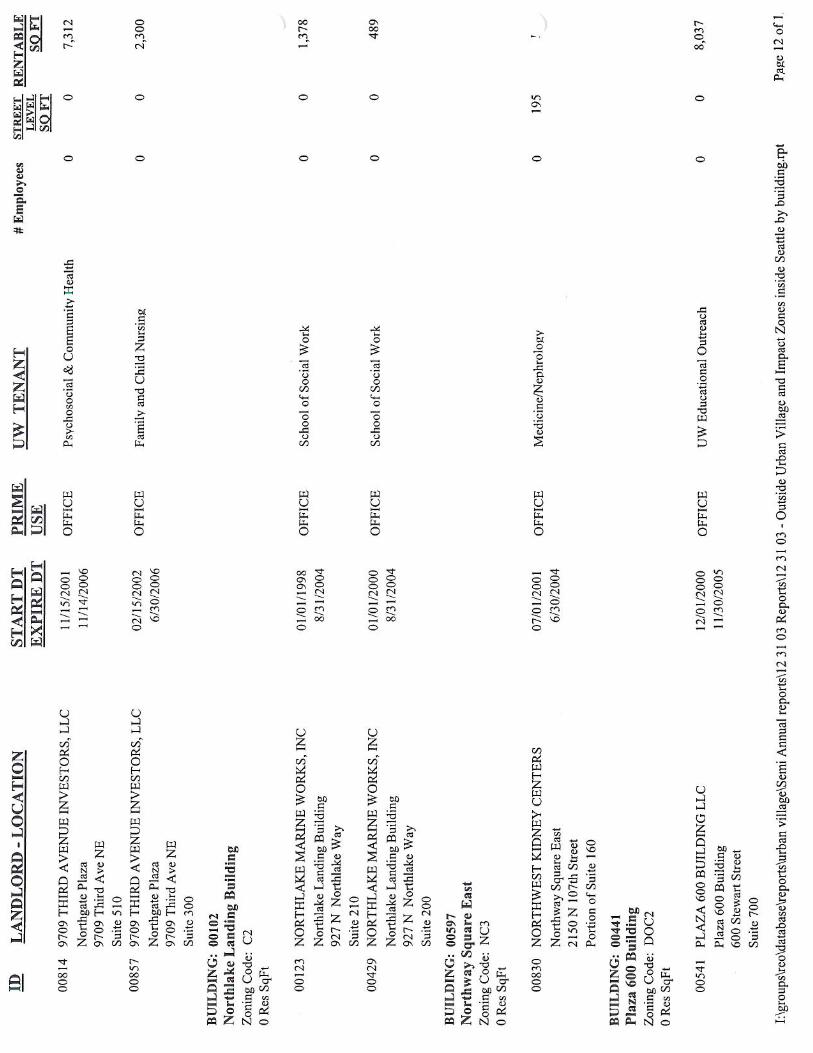
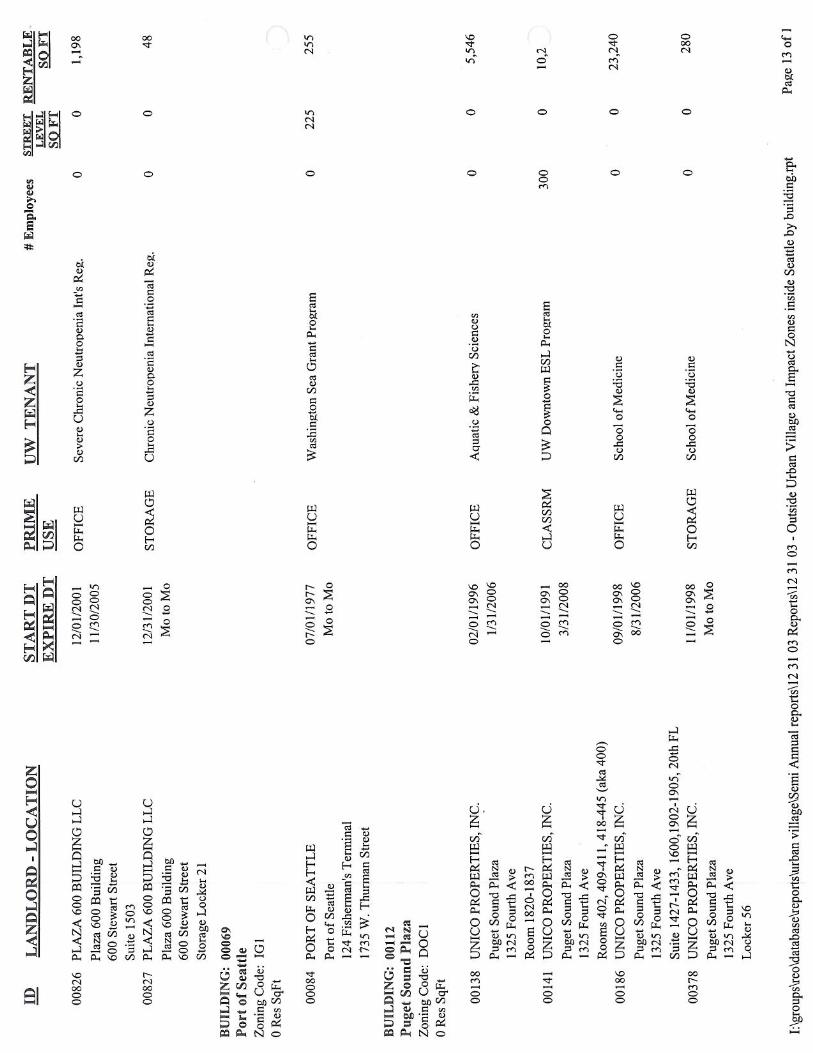
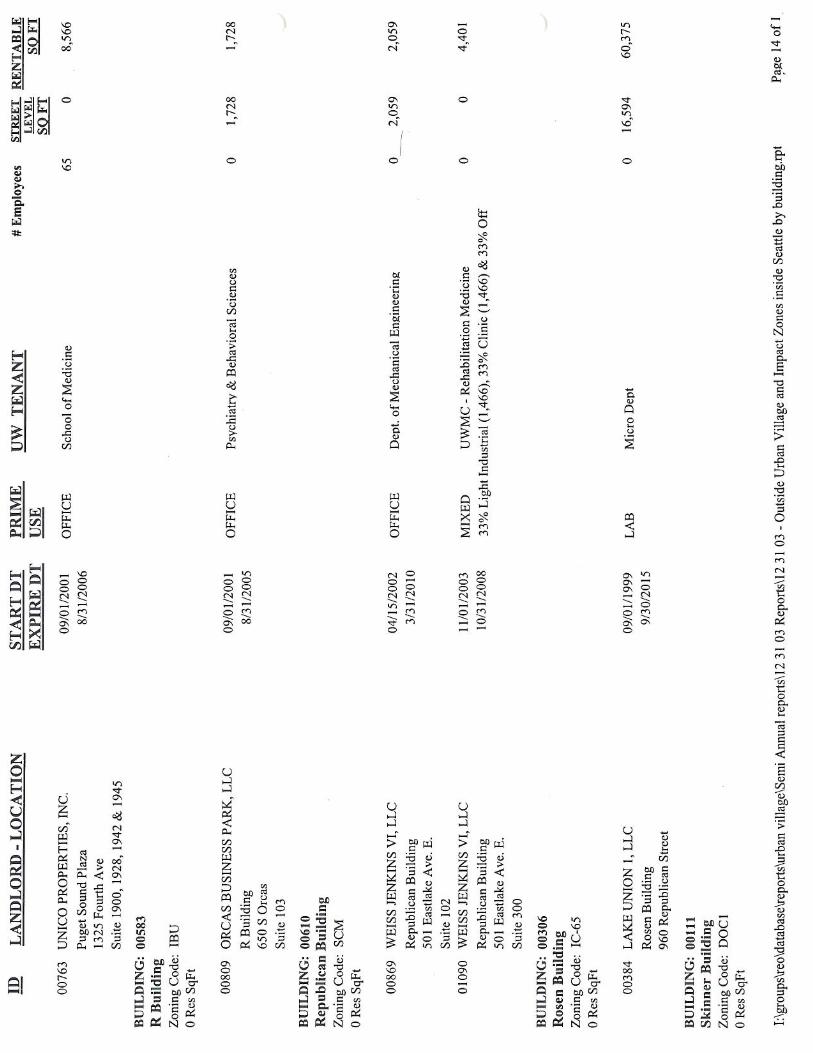
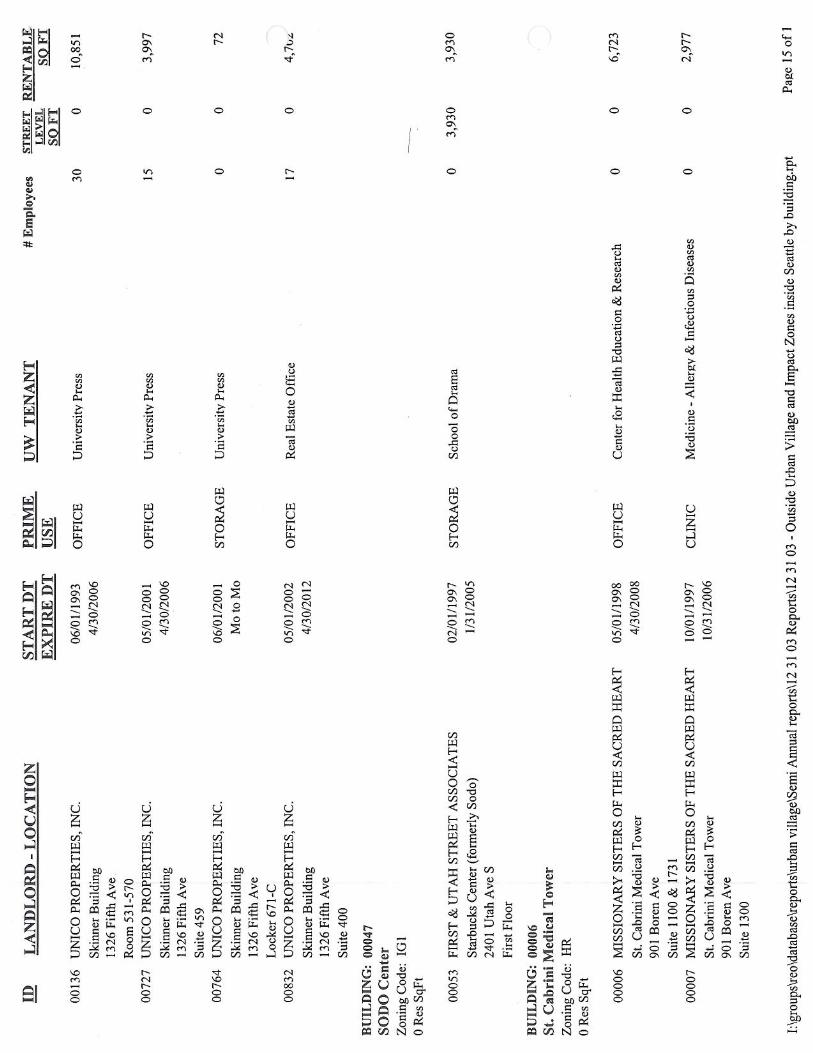
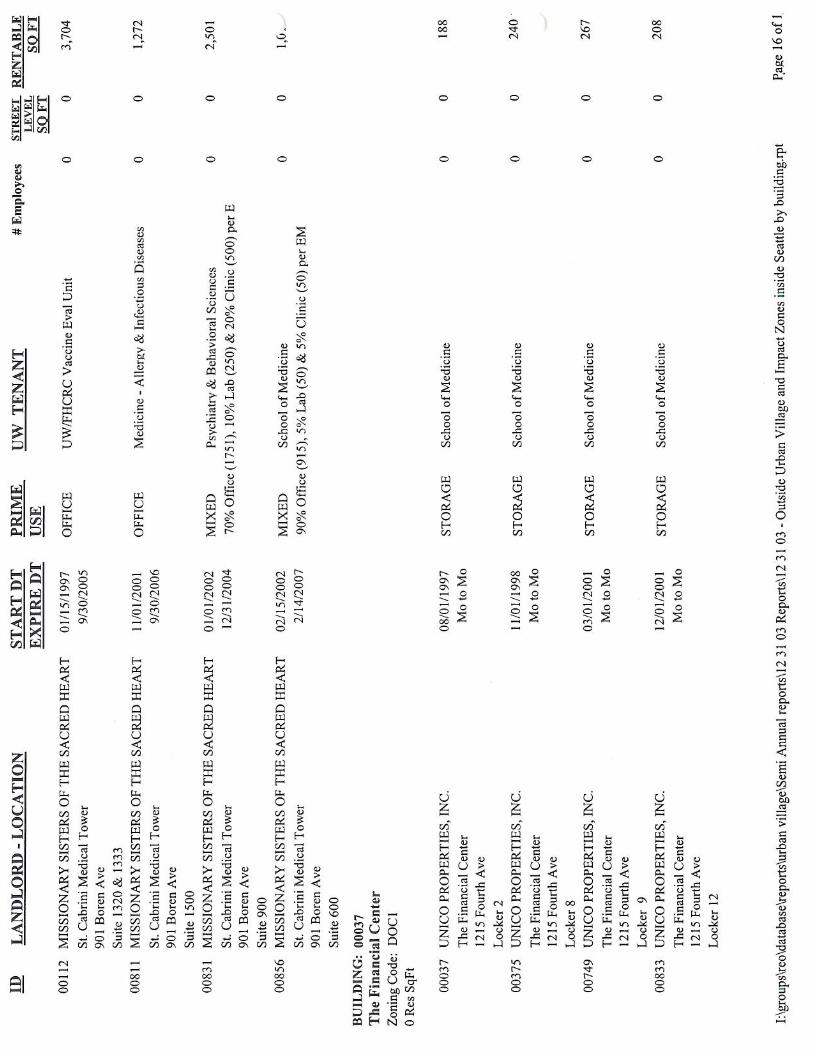
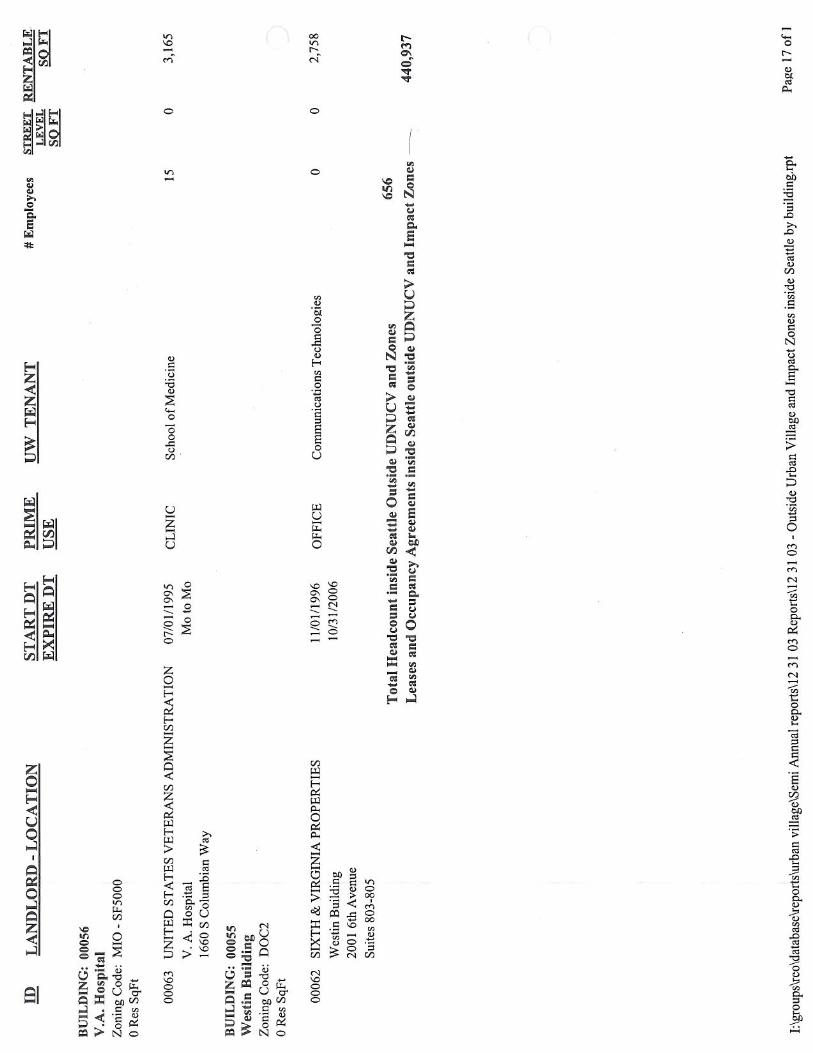
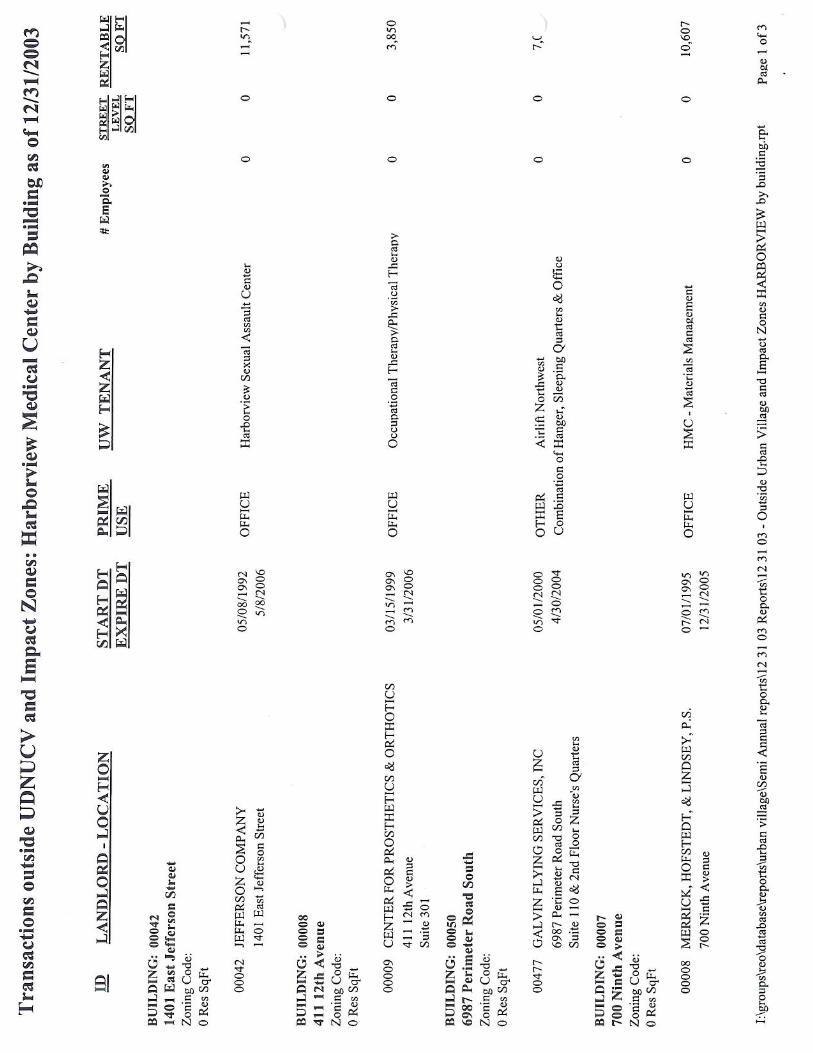
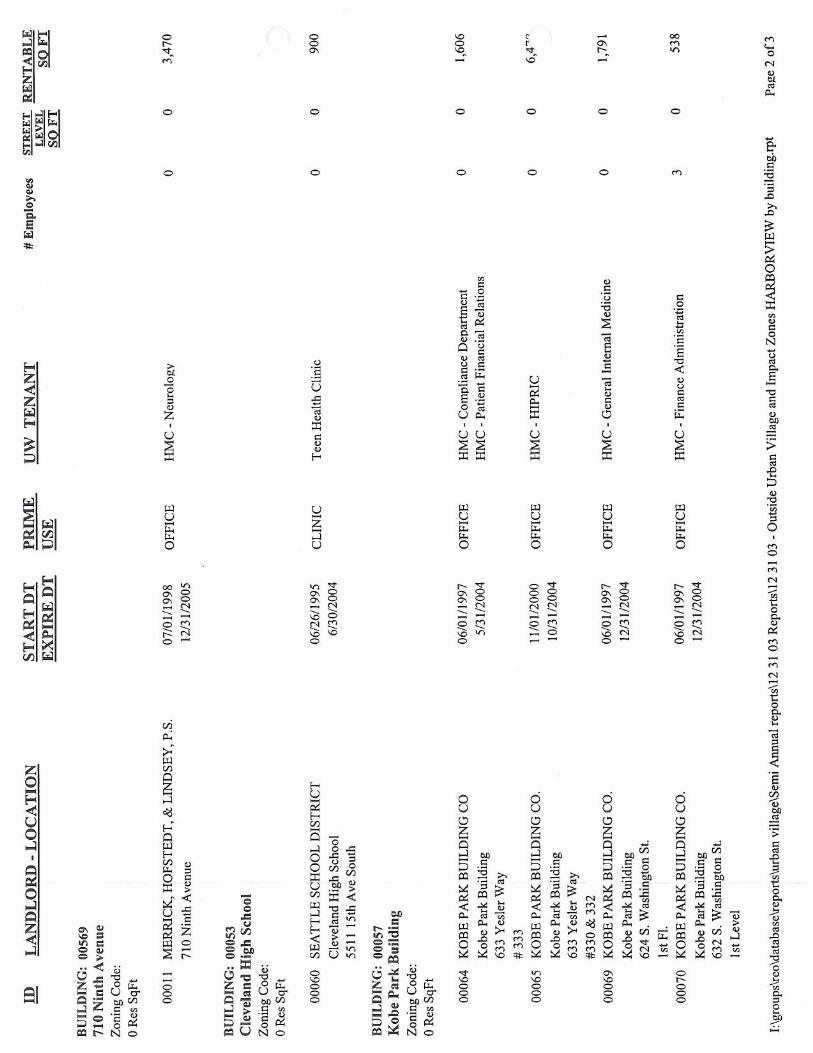
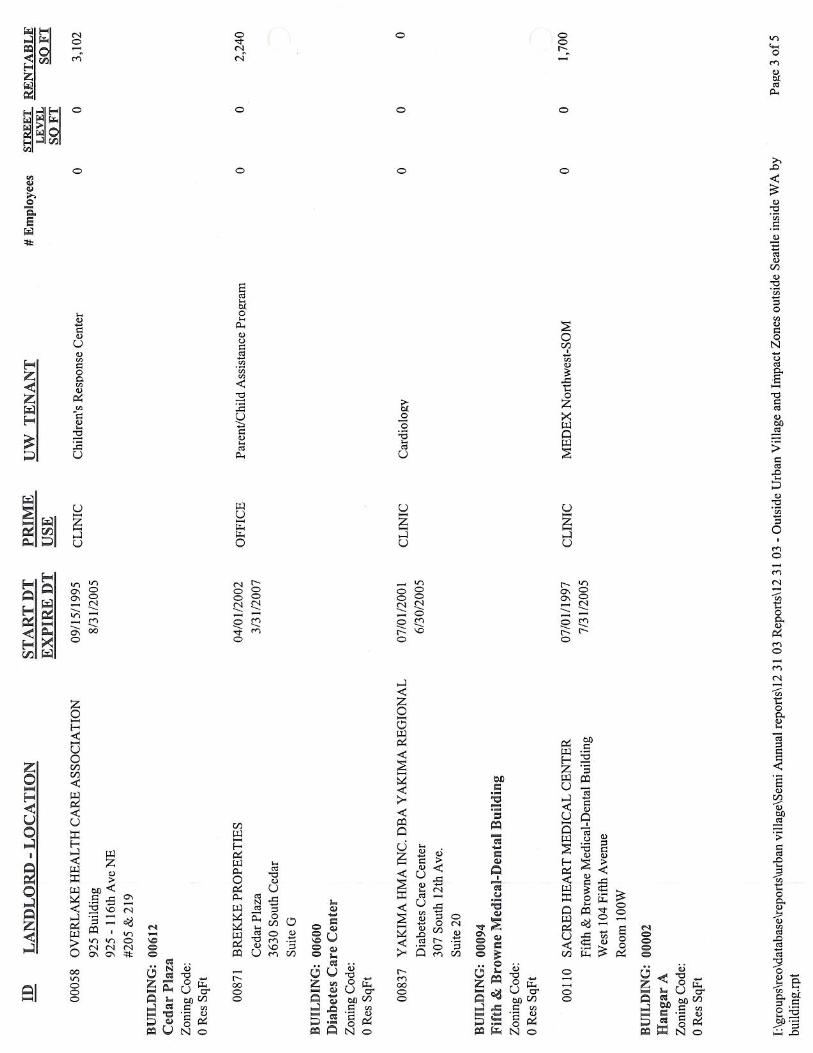
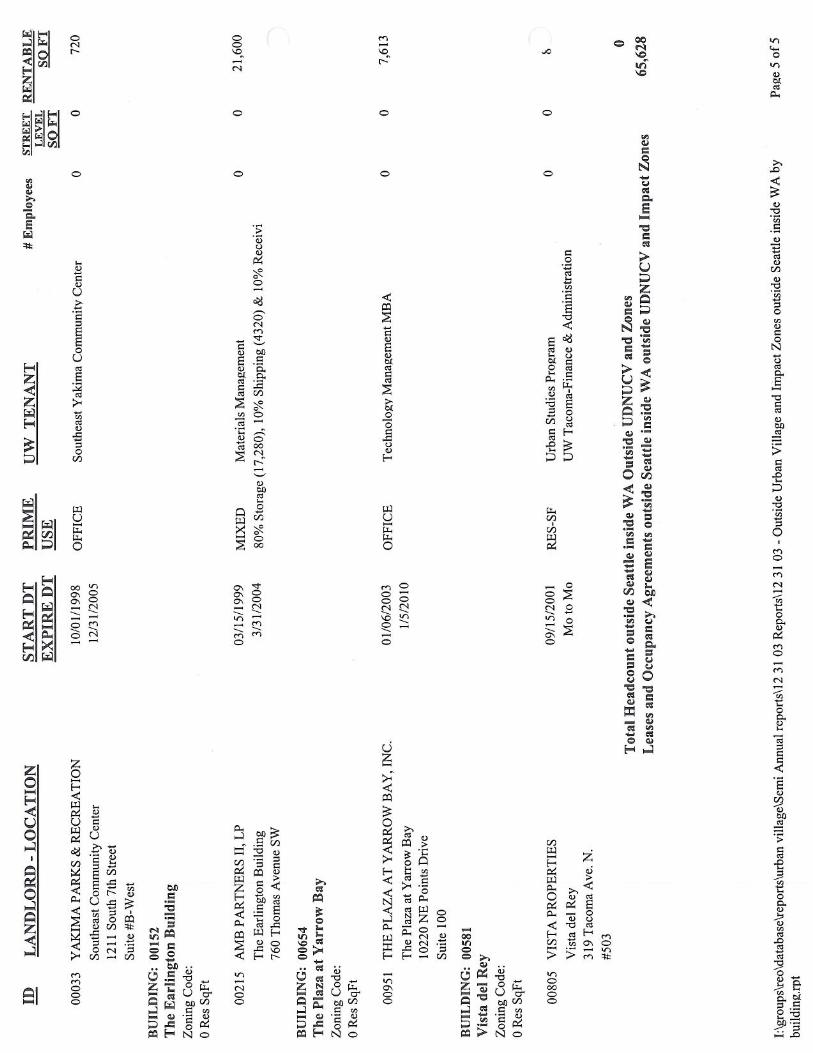
D. SUMMARY OF ALL LEASES WITHIN THE CITY OF SEATTLE, BOTH INSIDE AND OUTSIDE THE PRIMARY AND SECONDARY IMPACT ZONES. THIS LIST WILL INCLUDE THE LOCATION, AMOUNT OF SPACE, AMOUNT OF RESIDENTIAL SPACE WITHIN THE BUILDING, USE, TERM, KNOWN PLANS FOR ADDITIONAL LEASES, UNDERLYING ZONE DESIGNATION, IDENTIFICATION OF WHICH LEASES AND ASSOCIATED USES ARE FOR STREET-LEVEL SPACES, AND WHICH LEASES ARE WITHIN THE UDNUCV AND THE PERCENTAGE OF LEASES WITHIN THE UDNUCV.
Appendix “B” includes a summary of UW leases as described in the paragraph above. For the purposes of accounting for street level uses, the University counts every space on the ground floor as a “street level use” regardless of whether it has access to the street. All of the uses at the ground floor are allowed under the zonings for the site. * Please contact Carol Haire at [email protected] for “Appendix B.”
T A B L E 1 3 UDNUCV Leasing Report
(as of 12/31/03) Leases within Seattle
Total sq. ft.
Impact Zones and UDNUCV UDNUCV*
469,332
Primary Zone (outside UDNUCV) Total Primary Zone
64,975 534,307
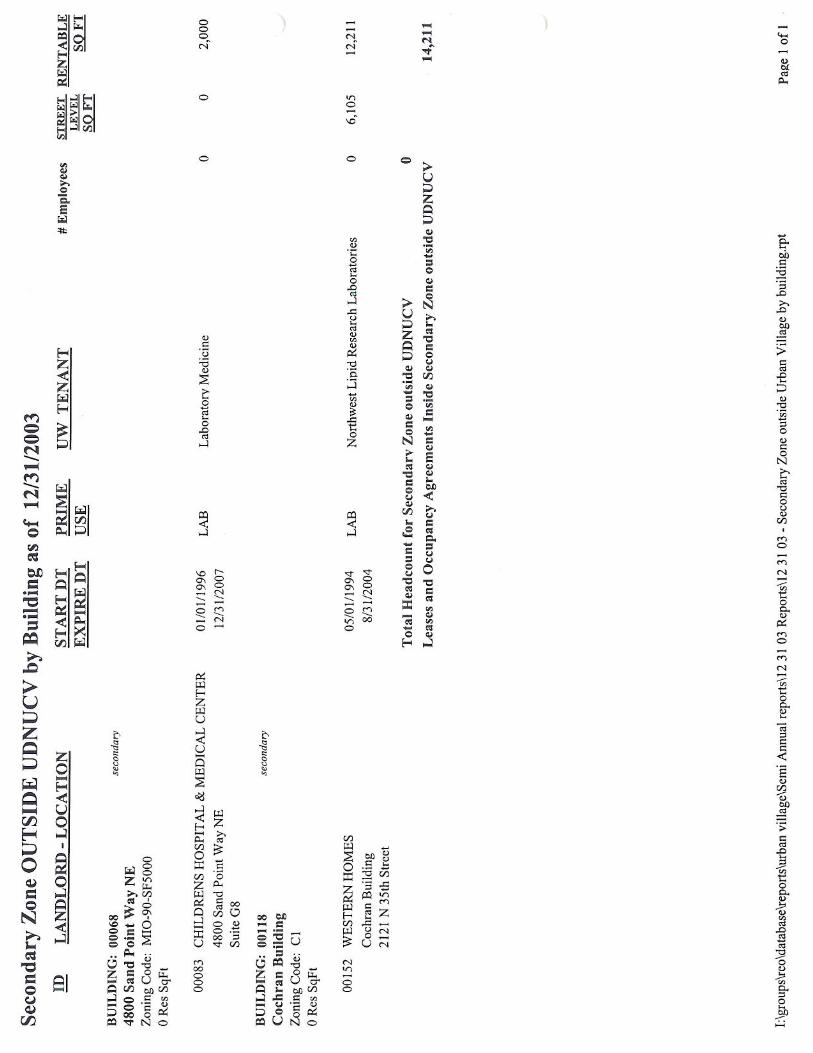
Secondary Zone (outside UDNUCV) Total Primary and Secondary Zones
14,211 548,518
Outside Impact Zone University of Washington Harborview Total within Seattle
440,937
65,507
1,054,962
Leases outside Seattle but within Washington
65,628
Total
1,120,590
[ 17 ]
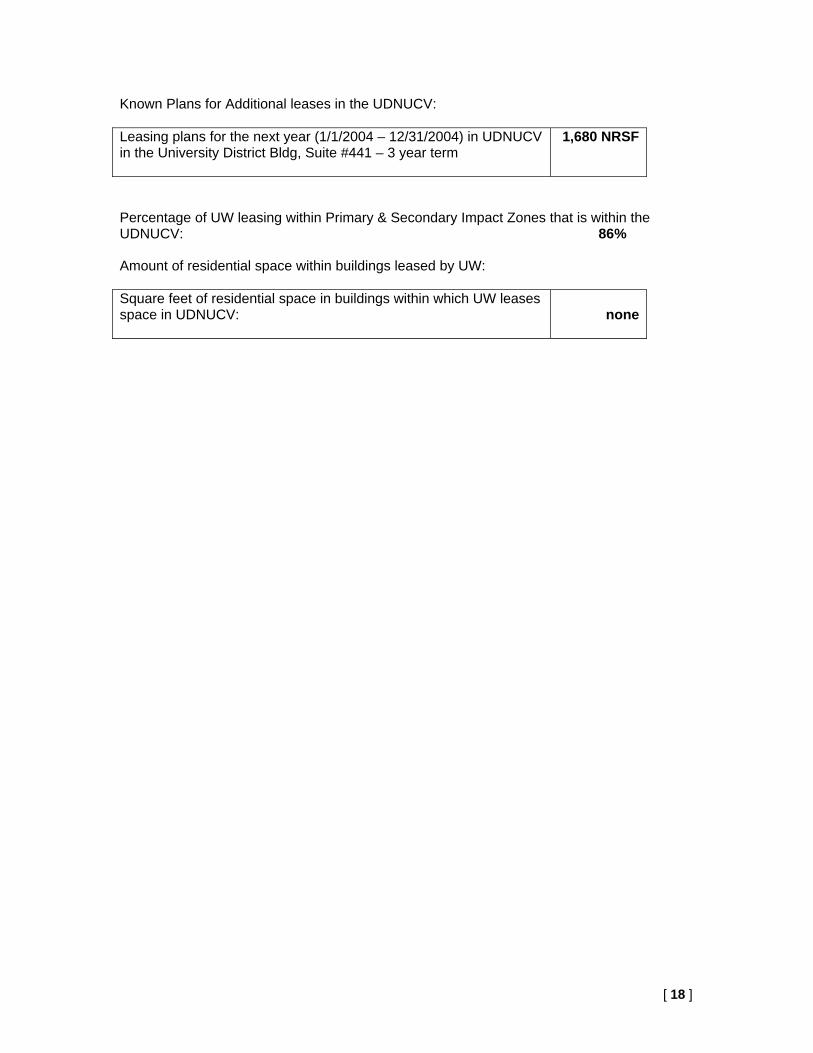
Known Plans for Additional leases in the UDNUCV: Leasing plans for the next year (1/1/2004 – 12/31/2004) in UDNUCV in the University District Bldg, Suite #441 – 3 year term
1,680 NRSF
Percentage of UW leasing within Primary & Secondary Impact Zones that is within the UDNUCV: 86% Amount of residential space within buildings leased by UW: Square feet of residential space in buildings within which UW leases space in UDNUCV:
none
[ 18 ]
S E C T I O N 5
The University in the Community A. DEVELOPMENT OF THE HOUSING QUALITY COMPLAINT PROGRAM AND
COMPLETION OF THE “GUIDE TO STUDENT COMMUNITY RELATIONS – NEIGHBOR TO NEIGHBOR EXPECTATIONS” BROCHURE.
Off-Campus Housing Complaints & Information The Associated Students of the University of Washington's (ASUW) Student Housing Affairs office provides information about off-campus housing. While this student-run office is a useful resource, there have been problems with landlords who take advantage of students or violate land use regulations. As a result, the ASUW has revised its Housing Complaint Policy to respond more effectively to students' issues with landlords and property management firms in a manner consistent with City policy. The ASUW is also educating students about their rights under the Landlord-Tenant Act and how to file land use complaints with the Department of Planning & Development (formerly DCLU). ASUW's complaint policy meets requirements in the new City/University Agreement. Complaint Policy: http://depts.washington.edu/asuwsha/c_policy.html Student Housing Education: http://depts.washington.edu/asuwsha/links.html Hold it Down Please! - A Guide to Off-Campus Living The recently published Guide to Off-Campus Living provides students with tips on being a good neighbor, noise expectations, parking restrictions and resources to help solve neighborhood problems. With publication of this guide, the University is fulfilling a commitment made to the City and neighbors during adoption of the Campus Master Plan. This document was sent out to more than 6,400 students living in the 98105 zip code. Hold it Down Please: http://depts.washington.edu/ovpsa/Hold_It_Down.pdf
[ 19 ]
B. A DESCRIPTION OF HOW UW LEASING ACTIVITY AND DEVELOPMENT IS CONSISTENT WITH APPLICABLE NEIGHBORHOOD PLANS.
University of Washington leasing supports the following goals in the University Community Urban Center plan:
• Goal A-3-Support long-term commercial redevelopment to maintain the UCUC’s diverse economic base: University leasing encourages the redevelopment of commercial areas in the U-District. For example, the University recently agreed to be an anchor tenant in a new UNICO development that will include ground floor retail and housing. Without the University’s commitment to leasing space in this project, the building would not be feasible to construct.
• Policy A-3.1-Accommodate new knowledge-based industries that have a positive
impact on their neighbors: The University uses leased space in the U-District to house many different research projects. These projects are an important cornerstone of knowledge-based industries in the neighborhood and City. The University’s presence draws other knowledge-based industries to the neighborhood - such as Intel Corporation at the 45th Street Plaza Building.
• Goal A-5.2 -Allow UW uses off campus where there is also a benefit to the
community: University leasing brings employees to the U-District who support small businesses. Concentrating UW employees closer to campus can also reduce traffic congestion as these employees are able to walk to campus for meetings and classes rather than drive.
• Policy A-5.3-Encourage University related commercial development such as
“technology transfer” and institute knowledge-based incubatory businesses where such uses are of benefit to the university and the community. Focus such uses along Roosevelt Avenue NE south of NE 50th and the University Gardens core, between the freeway and Brooklyn Avenue NE, NE 50th Street, and NE 43rd Street: Many UW leased spaces house research and activities related to: environmental & occupational health, psychiatry, family & child nursing, alcohol & drug abuse, fertility & endocrinology, and intellectual & property transfer. This important work supports & attracts biotech and other businesses throughout the City and region.
[ 20 ]

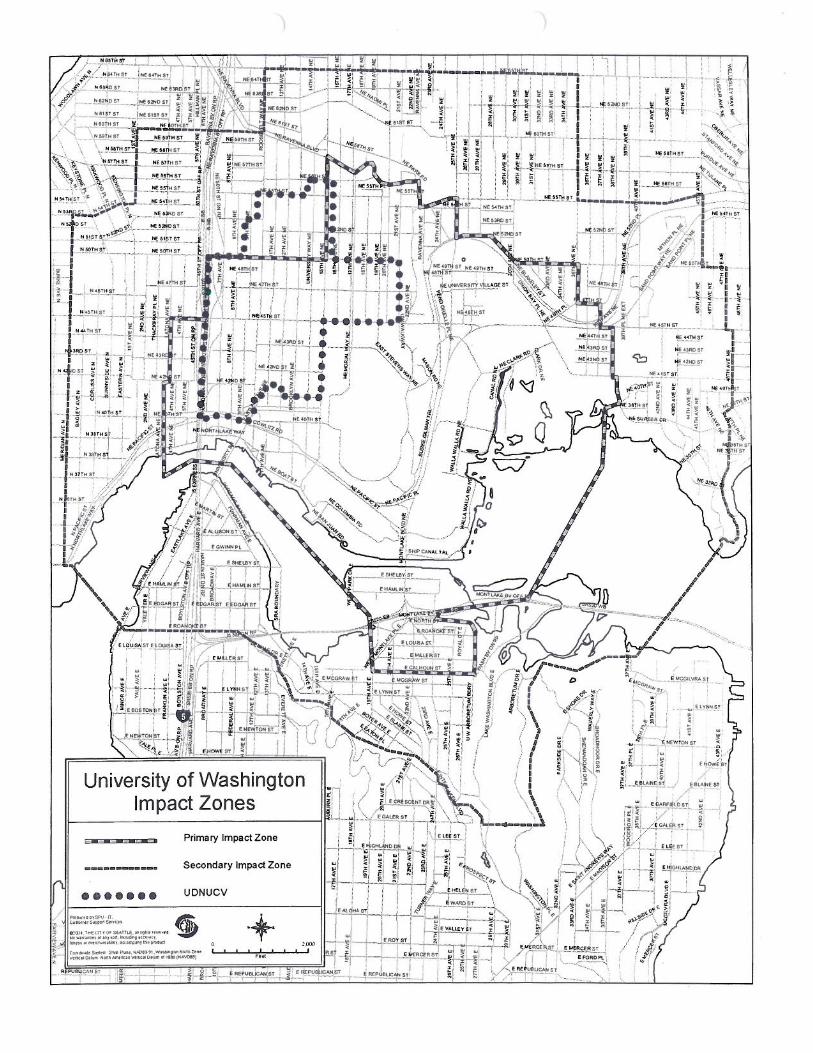
Appendix A
Map of UDNUCV
[ 21 ]

Appendix B
UW Leasing Summary
Please contact Carol Haire at [email protected] for Appendix B.
[ 22 ]
Appendix C
List of Errors in the Campus Master Plan
During the course of working with the CMP over the past year, several errors in the Plan have been noted by University staff. Below are three errors that have been noted thus far.
1. List of campus buildings in Appendix “G” has several errors. The following buildings are listed as leased when they should be listed as owned: Ocean Research Buildings 1 and 2. In addition, 4100 and 4516 University Way NE are leased by the University but are outside of the MIO boundaries and are therefore not appropriate for inclusion in this list.
2. One of the sites listed as approved under the GPDP is incorrect. The list of buildings on Table IV-4, page 86, lists site 47S as one of the eight “GPDP Projects currently approved and in design/construction.” This table should show site 48S as the one approved under the GPDP, not site 47S.
3. One of the sites listed on Table IV-4, page 86, does not include demolished square footage. Site 44S should include 30,468 gsf in the “Demo’d SF” column. The Academic Computing center is on site 44S and would be demolished if a new building were built on this site.
[ 23 ]