university of st. thomas uses ahp to grow operations
TRANSCRIPT

University of St. Thomas, MinnesotaUST Research OnlineOperations and Supply Chain Management FacultyPublications Operations and Supply Chain Management
2013
University of St. Thomas uses AHP to growoperations management majorJanine SandersUniversity of St. Thomas, Minnesota, [email protected]
Sheneeta W. WhiteUniversity of St. Thomas, Minnesota, [email protected]
Follow this and additional works at: http://ir.stthomas.edu/ocbopmtpub
Part of the Business Administration, Management, and Operations Commons, ManagementSciences and Quantitative Methods Commons, and the Operations and Supply Chain ManagementCommons
This Article is brought to you for free and open access by the Operations and Supply Chain Management at UST Research Online. It has been acceptedfor inclusion in Operations and Supply Chain Management Faculty Publications by an authorized administrator of UST Research Online. For moreinformation, please contact [email protected].
Recommended CitationSanders, Janine and White, Sheneeta W., "University of St. Thomas uses AHP to grow operations management major" (2013).Operations and Supply Chain Management Faculty Publications. 31.http://ir.stthomas.edu/ocbopmtpub/31

130 Int. J. Information and Operations Management Education, Vol. 5, No. 2, 2013
Copyright © 2013 Inderscience Enterprises Ltd.
University of St. Thomas uses AHP to grow operations management major
Janine Sanders Jones* Operations and Supply Chain Management, University of St. Thomas, 1000 LaSalle Ave, Minneapolis, MN 55403, USA E-mail: [email protected] *Corresponding author
Sheneeta W. White and John R. Olson Operations and Supply Chain Management, University of St. Thomas, 2115 Summit Ave, St. Paul, MN 55105, USA E-mail: [email protected] E-mail: [email protected]
Abstract: Our study describes how one business school department used the analytic hierarchy process (AHP) to identify and rank factors most influencing students’ choice of business school concentrations. Using a series of pairwise comparison matrices as the survey instrument, we identified characteristics associated with a student’s personal abilities and goals as the most important factor influencing a student’s choice in majors. The factors were then mapped with student touch points (e.g., campus events, information sessions, etc.) in an effort to directly influence those factors most affecting students’ decision making and increase departmental enrolment numbers. The result was a near 120% increase in operations management enrolment upon the completion of the project.
Keywords: college majors; student enrolment; analytic hierarchy process; AHP; business school; operations management.
Reference to this paper should be made as follows: Jones, J.S., White, S.W. and Olson, J.R. (2013) ‘University of St. Thomas uses AHP to grow operations management major’, Int. J. Information and Operations Management Education, Vol. 5, No. 2, pp.130–153.
Biographical notes: Janine Sanders Jones is an Assistant Professor in the Operations and Supply Chain Management Department at the University of St. Thomas. She received her PhD in Business Administration with a concentration in Operations Management from the University of Minnesota. She worked as an Industrial Engineer and Process Engineer for Merck & Co. before joining academia. Currently, her research interests include quality management, process management and organisation culture. Her work has been published in Decision Sciences Journal. She is a member of the Academy of Management Operations Management Division and Decision Sciences Institute.
University of St. Thomas uses AHP to grow operations management major 131
Sheneeta W. White is an Assistant Professor in the Operations and Supply Chain Management Department at the University of St. Thomas. She received her PhD in Management Science from Virginia Tech, her MBA degree from North Carolina State University, and her BS degree from Xavier University of Louisiana. Her research interests include planning and control of manufacturing and service operations, service supply chain management, and sustainability. She has published her work in the European Journal of Operational Research and the International Journal of Production Economics. Prior to pursuing her academic career, she enjoyed a seven-year career with IBM Global Services in Raleigh, NC.
John R. Olson is currently the Chairperson of the Operations and Supply Chain Management Department at the University of St. Thomas. He received his PhD degree from the University of Nebraska in the area of Operations Management. He has published numerous articles and books in the area of supply chain management, quality management and healthcare efficiency. In addition to his academic experience, he has over 20 years of experience in quality management and has worked with several Fortune 500 firms and hospitals in the implementation of their quality programmes and strategic planning.
1 Introduction
Many organisations face situations where capacity far exceeds demand. Subsequently, an organisation is often challenged to find ways to increase demand or face the difficult choice of cutting workforce capacity. Business schools are no exception to this situation. Due to the recent economic downturn, many business schools are experiencing declining enrolments (Graduate Management Admissions Council, 2011). Student enrolments have a direct effect on the number of sections of core and elective course offerings and thus, the number of faculty needed to instruct those courses.
Recently, the Operations and Supply Chain Management Department (OSCM) in the Opus College of Business at the University of St. Thomas experienced faculty capacity well above demand. Accreditation requirements led us to increase course offerings and hire a number of full-time tenure/tenure track faculty members, while simultaneous unexpected economic factors led to a decrease in student enrolment. These factors initiated an immediate concern about our current and future capacity situation. Because the new hires were fixed allocations, our ability to adjust our capacity to the needs of the marketplace decreased substantially. With declining enrolments and fixed capacity, the problem on the horizon for the OSCM department was too many faculty members for the number of courses offered. Growing our enrolment for the OSCM concentration, therefore increasing demand for our courses, quickly became a department goal.
In order to increase our enrolment, we needed to gain a better understanding of our students and how they selected a concentration. Using a survey tool, we employed analytic hierarchy process (AHP) methodology to identify the key factors that impact students’ choice of degree concentration. We then linked these factors to existing organisational processes that would provide opportunity for our faculty and additional resources to interact with students, consequently influencing those factors affecting their decision making process.
132 J.S. Jones et al.
The objective of our study was to increase enrolment in the undergraduate operations management concentration. In this paper, we describe how we used operations research and process management techniques to achieve this goal. In Section 2, we detail the situation the department faced in 2009–2010. We highlight the literature that we used to identify potential factors influencing student selection of college majors and describe our use of the AHP methodology in Section 3. We then explain our results and how we map the AHP priorities to processes or student touch points in Section 4. In Section 5, we summarise our future outlook and activities and the implications of this study.
2 Departmental capacity challenges
2.1 Faculty hiring
The University of St. Thomas is the largest private university in Minnesota and has an undergraduate enrolment of approximately 6,000 students and a graduate enrolment close to 4,500 students. It is comprised of seven schools and colleges with more than 90 majors offered. Even though a business programme was offered since the early decades of the university, the college of business was not formally created until 2001. It now accounts for approximately 28% of all degrees granted at the institution. The Opus College of Business undergraduate programme offers 13 business concentrations as a major area of study: accounting, business communication, entrepreneurship, family business, financial management, general business, management, human resources, international business, leadership, legal studies, marketing, and operations management. There are seven academic departments in the college including OSCM.
The college of business received the Association to Advance Collegiate Schools of Business (AACSB) accreditation in December 2010. Years prior to receiving accreditation, the OSCM department began recruiting faculty to meet AACSB hiring standards. In a time span of four years, the OSCM department hired seven new faculty members to teach the required core courses of operations management and statistics at both the undergraduate and graduate levels, in addition to teaching the elective courses in operations management. The new faculty members were on a three course per semester teaching load. The addition of faculty helped to meet the academically qualified (AQ) standard set by AACSB and increased the department’s ability to teach a wide variety of courses using faculty from PhD granting institutions. Even though the number of full-time faculty increased, the teaching capacity of the department did not increase over this time. The full-time faculty members were hired to teach courses that had been taught by adjunct faculty. In essence, non-contractual, temporary instructors were replaced with fulltime faculty lines and capacity was at a fixed level.
2.2 Enrolment challenges
In addition to the internal factors that impacted our faculty capacity level, a number of external factors led to a decrease in student enrolment and thus a decrease in demand for our course offerings. At the same time of our hiring increase, the recession that started in 2007–2008 began to take grip on the nation’s economy. As the recession hampered the economy, our university began to experience decreases in enrolment in the college of business. Undergraduate students were opting for less expensive options such as

University of St. Thomas uses AHP to grow operations management major 133
community colleges or public universities. Consistent with many MBA programmes (Graduate Management Admissions Council, 2011) we had a fairly substantial decrease in enrolment at the graduate level. This decrease in graduate enrolment was due to a decrease in discretionary income of families coupled with companies reducing or eliminating tuition reimbursement for college courses. The decline in enrolment significantly reduced the number of sections of required and elective courses taught in the graduate programmes.
In addition, in the undergraduate program, our college implemented a new curriculum to better suit the needs of our students and to become comparable with course offerings from other accredited institutions. However, in estimating how many students would attend each of the undergraduate classes in the new curriculum, our forecasting model did not accurately account for the economic downturn. Although the number of operations management majors had slightly increased from 45 students to 54 students from 2008–2010, enrolment for the entire college was on the decline by 23% during the same period as illustrated in Figure 1. Again, these factors reduced the number of sections of the core operations management course required for all business majors.
Figure 1 Student enrolment in the Opus College of Business from 2005–2010
2.3 Strategic approach
The combination of changes due to accreditation and the decrease in enrolment due to economic factors created a surplus of capacity in the college and in particular for the OSCM Department. The excess capacity on the schedule was the equivalent of two full-time faculty members (six courses per semester).
Our operations management department faced a dilemma regarding best use of the newly hired full-time faculty. The options available included:
1 downsize the department
2 use faculty to teach courses in other departments that were similar to offerings in our department (like engineering management)
3 increase the enrolment of our major.
As a department, we made the decision to develop an aggressive strategy to increase the number of students who declared operations management as their major in the
134 J.S. Jones et al.
undergraduate program. We specifically focused on the undergraduate program, which presented the best chance to expand our enrolment because of the large number of undecided and non-business major students. It would have been more difficult for us to address enrolment issues at the graduate level since a majority of our graduate students receive tuition reimbursement, and companies that employed our graduate students were reducing or eliminating tuition benefits. Our presumption was that an increase in student enrolment in the operations management concentration would lead to an increase in class offerings and reduce our extra faculty capacity.
Prior to choosing a major, our undergraduate students are provided information about potential majors and careers. They receive information at freshman student orientation, sophomore information sessions, and the university open houses prior to major declaration day. Students typically declare majors at the start of their junior year; however, many students do not declare until mid-way through their junior year and some not until their senior year. With ample opportunity to provide undergraduates with information about our major, the number of students that declared operations management was still quite low. As the department began to examine how to increase the number of students who declared the operations major, it became very clear that we did not understand the most important factors influencing students’ decisions to choose a particular major, nor did we have an effective process to provide students with information about the discipline during this decision-making process.
Using existing literature on this topic area and our own knowledge of operations research techniques, we sought to study our students and their attraction to particular business concentrations and use this information to guide our departmental activities toward critical student touch-points in an effort to build our major. Our goal was to build a process that would best utilise resources to educate students about the operations management major. We identified and examined the factors influencing undergraduate choice in business school concentrations and used pairwise comparison matrices to prioritise and rank those factors. We then took the priorities and mapped them to specific student touch-points that expose the students and their families to the college and department.
3 Methodology
3.1 Ranking student preferences
Attracting new students starts with an understanding of the determinants of their choice in business concentration. Our first objective was to understand and prioritise factors influencing student choice in business school majors. This decision problem is influenced by personal preferences and judgments of individual students, which can be difficult to capture and analyse. Also, we were faced with the need to synthesise these individual preferences into a group consensus. Therefore, we used the AHP to compare, synthesise, and rank student preferences.
AHP is a tool, developed by Thomas Saaty, used in decision making. AHP can be applied to numerous decision-based situations, one of which is ranking. We were able to use this tool for ranking factors influencing students’ choice in majors. For purposes of this paper, we will not describe the mathematics underlying AHP; however, we will
University of St. Thomas uses AHP to grow operations management major 135
describe our application of the powerful tool. AHP consists of six steps outlined in Saaty (1994):
1 construct a hierarchy of the relationships of the problem’s key elements
2 elicit judgments based on pairwise comparisons
3 evaluate those responses and assign a numerical representation for each
4 use the numbers obtained to calculate ranking
5 synthesise these rankings
6 decide among decision alternatives.
We performed five out of the six steps for the purposes of this study. We did not perform the last step of deciding among alternatives because we were using AHP for the purpose of factor ranking. We will now describe each of the five steps conducted for this study.
3.2 Constructing the hierarchy
We developed the hierarchy based on information from a small survey performed by a business school advisor and previous literature on how students choose majors (Montmarquette et al., 2002; Malgwi et al., 2005; Kuechler et al., 2009; Zhang, 2007; Lee and Lee, 2006). Several studies have focused on students’ choice in a specific major. Kuechler et al. (2009) and Lee and Lee (2006) investigate why there is a decrease in students choosing information systems (IS) as a college major. Kuechler et al. (2009) conclude that the enrolment decreases are due to the amount of work required to obtain an IS degree and the training that must continue beyond the degree. Another study by Adams et al. (1994) examines ways to retain high-aptitude students in the accounting field. These studies served as an important resource for us.
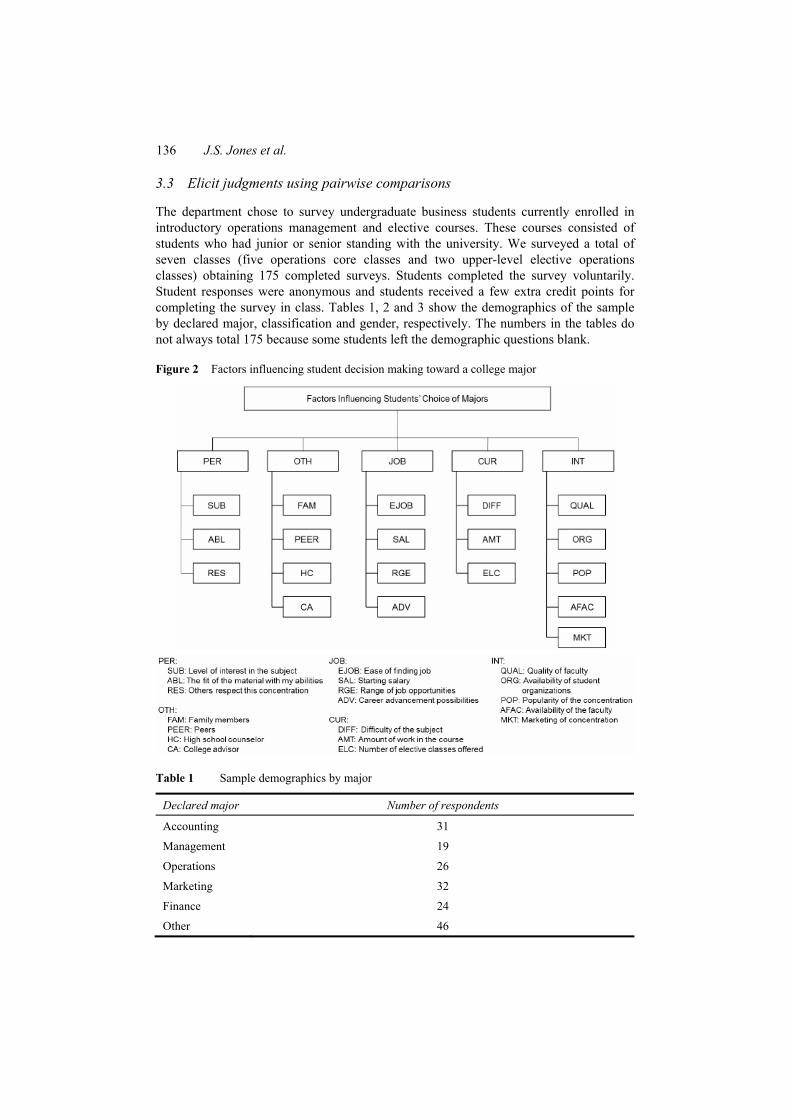
After reviewing the literature, we discovered five common internal and external factors that influence the decision-making process for selecting a major. We classified student influences into five top-level criteria: personal interests, image, and aptitude (PER), influence of others (OTH), job market characteristics (JOB), curriculum characteristics (CUR), and institutional characteristics (INT). Each of these top-level criteria was then further decomposed into more specific influences. According to Lee and Lee (2006) and Keuchler et al. (2009), a student’s aptitude and interest are personal characteristics that can influence a student’s choice of major. It is also evident from the literature that subjective norms formed through the connection with family, peers, and advisors can also have some bearing on a student’s decision (Zhang, 2007; Keucheler et al., 2009). Several external environmental level factors may also have an effect on choice of major. From a market perspective, job availability, salary, and career opportunities can impact the decision-making process (Kuechler et al., 2009; Zhang, 2007; Lee and Lee, 2006). We must also consider institutional level factors and curriculum level factors within the institution. For example, perception of difficulty of major classes has been linked to attitudes toward a major (Zhang, 2007; Keucheler et al., 2009). Additionally, quality and availability of faculty, marketing for the major, and student organisations are possible influencers. The full list of sub-criteria for each top-level criterion is detailed in Figure 2. We had a maximum of five elements, at any level, for the basis of comparison. This number is well within the limits outlined by Saaty (1980).
136 J.S. Jones et al.
3.3 Elicit judgments using pairwise comparisons
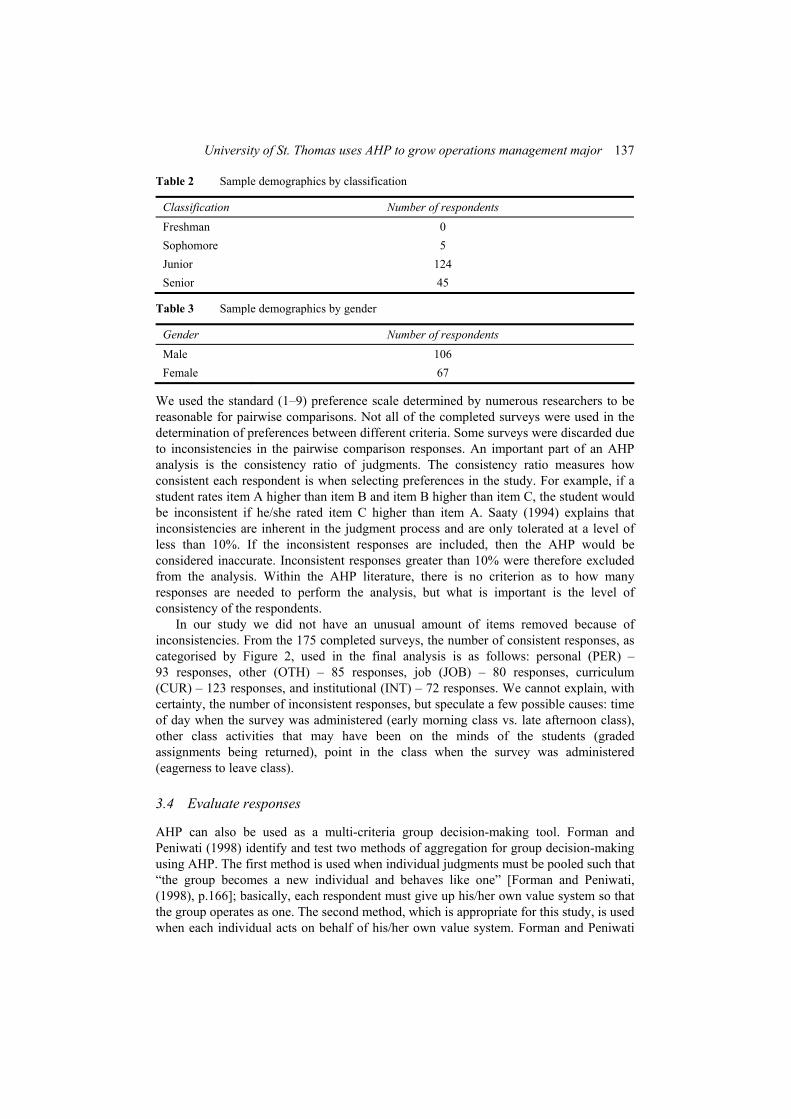
The department chose to survey undergraduate business students currently enrolled in introductory operations management and elective courses. These courses consisted of students who had junior or senior standing with the university. We surveyed a total of seven classes (five operations core classes and two upper-level elective operations classes) obtaining 175 completed surveys. Students completed the survey voluntarily. Student responses were anonymous and students received a few extra credit points for completing the survey in class. Tables 1, 2 and 3 show the demographics of the sample by declared major, classification and gender, respectively. The numbers in the tables do not always total 175 because some students left the demographic questions blank.
Figure 2 Factors influencing student decision making toward a college major
Table 1 Sample demographics by major
Declared major Number of respondents
Accounting 31
Management 19
Operations 26
Marketing 32
Finance 24
Other 46
University of St. Thomas uses AHP to grow operations management major 137
Table 2 Sample demographics by classification
Classification Number of respondents
Freshman 0 Sophomore 5 Junior 124 Senior 45
Table 3 Sample demographics by gender
Gender Number of respondents
Male 106 Female 67
We used the standard (1–9) preference scale determined by numerous researchers to be reasonable for pairwise comparisons. Not all of the completed surveys were used in the determination of preferences between different criteria. Some surveys were discarded due to inconsistencies in the pairwise comparison responses. An important part of an AHP analysis is the consistency ratio of judgments. The consistency ratio measures how consistent each respondent is when selecting preferences in the study. For example, if a student rates item A higher than item B and item B higher than item C, the student would be inconsistent if he/she rated item C higher than item A. Saaty (1994) explains that inconsistencies are inherent in the judgment process and are only tolerated at a level of less than 10%. If the inconsistent responses are included, then the AHP would be considered inaccurate. Inconsistent responses greater than 10% were therefore excluded from the analysis. Within the AHP literature, there is no criterion as to how many responses are needed to perform the analysis, but what is important is the level of consistency of the respondents.
In our study we did not have an unusual amount of items removed because of inconsistencies. From the 175 completed surveys, the number of consistent responses, as categorised by Figure 2, used in the final analysis is as follows: personal (PER) – 93 responses, other (OTH) – 85 responses, job (JOB) – 80 responses, curriculum (CUR) – 123 responses, and institutional (INT) – 72 responses. We cannot explain, with certainty, the number of inconsistent responses, but speculate a few possible causes: time of day when the survey was administered (early morning class vs. late afternoon class), other class activities that may have been on the minds of the students (graded assignments being returned), point in the class when the survey was administered (eagerness to leave class).
3.4 Evaluate responses
AHP can also be used as a multi-criteria group decision-making tool. Forman and Peniwati (1998) identify and test two methods of aggregation for group decision-making using AHP. The first method is used when individual judgments must be pooled such that “the group becomes a new individual and behaves like one” [Forman and Peniwati, (1998), p.166]; basically, each respondent must give up his/her own value system so that the group operates as one. The second method, which is appropriate for this study, is used when each individual acts on behalf of his/her own value system. Forman and Peniwati

138 J.S. Jones et al.
(1998) prove that either the geometric or arithmetic mean can be used to combine individual final priorities. According to James and James (1992, p.267) the arithmetic mean, or average, “is a single number representing a set of numbers, usually not less than the least nor greater than the greatest”. “The geometric mean of n positive numbers is the positive nth root of their product” [James and James, (1992), p.267]. In this study, each subject had his/her own value system; therefore, we aggregated individual final priorities using the geometric mean and the arithmetic mean. We assume that each subject is of equal importance; therefore, no weighting scheme was used. Table 4 This table shows the aggregated relative priority weights of each criterion in the
hierarchy
Geometric mean Arithmetic mean Top-level criterion PER 0.28 0.30 OTH 0.07 0.09 JOB 0.17 0.19 CUR 0.11 0.13 INT 0.12 0.14 First sub matrix: personal interests, image, and aptitude SUB 0.28 0.32 ABL 0.26 0.29 RES 0.11 0.15 Second sub matrix: influence of others FAM 0.27 0.31 PEER 0.12 0.14 HC 0.06 0.08 CA 0.23 0.28 Third sub matrix: job market characteristics EJOB 0.10 0.13 SAL 0.14 0.17 RGE 0.18 0.22 ADV 0.27 0.30 Fourth sub matrix: curriculum characteristics DIFF 0.24 0.26 AMT 0.23 0.26 ELC 0.19 0.24 Fifth sub matrix: institutional characteristics QUAL 0.29 0.32 ORG 0.08 0.10 POP 0.07 0.09 AFAC 0.19 0.22 MKT 0.09 0.11
Note: All calculations were performed via an Excel 2007 spreadsheet (see Appendix B) and confirmed with the Expert Choice 11.5 software package (Expert Choice User’s Guide, 2009).

University of St. Thomas uses AHP to grow operations management major 139
3.5 Calculate and synthesise ranking
The aggregated group priority vectors outlined in Table 4 present the geometric and arithmetic means in parentheses after each variable. Students clearly value their own personal characteristics above all other top-level criteria while the influence of others has less effect on students’ choice of major. Notice in the results both the geometric mean of 0.28 and arithmetic mean of 0.30 for personal characteristics are substantially larger than the next highest score related to job characteristics. This shows that personal characteristics clearly dominate when students are deciding which major to choose.
The results of the first sub-matrix show that students place a great deal of weight on their interest in the subject and the fit of the subject material with their abilities. geometric and arithmetic mean scores for both subject matter (0.28 and 0.32) and ability (0.26 and 0.29) were more than double the mean scores for the respect variable.
The second sub-matrix sought to determine the degree of influence of others on students’ choice of majors. Our survey found that family members (0.27 and 0.31) most influence their decision with college advisors (0.23 and 0.28) finishing a close second on the geometric and arithmetic means while high school counsellors had very little influence. The third sub-matrix focused on the influence of job characteristics, and students seem to make choices of majors based on the career advancement possibilities (0.27 and 0.30). In the fourth sub-matrix, we found that students choose majors based on the perceived difficulty of the subject (0.24 and 0.26) and perceived amount of work (0.23 and 0.26) in the course. Results from the fifth sub-matrix show that the quality of the faculty (0.29 and 0.32) most influences student decision making when choosing business school majors.
4 Practical application
The goal of this study was to understand which factors most influence students’ decision to choose a major. The result of our AHP study finds that factors affecting students’ choice in major should be ranked as follows:
1 personal characteristics
2 influence of others
3 job characteristics
4 curriculum
5 institutional characteristics.
We now offer a discussion on how we aligned the findings of this study to student touch points. This information is useful to any educational department trying to improve enrolment.
As a department, we mapped those factors found to be most influential with students choosing their major from the AHP priorities to the processes/student touch points currently in place at the university, college, or departmental level. The priority-to-process map structure can be found in Figure 3.

140 J.S. Jones et al.
4.1 Personal characteristics (PER)
Previous literature has shown that a student’s interest and ability are important factors in selecting a major (Hansen and Neuman, 1999; Kim et al., 2002; Zhang, 2007). It is no surprise that these two sub-level criteria were found to be important in our study. We have spent much effort developing interest in our major through marketing campaigns such as new brochures and departmental webpages that discuss in detail the skills required and the nature of the job rather than only stressing job statistics. In addition, we redesigned the core introduction to operations management class. We made the class highly interactive by including more hands-on activities and by using real-life case studies to pique interest. This course provides valuable material and is a useful information tool that appeals to the interests and abilities of the students.
Figure 3 Possible key business processes/student touch points that could impact student enrolment in a major
4.2 Influence of others (OTH)
Although at the top level influence of others has less impact than other factors, within this level, family and advisors are the most influential people in helping a student make a decision about which major to select. This is expected as students often take into account the information and advice of people that play an important role in the student’s life (Kuechler et al., 2009). We chose several sub-processes to focus on that involves family members and program advisors. One initiative is to ensure that we have department representatives at university and college level events where parents are in attendance. For example, the university hosts freshman orientation during the summer before a student’s
University of St. Thomas uses AHP to grow operations management major 141
freshman year. At this event, each college or school hosts a table to discuss potential majors. We have increased our presence at this event by having one or two faculty members in attendance to discuss our major with potential students and parents. Program advisers are also attending these events, so we provided more detailed information about our major for them to share as well. We have also increased our participation with the university phone-a-thon. Faculty members participate in calling potential students and their families who have expressed interest or applied to UST. This provides an opportunity to provide more information about the university, the college, and the operations management department. In addition, we have increased our involvement at college level information days and other events.
4.3 Job market characteristics (JOB)
Many students begin to think about career advancement opportunities very early in their academic lives. Other researchers have confirmed such findings (Malgwi et al., 2005; Lee and Lee, 2006). Since this is an important component to selecting a major, we realise that it is vital that we provide career information to students as early as possible. We were eager to share evidence that suggests a very high percentage of CEOs originate from the operations management concentration (Pride et al., 2010). Sharing career advancement opportunity information with students not only satisfied the AHP result that students want opportunity to advance their careers, but it also satisfied the result of improving the attractiveness of the subject matter.
We compiled statistics on placement of previous students and are sharing that information with our students. We will continue to collect this information to include in marketing materials and also to share with potential students. Most of the job opportunities for our majors come through faculty contacts and career services. We have a process in place to distribute this information to other faculty members to get the information to students in our Supply Chain and Operations Management (SCOM) club, students in our classes, and our advisees. We are bringing more professionals and recent graduates into the SCOM club and our classes to discuss their background and career path.
4.4 Curriculum characteristics (CUR)
Difficulty of classes and the amount of work were found to impact a student’s choice of major. This is expected as students sometimes shy away from courses that they believe are difficult (Zhang, 2007; Adams et al., 1994). Our classes are often more quantitative than others; thus students think our courses are more difficult by default than some of the other majors. Since we did not want to water down courses to make them appealing, our decision was to develop consistency and clarity around the core introductory course. Research demonstrates that setting clear expectations and providing a highly organised course structure will create a favourable impression to students (Feldman, 1988). In addition, research suggests that students will not only learn more, but become more engaged in classes when higher levels of learning are obtained (Brightman, 1987). By challenging students in a way that appeals to their personal interests, we will enhance the attractiveness of our major. To build infrastructure around this concept, we created two departmental committees to work toward standardising our core courses in operations management around the factors discovered in this study.
142 J.S. Jones et al.
4.5 Institutional characteristics (INT)
The quality and availability of department faculty influence a student’s decision to major in a specific business concentration. The quality of the faculty begins with the recruitment and selection process. We focused on hiring faculty who possess a passion for teaching operations courses and an interesting research stream that is relevant to business.
Also important to students is the ability to connect with faculty and having access to faculty. Recently, the college instituted a student access policy for faculty that strives to increase the availability of faculty.
At our university the faculty has several opportunities to interact with students early in the process of choosing their major. First, as previously mentioned, faculty phone-a-thons are an opportunity for students and parents to interact with faculty very early in the decision-making process. Second, all faculty are assigned students as advisees. Our department is currently developing the process for advising to better inform students of our major and to better prepare students to enter the workforce.
In addition, our department has committed not only to being available for our students and advisees, but also to being more focused on creating special events for our students. For example, many of our faculty have significant ties to the business community and have established and led student Kaizen groups at local companies. This has proven to be a very valuable activity in growing our major as students are now helping recruit other students. As the AHP results indicated earlier, this is a critical element to helping attract potential students to any major.
5 Discussion and conclusions
The purpose of this study was to identify key factors that influence our students’ decision-making process towards choosing a business concentration and to link those factors to specific student touch points in order to increase the number of students enrolled in operations management. We surveyed undergraduate business students and, using the AHP, we prioritised the factors most influencing their choice in majors. We found that students value their own personal interests, image, and aptitude; their interest in the subject and the fit of the subject material with their abilities; their family members’ opinions,; the possibility for career advancement; the perceived difficulty of the subject and the perceived amount of work in the course; and the quality of the faculty.
Currently, our enrolment numbers indicate a positive growth in the number of students declaring operations management as their primary major. At the start of this study, the number of students declaring an operations management major was 49 students. By the start of Fall 2012, the number of students declaring operations management as a major was 107 students, an increase of almost 120%. At this time, the amount of students registered for all of our major courses is now over capacity. We are, as of Fall 2013, also predicting a need to double the number of sections offered in our upper level and elective courses. We cannot empirically link our efforts to the increase in enrolment. However, we do believe the outcomes, which were driven by the results of the AHP study, demonstrate some evidence of a relationship between our actions and increased student enrolment. A future study will help us to uncover more information in
University of St. Thomas uses AHP to grow operations management major 143
regard to the direct linkage between our activities and enrolment in the operations management concentration.
After completing this study, we reported the results to our current operations management students, and the response was overwhelming excitement about the study. A surprising outcome of this study is a newly formed student-led operations management recruiting team. The students brainstormed a number of ideas for increasing students concentrating in operations management, and currently a student team is working on these ideas.
This study has major implications for practice. To have an effective recruiting strategy, school administrators must find ways to map the factors that students find important in their selection of a major to the processes and events at the university, college, and departmental levels. It is not enough merely to know what influences students’ decision making. One must also identify the student touch points that are related to the decision-making factors. This will allow the appropriate recruitment strategies to be derived.
From an academic perspective, there is still much to learn on this topic, and the research opportunities are vast. In the future, we would like to expand this study to capture decision making information from students at the start of their college education as additional factors may surface as important to the selection process. We would also like to expand the study to include our graduate MBA students. It would be interesting to develop a resource/faculty allocation model to determine whether placing more ‘popular’ faculty at certain events would increase enrolment by greater numbers. In the future, we could also study the impact of family occupations and family legacy on student enrolment in business majors.
We believe that the challenges that we faced are not unique to UST, the Opus College of Business, or the OSCM department. Our intention for this study was not only to increase our enrolment, but also to provide insight on one approach to organisational growth. Using operations research and process management tools, we gained a better understanding of our student population. As a result, we are on a trajectory to accomplish our department goal.
References Adams, S.J., Pryor, L.J. and Adams, S.L. (1994) ‘Attraction and retention of high-aptitude students
in accounting: an exploratory longitudinal study’, Issues in Accounting Education, Vol. 9, No. 1, pp.45–58.
Brightman, H. (1987) ‘Towards teaching excellence in decision sciences’, Decision Sciences, Vol. 18, No. 4, pp.646–661.
Expert Choice User’s Guide (2009) Version 11.5, Arlington, VA. Feldman, K. (1988) ‘Effective college teaching from the students’ and faculty’s view: matched or
mismatched priorities?’, Research in Higher Education, Vol. 28, No. 4, pp.291–336. Forman, E. and Peniwati, K. (1998) ‘Aggregating individual judgment and priorities with the
analytic hierarchy process’, European Journal of Operational Research, Vol. 108, No. 1, pp.165–169.
Graduate Management Admissions Council (2011) 2011 Application Trends Survey, Reston, VA [online] http://www.gmac.com/~/media/Files/gmac/Research/admissions-and-application-trends/applicationtrends2011_sr.pdf (accessed 2 January 2013).
144 J.S. Jones et al.
Hansen, J.C. and Neuman, J.L. (1999) ‘Evidence of concurrent prediction of the Campbell interest and skill survey (CISS) for college major selection’, Journal of Career Assessment, Vol. 7, No. 3, pp.239–247.
James, R.C. and James, G. (1992) Mathematics Dictionary, 5th ed., Chapman and Hall Publishers, New York, NY.
Kim, D., Markham, F.S. and Cangelosi, J.D. (2002) ‘Why students pursue the business degree: a comparison of business majors across universities’, Journal of Education for Business, Vol. 78, No. 1, pp.28–32.
Kuechler, W.L., McLeod, A. and Simkin, M.G. (2009) ‘Why don’t more students major in IS?’, Decision Sciences Journal of Innovative Education, Vol. 7, No. 2, pp.463–488.
Lee, Y. and Lee, S.J. (2006) ‘The competitiveness of the information systems major: an analytical hierarchy process’, Journal of Information Systems Education, Vol. 17, No. 2, pp.277–291.
Malgwi, C.A., Howe, M.A. and Burnaby, P.A. (2005) ‘Influence of students’ choice of college major’, Journal of Education for Business, Vol. 80, No. 5, pp.275–282.
Montmarquette, C., Cannings, K. and Mahseredjian, S. (2002) ‘How do young people choose college majors?’, Economics of Education Review, Vol. 21, No. 5, pp.543–556.
Pride, W., Hughes, R. and Kapor, J. (2010) Business, 10th ed., Southwestern Cengage Learning, Mason, OH.
Saaty, T.L. (1980) The Analytic Hierarchy Process, McGraw-Hill, New York. Saaty, T.L. (1994) ‘How to make a decision: the analytic hierarchy process’, Interfaces, Vol. 24,
No. 6, pp.19–43. Zhang, W. (2007) ‘Why IS: understanding undergraduate students’ intentions to choose an
information systems major’, Journal of Information Systems Education, Vol. 18, No. 4, pp.447–458.
Appendix A
Survey
Survey on choosing a concentration
Administrators of the Opus College of Business – University of St. Thomas are currently conducting a research study on how college students select their major field of study. The better we understand how you select a concentration, the better we will be able to serve our students. Survey participation is optional and there is no penalty for refusing to participate. However, you may receive participation points for completing the survey which will be determined by the course instructor. All respondents will remain anonymous and results will be used for departmental and research purposes only. Your consent to participate in this study is implied when you complete and return this survey.
University of St. Thomas uses AHP to grow operations management major 145
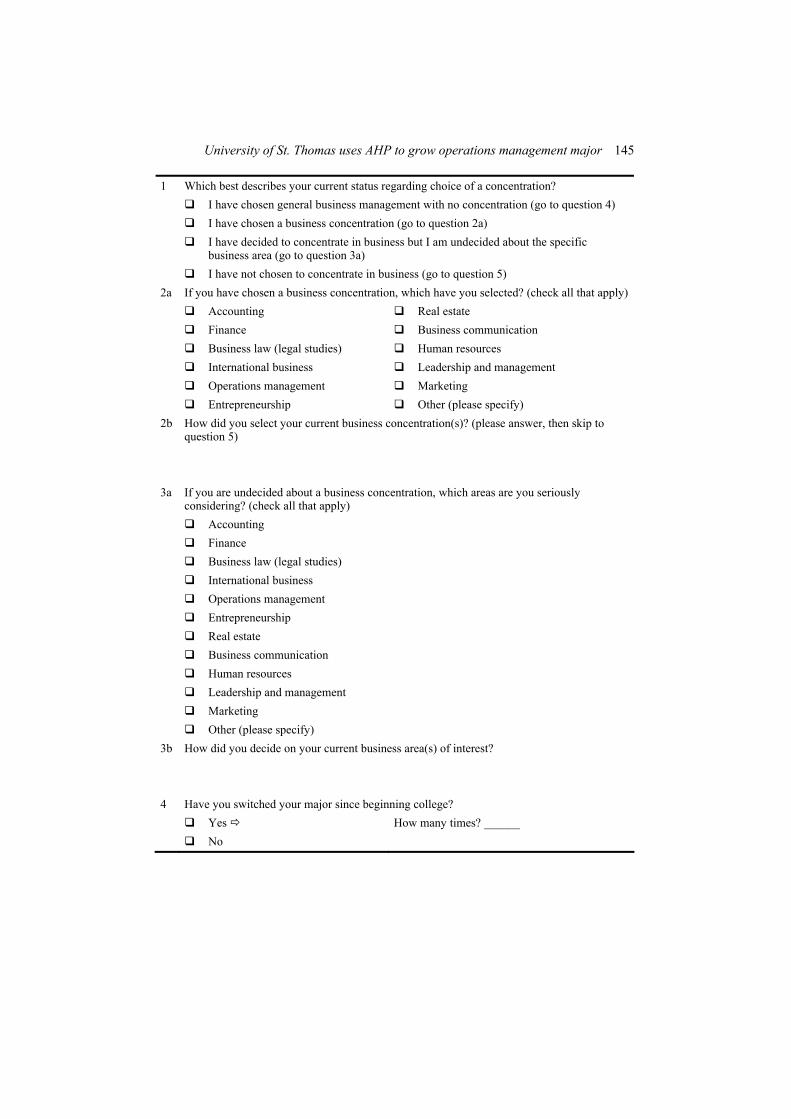
1 Which best describes your current status regarding choice of a concentration? I have chosen general business management with no concentration (go to question 4) I have chosen a business concentration (go to question 2a) I have decided to concentrate in business but I am undecided about the specific
business area (go to question 3a) I have not chosen to concentrate in business (go to question 5) 2a If you have chosen a business concentration, which have you selected? (check all that apply) Accounting Real estate Finance Business communication Business law (legal studies) Human resources International business Leadership and management Operations management Marketing Entrepreneurship Other (please specify) 2b How did you select your current business concentration(s)? (please answer, then skip to
question 5) 3a If you are undecided about a business concentration, which areas are you seriously
considering? (check all that apply) Accounting Finance Business law (legal studies) International business Operations management Entrepreneurship Real estate Business communication Human resources Leadership and management Marketing Other (please specify) 3b How did you decide on your current business area(s) of interest? 4 Have you switched your major since beginning college? Yes How many times? ______ No
146 J.S. Jones et al.
Choosing a major
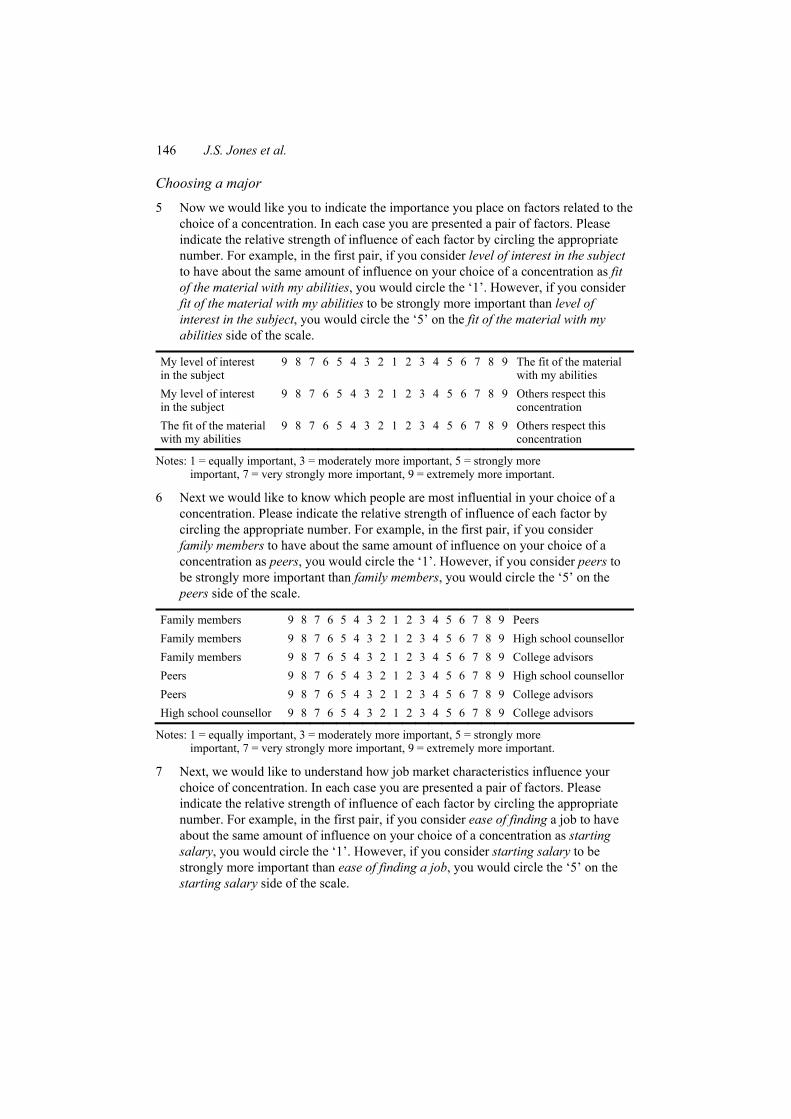
5 Now we would like you to indicate the importance you place on factors related to the choice of a concentration. In each case you are presented a pair of factors. Please indicate the relative strength of influence of each factor by circling the appropriate number. For example, in the first pair, if you consider level of interest in the subject to have about the same amount of influence on your choice of a concentration as fit of the material with my abilities, you would circle the ‘1’. However, if you consider fit of the material with my abilities to be strongly more important than level of interest in the subject, you would circle the ‘5’ on the fit of the material with my abilities side of the scale.
My level of interest in the subject
9 8 7 6 5 4 3 2 1 2 3 4 5 6 7 8 9 The fit of the material with my abilities
My level of interest in the subject
9 8 7 6 5 4 3 2 1 2 3 4 5 6 7 8 9 Others respect this concentration
The fit of the material with my abilities
9 8 7 6 5 4 3 2 1 2 3 4 5 6 7 8 9 Others respect this concentration
Notes: 1 = equally important, 3 = moderately more important, 5 = strongly more important, 7 = very strongly more important, 9 = extremely more important.
6 Next we would like to know which people are most influential in your choice of a concentration. Please indicate the relative strength of influence of each factor by circling the appropriate number. For example, in the first pair, if you consider family members to have about the same amount of influence on your choice of a concentration as peers, you would circle the ‘1’. However, if you consider peers to be strongly more important than family members, you would circle the ‘5’ on the peers side of the scale.
Family members 9 8 7 6 5 4 3 2 1 2 3 4 5 6 7 8 9 Peers Family members 9 8 7 6 5 4 3 2 1 2 3 4 5 6 7 8 9 High school counsellor Family members 9 8 7 6 5 4 3 2 1 2 3 4 5 6 7 8 9 College advisors Peers 9 8 7 6 5 4 3 2 1 2 3 4 5 6 7 8 9 High school counsellor Peers 9 8 7 6 5 4 3 2 1 2 3 4 5 6 7 8 9 College advisors High school counsellor 9 8 7 6 5 4 3 2 1 2 3 4 5 6 7 8 9 College advisors
Notes: 1 = equally important, 3 = moderately more important, 5 = strongly more important, 7 = very strongly more important, 9 = extremely more important.
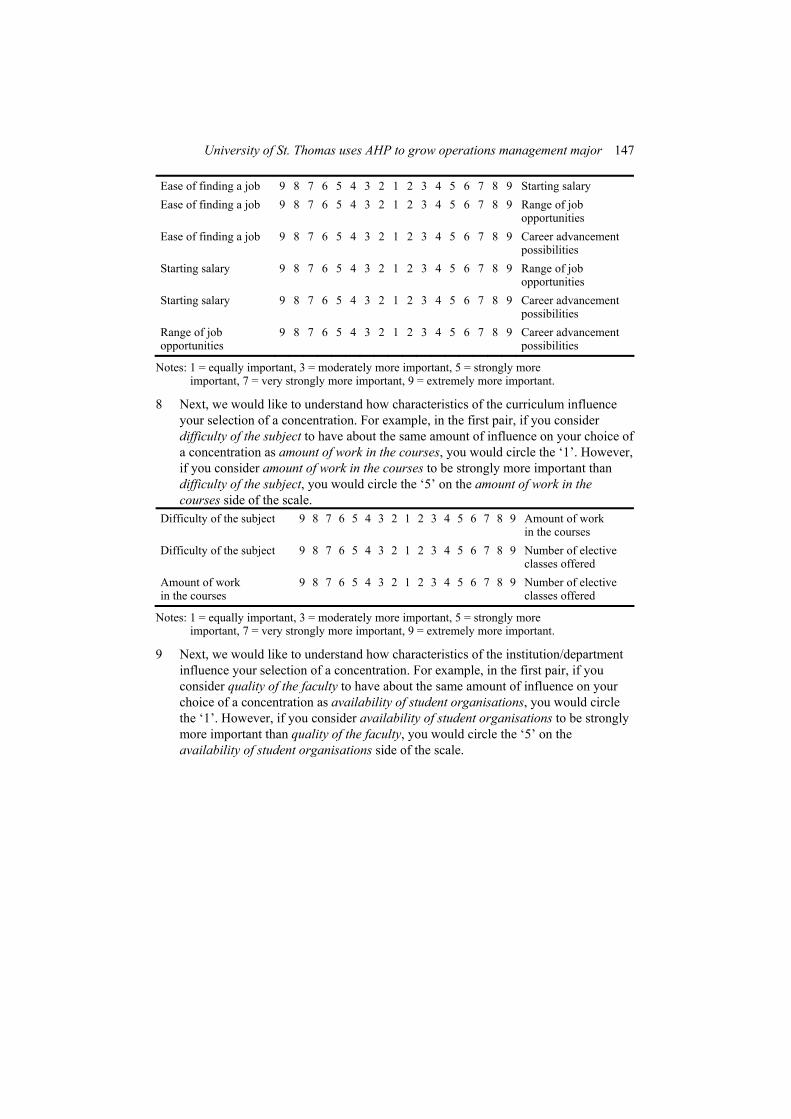
7 Next, we would like to understand how job market characteristics influence your choice of concentration. In each case you are presented a pair of factors. Please indicate the relative strength of influence of each factor by circling the appropriate number. For example, in the first pair, if you consider ease of finding a job to have about the same amount of influence on your choice of a concentration as starting salary, you would circle the ‘1’. However, if you consider starting salary to be strongly more important than ease of finding a job, you would circle the ‘5’ on the starting salary side of the scale.
University of St. Thomas uses AHP to grow operations management major 147
Ease of finding a job 9 8 7 6 5 4 3 2 1 2 3 4 5 6 7 8 9 Starting salary Ease of finding a job 9 8 7 6 5 4 3 2 1 2 3 4 5 6 7 8 9 Range of job
opportunities Ease of finding a job 9 8 7 6 5 4 3 2 1 2 3 4 5 6 7 8 9 Career advancement
possibilities Starting salary 9 8 7 6 5 4 3 2 1 2 3 4 5 6 7 8 9 Range of job
opportunities Starting salary 9 8 7 6 5 4 3 2 1 2 3 4 5 6 7 8 9 Career advancement
possibilities Range of job opportunities
9 8 7 6 5 4 3 2 1 2 3 4 5 6 7 8 9 Career advancement possibilities
Notes: 1 = equally important, 3 = moderately more important, 5 = strongly more important, 7 = very strongly more important, 9 = extremely more important.
8 Next, we would like to understand how characteristics of the curriculum influence your selection of a concentration. For example, in the first pair, if you consider difficulty of the subject to have about the same amount of influence on your choice of a concentration as amount of work in the courses, you would circle the ‘1’. However, if you consider amount of work in the courses to be strongly more important than difficulty of the subject, you would circle the ‘5’ on the amount of work in the courses side of the scale.
Difficulty of the subject 9 8 7 6 5 4 3 2 1 2 3 4 5 6 7 8 9 Amount of work in the courses
Difficulty of the subject 9 8 7 6 5 4 3 2 1 2 3 4 5 6 7 8 9 Number of elective classes offered
Amount of work in the courses
9 8 7 6 5 4 3 2 1 2 3 4 5 6 7 8 9 Number of elective classes offered
Notes: 1 = equally important, 3 = moderately more important, 5 = strongly more important, 7 = very strongly more important, 9 = extremely more important.
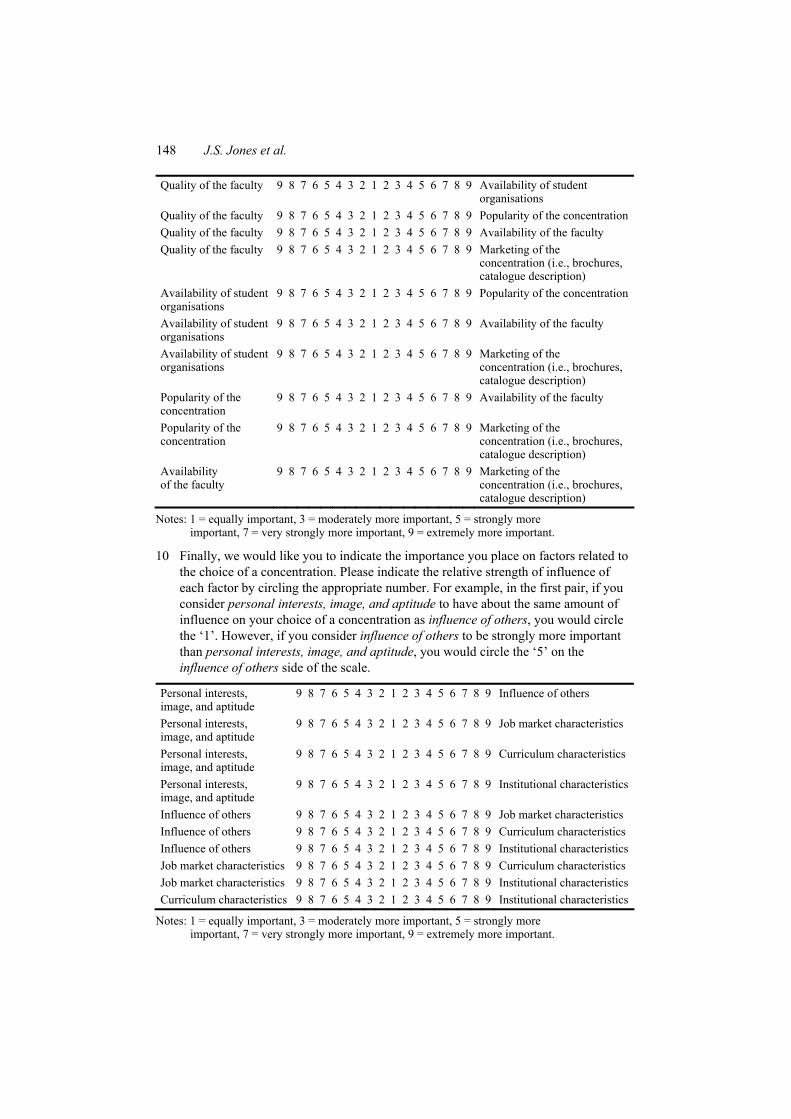
9 Next, we would like to understand how characteristics of the institution/department influence your selection of a concentration. For example, in the first pair, if you consider quality of the faculty to have about the same amount of influence on your choice of a concentration as availability of student organisations, you would circle the ‘1’. However, if you consider availability of student organisations to be strongly more important than quality of the faculty, you would circle the ‘5’ on the availability of student organisations side of the scale.
148 J.S. Jones et al.
Quality of the faculty 9 8 7 6 5 4 3 2 1 2 3 4 5 6 7 8 9 Availability of student organisations
Quality of the faculty 9 8 7 6 5 4 3 2 1 2 3 4 5 6 7 8 9 Popularity of the concentration Quality of the faculty 9 8 7 6 5 4 3 2 1 2 3 4 5 6 7 8 9 Availability of the faculty Quality of the faculty 9 8 7 6 5 4 3 2 1 2 3 4 5 6 7 8 9 Marketing of the
concentration (i.e., brochures, catalogue description)
Availability of student organisations
9 8 7 6 5 4 3 2 1 2 3 4 5 6 7 8 9 Popularity of the concentration
Availability of student organisations
9 8 7 6 5 4 3 2 1 2 3 4 5 6 7 8 9 Availability of the faculty
Availability of student organisations
9 8 7 6 5 4 3 2 1 2 3 4 5 6 7 8 9 Marketing of the concentration (i.e., brochures, catalogue description)
Popularity of the concentration
9 8 7 6 5 4 3 2 1 2 3 4 5 6 7 8 9 Availability of the faculty
Popularity of the concentration
9 8 7 6 5 4 3 2 1 2 3 4 5 6 7 8 9 Marketing of the concentration (i.e., brochures, catalogue description)
Availability of the faculty
9 8 7 6 5 4 3 2 1 2 3 4 5 6 7 8 9 Marketing of the concentration (i.e., brochures, catalogue description)
Notes: 1 = equally important, 3 = moderately more important, 5 = strongly more important, 7 = very strongly more important, 9 = extremely more important.
10 Finally, we would like you to indicate the importance you place on factors related to the choice of a concentration. Please indicate the relative strength of influence of each factor by circling the appropriate number. For example, in the first pair, if you consider personal interests, image, and aptitude to have about the same amount of influence on your choice of a concentration as influence of others, you would circle the ‘1’. However, if you consider influence of others to be strongly more important than personal interests, image, and aptitude, you would circle the ‘5’ on the influence of others side of the scale.
Personal interests, image, and aptitude
9 8 7 6 5 4 3 2 1 2 3 4 5 6 7 8 9 Influence of others
Personal interests, image, and aptitude
9 8 7 6 5 4 3 2 1 2 3 4 5 6 7 8 9 Job market characteristics
Personal interests, image, and aptitude
9 8 7 6 5 4 3 2 1 2 3 4 5 6 7 8 9 Curriculum characteristics
Personal interests, image, and aptitude
9 8 7 6 5 4 3 2 1 2 3 4 5 6 7 8 9 Institutional characteristics
Influence of others 9 8 7 6 5 4 3 2 1 2 3 4 5 6 7 8 9 Job market characteristics Influence of others 9 8 7 6 5 4 3 2 1 2 3 4 5 6 7 8 9 Curriculum characteristics Influence of others 9 8 7 6 5 4 3 2 1 2 3 4 5 6 7 8 9 Institutional characteristics Job market characteristics 9 8 7 6 5 4 3 2 1 2 3 4 5 6 7 8 9 Curriculum characteristics Job market characteristics 9 8 7 6 5 4 3 2 1 2 3 4 5 6 7 8 9 Institutional characteristics Curriculum characteristics 9 8 7 6 5 4 3 2 1 2 3 4 5 6 7 8 9 Institutional characteristics
Notes: 1 = equally important, 3 = moderately more important, 5 = strongly more important, 7 = very strongly more important, 9 = extremely more important.

University of St. Thomas uses AHP to grow operations management major 149
11 How would you describe each of the following concentrations?
Stronglydisagree Disagree Neither agree
nor disagree Agree Strongly agree
Marketing The subject matter really interests me This material really fits my abilities It is easy to find a job in this area Salaries are very high in this area Courses in this discipline require a lot of work
The faculty in this area is very good Accounting
The subject matter really interests me This material really fits my abilities It is easy to find a job in this area Salaries are very high in this area Courses in this discipline require a lot of work
The faculty in this area is very good
Operations management The subject matter really interests me This material really fits my abilities It is easy to find a job in this area Salaries are very high in this area Courses in this discipline require a lot of work
The faculty in this area is very good
12 How much do you know about what would be covered in courses for each of the following concentrations?
Know absolutely nothing
Know very little
Know some
Know quite a bit
Know very much
Accounting 0 1 2 3 4 Finance 0 1 2 3 4 Operations management
0 1 2 3 4
Entrepreneurship 0 1 2 3 4 Marketing 0 1 2 3 4
150 J.S. Jones et al.
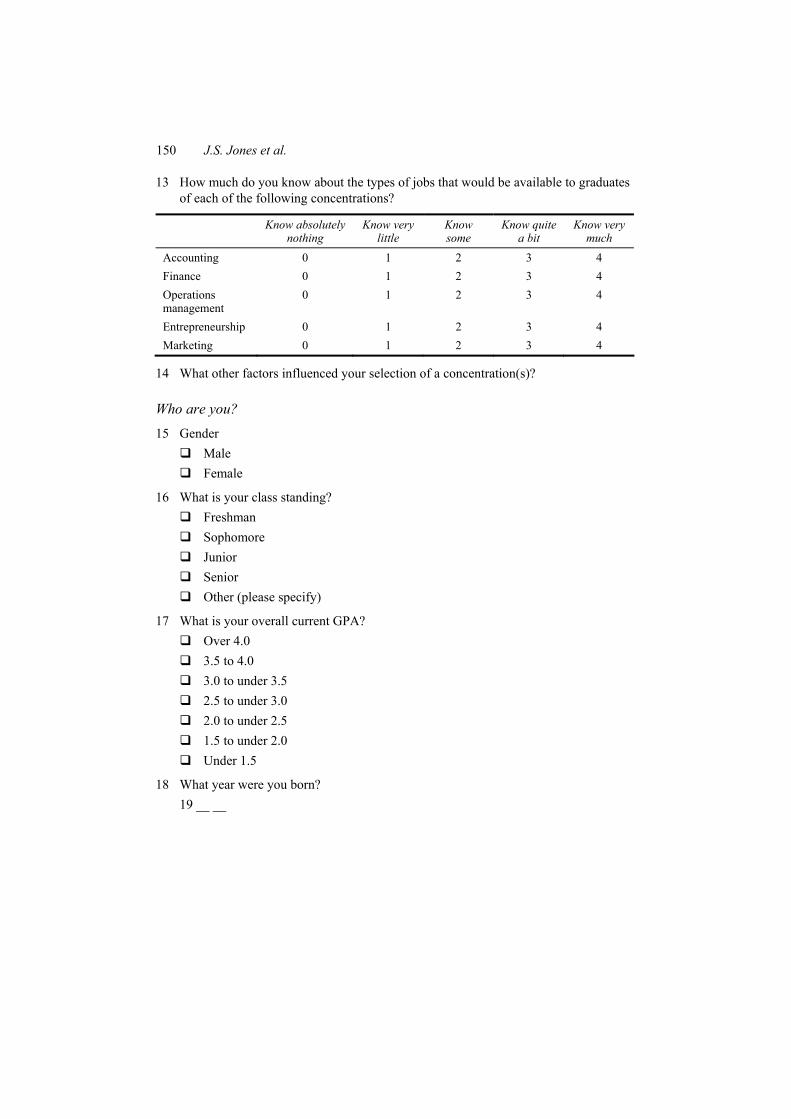
13 How much do you know about the types of jobs that would be available to graduates of each of the following concentrations?
Know absolutely nothing
Know very little
Know some
Know quite a bit
Know very much
Accounting 0 1 2 3 4 Finance 0 1 2 3 4 Operations management
0 1 2 3 4
Entrepreneurship 0 1 2 3 4 Marketing 0 1 2 3 4
14 What other factors influenced your selection of a concentration(s)?
Who are you?
15 Gender Male Female
16 What is your class standing? Freshman Sophomore Junior Senior Other (please specify)
17 What is your overall current GPA? Over 4.0 3.5 to 4.0 3.0 to under 3.5 2.5 to under 3.0 2.0 to under 2.5 1.5 to under 2.0 Under 1.5
18 What year were you born? 19 __ __
University of St. Thomas uses AHP to grow operations management major 151
Appendix B
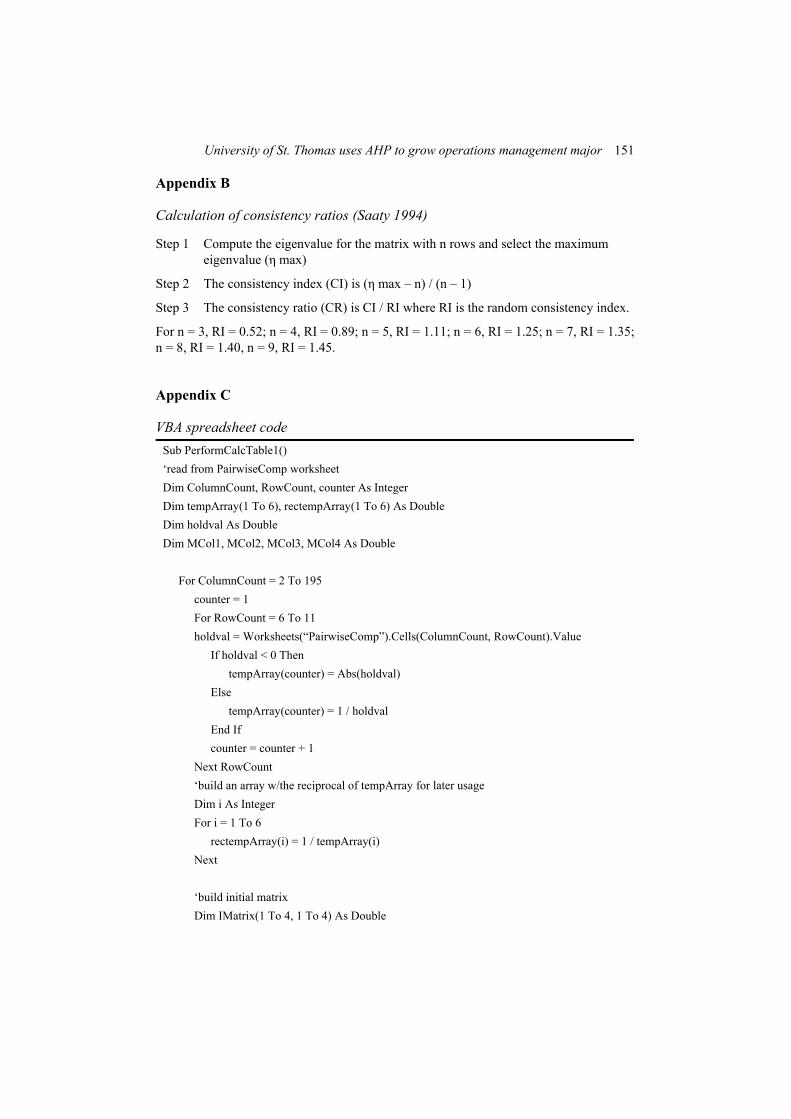
Calculation of consistency ratios (Saaty 1994)
Step 1 Compute the eigenvalue for the matrix with n rows and select the maximum eigenvalue (η max)
Step 2 The consistency index (CI) is (η max – n) / (n – 1)
Step 3 The consistency ratio (CR) is CI / RI where RI is the random consistency index.
For n = 3, RI = 0.52; n = 4, RI = 0.89; n = 5, RI = 1.11; n = 6, RI = 1.25; n = 7, RI = 1.35; n = 8, RI = 1.40, n = 9, RI = 1.45.
Appendix C
VBA spreadsheet code Sub PerformCalcTable1() ‘read from PairwiseComp worksheet Dim ColumnCount, RowCount, counter As Integer Dim tempArray(1 To 6), rectempArray(1 To 6) As Double Dim holdval As Double Dim MCol1, MCol2, MCol3, MCol4 As Double For ColumnCount = 2 To 195 counter = 1 For RowCount = 6 To 11 holdval = Worksheets(“PairwiseComp”).Cells(ColumnCount, RowCount).Value If holdval < 0 Then tempArray(counter) = Abs(holdval) Else tempArray(counter) = 1 / holdval End If counter = counter + 1 Next RowCount ‘build an array w/the reciprocal of tempArray for later usage Dim i As Integer For i = 1 To 6 rectempArray(i) = 1 / tempArray(i) Next ‘build initial matrix Dim IMatrix(1 To 4, 1 To 4) As Double
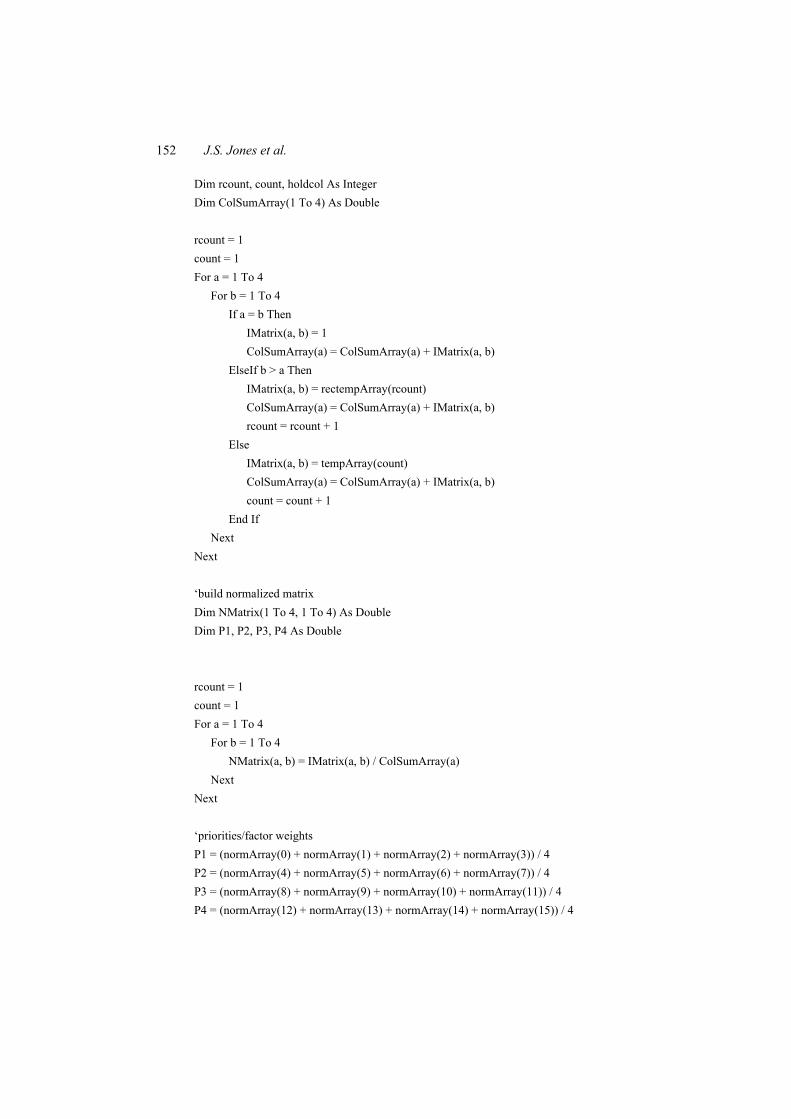
152 J.S. Jones et al.
Dim rcount, count, holdcol As Integer Dim ColSumArray(1 To 4) As Double rcount = 1 count = 1 For a = 1 To 4 For b = 1 To 4 If a = b Then IMatrix(a, b) = 1 ColSumArray(a) = ColSumArray(a) + IMatrix(a, b) ElseIf b > a Then IMatrix(a, b) = rectempArray(rcount) ColSumArray(a) = ColSumArray(a) + IMatrix(a, b) rcount = rcount + 1 Else IMatrix(a, b) = tempArray(count) ColSumArray(a) = ColSumArray(a) + IMatrix(a, b) count = count + 1 End If Next Next ‘build normalized matrix Dim NMatrix(1 To 4, 1 To 4) As Double Dim P1, P2, P3, P4 As Double rcount = 1 count = 1 For a = 1 To 4 For b = 1 To 4 NMatrix(a, b) = IMatrix(a, b) / ColSumArray(a) Next Next ‘priorities/factor weights P1 = (normArray(0) + normArray(1) + normArray(2) + normArray(3)) / 4 P2 = (normArray(4) + normArray(5) + normArray(6) + normArray(7)) / 4 P3 = (normArray(8) + normArray(9) + normArray(10) + normArray(11)) / 4 P4 = (normArray(12) + normArray(13) + normArray(14) + normArray(15)) / 4
University of St. Thomas uses AHP to grow operations management major 153
‘consistency ratio ‘write results of worksheet Next ColumnCount End Sub