university of são paulo “luiz de queiroz” college of …...insect pest dynamics first arose in...
TRANSCRIPT

University of São Paulo
“Luiz de Queiroz” College of Agriculture
Computational modeling to describe the dynamics of fall armyworm
Spodoptera frugiperda (J.E. Smith) (Lepidoptera: Noctuidae) in Bt crop
areas
Adriano Gomes Garcia
Thesis presented to obtain the degree of Doctor in
Science. Area: Entomology
Piracicaba
2017

Adriano Gomes Garcia
Bachelor in Biological Sciences
Computational modeling to describe the dynamics of fall armyworm Spodoptera
frugiperda (J.E. Smith) (Lepidoptera: Noctuidae) in Bt crop areas
Advisor:
Prof. Dr. WESLEY AUGUSTO CONDE GODOY
Thesis presented to obtain the degree of Doctor in
Science. Area: Entomology
Piracicaba
2017

2
Dados Internacionais de Catalogação na Publicação DIVISÃO DE BIBLIOTECA – DIBD/ESALQ/USP
Garcia, Adriano Gomes
Computational modeling to describe the dynamics of fall armyworm Spodoptera frugiperda (J.E. Smith) (Lepidoptera: Noctuidae) in Bt crop areas / Adriano Gomes Garcia. - - Piracicaba, 2017.
91 p.
Tese (Doutorado) - - USP / Escola Superior de Agricultura “Luiz de Queiroz”.
1. Insetos pragas 2. Ferramentas de decisão 3. Programas computacionais 4. Cultivos transgênicos I. Título

3
DEDICATION
This thesis is dedicated to my beloved Josemeri, Grega and Zorro

4
ACKNOWLEDGEMENTS
To Josemeri, Grega and Zorro for all your love, support and patience during this long road. Thank you
for helping me to find my life's purpose and for bringing so much joy and happiness into my life.
To my father, mother and sister for always being there for me and believing in my potential.
To all the loved people in my life, especially my second father and mother, Duda and Rose, for allowing
me to be part of your family.
To Prof. Wesley Godoy, for all our long talks, laughs, friendship and guidance.
To Prof. Claudia Pio Ferreira and Prof. Fernando Cônsoli for doing part of this work and, more
importantly, for being my friends.
To Rob Meagher for the opportunity, support and friendship during my sandwich period.
To Roberto Pereira and Bete for all your support and friendship during my stay in the U.S.
To the entire team behind the Graduate Program in Entomology of ESALQ for all their support.
To the United States Department of Agriculture (USDA) for affording me the opportunity to do this
research.
To Amy Rowley for technical assistance during the experiments, and for friendship.
To all professors who participated in my education by teaching me or discussing ideas, especially Prof.
José Postali Parra, Prof. Roberto Antonio Zucchi and Prof. Carolina Reigada.
To CNPq and FAPESP (2014/16609-7, 2015/10640-2, 2016/00831-8) for the fellowships.
To my valued friends, Paulo Victor and Paulo André “Maravilha”.

5
To all living beings that have passed through my life and helped me to evolve in different ways.
6
EPIGRAPH
But Moses said to God, “Who am I that I should go to Pharaoh and bring the Israelites out of
Egypt?”
And God said, “I will be with you. And this will be the sign to you that it is I who have sent
you: When you have brought the people out of Egypt, you will worship God on this
mountain.”
Exodus 3: 11-12

7
SUMMARY
RESUMO ............................................................................................................................................................... 8
ABSTRACT ......................................................................................................................................................... 10
1. INTRODUCTION ........................................................................................................................................... 11
2. PREDICTING EVOLUTION OF INSECT RESISTANCE TO TRANSGENIC CROPS IN WITHIN-
FIELD REFUGE CONFIGURATIONS, BASED ON LARVAL MOVEMENT .......................................... 21
ABSTRACT ......................................................................................................................................................... 21
2.1. INTRODUCTION ........................................................................................................................................... 22 2.2. MODEL ASSUMPTIONS ................................................................................................................................ 25 2.3. SIMULATIONS ............................................................................................................................................. 31 2.4. RESULTS ..................................................................................................................................................... 33 2.5. DISCUSSION ................................................................................................................................................ 37 2.6. CONCLUSIONS ............................................................................................................................................ 41 2.7. ACKNOWLEDGEMENTS ............................................................................................................................... 41 REFERENCES...................................................................................................................................................... 42
3. DELIMITING STRATEGIC ZONES FOR THE DEVELOPMENT OF FALL ARMYWORM
(LEPIDOPTERA: NOCTUIDAE) ON CORN IN THE STATE OF FLORIDA, BASED ON THERMAL
REQUIREMENTS AND GIS MODELING ..................................................................................................... 47
ABSTRACT ......................................................................................................................................................... 47
3.1. INTRODUCTION ........................................................................................................................................... 47 3.2. MATERIAL AND METHODS .......................................................................................................................... 49 3.3. RESULTS ..................................................................................................................................................... 53 3.4. DISCUSSION ................................................................................................................................................ 59 3.5. ACKNOWLEDGMENTS ................................................................................................................................. 60 REFERENCES...................................................................................................................................................... 60
4. A COMPUTATIONAL MODEL TO PREDICT THE LEVELS OF FALL ARMYWORM
SPODOPTERA FRUGIPERDA (LEPIDOPTERA: NOCTUIDAE) (J.E. SMITH) IN CROP AREAS,
CONSIDERING SPATIAL DYNAMICS, TEMPERATURE CHANGES AND GENETIC
COMPOSITION .................................................................................................................................................. 67
ABSTRACT ......................................................................................................................................................... 67
4.1. INTRODUCTION ........................................................................................................................................... 68 4.2. METHODS ................................................................................................................................................... 70 4.3. RESULTS ..................................................................................................................................................... 77 4.4. DISCUSSION ................................................................................................................................................ 81 4.5. CONCLUSION .............................................................................................................................................. 84
SUPPLEMENTARY DATA ............................................................................................................................... 91

8
RESUMO
Modelagem computacional para descrever a dinâmica populacional de Spodoptera
frugiperda (J.E. Smith) (Lepidoptera: Noctuidae) em áreas com cultivos Bt
Spodoptera frugiperda é um dos principais insetos-praga do hemisfério
ocidental, causando diversos danos a cultivos de interesse econômico, como milho
e algodão. Uma das estratégias mais comuns de controle é o uso de plantas Bt,
contudo sua aplicação intensa e indiscriminada levou à evolução de resistência em
algumas populações. O estabelecimento de refúgio pode representar uma opção
viável para atrasar esse processo. Refúgios são áreas nas quais cultivos não-Bt são
plantados de forma a fornecerem insetos suscetíveis para a população. Neste
estudo, eu desenvolvi inicialmente um modelo para descrever a evolução de
resistência de populações de S. frugiperda em diferentes configurações de refúgio
(mistura de sementes, blocos e faixas) e tamanhos (20 – 50%), considerando o
movimento larval. Eu demonstrei que para a mistura de sementes, na maioria dos
casos, maiores taxas de movimentação larval implicavam em maiores proporções
de insetos resistentes na população, independente do tipo de resistência testada,
enquanto áreas com configurações em faixas apresentaram tendência oposta. Na
segunda parte deste trabalho, eu obtive dados para validar o modelo proposto. O
desenvolvimento de S. frugiperda em folhas de milho foram determinadas em 5
temperaturas constantes variando de 14°C a 30°C. Estes dados também foram
utilizados para estimar o número de gerações do inseto em 42 localizações no
estado da Flórida de 2006 a 2016, que foram interpolados e representados em
mapas, utilizando SIG (Sistema de Informações Geográficas). Eu observei que
condados mais ao sul apresentaram maior número de gerações e que S. frugiperda
é capaz de passar o inverno abaixo de latitudes ~29°N. Utilizando os dados
obtidos no experimento, um novo modelo foi proposto, considerando um intervalo
maior de condições e permitindo ao usuário definir a área de cultivo, as exigências
térmicas da população estudada, as funções de oviposição e viabilidade, a taxa de
migração, a taxa de movimentação larval e a frequência do alelo de resistência. O
modelo foi verificado com dados de monitoramento de 2012 a 2015, coletados em
uma área de cultivo localizada na Flórida, distante apenas 70 km da área que
forneceu a população para o experimento laboratorial. Eu também utilizei o
modelo para estimar o número de adultos para 2016 e para duas situações
hipotéticas que consideraram possíveis cenários envolvendo o aquecimento global
(médias de temperaturas de 2016 + 1°C e + 2°C). O modelo se ajustou aos dados
de monitoramento com sucesso e indicou que os aumentos simulados na
temperatura média poderiam produzir surtos quase duas vezes maiores que os
níveis de S. frugiperda estimados para 2016. O modelo pode ser usado para
estimar a dinâmica populacional de S. frugiperda em uma determinada área de
acordo com a composição e disposição dos cultivos, investigar os efeitos das
mudanças de temperatura nos níveis populacionais, definir áreas de refúgio
apropriadas para o manejo da evolução de resistência, definir os melhores
períodos para plantação e colheita durante o ano de forma a reduzir a população
da praga, entre outros.

9
Palavras-chave: Insetos pragas; Ferramentas de decisão; Programas computacionais; Cultivos
transgênicos

10
ABSTRACT
Computational modeling to describe the dynamics of fall armyworm Spodoptera
frugiperda (J.E. Smith) (Lepidoptera: Noctuidae) in Bt crop areas
Spodoptera frugiperda is one of the main insect pests of the New World,
and causes extensive damage to economically important crops such as cotton and
corn. One of the most common control strategies is the use of Bt plants; however,
their intense and indiscriminate use has led to the evolution of resistance in some
populations. The establishment of a refuge can be a viable option to delay this
process. Refuges consist of areas where non-Bt crops are planted, in order to
provide susceptible insects to the population. In this study, I initially developed a
model to describe the evolution of resistance of fall armyworm populations in
different refuge configurations (seed mixture, blocks, and strips) and sizes (20% –
50%), considering the larval movement. I demonstrated that with a seed mixture,
in most cases, the higher the rate of larval movement, the higher the proportion of
resistant insects in the population, regardless of the type of resistance tested;
meanwhile, strip configurations showed the opposite trend. In the second part of
this study, I obtained data to validate the proposed model. The development of the
fall armyworm on corn leaves was determined at five constant temperatures
ranging from 14°C to 30°C. These data were also used to estimate the number of
generations of fall armyworms at 42 locations in the state of Florida, from 2006 to
2016, which were interpolated and represented on maps, using GIS (Geographic
Information System). I observed that counties farther south had the highest
numbers of generations, and that fall armyworms should be able to overwinter as
far north as ~29°N. Using the data obtained in the experiment, a new model was
proposed, covering a wider range of conditions and allowing the user to define the
crop area, the thermal requirements of the population studied, the viability and
oviposition functions, the migration rate, the rate of larval movement and the
frequency of alleles for resistance. The model was verified with monitoring data
collected in a crop area in Florida from 2012 – 2015, only 70 km from the area
that provided the population for the experiment. I also used the model to estimate
the number of adults for 2016 and for two hypothetical situations that considered
possible scenarios involving global warming (mean temperatures in 2016 + 1°C
and + 2°C). The model succeeded in fitting the monitoring data, and indicated that
the simulated increases in mean temperature could produce outbreaks nearly twice
as large as the levels of fall armyworm estimated for 2016. The model can be used
to estimate the population dynamics of S. frugiperda in a particular area,
according to the crop composition and disposal, to investigate the effects of
temperature changes on the levels of fall armyworm populations, to define
appropriate refuge areas in order to manage the evolution of insect resistance, and
to define the best periods for plantation and harvesting during the year to reduce
pest populations, among others.
Keywords: Insect pest; Decision tools; Computational programs; Transgenic crops

11
1. INTRODUCTION
Several questions concern farmers and entomologists when dealing with insect pests:
What is the best control strategy? How to implement this strategy? Is it safe for people and
for the environment? Agriculture has become an international activity and the economic
foundation of many countries, where food is produced not only to supply internal demands,
but for the whole world (CERVANTES-GODOY; DEWBRE, 2010). Unfortunately,
answering many of the questions about improvement of agriculture requires time and
resources that are usually not available. Models can provide reliable and relatively rapid
responses (TENG; DE VRIES, 1992; JONES et al., 2017). Interest in using models to study
insect pest dynamics first arose in the 1950s, aiming to define the intensity and frequency of
chemical pulverizations, motivated by the rise of the concept of pest management (STERN et
al., 1959). Modeling has become an important part of the process to choose the best
economically and environmentally sound management strategy. Norton (1976) emphasized
the important role of models as tools to aid in reaching decisions, although Bertsekas (1976)
cautioned about the necessity to consider stochastic events in the modeling process due to the
unpredictability inherent in biological systems. For instance, stochasticity can be related to
unpredictable outbreaks of some insect pests (COOKE; CARROLL, 2017). Even so,
deterministic models were able to provide useful results for insect-management plans
involving the introduction of sterile males (KNIPLING 1955, PROUT 1978). Comins (1977)
adapted a logistic model to define the quantity of pesticides to be used and the size of refuge
areas to avoid the development of resistant insects. In the 1970s, the use of parasites to control
pest populations was also studied using models, coupling non-linear differential equations to
classify members of a host population according to their state, e.g., susceptible and infected,
and describing their dynamics over time (ANDERSON; MAY, 1978, 1981; MAY;
ANDERSON, 1978).
Currently, the technology has evolved following the evolution of computers,
allowing diverse new modeling approaches and enlarging the role of models in pest control
(JONES et al., 2017). Modeling is the representation of reality; therefore, the computational
models aim to describe entomological problems using the facility and dynamism provided by
computers. Computational models have proven to be useful tools for agriculture because they
constitute a laboratory in silico, where experiments can be done to anticipate the effect of a
natural or anthropic variable on the insect dynamics (MICHALSKI; CARBONELL;

12
MITCHELL, 1985; FERREIRA; GODOY, 2014). Bone et al. (2006) coupled a cellular
automata model and fuzzy logic to describe the spatial distribution of the mountain pine
beetle Dendroctonus ponderosae (Coleoptera: Scolytidae) and simulate the susceptibility
levels of trees to this beetle. Cellular automata models were also used to study habitat
management, to optimize the control of the cucurbit beetle Diabrotica speciosa (Coleoptera:
Chrysomelidae) (GARCIA et al., 2014) and to evaluate the invasion potential of the tomato
leafminer Tuta absoluta (Lepidoptera: Gelechiidae) in Africa, considering temperature,
relative humidity and yield of tomato production (GUIMAPI et al., 2016).
One of the insect pests of great interest to model is the fall armyworm Spodoptera
frugiperda (J.E. Smith, 1797) (Lepodoptera: Noctuidae). S. frugiperda is a polyphagous pest
that occurs in the western hemisphere from Argentina to Canada (SPARKS, 1979), and
attacks several crops, including corn, cotton and soybeans (BARROS; TORRES; BUENO,
2010). In Brazil, the fall armyworm is one of the main insect pests of corn and cotton
(MARTINELLI et al., 2006). In the United States, it is concentrated mainly in the southeast
due to the climate conditions (HOGG; PITRE; ANDERSON, 1982). Young larvae begin to
damage leaves by scraping the leaf stem, and completely consume the leaves during the last
larval instars (VILARINHO et al., 2011; REDAELLI; OURIQUE, 2015).
One of the main strategies of fall-armyworm control involves the use of transgenic
crops altered to express genes from the bacterium Bacillus thuringiensis (Bt plants). The
increasing use of Bt plants, together with the low level of commitment to using refuge areas,
have raised concerns. Intensive use of these plants has favored the evolution of insect
resistance to the plants in the field, making some of the commercially available technologies
unviable (JAMES, 2013; TABASHNIK; BRÉVAULT; CARRIÉRE, 2013).
One approach to delay the evolution of insect resistance to Bt toxins is the use of
refuge areas. These consist of areas where non-Bt crops are planted in order to promote the
survival of susceptible individuals, preventing an increase in the proportion of resistant
insects when resistance is a recessive character (SISTERSON et al., 2005; CROWDER;
CARRIÈRE, 2009). In the United States, proportions of non-transgenic refuge areas totaling
20% have been recommended for transgenic-corn fields in the Corn Belt and 50% for
transgenic-corn fields in the Cotton Belt (ENVIRONMENTAL PROTECTION AGENCY,
1998). In Brazil, proportions of 10% for non-transgenic crops in transgenic-maize fields, 20%
in transgenic-soybean fields, and 5% to 20% in transgenic-cotton fields are recommended
(MINISTRY OF AGRICULTURE, LIVESTOCK AND FOOD SUPPLY, 2014).

13
Therefore, it is not surprising that the dynamics of S. frugiperda in transgenic and
non-transgenic crops have already been simulated using computational models. Cerda and
Wright (2004) developed a population-based model to investigate optimal refuge
configurations and proportions to manage the resistance in hypothetical populations. They
found that the larger the refuge sizes, the lower the rates of increase in the frequency of
resistance; however, larval movement could produce an opposite trend. Carroll et al. (2012)
used a probabilistic model to compare different refuge configurations, concluding that seed
mixtures were more effective in delaying resistance evolution across a range of conditions.
My primary goal in this thesis was to create a new approach to simulate the spatio-
temporal dynamics of S. frugiperda. First, differently from most of the studies in this area, I
used a spatially explicit model that allowed a detailed investigation of the spatial distribution
of S. frugiperda. Additionally, I used an individual-based model, whose greatest advantage is
the ability to represent the individual-level variations among insects during their life cycle,
allowing a more realistic representation of the study case (DEANGELIS; GRIMM, 2014). My
intention here was to create a computational tool able to represent in detail the design and
characteristics of a small-scale area. This type of model is appropriate for this representation
because it details the variability of individual characteristics (JORGENSEN; CHON, 2009). I
also combined a larger set of conditions than previous models that investigated the evolution
of resistance, providing a more complete set of results. The theoretical model and the results
of this proposal are described in Chapter 2 of this dissertation.
The second stage of this study was the model validation. According to Rykiel (1999),
validation is not a test of a scientific theory, nor is it a statement of the veracity of a scientific
understanding. Validation merely means that a model is acceptable for its purpose, since it
meets certain requirements. A partnership was established with the USDA in order to test if
the model provided acceptable results. A fall armyworm population from Florida was studied
in the laboratory in order to obtain data to use as input for the model. With these data in hand,
I decided to conduct an additional analysis to map strategic areas for the development of fall
armyworms in Florida and compare the results to previous studies that used different
approaches (SNOW; COPELAND, 1969; WOOD; POE; LEPPLA, 1979; WADDILL et al.,
1982). Based on the thermal requirements of S. frugiperda, the number of generations of fall
armyworm was estimated at 42 locations in Florida, from 2006 to 2016, and represented in
interpolation maps using a Geographic Information System (GIS). The results of this study
are described in Chapter 3.

14
Finally, in Chapter 4, the model developed in Chapter 2 was improved and adapted
with the data obtained in Chapter 3. Initially, my proposal was to create a theoretical model
providing useful information about the refuge configuration and size in order to manage the
evolution of resistance of S. frugiperda (Chapter 2, GARCIA et al., 2016). However, in
Chapter 4, the potential of the model was expanded. One of the improvements was that all
equations and rules related to insect development have become temperature-driven. This
allowed me to consider the effect of climate changes and seasonality on the population
dynamics. Additionally, the results provided by the model were verified with data from the
field, which increased its reliability. Although insects are considered poikilotherms and
temperature is one of the most important variables in their development and geographic
distribution (LUGINBILL, 1928; ROSE; SILVERSIDE; LINDQUIST, 1975; BARFIELD;
MITCHELL; POE, 1978; YOUNG, 1979), most models do not consider the influence of
temperature variation on insect development.
References
ANDERSON, R. M.; MAY, R. M. Regulation and stability of host-parasite population
interactions. I. Regulatory processes. Journal of Animal Ecology, v. 47, p. 219–247,
1978.
ANDERSON, R. M.; MAY, R. M. The population dynamics of microparasites and their
invertebrate hosts. Philosophical Transactions of the Royal Society of London, Series
B, v. 291, p. 451–524, 1981.
BARFIELD, S. C.; MITCHELL, E.R.; POE, S. L. A Temperature-Dependent Model for Fall
Armyworm Development. Annals of the Entomological Society of America, v .71, p.
70–74, 1978.
BARROS, E.M., TORRES, J.B., BUENO, A.F. Oviposition, development, and reproduction
of Spodoptera frugiperda (J.E. Smith) (Lepidoptera: Noctuidae) fed on different hosts of
economic importance. Neotropical Entomology, v. 39, p. 996–1001, 2010.
BERTSEKAS, D.A. Dynamic Programming and Stochastic Control. New York:
Academic Press, 1976. 488 p.

15
BONE, C.; DRAGICEVIC, S.; ROBERTS, A. A fuzzy-constrained cellular automata model
of forest insect infestations. Ecological Modeling, v. 192, p.107 – 125, 2006.
CARROLL, M.W.; HEAD, G.; CAPRIO, M.; STORK, L. Theoretical and empirical
assessment of a seed mix refuge in corn for southwestern corn borer. Crop Protection, v
.49, p. 58–65, 2013.
CERDA, H., WRIGHT, D.J. Modeling the spatial and temporal location of refugia to manage
resistance in Bt transgenic crops. Ecosystem Environment, v .102, pp. 163–174, 2004.
CERVANTES-GODOY, D.; DEWBRE, J. Economic Importance of Agriculture for
Poverty Reduction. Paris: OECD Publishing, 2000. v. 23. 26 p. OECD Food, Agriculture
and Fisheries Working Papers.
COMINS, H.N. The development of resistance in the presence of migration. Journal of
Theoretical Biology, v.64, p.177-197, 1977.
COOKE, B.J.; CARROLL, A.L. Predicting the risk of mountain pine beetle spread to eastern
pine forests: Considering uncertainty in uncertain times. Forest ecology and
Management, v. 396, p. 11 – 25, 2017.
CROWDER, D.W., CARRIÈRE, Y. Comparing the refuge strategy for managing the
evolution of insect resistance under different reproductive strategies. Journal of
Theoretical Biology, v. 261, pp. 423–430, 2009.
DEANGELIS, D.L., GRIMM, V. Individual-based models in ecology after four decades.
F1000Prime Reports, v.6, doi: 10.12703/P6-39, 2014.
ENVIRONMENTAL PROTECTION AGENCY. Final Report of the Subpanel on Bacillus
thuringiensis (Bt) Plant-Pesticides and Resistance Management, 1998. 61 p. Available
from http://www2.epa.gov/sap (accessed September 2015).
FERREIRA, C. P.; GODOY, W.A.C. (Eds.). Ecological Modelling Applied to Entomology.
Switzerland: Springer, 2014. 262 p.
16
GARCIA, A. CÔNSOLI, F.L., GODOY, W.A.C., FERREIRA, C.P. A mathematical
approach to simulate spatio-temporal patterns of an insect-pest, the corn rootworm
Diabrotica speciosa (Coleoptera: Chrysomelidae) in intercropping systems. Landscape
Ecology, v. 29, pp. 1531–1540, 2014.
GARCIA, A. G., CÔNSOLI, F.L., FERREIRA, C.P., GODOY, W.A.C. Predicting evolution
of insect resistance to transgenic crops in within-field refuge configurations, based on
larval movement. Ecological Complexity, v.28, p. 94 – 103, 2016.
GUIMAPI, R.Y.A.; MOHAMED, S.A.; OKEYO, G.O.; NDJOMATCHOUA, F.T.; EKESI,
S.; TONNANG, H.E.Z. Modeling the risk of invasion and spread of Tuta absoluta in
Africa. Ecological Complexity, v.28, p. 77 – 93, 2016.
HOGG, D. B., PITRE, H.N., ANDERSON, R.E. Assessment of Early-Season Phenology of
the Fall Armyworm (Lepidoptera: Noctuidae) in Mississippi. Environmental
Entomology, v.11, p. 705–710, 1982.
JAMES, C. Global status of commercialized biotech/GM crops. New York: ISAAA, 2013.
n. 46. 332 p. ISAAA Briefs.
JONES, J.W.; ANTLE, J.M.; BASSO, B.; BOOTE, K.J.; CONANT, R.T.; FOSTER, I.;
GODFRAY, C.J.; HERRERO, M.; HOWITT, R.E.; JANSSEN, S.; KEATING, B.A.;
MUNOZ-CARPENA, R. PORTER, C.H.; ROSENZWEIG, C.; WHEELER, T.R. Brief
history of agricultural systems modeling. Agricultural Systems, v. 155, p. 240-254, 2017.
JORGENSEN, S.E., CHON, T.S. Model types available for Ecological Modelling. In:
JORGENSEN, S.E.; CHON, T.S.; FRIEDRICH, R. (Eds.). Handbook of Ecological
Modelling and Informatics. Southampton, UK: WIT Press, 2009. p. 9-40.
KNIPLING, E.F. Possibilities of insect control or eradication through the use of sexually
sterile males. Journal of Economical Entomology, v.45, p.459-462, 1955.
LUGINBILL, P. The fall armyworm, Washington, DC: USDA, 1928. 91 p. Technical
Bulletin of the U.S. Department of Agriculture.

17
MARTINELLI, S.; CLARK P.L., ZUCCHI M.I., SILVA-FILHO M.C., FOSTER J.E.,
OMOTO C. Molecular Variability of Spodoptera Frugiperda (Lepidoptera: Noctuidae)
Populations Associated to Maize and Cotton Crops in Brazil. Bulletin of Entomological
Research, v. 99, p. 519-526, 2006.
MAY, R. M.; ANDERSON, R. M. Regulation and stability of host-parasite population
interactions. II. Destabilizing processes. Journal of Animal Ecology, v. 47, p. 249–267,
1978.
MICHALSKI, R.S.; CARBONELL, J.G.; MITCHELL, T.M. (Eds.). Machine Learning: An
Artificial Intelligence Approach. Los Altos, CA: Kaufmann, 1985. 512 p.
MINISTRY OF AGRICULTURE, LIVESTOCK AND FOOD SUPPLY. Recomendações de
refúgio preconizadas pelas empresas detentoras das tecnologias. Memória da 1ª reunião do
GTMR (Grupo Técnico-Científico sobre Manejo de Resistência), 2014. 4 p. Available
from https://www.slideshare.net/ruralbr/memria-da-1-reunio-do-gtmr (acessed September
2015).
NORTON, D.A. Analysis of decision making in crop protection. Agroecosystem, v.3, p.27-
44, 1976.
PROUT, T. The join effects of the release of sterile males and immigration of fertilized
females on a density regulated population. Theoretical population biology, v.13, p.40-
71, 1978.
REDAELLI, R. N. M. R. L., OURIQUE, C.B. Thermal Requirements and Annual Number of
Generations of Diachasmimorpha longicaudata (Hymenoptera: Braconidae) Reared in the
South American Fruit Fly and the Mediterranean Fruit Fly (Diptera: Tephritidae). Florida
Entomologist, v.98, pp. 1223–1226, 2015.
ROSE, A.H.; SILVERSIDES, R.H.; LINDQUIST, O.H. Migration fight by an aphid,
Rhopalosiphum maidis (Hemiptera: Aphididae) and a noctuid, Spodoptera frugiperda
(Lep.: Noctuidae). The Canadian Entomologist, v.107, p. 567-576, 1975.

18
RYKIEL, E. J. Testing ecological models: The meaning of validation. Ecological Modelling,
v. 90. p. 229-244, 1996.
SISTERSON, M.S.; CARRIÈRE Y., DENNEHY T.J., TABASHNIK B.E. Evolution of
resistance to transgenic crops: Interaction between insect movement and field distribution.
Journal of Economic Entomology, v. 98, pp. 1751–1762, 2005.
SNOW, J.W.; COPPELAND, W.W. Fall Armyworm Use of Virgin female traps to detect
males and to determine seasonal distribution. Washington, DC: U.S. Government
Printing Office, 1969. 9 p. Production Research Report - USDA-ARS.
SPARKS, A.N. A review of the biology of the fall armyworm. Florida Entomology, v. 62,
pp. 82–87, 1979.
STERN, V.N.; SMITH, R.F.; VAN DEN BOSCH, R.; HAGEN, K.S. The integrated control
concept. Hilgardia, v.29, p.81-101, 1959.
TABASHNIK, B.E., BRÉVAULT, T., CARRIÈRE, Y. Insect resistance to Bt crops: lessons
from the first billion acres. Nature Biotechnology, v.31, pp. 510–521, 2013.
TENG, P.S, DE VRIES, F.W.T.P. (Ed.) Systems Approaches for Agricultural
Development, Applied Science. Barking (UK): Elsevier, 1992. 309 p.
VILARINHO, E.C.; FERNANDES, O.A.; HUNT, T.E.; CAIXETA, D.F. Movement of
Spodoptera frugiperda adults (Lepidoptera: Noctuidae) in maize in Brazil. Florida
Entomology, v. 94, p. 480–488, 2011
WADDILL, V. H.; MITCHELL, E.R.; DENTON, W.H.; POE, S.L.; SCHUSTER, D.J.
Seasonal abundance of fall armyworm and velvetbean caterpillar (Lepidoptera: Noctuidae)
at four location in Florida. Florida. Entomologist, v. 65, p. 350–354, 1982
WESTBROOK, J. K.; NAGOSHI, R.N.; MEAGHER, R.L.; FLEISHCER, S.J.; JAIRAM, S.
Modeling seasonal migration of fall armyworm moths. International Journal of
Biometeorology, v. 60, p. 255–267, 2016.
19
WOOD, J. R.; POE, S.L.; LEPPLA, N.C. Winter Survival of Fall Armyworm Pupae in
Florida. Environmental Entomology, v. 8, p. 249–252, 1979.
YOUNG J.R. Fall armyworm: control with insecticides. Florida Entomologist, v. 62, p. 130-
133, 1979.
.

20
21
2. PREDICTING EVOLUTION OF INSECT RESISTANCE TO
TRANSGENIC CROPS IN WITHIN-FIELD REFUGE
CONFIGURATIONS, BASED ON LARVAL MOVEMENT
ABSTRACT
The selection pressure imposed by the widespread use of transgenic
technologies can lead to the evolution of insect resistance, and the availability of
refuge areas that allow susceptible homozygous insects to survive is a key factor
in delaying the evolution of resistance in agricultural landscapes. Different
strategies to exploit refuge areas exist, but several insect-related ecological traits
may directly affect the efficiency of refuges in slowing the development of
resistance. Insect larval movement is one such trait that may affect the
management of resistance, depending on the refuge strategy adopted. We
developed a computational model to simulate how larval movement would affect
the spatio-temporal dynamics of the evolution of resistance of insect pests to Bt
crops, under different refuge configurations. In order to test the model, we used
population data for Spodoptera frugiperda, one of the main target pests for control
with Bt toxins. Simulations were run for spatial arrangements composed of three
refuge configurations (seed mixture, blocks, and strips), with sizes ranging from
20% to 50% for two types of resistance (incomplete and complete) and three rates
of larval movement (proportion of larvae moving per time step), equal to 0, 0.1
and 0.5. We demonstrated that with a seed mixture, in most cases the higher the
rate of larval movement, the higher the proportion of resistant insects in the
population in an area, regardless of the type of resistance tested. Strip
configurations showed the opposite trend. In a block configuration, the number of
resistant larvae was highest at an intermediate dispersal rate (0.1). We concluded
that larval movement is an important variable affecting the evolution of resistance
to Bt crops, but its effect depends on the type of resistance and the configuration
and size of the refuge.
Keywords: Cellular automata; Transgenic crops; Resistance management; Refuge areas; Insect
ecology
22
2.1. Introduction
Increased concern regarding the side effects caused by the indiscriminate use of
pesticides to the environment and non-target organisms has motivated the development of
new pest-control strategies (THACKER, 2002). One of these technologies involves the use of
transgenic crops, most of them genetically altered to express genes from the bacterium
Bacillus thuringiensis (Bt plants). The increasing use of Bt plants, together with the low level
of compliance with refuge requirements, have raised concern. The lack of compliance with
guidelines for the use of refuges has favored the evolution of insect resistance to Bt plants in
the field, and has led to the rapid nullification of some of the commercially available
technologies (JAMES, 2013; TABASHNIK; BRÉVAULT, CARRIÉRE, 2013).
One strategy to delay the evolution of insect resistance to Bt toxins is the use of
refuges. This consists of planting non-Bt crops in order to promote the survival of susceptible
insects that will outnumber the resistant ones, preventing an increase in the proportion of the
resistant phenotype when resistance is a recessive trait (SISTERSON et al., 2005;
CROWDER; CARRIÈRE, 2009). Different countries have adopted different requirements for
refuge areas. For instance, in the United States, the Environmental Protection Agency (EPA)
has determined that the optimum proportions of non-Bt refuge areas are 20% for Bt-maize
fields in the Corn Belt and 50% for Bt-maize fields in the Cotton Belt, based on scientific
criteria and practicality for growers (ENVIRONMENTAL PROTECTION AGENCY, 1998).
In Brazil, the Ministry of Agriculture, Livestock and Food Supply recommends 10% non-Bt
plants in Bt-maize fields, 20% in Bt-soybean fields, and 5% to 20% in Bt-cotton fields
(MINISTRY OF AGRICULTURE, LIVESTOCK AND FOOD SUPPLY, 2014).
Usually, the refuge is structured as a block or a set of strips of non-Bt and Bt crops
(CARROLL et al., 2013). An alternative to the structured refuge is the use of seed mixtures of
non-Bt and Bt crops (RIB) to ensure growers' compliance with refuge requirements
(CARROLL; HEAD; CAPRIO, 2012; CARROLL et al. 2013). Although RIB appears to be a
plausible solution for managing the evolution of insect resistance to Bt crops, several
important issues related to the effect of insect larval movement on the evolution of resistance
remain to be resolved. Larval movement can expose more larvae to sublethal doses of Bt
toxins, increasing selection for Bt resistance either if the target pest moves as early instars
from Bt to non-Bt crops, or if it moves from non-Bt to Bt crops as older instars (BINNING et
al., 2014; HEAD et al., 2014).

23
Spodoptera species (Lepidoptera: Noctuidae) are among the main target pests for
control with Bt toxins in maize and cotton crops, and insect-resistance management is
essential to ensure the effectiveness of this control (HUANG et al., 2014). Spodoptera
frugiperda (J. E. Smith, 1797) is the main species occurring in the New World, with a
distribution ranging from Argentina to Canada (SPARKS, 1979), where Bt plants are
extensively cultivated. Because of the heavy use of Bt plants, field-evolved resistance to Bt
maize has already been documented in Puerto Rico (VÉLEZ et al., 2013) and Brazil (FARIAS
et al., 2014; OMOTO et al., 2016).
Ecological modeling can be a useful tool to investigate the influence of larval
movement and other ecological factors on the evolution of resistance (SISTERSON et al.,
2005). Theoretical ecological models that include spatial heterogeneity and insect fitness on
different hosts (e.g., Bt or non-Bt crops) can provide insights on this evolution. Cellular
automata (CA) are an interesting choice for developing these ecological models, because all
relevant within-plot characteristics of a crop can be included in the model (GARCIA et al.,
2014). The discrete nature of CA models permits one to represent the presence or absence of
the different stages of the insect pest at a specific position of the lattice, by a binary variable
whose state can change over time through simple stochastic rules that mimic an insect life
cycle (HIEBELER, 2005; GARCIA et al., 2014). Additionally, a combination between CA
and individual-based approaches may provide a realistic sense of movement since CA models
focus on the spatial conformation of the variables through transitions rules while individual-
based models focus on the variability of individual characteristics (JORGENSEN; CHON,
2009).
In order to investigate the effect of larval movement of S. frugiperda on the evolution
of resistance under different Bt refuge configurations, we developed a CA model. We ran
simulations testing three different rates of larval dispersal under three refuge configurations
(seed mixture, strips, and blocks), and with refuge areas ranging in size from 20 to 50% of the
total cultivated area. We also considered the type of resistance (complete or incomplete) to Bt
maize, since this attribute may influence the selection of the resistant phenotype. According to
Tabashnik et al. (2013), incomplete resistance occurs when resistant insects developing on Bt
crops are at a disadvantage compared with those that develop on non-Bt maize. In each
simulation, we determined the proportion of resistant larvae per time step. We hypothesized
that larval movement would differently affect the evolution of resistance to Bt crops, for
complete or incomplete resistance mechanisms, under different configurations and
proportions of refuges.

24
Many different studies have focused on the evolution of insect resistance to
transgenic crops, including considerations of spatiality. A model based on a reaction-diffusion
system of partial differential equations (PDEs), combining a spatial demographic model of
population dynamics with classical genetic theory, was used to study the relationship between
refuge size, pest movement, and resistance evolution in the European corn borer, Ostrinia
nubilalis (Lepidoptera: Crambidae), and showed that contiguous refuge areas are more
efficient than a large number of small refuge patches (TYUTYUNOV et al., 2008). A
stochastic model was developed to simulate the rate of resistance evolution of Helicoverpa
armigera (Lepidoptera: Noctuidae) to Cry1AC in India, integrating genetic and ecological
parameters (KRANTHI; KRANTHI, 2004). They were able to define the time spans
necessary to reach a resistant allele frequency of 0.5 for different proportions of Bt cotton in
the total area. Kang et al. (2014) developed a spatial explicit model of population dynamics
and genetics of Diatraea saccharalis (Lepidoptera: Crambidae) to investigate the evolution of
Bt resistance in a landscape composed of Bt and non-Bt maize, sorghum, and rice fields, and
concluded that the landscape heterogeneity may complicate the management of Bt resistance
in D. saccharalis. In order to study specifically the resistance evolution in S. frugiperda,
Téllez-Rodríguez et al. (2014) developed a two-patch population model to investigate the
effect of a preference for oviposition on Bt or non-Bt crops on resistance evolution. They
concluded that the avoidance of damaged leaves (which led females to lay eggs on Bt plants
rather than on plants in the refuge areas) rendered the refuge strategy ineffective. However,
none of these previous modeling investigations considered larval movement.
Among the spatial models that have been proposed to study the relationship between
larval movement and the evolution of insect resistance, Cerda and Wright (2004) developed a
population-based model to test the effects of different refuge proportions (5% – 50%) and
different refuge configurations (border, central, equidistant random) on the frequency of
resistant alleles in hypothetical populations. They reported that the larger the refuge sizes, the
lower the rates of increase in the frequency of resistance; however, higher rates of movement
produced an opposite trend. Carroll et al. (2012) developed a probabilistic model to compare
RIB and a structured refuge when larval movement in a hypothetical population was
considered, and concluded that RIB was more effective in delaying resistance evolution
across a range of conditions. Both these studies illustrate the importance of studying larval
movement and its implications for resistance evolution.
Differently from most of the work in this area, we used a spatially explicit model that
allowed a detailed investigation of the effects of several variables on the spatial distribution of

25
S. frugiperda. In addition, we used an individual-based model rather than a population-based
model. The greatest advantage of this approach is the ability to represent the individual level-
mechanisms and the variations among individuals during their life cycle (larval, pupal and
adult stages; and different reproductive stages, i.e. pre-oviposition and oviposition), allowing
a more realistic representation of the phenomenon under study (DEANGELIS; GRIMM,
2014). We also combined a larger set of conditions that were not previously modeled, to
investigate the evolution of resistance, such as the type of resistance (complete and
incomplete) with refuge configuration and refuge size, providing a more complete set of
results.
2.2. Model assumptions
Spodoptera frugiperda is a holometabolous insect. Only larvae are exposed to the
selection pressure imposed by the contact with Bt toxins, as only this stage feeds actively on
Bt crops. Therefore, plants are damaged only by larvae, while adults are responsible for laying
eggs on the leaves. In order to take this into account, a stochastic cellular automata consisting
of a grid of 604 x 604 sites representing one plant available in each cell was proposed to
simulate the population dynamics of larvae/pupae (immature stage) and adults, following a
similar method to that of Garcia et al. (2014). Regarding the immature stage, a cell could be
either empty or occupied by only one larva. This assumption was based on the mean number
of larvae developed per maize plant, as reported by Farias et al. (2001). Although females lay
clusters with hundreds of eggs on host plants, only one larva survives per plant, due to
environmental pressure and larval cannibalism. Regarding adults, a cell could be empty or
occupied by a maximum number of 10 adults, here set as the plant (cell) carrying capacity.
Both stages were connected by adult emergence and oviposition. We assumed unlimited
feeding resources. We also used a parallel update with fixed boundary conditions, i.e., the first
and last rows and columns of cells were kept constant over time (both were equal to 0). Each
time step t corresponded to one day, and each cell of the CA represented 1 x 1 m of the crop
system. We also associated an age-counter with each insect represented in order to follow its
chronological age. The immature stage was divided into larval and pupal stages, in order to
represent the period of larval mobility. The rules are:

26
(1) Immature (larvae and pupae) population dynamics
(a) A cell occupied by an immature insect could become empty with probability [1 -
µ(i)] + σ(i) due to mortality or adult emergence per day, respectively. Both parameters were
dependent on the chronological age i of the immature insect.
(b) An empty cell could become occupied by a larva if an adult (in a Moore
neighborhood of radius 2 plus the central cell) laid eggs in it. Per-capita oviposition
probability per day was ϕ(a), and was dependent on the chronological age a of the adult.
(2) Adult population dynamics
(a) A cell would become empty of adults if all adults died. The mortality for an
individual female per day is described by the probability γ(a), depending on the chronological
age a of the adult.
(b) An empty cell could be occupied per day with probability σ(i)/2 if a larva in the
corresponding cell developed into a female adult. The fraction 1/2 was related to the sex ratio,
and the probability was dependent on the chronological age i of the immature.
We considered an initial infestation in the center of the lattice, totaling 1600
individuals (40 x 40 cells). We chose f = 0.01 as an initial frequency of the resistance allele.
Therefore, 16 cells of the total of 1600 were randomly chosen to allocate resistant individuals.
The parameter (immature viability) was used to calculate the daily probability of
immature mortality [1 - as well as larval viabilities on Bt maize in the cases of either
complete or incomplete resistance. A summary of the model parameters is presented in Table
1.

27
Table 1. Model parameter units and description.
Parameter Unit Description
day-1 probability per time that an
immature insect survives
day-1 probability per time that a
pupa becomes an adult
day-1 probability per time of
death of a female adult
day-1 probability per time of
oviposition by a female
adult
f - frequency of resistant
allele
All probability functions are described in eqs. (1)-(4). They were proposed by using
data on non-Bt maize plants from S. frugiperda populations provided by Barros et al. (2010).
For CA1, we have:
Survival of immature insects
(1)
Metamorphosis (pupa becoming adult)
(2)
For CA2, we have:
Mortality of adult insects
(3)

28
Oviposition by a female adult
(4)
Since we used an individual-based model, each individual in the lattice was tested by
these equations depending on whether it was an immature or an adult stage. For instance, in
case of an immature, a random rational number between 0 and 1 was chosen by the computer,
and if this number was less than 0.98, the immature was considered to survive to the next time
step. Otherwise, the individual would die.
According to Elmo et al. (2006), there is no preferential direction for adult dispersal.
The distance traveled by an adult at each time step was calculated by using data for adult
movement in maize fields (VILARINHO et al., 2011). Therefore, in eq. (5), P is the
probability that an adult will travel over a distance S per time step in the lattice if the number
of insects in the cell destination is less than the carrying capacity defined previously (10
adults) (Figure 1).
Adult movement
(5)

29
0.0
0.2
0.4
0.6
0.8
1.0
S(meters)
P
0 5 10 15 20 25 30 35 40
Figure 1. Graphical representation of the equation system (5). P represents the probability that an adult will
travel over a distance S per day.
Larval dispersal was implemented as a random movement (diffusion) into a Moore
neighborhood of radius 1 (3x3 neighborhood), because experimental evidence suggests that
larvae disperse over only short distances. This means that on each day, a larva can move to
any of the neighbor cells that are directly in contact with its cell. We considered that only a
given proportion of all larvae could move in each time step (rate of dispersal). By increasing
the proportion of larvae moving in each time step, larval dispersal in the lattice was increased.
For instance, assuming a rate of dispersal equal to 0.1 means that only 10% of larvae (chosen
randomly) are moving in the lattice per time step.
2.2.1. Modeling the genetic component
We considered a recessive and autosomal resistance to Bt maize (R gene),
determined by a single locus, and the existence of three different phenotypes (SS – susceptible
homozygote, SR – susceptible heterozygote, RR – resistant homozygote) (VÉLEZ et al.,
2014; HUANG et al., 2014). In order to determine the genotype of each individual, we used

30
the Hardy-Weinberg equation created by Hardy (1908) to study the genetic variation in a
population for a single gene locus. It is expressed by:
(6)
where is the frequency of the S allele ( and q is the frequency of the R allele. In
eq. (6) represents the frequency of the genotype SS, determines the frequency of SR,
and the frequency of RR.
The genetic contribution of females, but not males, to the offspring was known. The
reason is that in the proposed model, the adult population is composed only of females since
they are responsible for laying eggs, and as such cause the population to grow.
Thus, we needed to use eq. (6) to estimate the conditional probabilities for each
genotype, considering that we knew only the contribution of the parental female. For instance,
if the mother is SS, we know the probability that the offspring genotype will be RR is equal to
0. However, since the father's genotype is unknown, the offspring can be either SS or SR. For
the offspring to be SS, the father would be SS ( or SR, and the probability that allele S will
be transmitted to the offspring is given by (0.5 × 2 × ). For the offspring to be SR, the
father would have to be SR and the R allele be transmitted to the offspring (0.5 × 2 × ), or
the father would be RR . The complete conditional probabilities are shown in Table 2.
Table 2. Conditional probabilities of the occurrence of each offspring genotype, depending on the mother's
genotype.
Offspring genotype
Mother genotype SS SR RR
SS 0
SR
RR 0

31
2.2.2. Fitness cost associated with resistance
Gassmann et al. (2009) defined fitness cost as a condition in which fitness is
increased by the presence of certain alleles under a stress condition (e.g., resistance to Bt
crops), but fitness is reduced when individuals carrying these alleles are freed from this stress
condition (e.g., resistance to Bt crops in the absence of Bt crops). The existence of fitness
costs associated with resistance to Bt toxins has been intensively discussed for S. frugiperda.
No fitness cost was associated with resistance in populations of S. frugiperda from Puerto
Rico (JAKKA, 2013), but a high fitness cost was detected in populations from Florida
(DANGAL; HUANG, 2015). In this study, we assumed a reduction of 20% in daily larval
viability and a delay of four days in the duration of larval development in the absence of Bt
crops when individuals carried at least one copy of the resistance allele (RR or SR genotypes)
(DANGAL; HUANG, 2015). According to Barros et al. (2010), the daily larval viability on
leaves of non-Bt maize is 0.98; therefore, larval viability was reduced to 0.78 daily. The delay
in larval development was considered by changing the domain of functions (1) and (2) (eqs.
(7) and (8)).
(7)
(8)
2.3. Simulations
To measure the effect of larval dispersal and refuge configuration on the proportion
of resistant larvae, we constructed several spatial arrangements composed of Bt maize and
non-Bt maize in refuge areas with different sizes and configurations. Three refuge
configurations were tested in the simulations: seed mixture, blocks, and strips (Figure 2). The
proportions of the refuges with non-Bt maize ranged from 20 to 50%. Bt maize was
considered to produce a high-dose event, which, according to the US Environmental
Protection Agency guidelines, should kill 99.99% of the susceptible individuals in the field,
with a minimum mortality of 95% of the heterozygotes (US ENVIRONMENTAL

32
PROTECTION AGENCY, 1998). When resistance was complete, we considered that the
survival of Bt-resistant larvae (RR) in Bt maize areas was the same as that of homozygote
larvae (SS) in non-Bt maize. On the other hand, when resistance was incomplete, larval
survival of the RR genotype in Bt maize was reduced by 50%; therefore, the survivorship of
the RR genotype in non-Bt maize was higher even in the presence of a fitness cost associated
with resistance. Thus, in the case of incomplete resistance, resistant and susceptible larvae
competed for non-Bt cells. Figure 3 explains the different values assumed by the parameter
during the larval stage in the different simulated conditions. A summary of the initial
conditions used in our simulations is shown in Table 3.
Table 3. Overview of the initial conditions used in the simulations. All possible combinations among the
described variables were simulated.
Resistance type Larval movement Refuge configuration Refuge size (%)
Incomplete
Complete
0
0.1
0.5
Seed mixture
Blocks
Strips
20
30
40
50
The use of seed mixtures as a refuge strategy has been a concern, as some
investigators have argued that larvae carrying a resistance allele may use refuge areas to reach
advanced instars, and become large enough to survive Bt toxins (sub-lethal dose) (ONSTAD
et al., 2011; YANG et al., 2014; SORGATTO; BERNARDI; OMOTO, 2015). In order to test
this possibility, we considered that Bt toxins would affect only larvae less than six days old
(earlier than 4th instar). For each proportion of non-Bt area and each refuge configuration, we
tested three different rates of larval dispersal (0, 0.1 and 0.5). Each simulation was conducted
during 300 time steps and repeated 50 times. Therefore, the results presented in the next
section are the mean values of the proportion of resistant larvae in these 50 repetitions. All
means were compared by using the Tukey’s test at 5% probability to determine if they were
significantly different.

33
a) b) c)
Figure 2. Refuge strategies designed for simulations of resistance evolution. a) seed mixture, and refuge
areas structured in b) blocks, and c) strips. Non-Bt maize is shown in gray, and Bt maize in black. Spatial
arrangements with 40% refuge areas are illustrated.
Figure 3. Diagram explaining the values assumed for during the larval stage in different simulated
conditions. The standard value of the parameter during the larval stage is equal to 0.98 as described in
eq. (1).
2.4. Results
In the proposed model, the efficiency of resistant larvae in exploiting different areas
depended on three main factors: resistance type, rate of larval movement, and refuge size. The
proportion of resistant insects affected by these factors in each simulation is shown in Figure
4.

34
a) Incomplete resistance (50%) b) Complete resistance (50%)
c) Incomplete resistance (40%) d) Complete resistance (40%)
35
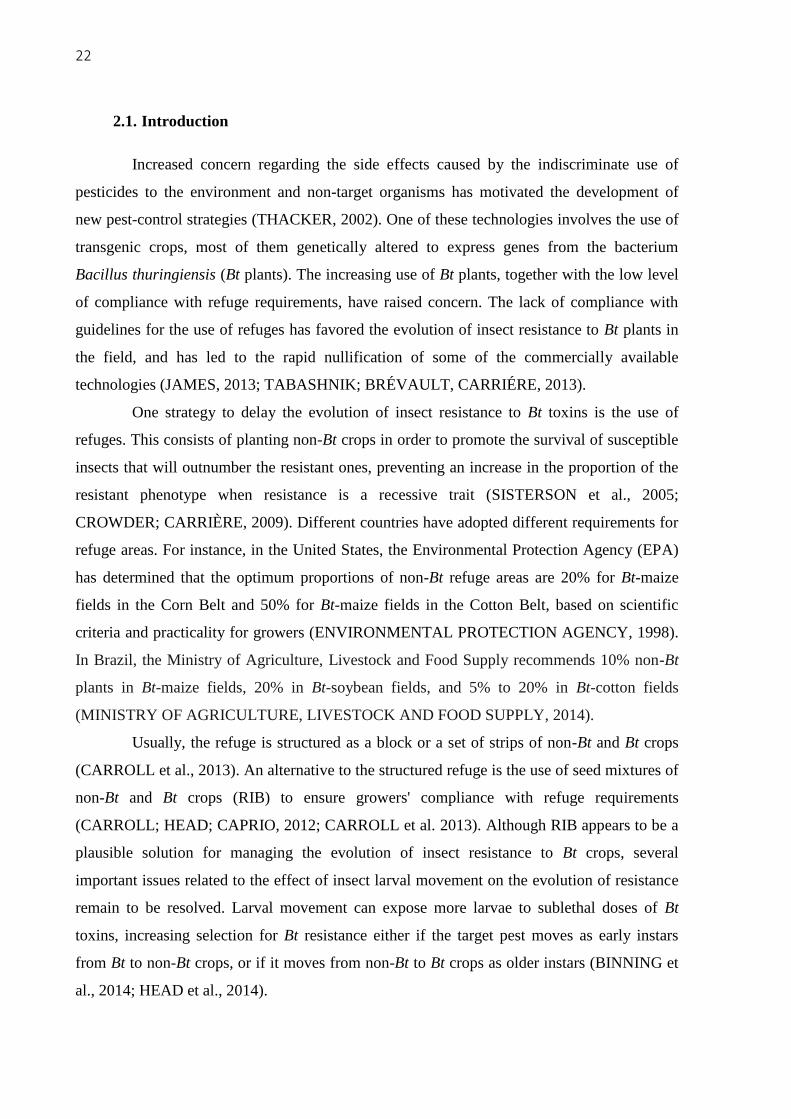
e) Incomplete resistance (30%) f) Complete resistance (30%)
g) Incomplete resistance (20%) h) Complete resistance (20%)
Figure 4. Proportion of resistant larvae measured at t = 300 in each spatial arrangement for different refuge
sizes and resistance types. Seed mixture in black, blocks in gray, and strips in white. Different uppercase
letters above different dispersal rates from the same refuge configuration and different lowercase letters
above different refuge configurations from the same dispersal rate indicate significant differences at the 5%
level (Tukey’s HSD, p < 0.05).

36
2.4.1. Seed mixture configuration
The spatial distribution of S. frugiperda larvae in the seed-mixture configuration is
shown in Figure 5a. No significant difference in the proportion of resistant insects was found
for the 50% seed mixture, because Bt and non-Bt areas were distributed homogeneously and
in the same proportion, reducing the effect of larval movement on the proportion of resistant
larvae. When the seed mixture with non-Bt maize was reduced to 40%, with either complete
or incomplete resistance, the higher the proportion of larvae dispersing to neighbor cells, the
higher was the proportion of resistant insects in the population (Figures 4c and 4d). This
pattern also occurred with a 30% refuge area, when resistance was complete (Figure 4f). With
a 30% refuge area and when resistance was incomplete, larval movement still increased the
proportion of resistant larvae (Figure 4e). However, an intermediate dispersal rate (0.1)
increased this proportion more than a high dispersal rate (0.5). When the refuge size was
reduced to 20% (Figures 4g and h), the dominance of resistant insects was higher and the
patterns of resistance evolution observed in the refuge size of 30% began to disappear since
the spatial configuration became more homogeneous.
2.4.2. Block configuration
The simulations of the evolution of resistance to Bt crops when using refuge areas
structured in a block configuration, arranged in two separate areas, showed a spatial
polarization between an area occupied preferentially by SS larvae (non-Bt block) and another
area occupied by RR larvae (Bt block) (Figure 5b). Heterozygous (RS) larvae predominated at
the boundaries of the Bt and non-Bt areas, since crossings between SS and RR genotypes
occurred in a high proportion in this area. In this refuge arrangement, larval movement
affected the evolution of resistance only in areas with 40 and 50% refuge area, regardless of
the type of resistance (Figures 4a-d), whether incomplete or complete. When the refuge area
was reduced to 30 and 20% of the total, non-Bt blocks were strongly reduced, resulting in a
more homogeneous area, and resistant larvae completely dominated the population.
When resistance was incomplete, the highest proportion of resistant larvae occurred
when the movement rate was equal to 0.1, with refuge sizes of 40 and 50% (Figures 4a and
4c). The same pattern was found in a refuge size of 50%, when resistance was complete
(Figure 4b). The highest proportion of resistant individuals carrying complete resistance to Bt
maize in a refuge size of 40% was observed in the absence of larval movement (Figure 4d).

37
2.4.3. Strip configuration
In this refuge configuration (Figure 5c), the highest proportion of resistant larvae
occurred in the absence of larval movement in most of the refuge sizes tested, regardless of
the type of resistance (incomplete or complete) (Figure 4). Larval movement benefited
susceptible genotypes, accelerating the occupation of non-Bt strips (horizontal movement). In
a refuge size of 20%, the spatial configuration was sufficiently homogeneous to reduce the
effect of larval movement, and the results were not significantly different.
Figure 5. Pattern of larval distribution observed in each refuge configuration after 300 time steps. Insect
genotypes are indicated in the legend. For these simulations, we defined spatial arrangements with 40%
refuge areas, complete resistance and rate of larval movement equal to 0.5.
2.5. Discussion
The increase in the proportion of resistant larvae as larval movement increased in the
seed mixture with complete (30 and 40%) and incomplete (40%) resistance occurred because
susceptible larvae moved to their neighbor cells, which were mostly composed of Bt maize,
resulting in their death, reducing their number and increasing the proportion of resistant larvae
(Figure 6). As the SS larvae moved and died, non-Bt cells became unoccupied and free for
colonization by RS (heterozygous) or RR (homozygous) larvae, which increased in the
population. Such a pattern has been intensively discussed previously, and accelerated
resistance due to larval movement in spatial arrangements composed of Bt and non-Bt crops
has also been modeled (CARROLL et al., 2012). In a field study, Head et al. (2014) also
observed that a low number of Diabrotica speciosa (Coleoptera: Chrysomelidae) larvae were
able to move from Bt to non-Bt areas when a seed mixture was used as a refuge strategy.
According to a field study conducted by Wangila et al. (2013), either heterozygotes or
resistant larvae (in the case of incomplete resistance) might remain in non-Bt maize until they

38
grow large enough to enhance their survival chances in Bt maize, increasing their number in
the population.
In the case of incomplete resistance (30%), a dispersal rate of 0.1 resulted in the
highest proportion of resistant insects, because in this case, survival of resistant larvae in non-
Bt maize was higher than in Bt maize. When the dispersal rate was too high, larvae moved too
rapidly and increased their probability of reaching a cell with Bt maize, resulting in the death
of RS genotypes or reduced survival of RR genotypes.
a) SS larvae b) RR larvae
Figure 6. Scheme of larval movement over the seed-mixture configuration. a) Susceptible larvae (SS) are
able to survive only in non-Bt cells (white). If they move to Bt cells (gray) before reaching the 4th instar,
they die. b) Resistant larvae survive in either non-Bt cells or Bt cells.
The polarization pattern observed in the block configuration occurs because the
border between Bt and non-Bt crops is limited to only one contact zone between them, which
allows susceptible individuals to become isolated from resistant ones in non-Bt areas (Figure
7a). An intermediate movement rate (0.1) accelerated the evolution of resistance in this
configuration because at this rate, dispersal was sufficiently rapid to maintain the flow of
different genotypes between cells near the border between Bt and non-Bt blocks (SS larvae
moved and died in the Bt block), but low enough to prevent them from moving out of the
border. At a higher rate of movement (0.5), susceptible and resistant larvae moved in opposite
directions far from the border, reducing the mortality of susceptible larvae and allowing the
densities of resistant (RR) and susceptible (SS and SR) larvae to increase without affecting
each other (spatial isolation). In a refuge size of 50%, when resistance was complete, resistant
larvae were favored by remaining in Bt cells instead of competing with susceptible larvae for
non-Bt cells, because of the associated fitness cost; therefore, the evidence of the relationship
between larval movement and the proportion of resistant individuals shown was weaker. The
exception occurred when resistance was complete and refuge areas occupied 40% of the total

39
area, because Bt maize occupied most of the area, enhancing the survival of resistant larvae.
The survival of susceptible larvae increased at higher movement rates as they moved far from
the Bt block, and at the same time the survival of resistant larvae decreased because they
moved to non-Bt cells (reduced survival in case of complete resistance, due to fitness cost).
Onstad et al. (2011) obtained similar results when comparing refuge strategies, e.g. a refuge
structured in blocks against a seed mixture. They reported that seed mixtures eliminate the
spatial isolation between the susceptible and resistant phenotypes, differently from block
configurations. In addition, crosses between susceptible and resistant insects were only
observed along the boundaries of Bt and non-Bt blocks. Mating between Bt-resistant adults
took place more frequently in refuge areas structured as blocks than in areas with seed
mixtures, reflecting the expectations of Carroll et al. (2012).
a) Blocks b) Strips
Figure 7. Scheme of larval movement over the spatial configuration: blocks (a) and strips (b). Non-Bt maize
in white and Bt-maize in gray. Heterozygotes (SR) are concentrated at the boundaries between Bt and non-Bt
maize.
In a strip configuration, the more rapid occupation of non-Bt strips by susceptible
larvae prevented resistant genotypes from occupying these areas (Figure 7b). The competitive
advantage of susceptible larvae over resistant larvae in non-Bt strips severely affected the
resistant insects in the case of incomplete resistance, because the competition for non-Bt cells
was more intense, since the resistant larvae reached their highest survival rate in these cells.
With a refuge size of 20%, the spatial configuration was sufficiently homogeneous to reduce
the effect of larval movement. Comparing the refuge structured in strips to the other refuge
strategies tested, we observed that the strip configuration maintained the heterogeneity in the
area (preventing mating between Bt-resistant adults), and continuous areas of non-Bt maize
arranged as strips allowed susceptible insects to persist.

40
Comparing the three configurations, we can conclude that the border between Bt and
non-Bt crops plays an important role in resistance evolution. The block configuration has the
smallest border zone between Bt and non-Bt blocks, and was the least effective arrangement
for delaying evolution. For either complete or incomplete resistance, the population becomes
completely dominated by resistant individuals when the refuge area is less than 40%. The
resulting reduction of borders between Bt and non-Bt blocks favors the isolation of genotypes,
reducing the intercrossing that would “dilute” the resistance allele. On the other hand, the
seed mixture provides the largest border of contact between Bt and non-Bt areas, since they
are randomly distributed. This is the best arrangement to delay resistance evolution, in either
incomplete or complete resistance, when the refuge area is higher than 30%. However, as the
proportion of refuge is reduced, the strip configuration becomes the most suitable. This
occurs, in part, because of the effect of larval movement. However, this is also observed when
the refuge area is 20% and the larvae are not moving. We can conclude that for the seed
mixture, at this proportion (20% refuge), the non-Bt cells are so dispersed and scarce in the
lattice that the effect is similar to a homogeneous Bt crop.
Our findings indicate that the best option for farmers is to arrange refuge areas in
order to maximize the borders of contact between Bt and non-Bt plants, but it is also necessary
to consider the effect of larval movement on the system. The ideal arrangement would
maintain continuous refuge areas to allow the maintenance of SS individuals, but it would
also have the largest possible border zone between refuge and Bt crops. In our case, the strip
configuration satisfied both of these requirements better than the other two arrangements. The
block configuration offered a continuous refuge, but the contact between the different crops
was reduced to one boundary line. On the other hand, the seed configuration offered the
largest contact surface between Bt and non-Bt crops, but it restricted the SS larvae to isolated
“islands” of refuge where exiting these islands would lead them to death and free those cells
for occupation by RR larvae.
Although the spatial structure in agricultural systems is more complex, involving
different crops and even interspecific interactions among insects, including other pests and
beneficial species, our model gives an overall view of the role of the variables studied, such as
the spatial configuration, resistance type, and larval movement, on the evolution of resistance
in insects. In the field, the complexity of each structure would make such a study impossible,
considering all the particularities of each case. Therefore, the computational approach is
advantageous, as it allows for the investigation of the general characteristics of a particular
system. Moreover, modeling is a continuous process and the successful validation of a

41
theoretical model requires a thorough understanding of all variables involved. According to
Rykiel (1996), validation is not a test of a scientific theory, nor is it a statement of the veracity
of a scientific understanding. Validation signifies that a model is acceptable for its purpose
since it meets the predetermined requirements. In this stage, a specific landscape can be
structured in our simulation, considering all of its particularities, to allow for local
comparisons.
2.6. Conclusions
In general, larval movement led to an increase in the proportion of resistant insects in
the population for the seed-mixture configuration, because it favored the occupation of non-Bt
cells by resistant larvae. The opposite trend was observed for the strip configurations, because
larval movement favored the occupation of non-Bt strips by susceptible larvae, which limited
the movement of resistant ones. In the case of the block configurations, the highest proportion
of resistant larvae was observed at a rate equal to 0.1, because it was high enough to maintain
the flow of RR and SS genotypes between Bt and non-Bt blocks, but low enough to prevent
their movement out of these blocks, leading to spatial isolation.
We also combined these results with the effect of the border zone between Bt and
non-Bt areas on the evolution of resistance. In order to successfully fulfill the objectives of a
refuge implementation, it is necessary to establish continuous refuge areas (maintenance of SS
individuals) as well as large border zones to promote crossing between resistant and
susceptible insects. The arrangement that best fulfilled these conditions was the strip
configuration. Indeed, as observed in our results, the strip configuration was most effective in
delaying the evolution of resistance.
2.7. Acknowledgements
AG holds fellowships awarded by FAPESP (2015/10640-2, 2016/00831-8). The
project also receives grants 2014/16277-4 and 2014/16609-7 from FAPESP. Work by WACG
and FLC has been supported by research fellowships from the Conselho Nacional de
Desenvolvimento Científico e Tecnológico.We are also grateful for the assistance of Dr. Jorge
Torres with complementary data on S. frugiperda. We are thankful for the assistance of Dr.
Janet Reid with English revision.

42
References
BARROS, E.M., TORRES, J.B., BUENO, A.F. Oviposition, development, and reproduction
of Spodoptera frugiperda (J.E. Smith) (Lepidoptera: Noctuidae) fed on different hosts of
economic importance. Neotropical Entomology, v. 39, p. 996–1001, 2010.
BINNING, R.R., COATS, J., KONG, X., HELLMICH, R.L. Susceptibility and aversion of
Spodoptera frugiperda (Lepidoptera: Noctuidae) to Cry1F Bt Maize and considerations
for insect resistance management. Journal of Economic Entomology, v. 107, p. 268–374,
2014.
BURKNESS, E.C., HUTCHISON, W.D. Bt pollen dispersal and Bt kernel mosaics: integrity
of non-Bt refugia for lepidopteran resistance management in maize. Journal of Economic
Entomology, v. 105, p. 1773–1780, 2012.
CARROLL, M.W., HEAD, G., CAPRIO, M. When and where a seed mix refuge makes sense
for managing insect resistance to Bt plants. Crop Protection, v. 38, p. 74–79, 2012.
CARROLL, M.W., HEAD, G., CAPRIO, M., STORK, L. Theoretical and empirical
assessment of a seed mix refuge in corn for southwestern corn borer. Crop Protection, v.
49, p. 58–65, 2013.
CERDA, H., WRIGHT, D.J. Modeling the spatial and temporal location of refugia to manage
resistance in Bt transgenic crops. Ecosystem Environtal, v. 102, p. 163–174, 2014.
CROWDER, D.W., CARRIÈRE, Y. Comparing the refuge strategy for managing the
evolution of insect resistance under different reproductive strategies. Journal of
Theoretical Biology, v. 261, p. 423–430, 2009.
DANGAL, V., HUANG, F. Fitness costs of Cry1F resistance in two populations of fall
armyworm, Spodoptera frugiperda (J.E. Smith), collected from Puerto Rico and Florida.
Journal of Invertebrate Pathology, v. 127, p. 81–86, 2015.

43
DEANGELIS, D.L., GRIMM, V. Individual-based models in ecology after four decades.
F1000Prime Reports, v.6, doi: 10.12703/P6-39, 2014
ELMO, E.P., FERNANDES, M.G., DEGRANDE, P.E., CESSA, R.M.A., SALOMÃO, J.L.,
NOGUEIRA, R.F. Spatial distribution of plants infested with Spodoptera frugiperda (J.E.
Smith) (Lepidoptera: Noctuidae) on corn crop. Neotropical Entomology, v. 35, p. 689–
697, 2006.
ENVIRONMENTAL PROTECTION AGENCY. Final Report of the Subpanel on Bacillus
thuringiensis (Bt) Plant-Pesticides and Resistance Management, 1998. 61 p. Available
from http://www2.epa.gov/sap (accessed September 2015).
FARIAS, J.R., ANDOW, D.A., HORIKOSHI, R.J., SORGATTO, R.J., FRESIA, P.,
SANTOS, A.C. DE, OMOTO, C. Field-evolved resistance to Cry1F maize by Spodoptera
frugiperda (Lepidoptera: Noctuidae) in Brazil. Crop Protection, v. 64, p. 150–158, 2014.
FARIAS, P.R.S., BARBOSA, J.C., BUSOLI, A.C. Spatial distribution of fall armyworm,
Spodoptera frugiperda (J.E. Smith) (Lepidoptera: Noctuidae), on corn crop. Neotropical
Entomology, v. 30, p. 681–689, 2001.
GARCIA, A., CÔNSOLI, F.L., GODOY, W.A.C., FERREIRA, C.P. A mathematical
approach to simulate spatio-temporal patterns of an insect-pest, the corn rootworm
Diabrotica speciosa (Coleoptera: Chrysomelidae) in intercropping systems. Landscape
Ecology, v. 29, p. 1531–1540, 2014.
GASSMANN, A.J., CARRIÈRE, Y., TABASHNIK, B.E. Fitness costs of insect resistance to
Bacillus thuringiensis. Annual Review of Entomology, v. 54, p. 147–163, 2009.
HARDY, G.H. Mendelian proportions in a mixed population. Science, v. 8, p. 49–50, 1908.
HEAD, G., CAMPBELL, L.A., CARROLL, M., CLARK, T., GALVAN, T., HENDRIX,
W.M., PRASIFKA, P.L., PRICE, P., STORER, N.P., STORK, L. Movement and survival
of corn rootworm in seed mixtures of SmartStax® insect-protected corn. Crop
Protection, v. 58, p. 14–24, 2014.

44
HIEBELER, D. Spatially correlated disturbances in a locally dispersing population model. J.
Theoretica Biology, v. 232, p. 143–149, 2005.
HUANG, F., QURESHI, J.A., MEAGHER, R.L.JR., REISIG, D.D., HEAD, G.P., ANDOW,
D.A., NI, X., KERNS, D., BUNTIN, G.D., NIU, Y., YANG, F., DANGAL, V. Cry1F
resistance in fall armyworm Spodoptera frugiperda: single gene versus pyramided Bt
maize. PLoS ONE, v. 9, n. 11, e112958, 2014.
JAKKA, S.R.K. Characterization of field evolved resistance to transgenic Cry1Fa maize in
Spodoptera frugiperda, 2013. 149 p. Dissertation - University of Tennessee, 2013.
JAMES, C. Global status of commercialized biotech/GM crops. New York: ISAAA, 2013.
n. 46. 332 p. ISAAA Briefs.
JORGENSEN, S.E., CHON, T.S. Model types available for Ecological Modelling. In:
JORGENSEN, S.E.; CHON, T.S.; FRIEDRICH, R. (Eds.). Handbook of Ecological
Modelling and Informatics. Southampton, UK: WIT Press, 2009. p. 9-40.
KANG, J., HUANG, F., ONSTAD, D.W. Modeling evolution of resistance of sugarcane
borer (Lepidoptera: Crambidae) to transgenic Bt corn. Environmental Entomology, v.
45, p. 1084–1104, 2014
KRANTHI, K.R., KRANTHI, N.R. Modelling adaptability of cotton bollworm, Helicoverpa
armigera (Hübner) to Bt cotton in India. Current Science, v. 87, p. 1096–1107, 2004.
MINISTRY OF AGRICULTURE, LIVESTOCK AND FOOD SUPPLY. Recomendações de
refúgio preconizadas pelas empresas detentoras das tecnologias. Memória da 1ª reunião do
GTMR (Grupo Técnico-Científico sobre Manejo de Resistência), 2014. 4 p. Available
from https://www.slideshare.net/ruralbr/memria-da-1-reunio-do-gtmr (acessed September
2015).

45
OMOTO, C., BERNARDI, O., SALMERON, E., SORGATTO, R.J., DOURADO, P.M.,
CRIVELLARI, A., CARVALHO, R.A., WILLSE, A., MARTINELLI, S., HEAD, G.P.
Field-evolved resistance to Cry1Ab maize by Spodoptera frugiperda in Brazil. Pest
Management Science, doi 10.1002/ps.4201, 2016.
ONSTAD, D.W., MITCHELL, P.D., HURLEY, T.M., LUNDGREN, J.G., PORTER, R.P.,
KRUPKE, C.H., SPENCER, J.L., DIFONZO, C.D., BAUTE, T.S., HELLMICH, R.L.,
BUSCHMAN, L.L., HUTCHISON, W.D., TOOKER, J.F. Seeds of Change: Corn Seed
Mixtures for Resistance Management and Integrated Pest Management. Journal of
Economic Entomology, v. 104, p. 342–352, 2011.
SISTERSON, M.S., CARRIÈRE, Y., DENNEHY, T.J., TABASHNIK, B.E. Evolution of
resistance to transgenic crops: Interaction between insect movement and field distribution.
Journal of Economic Entomology, v. 98, p. 1751–1762, 2005.
SORGATTO, R.J., BERNARDI, O., OMOTO, C. Survival and development of Spodoptera
frugiperda and Chrysodeixis includens (Lepidoptera: Noctuidae) on Bt cotton and
implications for resistance management strategies in Brazil. Environmental Entomology,
v. 44, p. 186–192, 2015.
SPARKS, A.N. A review of the biology of the fall armyworm. Florida Entomologist, v. 62,
p. 82–87, 1979.
TABASHNIK, B.E., BRÉVAULT, T., CARRIÈRE, Y. Insect resistance to Bt crops: lessons
from the first billion acres. Nature Biotechnology, v. 31, p. 510–521, 2013.
TÉLLEZ-RODRÍGUEZ, P., RAYMOND, B., MORÁN-BERTOT, I., RODRÍGUEZ-
CABRERA, L., WRIGHT, D.J., BORROTO, C.G., AYRA-PARDO, C. Strong
oviposition preference for Bt over non-Bt maize in Spodoptera frugiperda and its
implications for the evolution of resistance. BMC Biology, v. 12, n. 48, doi: 0.1186/1741-
7007-12-48, 2014.
THACKER, J.R.M. An Introduction to Arthropod Pest Control. Cambridge: Cambridge
University Press, 2002. 380 p.

46
TYUTYUNOV, Y., ZHADANOVSKAYA, E., BOURGUET, D., ARDITI, R.. Landscape
refuges delay resistance of the European corn borer to Bt-maize: A demo-genetic dynamic
model. Theoretical Population Biology, v. 74, p. 138–146, 2008.
VÉLEZ, A.M., SPENCER, T.A., ALVES, A.P., MOELLENBECK, D., MEAGHER, R.L.,
CHIRAKKAL, H., SIEGFRIED, B.D. Inheritance of Cry1F resistance, cross-resistance
and frequency of resistant alleles in Spodoptera frugiperda (Lepidoptera: Noctuidae).
Bulletin of Entomological Research, v. 103, p. 700–713, 2013.
VÉLEZ, A.M., SPENCER, T.A., ALVES, A.P., CRESPO, A.L.B., SIEGFRIED, B. D.
Fitness costs of Cry1F resistance in fall armyworm, Spodoptera frugiperda. Journal of
Applied Entomology, v. 128, p. 315–325, 2014.
VILARINHO, E.C., FERNANDES, O.A., HUNT, T.E., CAIXETA. D.F. Movement of
Spodoptera frugiperda adults (Lepidoptera: Noctuidae) in maize in Brazil. Florida
Entomologist, v. 94, p. 480–488, 2011.
WANGILA, D.S., LEONARD, B.R., GHIMIRE, M.N., BAI, Y., ZHANG, L., YANG, Y.,
EMFINGER, K.D., HEAD, G.P., YANG, F., NIU, Y., HUANG, F. Occurrence and larval
movement of Diatraea saccharalis (Lepidoptera: Crambidae) in seed mixes of non-Bt and
Bt pyramid corn. Pest Management Science, v. 69, p. 1163–1172, 2013.
YANG, F., KERNS, D.L., HEAD, G.P., LEONARD, B.R., LEVY, R., NIU, Y., HUANG, F.
A challenge for the seed mixture refuge strategy in Bt maize: impact of cross-pollination
on an ear-feeding pest, corn earworm. PLoS ONE, v. 9, n. 11, e112962, 2014.

47
3. DELIMITING STRATEGIC ZONES FOR THE DEVELOPMENT OF
FALL ARMYWORM (LEPIDOPTERA: NOCTUIDAE) ON CORN IN
THE STATE OF FLORIDA, BASED ON THERMAL
REQUIREMENTS AND GIS MODELING
ABSTRACT
The fall armyworm, Spodoptera frugiperda (J. E. Smith), cannot survive
prolonged periods of freezing temperatures, thereby limiting where it can
overwinter in North America. Climate change is anticipated to reduce the
frequency of freeze days in Florida over the decades, with the potential
consequence of a significant expansion of the overwintering range, which in
North America was assessed as south of ~27°N in the last century. To assess this
possibility, the development of the fall armyworm on corn leaves, one of the main
host plants in the United States, was determined at five constant temperatures
ranging from 14°C to 30°C. Based on the development time, the thermal constant
and the lower threshold temperature were used to estimate the number of
generations of fall armyworm at 42 locations in the state of Florida, from 2006 to
2016. Maps were constructed to provide a visual description of the interpolated
data, using GIS (Geographic Information System). The highest number of
generations was observed in the counties farther south, an area that showed the
highest temperatures during the years and plays a strategic role in maintaining fall
armyworm populations in corn fields. Additionally, we conclude that in the
absence of freeze periods, fall armyworm should be able to overwinter as far north
as ~29°N.
Keywords: Spodoptera frugiperda; Climate change; Spatial distribution
3.1. Introduction
Spodoptera frugiperda (J. E. Smith) (Lepidoptera: Noctuidae) is a major insect pest
that damages many field and vegetable crops in the Western Hemisphere, from southern
Argentina to southern Canada (SPARKS, 1979). One of its main host plants is corn (Zea

48
mays L.), which is planted as field corn in northern Florida and sweet corn in southern Florida
(FLORIDA CORN INSECT IDENTIFICATION GUIDE, 2016). Since insects are
poikilothermic animals, they need to develop strategies to survive more extreme temperatures
at higher and lower latitudes (LEE; DELINGER, 1991). In particular, the fall armyworm does
not diapause and its overwintering range is restricted to regions where larval development is
possible throughout the year (BARFIELD et al., 1978, WOOD; POE; LEPPLA, 1979).
Although it is important to understand the relationship between insect distribution and
temperature in order to develop pest-management plans, most studies detailing the effects of
temperature on the development of fall armyworm populations in North America are more
than 25 years old (HOGG; PITRE; ANDERSON, 1982, ALI; LUTTRELL; SCHNEIDER,
1990). The results have been generally consistent with significant deleterious effects
becoming apparent above 28°C and below 20°C, regardless of the diet of the armyworms
(BARFIELD et al., 1978, ALI; LUTTRELL; SCHNEIDER, 1990). Given these constraints, it
is not surprising that climatic conditions influence the geographic distribution of fall
armyworm in the continental United States, and it is necessary to know the effects on current
populations, which may have changed in recent decades.
Snow and Copeland (1969), using insect survey reports composed of larval
collection data and data from captures of adult males in traps, defined areas where the
generations are continuous. Waddill et al. (1982) monitored the seasonal abundance of fall
armyworm in Florida, concluding that they were most abundant in the south during the spring
and more numerous at locations farther north during the summer and fall. These observations
led to the conclusion that the northern limit for fall armyworm overwintering in North
America is ~27°N, unless winters are unusually mild (SNOW; COPELAND, 1969; WOOD;
POE; LEPPLA, 1979, WADDILL et al., 1982). Several hypotheses have been proposed to
describe the seasonal survival strategies of fall armyworm, however many of the experiments
needed to test these ideas have not been completed (BARFIELD; STIMAC; KELLER, 1980).
An important technological development since these studies is GIS (Geographic
Information System) modeling, which allows representation of the relationship between
temperature and spatial distribution (ELIGIO et al., 2015). GIS users can computationally
analyze geospatial data, including collection, analysis, manipulation, and representation of the
data set (BYRNE; PICKARD, 2016). This approach has been used succesfully in different
studies involving the spatial dynamics of fall armyworm. Clark et al. (2007) applied GIS to
map gene flow, using genetic data from Mexico, the United States, Brazil, Puerto Rico and
Argentina. Westbrook et al. (2016) developed a GIS model based on cumulative degree-days

49
for simulated development of corn plants and larval fall armyworm, and correlated this with
corn distribution data to describe migration.
In organisms such as fall armyworm where body temperature is determined by the
environment, the development rate generally changes with temperature. A surrogate value for
the lowest temperature that can sustain development is the lower developmental threshold,
also referred to as basal temperature (Tb). The estimation of the number of generations
geographically, based on the threshold temperature and thermal constant, has been widely
applied in entomological studies, providing useful results (NAVA et al., 2007; REDAELLI;
OURIQUE, 2015).
In the present study, we evaluated the development time of the egg, larval and pupal
stages, and determined fecundity and adult longevity of S. frugiperda fed on corn leaves at
five different temperatures (14, 18, 22, 26, 30°C) in order to identify the effects of
temperature on the development of a current fall armyworm population in the United States.
These experiments will update development parameters and identify possible changes in the
thermal requirements of fall armyworm over the last 26 years. Then, the thermal constant and
the lower temperature threshold were used to estimate the number of fall armyworm
generations at constant temperatures for 42 locations in the state of Florida from 2006 to
2016. These values were interpolated, creating surface maps of the predicted number of
generations of S. frugiperda in Florida, in order to identify the locations with the potential for
high population development of this insect pest. This analysis identifies locations in Florida at
high risk for becoming significant reservoirs of overwintering fall armyworm if the number of
freeze days declines, using a methodology that has not been applied previously to S.
frugiperda populations.
3.2. Material and methods
3.2.1. Spodoptera frugiperda colony
Fourth and fifth-instar larvae of S. frugiperda were collected from corn plants at the
Plant Science Research and Education Unit, Citra, FL (29°24'42.9"N, 082°6'35.34"W), in
September 2016. They were maintained on corn leaves (‘Trucker’s Favorite’) under
laboratory-controlled conditions (25±1 °C, 70 ± 10% RH), and a photoperiod of 14h:10h
[L:D] until pupation. Emerging adults were fed a 10% water and honey solution and the eggs
were collected daily.

50
3.2.2. Biology of S. frugiperda on corn leaves at different temperatures
The experiment was conducted at the USDA - ARS, Center for Medical, Agricultural
and Veterinary Entomology laboratory in Gainesville, FL. Five Biochemical Oxygen
Demand (BOD) climate chambers were programmed under five different temperatures (14°C,
18°C, 22°C, 26°C and 30° ± 1°C) and a photoperiod of 14h:10h [L:D]. The experiment
started after one generation of the field-collected colony was reared in the laboratory.
For studies on larval development in each temperature, 96 newly hatched larvae (<
12h) were placed individually in 32-well high-intensity polystyrene rearing trays with clear
polyethylene lids (Frontier Agricultural Sciences, Newark, DE), which were lined on the
bottom with filter paper. Each of the six replications per treatment was performed using 16
larvae. The insects were maintained in the rearing trays until pupation. Each larva was
provided corn leaves (V4 – V8 stages) washed with a 1% sodium hypochlorite solution,
rinsed in deionized water and dried on paper towels. Leaves were replaced daily, and two
times a week the old leaves and frass were removed from the wells. Corn plants were grown
in a greenhouse in pots filled with soil up to 10 cm from the top edge. They were sown at a
density of four plants per pot.
Adult developmental metrics included the duration of the pre-oviposition and
oviposition periods, fecundity and adult longevity. After the pupae emerged from the different
temperature treatments, moth pairs were placed in a single-pair mating system similar to that
described by Stuhl et al. (2008). These small oviposition cages consisted of a cylindrical 473-
mL plastic food container (Solo Cup Co., Urbana, IL) lined with a 7.6-cm coffee filter (Bunn,
Springfield, IL). Holes (5 mm) were made in the bottoms of the containers to allow for
airflow, and one hole (1.5 cm) was made in each lid (Solo, ML8) so that a braided cotton roll
(Richmond Dental, Charlotte, NC) could be inserted. The cage was inverted and placed over a
177-mL container (S306, Sweetheart Products Group, Owings Mills, MD), which held a
plastic soufflé cup (Solo, P100) with a 10% honey solution. This system allowed for adult
nourishment by absorption of liquids.
Because only one female oviposited at 18°C and no adults were collected at 14°C, all
eggs examined for the embryonic development time were from females reared at 26°C. The
eggs were exposed to the temperature regimes within 12 h after oviposition and held until
neonates hatched. For each temperature, 12 replications with 50 eggs each were allocated in
Petri dishes lined on the bottom with filter paper, and maintained in each of the BOD climate
chambers.

51
3.2.3. Determination of strain identity
Fall armyworm can be subdivided into two "host strains" with different host-plant
preferences that are morphologically indistinguishable, but genetically distinct (NAGOSHI;
SILVIE; MEAGHER, 2007). The molecular markers indicative of the "corn-strain" typically
predominate in larvae collected from corn and sorghum, while the "rice-strain" markers are
the majority in larvae from turf grass and alfalfa. Twenty-seven adults each that completed
development at 22, 28, and 30°C, were analyzed for their host strain. Unambiguous results
were obtained for 69 specimens. Strain determination was completed by analysis of a portion
of the Triosephosphate isomerase (Tpi) gene as previously described (MURÚA et al., 2015).
Genomic and mitochondrial DNA for use in polymerase chain reaction (PCR) amplifications
was isolated from individual specimens using Zymo-Spin III columns (Zymo Research,
Orange, CA) as described previously (NAGOSHI; SILVIE; MEAGHER, 2007). PCR
amplification of Tpi sequences with appropriate primers produces an approximately 500-bp
fragment that includes a variable-length intron that is typically about 250 bp in length
(NAGOSHI, 2012). The PCR fragment carries an MspI site present in both strains within the
Tpi-412F primer region, and a second MspI site that is present only in the strain preferring
corn. The presence of the MspI site results in two bands, a diagnostic 162-bp fragment and a
larger one that contains the variable-length intron. Amplification of the Tpi gene used primers
Tpi-412F (5’-GGTTGCCCATGCTCTTGAGTCCGGACTGAAG-3’) and Tpi-1140R (5’-
AGTCACTGACCCACCATACTG-3’).
3.2.4. Statistical Analysis and GIS modeling
Treatment mean values were analyzed by ANOVA and were compared using
Tukey’s test (P ≤ 0.05) with the R software (R DEVELOPMENT CORE TEAM, 2008). Prior
to this analysis, the results were tested for homogeneity (BURR; FOSTER, 1972), normality
and independence of the residuals (SHAPIRO; WILK, 1965). After the durations of the
developmental stages at different temperatures were determined, the lower threshold
temperature ( ) and thermal constant ( ) were calculated using the following linear equation
(WORNER, 1992; HADDAD; PARRA; MORAES, 1999):

52
where is the development rate (d–1) and is the temperature (°C). The lower threshold
temperature was calculated as the ratio between angular and linear coefficients of the line
) and the thermal constant ( ) was obtained using the quotient ( (CAMPBELL et
al.. 1974). Using a temperature database (FLORIDA AUTOMATED WEATHER
NETWORK, IFAS, UNIVERSITY OF FLORIDA, 2017) corresponding to 42 georeferenced
locations in Florida (Figure 8), it was possible to estimate the number of generations (G) of
fall armyworm from 2006 to 2016 in each location per year, using the following mathematical
relationship (ARNOLD, 1959):
where is the number of days and is the mean temperature of the month .
Figure 8. Locations in the state of Florida where the G values were calculated.
53
The ArcMap application within ArcGis 10.3 (ESRI, 2014) was used to organize and
represent the values of from 2006 to 2016 in shapefiles. ArcMap is the environment used to
explore GIS, organizing spatial data and representing them on a map. Then, IDW (Inverse
Distance Weighting) interpolation was applied to obtain a surface, providing a visual
description of the data, using the Geostatistical Analyst Tool from ArcGis 10.3.
3.3. Results
3.3.1. Strain analysis
Because larvae were collected from corn we expected these to be primarily of the
strain that prefers that host (corn-strain). This was confirmed using molecular markers. Of the
81 specimens tested, 64 were corn-strain, 5 were rice-strain, and 12 gave no results. During
the experiment, no significant strain differences were observed, so the data were pooled.
3.3.2. Development and fecundity of S. frugiperda at different temperatures
Fall armyworm completed its development at all temperatures except 14°C.
Temperature significantly influenced the development cycle of the insect from egg to adult.
The incubation period of eggs was 13.2 days at 14°C and 2.0 days at 30°C, with significant
differences among the results for all temperatures used (F4,2071 = 392.7, P < 0.001). Larval
development took 129 days at 14°C and 14.6 days at 30°C (F4,241 = 4459.9, P < 0.001); pupal
development took 24.5 days at 14°C and 6.6 days at 30°C (F3,133 = 686.1, P < 0.001) (Table
4).

54
Table 4. Development time (days) (mean ± SE) of the different life stages of Spodoptera frugiperda recorded at
five constant temperatures*
Temperature Development
(days)
(°C) Egg Larva Pupa
30 2.0 ± 0a 14.6 ± 0.2a 6.6 ± 0.1a
26 3.0 ± 0b 18.3 ± 0.2b 9.6 ± 0.1b
22 4.4 ± 0.1c 27.5 ± 0.2c 14.6 ± 0.2c
18 6.0 ± 0d 45.6 ± 0.5d 24.5 ± 0.6d
14 13.2 ± 0.1e 129.0 ± 2e –
*Means followed by the same letter in a column are not different from one another by Tukey's test at 5%
Fecundity was highest at 26°C and lowest at 30°C, with a mean of 1071 and 790.1
eggs per female, respectively (Table 5). Temperature inversely affected the longevity of the
adults, ranging from 8.8 days at 30°C to 19.5 days at 18°C (F3,55 = 2.5, P < 0.001) (Table 5).
Table 5. Mean duration (± SE) of the pre-oviposition, oviposition period (days) and fecundity (eggs per female)
of Spodoptera frugiperda recorded at four constant temperatures*
Temperature
(°C)
Pre-oviposition Oviposition Longevity Number of eggs
30 4.8 ± 0.8a 5.2 ± 0.4a 8.8 ± 0.6a 790.1 ± 105.3a
26 4.9 ± 0.3a 8.7 ± 0.4b 14.8 ± 0.5b 1071.0 ± 80.6b
22 6.0 ± 0.6a 11.4 ± 0.7c 18.4 ± 1.0c 993.5 ± 109.4ab
18 – – 19.5 ± 0.5 d –
*Means followed by the same letter in a column are not different from one another by Tukey's test at 5%
At 18°C, the insect’s metabolism apparently slowed, as activity was reduced and
only one female successfully oviposited (total of 50 eggs). Therefore, it was not possible to
compare the results with other temperatures. There were no significant differences in the pre-
oviposition period, which ranged from 4.8 to 6 days (F2,51 = 2.1, P = 0.12) (Table 5). The
oviposition period was inversely affected by temperature, ranging from 5.2 days at 30°C to
11.4 days at 22°C (F2,51 = 40.5, P < 0.001) (Table 5). At 14°C, the insects were not able to
reach the adult stage.

55
Using the development time data (Table 4) and applying the linear model (eq. (9)), it
was possible to obtain the values of and , comparing to the values obtained 26 years ago
by Ali et al. (1990) (Figure 9; Table 6).
Figure 9. Rate of development versus temperature for fall armyworm a) egg masses, b) larval stage reared
on corn, and c) pupae, estimated with a linear model fitted to the data for development time (continuous
line). The dashed line represents the model obtained by Ali et al. (1990).
Table 6. The lower developmental threshold temperature ( ) and thermal constant in degree-days (K) estimated
for the immature stages of Spodoptera frugiperda in the present study and by Ali et al. (1990)
Parameter Study Egg Larva Pupa Egg-adult
Current 11.7 12.5 14.1 13.2
Ali et al.
(1990)
12.7 11.8 13.7 12.2
Current 39.5 250 108.7 400
Ali et al.
(1990)
39.9 204.1 113.6 357.6
Based on the threshold temperature and the thermal constant obtained, it was
possible to use the eq. (10) and produce maps representing the estimated values of G from
2006 to 2016 (Figure 10). In order to facilitate the visualization, the number of generations
per year was represented in different categories: Low (< 7), Medium (7 – 9), High (9 – 11),
Extremely high (> 11).

56
Figure 10. Interpolated maps indicating the estimated number of generations per year ( ) from 2006 to
2016.

57
Most maps clearly showed fewer generation cycles in the north (above ~29°N) and
an increasing number of cycles southward. This pattern changed drastically in 3 separate
years: in 2010, the zone corresponding to the category High disappeared; in 2015, the zones
corresponding to the categories High and Medium expanded northward and a new zone
corresponding to an area that exceeded 11 generations per year appeared (Extremely High); in
2016, the pattern observed was very similar to 2015, but the zones receded from the north.
Maps were also generated to indicate the overwintering areas where the insect
generations are uninterrupted, i.e, all months show G > 0 (Figure 11). For all years, the line
delimiting the area with uninterrupted generations is located between 28°N and 29°N, except
in 2010. In 2010, the line moved abruptly southward, reaching latitude 26°N.

58
Figure 11. Maps indicating the probable overwintering areas (uninterrupted generations) based on the
monthly values of .

59
3.4. Discussion
Except for the pre-oviposition period, the data showed that temperature significantly
affected the development, reproduction, and longevity of S. frugiperda. The rate of
development as well as the parameters of the linear model were very similar to those found by
Ali et al. (1990). Our nearly wild colony that fed on plant material required slightly longer to
develop at warmer temperatures for larval development, and slightly shorter for egg
development. The lower threshold temperatures and thermal constants were similar in the two
studies, except for the thermal constant corresponding to the larval stage, indicating that the
present population required more heat and consequently higher temperatures to pupate when
compared to the population from 1990.
Ali et al. (1990) used populations that had been maintained for many generations,
and therefore the differences can be explained in part by an artifact of laboratory rearing
(MASON; PASHLEY; JOHNSON, 1987). However, another explanation may be the time
interval separating these populations. Over these 26 years, fall armyworm populations may
have undergone genetic changes, influenced by selection pressure from climate changes,
leading them to adapt their metabolism to new situations that involve higher temperatures
(DILLON; FRAZIER, 2013). A more detailed genetic study would be necessary to verify this
hypothesis.
Regarding the maps, the temperature in Florida gradually increases toward the south,
implying increased numbers of generations. In 2010, Florida faced the coldest winter in 30
years due to a combination of cold Arctic streams of air and effects of the El Niño climate
phenomenon, experiencing temperatures near –4°C in east-central Florida (INCH et al.,
2014). As a result, the number of insect generations decreased throughout the state. On the
other hand, 2015 was the warmest year on record in Florida, followed by 2016, resulting in an
increase in the number of fall armyworm generations throughout the state (UFWEATHER,
2015; NOAA 2015). If temperatures remain high, farmers may face new challenges to deal
with an increase in population numbers of this insect pest.
Figure 11 indicates that locations farther north (darker area) do not provide
conditions where fall armyworm populations can be maintained year-round. In these regions,
the value of G was equal to 0 from December to February, i.e. the Northern Hemisphere
winter. Therefore the results suggest that these populations periodically receive migratory
adults from the south. Fall armyworm populations within the light-gray area on the map
(uninterrupted generations) act as a reservoir of individuals for migration after colder seasons.

60
The occurrence of these reservoir areas in Florida was suggested by researchers in the early
1900s (WALTON; LUGINBILL, 1916; LUGINBILL, 1928), and uninterrupted or continuous
generations were determined to occur south of latitude ~27°N, unless winters were unusually
mild (SNOW; COPELAND, 1969; WOOD, POE, LEPPLA, 1979, WADDILL et al., 1982).
This boundary was questioned by other researchers, who suggested that fall armyworms could
survive winter conditions farther north (DEW, 1913; HINDS; DEW, 1915; TINGLE;
MITCHELL, 1977; BARFIELD; STIMAC; KELLER, 1980). The overwintering boundary of
~27°N is farther south than the limit estimated from our study. In fact, we observed that some
fall armyworm larvae were able to survive for more than 120 days at 14°C, although no adults
were produced. We conclude that fall armyworms should be able to overwinter in latitudes
between 28°N and 29°N, if host plants are available to maintain continuous generations and
no drastic temperature changes occur. In 2010, for instance, temperatures dropped unusually
low during the winter, which restricted the overwintering region to a small portion of the state
located farther south, covering the following counties: St. Lucie, Martin, Hendry, Palm
Beach, Collier, Broward, Monroe and Miami-Dade. This particular result, combined with the
observation of a larger number of generations in this same area (Figure 11), allow us to
conclude that this region is strategic for fall armyworm populations.
3.5. Acknowledgments
AGG holds a fellowship awarded by FAPESP (2015/10640-2, 2014/16609-7) and
held a Foreign Research Fellowship awarded by FAPESP (2016/00831-8) during the project
execution. We thank Amy Rowley for technical assistance.
References
ALI, A., LUTTRELL, R.G., SCHNEIDER, J.C. Effects of Temperature and Larval Diet on
Development of the Fall Army worm (Lepidoptera: Noctuidae). Annals of the
Entomological Society of America, v. 83, p. 725–733, 1990.
ARNOLD, C.Y. The determination and significance of the base temperature in a linear heat
unit system. Proceedings of the American Society of Horticulture Science, v. 74, p.
430–445, 1959.

61
BARFIELD, S.C.; MITCHELL, E.R.; POE, S. L. A Temperature-Dependent Model for Fall
Armyworm Development. Annals of the Entomological Society of America, v .71, p.
70–74, 1978.
BARFIELD, C.S., STIMAC, J.L., KELLER, M.A. State-of-the-art for predictiong damaging
infestation of fall armyworm. Florida Entomologist, v. 63, p. 364–375, 1980.
BURR, I.W., FOSTER, L.A. A test for equality of variances. West Lafayette, IN: University
of Purdue, 1972. 26 p.
BYRNE D., PICKARD, A.J. Neogeography and the democratization of GIS: a metasynthesis
of qualitative research. Information Communication Society, v. 11, p. 1505–1522, 2016.
CAMPBELL A., FRAZER, B.P., GILBERT, N., GUTIERREZ, A.P., MACKAUER, M.
Temperature requirements of some aphids and their parasites. Journal of Applied
Ecology, v. 11, p.431–438, 1974.
CLARK, P.L., MOLINA-OCHOA, J., MARTINELLI, S., SKODA, S.R., ISENHOUR, D.J.,
LEE, D.J., KRUMM, J.T., FOSTER, J.E. Population variation of the fall armyworm,
Spodoptera frugiperda, in the Western Hemisphere. Journal of Insect Science, v. 7, p. 1-
5, 2007.
DEW, J.A. Fall armyworm Laphygna frugiperda (S & A). Journal of Economic Entomoly, v.
6, p. 362–366, 1913.
DILLON, M.E., FRAZIER, M.R. Thermodynamics Constrains Allometric Scaling of Optimal
Development Time in Insects. PLoS ONE, v. 8, n. 12, e84308.
https://doi.org/10.1371/journal.pone.0084308, 2013.

62
ELIGIO, V.V., LOZANO, L.B., CASTANEDA, R.P., GARCIÁ, G.G., VILLALON, M.L.
Regional-Scale Spatio-Temporal Analysis of Anastrepha ludens (Diptera: Tephritidae)
Populations in the Citrus Region of Santa Engracia, Tamaulipas, Mexico. Journal of
Economical Entomoogy, v. 108, p. 1655–1664, 2015.
ESRI. ArcGIS Desktop: Version 10.3. Environmental Systems Research Institute. Redlands,
CA, 2014.
FLORIDA AUTOMATED WEATHER NETWORK, IFAS, UNIVERSITY OF FLORIDA.
Archived Weather Data. https://fawn.ifas.ufl.edu/. (accessed 19 August 2017).
FLORIDA CORN INSECT IDENTIFICATION GUIDE. Summary of Florida corn
production. http://erec.ifas.ufl.edu/fciig/. (accessed 11 November 2016).
HADDAD M.L., PARRA, J.R.P, MORAES, R.C.B. Métodos para estimar os limites
térmicos inferior e superior de desenvolvimento de insetos. Piracicaba, São Paulo,
Brazil :FEALQ, 1999. 29 p.
HINDS, W.E., DEW, J.A. The grass worm or fall armyworm. Montgomery, AL: Alabama
Agricultural Experiment Station Bulletin, 1915.
HOGG, D.B., PITRE, H.N., ANDERSON, R.E. Assessment of Early-Season Phenology of
the Fall Armyworm (Lepidoptera: Noctuidae) in Mississippi. Environmental
Entomology, v.11, p. 705–710, 1982.
INCH, S., STOVER, E., DRIGGERS, R., LEE, R.F. Freeze Response of Citrus and Citrus
related Genotypes in a Florida Field Planting. HortScience, v. 49, p. 1010–1016, 2014.
LEE, R.E., DELINGER, D.E. Insects at low temperatures. London, United Kingdom :
Chapman & Hall, 1991. 513 p.

63
LUGINBILL, P. The fall armyworm, Washington, DC: USDA, 1928. 91 p. Technical
Bulletin of the U.S. Department of Agriculture.
MASON, L.J., PASHLEY, D.P., JOHNSON, S.J. The laboratory as an altered habitat:
Phenotypic and genotypic consequences of colonization. Florida Entomologist, v. 70, p.
49–58, 1987.
MURÚA, M.G., NAGOSHI, R.N., DOS SANTOS, D.A, HAY-ROE, M.M., MEAGHER,
R.L., VILARDI, J.C. Demonstration Using Field Collections that Argentina Fall
Armyworm Populations Exhibit Strain-Specific Host Plant Preferences. Journal of
Economic Entomology, v. 108, p. 2305–2315, 2015.
NAGOSHI, R.N. Improvements in the identification of strains facilitate population studies of
fall armyworm subgroups. Annals of the Entomological Society of America, v. 105, p.
351–358, 2012.
NAGOSHI, R.N., SILVIE, P., MEAGHER, R.L. Comparison of haplotype frequencies
differentiate fall armyworm (Lepidoptera: Noctuidae) corn-strain populations from Florida
and Brazil. Journal of Economical Entomology, v. 100, p. 954–961, 2007
NAVA, D.E., NASCIMENTO, A.M., STEIN, C.P, HADDAD, M.L., BENTO, J.M.S,
PARRA, J.R.P. Biology, thermal requirements, and estimation of the number of
generations of Zaprionus indianus (Diptera: Drosophilidae) for the main fig producing
regions of Brazil. Florida Entomologist, v. 90, p. 495–501, 2007.
NOAA. National Climate Report – 2015. https://www.ncdc.noaa.gov. (accessed 14 May
2015).
R DEVELOPMENT CORE TEAM. R: A language and environment for statistical
computing. R Foundation for Statistical Computing. Vienna, Austria, 2008.

64
REDAELLI, R. N. M. R. L., OURIQUE, C.B. Thermal Requirements and Annual Number of
Generations of Diachasmimorpha longicaudata (Hymenoptera: Braconidae) Reared in the
South American Fruit Fly and the Mediterranean Fruit Fly (Diptera: Tephritidae). Florida
Entomologist, v.98, pp. 1223–1226, 2015.
SHAPIRO, S. S., WILK, M.B. An Analysis of Variance Test for Normality (Complete
Samples). Biometrika, v. 52, p. 591–611, 1965.
SNOW, J.W.; COPPELAND, W.W. Fall Armyworm Use of Virgin female traps to detect
males and to determine seasonal distribution. Washington, DC: U.S. Government
Printing Office, 1969. 9 p. Production Research Report - USDA-ARS.
SPARKS, A.N. A review of the biology of the fall armyworm. Florida Entomology, v. 62,
pp. 82–87, 1979.
STUHL, C.J., MEAGHER, R.L., NAGOSHI, R.N. Genetic variation in neonate behavior of
Fall armyworm (Lepidoptera: Noctuidae). Florida Entomologist, v. 91, p. 151–158,
2008.
UFWEATHER. It Wasn’t Just the Warmest Year EVER in Gainesville.
http://ufweather.org. (accessed 13 May 2015).
TINGLE, F.C., MITCHELL, E.R. Seasonal populations of armyworms and loopers at
Hastings, Florida. Florida Entomologist, v. 60, p. 115–122, 1977.
WADDILL, V. H.; MITCHELL, E.R.; DENTON, W.H.; POE, S.L.; SCHUSTER, D.J.
Seasonal abundance of fall armyworm and velvetbean caterpillar (Lepidoptera: Noctuidae)
at four location in Florida. Florida. Entomologist, v. 65, p. 350–354, 1982
WALTON, W.R., LUGINBILL, P. The Fall Army Worm, Or "grass Worm", and Its
Control. Washington, DC: U.S. Department of Agriculture, 1916. 16 p.

65
WESTBROOK, J. K.; NAGOSHI, R.N.; MEAGHER, R.L.; FLEISHCER, S.J.; JAIRAM, S.
Modeling seasonal migration of fall armyworm moths. International Journal of
Biometeorology, v. 60, p. 255–267, 2016.
WOOD, J. R.; POE, S.L.; LEPPLA, N.C. Winter Survival of Fall Armyworm Pupae in
Florida. Environmental Entomology, v. 8, p. 249–252, 1979.
WORNER, S.P. Performance of phenological models under variable temperature regimes:
consequences of the Kaufmann or rate summation effect. Environmental Entomology, v.
21, p. 689–699, 1992.

66

67
4. A COMPUTATIONAL MODEL TO PREDICT THE LEVELS OF
FALL ARMYWORM Spodoptera frugiperda (LEPIDOPTERA:
NOCTUIDAE) (J.E. SMITH) IN CROP AREAS, CONSIDERING
SPATIAL DYNAMICS, TEMPERATURE CHANGES AND GENETIC
COMPOSITION
ABSTRACT
Among the lepidopteran insects, the fall armyworm Spodoptera
frugiperda deserves special attention because of its agricultural importance. The
immature stage is able to cause plant injury to cotton and corn crops as observed
in North, Central, and South America, and more recently in Africa. Different
computational approaches have been proposed to clarify the dynamics of fall
armyworm populations, but most of them are not tested in the field and do not
consider one of the most important variables that influence insect development:
temperature. Our objective in this research was to develop a computational tool
that covers a wide range of conditions and allows the user to define different input
variables, such as crop area, thermal requirements of S. frugiperda, viability and
oviposition functions, migration rate, rate of larval movement, and resistance to
transgenic crops. In order to verify the efficiency of this tool, we tested it using
monitoring data of an area located in northern Florida from 2012 to 2015.
Simulations were run to estimate the number of adults in 2016 and predictions
were carried out for two hypothetical situations that considered possible scenarios
involving climate change. The model fitted the monitoring data well, estimating
values for the resistance allele frequency (0.15), migration rate (0.48) and rate of
larval movement (0.04). It also indicated that an increase of only 1°C in weekly
average temperatures could almost double the levels of fall armyworm estimated
for 2016, drawing attention to the possible consequences of temperature rises on
pest dynamics.
Keywords: Individual-based approach; Spatial models; Resistance; Transgenic crops; Climate
changes
68
4.1. Introduction
The fall armyworm Spodoptera frugiperda (J. E. Smith) (Lepidoptera: Noctuidae) is
a polyphagous insect pest that occurs in the Western Hemisphere (SPARKS, 1979), attacking
several crops, including corn, cotton, and soybean (BARROS; TORRES; BUENO, 2010). In
Brazil, fall armyworm is considered one of the main insect pests of corn and cotton
(MARTINELLI et al., 2006). In the United States, it is a severe crop pest, mainly in the
Southeast (HOGG; PITRE; ANDERSON, 1982). Young larvae are usually found in the whorl
in maize plants and initiate injury to leaves by scraping the foliar limb, destroying them
during the last larval instars (VILARINHO et al., 2011; DOS SANTOS, 2004) and their
presence can cause damage to 57% of the crop in maize fields (CRUZ et al., 1999).
One of the main strategies of insect control in these habitats is the use of transgenic
crops, most of which were modified by the Bt (Bacillus thuringiensis) gene that codes for a
particular endotoxin. However, resistant populations have been documented in Puerto Rico,
Brazil and the United States (VÉLEZ et al., 2013; FARIAS et al., 2014; OMOTO et al.,
2016). In order to manage the evolution of resistance to transgenic crops, the use of refuge
areas has been recommended, i.e., non-Bt crops planted to promote the survival of susceptible
insects (SISTERSON et al., 2005).
Because of its agricultural importance, the spatio-temporal dynamics of fall
armyworm has been investigated by many different studies using computational modelling.
Computational models have been found to be useful technology tools for Integrated Pest
Management (IPM) programs because they constitute a laboratory in silico where experiments
can be done to anticipate the effect of a natural or anthropic variable on the insect dynamics
(FERREIRA; GODOY, 2014). For instance, the effect of different refuge proportions and
configurations on the evolution of fall armyworm resistance has been intensely discussed
using spatial models (CARROLL; HEAD; CAPRIO, 2012; CERDA; WRIGHT, 2004;
GARCIA et al., 2016). Labatte et al. (1994) mathematically modelled the larval development
using a degree-days model under various field conditions (larval damage, host plant resistance
and microbial control). The spatial patterns, e.g., aggregated, uniform and random, of S.
frugiperda in different crops were described using an individual based-model (GARCIA;
GODOY, 2016).
Although insects are considered poikilotherms, i.e., animals whose internal
temperature varies along with the environmental temperature, most models do not consider
69
the influence of temperature variation on insect development. The importance of considering
temperature on the development of fall armyworm can be illustrated by the patterns of
migration observed in the United States. Because of its tropical origin, fall armyworm is not
able to survive extended periods of low temperatures and does not present the ability to enter
diapause (LUGINBILL, 1928; BARFIELD; MITCHELL; POE, 1978). Therefore, the
geographic distribution of fall armyworm is closely associated to climatic conditions. In
Brazil, fall armyworm is widely distributed throughout the country because of its tropical
climate, whereas in the United States, insect populations must migrate northward each spring
from overwintering areas located in the south of Florida and Texas to re-infest the central and
eastern United States and parts of southern Canada (SNOW; COPELAND, 1969; ROSE;
SILVERSIDES; LINDQUIST, 1975; YOUNG, 1979). Considering the effects of different
temperatures on the development of fall armyworm, a grid-based spatial model was able to
reproduce the migration pattern in the United States using degree-days accumulated by
populations throughout the year (WESTBROOK et al., 2016).
The effect of temperature on fall armyworm populations in modelling approaches is
also important to respond to the increased concern regarding the impact of climate changes on
the ecology of insect pests (CANNON, 1998). Overwintering areas in the state of Florida are
possibly moving toward north over the years, allowing fall armyworm populations to cover a
wider area during colder seasons (WOOD; POE; LEPPLA, 1979; WADDILL et al., 1982;
WESTBROOK et al., 2016). African countries have faced severe infestations of S. frugiperda
populations, causing losses to crops that have been associated to fluctuations in temperature
and rainfall due to global climate changes (WILD, 2017).
The present study introduces an individual-based model that describes the dynamics
of S. frugiperda based on its thermal requirements, i.e., degree-days accumulated for insect
development and temperature-driven viabilities. It also considers crop composition and its
spatial arrangement, adult and larval movement, migration rate and resistance allele frequency
to Bt corn. In order to test the model, we represented an area located in Alachua County,
Florida, United States, composed of corn plants in which the presence of S. frugiperda has
been monitored for many years. Most of the parameters were obtained through experiments in
the laboratory and others were estimated using insect monitoring data in the study area and an
optimization technique. Then, given a set of parameters, we ran the model using a temperature
database from 2012 - 2015, verifying if the obtained results (model simulations) corresponded
to the insect monitoring data obtained in field. After the model was verified, we estimated the

70
population dynamics and number of generations for 2016 and for two hypothetical situations:
mean temperatures in 2016 + 1°C and + 2°C.
One novelty of the proposed model is in considering all equations and rules related to
insect development be temperature-driven. It allows us to consider the effect of climate
changes over insect populations and the influence of seasonality on population dynamics.
Additionally, the results provided by the model were confronted with data from the field,
increasing its reliability. We used an individual-based approach because our purpose was to
create a computational tool that could be used to estimate the levels of fall armyworm in a
small-scale area, representing its design and local characteristics. Individual-based models are
adequate for this application because they focus on the variability of individual characteristics
(JORGENSEN; CHON, 2009).
The model has potential to be used for different purposes/studies, such as estimation
of population levels in a determined area, investigation of effects of temperature changes on
the dynamics of fall armyworm populations, management of the evolution of insect
resistance, and determination of the crop calendar in IPM plans, among others.
4.2. Methods
The overall modelling process comprised three different stages. In the first stage, the
structure of the model was defined, including its rules and general structure based on the
biology of the insect. The second stage involved the use of the model to simulate an area in
Florida and verify the reliability of the results. In this stage, data from a laboratory experiment
with fall armyworm populations was used in the modeling process and monitoring data from
2012 to 2015 was compared with model outputs. Finally, in the third stage, after model
validation, the density of fall armyworm adults was estimated for 2016 and for other two
hypothetical scenarios, i.e., increasing the temperatures of 2016 by 1°C and 2°C.
4.2.1. Description of the structure of the program developed
The proposed model was developed in C programming language, using a grid of
cells to emulate the crop habitat to be represented. Each one of the cells corresponded to the
presence of one plant in the field, which could be either empty or occupied by insects. We
also associated an energy-counter with each insect that represented the energy accumulated

71
over time since insect development is determined by the energy accumulated according to
temperature variation. Therefore, an insect should be able to accumulate a determined amount
of energy (degree-days) to molt to another stage. This amount of energy is called the thermal
constant (GALLO et al., 2002; PADMAVATHI et al., 2013). The thermal constant can be
defined as the number of degree-days required for a development change to occur. Knowing
the thermal constant and the degree-days accumulated each day, it is possible to predict the
development time of hatching, larval and pupal stages, and adult emergence. Another
important parameter related to the thermal requirements of insects is the lower temperature
threshold, i.e., the lowest temperature in which it is possible to observe insect development
(DIXON et al., 2008). Below the lower temperature threshold, the insect does not accumulate
degree-days; therefore, it may die or enter diapause. Unlike other insect species, fall
armyworm does not enter diapause (SPARKS, 1979).
The rules used in the individual-based model are summarized below:
(a) A cell occupied by an immature insect (eggs, larvae, pupae and adults) could become
empty with a daily probability equal to due to mortality, where is the
viability corresponding to the insect stage and is the duration of the insect stage (GARCIA
et al., 2014; GARCIA et al., 2016). The variable is given by , where T is the
temperature, and are the lower threshold temperature and thermal constant
corresponding to the insect stage, respectively (GALLO et al., 2002) (Figure 12).
(b) An egg needs to accumulate energy equals to K1 to hatch. A larva needs to accumulate
energy equals to K2 to pupate. A pupa needs to accumulate energy equals to K3 for adults to
emerge (GALLO et al., 2012) (Figure 12).
(c) A cell could become occupied by an immature insect if an adult laid eggs in it. Per-capita
oviposition probability per day was φ (T), and it was dependent on the temperature T
(GARCIA et al., 2016).
(d) A cell would become empty of adults if all adults died. We considered that mortality for
an adult occurs when it accumulates an amount of energy equal to K4.

72
Figure 12. Schematization of the general model structure.
The distance travelled by an adult inside the simulated area at each time step had no
preferential direction and was calculated as described in Garcia et al. (2016). We also
associated a short-scale movement component to the larva. Each larva had a probability l to
move to an adjacent plant per day using a Moore neighbourhood of radius 1 (3 x 3 cells).
Each time step t corresponded to one day, and each cell represented 1 x 1 m of the crop
system.
4.2.1.1. Genetic component
The genotype of each individual regarding its resistance to Bt corn (Cry1Fa), i.e., SS
– susceptible homozygote, SR – susceptible heterozygote or RR – resistant homozygote
(VÉLEZ et al., 2014; HUANG et al., 2014), was determined using the Hardy-Weinberg
equation (HARDY, 1908), given by:
where is the frequency of the S allele ( , and q is the frequency of the R allele.
Therefore, knowing the frequency of the R allele in the population, it was possible to
determine the probability of an individual presenting the genotype SS ( ), SR ( ) or RR
( ) (GARCIA et al., 2016). Regarding the fitness cost, it was assumed a reduction of 20% in
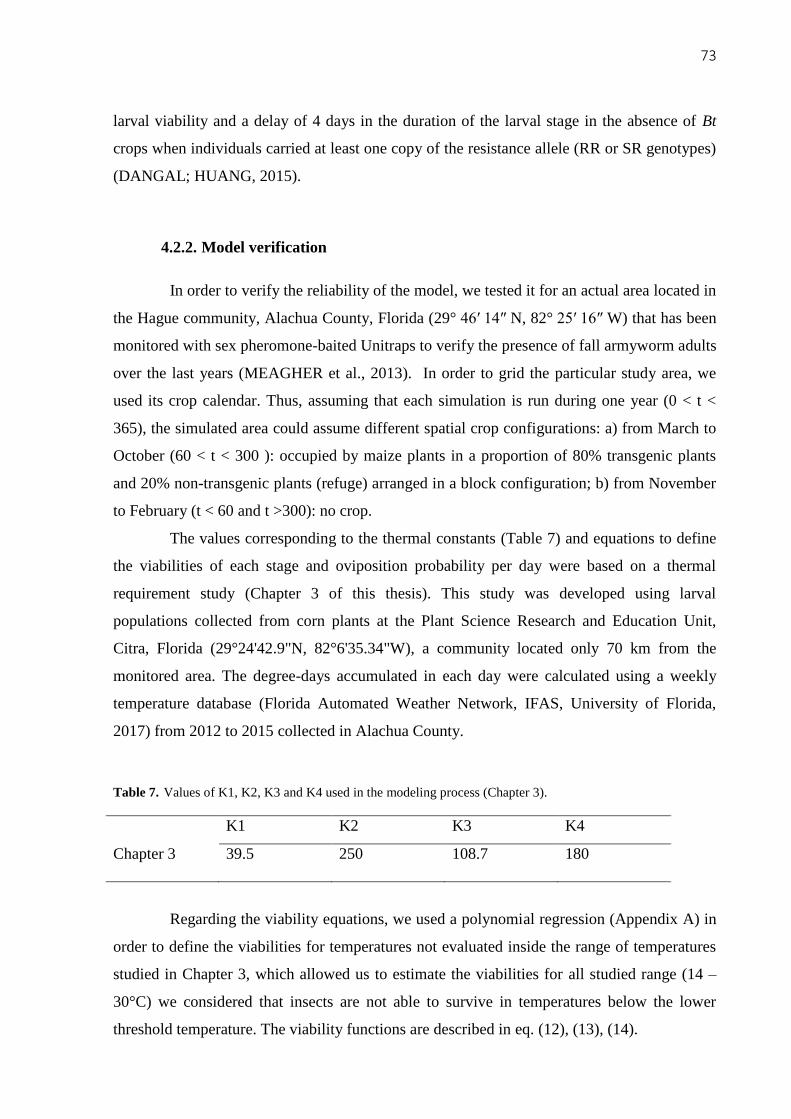
73
larval viability and a delay of 4 days in the duration of the larval stage in the absence of Bt
crops when individuals carried at least one copy of the resistance allele (RR or SR genotypes)
(DANGAL; HUANG, 2015).
4.2.2. Model verification
In order to verify the reliability of the model, we tested it for an actual area located in
the Hague community, Alachua County, Florida (29° 46′ 14″ N, 82° 25′ 16″ W) that has been
monitored with sex pheromone-baited Unitraps to verify the presence of fall armyworm adults
over the last years (MEAGHER et al., 2013). In order to grid the particular study area, we
used its crop calendar. Thus, assuming that each simulation is run during one year (0 < t <
365), the simulated area could assume different spatial crop configurations: a) from March to
October (60 < t < 300 ): occupied by maize plants in a proportion of 80% transgenic plants
and 20% non-transgenic plants (refuge) arranged in a block configuration; b) from November
to February (t < 60 and t >300): no crop.
The values corresponding to the thermal constants (Table 7) and equations to define
the viabilities of each stage and oviposition probability per day were based on a thermal
requirement study (Chapter 3 of this thesis). This study was developed using larval
populations collected from corn plants at the Plant Science Research and Education Unit,
Citra, Florida (29°24'42.9"N, 82°6'35.34"W), a community located only 70 km from the
monitored area. The degree-days accumulated in each day were calculated using a weekly
temperature database (Florida Automated Weather Network, IFAS, University of Florida,
2017) from 2012 to 2015 collected in Alachua County.
Table 7. Values of K1, K2, K3 and K4 used in the modeling process (Chapter 3).
K1 K2 K3 K4
Chapter 3 39.5 250 108.7 180
Regarding the viability equations, we used a polynomial regression (Appendix A) in
order to define the viabilities for temperatures not evaluated inside the range of temperatures
studied in Chapter 3, which allowed us to estimate the viabilities for all studied range (14 –
30°C) we considered that insects are not able to survive in temperatures below the lower
threshold temperature. The viability functions are described in eq. (12), (13), (14).

74
The per-capita oviposition probability per day was given by the eq. (15) using data
from the experiment described in Chapter 3 (Figure 13).
(15)
where is the energy accumulated in the days and .

75
Figure 13. Proportion of eggs laid versus mean energy accumulated by adults in three different temperatures
(data from the experiment developed in Chapter 3)
Another issue to be considered is that the study area is located in a region where
insects are not able to overwinter, receiving individuals from warmer regions periodically
(BARFIELD; STIMAC; KELLER, 1980; WESTBROOK et al., 2016). According to Meagher
and Mitchell (2001) and Westbrook et al. (2016), this period corresponds approximately from
the second half of April to the first half of May. Therefore, in order to represent this
immigration process, we included an average migration rate higher than 0 (m > 0), occurring
during the interval

76
4.2.2.1. Genetic Algorithm (GA)
Some parameters of the model were not available in the literature and are difficult to
obtain from experimental data. Therefore, in order to reproduce the monitoring data set, a
genetic algorithm was used to find the appropriate set of parameters given by z = [m, f, l],
corresponding, respectively, to the migration rate, resistance allele frequency to Bt corn
associated to immigrant populations and the rate of larval movement, which promoted the
best match between the model and the monitoring data.
GA is an optimization method based on the mechanisms of natural selection, whose
goal is to produce new parameter sets gradually better fitted to the present conditions
according to some objective function (MELANIE, 1999). In entomological research, the
recent work developed by Ren et al. (2016) can be mentioned, where a GA was used to
estimate the parameters of a force-based model for simulation. With this in mind, is the
number of parameter sets tested. A score (or fitness) is attributed to each one according to a
fitness function. At each interation of the GA algorithm, three processes may occur:
reproduction, crossover, and mutation (Figure 14) (CHAMBERS, 2000).
Reproduction selects the parameter sets with the highest fitness to compose the next
generation according to a fitness function. In the present study, the mean square error between
the observed and the expected results (number of adults) was used as a fitness function.
Crossover exchanges information between two parameter sets according to a probability 0.1
in the current study. It mimics sexual reproduction, otherwise the parents would produce an
offspring identical to themselves and no increase in population fitness would be observed
over the iterations. Mutation modifies randomly the value of one parameter in the set with a
probability 0.1 in the current study. It allows the introduction of new values, avoiding local
minimums since we were looking for a global solution. We used a number of populations
equal to = 200 and let them evolve over 100 iterations.

77
Figure 14. Exemplification of the three processes involved in a genetic algorithm. Reproduction selects the
individuals to reproduce according to a fitness function F. Crossover exchanges information between two
parameter sets according to a probability Pc. Mutation randomly modifies a parameter in a set according to
a probability Pm.
4.3. Results
Initially the model was applied to the study area using data from 2012. The genetic
algorithm found the best match between model prediction and field data, which is z = [0.48,
0.15, 0.04] from the field data. Then, using these parameter values, we ran simulations for
2013, 2014 and 2015 (Figure 15).

78
Figure 15. Field data and model simulations using the parameter set z = [0.48, 0.15, 0.04] and weekly
average temperatures of 2012, 2013, 2014 e 2015. Ng – Number of generations.
Since the model was able to reproduce the monitoring data for the consecutive three
years with good accuracy, using the combination of parameters provided by the GA for 2012,
a new question was formulated: Are the parameters obtained by the genetic algorithm not
suffering significant variations during the proposed interval of time (2012-2015)? In order to
test this hypothesis, we ran the genetic algorithm once more to find the combination of
parameters that provide the best match of the model for each year from 2012 to 2015. Then,
we calculated the mean values of the 20 best parameter set obtained from simulations of the
algorithm for each year (Figure 16, Figure 17).

79
a) b)
Figure 16. Mean values of (migration rate) (a) and (resistance allele frequency in migrant population)
(b) obtained from simulations of the GA for 2012, 2013, 2014 and 2015. Different letters above the bars
indicate significant differences at 5% (Tukey’s HSD, p<0.05).
Figure 17. Mean value of (rate of larval movement) obtained from the simulations of the GA for 2012,
2013, 2014 and 2015. Different letters above the bars indicate significant differences at 5% (Tukey’s HSD,
p<0.05).

80
4.3.1. Estimation for 2016 and hypothetical scenarios
In order to investigate the possible effects of increases in the temperature on the
population dynamics of S.frugiperda, we tested the model using climate data from 2016 and
considered two hypothetical scenarios: increasing the mean temperatures of 2016 by 1°C and
by 2°C. Using weekly temperature data (Florida Automated Weather Network, IFAS,
University of Florida, 2017) and the combination of parameters found by the GA for 2012,
we estimated the populations levels for 2016 and for each one of the hypothetical scenarios
proposed (Figure 18).
Figure 18. Populations levels estimated for 2016 and for two hypothetical situation (increasing the
temperatures by 1°C and 2°C). Ng – Number of generations.
81
4.4. Discussion
The model successfully predicted the population distribution from 2012 to 2015,
indicating a good correspondence between model results and monitoring data. The few
differences between the expected and the observed data can be related to:
a) The years of 2012 and 2013 did not show an accentuated oscillation during the
immigration period (105 < t < 135) as observed in the curves provided by the model for all
years. It may be related to the absence of monitoring data in determined periods. Since we are
working with discrete data, some intervals were not sampled and therefore, this oscillation
was not verified because there was not monitoring data during the period. Another reason is
the methodology used to model the immigration period. Since information about the specific
period of immigration was scarce, we considered it occurred uniformly during a determined
interval of time based on previous observations. However, migration can be ruled by different
factors such as corn phenology, temperature and pluviosity (WESTBROOK et al., 2016).
b) The model was able to predict two main periods of outbreak. The first one (lower) is
derived from eggs laid in mid-summer (~July) by populations from the beginning of this
season when climate conditions were extremely favorable for fall armyworm development
(25°C < T < 30°C) (HOGG; PITRE; ANDERSON, 1982; ALI; LUTTRELL; SCHNEIDER,
1990). The second and higher outbreak is expected in mid-autumn (~October) from eggs laid
by populations at the end of summer when conditions were still optimal for fall armyworm
development. In addition to these two outbreaks, a third one was observed during December,
2012, which was not predicted by the model. It was an unexpected outbreak since corn plants
were not present in December. It may have occurred due to the presence of other host plants
remaining in the field or an influx of moths returning from the north (PAIR et al., 1987). In
2014 and 2015, only one larger outbreak was observed, which the model was able to
reproduce, but it also predicted another smaller one that was not observed in the monitoring
data, which can also be explained due to the discrete nature of data since some intervals of
time were not sampled. The model provided a more detailed description of population
dynamics, whereas the monitoring data presented many individual “pieces” of the whole
“puzzle”. However, some of these pieces were missing. Another reason for differences
between the expected and observed results can be related to the nature of the model. The
82
modelling approach considered temperature as the driving factor moderating population
dynamics, but other variables may also influence it, such as pluviosity, corn phenology or
natural phenomena (BARFIELD; ASHLEY, 1987). The modelling process is just an
approximation of reality, not intending to reproduce it exactly.
c) Only synchronization delays of less than five days were observed. These delays can be
explained since the intervals of observation were longer than one week.
An important achievement by the model was the representation of outbreaks
according to their intensities. For instance, the model was able to represent the large outbreak
in 2015 (surpassing 100 adults/ ha). The year 2015 was one of the warmest on record in
Florida, resulting in an increase in the number of generations of fall armyworm throughout the
state (UFWEATHER, 2015; NOAA, 2015).
We did not find any study available in the literature providing values of migration
rate or rate of larval movement in the field to compare to our results. Research determining
the influence of rates of larval movement on the choice of refuge configurations indicated that
seed mixture arrangements could represent a better alternative for lower rates of larval
movement, i.e., < 0.1 (GARCIA et al., 2016).
The resistance allele frequency found in our study varied between 0.12 and 0.18.
Different genetic studies were conducted using fall armyworm populations from counties
located in southern Florida and resistance allele frequency was estimated: Palm Beach (0.05 –
0.20), Hendry (0.01 – 0.12) and Collier (0.24 – 0.35) (VÉLEZ et al., 2013), and Collier (0.24
– 0.35) (HUANG et al., 2014). Since insects arrive in the study area from different southern
locations during the migration period, the obtained resistance allele frequency (0.12 – 0.18)
can be interpreted as a mean of the allele resistance frequency of populations from the many
counties that provide fall armyworm moths to the simulated area. It also indicates that
resistant individuals may be present in the area (HUANG et al., 2014.), information that needs
to be considered in future management plans.
From 2012 to 2014, five generations of fall armyworm per year were predicted by
our model. The same number was found for the same region in Chapter 3, where thermal
requirements and Geographic Information System (GIS) were used to estimate the number of
generations of fall armyworm from 2006 to 2016 throughout the state of Florida. In 2015 and
2016, six generations were observed during the year due to the warmer climate conditions. In

83
Chapter 3, seven generations for the same years were estimated. These differences are
probably related to the different approaches used in both studies. Whereas in Chapter 3, a
GIS-based analysis was used, considering only degree-days accumulated during the egg-adult
period; the current study used a computational model that covered a wider range of
parameters related to temperature, such as viability and fecundity. Additionally, the previous
study did not consider parameters such as migration rate, resistance allele frequency and
larval movement. Nevertheless, the values between both studies were very similar.
As indicated in Figure 16, the resistance allele frequency did not indicate statistically
significant differences among years. We found no differences in the simulations because we
were assessing during a short interval of time that was not enough to verify possible changes
in the population. We also did not verify significant variations in the migration rate and rate of
larval movement. These results may indicate that both parameters are not affected by small
variations in temperature and only drastic climate changes may affect them. They can also be
more tightly related to other non-studied variables, such as crop neighborhood, crop calendar,
etc. A more detailed study focusing on the variables that affect both parameters would be
necessary to test such a hypothesis.
The model result for 2016 was very similar to 2015, but it presented a larger insect
outbreak that reached ~150 adults/ha. Before 2016, 2015 presented the warmest summer in
Florida’s history. However, the record was broken in 2016 with average temperatures
reaching 30°C during the summer (NOAA, 2016). The gradual increase in average
temperatures has raised concerns that the number of insects in the field is increasing
(LIEBHOLD; BENTZ, 2011; GOERGEN, 2016). The simulations for 2015 and 2016
indicated the addition of one generation, compared to 2012, 2013 and 2014. Additionally, our
simulations for the hypothetical scenarios indicated that just an increase of 1°C in weekly
average temperatures could produce an outbreak 1.7 times higher than in 2016, reaching ~
250 adults/ha. However, this increase in the number of insects is not proportional to the
increase in temperatures indefinitely, which was observed when average temperatures
increased by 2°C. The outbreak did not present a great variation compared to the simulation
correspondent to an increase of 1°C. Insects are negatively affected by extreme temperatures
and the optimal temperature for fall armyworm development is around 26°C as verified in
Chapter 3. Therefore, it is expected that fall armyworm development will be negatively
affected as temperatures rise above this value (HOGG; PITRE; ANDERSON, 1982; ALI;
LUTTRELL; SCHENEIDER, 1990).

84
4.5. Conclusion
The model succeeded in representing the dynamics of fall armyworm populations for
the simulated area and was reliable to represent the main outbreaks observed in the field. It
may represent an important tool for integrated pest management programs since the model
can be used either to predict the effects of the implementation of a new approach for pest
control or the influence of global warming in insect dynamics. The results provided by the
model also represent an alert for the effects of a gradual increase in average temperatures on
the density of fall armyworm in the field.
References
ALI, A., LUTTRELL, R.G., SCHNEIDER, J.C. Effects of Temperature and Larval Diet on
Development of the Fall Army worm (Lepidoptera: Noctuidae). Annals of the
Entomological Society of America, v. 83, p. 725–733, 1990.
BARFIELD, C.S., ASHLEY, T.R. Effects of corn phenology and temperature on the life
cycle of the fall armyworm, Spodoptera frugiperda (Lepidoptera: Noctuidae). Florida
Entomologist, v. 70, n.1, p. 110 – 117, 1987.
BARFIELD, S.C.; MITCHELL, E.R.; POE, S. L. A Temperature-Dependent Model for Fall
Armyworm Development. Annals of the Entomological Society of America, v .71, p.
70–74, 1978.
BARFIELD, C.S., STIMAC, J.L., KELLER, M.A. State-of-the-art for predicting damaging
infestations of fall armyworm. Florida Entomologist, v.63, n.4, 1980.
BARROS, E.M., TORRES, J.B., BUENO, A.F. Oviposition, development, and reproduction
of Spodoptera frugiperda (J.E. Smith) (Lepidoptera: Noctuidae) fed on different hosts of
economic importance. Neotropical Entomology, v. 39, pp. 996–1001, 2010.

85
CANNON, R.J.C. The implications of predicted climate change for insect pests in the UK,
with emphasis on non-indigenous species. 1998. Global Change Biology, v. 4, n. 7, p.
785-796, 1996.
CARROLL, M.W., HEAD, G., CAPRIO, M. When and where a seed mix refuge makes sense
for managing insect resistance to Bt plants. Crop Protection, v. 38, p. 74–79, 2012.
CERDA, H., WRIGHT, D.J. Modeling the spatial and temporal location of refugia to manage
resistance in Bt transgenic crops. Ecosystem Environment, v .102, pp. 163–174, 2004.
CHAMBERS, L. The practical handbook of Genetic Algorithms. Boca Raton, FL:
Chapman and Hall. 2nd edition, 2001.
CRUZ, I.; FIGUEIREDO, M.L.C.; OLIVEIRA, A.C.; VASCONCELOS, C.A. Damage of
Spodoptera frugiperda (Smith) in different maize genotypes cultivated in soil under three
levels of aluminium saturation. International Journal of Pest Management, v.45, p.
293-296, 1999.
DANGAL, V., HUANG, F. Fitness costs of Cry1F resistance in two populations of fall
armyworm, Spodoptera frugiperda (J.E. Smith), collected from Puerto Rico and Florida.
Journal of Invertebrate Pathology, v. 127, p. 81–86, 2005.
DIXON, A.F.G; HONEK, A. KEIL, P., KOTELA, A.L.S., JAROSIK, V. Relationship
between the minimum and maximum temperature thresholds for development in insects.
Functional Ecology, v. 23, p. 257–264, 2008.
DOS SANTOS, L.M., REDAELLI, L.R., DIEFENBACH, L.M.G.; EFROM C.F.S.
Fertilidade e longevidade de Spodoptera frugiperda (J.E. Smith) (Lepidoptera:Noctuidae)
em genótipos de milho. Ciência Rural, v.34, n.2, p. 345-350, 2004.
FARIAS, J.R., ANDOW, D.A., HORIKOSHI, R.J., SORGATTO, R.J., FRESIA, P.,
SANTOS, A.C. DE, OMOTO, C. Field-evolved resistance to Cry1F maize by Spodoptera
frugiperda (Lepidoptera: Noctuidae) in Brazil. Crop Protection, v. 64, p. 150–158, 2014.

86
FERREIRA, C. P.; GODOY, W.A.C. (Eds.). Ecological Modelling Applied to Entomology.
Switzerland: Springer, 2014. 262 p.
FLORIDA AUTOMATED WEATHER NETWORK, IFAS, UNIVERSITY OF FLORIDA.
Archived Weather Data. https://fawn.ifas.ufl.edu/. (accessed 19 August 2017).
GALLO, D.; NAKANO, O.; SILVEIRA NETO, S.; CARVALHO, R. P. L.; BATISTA, G.
C.; BERTI FILHO, E.; PARRA, J. R. P.; ZUCCHI, R. A.; ALVES, S. B.; VENDRAMIN,
J. D.; MARCHINI, L. C.; LOPES, J. R. S.; OMOTO, C. Entomologia agrícola.
Piracicaba: FEALQ, 2002. 920 p.
GARCIA, A. CÔNSOLI, F.L., GODOY, W.A.C., FERREIRA, C.P. A mathematical
approach to simulate spatio-temporal patterns of an insect-pest, the corn rootworm
Diabrotica speciosa (Coleoptera: Chrysomelidae) in intercropping systems. Landscape
Ecology, v. 29, pp. 1531–1540, 2014.
GARCIA, A. G., CÔNSOLI, F.L., FERREIRA, C.P., GODOY, W.A.C. Predicting evolution
of insect resistance to transgenic crops in within-field refuge configurations, based on
larval movement. Ecological Complexity, v.28, p. 94 – 103, 2016.
GARCIA, A.G., GODOY, W.A.C. A Theoretical Approach to Analyze the Parametric
Influence on Spatial Patterns of Spodoptera frugiperda (J.E. Smith) (Lepidoptera:
Noctuidae) Populations. Neotropical Entomology, v.46, n.3, pp 283–288, 2016.
GOERGEN, G., KUMAR P.L., SANKUNG S.B., TOGOLA A., TAMÒ M. First Report of
Outbreaks of the Fall Armyworm Spodoptera frugiperda (J E Smith) (Lepidoptera,
Noctuidae), a New Alien Invasive Pest in West and Central Africa. PLoS ONE, v. 11, n.
10, e0165632, 2016.
HARDY, G.H. Mendelian proportions in a mixed population. Science, v. 28, p. 49–50, 1908.
HOGG, D. B., PITRE, H.N., ANDERSON, R.E. Assessment of Early-Season Phenology of
the Fall Armyworm (Lepidoptera: Noctuidae) in Mississippi. Environmental
Entomology. v.11, pp. 705–710, 1982.
87
HUANG, F., QURESHI, J.A., MEAGHER, R.L.JR., REISIG, D.D., HEAD, G.P., ANDOW,
D.A., NI, X., KERNS, D., BUNTIN, G.D., NIU, Y., YANG, F., DANGAL, V. Cry1F
resistance in fall armyworm Spodoptera frugiperda: single gene versus pyramided Bt
maize. PLoS ONE, v. 9, n. 11, e112958, 2014.
JORGENSEN, S.E., CHON, T.S. Model types available for Ecological Modelling, in:
JORGENSEN, S.E.; CHON, T.S.; FRIEDRICH, R. (Eds.). Handbook of Ecological
Modelling and Informatics. Southampton, UK: WIT Press, 2009. p. 9-40.
LABATTE, J.M. Modelling the larval development of Spodoptera frugiperda (J. E. Smith),
(Lep., Noctuidae) on corn. Journal of Applied Entomology, v. 118, p. 172-176, 1994.
LIEBHOLD, A., BENTZ, B. Insect Disturbance and Climate Change. U.S. Department of
Agriculture, Forest Service, Climate Change Resource Center.
www.fs.usda.gov/ccrc/topics/insect-disturbance/insect-disturbance (acessed 14 May
2016).
LUGINBILL, P. The fall armyworm, Washington, DC: USDA, 1928. 91 p. Technical
Bulletin of the U.S. Department of Agriculture.
MARTINELLI, S. BARATA, R.M., ZUCCHI, M.I., SILVA-FILHO, M.C., OMOTO, C.
Molecular Variability of Spodoptera Frugiperda (Lepidoptera: Noctuidae) Populations
Associated to Maize and Cotton Crops in Brazil. Journal of Economic Entomology, v.
99, pp. 519-526, 2006.
MEAGHER, R.L., MITCHELL, E.R. Collection of fall aarmyworm (Lepidoptera: Noctuidae)
using selected pheromone lures and trap designs. Journal of Entomology Science. v. 36,
n.2, p 135-142, 2001.
MEAGHER, R.L., NAGOSHI, R.N., ARMSTRONG, J.S., NIOGRET, J., EPSKY, N.D.,
FLANDERS, K.L. Captures and host strains of fall armyworm (Lepidoptera: Noctuidae)
males in traps baited with different commercial pheromone blends. Florida
Entomologist, v. 96, n. 3, 2013.

88
MELANIE, M. An introduction to genetic algorithms. Cambridge, Massachussets: MIT
Press, 5th edition, 1999.
NOAA. National Climate Report – 2015. https://www.ncdc.noaa.gov. (accessed 14 May
2015).
NOAA. National Climate Report – 2016. https://www.ncdc.noaa.gov. (accessed 14 May
2016).
OMOTO, C., BERNARDI, O., SALMERON, E., SORGATTO, R.J., DOURADO, P.M.,
CRIVELLARI, A., CARVALHO, R.A., WILLSE, A., MARTINELLI, S., HEAD, G.P.
Field-evolved resistance to Cry1Ab maize by Spodoptera frugiperda in Brazil. Pest
Management Science, doi 10.1002/ps.4201, 2016.
PAIR, S.D., RAULSTON, J.R., RUMMEL, D.L., WESTBROOK, J. K., WOLF, W.W.,
SPARKS, A.N., SCHUSTER, M. F. Development and production of corn earworm and
fall armyworm in the Texas high plains: Evidence for reverse fall migration. The
Southwestern Entomologist, v.12, n.2, p. 89 – 100, 1987.
PADMAVATHI, C., KATTI, G., SAILAJA, V., PADMAKUMARI, A.P.,
JHANSILAKSHMI, V., PRABHAKAR, M. AND PRASAD, Y.G. Temperature
Thresholds and Thermal Requirements for the Development of the Rice Leaf Folder,
Cnaphalocrocis medinalis. Journal of Insect Science, v. 96, p. 1- 13, 2013.
REN, J., WANG, X., JIN, X., MANOCHA, D. Simulating Flying Insects Using Dynamics
and Data-Driven Noise Modeling to Generate Diverse Collective Behaviors. PLoS One,
v. 11, n.5, e0155698, 2016.
ROSE A.H., SILVERSIDES R.H., LINDQUIST O.H. Migration fight by an aphid,
Rhopalosiphum maidis (Hemiptera: Aphididae) and a noctuid, Spodoptera frugiperda
(Lep.: Noctuidae). The Canadian Entomologist, v. 107, p. 567-576, 1975.

89
SISTERSON, M.S., CARRIÈRE, Y., DENNEHY, T.J., TABASHNIK, B.E. Evolution of
resistance to transgenic crops: Interaction between insect movement and field distribution.
Journal of Economic Entomology, v. 98, p. 1751–1762, 2005.
SNOW, J.W.; COPPELAND, W.W. Fall Armyworm Use of Virgin female traps to detect
males and to determine seasonal distribution. Washington, DC: U.S. Government
Printing Office, 1969. 9 p. Production Research Report - USDA-ARS.
SPARKS, A.N. A review of the biology of the fall armyworm. Florida Entomology, v. 62,
pp. 82–87, 1979.
UFWEATHER. It Wasn’t Just the Warmest Year EVER in Gainesville.
http://ufweather.org. (accessed 13 May 2015).
VÉLEZ, A.M., SPENCER, T.A., ALVES, A.P., CRESPO, A.L.B., SIEGFRIED, B. D.
Fitness costs of Cry1F resistance in fall armyworm, Spodoptera frugiperda. Journal of
Applied Entomology, v. 128, p. 315–325, 2014.
VÉLEZ, A.M., SPENCER, T.A., ALVES, A.P., MOELLENBECK, D., MEAGHER, R.L.,
CHIRAKKAL, H., SIEGFRIED, B.D. Inheritance of Cry1F resistance, cross-resistance
and frequency of resistant alleles in Spodoptera frugiperda (Lepidoptera: Noctuidae).
Bulletin of Entomological Research, v. 103, p. 700–713, 2013.
VILARINHO, E.C.; FERNANDES, O.A.; HUNT, T.E.; CAIXETA, D.F. Movement of
Spodoptera frugiperda adults (Lepidoptera: Noctuidae) in maize in Brazil. Florida
Entomology, v. 94, p. 480–488, 2011
WADDILL, V. H.; MITCHELL, E.R.; DENTON, W.H.; POE, S.L.; SCHUSTER, D.J.
Seasonal abundance of fall armyworm and velvetbean caterpillar (Lepidoptera: Noctuidae)
at four location in Florida. Florida. Entomologist, v. 65, p. 350–354, 1982
WESTBROOK, J. K. et al. Modeling seasonal migration of fall armyworm moths.
International Journal of Biometeorology. v. 60, pp. 255–267, 2016.

90
WILD, S. African countries mobilize to battle invasive caterpillar. Nature.
http://www.nature.com/news/african-countries-mobilize-to-battle-invasive-caterpillar-
1.21527. Acessed in September 2017.
WOOD, J. R.; POE, S.L.; LEPPLA, N.C. Winter Survival of Fall Armyworm Pupae in
Florida. Environmental Entomology, v. 8, p. 249–252, 1979.
YOUNG J.R. Fall armyworm: control with insecticides. Florida Entomologist, v. 62, p. 130-
133, 1979.

91
SUPPLEMENTARY DATA
Appendix A: Relationship between viabilities and temperatures: (a) eggs, (b) larvae and (c) pupae (data
from Chapter 3). Different letters indicate significant differences at 5% (Tukey’s HSD, p<0.05).