university of sao paulo~ ribeirao preto medical …
TRANSCRIPT

UNIVERSITY OF SAO PAULO
RIBEIRAO PRETO MEDICAL SCHOOL
POSTGRADUATE PROGRAMME IN PUBLIC HEALTH
RODRIGO DE SOUZA REIS
Development of a Multi-state Markov Model for Labour Progression
Ribeirao Preto
2019

RODRIGO DE SOUZA REIS
Development of a Multi-state Markov Model for Labour Progression
Original version
Dissertation presented to the Postgrad-uate Programme in Public Health at theRibeirao Preto Medical School, Universityof Sao Paulo in Partial Fulfillment of theRequirements for the Degree of Master ofScience.
Area of Concentration: QuantitativeMethods in Health
Advisor: Dr. Domingos Alves
Ribeirao Preto
2019

Autorizo a reprodução e divulgação total ou parcial deste trabalho, por qualquer meio convencional ou eletrônico, para fins de estudo e pesquisa, desde que citada a fonte.
Souza Reis, Rodrigo de
Desenvolvimento de um modelo multi-estado de Markov para a progressão do trabalho de parto .
p.
Dissertação de Mestrado, apresentada ao Programa de Pós-graduação em Saúde Pública da Faculdade de Medicina de Ribeirão Preto da Universidade de São Paulo. Área de concentração: Métodos Quantitativos em Saúde.
Orientador: Alves, Domingos.
Progressão do Trabalho de parto Dilatação cervical Modelo multi-estado de Markov.

This Dissertation, “Development of a Multi-state Markov Model for LabourProgression”, presented by Rodrigo de Souza Reis, and submitted to the Ribeirao PretoMedical School of the University of Sao Paulo, in Partial Fulfillment of the requirementsfor the degree of Master of Science in the Postgraduate Programme in Public Health, inthe area of concentration of Quantitative Methods in Health, has been read and approvedin of of by:
Dr.
Institution:
Committee Chair
Dr.
Institution:
Dr.
Institution:
Dr.
Institution:

Acknowledgements
This work was supported by the World Health Organization (WHO) in partnership
with the Fundacao de Apoio ao Ensino, Pesquisa e Assistencia do Hospital das Clınicas
(FAEPA) of the Ribeirao Preto Medical School of the University of Sao Paulo (Process no.
113/2014). “SIMPLIFIED EFFETIVE LABOUR-MONITORING ASSISTANT (SELMA)
WITHIN THE BETTER OUTCOMES IN LABOUR DIFFICULTY (BOLD) PROJECT”
- SPHQ13-APW-4487 / WHO Registration 2013/391295-0

Abstract
SOUZA REIS, Rodrigo De. Development of a Multi-state Markov Model forLabour Progression. 2019. 89 p. Dissertation (Master of Science) – Ribeirao PretoMedical School, University of Sao Paulo, Sao Paulo, 2019.
This project aimed to develop a Multi-state Markov model for labour progression. Theanalysis was conducted as part of the World Health Organization Better Outcomes inLabour Difficulty project. The data employed was from a prospective, multi-centre, cohortstudy of women admitted for vaginal birth with single live fetus during early first stage oflabour. It was conducted at 13 maternity hospitals in Nigeria and Uganda from December2015 to November 2016. A multi-state continuous-time homogeneous Markov model wasfitted to labour progression data for different groups of parity. The model was designed asan progressive model which consisted of one simple chain of 9 states. The states represented2 to 10 centimetres, except 9 centimetres, of cervical dilatation and the vaginal birth.Parameters that define the labour progression model were estimated and these includetransition intensities, mean sojourn times and total length of stay. The fitted model wasused to simulate individual trajectories of labour progression. Estimated and observedprevalence of individuals in each state were plotted as time series for model assessment.The results obtained showed that the multi-state Markov model is robust to study labourprogression.
Keywords: Labour progress. Cervical dilatation. Multi-state Markov model.

Resumo
REIS, Rodrigo de Souza. Desenvolvimento de um Modelo Multi-estado deMarkov para a Progressao do Trabalho de Parto. 2019. 89 f. Dissertacao(Mestrado em Ciencias) – Faculdade de Medicina de Ribeirao Preto, Universidade de SaoPaulo, Sao Paulo, 2019.
Este projeto teve como objetivo desenvolver um modelo multi-estado de Markov para aprogressao do trabalho de parto. A analise foi realizada como parte do projeto BetterOutcomes in Labour Dificulty da Organizacao Mundial de Saude. Os dados utilizados foramde um estudo prospectivo multicentrico de coorte de mulheres admitidas para parto normalcom gravidez de um unico feto vivo durante o periodo inicial da primeira fase do trabalhode parto. O coorte foi realizado em 13 maternidades na Nigeria e Uganda de dezembro de2015 a novembro de 2016. Um modelo de multi-estado de Markov homogenio em tempocontınuo foi ajustado para os dados de progressao do trabalho de parto para diferentesgrupos de paridade. O modelo foi concebido como um modelo progressivo que consistia emuma cadeia simples de 9 estados. Os estados representavam valores de dilatacao cervicalde 2 a 10 centımetros, com excecao de 9 centımetros, e o parto normal. Os parametrosque definem o modelo da progressao do trabalho de parto foram estimados e incluemintensidades de transicao, tempos medios de permanencia e tempo total de permanencia.O modelo ajustado foi utilizado para simular trajetorias de progressao do trabalho departo individuais. As prevalencias estimadas e observadas dos indivıduos em cada estadoforam plotadas como series temporais para avaliacao do modelo. Os resultados obtidosmostraram que o modelo multi-estado de Markov e robusto para estudar a progressao dotrabalho de parto.
Palavras-chaves: Progressao do trabalho de parto. Dilatacao cervical. Modelo multi-estadode Markov.

List of Figures
Figure 1 – State diagram for labour progression. Unidirectional, progressive,
9-state model for labour progression. Paturients advances through the
states sequentially 1 to 8 (2 to 10 cm of cervical dilatation) until the
absorbing state 10 (the vaginal birth). . . . . . . . . . . . . . . . . . . 19
Figure 2 – Sample selection flow chart. . . . . . . . . . . . . . . . . . . . . . . 20
Figure 3 – Bubble chart of transitions probabilities for nulliparous start-
ing at 4cm of cervical dilatation with one hour cycle from 0
to 16 hours. . . . . . . . . . . . . . . . . . . . . . . . . . . . . . . . . 24
Figure 4 – Estimated observed and expected proportions of nulliparous
women at each state in 16 hours. Observed prevalence are indicated
as solid lines, expected prevalence as dashed lines. . . . . . . . . . . . . 25
Figure 5 – Real and simulated trajectories of individual realisations of
labour progress starting at 4cm for nulliparous women. a) ob-
served trajectories from BOLD’s cohort data. b) simulated trajectories
with randomly generated observation times from multistate Markov model 26

List of Tables
Table 1 – Labour characteristics and interventions by parity. . . . . . . . . . . . . 21
Table 2 – Number of observed transitions by parity. . . . . . . . . . . . . . . . . . 22
Table 3 – Estimated transition rates with 95% confidence intervals for each model
by parity. . . . . . . . . . . . . . . . . . . . . . . . . . . . . . . . . . . . 23
Table 4 – Estimation of the expected total length of stay in hours with 95%
confidence intervals of multi-state Markov models by parity. . . . . . . . 25

Contents
1 Introduction . . . . . . . . . . . . . . . . . . . . . . . . . . . . . . 10
2 Article . . . . . . . . . . . . . . . . . . . . . . . . . . . . . . . . . 14
3 Other Articles . . . . . . . . . . . . . . . . . . . . . . . . . . . . . 30
4 Conclusions . . . . . . . . . . . . . . . . . . . . . . . . . . . . . . 32
Bibliography . . . . . . . . . . . . . . . . . . . . . . . . . . . . . . 33
A WHO Research Ethics Review Committee Approval . . . . . . 37
B Article - Cervical dilatation over time is a poor predictor of
severe adverse birth outcomes: a diagnostic accurary study . . 42
C Article - Progression of the fisrt stage of spontaneous labour:
A prospective cohort study in two sub-Saharan African countries 52
D Article - Development of a system for antenatal and labour
care of pregnant women in the Brazilian private health system 82
10
1 Introduction
Identifying women at high risk of complications, careful monitoring, and appropriate
use of interventions during labour would avoid most maternal and neonatal adverse
outcomes. For many women, intrapartum care is comprised of monitoring and a supportive
approach. Others may require interventions to avoid complications. During this process,
health professionals often have to acquire information, process it, and make the decision
to keep monitoring, speed up labour or intervene.
Labour is a natural process that includes the onset of uterine contractions that
increase in intensity and frequency, resulting in progressive effacement and dilation of the
cervix. In this process, one of the most important indicators of progression is the cervical
dilatation. The cervix represents the main impediment to the passage of the baby and
its dilatation is the result of the main physiological mechanisms involved in the process
(FRIEDMAN, 1959). Thus, many publications emphasise the importance of the graphical
representation of cervical dilatation progression to the clinical management of labour.
Friedman (1954) was the first to publish a graphicostatistical analysis of labour
progress composed of a series of cervical dilatation values over time. Labour progression
has since been assessed on the basis of his work. He presented the cervical dilatation for
nulliparous women as a sigmoid labour curve. Subsequently, based on Friedman’s findings,
Philpott and colleagues developed guidelines to assess labour progression (PHILPOTT;
CASTLE, 1972b; PHILPOTT; CASTLE, 1972a). They proposed an alert line that repre-
sents a cervical dilatation rate of 1 cm/hr to detect abnormal labour. They also proposed an
action line parallel to the alert line four hours to the right intended to trigger some action.
After, O’DRISCOLL, Foley e MacDonald (1984) proposed a package of interventions to
decrease the proportion of women with labour progression beyond the alert line. All these
studies led to the creation of the World Health Organization (WHO) partograph presented
in 1994 (KWAST; LENNOX; FARLEY, 1994). The partograph, has since been promoted
as an essential tool for assessing labour progress and decision-making.
The partograph is a composite graphical record of key labour data over time. Its
main feature is a cervicograph that displays labour time in hours, in the x axis, and cervical
dilatation in centimetres, in the y axis. The principal attributes of the cervicograph are the
alert and action lines, which act as triggers for interventions during labour. The alert line

11
is linear and represents a cervical dilation rate of one centimetre per hour. The action line
is parallel to the alert line and is displayed four hours to the right of the alert line. At first,
3 cm dilatation was believed to be the most frequent dilatation at which the transition
takes place at the rate of 1 cm/hr and the cervicograph was marked accordingly. This
marking was afterwards changed to 4 cm. The partograph has an underlying algorithm
designed to identify women who are likely to present poor outcomes related to labour and
which interventions or treatments to take. The active management of labour with the use
of the partograph has been effective in reducing prolonged labour and adverse outcomes,
but many elements of this approach are controversial.
The understanding of natural labour progression has regaining interest with the
movement from a general approach of care to new approaches that are women-centred
and more natural without too many interventions (OLADAPO et al., 2018). There is
growing evidence that the pattern of labour progression among low-risk women with
spontaneous onset differs substantially from Friedman’s reports of 1950 (ZHANG; TROEN-
DLE; YANCEY, 2002; ZHANG et al., 2010; OLADAPO et al., 2018; ABALOS et al.,
2018). Changes in the characteristics of women and the current model of birth care are
questionable factors of the use of normal labour curves based on Fridman’s work (ZHANG
et al., 2010). In practice, identifying abnormally progressing labour that justifies a medical
intervention is often challenging and it has become a leading indication for oxytocin
augmentation and cesarean sections (BETRaN et al., 2016).
Recently, Zhang et al. (2010) presented new labour progression curves based on
records of more than 60,000 parturient women who had singleton births with spontaneous
onset of labour, fetal cephalic presentation, vaginal delivery and normal perinatal outcome
from 2002 to 2008. The curves encountered by Zhang and colleagues also differ from
those previously described by Friedman. They argues that the rate of dilation from 4
cm to 6 cm is far slower than previously reported and that health professionals should
wait longer before the 6cm dilation to make any decisions about the use of interventions.
The American College of Obstetricians and Gynecologists, adhered to the labour curve
proposed by Zhang and recommends its use instead of the curve based on Friedman’s work
(OBSTETRICIANS; GYNECOLOGISTS et al., 2014).
These approaches have been extremely useful in assessing the labour progress
retrospectively but not in predicting its course. When attempting to predict the course of
labour, information on cervical dilatation should be quantitatively described in a sequential
12
arrangement over time. For this purpose, we hypothesised that Markov processes could
be useful in determining the actual labour progress. Markov process is based on the
transition matrix with a probability structure (COX; MILLER, 1977). This matrix gives
the probabilities by which one set of states is followed by another set of states. Thus, the
transition matrix is a mathematical way of summarising the sequence of events over time.
Therefore, using the transition matrix we could predict future states.
To our knowledge there is only one published work using Markov process to model
labour progress. In 1988, Nagamatsu et al. (1988) developed a model based on Markov
processes to predict the progress of labour, which made a huge contribution to the
development of this project. In the mentioned study, when applying the Markov process,
the progression of labour was divided into eight states of cervical dilatation. Based on
collected data, a transition matrix was calculated, in which the value in each element
presented the probability of progression from one state to another using a period of 30
minutes. The Markov process was reported as an effective analytical model for predicting
labour. However, there are some limitations related to labour data that require some
adaptations of their approach for fitting more realistic labour data.
The problems associated with the assessment and recording of cervical dilation
during labour are important obstacles to study its progression (VAHRATIAN et al., 2006).
There is considerable variability between observers and the intermittent nature of the
procedure does not allow an assessment of the whole dynamics of the cervix during labour.
Pregnant women are usually evaluated on intermittent follow-up exams with time intervals
greater than 30 minutes, every 2 or 4 hours. During these exams monitoring information is
collected, but period information between the exams is not available. Also the exact time
in which the labour starts is unknown. Thus, most transitions are likely to be missed.
In longitudinal medical studies, the analysis is often performed using multi-state
models (MEIRA-MACHADO et al., 2009). A multi-state model is a model for a continuous
time stochastic process allowing individuals to move among a finite number of states.
Different model assumptions can be made about the dependence of the transition rates
on time. We assumed here the Markov property that the process depends only upon the
present state, not on the sequence of events that preceded it. Therefore, we assumed labour
can be represented as a state and time related phenomenon during a period ranging from
the onset of labour to childbirth like Nagamatsu et al. (1988). In this way, the labour
13
process can be considered as a mathematical model suitable for the application of the
multi-state Markov model.
This master’s dissertation proposes the application of mathematical and computa-
tional modelling techniques to develop a dynamic predictive model that could be used in
decision support for professionals who assist women during labour. This work uses data
from the prospective, multi-centre, cohort study of of the World Health Organization’s
Better Outcomes in Labour Difficulty (BOLD) project (SOUZA et al., 2015). The project
was submitted to the WHO Research Ethics Review Committee (WHO ERC) and approved
in August 2014 (see Appendix A). One of the main objectives of the BOLD project is
to develop innovative algorithms and tools for decision making during childbirth.
This is an article-based dissertation divided into four chapters. The first Chapter is
an introductory section. In Chapter 2, the main article is presented. Chapter 3 contains
three other articles related to the master’s project. At last, a conclusion is presented.

14
2 Article
Multi-state Markov model for spontaneous labour progression with vaginalbirth: a prospective cohort study in two sub-Saharan African countries
Rodrigo De Souza Reis1∗, Livia Oliveira-Ciabati1, Tiago Lara Michelin Sanches2, LarizaLaura de Oliveira2, Joao Paulo Dias De Souza1 and Domingos Alves1
1Department of Social Medicine, Ribeirao Preto Medical School, University of Sao Paulo,Ribeirao Preto, Sao Paulo, Brazil
2Centro de Informacao e Informatica em Saude/Fundacao de Apoio ao Ensino, Pesquisae Assistencia do Hospital das Clınicas, Ribeirao Preto Medical School, University of SaoPaulo, Ribeirao Preto, Sao Paulo, Brazil
∗Correspondence:
Department of Social Medicine, Ribeirao Preto Medical School
University of Sao Paulo
Av Bandeirantes, 3900
Ribeirao Preto, Sao Paulo, Brazil
14049-900
Background
Intrapartum care is critical to the survival of pregnant women and their babies as the
risk of serious morbidity and death increases during the period of birth (WORLD HEALTH
ORGANIZATION, 2018). A substantial proportion of pregnancy-related life-threatening
conditions and maternal deaths are attributed to complications that arise around the
labour (KASSEBAUM et al., 2014). These often include haemorrhage, obstructed labour
or sepsis (ALKEMA et al., 2016). Similarly, approximately half of all stillbirths and a
quarter of neonatal deaths result from complications during labour and childbirth (LAWN
et al., 2016).
In obstetric practice, an important indicator used to assess labour progress and
enable decision making during the intrapartum is the cervical dilatation. The cervix
represents the major impediment to the passage of the baby and its dilatation is a result

15
of the main physiological mechanisms involved in the labour process (FRIEDMAN, 1959).
Therefore, the graphical presentation of cervical dilatation progression is an important
feature of the partograph and has been the central measure for detecting abnormal progress.
Those measures enable care providers have an understanding of which interventions are
appropriated.
Despite decades of research and partograph use, the concept of normal progression
and duration of cervix dilatation is neither universal nor standardised (ABALOS et
al., 2018). The problems associated with its measurement and recording during labour
constitute major obstacles for the study of its progression. The intermittent nature of the
process does not allow an assessment of the whole dynamics of the cervix. The identification
of the exactly time of labour onset is very contentious. The changes of dilatation over time
occur at unknown times which make it very difficult to study or mathematically model.
Previously proposed models to estimate the rate of normal cervical dilatation are largely
unpredictable (FERRAZZI et al., 2015) and usually subject of intense debate (COHEN;
FRIEDMAN, 2015b; COHEN; FRIEDMAN, 2015a; ZHANG et al., 2015).
The theory of stochastic process is the mathematical tool to study situations of
modelling complex systems where the probability distribution of random variables changes
over time. Particularly when we work with longitudinal medical studies, the analysis
are often performed using multi-state models (ANDERSEN; KEIDING, 2002; MEIRA-
MACHADO et al., 2009). It allows describing the transitions that a cohort of patients
makes among a number of mutually exclusive and exhaustive states during a series of
time intervals. Multi-state models for longitudinal or panel data are generally based on
the Markov assumption that future evolution only depends on the current state. The
supposition enables reasoning and computation with a model that would otherwise be
intractable.
The goal of this study is to present the use of multi-state Markov modelling as
alternative to model labour progression through the cervical dilation progress. The analysis
performed here was conducted as part of the WHO’s Better Outcomes in Labour Difficulty
(BOLD) project (OLADAPO et al., 2015). The project was primarily designed to identify
the essential elements of labour monitoring that trigger the decision to use interventions
aimed at preventing poor labour outcomes.
16
Methods
Data
The data employed in this article are from the World Health Organization (WHO)
Better Outcome in Labour Difficult (BOLD) project. This was a prospective, multi-centre,
cohort study of women admitted for vaginal birth with single live fetus during early
first stage of labour. It was conducted at 13 maternity hospitals in Nigeria and Uganda
from December 2015 to November 2016. The study protocol and detailed methodological
considerations have been published elsewhere (SOUZA et al., 2015). The information was
collected on paper forms for individual study participants by trained research assistants
at each health facility. Briefly, the data were collected on maternal admission character-
istics, multiple assessments during labour monitoring, indication and timing of selected
interventions and maternal and neonatal labour outcomes.
From the initial database we included births at term (between 37 weeks and 0 days
and 41 weeks and 6 days) with vertex presentation, spontaneous labour onset and vaginal
delivery. We excluded women who had labour induction, previous uterine scar, or elective
cesarean. To examine the labour patterns in women with normal perinatal outcomes,
we also excluded women whose labour resulted in severe adverse outcomes. The adverse
outcomes was defined as occurrence of any of the following: stillbirths, early neonatal
deaths, neonatal use of anticonvulsants, neonatal cardiopulmonary resuscitation, apgar at
5 minutes score < 6, maternal death or organ dysfunction with labour dystocia and uterine
rupture. We further excluded women who gave birth to neonates with severe congenital
malformation and those with fewer than two cervical dilatation assessments. The dataset
used in this article has been published and made available elsewhere (OLADAPO et al.,
2018).
We grouped the selected women into three parity groups (para 0, 1 or 2+). Parity
is the number of pregnancies carried to viable gestational age. A woman who has never
carried a pregnancy beyond 20 weeks is nulliparous and is called a nullipara or ”para 0”.
A woman who has given birth one or more times is a multiparous and can also be referred
to as ”para 1”, ”para 2”, ”para 3” and so on. Here we referred women who has given birth
2 or more times to as ”para 2+”.

17
The data were specified as a series of observations for each eligible participant. The
variables selected for each observation indicate the time of observation in hours and either
the observed cervical dilatation in centimetres or the occurrence of vaginal delivery. The
first time the cervical dilatation reached 2 cm or more was marked as the starting point
(time=0).
Multi-state Markov Modelling
A multi-state Markov model is a stochastic process (X(t), t ∈ T ) which assumes
the markovian property (MEIRA-MACHADO et al., 2009). X(t) represents the state
occupied from a finite state space (S = 1, . . . , N) at time t that varies over a period of time
(T = [0,∞)). With the evolution of the process over time, a history Hs− will be generated
consisting of the observation of the process over the interval [0, s). The multi-state Markov
model is fully characterised through transition probabilities between states i and j ∈ S.
Therefore, for any s, t ∈ T with 0 ≤ s < t, we have:
pij(s, t) = (X(t) = j|X(s) = i,Hs−) = p(X(t) = j|X(s) = i),
Thus, the future states of the process after time s depends only on the state
occupied at time s, not on the sequence of events that preceded it. The model can also be
fully characterised through transition intensities:
qij(t) = limt→0
pij(t, t + ∆t)
∆t
The intensity represents the instantaneous risk of moving from state i to state j 6= i.
The set of intensities, qij, form a R×R matrix Q whose rows sum to zero. Any diagonal
entries qii of Q are constrained to be minus the sum of all the other entries in the row.
For a time-homogeneous process, the set of transition probabilities pij(s, t) (for
s, t ∈ T with 0 ≤ s < t) form the transition probability matrix P (t). The (i, j) entry of
P (t), pij(s, t), is the probability of being in state j at a time t, given the state i at time s.
P (t) can be calculated by taking the matrix exponential of the scaled transition intensity
matrix.
P (t) = Exp(tQ).
To derive a Multi-state Markov model, we estimated the maximum likelihood for the
transition intensity parameters (KALBFLEISCH; LAWLESS, 1985). The only information

18
used was the observed states at a set of time. The sampling times were assumed to be
non-informative. Also, the time of entry into the absorbing state was assumed as exactly
observed. We estimated the likelihood from the transition probability matrix P using the
Kolmogorov exponential intensity relationship. We used eigensystem decomposition to
calculate the matrix exponential in case of distinct eigenvalues. When there were repeated
eigenvalues, we used a method based on Pade approximants with scaling and squaring
(MOLER; LOAN, 2003).
This process requires some simplifications and approximations. In this work we
assumed that the behaviour of the underlying process is obeying a homogeneous Markov
model. This assumption requires that the future evolution of the system depend only on its
current state, not on the full history of the progression up to that point (COX; MILLER,
1965). To fit the Multi-state Markov models, all analysis was carried out using R version
3.0.1 (R Core Team, 2018) and the msm package (JACKSON, 2011). The package provides
functions for multi-state modelling and it was designed for processes observed at arbitrary
times in continuous time. The background to the method is explained in the package’s
documentation on which much of the explanation here is based.
Model Structure
The multi-state Markov model is a useful way of describing a process in which
an individual moves through a series of states in continuous time where the exact times
for state changes are unobserved. We can represent labour progression as a state and
time related phenomenon during a period that range from onset spontaneous labour to
full cervix opening until vaginal birth. In this manner, this process is suitable for the
application of multi-state Markov modelling.
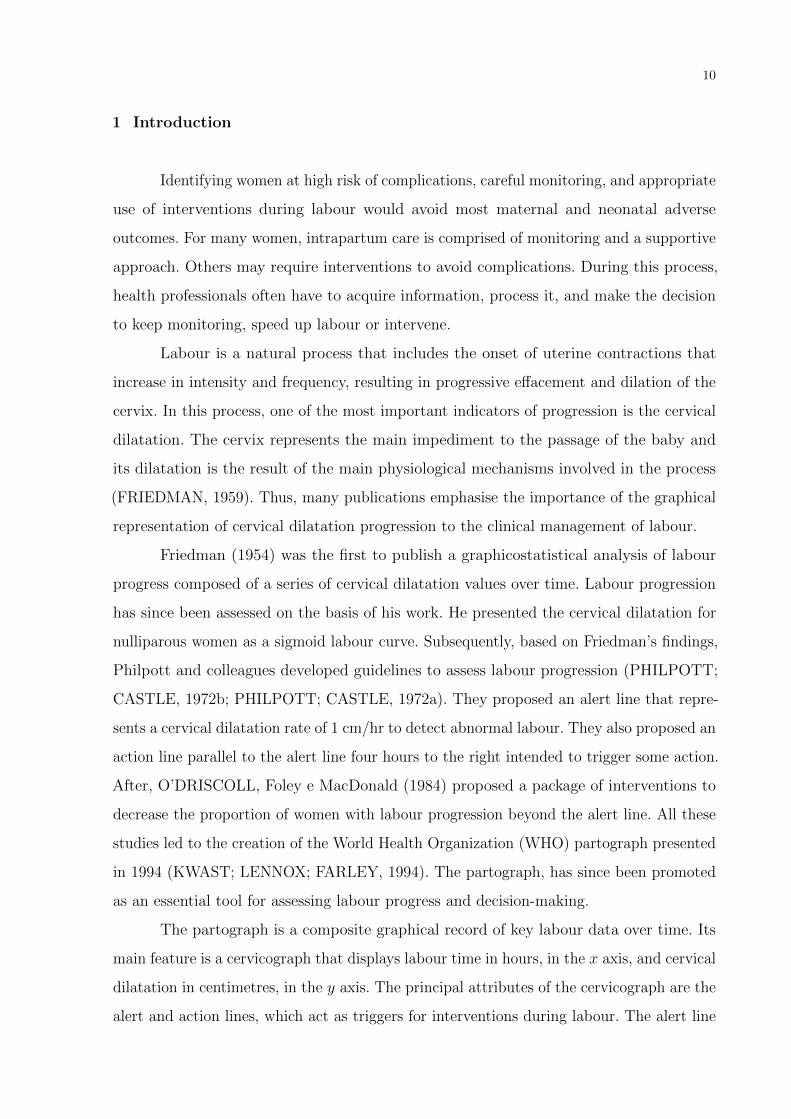
The structure of the multi-state Markov model for labour progression is illustrated
in Figure 1. We designed it as an (unidirectional) progressive model which consists of one
simple chain of 9 states similar to the presented by Nagamatsu et al. (1988). Thus, the
model is more realistic to the scenario where parturient women had a vaginal delivery.
The arrows show which transitions are possible between two states. Individuals can only
progress through the states sequentially 1 to 8 (representing 2, 3, 4, 5, 6, 7, 8 and 10
centimetres of cervical dilatation) until the absorbing state 9 (the vaginal birth). There

19
were no observations of 9 centimetres of cervical dilatation in our dataset, so we do not
represent this state in our model.
Figure 1 – State diagram for labour progression. Unidirectional, progressive, 9-statemodel for labour progression. Paturients advances through the states sequen-tially 1 to 8 (2 to 10 cm of cervical dilatation) until the absorbing state 10 (thevaginal birth).
At a time t the parturient woman is in one of the described states. The next
state to which the woman moves and the time of the change are governed by a set of
transition intensities for each pair of states i and j. The transition intensity represents the
instantaneous likelihood of moving from states i to state j. The full set of intensities for
our proposed system form the matrix Q:
Q =
q11 q12 0 0 0 0 0 0 0
0 q22 q23 0 0 0 0 0 0
0 0 q33 q34 0 0 0 0 0
0 0 0 q44 q45 0 0 0 0
0 0 0 0 q55 q56 0 0 0
0 0 0 0 0 q66 q67 0 0
0 0 0 0 0 0 q77 q78 0
0 0 0 0 0 0 0 q88 q89
0 0 0 0 0 0 0 0 0
We may observe a patient moving from state 1 to state 3. However, we could still
have a transition intensity from these states equal to 0 on the Q matrix. In this way, the
proposed model specifies that the patient must have passed through state 2 in between,
rather than jumping straight from state 1 to 3.
Results
From a total of 8,957 singleton births with consistent time records in the database,
we restricted our analysis to 5,606 women based on the inclusion criteria described in

20
Figure 2. First, we excluded 779 preterm and post-term births. Then, we excluded 728
women who had labour induction and 714 who had non-vertex presentations. After that, we
removed 838 women who had cesarean section during labour. Also, we excluded 262 women
with previous uterine scar, 456 with less than 2 cervix assessments and 94 with adverse
perinatal outcomes. The final sample consisted of 2.166 nulliparous women, 1.488 women
who has given one birth and 1.952 who has given two or more births. The characteristics
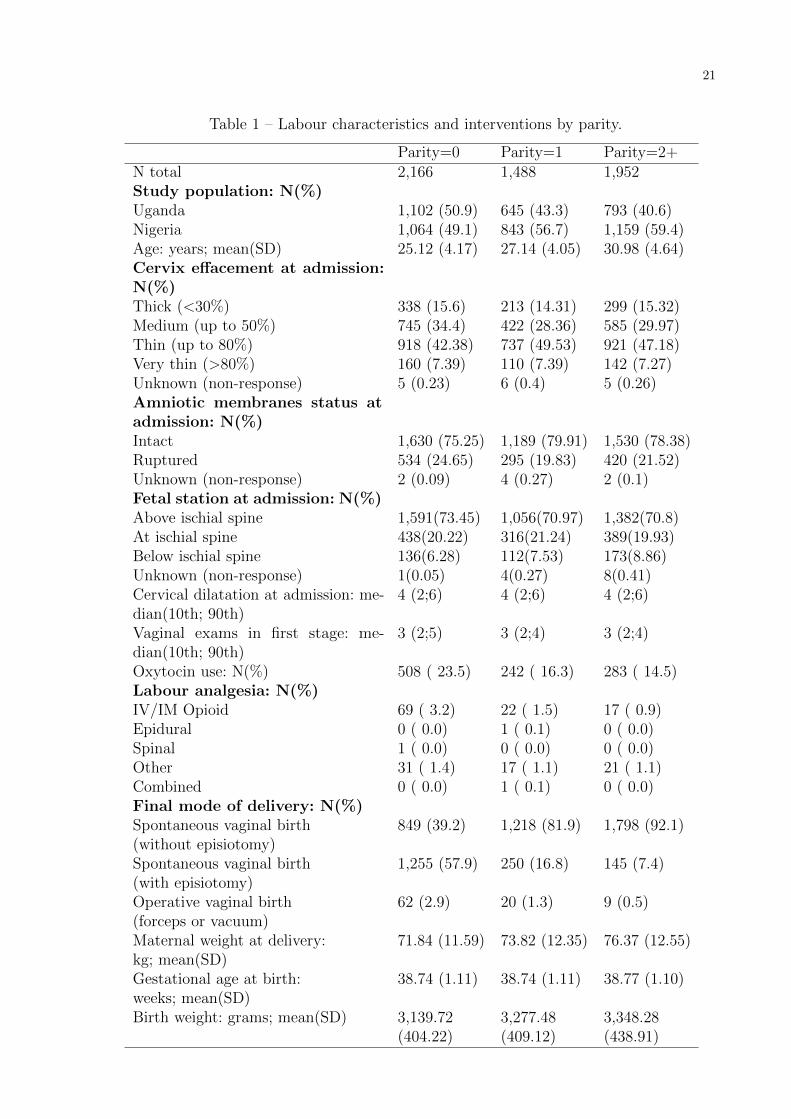
of selected women are presented by parity in Table 1.
Figure 2 – Sample selection flow chart.
In the selected sample, 54.7% of the women were from Uganda and 45.3% were
from Nigeria. Nulliparous women were younger than the multiparous women, constituted
over a third of the study sample, and were evenly balanced between the two countries.
At labour admission, spontaneous rupture of the membranes had occurred in a quarter
of nulliparous women and in about one-fifth of multiparous women. The cervix was well
effaced (thin or very thin) in half of the nulliparous and in slightly higher proportions in
the multiparous groups. The median cervical dilatation was 4 cm. The median number of
vaginal examinations in the first stage was 3. The number of spontaneous vaginal birth
with episotomy was higher in nulliparous women. The gestational age at birth was similar
among the parity groups.
21
Table 1 – Labour characteristics and interventions by parity.
Parity=0 Parity=1 Parity=2+N total 2,166 1,488 1,952Study population: N(%)Uganda 1,102 (50.9) 645 (43.3) 793 (40.6)Nigeria 1,064 (49.1) 843 (56.7) 1,159 (59.4)Age: years; mean(SD) 25.12 (4.17) 27.14 (4.05) 30.98 (4.64)Cervix effacement at admission:N(%)Thick (<30%) 338 (15.6) 213 (14.31) 299 (15.32)Medium (up to 50%) 745 (34.4) 422 (28.36) 585 (29.97)Thin (up to 80%) 918 (42.38) 737 (49.53) 921 (47.18)Very thin (>80%) 160 (7.39) 110 (7.39) 142 (7.27)Unknown (non-response) 5 (0.23) 6 (0.4) 5 (0.26)Amniotic membranes status atadmission: N(%)Intact 1,630 (75.25) 1,189 (79.91) 1,530 (78.38)Ruptured 534 (24.65) 295 (19.83) 420 (21.52)Unknown (non-response) 2 (0.09) 4 (0.27) 2 (0.1)Fetal station at admission: N(%)Above ischial spine 1,591(73.45) 1,056(70.97) 1,382(70.8)At ischial spine 438(20.22) 316(21.24) 389(19.93)Below ischial spine 136(6.28) 112(7.53) 173(8.86)Unknown (non-response) 1(0.05) 4(0.27) 8(0.41)Cervical dilatation at admission: me-dian(10th; 90th)
4 (2;6) 4 (2;6) 4 (2;6)
Vaginal exams in first stage: me-dian(10th; 90th)
3 (2;5) 3 (2;4) 3 (2;4)
Oxytocin use: N(%) 508 ( 23.5) 242 ( 16.3) 283 ( 14.5)Labour analgesia: N(%)IV/IM Opioid 69 ( 3.2) 22 ( 1.5) 17 ( 0.9)Epidural 0 ( 0.0) 1 ( 0.1) 0 ( 0.0)Spinal 1 ( 0.0) 0 ( 0.0) 0 ( 0.0)Other 31 ( 1.4) 17 ( 1.1) 21 ( 1.1)Combined 0 ( 0.0) 1 ( 0.1) 0 ( 0.0)Final mode of delivery: N(%)Spontaneous vaginal birth 849 (39.2) 1,218 (81.9) 1,798 (92.1)(without episiotomy)Spontaneous vaginal birth 1,255 (57.9) 250 (16.8) 145 (7.4)(with episiotomy)Operative vaginal birth 62 (2.9) 20 (1.3) 9 (0.5)(forceps or vacuum)Maternal weight at delivery: 71.84 (11.59) 73.82 (12.35) 76.37 (12.55)kg; mean(SD)Gestational age at birth: 38.74 (1.11) 38.74 (1.11) 38.77 (1.10)weeks; mean(SD)Birth weight: grams; mean(SD) 3,139.72 3,277.48 3,348.28
(404.22) (409.12) (438.91)

22
We summarised the data by counting, for each state i and j, the number of times
an observation of state i was followed by state j in Table 2. The resulting matrices
are upper triangular matrices in which the entries below the main diagonal are all zero.
In other words, there are no transitions returning from a state to an earlier one. The
diagonal counts tends to decrease as states progress. This shows that in advanced states
the transitions are faster.
Table 2 – Number of observed transitions by parity.
Parity From 2cm 3cm 4cm 5cm 6cm 7cm 8cm 10cm BirthTo
0 2cm 139 90 181 66 58 22 13 5 263cm 0 97 147 73 53 31 14 10 234cm 0 0 243 214 321 163 153 125 1065cm 0 0 0 89 128 118 141 165 1356cm 0 0 0 0 115 108 207 284 3007cm 0 0 0 0 0 18 35 179 2358cm 0 0 0 0 0 0 20 244 32510cm 0 0 0 0 0 0 0 6 1015
1 2cm 49 32 47 27 28 3 6 4 113cm 0 36 76 41 38 14 12 3 204cm 0 0 150 109 129 88 118 88 945cm 0 0 0 67 55 81 103 121 1216cm 0 0 0 0 74 41 137 215 1847cm 0 0 0 0 0 10 17 104 1108cm 0 0 0 0 0 0 11 160 24010cm 0 0 0 0 0 0 0 3 705
2+ 2cm 67 45 75 32 31 9 7 6 153cm 0 73 109 50 42 25 22 10 244cm 0 0 230 122 215 111 136 126 1205cm 0 0 0 117 103 87 93 175 1436cm 0 0 0 0 93 66 146 324 2807cm 0 0 0 0 0 9 23 136 1428cm 0 0 0 0 0 0 7 180 25510cm 0 0 0 0 0 0 0 2 969
In Table 3 we presented all estimated non-zero transitions intensities qij of Q. The
corresponding confidence interval is also given for each transition intensity. As shown, the
transition rate of moving to the next state is inversely proportional to the intensity of
staying at the same state. We can also observe that the transition rates increase as the
states advance. Also showing faster transitions for greater values of cervical dilatation.
The probability distribution of women occupying each state within a 16-hour period
by 1 hour cycle starting at 4cm of cervical dilatation is presented in Figure 3. The

23
Table 3 – Estimated transition rates with 95% confidence intervals for each model byparity.
Parity 0 Parity 1 Parity 2+2cm - 2cm -0.2385 -0.1967 -0.2508
(-0.2650; -0.2146) (-0.2339; -0.1655) (-0.2928; -0.2148)2cm - 3cm 0.2385 0.1967 0.2508
(0.2146; 0.2650) (0.1655; 0.2339) (0.2148; 0.2928)3cm - 3cm -0.3648 -0.3545 -0.3081
(-0.4025; -0.3306) (-0.4084; -0.3077) (-0.3450; -0.2752)3cm - 4cm 0.3648 0.3545 0.3081
(0.3306; 0.4025) (0.3077; 0.4084) (0.2752; 0.3450)4cm - 4cm -0.4219 -0.4677 -0.4602
(-0.4498; -0.3957) (-0.5106; -0.4284) (-0.4954; -0.4275)4cm - 5cm 0.4219 0.4677 0.4602
(0.3957; 0.4498) (0.4284; 0.5106) (0.4275; 0.4954)5cm - 5cm -0.7779 -0.8236 -0.8928
(-0.8345; -0.7251) (-0.9035; -0.7507) (-0.9761; -0.8166)5cm - 6cm 0.7779 0.8236 0.8928
(0.7251; 0.8345) (0.7507; 0.9035) (0.8166; 0.9761)6cm - 6cm -0.6986 -0.8545 -0.8228
(-0.7432; -0.6566) (-0.9346; -0.7813) (-0.8898; -0.7608)6cm - 7cm 0.6986 0.8545 0.8228
(0.6566; 0.7432) (0.7813; 0.9346) (0.7608; 0.8898)7cm - 7cm -1.1709 -1.6118 -1.9458
(-1.2674; -1.0818) (-1.8111; -1.4344) (-2.1851; -1.7328)7cm - 8cm 1.1709 1.6118 1.9458
(1.0818; 1.2674) (1.4344; 1.8111) (1.7328; 2.1851)8cm - 8cm -0.8819 -1.0092 -1.1818
(-0.9455; -0.8226) (-1.1165; -0.9122) (-1.3186; -1.0591)8cm - 10cm 0.8819 1.0092 1.1818
(0.8226; 0.9455) (0.9122; 1.1165) (1.0591; 1.3186)10cm - 10cm -1.1434 -1.1343 -1.1536
(-1.2229; -1.0690) (-1.2308; -1.0453) (-1.2545; -1.0608)10cm - Birth 1.1434 1.1343 1.1536
(1.0690; 1.2229) (1.0453; 1.2308) (1.0608; 1.2545)-2 * log-likelihood 21,743.7 13,525.32 17,704.05

24
bubble’s size is proportional to each probability. At the start point the probability of being
at 4cm is 1 (100%). Two hours after starting at 4cm, the probability of continuing in
4cm is 0.43 (43%) and the probability of being at 5cm, 6cm and 7cm are 0.26 (26%), 0.19
(19%) and 0.07 (7%) respectively. 16 hours later the probability of a nulliparous pregnant
women reach the vaginal birth is 97%.
Figure 3 – Bubble chart of transitions probabilities for nulliparous starting at4cm of cervical dilatation with one hour cycle from 0 to 16 hours.
The results shown in Table 4 describes the average time and their confidence
limits an individual spends in each state in a single stay before she makes a transition
to another state. The estimated mean sojourn times and expected total length of stay
are equal as the model is progressive and once the individual leaves a state she cannot
return. Smaller values of cervical dilatation had greater estimations of total length of stay
and mean sojourn times. We also observe that the greater the dilation the narrower the
confidence interval.
We present in Figure 4 the estimations of the observed numbers of nulliparous
occupying a state during the period of 16 hours. Forecasts from the fitted model are
also plotted against these estimations. Individuals with 3cm, 5cm and 6cm of cervical
dilatation appear to have a good fit. However, individuals predicted to have 2cm and 4cm
are underestimated while those predicted to have 7cm, 8cm and 10cm are overestimated.

25
Table 4 – Estimation of the expected total length of stay in hours with 95% confidenceintervals of multi-state Markov models by parity.
Parity 0 Parity 1 Parity 2+2cm 4.1936 (3.7734; 4.6607) 5.0827 (4.2748; 6.0433) 3.9871 (3.4147; 4.6554)3cm 2.7413 (2.4845; 3.0247) 2.8211 (2.4486; 3.2503) 3.2455 (2.8986; 3.6339)4cm 2.3703 (2.2231; 2.5272) 2.1382 (1.9586; 2.3343) 2.1731 (2.0187; 2.3393)5cm 1.2855 (1.1983; 1.3792) 1.2142 (1.1068; 1.3321) 1.1200 (1.0245; 1.2246)6cm 1.4315 (1.3455; 1.5230) 1.1703 (1.0700; 1.2800) 1.2154 (1.1239; 1.3144)7cm 0.8540 (0.7890; 0.9244) 0.6204 (1.0700; 1.2800) 0.5139 (0.4576; 0.5771)8cm 1.1339 (1.0577; 1.2157) 0.9909 (0.8957; 1.0962) 0.8462 (0.7584; 0.9442)10cm 0.8746 (0.8177; 0.9354) 0.8816 (0.8125; 0.9566) 0.8669 (0.7972; 0.9427)Birth Inf Inf Inf
Figure 4 – Estimated observed and expected proportions of nulliparous womenat each state in 16 hours. Observed prevalence are indicated as solid lines,expected prevalence as dashed lines.

26
We also display in Figure 5 trajectories of nulliparous women from the BOLD
cohort dataset and simulated trajectories from the multi-state Markov model for parity 0
with randomly placed observation times, both starting at 4cm.
Figure 5 – Real and simulated trajectories of individual realisations of labourprogress starting at 4cm for nulliparous women. a) observed trajectoriesfrom BOLD’s cohort data. b) simulated trajectories with randomly generatedobservation times from multistate Markov model
Discussion
From the analysis presented, it is possible to obtain a model that well represents
labour progression during the time. In addition, it is possible to simulate new cohorts
of labour progression similar to that studied. Understanding of the natural progression
27
of labour presents unique challenges and it is important to identify elements of labour
monitoring that trigger the decision to use interventions. Multi-state Markov modelling
appears to be a good approach to model labour progress as it takes into account the main
problems related to labour data: arbitrary observations times in continuous time and its
large randomness. Distributions of potential outcomes are derived from a large number of
simulations which reflect the random variation in the input. It shows not only the most
likely estimate but what ranges are reasonable too.
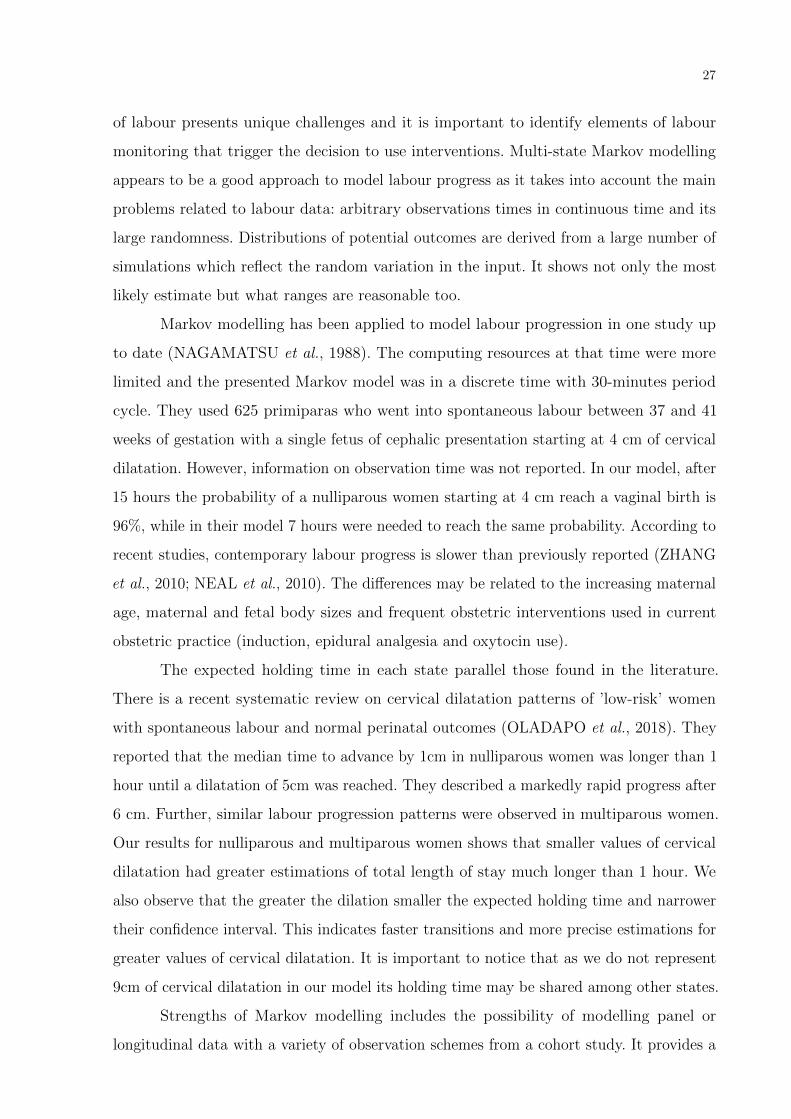
Markov modelling has been applied to model labour progression in one study up
to date (NAGAMATSU et al., 1988). The computing resources at that time were more
limited and the presented Markov model was in a discrete time with 30-minutes period
cycle. They used 625 primiparas who went into spontaneous labour between 37 and 41
weeks of gestation with a single fetus of cephalic presentation starting at 4 cm of cervical
dilatation. However, information on observation time was not reported. In our model, after
15 hours the probability of a nulliparous women starting at 4 cm reach a vaginal birth is
96%, while in their model 7 hours were needed to reach the same probability. According to
recent studies, contemporary labour progress is slower than previously reported (ZHANG
et al., 2010; NEAL et al., 2010). The differences may be related to the increasing maternal
age, maternal and fetal body sizes and frequent obstetric interventions used in current
obstetric practice (induction, epidural analgesia and oxytocin use).
The expected holding time in each state parallel those found in the literature.
There is a recent systematic review on cervical dilatation patterns of ’low-risk’ women
with spontaneous labour and normal perinatal outcomes (OLADAPO et al., 2018). They
reported that the median time to advance by 1cm in nulliparous women was longer than 1
hour until a dilatation of 5cm was reached. They described a markedly rapid progress after
6 cm. Further, similar labour progression patterns were observed in multiparous women.
Our results for nulliparous and multiparous women shows that smaller values of cervical
dilatation had greater estimations of total length of stay much longer than 1 hour. We
also observe that the greater the dilation smaller the expected holding time and narrower
their confidence interval. This indicates faster transitions and more precise estimations for
greater values of cervical dilatation. It is important to notice that as we do not represent
9cm of cervical dilatation in our model its holding time may be shared among other states.
Strengths of Markov modelling includes the possibility of modelling panel or
longitudinal data with a variety of observation schemes from a cohort study. It provides a

28
better representation of real life scenarios from more angles, including the incorporation
of empirical observations in the mode of modelling. The different possibilities of model
structure includes the use of covariates, piecewise-constant, censored states, misclassification
models and competing death states. The model gives a distributions of potential outcomes
and shows what ranges are reasonable too which can be more useful for decision making.
However, we also highlight some limitations. For a time-homogeneous Markov jump
process, the holding time in a given state is modelled using exponential distributions. The
exponential distributions is memoryless and may not be adequate for all real-life situations.
Multi-state Markov models are also limited by computing resources as well simulation error.
Other limitations includes the measurement of the cervix and data acquisition. A large
number of transitions were likely to be missed as it is expected that the dilation progress
sequentially. It is important to notice that there was no observation of 9 centimetres of
cervical dilatation in our dataset and we did not represent this state in our model. A study
argues that the frequency of vaginal examinations is once every 2 hours, and the median
duration of labour between 9 and 10 cm is 0.5 hour. Thus the likelihood that a woman is
observed at both 9 cm and promptly at 10 cm is very small and under the current practice,
it is likely to be missed in the vast majority of women (ZHANG et al., 2015).
Using the BOLD’s dataset, we have already applied the multi-state Markov model
to enable the study of the patterns of labour progression (OLADAPO et al., 2018). The
model was applied to determine how long it took the cervix to dilate by 1 cm from one
level of dilatation to the next until full dilatation (10 cm). It was important in determining
the time required for the cervix to achieve complete dilatation based on the dilatation at
the time of labour admission. Also, we used the same method to obtain population average
cervical dilatation time curves (labour curves) for the women in the sample. In that article,
we conclude that averaged labour curves may not truly reflect labour progression and their
use for decision-making in labour management should be deemphasized. The research
among others had a practical implication on the WHO recommendations: ”Intrapartum
care for a positive childbirth experience” which will influence the intrapartum obstetric
care for the next decades (WORLD HEALTH ORGANIZATION, 2018).

29
Conclusions
In this article a multi-state continuous-time homogeneous Markov model is fitted
to labour progression data. The results obtained shows that multi-state Markov modelling
is a robust method to study labour progression. In a future study, the applicability for
decision-making in the management of labour for individual women will be analysed. We
hope that the presented study generate ideas for new models in the field and that these
models could be tested and applied to obstetric practice in the future.

30
3 Other Articles
During the Master’s project, some articles have been published using the same
framework.
We have applied multi-state Markov modelling to generate customised labour
curves. Then, we assessed their accuracy compared with the WHO partograph lines in the
identification of women at risk of developing severe adverse birth outcomes (SOUZA et al.,
2018). In that article, we hypothesised that cervical dilatation curves customised according
to the obstetric characteristics of the population could have a better accuracy than the
generic alert and action lines. The study population was stratified into mutually exclusive,
totally inclusive obstetric groups according to the 10-group Robson classification. The
results showed that labour is an extremely variable phenomenon, and the assessment of
cervical dilatation curves and partograph lines are a poor predictor of severe adverse birth
outcomes. The article is presented in the Appendix B.
Using the BOLD’s dataset, we have also applied the multi-state markov model to
enable the study of the patterns of labour progression (OLADAPO et al., 2018). In the
article presented in Appendix C, the model was applied to determine how long it took
the cervix to dilate by 1 cm from one level of dilatation to the next until full dilatation (10
cm). It was important in determining the time required for the cervix to achieve complete
dilatation based on the dilatation at the time of labour admission. Also, we used the same
method to obtain population average cervical dilatation time curves (labour curves) for the
women in the sample. In that article, we conclude that averaged labour curves may not truly
reflect labour progression and their use for decision-making in labour management should
be deemphasized. The research among others had a practical implication on the WHO
recommendations Intrapartum care for a positive childbirth experience which will influence
the intrapartum obstetric care for the next decades (WORLD HEALTH ORGANIZATION,
2018).
In a further related article, the development of a system for antenatal and labour
care of pregnant women in the Brazilian private health system was presented. A partograph
and an instrument for recording antenatal medical appointments were implemented as
a software. The presented application would assist health professionals in the follow-up
of women from the gestation period until delivery. The tool was intended to ease the

31
burden of health professionals during labour and promote better management. The article
is presented in Appendix D.

32
4 Conclusions
With the work presented in this dissertation, we conclude that multi-state Markov
modelling can be a robust method to study labour progression. In a future study, the
applicability of the model for decision-making in the management of labour could be better
analysed. We hope that the presented study generate ideas for new models in the field
and that these models could be tested and applied to obstetric practice.
33
Bibliography
ABALOS, E.; OLADAPO, O. T.; CHAMILLARD, M.; DıAZ, V.; PASQUALE, J.;BONET, M.; SOUZA, J. P.; GuLMEZOGLU, A. M. Duration of spontaneous labourin ’low-risk’ women with ‘normal’ perinatal outcomes: A systematic review. EuropeanJournal of Obstetrics & Gynecology and Reproductive Biology, v. 223, p. 123 – 132, 2018.ISSN 0301-2115. Disponıvel em: 〈http://www.sciencedirect.com/science/article/pii/S0301211518300824〉. Cited 2 times on pages 11 e 15.
ALKEMA, L.; CHOU, D.; HOGAN, D.; ZHANG, S.; MOLLER, A.-B.; GEMMILL, A.;FAT, D. M.; BOERMA, T.; TEMMERMAN, M.; MATHERS, C.; SAY, L. Global, regional,and national levels and trends in maternal mortality between 1990 and 2015, with scenario-based projections to 2030: a systematic analysis by the un maternal mortality estimationinter-agency group. The Lancet, v. 387, n. 10017, p. 462 – 474, 2016. ISSN 0140-6736.Disponıvel em: 〈http://www.sciencedirect.com/science/article/pii/S0140673615008387〉.Cited on page 14.
ANDERSEN, P. K.; KEIDING, N. Multi-state models for event history analysis.Statistical Methods in Medical Research, v. 11, n. 2, p. 91–115, 2002. PMID: 12040698.Disponıvel em: 〈https://doi.org/10.1191/0962280202SM276ra〉. Cited on page 15.
BETRaN, A. P.; YE, J.; MOLLER, A.-B.; ZHANG, J.; GuLMEZOGLU, A. M.;TORLONI, M. R. The increasing trend in caesarean section rates: Global, regional andnational estimates: 1990-2014. PLOS ONE, Public Library of Science, v. 11, n. 2, p. 1–12,02 2016. Disponıvel em: 〈https://doi.org/10.1371/journal.pone.0148343〉. Cited on page11.
COHEN, W. R.; FRIEDMAN, E. A. Misguided guidelines for managing labor. AmericanJournal of Obstetrics and Gynecology, v. 212, n. 6, p. 753.e1 – 753.e3, 2015. ISSN 0002-9378.Disponıvel em: 〈http://www.sciencedirect.com/science/article/pii/S0002937815003762〉.Cited on page 15.
COHEN, W. R.; FRIEDMAN, E. A. Perils of the new labor management guidelines.American Journal of Obstetrics and Gynecology, v. 212, n. 4, p. 420 – 427, 2015.ISSN 0002-9378. Disponıvel em: 〈http://www.sciencedirect.com/science/article/pii/S0002937814009272〉. Cited on page 15.
COX, D. R.; MILLER, H. D. The theory of stochastic processes. Chapman and Hall, 1965.Cited on page 18.
COX, D. R.; MILLER, H. D. The theory of stochastic processes. [S.l.]: CRC Press, 1977.v. 134. Cited on page 12.
FERRAZZI, E.; MILANI, S.; CIRILLO, F.; LIVIO, S.; PIOLA, C.; BRUSATI, V.;PAGANELLI, A. Progression of cervical dilatation in normal human labor is unpredictable.Acta Obstetricia et Gynecologica Scandinavica, v. 94, n. 10, p. 1136–1144, 2015. Disponıvelem: 〈https://obgyn.onlinelibrary.wiley.com/doi/abs/10.1111/aogs.12719〉. Cited on page15.
FRIEDMAN, E. A. The graphic analysis of labor. American journal of obstetrics andgynecology, Elsevier, v. 68, n. 6, p. 1568–1575, 1954. Cited on page 10.

34
FRIEDMAN, E. A. Graphic analysis of labor. Bulletin of the American College ofNurse-Midwifery, v. 4, n. 3-4, p. 94–105, 1959. Disponıvel em: 〈https://onlinelibrary.wiley.com/doi/abs/10.1111/j.1542-2011.1959.tb00531.x〉. Cited 2 times on pages 10 e 15.
JACKSON, C. H. Multi-state models for panel data: The msm package forR. Journal of Statistical Software, v. 38, n. 8, p. 1–29, 2011. Disponıvel em:〈http://www.jstatsoft.org/v38/i08/〉. Cited on page 18.
KALBFLEISCH, J. D.; LAWLESS, J. F. The analysis of panel data under a markovassumption. Journal of the American Statistical Association, [American StatisticalAssociation, Taylor & Francis, Ltd.], v. 80, n. 392, p. 863–871, 1985. ISSN 01621459.Disponıvel em: 〈http://www.jstor.org/stable/2288545〉. Cited on page 17.
KASSEBAUM, N. J.; BERTOZZI-VILLA, A.; COGGESHALL, M. S.; SHACKELFORD,K. A.; STEINER, C.; HEUTON, K. R.; GONZALEZ-MEDINA, D.; BARBER, R.;HUYNH, C.; DICKER, D. et al. Global, regional, and national levels and causes ofmaternal mortality during 1990–2013: a systematic analysis for the global burden ofdisease study 2013. The Lancet, v. 384, n. 9947, p. 980 – 1004, 2014. ISSN 0140-6736.Disponıvel em: 〈http://www.sciencedirect.com/science/article/pii/S0140673614606966〉.Cited on page 14.
KWAST, B.; LENNOX, C.; FARLEY, T. World health organization partograph inmanagement of labour. world health organization maternal health and safe motherhoodprogramme. The Lancet, v. 343, p. 1399–1404, 06 1994. Cited on page 10.
LAWN, J. E.; BLENCOWE, H.; WAISWA, P.; AMOUZOU, A.; MATHERS, C.;HOGAN, D.; FLENADY, V.; FRøEN, J. F.; QURESHI, Z. U.; CALDERWOOD,C.; SHIEKH, S.; JASSIR, F. B.; YOU, D.; MCCLURE, E. M.; MATHAI, M.;COUSENS, S. Stillbirths: rates, risk factors, and acceleration towards 2030. TheLancet, v. 387, n. 10018, p. 587 – 603, 2016. ISSN 0140-6736. Disponıvel em:〈http://www.sciencedirect.com/science/article/pii/S0140673615008375〉. Cited on page14.
MEIRA-MACHADO, L.; UnA-ALVAREZ, J. de; CADARSO-SUaREZ, C.; ANDERSEN,P. K. Multi-state models for the analysis of time-to-event data. Statistical Methodsin Medical Research, v. 18, n. 2, p. 195–222, 2009. PMID: 18562394. Disponıvel em:〈https://doi.org/10.1177/0962280208092301〉. Cited 3 times on pages 12, 15 e 17.
MOLER, C.; LOAN, C. V. Nineteen dubious ways to compute the exponential of amatrix, twenty-five years later. SIAM Review, v. 45, n. 1, p. 3–49, 2003. Disponıvel em:〈https://doi.org/10.1137/S00361445024180〉. Cited on page 18.
NAGAMATSU, A.; KOYANAGI, T.; HIROSE, K.; NAKAHARA, H.; NAKANO, H. Anapplication of the markov process for quantitative prediction of labor progress. Journal ofPerinatal Medicine-Official Journal of the WAPM, Walter de Gruyter, Berlin/New York,v. 16, n. 4, p. 333–338, 1988. Cited 3 times on pages 12, 18 e 27.
NEAL, J. L.; LOWE, N. K.; AHIJEVYCH, K. L.; PATRICK, T. E.; CABBAGE, L. A.;CORWIN, E. J. ”active labor” duration and dilation rates among low-risk, nulliparouswomen with spontaneous labor onset: A systematic review. The Journal of Midwifery &Women’s Health, Wiley Online Library, v. 55, n. 4, p. 308–318, 2010. Cited on page 27.
35
OBSTETRICIANS, A. C. of; GYNECOLOGISTS et al. Safe prevention of the primarycesarean delivery. obstetric care consensus no. 1. Obstet Gynecol, v. 123, p. 693–711, 2014.Cited on page 11.
O’DRISCOLL, K.; FOLEY, M.; MACDONALD, D. Active management of labor as analternative to cesarean section for dystocia. Obstetrics & Gynecology, LWW, v. 63, n. 4, p.485–490, 1984. Cited on page 10.
OLADAPO, O.; DIAZ, V.; BONET, M.; ABALOS, E.; THWIN, S.; SOUZA, H.;PERDONa, G.; SOUZA, J.; GuLMEZOGLU, A. Cervical dilatation patterns of ‘low-risk’women with spontaneous labour and normal perinatal outcomes: a systematic review.BJOG: An International Journal of Obstetrics & Gynaecology, v. 125, n. 8, p. 944–954, 2018.Disponıvel em: 〈https://obgyn.onlinelibrary.wiley.com/doi/abs/10.1111/1471-0528.14930〉.Cited 2 times on pages 11 e 27.
OLADAPO, O. T.; SOUZA, J. P.; BOHREN, M. A.; TUNCALP, O.; VOGEL, J. P.;FAWOLE, B.; MUGERWA, K.; GULMEZOGLU, A. M. Who better outcomes in labourdifficulty (bold) project: innovating to improve quality of care around the time ofchildbirth. Reproductive Health, v. 12, n. 1, p. 48, May 2015. ISSN 1742-4755. Disponıvelem: 〈https://doi.org/10.1186/s12978-015-0027-6〉. Cited on page 15.
OLADAPO, O. T.; SOUZA, J. P.; FAWOLE, B.; MUGERWA, K.; PERDONa, G.; ALVES,D.; SOUZA, H.; REIS, R.; OLIVEIRA-CIABATI, L.; MAIORANO, A.; AKINTAN, A.;ALU, F. E.; OYENEYIN, L.; ADEBAYO, A.; BYAMUGISHA, J.; NAKALEMBE, M.;IDRIS, H. A.; OKIKE, O.; ALTHABE, F.; HUNDLEY, V.; DONNAY, F.; PATTINSON,R.; SANGHVI, H. C.; JARDINE, J. E.; TUNcALP, O.; VOGEL, J. P.; STANTON, M. E.;BOHREN, M.; ZHANG, J.; LAVENDER, T.; LILJESTRAND, J.; HOOPE-BENDER, P.ten; MATHAI, M.; BAHL, R.; GuLMEZOGLU, A. M. Progression of the first stage ofspontaneous labour: A prospective cohort study in two sub-saharan african countries.PLOS Medicine, Public Library of Science, v. 15, n. 1, p. 1–30, 01 2018. Disponıvel em:〈https://doi.org/10.1371/journal.pmed.1002492〉. Cited 3 times on pages 16, 28 e 30.
PHILPOTT, R. H.; CASTLE, W. M. Cervicographs in the management of labour inprimigravidae. i. the alert line for detecting abnormal labour. BJOG: An InternationalJournal of Obstetrics & Gynaecology, v. 79, n. 7, p. 592–598, 1972. Disponıvel em:〈https://obgyn.onlinelibrary.wiley.com/doi/abs/10.1111/j.1471-0528.1972.tb14207.x〉.Cited on page 10.
PHILPOTT, R. H.; CASTLE, W. M. Cervicographs in the management of labourin primigravidae. ii. the action line and treatment of abnormal labour. BJOG: AnInternational Journal of Obstetrics & Gynaecology, v. 79, n. 7, p. 599–602, 1972. Disponıvelem: 〈https://obgyn.onlinelibrary.wiley.com/doi/abs/10.1111/j.1471-0528.1972.tb14208.x〉.Cited on page 10.
R Core Team. R: A Language and Environment for Statistical Computing. Vienna,Austria, 2018. Disponıvel em: 〈https://www.R-project.org/〉. Cited on page 18.
SOUZA, J.; OLADAPO, O.; FAWOLE, B.; MUGERWA, K.; REIS, R.; BARBOSA-JUNIOR, F.; OLIVEIRA-CIABATI, L.; ALVES, D.; GuLMEZOGLU, A. Cervicaldilatation over time is a poor predictor of severe adverse birth outcomes: a diagnosticaccuracy study. BJOG: An International Journal of Obstetrics & Gynaecology, v. 125,

36
n. 8, p. 991–1000, 2018. Disponıvel em: 〈https://obgyn.onlinelibrary.wiley.com/doi/abs/10.1111/1471-0528.15205〉. Cited on page 30.
SOUZA, J. P.; OLADAPO, O. T.; BOHREN, M. A.; MUGERWA, K.; FAWOLE, B.;MOSCOVICI, L.; ALVES, D.; PERDONA, G.; OLIVEIRA-CIABATI, L.; VOGEL, J. P.;TUNCALP, O.; ZHANG, J.; HOFMEYR, J.; BAHL, R.; GULMEZOGLU, A. M.; Onbehalf of the WHO BOLD Research Group. The development of a simplified, effective,labour monitoring-to-action (selma) tool for better outcomes in labour difficulty (bold):study protocol. Reproductive Health, v. 12, n. 1, p. 49, May 2015. ISSN 1742-4755.Disponıvel em: 〈https://doi.org/10.1186/s12978-015-0029-4〉. Cited 2 times on pages 13e 16.
VAHRATIAN, A.; TROENDLE, J. F.; SIEGA-RIZ, A. M.; ZHANG, J. Methodologicalchallenges in studying labour progression in contemporary practice. Paediatric andperinatal epidemiology, Wiley Online Library, v. 20, n. 1, p. 72–78, 2006. Cited on page12.
WORLD HEALTH ORGANIZATION. WHO recommendations: intrapartum care for apositive childbirth experience. Geneva, 2018. Cited 3 times on pages 14, 28 e 30.
ZHANG, J.; LANDY, H. J.; BRANCH, D. W.; BURKMAN, R.; HABERMAN, S.;GREGORY, K. D.; HATJIS, C. G.; RAMIREZ, M. M.; BAILIT, J. L.; GONZALEZ-QUINTERO, V. H.; HIBBARD, J. U.; HOFFMAN, M. K.; KOMINIAREK, M.;LEARMAN, L. A.; VELDHUISEN, P. V.; TROENDLE, J.; REDDY, U. M.; LABOR,C. o. S. Contemporary patterns of spontaneous labor with normal neonatal outcomes.Obstet Gynecol, v. 116, n. 6, p. 1281–1287, Dec 2010. ISSN 1873-233X. Disponıvel em:〈https://www.ncbi.nlm.nih.gov/pubmed/21099592〉. Cited 2 times on pages 11 e 27.
ZHANG, J.; TROENDLE, J.; GRANTZ, K. L.; REDDY, U. M. Statisticalaspects of modeling the labor curve. American Journal of Obstetrics andGynecology, v. 212, n. 6, p. 750.e1 – 750.e4, 2015. ISSN 0002-9378. Disponıvel em:〈http://www.sciencedirect.com/science/article/pii/S0002937815003786〉. Cited 2 timeson pages 15 e 28.
ZHANG, J.; TROENDLE, J.; MIKOLAJCZYK, R.; SUNDARAM, R.; BEAVER, J.;FRASER, W. The natural history of the normal first stage of labor. Obstetrics & Gynecology,v. 115, n. 4, 2010. ISSN 0029-7844. Disponıvel em: 〈https://journals.lww.com/greenjournal/Fulltext/2010/04000/The Natural History of the Normal First Stage of.6.aspx〉. Citedon page 11.
ZHANG, J.; TROENDLE, J. F.; YANCEY, M. K. Reassessing the labor curve innulliparous women. American Journal of Obstetrics and Gynecology, v. 187, n. 4, p. 824 –828, 2002. ISSN 0002-9378. Disponıvel em: 〈http://www.sciencedirect.com/science/article/pii/S000293780200248X〉. Cited on page 11.

�
37
A WHO Research Ethics Review Committee Approval

�

�

�

�

Cervical dilatation over time is a poor predictorof severe adverse birth outcomes: a diagnosticaccuracy studyJP Souza,a OT Oladapo,a B Fawole,b K Mugerwa,c R Reis,d F Barbosa-Junior,d L Oliveira-Ciabati,d
D Alves,d AM G€ulmezoglua
a UNDP/UNFPA/ UNICEF/WHO/World Bank Special Programme of Research Development and Research Training in Human Reproduction
(HRP), Department of Reproductive Health and Research, World Health Organization, Geneva, Switzerland b Department of Obstetrics and
Gynaecology, College of Medicine, University of Ibadan, Ibadan, Nigeria c Department of Obstetrics and Gynaecology, Makerere University,
Kampala, Uganda d Department of Social Medicine, Centre for Information and Informatics for Health (CIIS), Ribeir~ao Preto Medical School,
University of S~ao Paulo, Ribeir~ao Preto, Brazil
Correspondence: JP Souza, UNDP/UNFPA/UNICEF/WHO/World Bank Special Programme of Research, Development and Research Training
in Human Reproduction (HRP), Department of Reproductive Health and Research, World Health Organization, Avenue Appia 20,
1202 Geneva, Switzerland. Email: [email protected]
Accepted 13 February 2018. Published Online 17 April 2018.
Objective To assess the accuracy of the World Health
Organization (WHO) partograph alert line and other candidate
predictors in the identification of women at risk of developing
severe adverse birth outcomes.
Design A facility-based, multicentre, prospective cohort study.
Setting Thirteen maternity hospitals located in Nigeria and Uganda.
Population A total of 9995 women with spontaneous onset of
labour presenting at cervical dilatation of ≤6 cm or undergoing
induction of labour.
Methods Research assistants collected data on sociodemographic,
anthropometric, obstetric, and medical characteristics of study
participants at hospital admission, multiple assessments during
labour, and interventions during labour and childbirth. The alert
line and action line, intrapartum monitoring parameters, and
customised labour curves were assessed using sensitivity,
specificity, positive and negative likelihood ratios, diagnostic odds
ratio, and the J statistic.
Outcomes Severe adverse birth outcomes.
Results The rate of severe adverse birth outcomes was 2.2% (223
women with severe adverse birth outcomes), the rate of
augmentation of labour was 35.1% (3506 women), and the
caesarean section rate was 13.2% (1323 women). Forty-nine percent
of women in labour crossed the alert line (4163/8489). All reference
labour curves had a diagnostic odds ratio ranging from 1.29 to 1.60.
The J statistic was less than 10% for all reference curves.
Conclusions Our findings suggest that labour is an extremely
variable phenomenon, and the assessment of cervical dilatation
over time is a poor predictor of severe adverse birth outcomes.
The validity of a partograph alert line based on the ‘one-
centimetre per hour’ rule should be re-evaluated.
Funding Bill & Melinda Gates Foundation, United States Agency
for International Development (USAID), UNDP/UNFPA/
UNICEF/WHO/World Bank Special Programme of Research,
Development and Research Training in Human Reproduction
(HRP), and WHO (A65879).
Keywords alert line, childbirth, diagnostic accuracy, partograph,
receiver operating characteristic space.
Tweetable abstract The alert line in check: results from a WHO
study.
Linked article This article is commented on by F Okonofua,
p. 1000 in this issue. To view this mini commentary visit https://
doi.org/10.1111/1471-0528.15213
Please cite this paper as: Souza JP, Oladapo OT, Fawole B, Mugerwa K, Reis R, Barbosa-Junior F, Oliveira-Ciabati L, Alves D, G€ulmezoglu AM. Cervical
dilatation over time is a poor predictor of severe adverse birth outcomes: a diagnostic accuracy study. BJOG 2018;125:991–1000.
Introduction
Labour and childbirth are natural processes with a rela-
tively low frequency of complications among healthy preg-
nant women.1,2 Intrapartum maternal and fetal monitoring
is used to further minimise risks, and is expected to enable
the early identification and prompt treatment of complica-
tions. The assessment of cervical dilatation is part of intra-
partum monitoring, and is conducted by healthcare
providers to determine the adequacy of labour progress.
991ª 2018 World Health Organization; licensed by John Wiley & Sons Ltd on behalf of Royal College of Obstetricians and Gynaecologists.This is an open access article distributed under the terms of the Creative Commons Attribution IGO License which permits unrestricteduse, distribution and reproduction in any medium, provided that the original work is properly cited.In any reproduction of this article there should not be any suggestion that WHO or the article endorse any specific organization or products.The use of the WHO logo is not permitted. This notice should be preserved along with the article’s URL
DOI: 10.1111/1471-0528.15205
www.bjog.orgGeneral obstetrics
42
B Article - Cervical dilatation over time is a poor predictor of severe adversebirth outcomes: a diagnostic accurary study

The observed cervical dilatation is usually compared with
reference labour curves to estimate the risk of labour com-
plications and to guide the use of interventions.3–7
The World Health Organization (WHO) partograph is a
decision-making support tool designed to assist health pro-
viders in identifying women at risk of developing complica-
tions during labour, and to guide the use of interventions
intended to mitigate any perceived risks.6 With the par-
tograph, the identification of certain patterns of cervical
dilatation or other risk factors may prompt the transfer of
the woman to a higher-level health facility, the intensifica-
tion of intrapartum monitoring, the augmentation of
labour, or delivery by caesarean section.7 The WHO par-
tograph is based on clinical principles, including the notion
that ‘normal’ labour progress is defined by a cervical dilata-
tion rate of not less than one centimetre per hour between
4 and 10 centimetres of cervical dilatation.6 This concept is
the basis for the partograph ‘alert line’, which was derived
from average labour curves developed during the 1950s and
1960s.8,9 Alternative and more recent labour curves have
been developed to provide a reference for labour progress
and to serve as the basis for new partograph designs.5,10
Although some observational studies and other empirical
evidence point towards the benefit of using the WHO par-
tograph, experimental, head-to-head comparisons failed to
demonstrate an effect of the partograph in improving
health outcomes related to labour and childbirth.11 Fur-
thermore, different studies have pointed to limitations in
the ‘one centimetre per hour rule’ as a valid benchmark for
assessing the adequacy of labour progress.5,10,12 Our
hypothesis is that if the partograph is unable to accurately
identify women at risk of developing intrapartum compli-
cations, it will not be able to effectively guide labour man-
agement.
This article reports on findings of the WHO Better Out-
comes in Labour Difficulty (BOLD) project. The present
analysis assessed the diagnostic accuracy of the alert line,
action line, and other parameters included in the WHO
partograph as predictors of severe adverse birth outcomes.
It also assessed the accuracy of customised labour curves to
identify women at risk of developing severe adverse birth
outcomes.
Methods
The BOLD project included quantitative, qualitative, and
service-design research conducted in Nigeria and Uganda.
The methodological details of the BOLD project have been
described elsewhere.13,14 This analysis is based on the quan-
titative component, a facility-based, multicentre, prospec-
tive cohort study. In brief, this study included women
admitted for vaginal birth with single live fetuses during
the early first stage of labour across 13 hospitals in both
countries. Women with spontaneous onset of labour pre-
senting at cervical dilatation of ≤6 cm and women under-
going induction of labour took part in the study. Women
with multiple pregnancies, women with pregnancies with
gestational ages of less than 34 weeks 0 days, women
choosing elective caesarean section, and women who were
incapable of giving consent because of labour distress or
obstetric emergencies at arrival were excluded. Participating
institutions had a minimum of 1000 deliveries per year,
with stable access to caesarean section, augmentation of
labour, and assisted vaginal birth. Midwives, obstetricians,
or obstetric residents provided intrapartum health care to
women in labour. Doptones were used to assess fetal vital
status at hospital admission and for intermittent monitor-
ing through labour and childbirth. Labour management
protocol, as well as the number and timing of pelvic exam-
inations, were not standardised across participating institu-
tions. None of the institutions subscribed to the active
management of labour protocol during the study period.
Although the partograph was a standard element of medi-
cal records in all participating health facilities, its prospec-
tive application to guide labour management during the
study period varied widely across the hospitals.
Eligible women were recruited into the study between
December 2014 and November 2015. From the medical
records, trained research nurses prospectively extracted
detailed information on the sociodemographic, anthropo-
metric, obstetric, and medical characteristics of the study
participants at hospital admission, multiple assessments
during labour monitoring, interventions performed
throughout the first and second stages of labour, and
maternal and neonatal labour outcomes. Attending staff
were approached to complement medical records data
when needed. Data collection was limited to hospital stay
of the mother and baby, and there was no post-hospital
discharge follow-up.
The current analysis was based on information on
maternal baseline and admission characteristics, repeated
assessments of cervical dilatation versus time, and maternal
and neonatal outcome data. Severe adverse birth outcomes
were defined as the occurrence of any of the following:
stillbirths, intra-hospital early neonatal deaths, neonatal use
of anticonvulsants, neonatal cardiopulmonary resuscitation,
Apgar score of <6 at 5 minutes, uterine rupture, and
maternal death or organ dysfunction with dystocia. Details
of the sample size calculation are provided in the support-
ing information (Box S1).
Data analysisSimple frequencies and proportions were used to describe
the characteristics of the study population. Sensitivity,
specificity, positive and negative likelihood ratios, diag-
nostic odds ratios, and the J statistic (Youden’s index),
992 © 2018 World Health Organization; licensed by John Wiley & Sons Ltd on behalf of Royal College of Obstetricians and Gynaecologists.
Souza et al.

with 95% confidence intervals, were used to estimate the
diagnostic accuracy of the alert line and the action line in
the identification of women who would develop a severe
adverse birth outcome.15–18 We used the true-positive rate
(i.e. sensitivity) and the false-positive rate (i.e. 1 – speci-
ficity) to graphically represent the diagnostic accuracy of
the partograph parameters in the receiver operating charac-
teristic (ROC) space.19 Each point estimate in the ROC
space represents a classification result for binary parame-
ters, and the interpretation of the ROC space is similar to
the ROC curve: optimal results are associated with high
true-positive rates combined with low false-positive rates.
The J statistic summarises the performance of a binary
classifier,16 and also expresses the proportion of ideal per-
formance of a diagnostic test (Box S2). The supporting
information provides additional details related to the calcu-
lation and interpretation of these statistics (Tables S1–S3).The alert line and the action line are classifiers currently
applied to all women, regardless of their obstetric charac-
teristics (e.g. nulliparous, multiparous, spontaneous or
induced labour, or previous caesarean section). We hypoth-
esised that cervical dilatation curves customised according
to the obstetric characteristics of the population could have
a better accuracy than the generic alert and action lines.
The study population was stratified into mutually exclusive,
totally inclusive obstetric groups according to the 10-group
Robson classification:20 group 1 (nulliparous, single cepha-
lic pregnancy, 37 weeks of gestation or more, with sponta-
neous onset of labour); group 2 (nulliparous women,
single cephalic pregnancy, 37 weeks of gestation or more,
with induced onset of labour); group 3 (multiparous women
without previous caesarean section, with single cephalic
pregnancy, 37 weeks of gestation or more, with spontaneous
onset of labour); group 4 (multiparous women without pre-
vious caesarean section, with single cephalic pregnancy,
37 weeks of gestation or more, with induced onset of
labour); group 5 (all multiparous women with at least one
previous caesarean section, single cephalic pregnancy, at
37 weeks of gestation or more); and group 10 (all women
with singleton cephalic preterm pregnancy at less than
37 weeks of gestation at childbirth). As a result of the eligi-
bility criteria, this study has no women from group 8 (mul-
tiple pregnancies) or with caesarean section before labour.
Women with non-cephalic presentations (groups 6, 7, and
9) were grouped together. Groups 1–5 and 10, were further
divided according to the use of augmentation of labour
(present or absent), totalling 12 subgroups. Using data from
women who did not have any severe adverse birth outcome,
customised labour curves were generated for each of these
12 subgroups. Data from women pertaining to groups 6, 7,
and 9 were not used to generate customised curves because
of the small numbers involved. The customised cervical
dilatation curves were created using a multi-state Markov
model,21,22 which represented the cervical dilation pattern
through intermediate states from 2 cm to 10 cm, and child-
birth by selected percentiles and obstetric group (i.e. one
labour curve for each obstetric group and selected per-
centile). In this model, each centimetre of cervical dilatation
represented an intermediate state, and childbirth was the
final ‘absorbing’ state. The model was generated as a pro-
gressive unidirectional labour-to-childbirth model, and the
time of state change was determined by a set of transition
intensities. The transition intensity represents the instanta-
neous likelihood of moving from one state to another, and
is generated as part of the multi-state Markov model. For
each one of the 12 obstetric subgroups, the multi-state Mar-
kov model generated labour curves representing the progress
of labour in women that was either faster or at the 50, 60,
70, 80, 90, and 95th percentiles.
Once the percentile curves were generated for each
obstetric subgroup of women without severe adverse birth
outcomes, women were classified as having crossed or not
having crossed each of the percentile curves of their rele-
vant obstetric subgroup. The study population was then
consolidated and all women who crossed their relevant 50th
percentile curves were grouped together (i.e. women in
which labour progressed more slowly than the customised
50th percentile curve). Similarly, women were classified as
having labour that progressed either slower or faster/equal
to the relevant 60, 70, 80, 90, and 95th percentiles. We esti-
mated the accuracies of the customised percentile curves in
the identification of women who would develop a severe
adverse birth outcome, by comparing women with labour
progress that was slower than the specific percentile with
women in which labour progressed faster or equal to that
percentile. Sensitivity, specificity, positive and negative like-
lihood ratios, diagnostic odds ratios, with 95% confidence
intervals, the J statistic, and ROC space plotting were used
to estimate the accuracy of the percentile curves in the
identification of women who would develop a severe
adverse birth outcome.
Statistical analyses were carried in R and Microsoft EXCEL
(2010).23
Results
The analysis flow is shown in Figure 1. Thirteen hospitals
(nine from Nigeria and four from Uganda) and a total of
9995 women (4964 from Nigeria and 5031 from Uganda)
took part in this study. The average age of the participants
was 27.9 years (�5.0 years); 3.2% were younger than
20 years of age (320 women) and 11.0% were 35 years old
or older (1100 women). The majority of the participants
had a partner (97.6%, 9753 women); 5.2% of the partici-
pants had either incomplete primary education or no edu-
cation (525 women), 5.6% had complete primary
993ª 2018 World Health Organization; licensed by John Wiley & Sons Ltd on behalf of Royal College of Obstetricians and Gynaecologists.
The diagnostic accuracy of labour curves and the partograph

education (564 women), 42.5% had either complete or
incomplete secondary education (4245 women), and 45.4%
had either complete or incomplete post-secondary/tertiary
education (4537 women). A total of 4076 nulliparous
women took part in the study (40.8%), and among women
with at least one previous birth (59.2%, 5919 women), 535
(5.4%) had had a previous caesarean section. A total of
667 women (6.7%) had no antenatal care visit, 4229
(42.3%) had between one and three antenatal care visits,
and 5007 (50.6%) had four visits of more; 1228 women
(12.3%) developed pre-labour complications during the
current pregnancy. The majority of women initiated labour
spontaneously (8984 women, 89.9%) at between 37 and
41 weeks of gestation (91.2%, 9111 women), with only 594
(5.9%) being referred from another health facility during
labour. All women participating in this study had singleton
pregnancies, 98.6% (9845 women) of which were in cepha-
lic presentation. The mean number of cervical assessments
between 4 and 10 cm was 2.22 (�1.02). Augmentation of
labour was used in 3506 women (35.1%). Pharmacological
analgesia was rarely used (2.0%, 196 women). Table 1 pre-
sents the distribution of the study population according to
the 10-group Robson classification. The overall intrapartum
caesarean section rate was 13.2% (1323 women), and the
rate of severe adverse birth outcomes was 2.2% (223
women with severe adverse birth outcomes; Table S4).
Nearly half of women with at least two assessments of cer-
vical dilatation between 4 cm and childbirth crossed the
alert line (49%; 4163/8489). Figure 2 illustrates the progress
of labour in the study population. In the upper panel, each
grey line represents the progress of an individual women
without severe adverse birth outcomes, and each red line
represents the progress of an individual woman with
adverse outcomes. In the lower panel, the labour curves for
women in the 95th percentile, without augmentation of
labour, is displayed by obstetric group. Video S1 displays
an animation of labour progress of all women in labour
that reached at least 4 cm of cervical dilatation.
The sensitivity, specificity, positive and negative likeli-
hood ratios, diagnostic odds ratio, and J statistic for the
WHO partograph alert and action lines, and the 50, 60, 70,
80, 90, and 95th percentiles are presented in Tables 1 and
S5. For all reference curves, women who crossed the curves
tended to show a mild increase in the odds of severe adverse
birth outcomes, when compared with women who did not
cross the reference lines. All reference curves had a diagnos-
tic odds ratio ranging from 1.29 to 1.60. All reference curves
had positive likelihood ratios smaller than 1.5 and negative
likelihood ratios greater than 0.85. The J statistic was less
than 10% for all reference curves. Figure 3 presents the
ROC space analysis, with all the aforementioned predictors
showing a poor diagnostic performance.
Figure 1. The analysis flowchart.
994 © 2018 World Health Organization; licensed by John Wiley & Sons Ltd on behalf of Royal College of Obstetricians and Gynaecologists.
Souza et al.
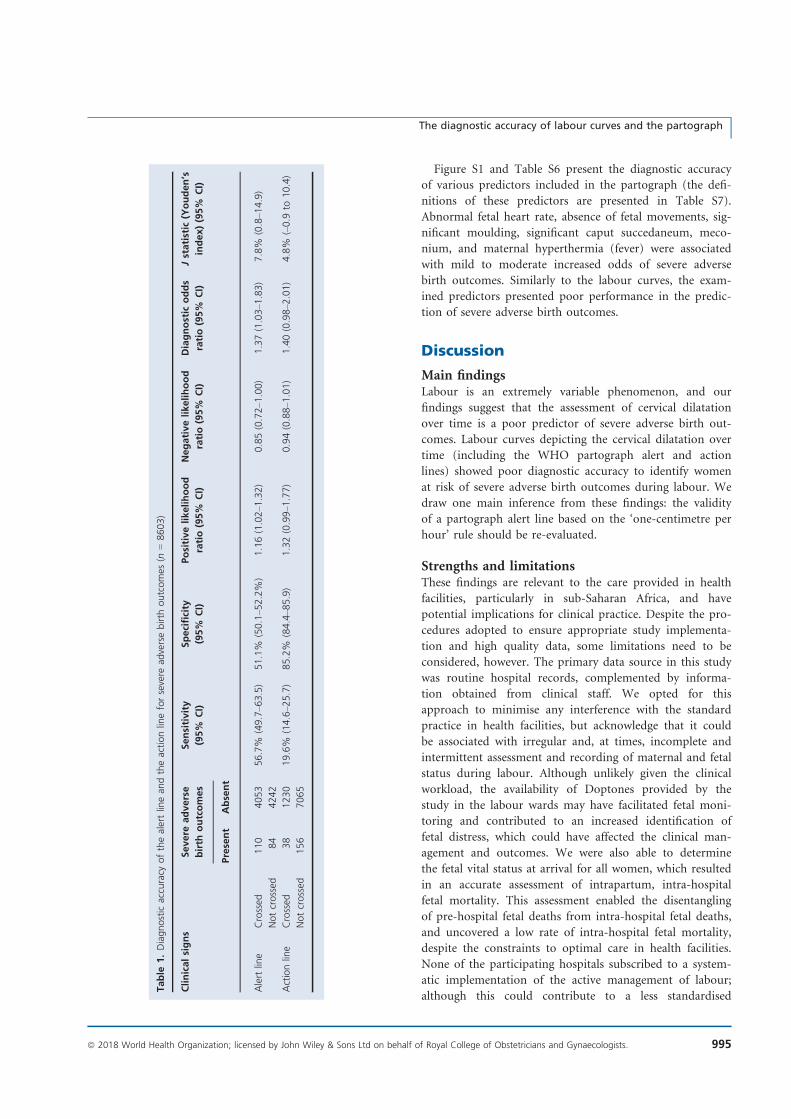
Figure S1 and Table S6 present the diagnostic accuracy
of various predictors included in the partograph (the defi-
nitions of these predictors are presented in Table S7).
Abnormal fetal heart rate, absence of fetal movements, sig-
nificant moulding, significant caput succedaneum, meco-
nium, and maternal hyperthermia (fever) were associated
with mild to moderate increased odds of severe adverse
birth outcomes. Similarly to the labour curves, the exam-
ined predictors presented poor performance in the predic-
tion of severe adverse birth outcomes.
Discussion
Main findingsLabour is an extremely variable phenomenon, and our
findings suggest that the assessment of cervical dilatation
over time is a poor predictor of severe adverse birth out-
comes. Labour curves depicting the cervical dilatation over
time (including the WHO partograph alert and action
lines) showed poor diagnostic accuracy to identify women
at risk of severe adverse birth outcomes during labour. We
draw one main inference from these findings: the validity
of a partograph alert line based on the ‘one-centimetre per
hour’ rule should be re-evaluated.
Strengths and limitationsThese findings are relevant to the care provided in health
facilities, particularly in sub-Saharan Africa, and have
potential implications for clinical practice. Despite the pro-
cedures adopted to ensure appropriate study implementa-
tion and high quality data, some limitations need to be
considered, however. The primary data source in this study
was routine hospital records, complemented by informa-
tion obtained from clinical staff. We opted for this
approach to minimise any interference with the standard
practice in health facilities, but acknowledge that it could
be associated with irregular and, at times, incomplete and
intermittent assessment and recording of maternal and fetal
status during labour. Although unlikely given the clinical
workload, the availability of Doptones provided by the
study in the labour wards may have facilitated fetal moni-
toring and contributed to an increased identification of
fetal distress, which could have affected the clinical man-
agement and outcomes. We were also able to determine
the fetal vital status at arrival for all women, which resulted
in an accurate assessment of intrapartum, intra-hospital
fetal mortality. This assessment enabled the disentangling
of pre-hospital fetal deaths from intra-hospital fetal deaths,
and uncovered a low rate of intra-hospital fetal mortality,
despite the constraints to optimal care in health facilities.
None of the participating hospitals subscribed to a system-
atic implementation of the active management of labour;
although this could contribute to a less standardised
Table
1.Diagnostic
accuracy
ofthealertlinean
dtheactionlineforsevere
adversebirth
outcomes
(n=8603)
Clinicalsigns
Severe
adverse
birth
outcomes
Sensitivity
(95%
CI)
Specificity
(95%
CI)
Positivelikelihood
ratio(95%
CI)
Negativelikelihood
ratio(95%
CI)
Diagnostic
odds
ratio(95%
CI)
Jstatistic
(Youden’s
index)(95%
CI)
Present
Absent
Alert
line
Crossed
110
4053
56.7%
(49.7–6
3.5)
51.1%
(50.1–5
2.2%
)1.16(1.02–1
.32)
0.85(0.72–1
.00)
1.37(1.03–1
.83)
7.8%
(0.8–1
4.9)
Notcrossed
84
4242
Actionline
Crossed
38
1230
19.6%
(14.6–2
5.7)
85.2%
(84.4–8
5.9)
1.32(0.99–1
.77)
0.94(0.88–1
.01)
1.40(0.98–2
.01)
4.8%
(–0.9
to10.4)
Notcrossed
156
7065
995ª 2018 World Health Organization; licensed by John Wiley & Sons Ltd on behalf of Royal College of Obstetricians and Gynaecologists.
The diagnostic accuracy of labour curves and the partograph

management of labour, it favoured a less interventionist
approach and an intra-hospital labour progression that
was more closely related to the natural progression in
many women. Given the differences of workload and
health-facility protocols, the standardisation of intra-
partum maternal–fetal monitoring and recording was a
challenging task. Several mechanisms were used to min-
imise methodological heterogeneity and to increase the
quality of the data as much as possible (such as research
assistant training, the use of a visual check of the data col-
lection forms before data entry, automated queries,
double-checking of selected medical records, and a thor-
ough audit of unclear cases, especially those resulting in
mortality). It should also be considered that crossing the
alert or action lines could have prompted health providers
to implement interventions in the current cohort popula-
tion. These interventions could have modified the final
outcome, either for good or bad.
InterpretationHealth facilities in low-resource settings often struggle with a
shortage of human resources and life-saving commodities,
Figure 2. Upper panel: cervical dilatation over time (all women with at least two cervical dilatation assessments between 4 cm and childbirth). Grey
lines denote labour progress of women without severe adverse birth outcomes; red lines denote labour progress of women with severe adverse birth
outcomes. Lower panel: labour curves for selected groups of the 10-group Robson classification (95th percentile, women without augmentation of
labour).
996 © 2018 World Health Organization; licensed by John Wiley & Sons Ltd on behalf of Royal College of Obstetricians and Gynaecologists.
Souza et al.

training resources, and health infrastructure, which limit
the early identification and effective management of
labour complications. Conversely, any overestimation of
the risk of complications and over-medicalisation of care
during labour and childbirth may lead to iatrogenic com-
plications, avoidable suffering, and a waste of limited
resources.24 In an attempt to optimise intrapartum care,
several organisations recommend the use of the WHO
partograph to guide labour monitoring and manage-
ment.24 The ‘one-centimetre per hour rule’, as illustrated
by the partograph alert line, has also (formally or infor-
mally) been used to prompt labour interventions in many
settings around the world.4,25 Global efforts to promote
the use of the partograph in the last three decades have
been met with mixed results. Although most healthcare
providers working in maternity settings know about the
partograph, it is frequently used retrospectively for
recording purposes instead of providing prospective sup-
port for clinical decision making. Possible reasons for
these shortcomings include difficulties in its use and inter-
pretation.26,27 Our findings suggest that the poor predic-
tive performance of the partograph – and the consequent
effect in supporting effective decision making – could
contribute to the lack of interest in using the tool
prospectively.
As countries navigate through the obstetric transition,28 a
marked trend towards the medicalisation of labour and
childbirth is observed. Several determinants of the medicali-
sation of labour and childbirth are at play, including models
of care based on the notion that a normal labour abides by
the ‘one-centimetre per hour’ rule. This notion has been
embedded in generations of healthcare providers across the
world, and the implicit or explicit influence of this notion in
obstetric and midwifery culture cannot be over-emphasised;
however, as suggested by our findings, a cervical dilatation
rate of ‘one-centimetre per hour’ may be unrealistically fast
for a substantial proportion of women in labour. The mis-
match between the unrealistic expectations of healthcare pro-
viders and the physiology of labour may give rise to the
constructed ‘need’ for an intervention in a natural process
that could otherwise be slower than currently expected but
end well and naturally. The poor accuracy of the tool means
on one hand that a high proportion of women would receive
an intervention without a valid justification, and on the other
0.0 0.2 0.4 0.6 0.8 1.0
0.0
0.2
0.4
0.6
0.8
1.0
Alert line
1 - Specificity
Sen
sitiv
ity
0.0 0.2 0.4 0.6 0.8 1.0
0.0
0.2
0.4
0.6
0.8
1.0
Action line
1 - Specificity
Sen
sitiv
ity
0.0 0.2 0.4 0.6 0.8 1.0
0.0
0.2
0.4
0.6
0.8
1.0
Percentile curves
1 - Specificity
Sen
sitiv
ity
0.0 0.2 0.4 0.6 0.8 1.0
0.0
0.2
0.4
0.6
0.8
1.0
Other parameters
1 - Specificity
Sen
sitiv
ity
Figure 3. Analysis of the ROC space (alert and action line, customised percentile curves, and other parameters included in the partograph).
997ª 2018 World Health Organization; licensed by John Wiley & Sons Ltd on behalf of Royal College of Obstetricians and Gynaecologists.
The diagnostic accuracy of labour curves and the partograph

hand women at risk would not be recognised in time to avoid
the adverse outcome. The excessive use of interventions may
also contribute to adverse outcomes. For example, the aug-
mentation of labour is a well-established risk factor for fetal
distress; unnecessary augmentation of labour, prompted by
the ‘one-centimetre per hour’ rule, may be harmful, particu-
larly in settings with limited capacity for providing appropri-
ate, intermittent fetal monitoring. Another potential adverse
effect of the above mismatch is increased tension, anxiety, and
frustration among the staff, which could be a contributing fac-
tor to disrespect, abuse, and mistreatment of women during
labour and childbirth. Allowing an increase in the average
duration of labour in health facilities has a direct impact on
the occupancy rate of labour-ward beds, however, which could
further complicate the shortage of hospital beds and over-
crowding of health facilities. Reducing the number of inter-
ventions during labour could reduce staff workload. Research
to determine the short- and long-term consequences of a less
invasive intrapartum care model at the individual and at the
health-systems level is warranted.
The poor performance of the partograph and the cus-
tomised labour curves may not be a surprising finding. The
rationale for using the partograph for preventing labour
problems goes back several decades, when it was introduced
for the timely referral from peripheral health facilities to pre-
vent the complications of obstructed labour.9 Fetal and early
neonatal outcomes are much more likely to be impacted by
events that are not related to the cervical dilatation rate,
such as placental abruption, cord compression, cord pro-
lapse, meconium aspiration, and intrauterine growth restric-
tion, among many other reasons. In South Africa, for
example, only 6% of fetal and early neonatal deaths were
associated with prolonged labour;29 however, we should not
overlook the finding that slower labours compared with fas-
ter labours (in different percentiles) tended to be associated
with a mild increase in the risk of adverse outcomes. Never-
theless, this association alone can hardly provide a basis for
a reliable classification tool because of the excessive number
of false positives. For example, nearly half of the study pop-
ulation crossed the alert line, making the policy of transfer-
ring women who crossed the alert line to referral hospitals
impractical. In this context, and given the limitations of sta-
tic, paper-based diagnostic tools, the development and test-
ing of more sophisticated, dynamic, easy-to-use tools for
improved risk classification during labour is a priority. A
cluster-randomised trial, comparing a static paper-based par-
tograph with a dynamic, multivariable prediction model
would be ideal research to be carried out next.
Conclusion
Our findings suggest that the validity of a partograph alert
line based on the ‘one-centimetre per hour’ rule should be
re-evaluated. Labour is an extremely variable phenomenon,
and emphasis should be given to individualised, supportive,
person-centered care during labour and childbirth.
Disclosure of interestsNone declared. Completed disclosure of interests form
available to view online as supporting information.
Contribution to authorshipJPS, OTO, and AMG developed the research protocol, with
input from members of the project steering committee and
advisory group, Nigeria and Uganda research teams, data
science team, and the project coordination and support
team. The analysis plan was developed by JPS with input
from OTO. Data analysis was carried out by RR, FBJ, LOC,
and JPS. JPS drafted this article, with substantial contribu-
tions from OTO, BF, KM, RR, FBJ, LOC, DA, and AMG.
All authors reviewed the draft manuscript for intellectual
content and approved the final version for publication.
Details of ethics approvalScientific and technical approval was obtained from the
Review Panel on Research Projects (RP2) of UNDP/
UNFPA/UNICEF/WHO/World Bank Special Program of
Research, Development and Research Training in Human
Reproduction (HRP). Ethical approval was obtained from
the World Health Organization Ethical Review Committee
(protocol A65879, approval date 25 August 2014), the
Makerere University School of Health Sciences Research
and Ethics Committee, Uganda (protocol #SHSREC REF
2014-058), University of Ibadan/University College Hospital
Ethics Committee (UI/EC/14/0223), Federal Capital Terri-
tory Health Research Ethics Committee, Nigeria (protocol
FHREC/2014/01/42/27-08-14), and Ondo State Govern-
ment Ministry of Health Research Ethics Review Commit-
tee, Nigeria (AD 4693/160).
AcknowledgementsThis manuscript was developed as part of the World
Health Organization’s BOLD (Better Outcomes in Labour
Difficulty) project. The BOLD project implementation was
a collaborative effort of a large number of academic staff,
hospital personnel and researchers from 13 hospitals across
Uganda and Nigeria. We acknowledge the contributions of
all midwives, doctors, facility administrators, and all mater-
nity unit staff in the maternity units of all hospitals that
participated in the project. The authors would like to thank
the members of the following groups for their input during
project implementation and analysis: the BOLD project
steering committee and advisory group (Priya Agrawal,
Fernando Althabe, Deborah Armbruster, France Donnay, G
Justus Hofmeyr, Vanora Hundley, Jen Jardine, David Kyad-
dondo, Tina Lavender, Simon Lewin, Jerker Liljestrand,
998 © 2018 World Health Organization; licensed by John Wiley & Sons Ltd on behalf of Royal College of Obstetricians and Gynaecologists.
Souza et al.

Matthews Mathai, Lanre Olutayo, Janna Patterson, Robert
Pattinson, Kate Ramsey, Harshadkumar C Sanghvi, Mary
Ellen Stanton, Petra Tenhoope-Bender, Mari Tikkanen,
Melanie Wendland, Jim Zhang); the Nigeria research team
(Amos Adebayo, Nike Adesina, Adesina Akintan, Olu-
bunmi Alabi, Francis E Alu, Halima Bello, Felicia Fasipe,
Bukola Fawole, Hadiza Idris, Oluwatosin Lawal, Ola Okike,
Lawal Oyeneyin, and Sanni Wilfred); the Uganda research
team (Salim Bataale, Michael Bukennya, Josaphat Bya-
mugisha, Wasswa Damien, Kidza Mugerwa, Othiniel
Musana, and Miriam Nakalembe); the data science team
(Domingos Alves, Francisco Barbosa-J�unior, Gleise Kele
Bernucci, Hayala Cristina Cavenague, Livia Ciabati,
Alexandre Cristov~ao Maiorano, J�essica Marcelino, Leo-
nardo Moscovici, Lariza Laura de Oliveira, Gleici Perdon�a,
Rodrigo Reis, Tiago Lara Michelin Sanches, and Joao
Paulo Souza); and the project coordination and support
team (Lily Zilla Atutornu, Rajiv Bahl, Meghan Bohren,
Metin G€ulmezoglu, Catherine C�ecile Kiener, Olufemi T
Oladapo, Joao Paulo Souza, €Ozge Tunc�alp, and Joshua P
Vogel). The manuscript presents the views of the named
authors only.
FundingBill & Melinda Gates Foundation, United States Agency for
International Development (USAID), UNDP/UNFPA/UNI-
CEF/WHO/World Bank Special Programme of Research,
Development and Research Training in Human Reproduc-
tion (HRP), and WHO (A65879). The external funders
played no role in conducting research and writing this
article.
Supporting Information
Additional Supporting Information may be found in the
online version of this article:
Figure S1. The analysis flowchart.
Table S1. Calculation of diagnostic accuracy statistics.
Table S2. Equivalence of diagnostic accuracy statistics.
Table S3. Suggested interpretation of diagnostic accuracy
statistics.
Table S4. Distribution of the study population according
to obstetric groups and the frequency of severe adverse
birth outcomes.
Table S5. Diagnostic accuracy of customized labour
curves by percentiles.
Table S6. Diagnostic accuracy of other predictors
included in the partograph.
Table S7. Definitions of the predictors included in the
Table S6 and Figure S1.
Box S1. Sample Size calculation.
Box S2. The J statistic in the ROC space
Video S1. All women and perinatal outcome&
References
1 Snowden JM, Tilden EL, Snyder J, Quigley B, Caughey AB, Cheng
YW. Planned Out-of-Hospital Birth and Birth Outcomes. N Engl J
Med 2015;373:2642–53.2 de Jonge A, Geerts CC, van der Goes BY, Mol BW, Buitendijk SE,
Nijhuis JG. Perinatal mortality and morbidity up to 28 days after
birth among 743 070 low-risk planned home and hospital births: a
cohort study based on three merged national perinatal databases.
BJOG 2015;122:720–8.3 Cohen WR, Friedman EA. The assessment of labor: a brief history. J
Perinat Med 2018;46:1–8. https://doi.org/10.1515/jpm-2017-0018
4 O’Driscoll K, Stronge JM. Active management of labor. BMJ
1973;3:590.
5 Zhang J, Landy HJ, Branch DW, Burkman R, Haberman S, Gregory
KD, et al. Contemporary patterns of spontaneous labor with normal
neonatal outcomes. Obstet Gynecol 2010;116:1281–7.6 World Health Organization. Preventing Prolonged Labour: A
Practical Guide. The Partograph Part I. Principle and Strategy.
Geneva, Switzerland: WHO, 1993a. WHO/FHE/MSM 93.8
7 World Health Organization. Managing Complications in Pregnancy and
Childbirth: A Guide for Midwives and Doctors. IMPAC. WHO/RHR.007.
Geneva, Switzerland: World Health Organization, 2000.
8 Friedman E. The graphic analysis of labor. Am J Obstet Gynecol
1954;68:1568–75.9 Philpott RH, Castle WM. Cervicographs in the management of
labour in primigravidae. I. The alert line for detecting abnormal
labour. J Obstet Gynaecol Br Commonw 1972;79:592–8.10 Neal JL, Lowe NK. Physiologic partograph to improve birth safety
and outcomes among low-risk, nulliparous women with
spontaneous labor onset. Med Hypotheses 2012;78:319–26.11 Lavender T, Hart A, Smyth RM. Effect of partogram use on
outcomes for women in spontaneous labour at term. Cochrane
Database Syst Rev 2013;7:CD005461.
12 Hamilton EF, Warrick PA, Collins K, Smith S, Garite TJ. Assessing
first-stage labor progression and its relationship to complications.
Am J Obstet Gynecol 2016;214:358.e1–8.13 Souza JP, Oladapo OT, Bohren MA, Mugerwa K, Fawole B,
Moscovici L, et al. The development of a Simplified, Effective,
Labour Monitoring-to-Action (SELMA) tool for Better Outcomes in
Labour Difficulty (BOLD): study protocol. Reprod Health 2015;12:49.
14 Bohren MA, Oladapo OT, Tunc�alp €O, Wendland M, Vogel JP,
Tikkanen M, et al. Formative research and development of
innovative tools for “Better Outcomes in Labour Difficulty” (BOLD):
study protocol. Reprod Health. 2015;26:50.
15 Powers DM. Evaluation: from precision, recall and f-measure to
ROC, informedness, markedness & correlation. J Mach Learn
Technol 2011;2:37–63.16 Youden WJ. Index for rating diagnostic tests. Cancer 1950;3:32–5.17 Glas AS, Lijmer JG, Prins MH, Bonsel GJ, Bossuyt PM. The diagnostic
odds ratio: a single indicator of test performance. J Clin Epidemiol
2003;56:1129–35.18 Cook C, Cleland J, Huijbregts P. Creation and critique of studies of
diagnostic accuracy: use of the STARD and QUADAS methodological
quality assessment tools. J Man Manip Ther 2007;15:93–102.19 Fawcett T. An Introduction to ROC Analysis. Pattern Recogn Lett
2006;27:861–74.20 Robson MS. Classification of caesarean section. Fetal Maternal Med
Rev 2001;12:23–39.21 Jackson CH. Multi-state models for panel data: The msm package
for R. J Stat Softw 2011;38:1–29.22 Reis R. Labour Curves and Markov models. MSc [Dissertation].
Ribeirao Preto, Brazil: University of Sao Paulo, 2017.
999ª 2018 World Health Organization; licensed by John Wiley & Sons Ltd on behalf of Royal College of Obstetricians and Gynaecologists.
The diagnostic accuracy of labour curves and the partograph

23 R Core Team. R: A Language and Environment for Statistical
Computing. Vienna, Austria: R Foundation for Statistical Computing,
2014 (http://www.R-project.org)
24 Miller S, Abalos E, Chamillard M, Ciapponi A, Colaci D, Comand�e D,
et al. Beyond too little, too late and too much, too soon: a pathway
towards evidence-based, respectful maternity care worldwide.
Lancet 2016;388:2176–92.25 Maffi I. The detour of an obstetric technology: active management
of labor across cultures. Med Anthropol 2016;35:17–30.26 Bedwell C, Levin K, Pett C, Lavender DT. A realist review of the
partograph: when and how does it work for labour monitoring?
BMC Pregnancy Childbirth 2017;17:31.
27 Ollerhead E, Osrin D. Barriers to and incentives for achieving
partograph use in obstetric practice in low- and middle-income
countries: a systematic review. BMC Pregnancy Childbirth
2014;16:281.
28 Souza JP, Tunc�alp €O, Vogel JP, Bohren M, Widmer M, Oladapo OT,
et al. Obstetric transition: the pathway towards ending preventable
maternal deaths. BJOG 2014;121(Suppl 1):1–4.29 Saving babies 2012-2013: Ninth report on perinatal care in South
Africa. Pretoria, South Africa: RC Pattinson, N Rhoda, Tshepesa
Press, 2014
Cervical dilatation over time is a poor predictor of severe adversebirth outcomes: a call for higher level evidence
F Okonofua
Obstetrics and Gynaecology, College of Medical Sciences, Women’s Health and Action Research Centre, University ofBenin, Benin City, Edo State, Nigeria
Linked article: This is a mini commentary on JP Souza et al., pp. 991–1000 in this issue. To view this article visit
https://doi.org/10.1111/1471-0528.15205
Published Online 25 April 2018.
The article by Joao Paulo Souza et al.in this issue of BJOG makes interest-ing reading. It describes a study car-ried out in 13 maternity hospitals inNigeria and Uganda that assessed theaccuracy of the WHO parthographfor the identification of women at riskof severe adverse birth outcomes. Theauthors concluded that cervical dilata-tion over time is not a good predictorof severe birth outcomes, and that thecurrent use of the ‘1-centimetre perhour’ rule should be re-evaluated.
This conclusion is problematic fortwo main reasons. In the first place,parthography was never designed tobe an accurate diagnostic tool forsevere birth outcomes. It wasintended to be used in primaryhealthcare settings to detect labourthat is not progressing well (WHO.Managing prolonged and obstructedlabour. http://whoqlidoc.who.int/publications/2008/978924156669_4_eng.pdf), so that early referrals can bemade to centres where caesarean sec-tions can be done. Secondly, notonly were the studies reported in thepaper conducted in secondary and
tertiary health facilities where the useof the parthograph would be a mootpoint, the authors accepted thatmany of the facilities lacked the effi-cacy to use parthographic labourmonitoring accurately. The authorsstate in the methods section of thepaper that ‘none of the institutionssubscribed to the active managementof labour protocol during the studyperiod. Although the parthographwas a standard element of medicalrecords in all participating healthfacilities, its prospective applicationto guide labour management duringthe study period varied widely acrossthe hospitals’. It was therefore evi-dent that the study reflected currentsuboptimal hospital practices ratherthan being a systematic processanchored in true experimental orquasi-experimental research design toanswer the specific research question.
The true diagnostic accuracy ofthe parthograph can only be evalu-ated in centres practising partho-graphic labour monitoring correctly,and a randomised control trialwould be better able to substantiate
the effects of the parthograph. Itherefore fully agree with the recom-mendations of the authors of thepaper that more studies to validateparthographic monitoring of labourare needed.
In particular, since the ‘1-hourrule’ on cervical dilatation has beentaught to students of midwifery inAfrica over the past decades, chang-ing the practice should be based onrigorous scientific evidence. Asreported elsewhere (Fawole et al. AfrJ Reprod Health 2008;12:22–9), thepresent challenge in much of sub-Saharan Africa is the low use andpoor understanding of parthographiclabour monitoring of labour byhealthcare ‘providers. We believe thatinitial efforts should focus on rectify-ing this bottleneck, while simultane-ously investigating its effects andmethods of its application.
Disclosure of interestsFull disclosure of interests availableto view online as supporting infor-mation.&
© 2018 Royal College of Obstetricians and Gynaecologists
Souza et al.
1000 © 2018 World Health Organization; licensed by John Wiley & Sons Ltd on behalf of Royal College of Obstetricians and Gynaecologists.

RESEARCH ARTICLEProgression of the first stage of spontaneouslabour: A prospective cohort study in two sub-Saharan African countriesOlufemi T. Oladapo1*, Joao Paulo Souza1, Bukola Fawole2, Kidza Mugerwa3,
Gleici Perdona4, Domingos Alves4, Hayala Souza4, Rodrigo Reis4, Livia Oliveira-Ciabati4,
Alexandre Maiorano5, Adesina Akintan6, Francis E. Alu7, Lawal Oyeneyin8,
Amos Adebayo9, Josaphat Byamugisha3, Miriam Nakalembe3, Hadiza A. Idris10,
Ola Okike11, Fernando Althabe12, Vanora Hundley13, France Donnay14, Robert Pattinson15,
Harshadkumar C. Sanghvi16, Jen E. Jardine17, Ozge Tuncalp1, Joshua P. Vogel1, Mary
Ellen Stanton18, Meghan Bohren1, Jun Zhang19, Tina Lavender20, Jerker Liljestrand21,
Petra ten Hoope-Bender22, Matthews Mathai23,24, Rajiv Bahl23, A. Metin Gulmezoglu1
1 UNDP/UNFPA/UNICEF/WHO/World Bank Special Programme of Research, Development and Research
Training in Human Reproduction (HRP), Department of Reproductive Health and Research, World Health
Organization, Geneva, Switzerland, 2 Department of Obstetrics and Gynaecology, College of Medicine,
University of Ibadan, Ibadan, Nigeria, 3 Department of Obstetrics and Gynaecology, Makerere University,
Kampala, Uganda, 4 Department of Social Medicine, Ribeirão Preto Medical School, University of São Paulo,
Ribeirão Preto, São Paulo, Brazil, 5 Institute of Mathematical Science and Computing, University of São
Paulo, São Carlos, São Paulo, Brazil, 6 Department of Obstetrics and Gynaecology, Mother and Child
Hospital, Akure, Ondo State, Nigeria, 7 Department of Obstetrics and Gynaecology, Maitama District
Hospital, Abuja, FCT, Nigeria, 8 Department of Obstetrics and Gynaecology, Mother and Child Hospital,
Ondo, Ondo State, Nigeria, 9 Department of Obstetrics and Gynaecology, Asokoro District Hospital,
Abuja, FCT, Nigeria, 10 Department of Obstetrics and Gynaecology, Nyanya General Hospital, Abuja, FCT,
Nigeria, 11 Department of Obstetrics and Gynaecology, Karshi General Hospital, Abuja, FCT, Nigeria,
12 Department of Mother and Child Health Research, Institute for Clinical Effectiveness and Health Policy,
Buenos Aires, Argentina, 13 Faculty of Health & Social Sciences, Bournemouth University, Bournemouth,
United Kingdom, 14 Tulane University School of Public Health and Tropical Medicine, New Orleans,
Louisiana, United States of America, 15 SAMRC/UP Maternal and Infant Health Care Strategies Unit,
University of Pretoria, Pretoria, South Africa, 16 Jhpiego, an affiliate of Johns Hopkins University, Baltimore,
Maryland, United States of America, 17 Women’s Health Research Unit, Queen Mary University of London,
London, United Kingdom, 18 United States Agency for International Development, Bureau for Global Health,
Washington D.C., United States of America, 19 Xinhua Hospital, Shanghai Jiao Tong University School of
Medicine, Shanghai, China, 20 School of Nursing Midwifery & Social Work, University of Manchester,
Manchester, United Kingdom, 21 Bill & Melinda Gates Foundation, Seattle, Washington, United States of
America, 22 United Nations Population Fund, Geneva, Switzerland, 23 Department of Maternal, Newborn,
Child and Adolescent Health, World Health Organization, Geneva, Switzerland, 24 Liverpool School of
Tropical Medicine, Liverpool, United Kingdom
AbstractBackground
Escalation in the global rates of labour interventions, particularly cesarean section and oxy-
tocin augmentation, has renewed interest in a better understanding of natural labour pro-
gression. Methodological advancements in statistical and computational techniques
addressing the limitations of pioneer studies have led to novel findings and triggered a re-
evaluation of current labour practices. As part of the World Health Organization’s Better Out-
comes in Labour Difficulty (BOLD) project, which aimed to develop a new labour monitoring-
PLOS Medicine | https://doi.org/10.1371/journal.pmed.1002492 January 16, 2018 1 / 30
a1111111111
a1111111111
a1111111111
a1111111111
a1111111111
OPENACCESS
Citation: Oladapo OT, Souza JP, Fawole B,
Mugerwa K, Perdona G, Alves D, et al. (2018)
Progression of the first stage of spontaneous
labour: A prospective cohort study in two sub-
Saharan African countries. PLoS Med 15(1):
e1002492. https://doi.org/10.1371/journal.
pmed.1002492
Academic Editor: Lars Åke Persson, London
School of Hygiene and Tropical Medicine, UNITED
KINGDOM
Received: August 2, 2017
Accepted: December 13, 2017
Published: January 16, 2018
Copyright: This is an open access article, free of all
copyright, and may be freely reproduced,
distributed, transmitted, modified, built upon, or
otherwise used by anyone for any lawful purpose.
The work is made available under the Creative
Commons CC0 public domain dedication.
Data Availability Statement: All relevant data are
within the paper and its Supporting Information
files.
Funding: This work was funded by the Bill &
Melinda Gates Foundation (Grant #OPP1084318:
https://www.gatesfoundation.org/How-We-Work/
Quick-Links/Grants-Database#q/k=OPP1084318);
The United States Agency for International
Development (USAID); and the UNDP-UNFPA-
52
C Article - Progression of the fisrt stage of spontaneous labour: A prospec-tive cohort study in two sub-Saharan African countries

to-action tool, we examined the patterns of labour progression as depicted by cervical dilata-
tion over time in a cohort of women in Nigeria and Uganda who gave birth vaginally following
a spontaneous labour onset.
Methods and findings
This was a prospective, multicentre, cohort study of 5,606 women with singleton, vertex,
term gestation who presented at� 6 cm of cervical dilatation following a spontaneous labour
onset that resulted in a vaginal birth with no adverse birth outcomes in 13 hospitals across
Nigeria and Uganda. We independently applied survival analysis and multistate Markov
models to estimate the duration of labour centimetre by centimetre until 10 cm and the
cumulative duration of labour from the cervical dilatation at admission through 10 cm. Multi-
state Markov and nonlinear mixed models were separately used to construct average labour
curves. All analyses were conducted according to three parity groups: parity = 0 (n = 2,166),
parity = 1 (n = 1,488), and parity = 2+ (n = 1,952). We performed sensitivity analyses to
assess the impact of oxytocin augmentation on labour progression by re-examining the pro-
gression patterns after excluding women with augmented labours. Labour was augmented
with oxytocin in 40% of nulliparous and 28% of multiparous women. The median time to
advance by 1 cm exceeded 1 hour until 5 cm was reached in both nulliparous and multipa-
rous women. Based on a 95th percentile threshold, nulliparous women may take up to 7
hours to progress from 4 to 5 cm and over 3 hours to progress from 5 to 6 cm. Median cumu-
lative duration of labour indicates that nulliparous women admitted at 4 cm, 5 cm, and 6 cm
reached 10 cm within an expected time frame if the dilatation rate was� 1 cm/hour, but their
corresponding 95th percentiles show that labour could last up to 14, 11, and 9 hours,
respectively. Substantial differences exist between actual plots of labour progression of indi-
vidual women and the ‘average labour curves’ derived from study population-level data.
Exclusion of women with augmented labours from the study population resulted in slightly
faster labour progression patterns.
Conclusions
Cervical dilatation during labour in the slowest-yet-normal women can progress more slowly
than the widely accepted benchmark of 1 cm/hour, irrespective of parity. Interventions to
expedite labour to conform to a cervical dilatation threshold of 1 cm/hour may be inappropri-
ate, especially when applied before 5 cm in nulliparous and multiparous women. Averaged
labour curves may not truly reflect the variability associated with labour progression, and
their use for decision-making in labour management should be de-emphasized.
Author summary
Why was this study done?
• Dr Emmanuel Friedman’s studies on normal and abnormal labour progression have
defined how labour should be managed since the mid-1950s until today. Although
Friedman’s studies were conducted among pregnant women in the United States, the
Progression of the first stage of labour
PLOS Medicine | https://doi.org/10.1371/journal.pmed.1002492 January 16, 2018 2 / 30
UNICEF-WHO-World Bank Special Programme of
Research, Development and Research Training in
Human Reproduction (HRP), a cosponsored
program executed by the World Health
Organization (WHO). The funders had no role in
study design, data collection and analysis, decision
to publish, or preparation of the manuscript.
Competing interests: The authors have declared
that no competing interests exist.
Abbreviations: BOLD, Better Outcomes in Labour
Difficulty; RP2, Review Panel on Research
Projects.

general belief that labour progression is the same in humans led to universal application
of their findings, and the expectation that the cervix dilates by at least 1 cm/hour in all
women during established labour.
• Since the early 2000s, however, researchers using new statistical methods to study labour
found evidence to suggest that the patterns of labour progression as described by Fried-
man may not be accurate for the current generation of women giving birth. While these
newer findings have informed changes in recommended labour practices in some set-
tings, they have also generated a lot of controversy.
• As a result of persistent questions as to whether racial characteristics influence labour
progression patterns, recent studies have been conducted among different populations,
but not yet in any African population.
What did the researchers do and find?
• We conducted an analysis of prospectively collected observational data of 5,606 women
who presented in early labour (at or before 6 cm of cervical dilatation) following sponta-
neous labour onset and gave birth vaginally in 13 maternity hospitals in Nigeria and
Uganda. None of these women experienced serious adverse outcomes for themselves or
their babies.
• We applied advanced statistical and computational methods (survival analysis and Mar-
kov techniques) to determine how long it took the cervix to dilate by 1 cm from one
level of dilatation to the next until full dilatation (10 cm) and how long it took the cervix
to reach full dilatation based on the dilatation at the time of labour admission. We also
used two separate methods to plot population average cervical dilatation time curves
(labour curves) for the women in our sample.
• Contrary to the generally held view, we found that labour progressed more slowly in our
study population than previously reported. On average, the rate of cervical dilatation
was less than 1 cm/hour for some women until 5 cm of cervical dilatation was reached
among those undergoing their first, second, or subsequent labours.
• Labour was very slow in some women throughout the first stage, including the early
part of the period that is traditionally known as the ‘active phase’, when the ‘normal’ cer-
vical dilatation rate is expected to be at least 1 cm/hour or faster. While on average the
labour progression in first-time mothers was generally similar to their counterparts in
the US, China, and Japan, there are also important differences in the slowest-yet-normal
(95th percentile) group of women in our study population.
What do these findings mean?
• The average labour curves derived from our study population are substantially different
from those published from the pioneer work of Friedman. They also do not truly reflect
the variations shown in the labour progression of individual women in our study.
• The application of population average labour curves could potentially misclassify
women who are slowly but normally progressing as abnormal and therefore increase
their chances of being subjected to unnecessary labour interventions. We propose that
Progression of the first stage of labour
PLOS Medicine | https://doi.org/10.1371/journal.pmed.1002492 January 16, 2018 3 / 30
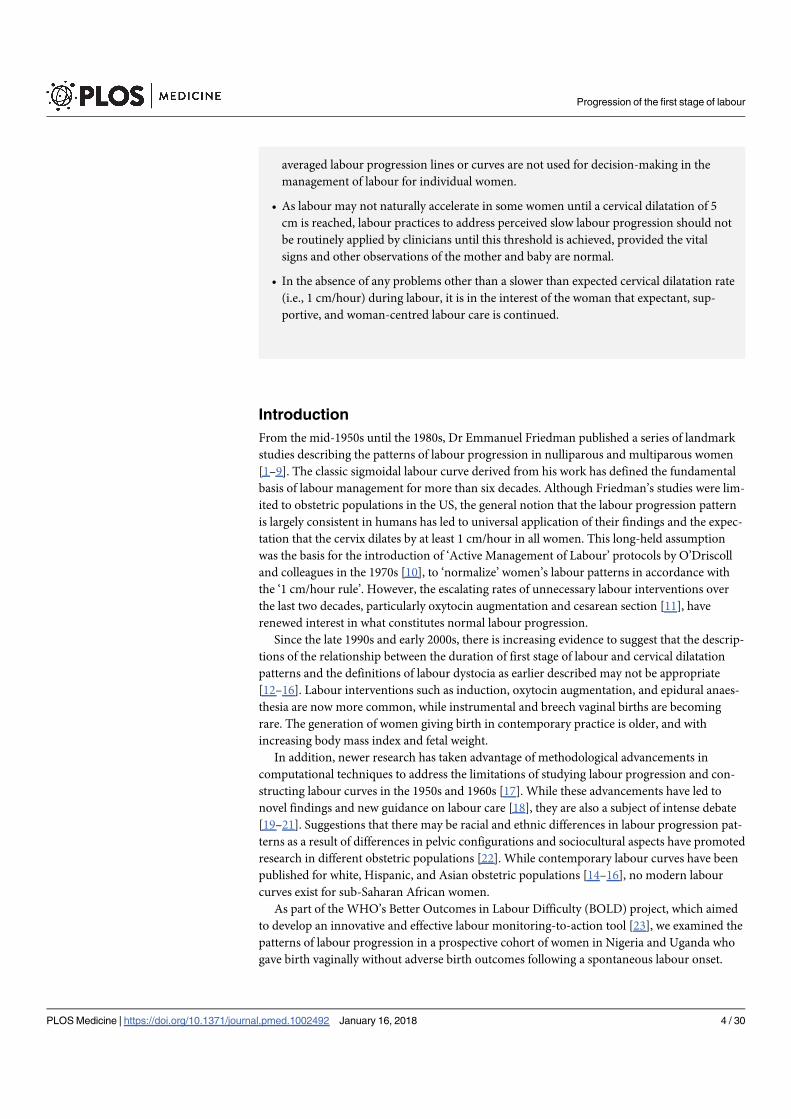
averaged labour progression lines or curves are not used for decision-making in the
management of labour for individual women.
• As labour may not naturally accelerate in some women until a cervical dilatation of 5
cm is reached, labour practices to address perceived slow labour progression should not
be routinely applied by clinicians until this threshold is achieved, provided the vital
signs and other observations of the mother and baby are normal.
• In the absence of any problems other than a slower than expected cervical dilatation rate
(i.e., 1 cm/hour) during labour, it is in the interest of the woman that expectant, sup-
portive, and woman-centred labour care is continued.
Introduction
From the mid-1950s until the 1980s, Dr Emmanuel Friedman published a series of landmark
studies describing the patterns of labour progression in nulliparous and multiparous women
[1–9]. The classic sigmoidal labour curve derived from his work has defined the fundamental
basis of labour management for more than six decades. Although Friedman’s studies were lim-
ited to obstetric populations in the US, the general notion that the labour progression pattern
is largely consistent in humans has led to universal application of their findings and the expec-
tation that the cervix dilates by at least 1 cm/hour in all women. This long-held assumption
was the basis for the introduction of ‘Active Management of Labour’ protocols by O’Driscoll
and colleagues in the 1970s [10], to ‘normalize’ women’s labour patterns in accordance with
the ‘1 cm/hour rule’. However, the escalating rates of unnecessary labour interventions over
the last two decades, particularly oxytocin augmentation and cesarean section [11], have
renewed interest in what constitutes normal labour progression.
Since the late 1990s and early 2000s, there is increasing evidence to suggest that the descrip-
tions of the relationship between the duration of first stage of labour and cervical dilatation
patterns and the definitions of labour dystocia as earlier described may not be appropriate
[12–16]. Labour interventions such as induction, oxytocin augmentation, and epidural anaes-
thesia are now more common, while instrumental and breech vaginal births are becoming
rare. The generation of women giving birth in contemporary practice is older, and with
increasing body mass index and fetal weight.
In addition, newer research has taken advantage of methodological advancements in
computational techniques to address the limitations of studying labour progression and con-
structing labour curves in the 1950s and 1960s [17]. While these advancements have led to
novel findings and new guidance on labour care [18], they are also a subject of intense debate
[19–21]. Suggestions that there may be racial and ethnic differences in labour progression pat-
terns as a result of differences in pelvic configurations and sociocultural aspects have promoted
research in different obstetric populations [22]. While contemporary labour curves have been
published for white, Hispanic, and Asian obstetric populations [14–16], no modern labour
curves exist for sub-Saharan African women.
As part of the WHO’s Better Outcomes in Labour Difficulty (BOLD) project, which aimed
to develop an innovative and effective labour monitoring-to-action tool [23], we examined the
patterns of labour progression in a prospective cohort of women in Nigeria and Uganda who
gave birth vaginally without adverse birth outcomes following a spontaneous labour onset.
Progression of the first stage of labour
PLOS Medicine | https://doi.org/10.1371/journal.pmed.1002492 January 16, 2018 4 / 30

Methods
Ethics statement
Scientific and technical approval for this study was obtained from the Review Panel on
Research Projects (RP2) of the UNDP/UNFPA/UNICEF/WHO/World Bank Special Program
of Research, Development and Research Training in Human Reproduction (HRP), Depart-
ment of Reproductive Health and Research, WHO. Ethical approval was obtained from the
WHO Ethical Review Committee (protocol A65879), the Makerere University School of
Health Sciences Research and Ethics Committee, Uganda (protocol #SHSREC REF 2014–058),
University of Ibadan/University College Hospital Ethics Committee (UI/EC/14/0223), Federal
Capital Territory Health Research Ethics Committee, Nigeria (protocol FHREC/2014/01/42/
27-08-14), and Ondo State Government Ministry of Health Research Ethics Review Commit-
tee, Nigeria (AD 4693/160). The study was conducted according to the Declaration of Helsinki
of the World Medical Association.
Design, setting, and population
The WHO BOLD research project was primarily designed to identify the essential elements of
labour monitoring that trigger the decision to use interventions aimed at preventing poor
labour outcomes, with the aim of developing a new labour monitoring-to-action tool. The
study protocol and detailed methodological considerations have been published elsewhere
[23]. In brief, this was a prospective, multicentre, cohort study of women admitted for vaginal
birth with single live fetuses during early first stage of labour across 13 hospitals in Nigeria and
Uganda. This included women undergoing induction of labour and those with spontaneous
labour onset who presented at cervical dilatation of� 6 cm. Women with multiple pregnan-
cies, gestational age less than 34 weeks, elective cesarean section, and those who were unwilling
to participate or incapable of giving consent due to obstetric emergencies were excluded. 9,995
women (56.1%) out of 17,810 women who were screened in all hospitals during the study
period met these inclusion criteria and participated in the study.
Participating hospitals had a minimum of 1,000 deliveries per year with stable access to
cesarean section, augmentation of labour, and instrumental vaginal birth. Estimation of gesta-
tional age at birth was in accordance with individual institutional practices, which relied upon
the woman’s first date of the last menstrual period in the majority of cases. Labour was man-
aged by midwives or obstetric residents and/or obstetricians. Doppler fetal monitor was used
to assess fetal vital status at hospital admission and for intermittent monitoring throughout
labour. Labour management protocol, as well as the number and timing of pelvic examina-
tions, were not standardized across participating institutions. None of the institutions sub-
scribed to the ‘Active Management of Labour’ protocol during the study period. Although the
partograph was a standard element in all labour protocols, adherence to its application for
labour management during the study period varied widely across hospitals.
Study procedures
Eligible women were recruited into the study between December 2014 and November 2015.
From the medical record, trained research nurses prospectively extracted detailed information
on sociodemographic, anthropometric, obstetric, and medical characteristics of study partici-
pants at hospital admission, multiple assessments for labour monitoring and interventions
performed throughout the first and second stages of labour, and maternal and neonatal out-
comes following labour. Attending staff were approached to complement medical records data
Progression of the first stage of labour
PLOS Medicine | https://doi.org/10.1371/journal.pmed.1002492 January 16, 2018 5 / 30

when needed. Data collection was limited to the hospital stay of the mother and baby, and
there was no follow-up after hospital discharge.
The current study used information on maternal baseline and admission characteristics,
repeated assessments of cervical dilatation over time, maternal and neonatal characteristics
throughout labour, and perinatal outcome data. This analysis was focused on describing the
labour patterns of women without adverse birth outcomes and not on determining correlation
to clinical outcomes (See S1 STROBE Checklist). From a total of 8,957 singleton births with
consistent time records in the database, we restricted our analysis to examine labour progres-
sion to 5,606 women on the basis of the following inclusion criteria (Fig 1): term births
(between 37 weeks and 0 days and 41 weeks and 6 days) with vertex presentation and sponta-
neous labour onset. We excluded women who had labour induction, previous uterine scar, or
Fig 1. Sample selection flow chart. � Excluding significant outliers due to unusual rapidity, regression, or
inconsistencies with time. BOLD, Better Outcomes in Labour Difficulty.
https://doi.org/10.1371/journal.pmed.1002492.g001
Progression of the first stage of labour
PLOS Medicine | https://doi.org/10.1371/journal.pmed.1002492 January 16, 2018 6 / 30

intrapartum cesarean section. To examine the labour patterns in women with normal perinatal
outcomes, we excluded women whose labour resulted in severe adverse outcomes, which was
defined as occurrence of any of the following: stillbirth, early neonatal death, neonatal use of
anticonvulsant, neonatal cardiopulmonary resuscitation, 5-minute Apgar score < 6, maternal
death or organ dysfunction associated with labour dystocia, or uterine rupture. Furthermore,
we excluded women who gave birth to neonates with severe congenital malformation and
those with fewer than two cervical dilatation assessments during the first stage of labour (since
a single data point cannot be used to generate a labour pattern for the individual woman).
Data analysis
We grouped women in the selected sample into three parity groups (0, 1, and 2+) to explore
any differences in labour patterns according to parity. We used two independent approaches
to analyse labour progression patterns and construct average labour curves for the selected
sample. In the first approach, we performed survival analyses to estimate the time it took to
progress from one level of cervical dilatation to the next (called ‘sojourn time’) (i.e., from 3 to 4
cm, 4 to 5 cm, 5 to 6 cm, until full dilatation [10 cm]). We used both complete (where avail-
able) and interval-censored times to estimate the distribution of times for progression from
one integer centimetre of dilatation to the next, with an assumption that the labour data are
log-normally distributed. Based on this model, the median, 5th, and 95th percentiles were cal-
culated. We used the same approach to derive the cumulative duration of labour for women
presenting at different cervical dilatations (3 cm, 4 cm, 5 cm, and 6 cm) to evaluate any poten-
tial differences in the patterns of labour progression. To illustrate the ‘slowest-yet-normal’
labour patterns, we plotted the 95th percentiles for the cumulative duration of labour based on
the cervical dilatation at admission. To construct average labour curves, we applied a nonlinear
mixed model that best fit our data instead of polynomial models used by previous authors [12–
16, 24]. We expressed cervical dilatation for subject i in time j (yij) as a function of time (tij)
according to the following three-parameter logistic growth model:
yij ¼ b0 þb1
1þ expð� ðtij � ðb2 þ biÞÞÞ
in which β0 is dilatation value when tij! −1, β1 is the asymptotic curve height, and β2 is the
inflection point and at this time value when the dilatation reaches half of its height. For sim-
plicity, we estimated β0, β1 as fixed effects and included the random term bi in the inflection
point and assumed that this term follows a normal distribution, i.e., bi � Nð0;s2bÞ. Given that
women in this analysis entered the cervical dilatation time curve at different dilatations but all
ended at full dilatation (10 cm), the starting point (time = 0) on the x-axis was set at full dilata-
tion (10 cm), which was reached by all women in the sample and then calculated backwards
(e.g., 1 hour before 10 cm becomes −1 hour and so on). This x-axis (time) was then reverted to
a positive value. For example, instead of −12! 0 hours, it became 0! 12 hours. We used
R-Cran version 3.2 for these statistical analyses [25].
In the second approach, we applied a multistate Markov modelling technique to examine
the labour progression patterns in the same sample. This mathematical modelling technique
from matrix algebra describes the transitions that a cohort of individuals make among a num-
ber of mutually exclusive and exhaustive health states during a series of short time intervals
[26]. As cervical dilatation progression is a state- and time-related phenomenon during a
period ranging from labour onset through to full cervical dilatation and birth of the baby (i.e.,
there is a finite set of states), the labour process can be considered a mathematical model that
is suitable for the application of multistate Markov modelling. We therefore represented the
Progression of the first stage of labour
PLOS Medicine | https://doi.org/10.1371/journal.pmed.1002492 January 16, 2018 7 / 30

sequence of labour progress as states based on every observed centimetre from 2 to 10 cm until
birth of the baby—the ‘absorbing state’, as illustrated in S1 Fig. At a time t, the woman is in
state S(t). The model was designed as a progressive unidirectional model, which only allows a
choice of a way out of a particular state, but once a woman has left a state she cannot return.
The next state to which a woman moves and the time of the change are governed by a set of
transition intensities for each pair of states r and s. The transition intensity represents the
instantaneous likelihood of moving from state r to state s. The full set of intensities for the sys-
tem form the matrix Q.
A Markov process is based on the transition matrix with a probability structure P(u, t + u).
The (r, s) entry (the elements of entire matrix) of P(u, t + u), is the probability of being in state
s at a time t + u, given the state at time u is r. P(u, t + u) is calculated in terms of Q. Assuming
that the transition intensity matrix Q is constant over the interval (u, t + u), as in a time-homo-
geneous process, P(u, t + u) = P(t) and the equations are solved by the matrix exponential of Qscaled by the time interval, P(t) = Exp(tQ) (S1 Fig). We used msm package for R Project pro-
gramming environment to fit the multistate Markov model [26]. We generated random obser-
vations of cervical dilatation based on the transition matrix P(t) for the entire duration of
labour (S2 Fig) to derive average labour curves according to parity and calculated the median,
5th, and 95th percentiles of sojourn times and cumulative duration of labour according to cer-
vical dilatation at admission.
In order to assess the influence of oxytocin augmentation on the described labour patterns,
we applied the survival analyses and multistate Markov models to perform sensitivity analyses
comparing labour progression patterns of all women with that of a population excluding
women with oxytocin augmentation (i.e., our entire study population versus study population
excluding women with augmented labours).
The plan for the above survival analyses was first presented at an expert meeting convened
by the WHO in November 2016, following which the analyses were started. In February 2017,
after a review of the preliminary results of these analyses, the WHO study-coordinating unit
requested an independent application of multistate Markov models to the same sample of
women in order to determine whether the findings are consistent between the two analytical
approaches. From June to July 2017, sensitivity analyses were conducted using the two analyti-
cal approaches to assess the influence of oxytocin augmentation on the described labour pat-
terns for the study population, following the suggestions of the BOLD project technical
advisory group and study co-authors.
Results
Baseline characteristics, labour observations, and interventions
A total of 5,606 women were included in these analyses. Table 1 presents the characteristics of
these women by parity. In the selected sample, 54.7% of the women were from Uganda and 45.3%
were from Nigeria. Nulliparous women were younger than the multiparous women, constituted
over a third of the study sample, and were evenly balanced between the two countries. There was a
slight increase in maternal body mass index at birth as parity increased. At labour admission, spon-
taneous rupture of the membranes had occurred in a quarter of nulliparous women and in about
one-fifth of multiparous women. The cervix was well effaced (thin or very thin) in half of the nul-
liparous and in slightly higher proportions in the multiparous groups. Median cervical dilatation
was 4 cm, and the fetal head was not engaged in over 90% of women in all parity groups. There
was no caput succedaneum or moulding in over 99% of the women at the time of admission.
In terms of labour interventions, 40% of nulliparous women received oxytocin infusion for
labour augmentation, compared with 28% of multiparous women. The median number of
Progression of the first stage of labour
PLOS Medicine | https://doi.org/10.1371/journal.pmed.1002492 January 16, 2018 8 / 30

Table 1. Labour characteristics and interventions by parity.
Demographic characteristics Parity = 0 Parity = 1 Parity = 2+
Study population: N = 5,606 2,166 1,488 1,952
Country
Nigeria 1,102 (50.88) 645 (43.35) 793 (40.62)
Uganda 1,064 (49.12) 843 (56.65) 1,159 (59.38)
Age: years, mean (SD) 25.12 (4.17) 27.14 (4.05) 30.98 (4.64)
Maternal height: cm, mean (SD) 159.88 (6.76) 159.96 (6.57) 160.43 (6.67)
Maternal weight at delivery: kg, mean (SD) 71.84 (11.59) 73.82 (12.35) 76.37 (12.55)
Maternal BMI at delivery: mean (SD) 28.09 (4.12) 28.86 (4.51) 29.66 (4.53)
Labour admission observations
Amniotic membranes status: N (%)
Intact 1,630 (75.25) 1,189 (79.91) 1,530 (78.38)
Ruptured 534 (24.65) 295 (19.83) 420 (21.52)
Unknown 2 (0.09) 4 (0.27) 2 (0.10)
Cervix effacement: N (%)
Thick (<30%) 338 (15.60) 213 (14.31) 299 (15.32)
Medium (up to 50%) 745 (34.40) 422 (28.36) 585 (29.97)
Thin (up to 80%) 918 (42.38) 737 (49.53) 921 (47.18)
Very thin (>80%) 160 (7.39) 110 (7.39) 142 (7.27)
Unknown 5 (0.23) 6 (0.40) 5 (0.26)
Cervical dilatation: cm, median (10th, 90th percentiles) 4 (2, 6) 4 (2, 6) 4 (2, 6)
Fetal station: N (%)
Above ischial spine 1,591 (73.45) 1,056 (70.97) 1,382 (70.80)
At ischial spine 438 (20.22) 316 (21.24) 389 (19.93)
Below ischial spine 136 (6.28) 112 (7.53) 173 (8.86)
Unknown 1 (0.05) 4 (0.27) 8 (0.41)
Caput succedaneum: N (%)
None 2,158 (99.60) 1,486 (99.90) 1,949 (99.80)
Mild 7 (0.30) 1 (0.10) 3 (0.20)
Moderate 1 (0.00) 0 (0.00) 0 (0.00)
Severe 0 (0.00) 0 (0.00) 0 (0.00)
Unknown 0 (0.00) 1 (0.07) 0 (0.00)
Moulding: N (%)
0 (none) 2,151 (99.30) 1,479 (99.50) 1,942 (99.50)
1+ (first degree) 13 (0.60) 8 (0.50) 10 (0.50)
2+ (second degree) 2 (0.10) 0 (0.00) 0 (0.00)
3+ (third degree) 0 (0.00) 0 (0.00) 0 (0.00)
Unknown 0 (0.00) 1 (0.07) 0 (0.00)
Intrapartum interventions and observations
Total number of vaginal examinations in first stage: median (10th, 90th percentiles) 3 (2, 5) 3 (2, 4) 3 (2, 4)
Augmentation with oxytocin infusion: N (%) 866 (40.00) 444 (29.80) 522 (26.70)
Labour analgesia: N (%)
IV/IM Opioid 69 (3.20) 22 (1.50) 17 (0.90)
Epidural 0 (0.00) 1 (0.10) 0 (0.00)
Spinal 1 (0.00) 0 (0.00) 0 (0.00)
Other 31 (1.40) 17 (1.10) 21 (1.10)
Combined 0 (0.00) 1 (0.10) 0 (0.00)
(Continued)
Progression of the first stage of labour
PLOS Medicine | https://doi.org/10.1371/journal.pmed.1002492 January 16, 2018 9 / 30

vaginal examinations per woman throughout first stage was 3. Presence of a labour companion
was observed at least on one occasion in more than half of the women and on two or more occa-
sions in at least a third. While over two-thirds of the women were observed to have taken oral flu-
ids at least once during labour, less than half of them were observed to have done so two or more
times. In comparison, oral feedings were observed less frequently, although the observed pattern
was similar across parity groups. Severe caput succedaneum and third-degree moulding of the
Table 1. (Continued)
Demographic characteristics Parity = 0 Parity = 1 Parity = 2+
Presence of a labour companion�: N (%)
0 1,053 (48.61) 661 (44.42) 808 (41.39)
1 304 (14.04) 300 (20.16) 414 (21.21)
2 371 (17.13) 276 (18.55) 400 (20.49)
�3 429 (19.81) 240 (16.13) 316 (16.19)
Unknown 9 (0.42) 11 (0.74) 14 (0.72)
Oral fluid intake�: N (%)
0 674 (31.12) 453 (30.44) 556 (28.48)
1 489 (22.58) 451 (30.31) 587 (30.07)
2 531 (24.52) 343 (23.05) 464 (23.77)
�3 463 (21.38) 230 (15.46) 328 (16.80)
Unknown 9 (0.42) 11 (0.74) 17 (0.87)
Oral food intake�: N (%)
0 1,698 (78.39) 1,187 (79.77) 1,561 (79.97)
1 273 (12.60) 207 (13.91) 255 (13.06)
2 118 (5.45) 52 (3.49) 92 (4.71)
�3 67 (3.09) 29 (1.95) 27 (1.38)
Unknown 10 (0.46) 13 (0.87) 17 (0.87)
Caput succedaneum��: N (%)
None 1,911 (88.23) 1,368 (91.94) 1,814 (92.93)
Mild 202 (9.33) 102 (6.85) 113 (5.79)
Moderate 44 (2.03) 10 (0.67) 16 (0.82)
Severe 0 (0.00) 0 (0.00) 0 (0.00)
Unknown 9 (0.42) 8 (0.54) 9 (0.46)
Moulding��: N (%)
0 (none) 1,758 (81.16) 1,219 (81.92) 1,598 (81.86)
1+ (first degree) 332 (15.33) 225 (15.12) 312 (15.98)
2+ (second degree) 64 (2.95) 35 (2.35) 32 (1.64)
3+ (third degree) 2 (0.10) 1 (0.10) 1 (0.10)
Unknown 10 (0.46) 8 (0.54) 9 (0.46)
Birth outcomes
Mode of birth: N (%)
Spontaneous vaginal birth (without episiotomy) 849 (39.20) 1,218 (81.90) 1,798 (92.10)
Spontaneous vaginal birth (with episiotomy) 1,255 (57.90) 250 (16.80) 145 (7.40)
Operative vaginal birth (forceps or vacuum) 62 (2.90) 20 (1.30) 9 (0.50)
Gestational age at birth: weeks, mean (SD) 38.74 (1.11) 38.74 (1.11) 38.77 (1.10)
Birth weight: g, mean (SD) 3,139.72 (404.22) 3,277.48 (409.12) 3,348.28 (438.91)
�Frequency of observations during intrapartum assessments
��Most ‘severe’ observation during intrapartum assessments
https://doi.org/10.1371/journal.pmed.1002492.t001
Progression of the first stage of labour
PLOS Medicine | https://doi.org/10.1371/journal.pmed.1002492 January 16, 2018 10 / 30

fetal head were rarely seen in any of the parity groups. Labour analgesia and operative vaginal
birth were used in less than 2% in the study population; a reflection of the current clinical prac-
tices in the study hospitals. While the gestational age at birth was similar across the parity groups,
there was an average of a 100-g increase in birth weight with increasing parity.
Labour progression patterns (all women)
Table 2 presents the detailed analyses of labour progression based on the two analytical
approaches and compares these with the findings of Zhang et al. [14]. The table shows that,
based on survival analyses, the median time for the cervix to dilate by 1 cm was longer than the
generally accepted limit of 1 hour until a cervical dilatation of 5 cm was achieved in nulliparous
women and until 5 cm was achieved in multiparous women. In all parity groups, the median
rate of progression doubles as the cervix reaches 6 cm with a median time shorter than 1 hour.
Labour progression afterwards escalated more rapidly as it advanced towards 10 cm in all par-
ity groups. Likewise, multistate Markov modelling shows that the median time needed to
advance by 1 cm was more than 1 hour until 5 cm was achieved in both nulliparous and mul-
tiparous women, and labour progression became more rapid from 7 cm. The distribution of
data from both analysis methods show a wide variability around the median for each level of
advancement, though this was more pronounced in the survival analyses data. The 95th per-
centiles of the distribution of sojourn times indicate that labour could progress much more
slowly for some women and still result in vaginal birth without adverse birth outcomes. The
data show that it was not unusual for nulliparous women to spend more than 7 hours to
advance from 4 to 5 cm and over 3 hours to advance from 5 to 6 cm. For some women, the
95th percentile data suggest that throughout the first stage of labour, it took more than 1 hour
Table 2. Duration of labour from one level of cervical dilatation to the next by parity and analysis method.
Parity Parity = 0 Parity = 1 Parity = 2+
Study Current study Current
study
Zhang et al.
[14]
Current study Current
study
Zhang et al.
[14]
Current study Current
study
†Zhang et al.
[14]
N 2,166 2,166 25,624 1,488 1,488 16,755 1,952 1,952 16,219
Cervical
dilatation
Survival
analysis†
Markov
model
Survival
analysis‡
Survival
analysis†
Markov
model
Survival
analysis‡
Survival
analysis†
Markov
model
Survival
analysis‡
3–4 cm 2.82 (0.60,
13.33)
1.83 (0.08,
8.17)
1.8 (8.1) 2.42 (0.41;
14.18)
1.92 (0.08,
8.33)
NA 2.35 (0.31;
17.85)
2.17 (0.08,
9.75)
NA
4–5 cm 1.72 (0.38,
7.83)
1.58 (0.08,
7.08)
1.3 (6.4) 1.37 (0.25;
7.65)
1.42 (0.08,
6.42)
1.4 (7.3) 1.18 (0.17;
8.05)
1.50 (0.08,
6.5)
1.4 (7.0)
5–6 cm 1.19 (0.23,
6.17)
0.83 (0.00,
3.83)
0.8 (3.2) 0.79 (0.13;
4.95)
0.83 (0.00,
3.58)
0.8 (3.4) 0.79 (0.10;
6.24)
0.75 (0.00,
3.33)
0.8 (3.4)
6–7 cm 0.66 (0.09,
4.92)
0.92 (0.00,
4.25)
0.6 (2.2) 0.33 (0.03;
3.67)
0.75 (0.00,
3.50)
0.5 (1.9) 0.31 (0.03;
3.29)
0.83 (0.00,
3.58)
0.4 (1.2)
7–8 cm 0.25 (0.02,
3.10)
0.58 (0.00,
2.50)
0.5 (1.6) 0.09 (0.00;
2.69)
0.42 (0.00,
1.83)
0.4 (1.3) 0.17 (0.01;
2.44)
0.33 (0.00,
1.50)
0.3 (0.9)
8–10 cm 0.87 (0.18,
4.19)
0.75 (0.00,
3.33)
0.5 (1.4)�; 0.5
(1.8)§
0.64 (0.11;
3.56)
0.67 (0.00,
2.92)
0.3 (1.0)�; 0.3
(0.9)§
0.68 (0.12;
3.77)
0.50 (0.00,
2.50)
0.3 (0.8)�; 0.3
(1.6)§
Current study data reported as median hours (5th, 95th percentiles).
Zhang et al. data reported as median hours (95th percentile).
† Survival analysis with complete and interval-censored values
‡ Survival analysis with interval-censored regression
� 8–9 cm.
§ 9–10 cm.
https://doi.org/10.1371/journal.pmed.1002492.t002
Progression of the first stage of labour
PLOS Medicine | https://doi.org/10.1371/journal.pmed.1002492 January 16, 2018 11 / 30

for cervical dilatation to advance by 1 cm irrespective of the parity groups. The table also
shows that the pattern of median times to advance from early to advanced first stage of labour
is largely consistent with the findings of Zhang et al. [14], although our 95th percentiles show
even wider variability.
Fig 2 shows that the ‘average labour curves’ derived from multistate Markov models for
both nulliparous and multiparous women progressed gradually from 4 cm with fairly linear
trajectories as they advanced towards 10 cm. The slopes of the curves for multiparous women
were steeper than that of the nulliparous women.
The nonlinear mixed models, however, produced smooth labour curves for both nullipa-
rous and multiparous women, which proceeded gradually with a slight upward inclination
from around 5 cm and no clear inflection points through 10 cm (S3 Fig). Inflection points
appear outside the normal range of observations. Within the range of observed data for cervi-
cal dilatation, the curves appear to accelerate from 5 cm, with steeper slopes as they advanced
towards 10 cm in multiparous compared to nulliparous women.
S1 Video, S2 Video, S3 Video, and S4 Video are video displays comparing actual plots of
cervical dilatation pattern of individual women (starting from 4 cm) with (1) the average
labour curves constructed from our study population and (2) the 1 cm/hour alert line of the
partograph. The videos show that a substantial proportion of nulliparous and multiparous
women crossed the 1 cm/hour alert line as they progressed during labour. The videos also
show that substantial differences exist between actual plots of labour progression for individual
women and the population average curves.
Table 3 shows the cumulative duration of labour from the cervical dilatation observed at
admission (e.g., at 3 cm, 4 cm, 5 cm, or 6 cm) to the next centimetre until 10 cm. The table
shows that the median times estimated by the two analysis methods are mostly consistent but
also have wide variability in data distribution expressed by their corresponding 5th and 95th
Fig 2. Average labour curves by parity based on multistate Markov models. P0, nulliparous women; P1, parity = 1
women; P2+, parity = 2+ women.
https://doi.org/10.1371/journal.pmed.1002492.g002
Progression of the first stage of labour
PLOS Medicine | https://doi.org/10.1371/journal.pmed.1002492 January 16, 2018 12 / 30
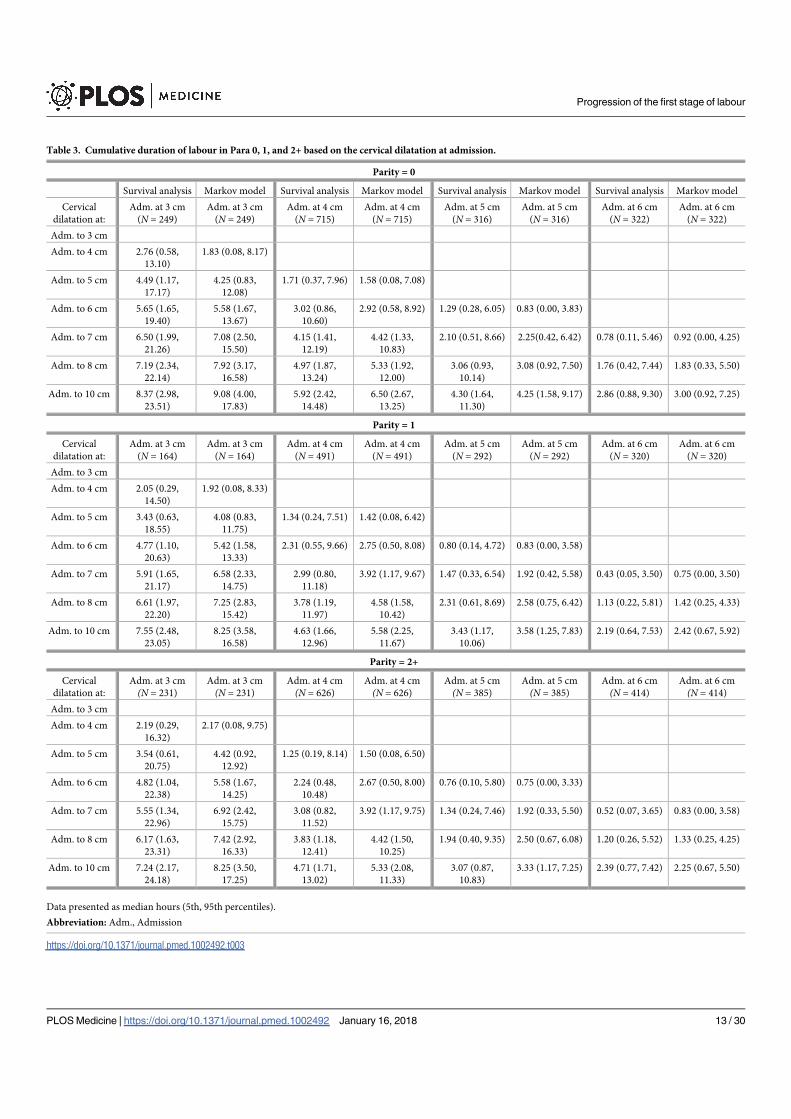
Table 3. Cumulative duration of labour in Para 0, 1, and 2+ based on the cervical dilatation at admission.
Parity = 0
Survival analysis Markov model Survival analysis Markov model Survival analysis Markov model Survival analysis Markov model
Cervical
dilatation at:
Adm. at 3 cm
(N = 249)
Adm. at 3 cm
(N = 249)
Adm. at 4 cm
(N = 715)
Adm. at 4 cm
(N = 715)
Adm. at 5 cm
(N = 316)
Adm. at 5 cm
(N = 316)
Adm. at 6 cm
(N = 322)
Adm. at 6 cm
(N = 322)
Adm. to 3 cm
Adm. to 4 cm 2.76 (0.58,
13.10)
1.83 (0.08, 8.17)
Adm. to 5 cm 4.49 (1.17,
17.17)
4.25 (0.83,
12.08)
1.71 (0.37, 7.96) 1.58 (0.08, 7.08)
Adm. to 6 cm 5.65 (1.65,
19.40)
5.58 (1.67,
13.67)
3.02 (0.86,
10.60)
2.92 (0.58, 8.92) 1.29 (0.28, 6.05) 0.83 (0.00, 3.83)
Adm. to 7 cm 6.50 (1.99,
21.26)
7.08 (2.50,
15.50)
4.15 (1.41,
12.19)
4.42 (1.33,
10.83)
2.10 (0.51, 8.66) 2.25(0.42, 6.42) 0.78 (0.11, 5.46) 0.92 (0.00, 4.25)
Adm. to 8 cm 7.19 (2.34,
22.14)
7.92 (3.17,
16.58)
4.97 (1.87,
13.24)
5.33 (1.92,
12.00)
3.06 (0.93,
10.14)
3.08 (0.92, 7.50) 1.76 (0.42, 7.44) 1.83 (0.33, 5.50)
Adm. to 10 cm 8.37 (2.98,
23.51)
9.08 (4.00,
17.83)
5.92 (2.42,
14.48)
6.50 (2.67,
13.25)
4.30 (1.64,
11.30)
4.25 (1.58, 9.17) 2.86 (0.88, 9.30) 3.00 (0.92, 7.25)
Parity = 1
Cervical
dilatation at:
Adm. at 3 cm
(N = 164)
Adm. at 3 cm
(N = 164)
Adm. at 4 cm
(N = 491)
Adm. at 4 cm
(N = 491)
Adm. at 5 cm
(N = 292)
Adm. at 5 cm
(N = 292)
Adm. at 6 cm
(N = 320)
Adm. at 6 cm
(N = 320)
Adm. to 3 cm
Adm. to 4 cm 2.05 (0.29,
14.50)
1.92 (0.08, 8.33)
Adm. to 5 cm 3.43 (0.63,
18.55)
4.08 (0.83,
11.75)
1.34 (0.24, 7.51) 1.42 (0.08, 6.42)
Adm. to 6 cm 4.77 (1.10,
20.63)
5.42 (1.58,
13.33)
2.31 (0.55, 9.66) 2.75 (0.50, 8.08) 0.80 (0.14, 4.72) 0.83 (0.00, 3.58)
Adm. to 7 cm 5.91 (1.65,
21.17)
6.58 (2.33,
14.75)
2.99 (0.80,
11.18)
3.92 (1.17, 9.67) 1.47 (0.33, 6.54) 1.92 (0.42, 5.58) 0.43 (0.05, 3.50) 0.75 (0.00, 3.50)
Adm. to 8 cm 6.61 (1.97,
22.20)
7.25 (2.83,
15.42)
3.78 (1.19,
11.97)
4.58 (1.58,
10.42)
2.31 (0.61, 8.69) 2.58 (0.75, 6.42) 1.13 (0.22, 5.81) 1.42 (0.25, 4.33)
Adm. to 10 cm 7.55 (2.48,
23.05)
8.25 (3.58,
16.58)
4.63 (1.66,
12.96)
5.58 (2.25,
11.67)
3.43 (1.17,
10.06)
3.58 (1.25, 7.83) 2.19 (0.64, 7.53) 2.42 (0.67, 5.92)
Parity = 2+
Cervical
dilatation at:
Adm. at 3 cm
(N = 231)
Adm. at 3 cm
(N = 231)
Adm. at 4 cm
(N = 626)
Adm. at 4 cm
(N = 626)
Adm. at 5 cm
(N = 385)
Adm. at 5 cm
(N = 385)
Adm. at 6 cm
(N = 414)
Adm. at 6 cm
(N = 414)
Adm. to 3 cm
Adm. to 4 cm 2.19 (0.29,
16.32)
2.17 (0.08, 9.75)
Adm. to 5 cm 3.54 (0.61,
20.75)
4.42 (0.92,
12.92)
1.25 (0.19, 8.14) 1.50 (0.08, 6.50)
Adm. to 6 cm 4.82 (1.04,
22.38)
5.58 (1.67,
14.25)
2.24 (0.48,
10.48)
2.67 (0.50, 8.00) 0.76 (0.10, 5.80) 0.75 (0.00, 3.33)
Adm. to 7 cm 5.55 (1.34,
22.96)
6.92 (2.42,
15.75)
3.08 (0.82,
11.52)
3.92 (1.17, 9.75) 1.34 (0.24, 7.46) 1.92 (0.33, 5.50) 0.52 (0.07, 3.65) 0.83 (0.00, 3.58)
Adm. to 8 cm 6.17 (1.63,
23.31)
7.42 (2.92,
16.33)
3.83 (1.18,
12.41)
4.42 (1.50,
10.25)
1.94 (0.40, 9.35) 2.50 (0.67, 6.08) 1.20 (0.26, 5.52) 1.33 (0.25, 4.25)
Adm. to 10 cm 7.24 (2.17,
24.18)
8.25 (3.50,
17.25)
4.71 (1.71,
13.02)
5.33 (2.08,
11.33)
3.07 (0.87,
10.83)
3.33 (1.17, 7.25) 2.39 (0.77, 7.42) 2.25 (0.67, 5.50)
Data presented as median hours (5th, 95th percentiles).
Abbreviation: Adm., Admission
https://doi.org/10.1371/journal.pmed.1002492.t003
Progression of the first stage of labour
PLOS Medicine | https://doi.org/10.1371/journal.pmed.1002492 January 16, 2018 13 / 30

percentiles. The rapid progression of cervical dilatation in advanced labour as shown by the
sojourn times (in Table 2) is also expressed by the progressively shorter cumulative duration of
labour as cervical dilatation on admission increased from 4 to 6 cm. The median rates of ‘linear
dilatation’ increased from 1 cm/hour for nulliparous women admitted at 4 cm to 1.3 cm/hour
for those admitted at 6 cm. While the median times for nulliparous women admitted at 4, 5,
and 6 cm to achieve full dilatation were within the same time frame for dilatation progressing
at�1 cm/hour, their 95th percentiles show that it was not uncommon to have labours lasting
up to 14, 11, and 9 hours in the same categories of women, respectively. The observed cumula-
tive duration of labour in women arriving in labour before 4 cm shows that some of these
Fig 3. The 95th percentiles of cumulative duration of labour among nulliparous women. (A) Survival analysis. (B) Multistate
Markov analysis.
https://doi.org/10.1371/journal.pmed.1002492.g003
Progression of the first stage of labour
PLOS Medicine | https://doi.org/10.1371/journal.pmed.1002492 January 16, 2018 14 / 30
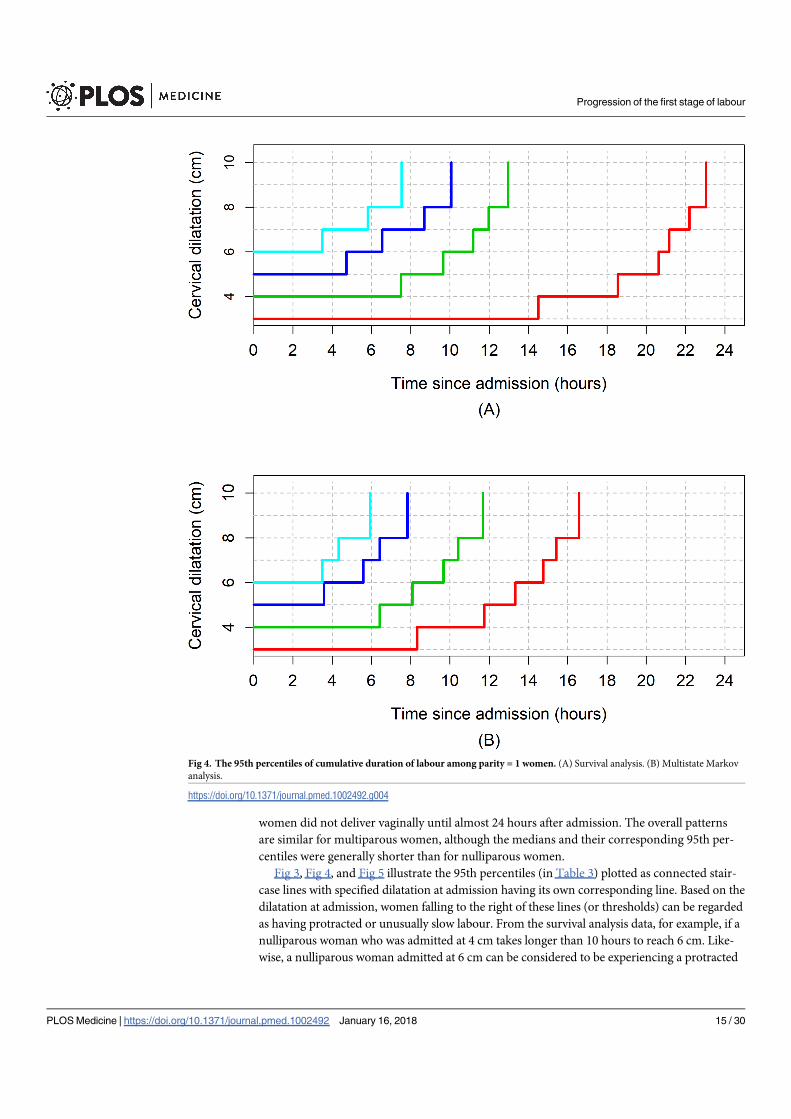
women did not deliver vaginally until almost 24 hours after admission. The overall patterns
are similar for multiparous women, although the medians and their corresponding 95th per-
centiles were generally shorter than for nulliparous women.
Fig 3, Fig 4, and Fig 5 illustrate the 95th percentiles (in Table 3) plotted as connected stair-
case lines with specified dilatation at admission having its own corresponding line. Based on the
dilatation at admission, women falling to the right of these lines (or thresholds) can be regarded
as having protracted or unusually slow labour. From the survival analysis data, for example, if a
nulliparous woman who was admitted at 4 cm takes longer than 10 hours to reach 6 cm. Like-
wise, a nulliparous woman admitted at 6 cm can be considered to be experiencing a protracted
Fig 4. The 95th percentiles of cumulative duration of labour among parity = 1 women. (A) Survival analysis. (B) Multistate Markov
analysis.
https://doi.org/10.1371/journal.pmed.1002492.g004
Progression of the first stage of labour
PLOS Medicine | https://doi.org/10.1371/journal.pmed.1002492 January 16, 2018 15 / 30

labour if she takes longer than 7 hours to reach 8 cm or longer than 9 hours to reach 10 cm. The
patterns of cumulative labour duration are similar for all parity groups until 6 cm, when the
staircase lines become steeper for multiparous compared to nulliparous women.
Labour progression patterns (excluding women with oxytocin
augmentation)
Table 4, Table 5, and Table 6 show the results of the sensitivity analyses of labour progression
based on our two analytical approaches. As shown in Table 4, the median, 5th, and 95th per-
centile times to advance by 1 cm were generally shorter when women who had oxytocin were
Fig 5. The 95th percentiles of cumulative duration of labour among parity = 2+ women. (A) Survival analysis. (B) Multistate Markov
analysis.
https://doi.org/10.1371/journal.pmed.1002492.g005
Progression of the first stage of labour
PLOS Medicine | https://doi.org/10.1371/journal.pmed.1002492 January 16, 2018 16 / 30

excluded from the study population. The differences between the median times were generally
small, less than half an hour in nearly all cases, and mostly confined to the early part of labour
(i.e., between 3 and 5 cm). For nulliparous women, the differences in median times ranged
from 5 to 22 minutes, while for parity = 1 and parity = 2+ women, it ranged from 1 to 33 min-
utes and from less than 1 minute to 27 minutes, respectively. The differences in median times
centimetre by centimetre became insignificant as labour advanced.
Table 5 and Table 6 show the cumulative duration of labour from the cervical dilatation
observed at admission to the next centimetre until 10 cm, excluding women who had oxytocin
augmentation. The slightly faster progression of cervical dilatation in the absence of oxytocin
augmentation as shown by the sojourn times (in Table 4) is also expressed by the shorter
median cumulative duration of labour in all scenarios. For example, considering the cumula-
tive duration of labour for 3 to 10 cm, 4 to 10 cm, 5 to 10 cm, and 6 to 10 cm, the differences in
median times were all less than 1 hour regardless of the analysis method used, and the faster
Table 4. Duration of labour from one level of cervical dilatation to the next with and without augmented labours.
Parity = 0
All women All women w/o oxytocin Difference in
median times
All women All women w/o oxytocin Difference in median times
N 2,100 1,300 2,166 1,300
Cervical dilatation Survival analysis† Survival analysis† Markov model Markov model
3–4 cm 2.82 (0.60, 13.33) 2.47 (0.47, 13.14) 0.35 1.83 (0.08, 8.17) 1.75 (0.08, 7.67) 0.08
4–5 cm 1.72 (0.38, 7.83) 1.35 (0.24, 7.57) 0.37 1.58 (0.08, 7.08) 1.67 (0.08, 7.25) −0.09
5–6 cm 1.19 (0.23, 6.17) 1.01 (0.19, 5.38) 0.18 0.83 (0.00, 3.83) 0.75 (0.00, 3.42) 0.08
6–7 cm 0.66 (0.09, 4.92) 0.46 (0.05, 4.12) 0.20 0.92 (0.00, 4.25) 0.92 (0.00, 4.00) 0.00
7–8 cm 0.25 (0.02, 3.10) 0.16 (0.01, 2.84) 0.09 0.58 (0.00, 2.50) 0.58 (0.00, 2.50) 0.00
8–10 cm 0.87 (0.18, 4.19) 0.76 (0.14; 4.20) 0.11 0.75 (0.00, 3.33) 0.75 (0.00, 3.50) 0.00
Parity = 1
N 1,488 1,044 1,488 1,044
Cervical dilatation Survival analysis† Survival analysis† Markov model Markov model
3–4 cm 2.42 (0.41, 14.18) 2.39 (0.50, 11.49) 0.03 1.92 (0.08, 8.33) 1.83 (0.08, 7.92) 0.09
4–5 cm 1.37 (0.25, 7.65) 0.82 (0.11, 6.38) 0.55 1.42 (0.08, 6.42) 1.17 (0.08, 5.33) 0.25
5–6 cm 0.79 (0.13, 4.95) 0.64 (0.10, 4.17) 0.15 0.83 (0.00, 3.58) 0.75 (0.00, 3.17) 0.08
6–7 cm 0.33 (0.03, 3.67) 0.30 (0.03, 3.15) 0.03 0.75 (0.00, 3.50) 0.75 (0.00, 3.42) 0.00
7–8 cm 0.09 (0.00, 2.69) 0.05 (0.00, 2.48) 0.04 0.42 (0.00, 1.83) 0.33 (0.00, 1.75) 0.09
8–10 cm 0.64 (0.11, 3.56) 0.62 (0.12, 3.23) 0.02 0.67 (0.00, 2.92) 0.58 (0.00, 2.58) 0.09
Parity = 2+
N 1,952 1,430 1,952 1,430
Cervical dilatation Survival analysis† Survival analysis† Markov model Markov model
3–4 cm 2.35 (0.31, 17.85) 1.90 (0.27, 13.50) 0.45 2.17 (0.08, 9.75) 1.75 (0.08, 7.58) 0.42
4–5 cm 1.18 (0.17, 8.05) 0.83 (0.11, 6.54) 0.35 1.50 (0.08, 6.50) 1.33 (0.08, 5.83) 0.17
5–6 cm 0.79 (0.10, 6.24) 0.61 (0.07, 5.51) 0.18 0.75 (0.00, 3.33) 0.67 (0.00, 2.92) 0.08
6–7 cm 0.31 (0.03, 3.29) 0.25 (0.02, 2.71) 0.06 0.83 (0.00, 3.58) 0.75 (0.00, 3.50) 0.08
7–8 cm 0.17 (0.01, 2.44) 0.16 (0.01, 2.52) 0.01 0.33 (0.00, 1.50) 0.33 (0.00, 1.58) 0.00
8–10 cm 0.68 (0.12, 3.77) 0.69 (0.12, 4.15) −0.01 0.50 (0.00, 2.50) 0.50 (0.00, 2.42) 0.00
Data presented as median hours (5th, 95th percentiles).
† Survival analysis with complete and interval-censored values
Abbreviation: w/o, without.
https://doi.org/10.1371/journal.pmed.1002492.t004
Progression of the first stage of labour
PLOS Medicine | https://doi.org/10.1371/journal.pmed.1002492 January 16, 2018 17 / 30

Table 5. Cumulative duration of labour in Para 0, 1, and 2+ based on the cervical dilatation at admission by use of oxytocin augmentation (survival analysis).
Parity = 0
All women w/o oxytocin All women w/o oxytocin All women w/o oxytocin All women w/o oxytocin
Cervical
dilatation at:
Adm. at 3 cm
(N = 249)
Adm. at 3 cm
(N = 158)
Adm. at 4 cm
(N = 715)
Adm. at 4 cm
(N = 384)
Adm. at 5 cm
(N = 316)
Adm. at 5 cm
(N = 191)
Adm. at 6 cm
(N = 322)
Adm. at 6 cm
(N = 201)
Adm. to 3 cm
Adm. to 4 cm 2.76 (0.58,
13.10)
2.54 (0.48,
13.54)
Adm. to 5 cm 4.49 (1.17,
17.17)
4.07 (0.90,
18.38)
1.71 (0.37, 7.96) 1.32 (0.25, 7.14)
Adm. to 6 cm 5.65 (1.65,
19.40)
5.27 (1.36,
20.46)
3.02 (0.86,
10.60)
2.58 (0.66,
10.07)
1.29 (0.28, 6.05) 0.86 (0.15, 4.98)
Adm. to 7 cm 6.50 (1.99,
21.26)
6.09 (1.67,
22.22)
4.15 (1.41,
12.19)
3.65 (1.11,
11.97)
2.10 (0.51, 8.66) 1.74 (0.40, 7.56) 0.78 (0.11, 5.46) 0.51 (0.06, 4.42)
Adm. to 8 cm 7.19 (2.34,
22.14)
6.81 (2.03,
22.88)
4.97 (1.87,
13.24)
4.51 (1.55,
13.15)
3.06 (0.93,
10.14)
2.69 (0.76, 9.47) 1.76 (0.42, 7.44) 1.46 (0.31, 6.81)
Adm. to 10 cm 8.37 (2.98,
23.51)
7.98 (2.61,
24.42)
5.92 (2.42,
14.48)
5.42 (2.06,
14.25)
4.30 (1.64,
11.30)
4.00 (1.46, 10.97) 2.86 (0.88, 9.30) 2.56 (0.75, 8.75)
Parity = 1
Cervical
dilatation at:
Adm. at 3 cm
(N = 164)
Adm. at 3 cm
(N = 123)
Adm. at 4 cm
(N = 491)
Adm. at 4 cm
(N = 304)
Adm. at 5 cm
(N = 292)
Adm. at 5 cm
(N = 211)
Adm. at 6 cm
(N = 320)
Adm. at 6 cm
(N = 256)
Adm. to 3 cm
Adm. to 4 cm 2.05 (0.29,
14.50)
1.98 (0.35,
11.15)
Adm. to 5 cm 3.43 (0.63,
18.55)
3.24 (0.79 13.34) 1.34 (0.24, 7.51) 0.82 (0.11, 6.25)
Adm. to 6 cm 4.77 (1.10,
20.63)
4.50 (1.32,
15.35)
2.31 (0.55, 9.66) 1.79 (0.35, 9.19) 0.80 (0.14, 4.72) 0.66 (0.11, 4.03)
Adm. to 7 cm 5.91 (1.65,
21.17)
5.41 (1.78,
16.46)
2.99 (0.80,
11.18)
2.54 (0.60,
10.84)
1.47 (0.33, 6.54) 1.15 (0.23, 5.73) 0.43 (0.05, 3.50) 0.36 (0.05, 2.68)
Adm. to 8 cm 6.61 (1.97,
22.20)
6.05 (2.08,
17.61)
3.78 (1.19,
11.97)
3.3 (0.95, 11.51) 2.31 (0.61, 8.69) 1.98 (0.49, 8.04) 1.13 (0.22, 5.81) 0.96 (0.19, 4.93)
Adm. to 10 cm 7.55 (2.48,
23.05)
6.92 (2.53,
18.91)
4.63 (1.66,
12.96)
4.08 (1.36,
12.28)
3.43 (1.17,
10.06)
3.17 (1.04, 9.70) 2.19 (0.64, 7.53) 2.03 (0.60, 6.84)
Parity = 2+
Cervical
dilatation at:
Adm. at 3 cm Adm. at 3 cm Adm. at 4 cm Adm. at 4 cm Adm. at 5 cm Adm. at 5 cm Adm. at 6 cm Adm. at 6 cm
(N = 231) (N = 163) (N = 626) (N = 446) (N = 385) (N = 283) (N = 414) (N = 333)
Adm. to 3 cm
Adm. to 4 cm 2.19 (0.29,
16.32)
1.84 (0.27,
12.76)
Adm. to 5 cm 3.54 (0.61,
20.75)
2.97 (0.52,
16.87)
1.25 (0.19, 8.14) 0.91 (0.12, 6.84)
Adm. to 6 cm 4.82 (1.04,
22.38)
4.09 (0.89,
18.89)
2.24 (0.48,
10.48)
1.85 (0.37, 9.33) 0.76 (0.10, 5.80) 0.54 (0.06, 5.28)
Adm. to 7 cm 5.55 (1.34,
22.96)
4.82 (1.18,
19.74)
3.08 (0.82,
11.52)
2.66 (0.66,
10.64)
1.34 (0.24, 7.46) 1.10 (0.17, 7.17) 0.52 (0.07, 3.65) 0.44 (0.06, 3.06)
Adm. to 8 cm 6.17 (1.63,
23.31)
5.46 (1.51,
19.82)
3.83 (1.18,
12.41)
3.46 (1.01,
11.82)
1.94 (0.40, 9.35) 1.67 (0.30, 9.18) 1.20 (0.26, 5.52) 1.06 (0.23, 4.87)
Adm. to 10 cm 7.24 (2.17,
24.18)
6.53 (2.03,
21.01)
4.71 (1.71,
13.02)
4.38 (1.54,
12.41)
3.07 (0.87,
10.83)
2.83 (0.73,10.93) 2.39 (0.77, 7.42) 2.24 (0.71, 7.11)
Data presented as median hours (5th, 95th percentiles).
Abbreviation: Adm., Admission
https://doi.org/10.1371/journal.pmed.1002492.t005
Progression of the first stage of labour
PLOS Medicine | https://doi.org/10.1371/journal.pmed.1002492 January 16, 2018 18 / 30

Table 6. Cumulative duration of labour in Para 0, 1, and 2+ based on the cervical dilatation at admission by use of oxytocin augmentation (Markov analysis).
Parity = 0
All women w/o oxytocin All women w/o oxytocin All women w/o oxytocin All women w/o oxytocin
Cervical
dilatation at:
Adm. at 3 cm
(N = 249)
Adm. at 3 cm
(N = 158)
Adm. at 4 cm
(N = 715)
Adm. at 4 cm
(N = 384)
Adm. at 5 cm
(N = 316)
Adm. at 5 cm
(N = 191)
Adm. at 6 cm
(N = 322)
Adm. at 6 cm
(N = 201)
Adm. to 3 cm
Adm. to 4 cm 1.83 (0.08, 8.17) 1.75 (0.08, 7.67)
Adm. to 5 cm 4.25 (0.83,
12.08)
4.17 (0.83,
11.75)
1.58 (0.08, 7.08) 1.67 (0.08, 7.25)
Adm. to 6 cm 5.58 (1.67,
13.67)
5.33 (1.58,
13.17)
2.92 (0.58, 8.92) 2.83 (0.58, 8.83) 0.83 (0.00, 3.83) 0.75 (0.00, 3.42)
Adm. to 7 cm 7.08 (2.50,
15.50)
6.75 (2.42,
15.00)
4.42 (1.33,
10.83)
4.25 (1.25,
10.67)
2.25(0.42, 6.42) 2.08 (0.42, 5.92) 0.92 (0.00, 4.25) 0.92 (0.00, 4.00)
Adm. to 8 cm 7.92 (3.17,
16.58)
7.58 (3.08,
15.83)
5.33 (1.92,
12.00)
5.17 (1.83,
11.67)
3.08 (0.92, 7.50) 2.92 (0.83, 7.08) 1.83 (0.33, 5.5) 1.75 (0.33, 5.25)
Adm. to 10 cm 9.08 (4.00,
17.83)
8.93 (3.92,
17.33)
6.50 (2.67,
13.25)
6.33 (2.58,
13.17)
4.25 (1.58, 9.17) 4.08 (1.50, 8.75) 3.00 (0.92, 7.25) 2.92 (0.83, 7.08)
Parity = 1
Cervical
dilatation at:
Adm. at 3 cm
(N = 164)
Adm. at 3 cm
(N = 123)
Adm. at 4 cm
(N = 491)
Adm. at 4 cm
(N = 304)
Adm. at 5 cm
(N = 292)
Adm. at 5 cm
(N = 211)
Adm. at 6 cm
(N = 320)
Adm. at 6 cm
(N = 256)
Adm. to 3 cm
Adm. to 4 cm 1.92 (0.08, 8.33) 1.83 (0.08, 7.92)
Adm. to 5 cm 4.08 (0.83,
11.75)
3.67 (0.75,
10.58)
1.42 (0.08, 6.42) 1.17 (0.08, 5.33)
Adm. to 6 cm 5.42 (1.58,
13.33)
4.75 (1.42,
11.92)
2.75 (0.5, 8.08) 2.33 (0.42, 6.92) 0.83 (0.00, 3.58) 0.75 (0.00, 3.17)
Adm. to 7 cm 6.58 (2.33,
14.75)
6.00 (2.17,
13.33)
3.92 (1.17, 9.67) 3.50 (1.00, 8.50) 1.92 (0.42, 5.58) 1.83 (0.33, 5.33) 0.75 (0.00, 3.50) 0.75 (0.00, 3.42)
Adm. to 8 cm 7.25 (2.83,
15.42)
6.58 (2.58,
14.08)
4.58 (1.58,
10.42)
4.08 (1.42, 9.25) 2.58 (0.75, 6.42) 2.42 (0.67, 6.00) 1.42(0.25, 4.33) 1.42 (0.25, 4.25)
Adm. to 10 cm 8.25 (3.58,
16.58)
7.50 (3.25,
15.17)
5.58 (2.25,
11.67)
5.00 (2.00,
10.33)
3.58 (1.25, 7.83) 3.33 (1.17, 7.33) 2.42 (0.67, 5.92) 2.25 (0.67, 5.67)
Parity = 2+
Cervical
dilatation at:
Adm. at 3 cm Adm. at 3 cm Adm. at 4 cm Adm. at 4 cm Adm. at 5 cm Adm. at 5 cm Adm. at 6 cm Adm. at 6 cm
(N = 231) (N = 163) (N = 626) (N = 446) (N = 385) (N = 283) (N = 414) (N = 333)
Adm. to 3 cm
Adm. to 4 cm 2.17 (0.08, 9.75) 1.75 (0.08, 7.58)
Adm. to 5 cm 4.42 (0.92,
12.92)
3.75 (0.75,
10.67)
1.50 (0.08, 6.50) 1.33 (0.08, 5.83)
Adm. to 6 cm 5.58 (1.67,
14.25)
4.75 (1.33,
11.92)
2.67 (0.50, 8.00) 2.33 (0.42, 7.17) 0.75 (0.00, 3.33) 0.67 (0.00, 2.92)
Adm. to 7 cm 6.92 (2.42,
15.75)
5.92 (2.08,
13.42)
3.92 (1.17, 9.75) 3.58 (1.08, 8.92) 1.92 (0.33, 5.50) 1.75 (0.33, 5.17) 0.83 (0.00, 3.58) 0.75 (0.00, 3.50)
Adm. to 8 cm 7.42 (2.92,
16.33)
6.50 (2.58,
14.00)
4.42 (1.50,
10.25)
4.08 (1.42, 9.50) 2.50 (0.67, 6.08) 2.33 (0.67, 5.83) 1.33 (0.25, 4.25) 1.33 (0.25, 4.25)
Adm. to 10 cm 8.25 (3.50,
17.25)
7.33 (3.17,
14.92)
5.33 (2.08,
11.33)
4.92 (2.00,
10.50)
3.33 (1.17, 7.25) 3.17 (1.17, 6.92) 2.25 (0.67, 5.50) 2.17 (0.67, 5.42)
Data presented as median hours (5th, 95th percentiles).
Abbreviation: Adm., Admission
https://doi.org/10.1371/journal.pmed.1002492.t006
Progression of the first stage of labour
PLOS Medicine | https://doi.org/10.1371/journal.pmed.1002492 January 16, 2018 19 / 30

progressions were more obvious in women arriving early in labour (i.e., at 3 and 4 cm cervical
dilatation).
Fig 6 shows the average labour curves by parity groups after excluding women with oxyto-
cin augmentation. Excluding women who received oxytocin augmentation did not lead to any
major change in the pattern or the trajectories of the curves for any parity group. However, the
small difference in the labour curves of multiparous groups (as shown in Fig 2) disappeared
when women who received oxytocin augmentation were excluded from the analysis. Fig 7, Fig
8, and Fig 9 illustrate the changes in the 95th percentiles (in Table 5 and Table 6) plotted as
connected staircase lines for women who received oxytocin augmentation compared to all
women. The shorter cumulative labour duration is also reflected in the 95th percentiles for all
parity groups regardless of the dilatation at admission, except for nulliparous women admitted
at 3 cm, which showed more variability.
Discussion
Main findings
Understanding the natural progression of labour presents unique challenges in current obstetric
practice. Nevertheless, a gradual shift towards approaches to reduce labour interventions deserves
evidence-based information on the upper limits of normal labour to guide practice, especially
now that modern analytical methods are available. Contrary to the generally held view, our study
shows that in this obstetric population, labour appears to progress more slowly than previously
reported [1–3, 27, 28]. The median time needed for the cervix to dilate by 1 cm exceeded 1 hour
until dilatation was at least 5 cm in both nulliparous and multiparous women. Labour tended to
progress more slowly in the early part of traditional active phase and more rapidly after 6 cm.
Considerable variability exists in the distribution of times needed to advance by 1 cm and the
Fig 6. Average labour curves by parity after excluding women with augmented labours. P0, nulliparous women; P1,
parity = 1 women; P2+, parity = 2+ women.
https://doi.org/10.1371/journal.pmed.1002492.g006
Progression of the first stage of labour
PLOS Medicine | https://doi.org/10.1371/journal.pmed.1002492 January 16, 2018 20 / 30

duration of labour among women who gave birth vaginally without adverse birth outcomes. For
instance, based on 95th percentile thresholds, some nulliparous women took more than 7 hours
to advance from 4 to 5 cm, and more than 3 hours to advance from 5 to 6 cm. This pattern of pro-
gression was observed irrespective of the analysis method we applied.
While the cumulative duration of labour indicates that a substantial proportion of nullipa-
rous women admitted in labour at 4, 5, and 6 cm achieved full dilatation within an expected
time frame if the dilatation rate was� 1 cm/hour, their 95th percentiles show that labour in
these women could last up to 14, 11, and 9 hours, respectively, and still lead to a vaginal birth
without untoward effects on the mother and baby. Labour could be considerably slow to
Fig 7. The 95th percentiles of cumulative duration of labour in nulliparous women by augmentation. (A) Survival analysis. (B)
Multistate Markov analysis. Thin lines: all women. Thick lines: women with oxytocin augmentation excluded.
https://doi.org/10.1371/journal.pmed.1002492.g007
Progression of the first stage of labour
PLOS Medicine | https://doi.org/10.1371/journal.pmed.1002492 January 16, 2018 21 / 30
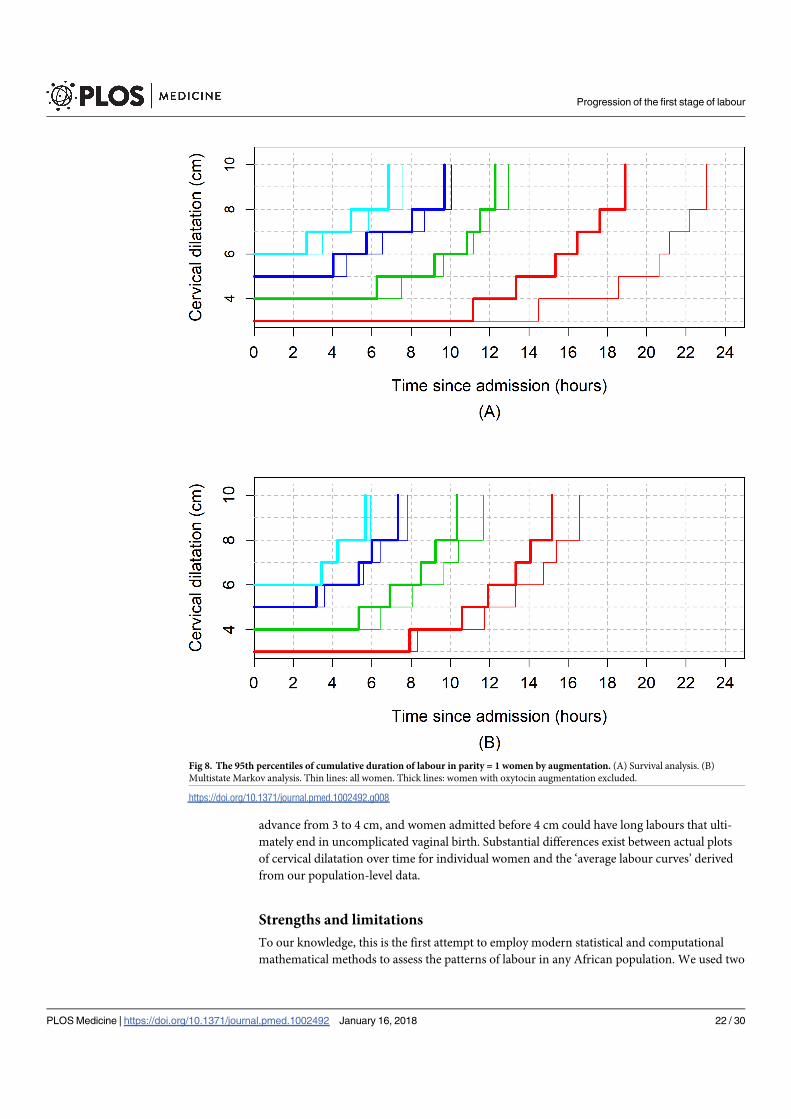
advance from 3 to 4 cm, and women admitted before 4 cm could have long labours that ulti-
mately end in uncomplicated vaginal birth. Substantial differences exist between actual plots
of cervical dilatation over time for individual women and the ‘average labour curves’ derived
from our population-level data.
Strengths and limitations
To our knowledge, this is the first attempt to employ modern statistical and computational
mathematical methods to assess the patterns of labour in any African population. We used two
Fig 8. The 95th percentiles of cumulative duration of labour in parity = 1 women by augmentation. (A) Survival analysis. (B)
Multistate Markov analysis. Thin lines: all women. Thick lines: women with oxytocin augmentation excluded.
https://doi.org/10.1371/journal.pmed.1002492.g008
Progression of the first stage of labour
PLOS Medicine | https://doi.org/10.1371/journal.pmed.1002492 January 16, 2018 22 / 30

analytical approaches to determine labour progression and construct labour curves from the
same sample in an attempt to explore whether the resulting patterns are independent of analy-
sis methods. We applied these methods to a relatively large and prospectively collected data set
from two sub-Saharan African countries comprising multiethnic groups. However, two main
limitations need to be highlighted.
First, our study is prone to selection bias that is inherent in the designs of studies of labour
patterns in current obstetric practice [17]. Women excluded from our analysis due to cesarean
section during the first or second stage of labour may have a different pattern of labour pro-
gression compared with women who had vaginal births. Our perception is that this will not
Fig 9. The 95th percentiles of cumulative duration of labour in parity = 2+ women by augmentation. (A) Survival analysis. (B)
Multistate Markov analysis. Thin lines: all women. Thick lines: women with oxytocin augmentation excluded.
https://doi.org/10.1371/journal.pmed.1002492.g009
Progression of the first stage of labour
PLOS Medicine | https://doi.org/10.1371/journal.pmed.1002492 January 16, 2018 23 / 30

impact our study findings, not only because such women constituted 12% of women in whom
vertex delivery was anticipated, but also because the inclusion of women who had cesarean sec-
tions as a result of labour dystocia during the first stage or failed operative vaginal birth during
the second stage could have biased our results towards even longer labours. Additionally, con-
struction of our labour curves was dependent on using 10 cm as the starting point through a
reverse approach, and therefore, it was essential that all women in our study sample reached
full dilatation. Nevertheless, the exclusion of women whose labours were induced and those
with nonvertex presentation implies that our findings may not be applicable to these women.
Our findings also need to be interpreted within the context of non- or low use of epidural
anaesthesia and instrumental vaginal birth. As these interventions tend to be associated with
slower labours, it is reasonable to assume that their low rates in this population would have
biased the current findings towards shorter rather than longer labour duration.
Second is the measurement bias that could have been introduced due to inherent subjectivity
in cervical dilatation assessments and a lack of standardization of frequency of pelvic examina-
tions across participating hospitals. Additionally, clinical assessments of cervical dilatation can
only be estimates that are rounded up to the nearest centimetre. Given the total number of
women analysed for each parity group, any bias from intra- and inter-observer variations is likely
to be random with potential impact on the data spread but with minimal effects on the point esti-
mates. However, it is possible that the accuracy of our estimations could have been affected by
smaller sample sizes in the subgroups that were used to explore various obstetric characteristics.
For example, fewer women in our analysed sample presented to the labour ward at 3 cm or less
compared to 4 cm and above in all parity groups. While this reflects the prevailing practices in
the study hospitals and most maternity units around the world, it is possible that smaller num-
bers of women did not permit an equally robust analysis of the passive phase of labour and could
have contributed to even wider variability in cervical dilatation profiles during this stage.
Interpretation
Our findings provide new data from the perspective of a sub-Saharan African population to sup-
port the observations reported in similar studies by Zhang [12–14], Suzuki [16], Shi [15], and their
colleagues, which suggest that labour progresses more slowly than previously thought. Similar to
these studies, our study reveals that the variability of labour progress in a cohort of nulliparous
and multiparous women with vaginal birth is greater than generally appreciated. This variability is
apparent even in an obstetric population as selected as ours and is independent of our analysis
methods, centimetre of cervical dilatation, or cervical dilatation of the woman at admission.
Despite the general similarities in the nulliparous labour progression pattern between our
study and those by Zhang [14], Suzuki [16], and Shi [15] et al., there are important differences
in the 95th percentiles reported for sojourn times and cumulative durations of labour. Our
95th percentile times indicate that labour can even be slower than what was reported by Zhang
[14] and Shi et al. [15], in their American and Chinese populations, respectively, but not as
long as Suzuki et al. [16] reported for Japanese women. While this may be due to the differ-
ences in the methods for analysing labour progression, a more logical explanation is the het-
erogeneity in these study populations in terms of labour interventions and demographic
characteristics. For instance, oxytocin augmentation among nulliparous women was more
common in the US population (47%) studied by Zhang et al. [14] and our study population
(40%), but infrequent (6.5%) in the Japanese population studied by Suzuki et al. [16].
The described patterns of labour progress from our study deviate substantially from what
Friedman’s curve indicates [1–3]. The classic sigmoidal pattern was not observed in our aver-
age labour curves. This may be due to the fact that the majority of the women in our study
Progression of the first stage of labour
PLOS Medicine | https://doi.org/10.1371/journal.pmed.1002492 January 16, 2018 24 / 30

were not admitted early enough in labour to substantially reflect the pattern of the passive
phase of labour and because of the lack of documented assessment of 9-cm dilatation in our
cohort, which precluded exploration of any deceleration between 9 and 10 cm. In his series of
500 nulliparous women [2], Friedman used the mean values of the four separate phases of indi-
vidually plotted sigmoid curves to derive the mean labour curve and reported 1.2 cm/hour as
the minimum value of ‘phase of maximum slope’ based on the 95th percentile point on the dis-
tribution curve. The nulliparous average curves from our cohort are less steep, and the 95th
percentile values from one level of dilatation to the next during the traditional active phase
yielded median rates between 0.1 and 0.5 cm/hour between 4 and 10 cm. It remains unclear to
what extent an average labour curve depicts the variability associated with individual women’s
labour progress, and its value in clinical practice is becoming increasingly questioned. The dif-
ferences illustrated by the video displays of individual labour profiles, compared to the average
labour curves for this cohort, indicate how unreliable a population average curve is in repre-
senting an individual woman’s labour progression profile.
In an attempt to overcome the shortcomings of Friedman’s labour curves, Zhang et al. [12]
proposed the use of repeated measures analysis with polynomial modelling as a superior
method for constructing labour curves, given its flexibility to fit labour data. Other investiga-
tors using the same statistical method have confirmed a similar pattern of labour curves
published by Zhang et al [12–14]. However, we found that the polynomial model was not
appropriate for our data, as it presents a behaviour that is incompatible with labour curve
modelling. Rather, we applied multistate Markov modelling to overcome the unpredictable
nature of cervical dilatation [29], since its models can accommodate the inherent randomness
in cervical dilatation over time [30] and it has the advantage of providing a better representa-
tion of real life scenarios from more angles by including empirical observations. We also
applied a nonlinear mixed model because of its advantages in terms of interpretability, parsi-
mony, and validity [31]. Although the curves obtained from our nonlinear mixed models are
similar to those constructed through polynomial models by previous authors [12, 14, 15], they
should be interpreted with caution, as the model appears dependent on extrapolation beyond
the normal range of observations for women in the sample.
An interesting finding in our study is the median cumulative duration of labour (e.g., from 4
to 10, 5 to 10, and 6 to 10 cm), which, when considered linearly, suggests that the cervix was
dilating at� 1 cm/hour. However, such interpretation hides the nonlinearity of labour progres-
sion patterns for most women and does not account for slower progress at the beginning of the
traditional active phase and faster progress when active phase is advanced. This implies that
some women within the 95th percentile boundary as shown in our study will be categorised as
having protracted labour if current labour standards were applied. For instance, a woman with
reassuring maternal and fetal conditions who remains at 4 cm for 4 hours may be subjected to
oxytocin augmentation when she could still be within her normal limits before advancing to 5
cm. Application of interventions too soon when a woman is still within the boundaries of her
normality probably accounts for escalating rates of interventions to expedite labour globally.
One subject of debate in the analysis of labour progression patterns in contemporary prac-
tice is the potential impact of oxytocin augmentation on observed labour patterns. A widely
held view is that the inclusion of women with augmented labour is likely to produce faster
labour progression profiles, and the restriction of analysis to women without labour augmen-
tation will generate labour profiles that reflect natural labour progression. However, we found
the contrary, as the exclusion of women with augmented labours from our study population
resulted in generally faster labour progression patterns. Although unexpected, this finding was
not surprising, as it reflects the impact of Friedman’s original curves and their derivative tools
on labour management even today. Women with augmented labours were those assessed by
Progression of the first stage of labour
PLOS Medicine | https://doi.org/10.1371/journal.pmed.1002492 January 16, 2018 25 / 30

labour attendants as having slower than normal progression based on a preconceived expec-
tation of 1 cm/hour cervical dilatation. Therefore, their exclusion from the analysed study
population leaves a highly selected population of women whose labour progression, by the
assessment of the labour attendants, conformed to this preconceived expectation and did not
require labour augmentation. While the overall clinical implications of the altered progression
in terms of labour duration are minimal, our findings support the inclusion of women with
augmented labours in the analysis of labour progression in the context where use of oxytocin
is the norm so as to facilitate applicability of their findings.
Conclusions and recommendations
We acknowledge that the described labour patterns from this cohort may be related to the
demographic characteristics and prevailing clinical practices in our study settings. Neverthe-
less, a number of clear messages emerged from our study. First, population average labour
curves are at best estimates that may not truly reflect the variability associated with labour
progress and could potentially misclassify individual women. It appears that average labour
curves are dependent on the underlying assumptions and principles governing the statistical
methods from which they are derived. We conclude that population average labour curves are
merely useful for illustrative purposes.
Secondly, our labour progression data clearly demonstrate that a minimum cervical dilata-
tion rate of 1 cm/hour throughout the period traditionally described as active phase may be
unrealistically fast for some women and should therefore not be universally applied as a
threshold for identifying abnormally progressing labour. Likewise, for most nulliparous and
multiparous women, labour may not accelerate until a threshold of at least 5 cm is reached.
The implication is that a cervical dilatation rate slower than 1 cm/hour throughout the first
stage of labour, especially before 5 cm, should not be an indication for interventions to expe-
dite labour provided maternal and fetal vital signs and other observations are normal. It would
be useful for labour care providers to consider the upper boundaries reported in this cohort
when reviewing whether an intervention is justified. It is important to note, however, that the
presented percentile values are insufficient to define abnormal labour that requires interven-
tions to avert adverse outcomes. As this is a selected sample of women without adverse birth
outcomes, we cannot conclude from the current analysis whether women with cervical dilata-
tion progressing beyond our percentile values (or other specific boundaries) have compara-
tively higher risk of adverse birth outcomes. As cervical dilatation is a reflection of a complex
interaction of biological, physical, and psychological factors during the course of labour, it is
imperative that women with a suspicion of protracted labour be carefully evaluated to exclude
developing complications (e.g., cephalopelvic disproportion) and to ensure that the woman’s
physical and emotional needs are being met. In the absence of any problems other than a
slower than expected cervical dilatation (i.e., 1 cm/hour), it is in the interest of the woman that
expectant, supportive, and woman-centred labour care is continued.
We propose that averaged lines or curves are not used for decision-making in the manage-
ment of labour for individual women. Efforts should focus on developing individualised (or
personalised) labour management algorithms that optimize woman-centred health outcomes.
Decision-analysis models and machine learning technologies that are available today can assist
in achieving this objective.
Supporting information
S1 STROBE Checklist.
(DOC)
Progression of the first stage of labour
PLOS Medicine | https://doi.org/10.1371/journal.pmed.1002492 January 16, 2018 26 / 30

S1 Fig. States and matrix of possible transitions of cervical dilatation. (a) Schematic repre-
sentation of possible states from 2 cm to 10 cm of cervical dilatation until birth (absorbing
state). (b) Matrix representation of all possible transitions between states of cervical dilatation.
(TIF)
S2 Fig. 3D graphical illustration of transition (matrix) model. The temporal evolution of
the distribution representing the theoretical cohort entering labour at 2 cm of cervical dilation.
Example of graphical representation of the transition (matrix) model for a simple case study
where each state (2, 3, 4, 5, 6, 7, 8, 10) is modelled as the possible next cervical dilatation until
the delivery state (D). Simulation was for a period cycle of 1 hour between transitions for the
sake of simplicity.
(TIF)
S3 Fig. Average labour curves by parity based on nonlinear mixed models. P0, nulliparous
women; P1, parity = 1 women; P2+, parity = 2+ women.
(TIFF)
S1 Video. Individual plots of cervical dilatation, average labour curve (from Markov mod-
els), and alert line for nulliparous women.
(MP4)
S2 Video. Individual plots of cervical dilatation, average labour curves (from Markov mod-
els), and alert line for multiparous women.
(MP4)
S3 Video. Individual plots of cervical dilatation, average labour curve (from nonlinear
mixed models), and alert line for nulliparous women.
(MP4)
S4 Video. Individual plots of cervical dilatation, average labour curves (from nonlinear
mixed models), and alert line for multiparous women.
(MP4)
S1 Data. Data set.
(CSV)
S2 Data. Data dictionary.
(XLSX)
Acknowledgments
This manuscript was developed as part of the World Health Organization’s BOLD project. The
BOLD project implementation was a collaborative effort of a large number of academic staff,
hospital personnel, and researchers from thirteen hospitals in Uganda and Nigeria and a tech-
nical advisory group of international experts convened by the World Health Organization. We
acknowledge the contributions of all midwives, doctors, facility administrators, and maternity
unit staff of all hospitals that participated in the project. The authors appreciate the hospital
level coordination provided by Olubunmi Alabi, Sanni Wilfred, and Halima Bello (Nigeria)
and Othiniel Musana, Michael Bukennya, and Salim Bataale (Uganda). Special thanks go to
Oluwatosin Lawal, Nike Adesina, Felicia Fasipe, and Wasswa Damien for managing the data-
base at the country level and to Leonardo Moscovici for his contributions to central data man-
agement. Gleise Kele Bernucci, Jessica Marcelino, Tiago Lara Michelin Sanches, and Lariza
Progression of the first stage of labour
PLOS Medicine | https://doi.org/10.1371/journal.pmed.1002492 January 16, 2018 27 / 30

Laura de Oliveira provided technical support to survival analysis and multistate Markov
modelling, and Francisco Barbosa Junior developed the videos on labour curves for individual
women. We acknowledge the valuable comments provided by G. Justus Hofmeyr on this man-
uscript. We thank Soe Soe Thwin for commenting on the statistical analyses during the revi-
sion of this manuscript.
The technical advisory group and other invited experts who participated in various WHO
BOLD technical consultations between 2014 and 2016 include: Priya Agrawal, Fernando
Althabe, Domingos Alves, Deborah Armbruster, Livia Ciabati, France Donnay, Bukola Fawole,
G. Justus Hofmeyr, Vanora Hundley, Jen Jardine, David Kyaddondo, Jerker Liljestrand, Tina
Lavender, Michelle Mosolgo, Susan Munabi-Babigumira, Simon Lewin, Kidza Mugerwa,
Janna Patterson, Robert Pattinson, Gleici Perdona, Cynthia Pileggi Castro, Kate Ramsey,
Damaris Rodriguez, Harshadkumar C. Sanghvi, Mary Ellen Stanton, Petra ten Hoope-Bender,
Mari Tikkanen, Lanre Olutayo, Melanie Wendland, and Jun Zhang.
The manuscript presents the views of the named authors only.
Author Contributions
Conceptualization: Olufemi T. Oladapo, Joao Paulo Souza, Bukola Fawole, Kidza Mugerwa,
Gleici Perdona, Domingos Alves, France Donnay, Robert Pattinson, Rajiv Bahl, A. Metin
Gulmezoglu.
Data curation: Olufemi T. Oladapo, Joao Paulo Souza, Bukola Fawole, Kidza Mugerwa, Gleici
Perdona, Domingos Alves, Hayala Souza, Rodrigo Reis, Livia Oliveira-Ciabati, Alexandre
Maiorano, Adesina Akintan, Francis E. Alu, Lawal Oyeneyin, Amos Adebayo, Josaphat
Byamugisha, Miriam Nakalembe, Hadiza A. Idris, Ola Okike, A. Metin Gulmezoglu.
Formal analysis: Olufemi T. Oladapo, Joao Paulo Souza, Gleici Perdona, Domingos Alves,
Hayala Souza, Rodrigo Reis, Livia Oliveira-Ciabati, Alexandre Maiorano, A. Metin
Gulmezoglu.
Funding acquisition: Olufemi T. Oladapo, Joao Paulo Souza, Bukola Fawole, Kidza Mugerwa,
Josaphat Byamugisha, Meghan Bohren, Rajiv Bahl, A. Metin Gulmezoglu.
Investigation: Olufemi T. Oladapo, Joao Paulo Souza, Bukola Fawole, Kidza Mugerwa, Gleici
Perdona, Domingos Alves, Adesina Akintan, Francis E. Alu, Lawal Oyeneyin, Amos Ade-
bayo, Josaphat Byamugisha, Miriam Nakalembe, Hadiza A. Idris, Ola Okike, Rajiv Bahl, A.
Metin Gulmezoglu.
Methodology: Olufemi T. Oladapo, Joao Paulo Souza, Bukola Fawole, Kidza Mugerwa, Gleici
Perdona, Domingos Alves, Hayala Souza, Rodrigo Reis, Livia Oliveira-Ciabati, Alexandre
Maiorano, Adesina Akintan, Francis E. Alu, Amos Adebayo, Josaphat Byamugisha, Hadiza
A. Idris, Ola Okike, Fernando Althabe, Vanora Hundley, France Donnay, Robert Pattinson,
Harshadkumar C. Sanghvi, Jen E. Jardine, Ozge Tuncalp, Joshua P. Vogel, Mary Ellen Stan-
ton, Meghan Bohren, Jun Zhang, Tina Lavender, Jerker Liljestrand, Petra ten Hoope-
Bender, Matthews Mathai, Rajiv Bahl, A. Metin Gulmezoglu.
Project administration: Olufemi T. Oladapo, Joao Paulo Souza, Bukola Fawole, Kidza
Mugerwa, Josaphat Byamugisha, A. Metin Gulmezoglu.
Resources: Olufemi T. Oladapo, Joao Paulo Souza, Bukola Fawole, Kidza Mugerwa, Gleici Per-
dona, Domingos Alves, Hayala Souza, Rodrigo Reis, Alexandre Maiorano, Adesina Akin-
tan, Francis E. Alu, Lawal Oyeneyin, Amos Adebayo, Josaphat Byamugisha, Miriam
Nakalembe, Hadiza A. Idris, Ola Okike, A. Metin Gulmezoglu.
Progression of the first stage of labour
PLOS Medicine | https://doi.org/10.1371/journal.pmed.1002492 January 16, 2018 28 / 30
Software: Gleici Perdona, Domingos Alves, Hayala Souza, Rodrigo Reis, Livia Oliveira-Cia-
bati, Alexandre Maiorano.
Supervision: Olufemi T. Oladapo, Joao Paulo Souza, Bukola Fawole, Kidza Mugerwa, Gleici
Perdona, Domingos Alves, Livia Oliveira-Ciabati, Adesina Akintan, Francis E. Alu, Lawal
Oyeneyin, Amos Adebayo, Josaphat Byamugisha, Miriam Nakalembe, Hadiza A. Idris, Ola
Okike, France Donnay, A. Metin Gulmezoglu.
Visualization: Gleici Perdona, Domingos Alves, Hayala Souza, Rodrigo Reis, Livia Oliveira-
Ciabati, Alexandre Maiorano.
Writing – original draft: Olufemi T. Oladapo, Joao Paulo Souza, A. Metin Gulmezoglu.
Writing – review & editing: Olufemi T. Oladapo, Joao Paulo Souza, Bukola Fawole, Kidza
Mugerwa, Gleici Perdona, Domingos Alves, Hayala Souza, Rodrigo Reis, Livia Oliveira-
Ciabati, Alexandre Maiorano, Adesina Akintan, Francis E. Alu, Lawal Oyeneyin, Amos
Adebayo, Josaphat Byamugisha, Miriam Nakalembe, Hadiza A. Idris, Ola Okike, Fernando
Althabe, Vanora Hundley, France Donnay, Robert Pattinson, Harshadkumar C. Sanghvi,
Jen E. Jardine, Ozge Tuncalp, Joshua P. Vogel, Mary Ellen Stanton, Meghan Bohren, Jun
Zhang, Tina Lavender, Jerker Liljestrand, Petra ten Hoope-Bender, Matthews Mathai, Rajiv
Bahl, A. Metin Gulmezoglu.
References
1. Friedman E. The graphic analysis of labor. Am J Obstet Gynecol. 1954; 68(6):1568–75. PMID:
13207246
2. Friedman EA. Primigravid labor; a graphicostatistical analysis. Obstet Gynecol. 1955; 6(6):567–89.
PMID: 13272981
3. Friedman EA. Labor in multiparas; a graphicostatistical analysis. Obstet Gynecol. 1956; 8(6):691–703.
PMID: 13378754
4. Friedman EA, Kroll BH. Computer analysis of labour progression. J Obstet Gynaecol Br Commonw.
1969; 76(12):1075–9. PMID: 5359671
5. Friedman EA, Kroll BH. Computer analysis of labor progression. II. Distribution of data and limits of nor-
mal. T J Reprod Med. 1971; 6(1):20–5.
6. Friedman EA, Kroll BH. Computer analysis of labor progression. 3. Pattern variations by parity. J
Reprod Med. 1971; 6(4):179–83. PMID: 4938465
7. Friedman EA, Kroll BH. Computer analysis of labor progression. IV. Diagnosis of secondary arrest of
dilatation. J Reprod Med. 1971; 7(4):176–8. PMID: 5135913
8. Friedman EA. Evolution of graphic analysis of labor. Am J Obstet Gynecol. 1978; 132(7):824–7. PMID:
717493
9. Friedman EA. The labor curve. Clin Perinatol. 1981; 8(1):15–25. PMID: 7237887
10. O’Driscoll K, Stronge JM. Active management of labor. BMJ. 1973; 3(5880):590.
11. Betran AP, Ye J, Moller AB, Zhang J, Gulmezoglu AM, Torloni MR. The Increasing Trend in Caesarean
Section Rates: Global, Regional and National Estimates: 1990–2014. PLoS ONE. 2016; 11(2):
e0148343. https://doi.org/10.1371/journal.pone.0148343 PMID: 26849801
12. Zhang J, Troendle JF, Yancey MK. Reassessing the labor curve in nulliparous women. Am J Obstet
Gynecol. 2002; 187(4):824–8. PMID: 12388957
13. Zhang J, Troendle J, Mikolajczyk R, Sundaram R, Beaver J, Fraser W. The natural history of the normal
first stage of labor. Obstet Gynecol. 2010; 115(4):705–10. https://doi.org/10.1097/AOG.
0b013e3181d55925 PMID: 20308828
14. Zhang J, Landy HJ, Branch DW, Burkman R, Haberman S, Gregory KD, et al. Contemporary patterns
of spontaneous labor with normal neonatal outcomes. Obstet Gynecol. 2010; 116(6):1281–7. https://
doi.org/10.1097/AOG.0b013e3181fdef6e PMID: 21099592
15. Shi Q, Tan XQ, Liu XR, Tian XB, Qi HB. Labour patterns in Chinese women in Chongqing. BJOG. 2016;
123 Suppl 3:57–63. Epub 2016/09/15. https://doi.org/10.1111/1471-0528.14019 PMID: 27627599
Progression of the first stage of labour
PLOS Medicine | https://doi.org/10.1371/journal.pmed.1002492 January 16, 2018 29 / 30

16. Suzuki R, Horiuchi S, Ohtsu H. Evaluation of the labor curve in nulliparous Japanese women. Am J
Obstet Gynecol. 2010; 203(3):226.e1–6.
17. Vahratian A, Troendle JF, Siega-Riz AM, Zhang J. Methodological challenges in studying labour pro-
gression in contemporary practice. Paediatr Perinat Epidemiol. 2006; 20(1):72–8. https://doi.org/10.
1111/j.1365-3016.2006.00696.x PMID: 16420344
18. American College of Obstetricians and Gynecologists, Society for Maternal-Fetal Medicine, Caughey
AB, Cahill AG, Guise JM, et al. Safe prevention of the primary cesarean delivery. Am J Obstet Gynecol.
2014; 210(3):179–93. https://doi.org/10.1016/j.ajog.2014.01.026 PMID: 24565430
19. Cohen WR, Friedman EA. Perils of the new labor management guidelines. Am J Obstet Gynecol. 2015;
212(4):420–7. https://doi.org/10.1016/j.ajog.2014.09.008 PMID: 25218127
20. Cohen WR, Friedman EA. Misguided guidelines for managing labor. Am J Obstet Gynecol. 2015; 212
(6):753.e1–3.
21. Zhang J, Troendle J, Grantz KL, Reddy UM. Statistical aspects of modeling the labor curve. Am J
Obstet Gynecol. 2015; 212(6):750.e1–4.
22. Greenberg MB, Cheng YW, Hopkins LM, Stotland NE, Bryant AS, Caughey AB. Are there ethnic differ-
ences in the length of labor? Am J Obstet Gynecol. 2006; 195(3):743–8. https://doi.org/10.1016/j.ajog.
2006.06.016 PMID: 16949407
23. Souza JP, Oladapo OT, Bohren MA, Mugerwa K, Fawole B, Moscovici L, et al. The development of a
Simplified, Effective, Labour Monitoring-to-Action (SELMA) tool for Better Outcomes in Labour Difficulty
(BOLD): study protocol. Reprod health. 2015; 12:49. https://doi.org/10.1186/s12978-015-0029-4 PMID:
26006758
24. Harper LM, Caughey AB, Odibo AO, Roehl KA, Zhao Q, Cahill AG. Normal progress of induced labor.
Obstet Gynecol. 2012; 119(6):1113–8. https://doi.org/10.1097/AOG.0b013e318253d7aa PMID:
22569121
25. R Core Team. R: A language and environment for statistical computing. Vienna, Austria: R Foundation
for Statistical Computing; 2013.
26. Jackson CH. Multi-state models for panel data: the msm package for R. J Stat Softw. 2011; 38(8):1–29.
27. Albers LL. The duration of labor in healthy women. J Perinatol. 1999; 19(2):114–9. PMID: 10642971
28. Albers LL, Schiff M, Gorwoda JG. The length of active labor in normal pregnancies. Obstet Gynecol.
1996; 87(3):355–9. PMID: 8598954
29. Pinheiro JC, Bates DM. Mixed-effects models in S and S-PLUS. New York: Springer; 2000.
30. Ferrazzi E, Milani S, Cirillo F, Livio S, Piola C, Brusati V, et al. Progression of cervical dilatation in normal
human labor is unpredictable. Acta Obstet Gynecol Scand. 2015; 94(10):1136–44. https://doi.org/10.
1111/aogs.12719 PMID: 26230291
31. Cox DR, Miller HD. The theory of stochastic processes. Boca Raton, Florida: CRC Press; 1977
Progression of the first stage of labour
PLOS Medicine | https://doi.org/10.1371/journal.pmed.1002492 January 16, 2018 30 / 30

ISBN 978-989-97433-8-0 E-book edition 2017 by SciKa
Book of abstracts of the
CENTERIS 2017 – Conference on Enterprise Information Systems /
ProjMAN 2017 – International Conference on Project MANagement /
HCist 2017 – International Conference on Health and Social Care Information Systems and Technologies
212
Development of a system for antenatal and labour care of
pregnant women in the Brazilian private health system Mariana Marquesa, Lívia Oliveira-Ciabatia, Nathalia Crepaldia, João Paulo
Souzaa, Rui Pedro Charters Lopes Rijob, Domingos Alvesa, Rodrigo Reisa
aDepartment of Social Medicine, Ribeirão Preto Medical School, University of São Paulo, Ribeirão Preto, Brazil bSchool of Technology and Management, Polytechnic Institute of Leiria, Apt. 4163, 2411-901 Leiria, Portugal, phone: +351
244 820 300, fax: +351 244 820 310
INESCC - Institute for Systems and Computers Engineering at Coimbra, Rua Antero de Quental, Nº199, 3000 - 033, Coimbra,
Portugal, phone: +351 239 851040/9, fax: +351 239 824692
Center for Health Technology and Services Research (CINTESIS), Faculty of Medicine, University of Porto, Porto, Portugal
Abstract
Brazil is the second country with the highest rate of caesarean sections worldwide which has a negative impact on
maternal and neonatal mortality and morbidity rates. In order to stimulate normal vaginal delivery and reduce the
number of unnecessary caesarean surgeries, the National Agency of Supplementary Health established a Normative
Resolution. It states the right to access the cesarean surgeries and normal deliveries percentation per operator, health
facility and physician, ensure partogram use during labour, antenatal care card and the information letter to the
pregnant woman within the scope of supplementary health. Aiming at providing quality information to the
parturient which would allow her to choose the most suitable type of birth, assisting the health professionals, and
facilitating the adaptation of health operators to the new law, a system has been developed. The requirements
gathering was done through online questionnaires and interviews with health professionals, which increases their
chances of having a good acceptance by the users. The system was developed using the framework CakePHP. As
next steps, we intend to develop some more functionalities and implant the system in maternity wards to validate
the tool.
Keywords: Antenatal Care; Labour Care; Supplementary Health.
1. Introduction
According to a research conducted in 2014 by the World Health Organization (WHO), Brazil is the
second country with the highest rate of deliveries by caesarean section (CS) in the world (55.6%)1.
82
D Article - Development of a system for antenatal and labour care of preg-nant women in the Brazilian private health system

ISBN 978-989-97433-8-0 E-book edition 2017 by SciKa
Book of abstracts of the
CENTERIS 2017 – Conference on Enterprise Information Systems /
ProjMAN 2017 – International Conference on Project MANagement /
HCist 2017 – International Conference on Health and Social Care Information Systems and Technologies
213
According to data from the National Agency of Supplementary Health (in Portuguese: Agência
Nacional de Saúde Suplementar - ANS), responsible for regulating the Brazilian private health sector,
the situation is even more worrying in the private health sector. In 2015, 84.6% of deliveries in
supplementary health were performed by cesarean section2. WHO suggests that populational rates of
caesarean sections above 10% do not contribute to the reduction of maternal, perinatal or neonatal
mortality. Considering the characteristics of Brazil, the reference rate adjusted by the instrument
developed by the WHO would be between 25% and 30%3.
CS without medical indication increases risks to the woman and neonatal health. Because it is a
surgery, it presents complications risks such as infections and hemorrhage to the mother that may result
in maternal death4, 5, 6. As for the newborn, lesions can occur at the time of delivery or other
complications after birth such as infections, pneumonias, prematurity or Intensive Care Unit (ICU)
admission, in cases in which surgery is performed before 39 weeks of gestation7, 8, 9. In addition,
cesarean delivery increases the infant's chance of respiratory distress by 120 times when the surgery is
performed between 37 and 38 weeks10.
In order to stimulate normal vaginal delivery and reduce the number of unnecessary caesarean
surgeries, ANS established the Normative Resolution (RN) 368, of January 6, 2015. With its entry into
force, health plan operators, whenever requested, must disclose the percentages of cesarean surgeries
and vaginal deliveries per health facility and physician. The operators will also be obliged to provide
the antenatal care card, in which all the antenatal information must be recorded. In addition, they must
require the use of the Partogram, a graphic document where the entire evolution of labor is recorded
and will be considered an integral part of the process for payment of the procedure 11.
This article aims to present the development of a system for antenatal care follow-up and labor
management at the supplementary health care. The system will allow health professionals to store and
organize pregnant women information from the antenatal care facility until delivery. The system will
respond to the RN 368, integrating the information on percentages of normal and cesarean deliveries,
the antenatal care card and the Partogram in a digital form with easy access. Consequently, it is hoped
that the system may contribute to reducing the number of cesarean deliveries performed in the private
health sector.
In the next section, we will present some concepts used as reference background for the construction
of the proposed system. Then, in the third section, we will describe the steps planned to build the system.
In the section four, we will present the results and a brief discussion of the importance of such work. At
last, we will present the conclusion and propose future works.
ISBN 978-989-97433-8-0 E-book edition 2017 by SciKa
Book of abstracts of the
CENTERIS 2017 – Conference on Enterprise Information Systems /
ProjMAN 2017 – International Conference on Project MANagement /
HCist 2017 – International Conference on Health and Social Care Information Systems and Technologies
214
2. Background
2.1. Supplementary health
The Brazilian health system consists of at least two subsystems: a public health system, the Unified
Health System (SUS - Sistema Único de Saúde) and a private health system, the Supplementary Health
Care System (SSAM - Sistema Supletivo de Assistência Médica)12. The Supplementary Health in Brazil
is the activity that involves the operation of private health insurance plans and insurance13. This
operation is regulated by the ANS that represents the public power and was created to act in the
regulation, creation and implementation of norms, control and inspection of the activities of the
segment. The supplementary health operators include health insurers, group medicines, cooperatives,
philanthropic institutions and self-suggestions. According to the ANS, of 2.905.789 births a total of
589.188 were performed at the Supplementary Health system in 2015.
2.2. Antenatal care card
The antenatal care card, created in Brazil in 1988, is a paper instrument for recording antenatal
medical appointments that contains the main data of the pregnant woman's follow-up14. Because it is a
paper record, the custody of the card may be vulnerable to loss, which may make it difficult to perform
any procedure in an emergency situation. The card must be provided to all pregnant women, both in the
public and private health care, at the first prenatal visit and must be filled in regularly with information
such as the weight of the pregnant woman, vaccination, obstetric characteristics, medical conditions,
results of each medical appointment and symptoms presented in the period. The card is also important
for recording uterine height measurement, an examination that helps to monitor the development of the
baby15.
The pregnant woman must ask her doctor for the correct and legible filling of the card information
and carry it with her all the time, especially on trips, because if she needs emergency care, any health
professional can review the information and act safely. It is also important to take the Pregnant Woman's
Card to hospital admission during labour15. Women with gestational diabetes, for example, can not take
glucose serum, that is, through the antenatal care card, before performing any procedure, doctors can
analyze and act safely for the mother and the baby16.
2.3. Partograph
The partograph is a graphic tool where the progression of labor and conditions of the mother and
fetus are recorded17. It was idealized by WHO in 1992 and became mandatory in maternity hospitals in
199418. It mainly records the frequency of uterine contractions, fetal heart rate, and maternal cervical
dilatation. With these records the doctor can assess whether labor is within normal standards and

ISBN 978-989-97433-8-0 E-book edition 2017 by SciKa
Book of abstracts of the
CENTERIS 2017 – Conference on Enterprise Information Systems /
ProjMAN 2017 – International Conference on Project MANagement /
HCist 2017 – International Conference on Health and Social Care Information Systems and Technologies
215
whether interventions should be performed. Through the partograph it can be possible to verify if a
cesarean was performed unnecessarily.
3. Methods
To gather important information to identify and analyse users' wants, needs and beliefs, we applied
online questionnaires. This kind of strategy, also known as market research, is beneficial in providing a
better understanding of users' demands and behaviour, thus, helping in product design. Also, interviews
with a gynecologist-obstetrician doctor were conducted. Therefore, the requirements (functional and
nonfunctional) were raised from both strategies. Consultations were also held on related work and
demonstrations of related systems. In this way, our intention was to guarantee consistency,
completeness and correctness of the product during the development phase.
The web-based system was designed following the model-view-controller (MVC) pattern19. The
MVC architecture organizes the application into three interconnected parts: the first (the model)
represents an object carrying data; the second (the view) represents the presentation layer; and the last
(the controller) acts on both, model and view, controlling the data flow updating the view whenever
data changes. This pattern permits a better organization of the code and allows the development of
multiple views for a model. The system will provide interoperability by a web service application
program interface (API) that adhere to the representational state transfer (REST) architecture20. REST
is a great way to facilitate the access to the logic of the application and the integration with other
systems. The API and the web tool was implemented using the PHP framework CakePHP that makes
building web applications using the MVC patterns and implementing REST services simpler, faster,
while requiring less code21. The presentation layer was developed using HTML5, CSS and JavaScript.
Also, a mobile application was developed consuming the RESTful API, so the parturient can always be
with her antenatal information when it is needed.
4. Results and Discussion
A total of 15 women (who was pregnant or had already given at least one birth) answered an online
questionnaire. The results showed that 66.7% of the women would like to exchange the paper version
for a digital one of the pregnant antenatal care card, and 93.3% was interested in a system that provides
information such as feeding, proper exercises, baby development and care to be taken during pregnancy.
Also, 2 health professionals responded to a different online questionnaire and both would like to use a
tool to help their patients with useful information that contains the antenatal care card and the partograph
digitally. The participants, women and the health professional, suggested some functionalities to the
system in the survey, and although it was a low number of interviewed people, their answers were
essential to the software development.

ISBN 978-989-97433-8-0 E-book edition 2017 by SciKa
Book of abstracts of the
CENTERIS 2017 – Conference on Enterprise Information Systems /
ProjMAN 2017 – International Conference on Project MANagement /
HCist 2017 – International Conference on Health and Social Care Information Systems and Technologies
216
In addition, a third health professional, an experienced gynecologist and obstetrician doctor,
participated in the system development through interviews. In particular, she was crucial at informing
the functioning and flow of the process of antenatal care at the supplementary health system. She also
suggested some desired functionalities to speed up and facilitate the work of health professionals during
antenatal and labour care. We recognize that health professionals may have different perceptions and
only one is a very low number. Therefore, further tests and improvements are needed, but it was
important to obtain the first version of the system.
The developed system fulfills the requirements of the RN 368 in a digital manner through a web-
based multi platform architecture. The model adopted for the development of the application is based
on the client-server model, where several clients can simultaneously access the server, which searches
for information in a database, to respond to customer requests. The system allows health professionals
to register pregnant women and, from then on, to monitor their antenatal care. When starting the labor,
the health professional counts on the aid of a digital partogram, a tool much more practical and easy to
use than its paper version. The pregnant woman can have access to the information on the Antenatal
Care Card and also useful information during pregnancy and the postpartum period, such as feeding,
adequate exercise, baby development, etc. In Fig. 1. are presented screenshots of the mobile version
developed for pregnant women and in Fig. 2. is shown the digital partogram developed for health
professionals.

ISBN 978-989-97433-8-0 E-book edition 2017 by SciKa
Book of abstracts of the
CENTERIS 2017 – Conference on Enterprise Information Systems /
ProjMAN 2017 – International Conference on Project MANagement /
HCist 2017 – International Conference on Health and Social Care Information Systems and Technologies
217
Fig. 1. Mobile interfaces of the system for pregnant women
Fig. 2. Digital Partogram (version of system for health professionals)

ISBN 978-989-97433-8-0 E-book edition 2017 by SciKa
Book of abstracts of the
CENTERIS 2017 – Conference on Enterprise Information Systems /
ProjMAN 2017 – International Conference on Project MANagement /
HCist 2017 – International Conference on Health and Social Care Information Systems and Technologies
218
Some similar systems have already been developed. One of them is QUALMAT, a software that
aims to improve the performance and motivation of rural health workers and ultimately quality of
primary maternal health care services in three African countries Burkina Faso, Ghana, and Tanzania.
QUALMAT Clinical Decision Support System provides computerized guidance and clinical decision
support for antenatal care, and care during delivery and up to 24 hours post delivery22. However, the
system does not support the interaction between health professionals and parturients and it is designed
for a different scenario.
Childbirth is often one of the most special moments in the lives of many women and their families.
In addition, it is important to understand the life risks caused by gestation, which are even greater when
a CS is performed. The parturient must have the right to quality information and to have a humanized
labour, without any abuse, disrespect or mistreatment for both mother and baby. In the current model
of delivery and birth care in the private sector in Brazil, we could say that this may does not always
occur due to the high number of SC that increases the risk of complications. A system that allows the
women to consult information on the number of cesarean deliveries and normal births of each doctor
and health unit would empower the woman to make the best choice on where to get a better antenatal
and labour care.
On the other hand, the application will assist health professionals in the follow-up of women from
the gestation period until delivery. The tool is expected to ease the burden of health professionals during
labor, promote better management, and support decision-making by health professionals. The
application could help increase the efficiency of the care process and ultimately improve the outcomes
of labor.
Therefore, the application will have a positive impact on both the private health sector, helping the
workflow and adjustment to the RN 368, as well as the pregnant woman, making her feel more confident
about the procedures performed during her pregnancy. Also, the system could have a positive impact
on public health too.
5. Conclusion
The purpose of this article was to present a solution that could help to reduce the number of
unnecessary caesarean surgeries, keeping the pregnants informed about her and her baby’s health and
helping the health professionals at daily work routine to accomplish the RN 368. We proposed a web-
based solution that was developed using the MVC patterns.
By being an intuitive system, available on multiple platforms, modeled and developed together with
healthcare professionals, it is believed the software will have good acceptance of the users. Regarding
this, we aim to strengthen the cooperation and involvement with Brazilian healthcare institutions, in
order to make tests and improve our solution toward an effective implementation to its users. We also
aim to add more functionalities to our system, like a chat to enable the pregnant and her health

ISBN 978-989-97433-8-0 E-book edition 2017 by SciKa
Book of abstracts of the
CENTERIS 2017 – Conference on Enterprise Information Systems /
ProjMAN 2017 – International Conference on Project MANagement /
HCist 2017 – International Conference on Health and Social Care Information Systems and Technologies
219
professional to communicate and an intelligent algorithm to help health professionals to make their
decisions at deliveries.
References
[1]. Betrán AP, Ye J, Moller AB, Zhang J, Gülmezoglu AM, Torloni MR. The increasing trend in caesarean section rates:
global, regional and national estimates: 1990-2014. PloS one. 2016 Feb 5;11(2):e0148343.
[2]. Taxas de partos cesáreos por operadora de plano de saúde [Internet]. Agência Nacional de Saúde Suplementar. 2016 [cited
15 17 February 2017]. Available from: http://www.ans.gov.br/planos-de-saude-e-operadoras/informacoes-e-avaliacoes-de-
operadoras/taxas-de-partos-cesareos-por-operadora-de-plano-de-saude.
[3]. Ministério da Saúde. Governo quer reduzir cesarianas desnecessárias [Internet]. Portal Brasil. 2016 [cited 15 17 February
2017]. Available from: http://www.brasil.gov.br/saude/2016/04/governo-federal-quer-reduzir-cesariana-desnecessaria
[4]. Villar J, Valladares E, Wojdyla D, Zavaleta N, Carroli G, Velazco A, Shah A, Campodónico L, Bataglia V, Faundes A,
Langer A. Caesarean delivery rates and pregnancy outcomes: the 2005 WHO global survey on maternal and perinatal
health in Latin America. The Lancet. 2006 Jun 9;367(9525):1819-29.
[5]. Silver RM. Delivery after previous cesarean: long-term maternal outcomes. InSeminars in perinatology 2010 Aug 31 (Vol.
34, No. 4, pp. 258-266). WB Saunders.
[6]. Souza JP, Gülmezoglu AM, Lumbiganon P, Laopaiboon M, Carroli G, Fawole B, Ruyan P. Caesarean section without
medical indications is associated with an increased risk of adverse short-term maternal outcomes: the 2004-2008 WHO
Global Survey on Maternal and Perinatal Health. BMC medicine. 2010 Nov 10;8(1):71.
[7]. Hansen AK, Wisborg K, Uldbjerg N, Henriksen TB. Risk of respiratory morbidity in term infants delivered by elective
caesarean section: cohort study. Bmj. 2008 Jan 10;336(7635):85-7.
[8]. Tita AT, Landon MB, Spong CY, Lai Y, Leveno KJ, Varner MW, Moawad AH, Caritis SN, Meis PJ, Wapner RJ, Sorokin
Y. Timing of elective repeat cesarean delivery at term and neonatal outcomes. New England Journal of Medicine. 2009 Jan
8;360(2):111-20.
[9]. Wilmink FA, Hukkelhoven CW, Lunshof S, Mol BW, van der Post JA, Papatsonis DN. Neonatal outcome following
elective cesarean section beyond 37 weeks of gestation: a 7-year retrospective analysis of a national registry. American
journal of obstetrics and gynecology. 2010 Mar 31;202(3):250-e1.
[10]. Madar J, Richmond S, Hey E. Surfactant‐deficient respiratory distress after elective delivery at ‘term’. Acta Paediatrica.
1999 Nov 1;88(11):1244-8.
[11]. Entram em vigor novas regras sobre parto na saúde suplementar - ANS - Agência Nacional de Saúde Suplementar
[Internet]. Agência Nacional de Saúde Suplementar. 2015 [cited 15 February 2017]. Available from:
http://www.ans.gov.br/aans/noticias-ans/qualidade-da-saude/2923-entram-em-vigor-novas-regras-sobre-parto-na-saude-
suplementar.
[12]. Brazil C. Constituição da república federativa do Brasil. Texto constitucional promulgado em 5 de outubro de 1988, com
as alterações adotadas pelas Emendas Constitucionais n 1/92 a 44/2004 e pelas Emendas Constitucionais de Revisão n 1 a
6/94. Brasília: Senado Federal, Subsecretaria de Edições Técnicas, 2004.
[13]. Pietrobon L, Prado ML, Caetano JC. Saúde Suplementar no Brasil: o papel da Agência Nacional de Saúde Suplementar na
regularização do setor. Physis (Rio J.). 2008:767-83.
[14]. Campos JJ, Akatsu AS, Prado ES, Hoyama É, Rodrigues JA. Cartão da gestante: uma análise sob o ponto de vista dos
médicos do município de Londrina. Semina: Ciências Biológicas e da Saúde. 2004 Dec 15;17(2):149-57.
[15]. Para que serve o Cartão da Gestante? [Internet]. Pastoral da Criança. 2017 [cited 17 March 2017]. Available from
https://www.pastoraldacrianca.org.br/outrosassuntos/3081-para-que-serve-o-cartao-da-gestante
View publication statsView publication stats