university of newcastle upon tyne - newcastle university
TRANSCRIPT

University of Newcastle upon Tyne
Department of Computing Science
NEWCASTLE UNIVERSITY LIBRARY
098 06639 2
---rh.tz si s L <c, 2 <0 -=t
Towards Quality Programming in the Automated
Testing of Distributed Applications
PhD Thesis
By
Huey-Der Chu
October 1998
~\_ _!Siiiii&:."

Abstract
Software testing is a very time-consuming and tedious activity and accounts for over 25% of
the cost of software development. In addition to its high cost, manual testing is unpopular and
often inconsistently executed. Software Testing Environments (STEs) overcome the deficiencies
of manual testing through automating the test process and integrating testing tools to support a
wide range of test capabilities.
Most prior work on testing is in single-thread applications. This thesis is a contribution to testing
of distributed applications, which has not been well explored. To address two crucial issues in
testing, when to stop testing and how good the software is after testing, a statistics-based
integrated test environment which is an extension of the testing concept in Quality Programming
for distributed applications is presented. It provides automatic support for test execution by the
Test Driver, test development by the SMAD Tree Editor and the Test Data Generator, test failure
analysis by the Test Results Validator and the Test Paths Tracer, test measurement by the Quality
Analyst, test management by the Test Manager and test planning by the Modeller. These tools
are integrated around a public, shared data model describing the data entities and relationships
which are manipulable by these tools. It enables early entry of the test process into the life cycle
due to the definition of the quality planning and message-flow routings in the modelling. After
well-prepared modelling and requirements specification are undertaken, the test process and the
software design and implementation can proceed concurrently.
A simple banking application written using Java Remote Method Invocation (RMI) and Java
DataBase Connectivity (JDBC) shows the testing process of fitting it into the integrated test
environment. The concept of the automated test execution through mobile agents across multiple
platforms is also illustrated on this 3-tier client/server application.

Acknowledgements
First and foremost, I would like to thank my supervisor Professor John Dobson for his constant
support and constructive advice. I am grateful to Professor Dobson for his comments and
criticisms on the preliminary drafts of the work. Special thanks is extended to Professor Santosh
Shrivastava and Dr Paul Watson, member of the thesis committee, for their useful suggestions,
specially in the first year.
I would like also to thank several of my colleagues and staffs members of the Centre for Software
Reliability for their prompt help and technical support on my occasions. These include Professor
Tom Anderson, Joan Atkinson, Peter Barrett, Dr Oliver Biberstein, Dr Rogerio de Lemos, Dr
John Fitzgerald, Claire Hall, Kevin Hollingworth, Andrej Pietschker, Dr Steve Riddle, Dr Amer
Saeed, Alison Sheavills and Dr Ros Strens. Also, many thanks to Shirley Craig for her patience
and efficient help in searching out many relevant references for this thesis.
The support and encouragement offered by my wife and my children during studies are also
greatly acknowledged.
The work reported in this thesis was financially supported by grants from the National Science
Council in Taiwan and the Ministry of National Defense in Taiwan.

Table of Contents
Overview of the Thesis
................................................
Chapter 1
Introduction
1.1 Statement of the Problem .................................... .
1.1 . 1 Software Testing Techniques ............................. .
1.1.2 Software Testing Tools .................................. .
1.2 The Research Hypothesis .................................... .
1.2.1 A Graph Model Suited for Testing Purpose ................. .
1.2.2 A Tool for Specifying All Possible Delivered Messages ....... .
1.2.3 A Framework for Testing Distributed Software .............. .
1.2.4 An Integrated Test Environment for Testing Distributed Software
1.2.5 Automated Test Execution through Mobile Agents .......... .
1.3 Validation ................................................. .
1.4 Outline of the Thesis ........................................ .
Chapter 2
Survey of Software Testing Technology
2.1 Introduction ............................................. .
2.2 A Framework For Surveying Software Testing Techniques ........ .
2.J An Evaluation Scheme for Testing Techniques ................... .
2.J.l A Classification of Software Testing Techniques ............. .
2.J.2 Tcst Data Selection ..................................... .
2.J.J Adequ<lev Criterion ..................................... .
2.JA Exit Criterion .......................................... .
2.J.5 Test Quali!\' Measurement ............................... .
2A Software Testing Tools .................................... .
1
4
4
5
6
7
7
8
8
8
10
10
11
13
13
15
18
18
21
25
28
29
32

2.4.1 Why Automated Software Testing. . . . . . . . . . . .. . .. . . . . . . . . . . 32
2.4.2 Taxonomy of Software Testing Tools ........................ 33
2.4.3 Test Data Generators .................................... 35
2.4.4 Testing Tools with Capture/Playback Paradigm ............... 37
2.5 Software Testing Strategy ..................................... 39
2.5.1 Comparison of Software Testing Techniques. . . . . . . . . . . . . . . . . 39
2.5.2 Proposal Of Strategy. . . . . . . . . . . . . . . . . . . . . . . . . . . . . . . . . . . . . 41
2.6 Statistical Software Testing .................................... 43
2.6.1 The Problem of Statistical Testing . . . . . . . . . . . . . . . . . . . . . . . . . . 43
2.6.2 FAST: A Framework for Automating Statistics-based Testing. . 45
2.7 Testing Of Distributed Software Systems ........................ 46
2.7.1 The problems of Testing Distributed Software Systems ........ 46
2.7.2 Needs to be Tested ...................................... 48
2.7.3 An Approach for Testing Distributed Software Systems. . . . . . . . 50
2.8 Conclusion
Chapter 3
An Integrated Test Environment for Distributed Applications
3.1 Introduction ............................................... .
3.2 A Basic Architecture of Automated Software Testing ............. .
3.2.1 Requirements Specification ............................. .
3.2.2 Test Data Generator ................................... .
3.2.3 Test Execution ......................................... .
3.2.4 Test Results Validator .................................. .
3.3 My Approach .............................................. .
3.3.1 The Concept of The SIAD/SOAD Tree .................... .
3.3.2 The SMAD Tree ....................................... .
3.4 SITE: A Statistics-based Integrated Test Environment ........... .
3.4.1 Test Manager .......................................... .
3.4.2 Modeller ............................................. .
3.4.3 SMAD nee Editor ..................................... .
3.4.4 Test Driver ............................................ .
3.4.5 Quality Analyst ........................................ .
3.4.6 Test Data Generator .................................... .
ii
52
53
53
53
54
56
57
57
58
58
63
64
66
67
68
69
70
71

3.4.7 Test Path Tracer. . . . . . . . . . . . . . . . . . . . . . . . . . . . . . . . . . . . . . . . . 71
3.4.8 Test Results Validator .................................... 72
3.5 An Operational Environment for Testing Distributed Software. . . . . . 72
3.5.1 Overview. . . . . . . . . . . . . . . . . . . . . . . . . . . . . . . . . . . . . . . . . . . . . . . 72
3.5.2 The Java Development Kit . . . . . . . . . . . . . . . . . . . . . . . . . . . . . . . . 74
3.6 Comparison With Other Test Environments. . . . . . . . . . . . . . . . . . . . . . 84
3.6.1 Canonical Function Partition .............................. 85
3.6.2 SAAM Structure ........................................ 87
3.6.3 SITE SAAM Description and Functional Allocation .......... 88
3.6.4 PROTest II SAAM Description and Functional Allocation ..... 89
3.6.5 TAOS SAAM description and functional allocation 90
3.6.6 CITE SAAM description and functional allocation ........... 92
3.6.7 STE Comparison . . . . . . . . . . . . . . . . . . . . . . . . . . . . . . . . . . . . . . . . 93
3.6 Conclusion ........................................... 95
Chapter 4
A Statistics - based Framework For Testing Distributed Software
4.1 Introduction ............................................... .
4.2 Statistical Software Testing
4.2.1 Quality Programming
96
96
96
96
4.2.2 FAST: a Framework for Automating Statistics-based Testing. . . 98
4.3 Modelling Distributed Software . . . . . . . . . . . . . . . . . . . . . . . . . . . . . . . . 102
4.3.1 A Graph Model for Modelling Distributed Software. . . . . . . . . . 102
4.3.2 The causality relation. . . . . . . . . . . . . . . . . . . . . . . . . . . . . . . . . . . . 104
4.4 The SMAD Tree . . . . . . . . . . . . . . . . . . . . . . . . . . . . . . . . . . . . . . . . . . . . . 106
4.5 A Framework For Testing Distributed Software. . . . . . . . . . . . . . . . . . . 110
4.5.1 Statistical Analysis. . . . . . . . . . . . . . . . . . . . . . . . . . . . . . . . . . . . . . . 111
4.5.2 Quality Analysis. . . . . . . . . . . . . . . . . . . . . . . . . . . . . . . . . . . . . . . . . 113
4.5.3 Test Data Generator of Messages ................... . . . . . . . 115
4.5.3 The Construction of the Causality Relation ................. 116
4.5.4 Test Results Validator ................................... .
4.h Conclusion ............... .
1Il
.~----."
116
120
Chapter 5
The Design And Implementation of SITE For A Simple Banking Application
................................................
5.1 Introduction ............................................... .
5.2 What The Tool Look Like .................................... .
5.3 The Simple Banking Application .............................. .
5.4 Modelling ................................................. .
5.4.1 Manufacturing Process
5.4.2 Type of Raw Materials
121
121
122
124
125
125
127
5.4.3 Characteristics of The Raw Materials. . . . . . . . . . . . . . . . . . . . . . . 127
5.4.4 Rules for Using the Raw Materials ........................ .
5.4.5 Definition of Product Unit ..................... .
5.4.6 Definition of Production Unit Defectiveness ......... .
5.4.7 Data Modelling ........................................ .
128
128
128
128
5.5 The Requirements Specification ............................... 129
5.5.1 Software Design Requirements ............................ 129
5.5.2 Test Requirements. . . . . . . . . . . . . . . . . . . . . . . . . . . . . . . . . . . . . . . 131
5.6 The design of the Banking Application. . . . . . . . . . . . . . . . . . . . . . . . . . 133
5.6.1 The Password Checker ................................... 134
5.6.2 The Banking Data Manager. . . . . . . . . . . . . . . . . . . . . . . . . . . . . . . 134
5.6.3 The Banking Activity Executor ............................ 135
5.7 The Design of the Integrated Test Environment. . . . . . . . . . . . . . . . . . 135
5.7.1 Test Manager. . . . . . . . . . . . . . . . . . . . . . . . . . . . . . . . . . . . . . . . . . . 136
5.7.2 Test Driver ............................................. 137
5.8 Concurrent Implementation of Software Design and Test Design ... 140
5.8.1 The Implementation of the Simple Banking Application. ...... 140
5.8.2 The Implementation of SITE for SBA ... . . . . . . . . . . . . . . . . . . . 143
5.9 Testing and Integration ....................................... 149
5.10 Experimental Results and Discussion .......................... 149
5.10.1 Automatic Testing on One Client Site .................... 150
5.10.2 Manual Testing on Two Client Sites ...................... 153
5.10.3 Comment ................ , . .. . . ....................... 156
5.11 Conclusion ................................................ 158
1\'

Chapter 6
Automated Test Execution Through Mobile Agents and Multicast
................................................
6.1 Introduction ............................................... .
6.2 An agent-based architecture of VISITOR ..................... .
6.2.1 Mobile Agents ......................................... .
6.2.2 The Architecture of VISITOR ............................ .
6.2.3 A General Structure of Agents ........................... .
6.2.4 Structure of the Receiving Agents ........................ .
6.2.5 Communication between Agents .......................... .
6.3 Automated Test Execution Through VISITOR .................. .
6.4 Automated Test Execution Through The Multicast System ........ .
6.4.1 The Chat System ....................................... .
6.4.2 The Multicast System ................................... .
6.4.3 Automated Test Execution Through the Multicast System ..... .
6.5 A Blackboard-based Dynamic Test Plan for Test Automation ..... .
6.5.1 Blackboard Architecture ................................. .
6.5.2 Illustration of the Framework ............................ .
6.6 Conclusion ................................................ .
Chapter 7
Summary and Conclusions
7.1 The Problem ............................................... .
7.2 Contribution of Current Understanding ........................ .
7.2 Future Research ............................................ .
REFERENCE LIST .................................... .
159
159
160
160
162
164
165
167
170
173
174
174
175
177
177
178
179
181
181
182
186
190

Overview of the Thesis
Chapter one begins with a general problem definition statement of the problems concerned with
software testing. In this section the concept of the problems on software testing techniques and
tools are addressed. In the folJowing section I state what my hypothesis is and how I propose to
prove it. The structure of this thesis is presented in the final section.
Chapter two presents a framework (Chu, 1997) for the classification of testing techniques, the
evaluation of testing techniques, the currently available testing tools and testing strategies. I start
the chapter by pointing out the idea that there is no "silver bulJet" testing approach and that no
single technique alone is satisfactory which has been pointed out by many leading researchers
such as (Hamlet, 1988; Musa & Ackerman, 1989; Parnas, Schouwen & Kwan, 1988). In the
folJowing section a framework for surveying software testing techniques is briefly given.
According to this framework, a classification scheme for software testing techniques is presented
in the next section. In the folJowing section I survey the currently available tools for supporting
these techniques, particularly test data generators and testing tools with capture/playback
paradigm. In the final sections I show how my work fits into the framework, choosing a position
which is not occupied already by anything in the literature.
I start Chapter three with a brief discussion and overview of software testing environments. In
the following section a basic architecture of automated software testing is introduced. In addition,
an overview of my approach is shown at the end of this section. In the folIowing section the
architecture of SITE (Chu & Dobson, 1997) is described. In consists of control components (Test
Manager, Test Driver), computational components (ModelJer, SMAD Tree Editor, Quality
Analyst, Test Data Generator, Test Paths Tracer, Test Results Validator) and an integrated
database. SITE provides automated support for test execution, test development, test failure
analysis, test measurement, test management and test planning. An operational environment for
testing distlibuted applications based on the Java software is described in the next section. An
essential component for developing quality software is SITE in this operational environment. A

comparison of STEs (Eickelman & Richardson, 1996) using the SAAM structure (Kazman, Bass,
Abowd & Webb, 1994) is discussed in the final section.
Chapter four begins with a problem statement in testing distributed applications (Ferguson, 1993;
Shatz & Wang, 1987). For a proper understanding of a distributed application and its execution,
it is important to determine the causal and the temporal relationship (Berry, 1995; Lamport, 1978)
between the events that occur in its computation. In the following section a graph model is
introduced to represent the behaviour amongst events in distributed applications. In the next
section I extend the concept of the SIAD/SOAD tree from FAST (Chu, Dobson & Liu, 1997) to
SMAD tree making it a more powerful technique for test data generation and test result inspection
in distributed applications. In the following section, based on the SMAD tree, I develop a
framework which not only can generate the input messages and a sequence of intermediate
message pairs with casual relationship, but can inspect the test results, both with respect to their
syntactic structure and the causal message ordering under repeated executions.
In chapter five, a simple banking application written using Java Remote Method Invocation
(RMI) and Java DataBase Connectivity (JDBC) shows how the testing process fits into SITE.
After the behaviour of this application is modelled by a DMFG and messages amongst events are
defined by the SMAD tree, the concurrent design and implementation of this application and
SITE are processed. How the test of the application is conducted and comments on the results
obtained are described in the final section. All source codes for this implementation can be
downloaded at http://www.casq.orglsiteibankingl which is under the web site for Chinese
Association for Software Quality (CASQ) constructed and maintained by Huey-Der Chu 1998.
In the first section of Chapter six, I address some problems of current testing tools with the
capture/playback paradigm. The agent-based architecture of VISITOR (Chen, Greenwood &
Chu, 1998), which can support flexible communication and co--operation between mobile agents
and local agents which provide some services through the agent broker, is described in the next
section. In the following section, I illustrate the application of VISITOR to the client/server test
2

execution. In the following section, the concept of a multicast system is introduced. In addition,
I illustrate the multicast framework for client/server test execution. A dynamic test plan based
on the blackboard model is proposed for automated test execution in the final section. The
application of VISITOR to software testing, Mobile Testing Agent (Chu, Dobson, Chen &
Greenwood, 1998), has been implemented and can be seen at the MObile Software Testing
(MOST) web site (http://www.casq.org/most/) constructed and maintained by Huey-Der Chu
1998.
In the first section of Chapter 7, I summarise my results and shows that my initial hypothesis has
been validated by my work; it concludes by discussing what and how constraints could be relaxed
in order to take the approach further.
3

1.1 Statement of the Problem
Chapter 1
Introduction
It transformed the automotive industry in the 1970's and the semiconductor industry in the
1980's, and now, the demand for quality is transforming the software industry. In today's
competitive market, the production of high-quality software systems is an important issue for
the near future. Software quality is the degree to which a customer or user perceives the software
as meeting his or her composite expectations (Deutsch & Willis, 1988). To achieve reliable and
high quality software, it is essential to prevent errors from occurring and to test the software
sufficiently before the product is delivered. This is not only a developmental activity for
discovering product defects but also an independent assessment of software execution in an
operating environment. It is a very time-consuming and tedious activity and accounts for over
25% of the cost of software development (Beizer, 1990; Myers, 1978; Norman, 1993). Manual
test efforts tend to find the majority of defects at the end of the release effort or during beta testing,
where the errors are more expensive to fix. In addition to its high cost, manual testing is unpopular
and often inconsistently executed. If the testing process could be automated, the cost of
developing software could be significantly reduced (Ince, 1987).
Distributed applications are traditional applications re-cast for a new environment of multiple
interlinked computers and have been designed as systems whose data and processing capabilities
reside on multiple platforms, each performing an assigned function within a known and
controlled framework contained in the enterprise. Applications can now be broken into pieces
that are common to more than one application and therefore stored, maintained and executed in
a central location (a server), with the results sent back to the requesting client. The complexity
of the client/server makes testing more difficult and poses new challenges to the development
organization. Because each component can not always be tested as a single unit, integration
4

testing becomes the lowest meaningful level testing. Defining all test conditions for a set of
integrated functions is difficult enough with structured programs and procedures, let alone those
that have been distributed across client and server platforms.
Software testing is characterized by the existence of many methods, techniques and tools, that
must fit the test situation, including technical properties, goals and restrictions. In practice, the
software development methodologies typically employ a combination of several software testing
methods, techniques and tools. There is no single ideal software testing technique for assessing
software quality. Therefore, we must ensure that the testing strategy is chosen by a combination
of testing techniques and tools at the right time on the right world. The problems of testing
techniques and tools are addressed the following sections.
1.1.1 Software Testing Techniques
It is a well known fact in the software industry that software of any complexity cannot be
exhaustively tested and that a sample of the possible inputs must be relied on for the testing
performed. The conventional testing techniques based on the deterministic method (Marre,
Thevenod-Fosse, Waeselynck, Gall & Crouzet, 1995) ask the tester to select particular inputs to
test peculiar cases by means of test criteria. It may discover many errors but may not provide
much improvement in the product's quality, because their intention is to provoke failure
behaviour (Vliet, 1996). It is also accepted that errors can have significantly different effects on
the failure rate of software and that a greater payoff comes from discovering and removing the
errors with high failure rates during testing. However, the use of a system is interested in the
probability of failure-free behaviour. Statistically based testing with random sampling driven
from input probability distributions is uniquely effective at finding errors with high failure rates.
The major advantages of using the statistical method for software testing are as follows (Curritt,
Dyer & Mills, 1986; Whittaker & Tomason, 1994): Firstly, testing can be performed based on
the user's actual utilization of the software; secondly, it allows the use of statistical inference
techniques to compute probabilistic aspects of the testing process; and thirdly, in many
applications, testing can be completely automated, from the generation of test data to the analysis
of test results.
5

Current statistical testing techniques involve exercising a piece of software by supplying it with
test data that are randomly drawn according to a single, unconditional probability distribution
on the software's input domain (Curritt, Dyer & Mills, 1988; Dyer, 1992; TMvenod-Fosse,
Waeselynck & Crouzet, 1995). This distribution represents the best estimate of the operational
frequency for the use for each input. This model is not sufficiently effective for many types of
software, because the probability of applying an input can change as the software is executed
(Whittaker & Tomason, 1994).
Quality Programming introduced by Cho (1988) specifies the input domain of a software by
means of a "Symbolic Input Attribute Decomposition" (SIAD) tree, which is a syntactic structure
describing the characteristics of all possible input data. The SIAD tree is a way to achieve clarity,
conciseness, completeness and measurability in the specification of input requirements. It
enforces the development of well-defined requirements and imposes disciplines in both design
and implementation. Based on the SIAD tree, a test plan can be designed and implemented
concurrently with the software development. The quality control comes from the imposed
disciplines as well as from the systematic application of statistical sampling techniques using the
SIAD tree. From a fault forecasting point of view, a comparative analysis (Thevenod-Fosse &
Waeselynck, 1991) concluded that the best evaluation is provided by Cho's approach, particularly
when few failures are observed during a test experiment. It can automatically generate data for
testing, based on the SIAD tree. However, it lacks a clear framework with which to tell us how
to achieve automated testing. Therefore, a statistics-based framework which extends the testing
concept in Quality Programming could be presented to achieve automated testing.
1.1.2 Software Testing Tools
To create an automated test in a distributed environment, a test harness (which provides the
infrastructure in which the tests run) and one or more test scripts are needed (Quinn & Sitaram,
1996). Current automated testing tools are an elaboration and more modem implementation of
the capture/playback paradigm. There are indeed many tools that allow test scripts to be recorded
and then played back, using screen captures for verification. However, there are some inherent
6
problems with these capture/playback testing tools (Zallar, 1997; Pettichord, 1996): Firstly, test
automation is only applied at the final stage of testing when it is most expensive to go back and
correct the problem. Secondly, the testers do not get an opportunity to create test scripts until the
application is finished and turned over and thirdly, the problem that sometimes crops up is that
application modifications are made, invalidating the screen captures and then the interface
controls change, making playback fail.
Moreover, for client/server applications, there are some limitations with the capture/playback
paradigm (Mooney & Chadwick, 1998; Quinn & Sitaram, 1996): Firstly, the communication
mechanism between clients and servers uses technology like an RPC protocol that current
capture/playback tools cannot effectively capture from a software company's experience in
(Quinn & Sitaram, 1996). Secondly, these client testing products may not provide a way to test
the effect of multiple users of the software and thirdly, there are non-deterministic behaviours
in a client/server application. Repeated executions of a sequential deterministic software with the
same test script always exercise the same path in the software and thus always produce the same
behaviour. However, a client/server application may not have this capability owing to their use
of nondeterminism. As a result of indeterminacy, repeated execution of a client/server application
with the same test script may execute different paths and produce different results. This is called
the non-reproducible problem. Therefore, some mechanisms are required in order to exercise
these test scripts and examine the test ordering.
1.2 The Research Hypothesis
To address the problems mentioned in the previous section, the hypothesis presented is that of
automated testing of distributed applications to achieve high quality software can be assisted by
means of a statistics-based framework which is an extension of the testing concept in Quality
Programming and a statistics-based integrated test environment. In particular I assert the
following:
7

1.2.1 A Graph Model Suited for Testing Purpose
The execution behaviour of a distributed computation is non-deterministic. As a result of
indeterminacy, it is difficult to know the possible execution behaviours of distributed software,
to identify exactly the execution behaviour to be tested and to control the software execution for
testing a specific execution behaviour. Based on the analysis of execution behaviour of
distributed software, a conventional graph model is not suited for modeling the execution
behaviour of distributed software. Therefore, a Distributed Message Flow Graph (DMFG) is
proposed in my research for modeling the execution behaviour of distributed software.
1.2.2 A Tool for Specifying All Possible Delivered Messages
Quality Programming introduced by Cho can automatically generate data for testing, based on
a so-called' SIAD tree' which is used to represent the hierarchical and syntactic relation between
input elements and also incorporates rules into the tree for using the inputs. In my research, I
extend the concept of SIAD tree to the 'Symbolic Message Attribute Decomposition' (SMAD)
tree which specifies all possible delivered messages between events. The SMAD tree can be used
to define test cases, which consist of an input message plus a sequence of intermediate messages
corresponding to messages in a distributed application, to resolve any non-deterrninistic choices
that are possible during software execution, e.g., exchange of messages between processes. In
other words, there will be two uses of the SMAD tree: one to describe abstract syntax of test data
(including temporal aspects); the other one is that the SMAD tree will be instantiated for each test,
to hold data occurring during the test.
1.2.3 A Framework for Testing Distributed Software
Based on the SMAD tree, it is possible to develop a framework which is based on a statistical
approach. It can automatically generate the test data with an iterative sampling process which
determines the sample size and the software quality can be estimated with the inspection of test
results, both with respect to their syntactic structure and the causal message ordering under
repeated execution. Software quality here means the degree of the analysis of test results for
conformance to the requirements specification of software. The outcome of the analysis is a
classification of the software output into defective and non-defective product units which, in
turn, leads to acceptance or rejection of the software.
8

1.2.4 An Integrated Test Environment for Testing Distributed Software
Based on the framework, it is possible to build a Statistics-based Integrated Test Environment
(SITE) which can provide automated support for the testing process, to address two main issues,
deciding when to stop testing and determining how good the software is after testing. It consists
of computational components, control components and an integrated database. The
computational components will include the Modeller for modelling the applications as well as
the quality plan, the SMAD Tree Editor for specifying input and output messages, the Quality
Analyst which includes the statistical analysis for determining the sample size for the statistical
testing and the test coverage analysis for evaluating the test data adequacy, the Test Data
Generator for generating test data, the Test Tracer for recording testing behaviours on the sen'er
side and the Test Results Validator for inspecting the test results as well as examining the
"happened before" relationship. The architecture of SITE is as shown in Figure 1.1.
( Modeller ) ( SMAD tree _ Editor
Specification
~~~:::-=:.:::::::- -- -----......
" ( \ \ Testin o Testin / " ~ ~. /
'-----------~~ 1~~~----------
An Integrated Database Test Manager
D Control Component Control flow
o Computational Component Data flow
Figure 1.1: The architecture of SITE
9

There are two control components, the Test Manager and the Test Driver. The Test Manager
receives commands from the tester and corresponds with the functional module to execute the
action and achieve the test requirements. It executes two main tasks: data management and
control management. In data management, the Test Manager maintains an integrated database
which consists of static data files and dynamic data files which are created, manipulated and
accessed during the test process. The static files include a SMAD tree file, a random number seed
file and a quality requirement file. The dynamic files include an input unit file, a product unit file,
a test ordering file, a defect rate file, a file for the defect rate range and a sample size file.
In control management, the Test Manager controls three main functional modules: the Modeller,
the SMAD Tree Editor and the Test Driver. The Modeller is used for receiving the test plan such
as test requirements and test methods from the users, creating test plan documentation and saving
some values for the testing database. The documentation produced by the Modeller provides
support for test planning to the Test Driver as well as the SMAD Tree Editor for specifying
messages among events. The SMAD Tree Editor is used to create the SMAD tree file that can
be used to describe the abstract syntax of the test cases as well as to trace data occurring during
the test. The SMAD tree file provides the structure to the Test Data Generator for generating input
unit and the Quality Analyst to inspect the product unit. The Test Driver executes the main task
of testing which includes the Test Data Generator, the Test Execution, the Test Results Validator
and the Sampling Processor.
1.2.5 Automated Test Execution through Mobile Agents
To run the test on the multi-client sites and the server site, it is possible to apply the concept of
mobile agents to the automated testing of client/server testing. A mobile agent is a computer
object that can move through a computer network under its own control, migrating from host to
host and interacting with other agents and resources in order to satisfy requests made by its
clients. In an extension to my work, the test driver could be launched by a mobile agent to remote
client sites to run the tests and the tracing file on the server site could also be brought back to the
user for inspecting.
10

1.3 Validation of the SITE
The implementation of a simple banking application which incorporates the framework will be
taken for the validation of this thesis. A simple banking application is an embedded software
system which is commonly seen inside or outside banks to drive the machine hardware and to
communicate with the bank's central banking database. This application accepts customers
requests and produces cash, account information, database updates and so on. In our research,
a Simple Banking Application (SBA) will be designed as a 3-tier client/server application. The
validation of the hypothesis against this implementation will employ the following components:
• A Distributed Message Flow Graph will be developed for modeling this simple banking
application. The behaviour of this application could be shown in this graphic model.
• The definition of the input domain, of the product unit and of product unit defectiveness for
this simple application will be specified by SMAD tree.
• This simple banking application written using Java Remote Invocation (RMI) and Java
DataBase Connectivity (JDBC) will show the testing process offitting it into a statistics-based
integrated test environment.
• The concept of the automated test execution through mobile agents across multiple platforms
will be implemented on this simple banking application.
1.4 Outline of the Thesis
The ultimate purpose of this study is to address the concept that high quality software can be
achieved and the cost of software testing can be reduced, therefore, the testing process for Quality
Programming (Cho, 1988) should be improved for automated testing of distributed applications.
The following chapters set out the various aspects of the study:
• Chapter 1 outlines the research problem I am addressing, explains why it is an important
problem and states what the research hypothesis that I am trying to establish in this thesis is
and how I propose to prove it. The structure of this thesis is presented in the final section.
• Chapter 2 reviews the relevant literature on testing, automated testing techniques and test data
generators and comments on them from my own particular viewpoint. It provides a framework
in which to position current tools and methods and shows how my work fits into the
11

framework, choosing a position which is not occupied already by anything in the literature.
The final chapter shows that my approach is not only capable of solving problems not
elsewhere addressed, but is capable of doing so efficiently.
• Chapter 3 describes the environment on which I have chosen to base my testbed (Java
Development Kit). It describes what the options were, why I chose that particular one, the
features that it offers and the use made of them. It describes the architecture of my testbed,
showing how the main components relate to each other and to the base environment.
• Chapter 4 describes my approach in more detail and relates the testing process to the
architecture given in the previous chapter. It explains how to construct the input and output
tree structures, how these are used to generate test data, how the application output is captured
and how comparisons between expected and actual output are performed. I introduce some
statistics to show how much test data is required to be generated in order to gain a certain
confidence in the correctness of the application under test and discuss issues of evaluating the
completeness of the test coverage.
• Chapter 5 describes the design of the integrated test environment and how to implement it.
It describes the application, a simple banking application written using Java Remote Method
Invocation (RMI) and Java DataBase Connectivity (JDBC), in some detail and with an
explanation of the process of fitting this application into the integrated test environment.
• Chapter 6 presents a novel paradigm for software testing, which applies mobile agents to
software testing in order to test applications on remote sites. The paradigm proposed shows
a way to address problems in automated testing in a networked environment that fits more
naturally into the real world.
• Chapter 7 summarises my results and shows that my initial hypothesis has been validated by
my work; it concludes by discussing what and how constraints could be relaxed in order to
take the approach further.
12

Chapter 2
Survey of Software Testing Technology
2.1 Introduction
The history of software testing is as long as the history of software development itself. It is an
integral part of the software life-cycle and must be structured according to the type of product,
environment and language used. In the absence offeasible and cost-effective theoretical methods
for verifying the correctness of software designs and implementations, software testing plays a
vital role in validating both. The goal of software testing is firstly, to reveal the hidden number
of defects which are created during the specification, design and coding stages of development,
secondly, to provide confidence that failures do not occur and thirdly, to reduce the cost of
software failure over the life of a product (Smith & Wood, 1989; Chaar, Halliday, Bhandari &
Chillarege, 1993).
Software testing has progressed through five major paradigms (Gelperin & Hetzel, 1988): the
debugging, demonstration, destruction, evaluation and prevention periods, as outlined by a
number of authors. During its development, software testing has focused on two separate issues,
verification (static testing) and validation (dynamic testing).
Verification, as defined by IEEE/ANSI (1983), is the process of evaluating a system or
component to determine whether the products of a given development phase satisfy the
conditions imposed at the start of that phase. It is the process of evaluating, reviewing, inspecting,
and doing desk checks of work products such as requirement specifications, design specifications
and code. In this case code means the static analysis of the code - a code review - not the dynamic
execution of the code. Verification thus tries to answer the question: Have we built the system
right?
13

Validation, as defined by IEEFl ANSI (1983), is the process of evaluating a system or component
during or at the end of the development process to determine whether it satisfies specified
requirements. It normally involves the execution of actual software on a computer and usually
exposes any defects. Validation then boils down to the question: Have we built the right system?
Verification and validation are complementary (Kit, 1995). The effectiveness of defect detection
suffers if one or the other is not done. Each of them provides filters that are designed to expose
different kinds of problems in the product. Historically testing has been, and continues to be,
largely validation-orientated in the sense that it is mainly concerned with dynamic execution in
comparison with specified (expected) results, although static testing (discussed later) can be seen
as part of verification .. It is not that we should stop doing validation, but we want to be much
cleverer about how we do it, and how we do it in combination with verification. We must also
ensure that we do each of them at the right time on the right work products.
In practice, the software development methodologies typically employ a combination of several
software testing methods, techniques and tools. That there is no "silver bullet" testing approach
and that no single technique alone is satisfactory has been pointed out by many leading
researchers such as (Hamlet, 1988; Musa & Ackerman, 1989; Parnas, Schouwen & K wan, 1988).
The need to combine testing techniques is further visible when we consider the primary
characteristics of each approach and find that each testing strategy addresses only a narrow set
of concerns.
From this viewpoint, a framework is presented in this chapter for the classification of testing
techniques. It is applied to the evaluation of testing techniques, the currently available testing
tools and testing strategies. The framework for surveying software testing techniques is briefly
given in Section 2.2. According to this framework, a classification scheme of software testing
techniques is presented in Section 2.3. Section 2.4 surveys the currently available tools for
supporting these techniques, particularly in test data generators. Software testing strategies are
discussed in Section 2.5. Based on this framework, statistical testing techniques will be discussed
14

in Section 2.6. This done, in Section 2.7 I propose an approach that fits into the above framework
for testing distributed software systems. Concluding remarks are made in Section 2.8. This
organization is shown in Figure 2.1.
S.2 A Framework for Technique Surveying software t-----'~ Testing Techniques
Fault
S.3 f Report 0 Evaluati
Classification on ~
Scheme
" ,~
finding SUPisrt Tools Too s
S.4 Software Testing
Tools
S.5
Key:
Software Testing
Strategy
S.2 refers Section 2.2 S.3 refers Section 2.3 S.4 refers Section 2.4 S.5 refers Section 2.5
Figure 2.1: The organization of Surveying of Software Testing Technology
2.2 A Framework For Surveying Software Testing Techniques
An agreed standard for classifying testing techniques would allow testers to compare and
evaluate testing techniques more easily when attempting to choose the testing strategy for the
software development. The software testing techniques that have been developed can be
classified according to the following viewpoints:
• Does the technique require us to execute the software? If so, the technique is dynamic testing;
if not, the technique is static testing.
• Does the technique require examining the source code in dynamic testing? If so, the technique
is white-box testing; if not, the technique is black-box testing.
• Does the technique require examining the syntax of the source in static testing? If so, the
technique is syntactic testing; if not, the technique is semantic testing.
• How does the technique select the test data? Test data is selected depending on whether the
technique refers to the function or the structure of the software, leading respectively to
functional testing and structural testing, whereas test data is randomly selected according to
the operational distribution for the software with respect to random testing.
15

• What type of test data does the technique generate? In deterministic testing, test data are
predetermined by a selecti ve choice according to certain criteria. In contrast to this, in random
testing, test data are generated according to a defined probability distribution on the input
domain.
With reference to this classification, work on the evaluation of software testing techniques can
be done in correspondence with two major testing issues as shown:
• When should testing stop? The exit criterion can be based on a reliability measure in the case
when the test data have been selected by random testing, whereas a test data adequacy criterion
for determining whether or not a test set is sufficient for deterministic testing.
• How good is the software after testing? The definition of software reliability measures with
a failure rate can be applied to test software with discrete or continuous test data (DeMilIo,
McCracken, Martin & Passafiume, 1987). Test data adequacy criteria are measures of the
quality of testing. From this viewpoint, the classification of test adequate criteria can be
divided into fault-based testing and error-based testing (Zhu, Hall & May, 1994). Fault-based
testing focuses on the detection of faults in the software, whereas error based testing requires
test cases to check the program on certain error-prone points identified by the empirical
knowledge about software errors. However, as this is the most important aspect of test quality,
there are many experimental works to measure it including reliability metrics, mutation
analysis and the expected number of failures detected.
A framework for surveying software testing techniques based on the above classification and
evaluation is shown in Figure 2.2.
16
>
l' I I I
I
I I

No
How does the technique select the test data?
What the type of the test data does the technique generate?
Yes
-_C.~~s!f!~a.~o.n ____ -__ -__________ t ----------------------t ------------Evaluation
When should testing stop?
How good the software is after testing?
Exit Criterion (reliability model)
Test Quality Measurement
Adequacy Criterion (control flow, data flow, ... )
Figure 2.2: A framework for surveying software testing techniques
17

2.3 A Classification Scheme for Testing Techniques
According to the framework for surveying software testing techniques, we present a
classification scheme of software testing techniques. The purpose of this classification scheme
is to allow us to identify the strengths and weaknesses of current software testing techniques. This
will provide the information for selecting the testing strategy in the development of applications.
In addressing the two major testing issues, that is when should testing stop and how good is the
software after testing, a Data Flow Diagram (DFD) depicting the classification scheme is shown
in Figure 2.3; the circles in the diagram correspond to the tasks that will be identified in the
following sub-sections.
Techniques under
Evaluation
Qyn;unic Testing
1-------. Deterministic Testing
Figure 2.3: A classification scheme for software testing techniques
2.3.1 The Classification of Software Testing Techniques
Software Testing Strategy
Historically there have emerged different classifications of testing techniques. Existing software
testing techniques are divided into two categories: static and dynamic testing (QuId & Unwin,
1986; Roper, 1994). Static techniques were those that examined the software without executing
it and encompassed activities such as inspection, symbolic execution and verification. Dynamic
techniques are those that examined the software with a view to generating test data for execution
by the software.
Static testing
Static testing techniques are concerned with the analysis and checking of system representations
such as the requirements documents, design diagrams and the program source code without
18

actually executing the code (Sommerville, 1996). During static testing, specifications are
compared with each other to verify that errors have not been introduced during the process. In
comparison to dynamic testing, static testing does not require input distributions, since they do
not require that the software be executed. This is convenient when the input distributions are not
known. However, since input distributions are not known to the techniques, static testing
techniques cannot take advantage of this knowledge. Static testing techniques can be classed
according to whether or not the technique requires examination of the syntax of the source code.
If so, the technique is syntactic testing; if not, the technique is semantic testing.
Syntactic testing may include reviews and walk-throughs (Vliet, 1994) held by a design team
to check that the refinements of accepted requirements are proceeding as desired through each
transformation stage. However, the informal nature of such reviews and walk-throughs leaves
some doubts about their overall effectiveness and their repeatability (Humphrey, 1989).
Unlike informal reviews and walk-throughs, a software inspection is a formal evaluation of the
work items of a software product. The technique was originally devised by Fagan at IDM (Fagan,
1976) and has proved to be an effective technique for the design, code and test phases. A software
inspection is led by an independent moderator with the intended purposes of effectively and
efficiently finding defects early in the development process, recording these defects as a basis
for analysis and history and initiating re-work to correct such defects. Re-worked items are
subsequently re-inspected to ensure their quality. Software developers can literally remove a part
from the development line, re-work it at the most appropriate time in the process and replace it
in the development line. Therefore, inspections ensure that a high level of quality is delivered to
the testers and ultimately to the users of a software product.
Semantic testing includes formal methods such as proof of correctness. Proof of correctness
(DeMilIo, Lipton & Perlis, 1979; Vliet, 1994) is a mathematical method of verifying the logic
or function of a program or program segment. In order to be able to do so, the specification must
be expressed formally as well. We achieve this by expressing the specification in terms of two
19

sets of assertions which come before and after the program's execution, respectively. Next, we
prove that the software transfonns one set of assertions, the pre--conditions, into the other, the
post-conditions. As it is the most labour-intensive validation and verification method, it offers
a consistent and reputable approach. Refined specification or design can sometimes be proven
correct and probably defect-free against higher level specification or design.
Dynamic testing
Dynamic testing techniques are generally divided into two categories - black-box and
white-box testing (Beizer, 1995; Sommerville, 1996), which correspond with two different
starting points for software testing: the internal structure of the software and the requirements
specification. They involve the execution of a piece of software with test data and a comparison
of the results with the expected output which must satisfy the users' requirements. The process
of dynamic testing is shown in Figure 2.4.
Specification ....;----. (Black-box) .----. instrumentation
(White-box)
Test Data Generation
generate -.
...------'
input
Specification Expected Result ....;----. '-----. Generation
I generate '------.
Figure 2.4: The process of dynamic testing
Compare and
Analyze
IL....---. SuccesslFailure
Black-box testing uses a 'toaster mentality': You plug it in, it is supposed to work. Created input
data is designed to generate variations of outputs without regard to how the logic actually
functions. The results are predicted and compared to the actual results to determine the success
20

of the test. In contrast to this, white-box testing opens up the 'box' and looks at the specific logic
of the application to verify how it works. Tests use logic specifications to generate variations of
processing and to predict the resulting outputs. Intermediate and final output results can be
predicted and validated using white-box testing. Other terms have been introduced over the years
and now the black-box testing method is sometimes called "functional" or
"specification-based" while white-box testing method may be referred to as "structural" or
"code-based" or even "glass-box" (Roper, 1994).
It is important to examine why this distinction appeared. Black-box testing is frequently a vague
formalization of good testing practice. Its drawback is that without examining the code in some
way you do not know how much of it is being tested. Black-box testing is typically used to check
if the product conforms to its specification. But what if there is something in the product that does
not meet the specification? What if the software performs some undesirable task that the
black-box inputs have not detected? This is where the white-box techniques come in. They allow
you to examine the code in detail and be confident that at least you have achieved a level of test
coverage, for example, the execution of every statement. White-box testing is in itself
insufficient since the software under examination may not perform one of its desired tasks the
function to do this may even be missing and the examination of the code is unlikely to reveal this.
The objective perspective of black-box testing is needed to be able to spot such missing
functionality.
2.3.2 Test Data Selection
Dynamic testing involves selecting input test data, executing the software on that data and
comparing the results to some test oracle, which determines whether the results are correct or
erroneous. To be sure of the certainty of the validity of software through dynamic testing, ideally
we should try the software on the entire input domain. In fact, due to the intrinsically
discontinuous nature of software, given an observation on any point of the input domain, we
cannot infer any property for other points in the input domain. However, excluding trivial cases,
the input domain is usually too large for exhaustive testing to be practical. Instead, the usual
procedure is to select a relatively small subset termed a "subdomain", which is in some sense
21

representative of the entire input domain. From this limited number of test runs, we then infer
the behaviour of software for the entire input domain. Therefore, dynamic testing corresponds
to sampling a certain number of executions of a program from amongst all its possible executions,
by sampling a number of input data within the input domain. Ideally, the test data should be
chosen so that executing the software on these samples will uncover all errors, thus guaranteeing
that any software which produces correct results for the test data will produce correct results for
any data in the input domain. However, discovering such an ideal set of test data is in general an
impossible task (Rapps & Weyuker, 1985; Bertolino, 1991). The identification of a suitable
sampling strategy is known as the test data selection problem. The model of test data selection
is shown in Figure 2.5.
Input Domain .. - - - - - - Functional Specification
~-----.. sampling
I--~""=""-
~strate
r-----..
Test Data
Selection
: instrumentation input
...-------' Structural Output Domain
output
Figure 2.5: The basic model of test data selection
In general, however, the samples formed may not be all disjoint, and hence they are not true
partitions in the fonnal mathematical sense. Figure 2.5 also shows a software system as a mapping
of an input to an output set. The software responds to the inputs by producing an output or a set
of outputs. Some of the inputs (shown in the shaded circle in Figure 2.5) cause system failures
where erroneous outputs are generated by the software.

There are three basic strategies for selecting test data which are used to make the distinctions in
Figure 2.2 (Bertolino, 1991):
(1) Functional testing: essentially, test data is selected according to the reference functional
specification.
(2) Random testing: essentially, test data is selected according to the way in which the software
is operated. (In fact, the input domain is generally partitioned according to the expected use of
software).
(3) Structural testing: essentially, test data is selected according to the reference structural
specification.
The first two strategies are both referred to as black-box testing and the third as white-box
testing. A variety of testing techniques fall within each of the above basic strategies. When the
focus of dynamic testing is fault removal, that is, fault-finding rather than reliability assessment,
the tester is faced with the problem of selecting a subset of the input domain that is suitable for
revealing the actual but unknown faults. The methods for generating test inputs then proceed
according to one of two principles: either deterministic or probabilistic (Laprie, 1995;
Thevenod-Fosse & Waeselynck, 1991).
Deterministic testing
Deterministic methods for generating test inputs usually take advantage of information on the
target software in order to provide guides for selecting test cases, the information being depicted
by means of test criteria (Thevenod-Fosse, Waeselynck & Crouzet, 1995) that relate either to a
model of the program structure or a model of its functionally. In both cases, any criterion specifies
a set of elements to be exercised during testing. For example, for procedural programs, the
program control flow graph is a well-known structural model and branch testing is a classical
example of a test criterion associated with this model (Th6venod-Fosse & Waeselynck, 1996).
Both functional and structural testing strategies use systematic means to determine subdomains.
23

They often use specific inputs to test peculiar cases. Given a criterion, the type of test input
generation is detenninistic: input test sets are built by selecting one element from each subdomain
involved in the set proper to the adopted criterion. This approach to the selection of test data is
commonly referred to as partition testing (Duran & Ntafos, 1984; Hamlet & Taylor, 1990;
Weyuker & Jeng, 1991). In fact, most of the testing strategies subdivide the input domain into
overlapping subdomains and thus do not form a true partition of the input domain, so the term
subdomain-based testing or simply subdomain testing was suggested by a number of authors
(Frankl & Weyuker, 1993; Chen &Yu, 1996). However, their intention is to provoke failure
behaviour, and success hinges on the assumption that we can identify failuresubdomains with
a high probability. Though this is a good strategy for fault detection, it does not necessarily inspire
confidence (Vliet, 1996).
Random testing
Random testing strategy is the conventional probabilistic method for generating test inputs. In
contrast to the systematic approach of detenninistic testing, random testing simply requires test
cases to be randomly selected from the entire input domain. This is a probability distribution
describing the frequency with which different elements of the input domain are selected when
the software is in actual use. Test data generators for random testing function in a simplest way:
they pick random data from the input domain, according to a chosen distribution. Very often, the
operational distribution is assumed: very simply, the more frequently used input data are tried
more frequently. An advantage of using random testing is that quantitative estimates of the
software's operational reliability may be inferred. From another viewpoint, random testing can
be viewed as a degenerate form of subdomain testing in the sense that there is only one
"subdomain," the entire input domain. Thus, random testing does not bear the overheads of
subdividing the input domain and of keeping track of which subdomains have been tested or not
(Chen & Yu, 1994).
Statistical testing is based on an unusual definition of random testing (Thevenod-Fosse,
Waeselynck & Crouzet, 1995): it aims to provide a "balanced" coverage of a model of the target
software, no part of the model being seldom or never exercised during testing. With this approach,
24

the method for generating statistical test patterns combines information provided by a model of
the target software, that is, by a test criterion with a practical way of producing large sets of
patterns, that is, a random generation. The set of statistical test patterns are then defined by two
parameters, which have to be detennined according to the test criterion used. These are as
follows:
• The test profile or input distribution, from which the patterns are randomly drawn.
• The test size or equivalently the number of input patterns that are generated.
The major advantages of using the statistical method for software testing are (Curritt, Dyer &
Mills, 1986; Whittaker & Tomason, 1994): Firstly, testing can be perfonned based on the user's
actual utilization of the software, secondly, it allows the use of statistical inference techniques
to compute probabilistic aspects of the testing process and thirdly, in many applications, testing
can be completely automated from the generation of test data to analysis of test results.
2.3.3 Adequacy Criterion
We call a criterion used to detennine whether testing may tenninate, an adequacy criterion. Such
a criterion represents minimal standards for testing a program and as such measures how well the
testing process has been perfonned. The criterion should relate a test set to the program, the
specification or both. In addition, it could also relate the test set to the program's intended
environment or operational profile. We consider in this sub-section only dynamic testing. This
means that the program is run on one or more input test data and the outputs produced are
assessed. There are other ways of validating a software which do not involve running the software
on test cases including static analysis and fonnal verification, but our concern in this sub-section
is only with ways of assessing the adequacy of dynamic testing. (Beizer, 1990; Weyuker, 1986)
An example of an adequacy criterion is branch adequacy. If a program P is represented by a
flowchart, then a branch in an edge of flowchart. Test set T is branch adequate for P, provided
for every branch b of P, there is some t in T which causes b to be traversed. This is an example
of an adequacy criterion which is entirely program-based in the sense that it is independent of
the specification (except, of course, for comparing the results produced by the program for a
25
given input with the intended results as defined in the specification).
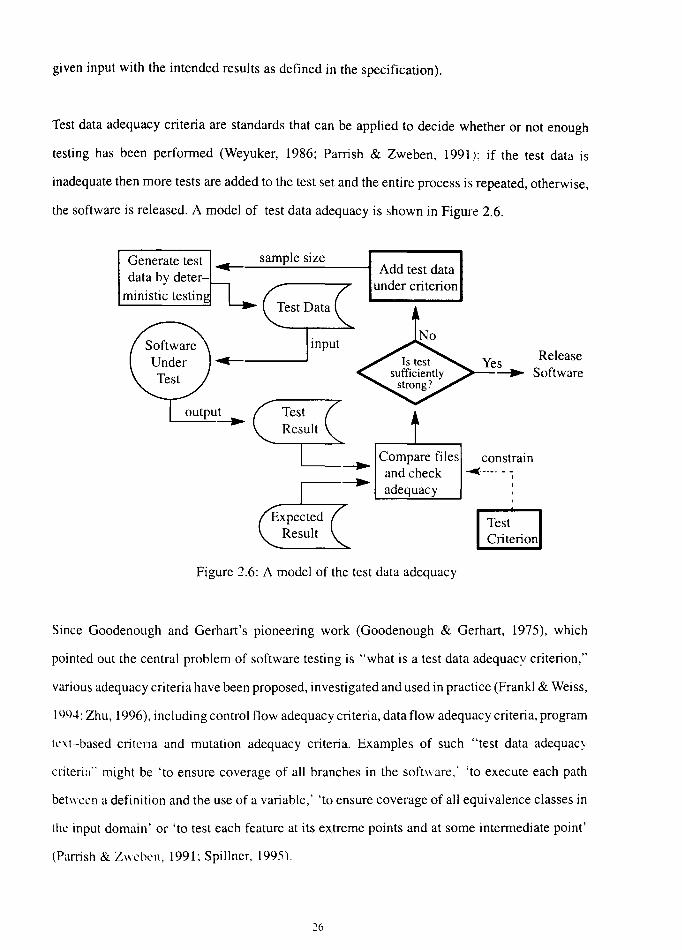
Test data adequacy criteria are standards that can be applied to decide whether or not enough
testing has been performed (Weyuker, 1986; Parrish & Zweben, 1991); if the test data is
inadequate then more tests are added to the test set and the entire process is repeated, otherwise,
the software is released. A model of test data adequacy is shown in Figure 2.6.
Generate test ..- sample size data by deter-
Add test data under criterion
ministic testin
..-------'
output L..-_...!...---'
Compare files --. and check .-----. adequacy
Figure 2.6: A model of the test data adequacy
constrain ~-.-. --
I
Release Software
Test Criterion
Since Goodenough and Gerhart's pioneering work (Goodenough & Gerhart, 1975), which
pointed out the central problem of software testing is "what is a test data adequacy criterion,"
various adequacy criteria have been proposed, investigated and used in practice (Frankl & Weiss,
1994; Zhu, 1996), including control flow adequacy criteria, data flow adequacy criteria, program
tnt-based critcria and mutation adequacy criteria. Examples of such "test data adequacy
criteria" might be 'to ensure coverage of all branches in the software,' 'to execute each path
betwccn a definition and the use of a variable,' 'to ensure coverage of all equivalence classes in
thc input domain' or 'to test each feature at its extreme points and at some intermediate point'
(Panish & Zwcbcn, 1991; Spillner, 1995).
26
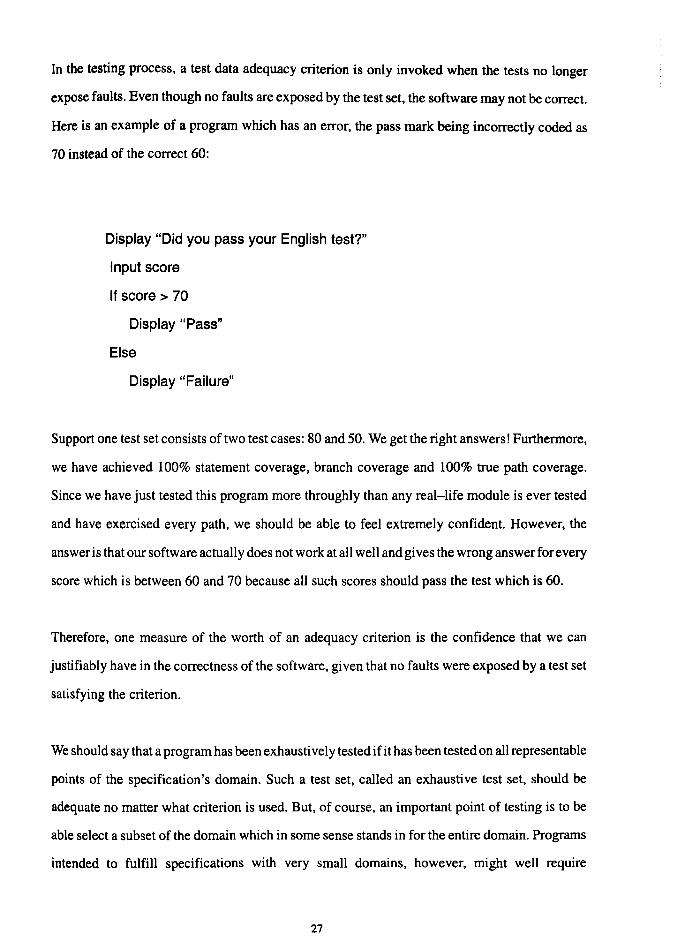
In the testing process, a test data adequacy criterion is only invoked when the tests no longer
expose faults. Even though no faults are exposed by the test set, the software may not be correct.
Here is an example of a program which has an error, the pass mark being incorrectly coded as
70 instead of the correct 60:
Display "Did you pass your English test?"
Input score
If score> 70
Display "Pass"
Else
Display "Failure"
Support one test set consists of two test cases: 80 and 50. We get the right answers! Furthermore,
we have achieved 100% statement coverage, branch coverage and 100% true path coverage.
Since we have just tested this program more throughly than any real-life module is ever tested
and have exercised every path, we should be able to feel extremely confident. However, the
answer is that our software actually does not work at all well and gi ves the wrong answer for every
score which is between 60 and 70 because all such scores should pass the test which is 60.
Therefore, one measure of the worth of an adequacy criterion is the confidence that we can
justifiably have in the correctness of the software, given that no faults were exposed by a test set
satisfying the criterion.
We should say that a program has been exhausti vely tested if it has been tested on all representable
points of the specification's domain. Such a test set, called an exhaustive test set, should be
adequate no matter what criterion is used. But, of course, an important point of testing is to be
able select a subset of the domain which in some sense stands in for the entire domain. Programs
intended to fulfill specifications with very small domains, however, might well require
27

exhaustive testing using any reasonable criterion. In fact one only needs to be able to do
non-exhaustive testing when the domain is large. Thus, although a criterion may well require
exhaustive testing in some cases, one which always requires exhaustive testing is unacceptable.
Therefore, an adequacy criterion tells us whether or not it is reasonable to tenninate testing with
a non-exhaustive test set. However, it is hard to get the adequacy criterion. For example, the
branch adequacy, if a program has un-executable branches then no amount of testing can cause
every branch to be exercised. Therefore, when we find out that a given test set exercised 80
percent of the branches, we do not know whether we should continue trying to find test cases to
exercise the remaining 20 percent of the branches or stop testing because 100 percent of the
executable branches have been exercised.
2.3.4 Exit Criterion
Random testing is a software testing process in which the objective is to measure the reliability
of the software rather than to discover software faults. The user of a system is interested in the
probability of failure-free behaviour. Following this line of thought, random testing which has
a high fault-revealing power provides a method for detennining test data sets, in spite of a
doubtful link between the adopted criterion and the actual faults (Vliet, 1994; Marre,
Thevenod-Fosse, Waeselynck, Gall & Crouzet, 1995). Exercising each subdomain defined from
an imperfect criterion only once is far from being enough to provide an efficient test set. An
obvious improvement consists in exercising each subdomain several times. In the other words,
the execution of a large number of test cases that represent typical usage scenarios is required.
The exit criterion which is defined as an adequacy criterion for statistical testing in this thesis
shown in Figure 2.7 can be based on a reliability measure when the test set has been selected
randomly from an appropriate probability distribution over the input domain.
28

Generate test data by
random testin
sample size ~------~------~ Increase 11 by
reliability mode
No
Compare and
Analyze
Figure 2.7: A model of the test data adequacy
The basic procedure shown is
Release Software
Repair Activity
• to determine the size 11 of the test set and select test cases from an input distribution,
• to execute the software under test,
• to record the amount of execution time between failure (Musa & Ackerman, 1989) or estimate
the defective rate of the output population (Cho, 1988),
• to continue testing until the selected model shows that the required failure-intensity level has
been met to the desired level of confidence like "we can accept the testing to say with 9S0(
confidence that the probability of 1,000 CPU hours of failure-free operation in a
probabilistieally defined environment is at least 0.995."
2.3.5 Test Quality Measurement
Software reliability measures
A number of software reliability measures have been defined and used in software reliability
analysis (DeMilio, McCracken. MUltin & Passafiume, 1987). Testing a piece of software is
equivalent to finding the failure rate of the product unit population generated by the software.
29

The failure rate is defined as the ratio of the number of product units that are defective to the total
number of product units that the software has generated. The total number of product units.
denoted by N, of any non-trivial piece of software ranges from extremely large to infinite. but
can still be treated as an object of statistical interest. Although impossible in practice. it can be
conceptually assumed that all N units have been produced and analyzed. Each of them can be
classified as defective or non-defective. If there are D units that are defective. then the product
unit population failure rate. denoted bye, is e = DIN. Since it is impossible to obtain all N units.
the best approach is to estimate by means of statistical sampling. This definition is applicable
to conventional batch processing environments and real-time systems dealing with discrete
operations. For real-time systems dealing with continuous streams of data, a more realistic index
is mean time between failures (MTBF) or mean time to failure (MTTF). It is expressed as MTBF
= tlF where t is the predetermined total running time and F is the total number of failures in the
interval [O,t]. The failure rate is then J..I. = lIMTBF. In software systems. components do not wear
out and after a single failure usually remain operational. Therefore. MTBF or MTTF are only
useful in software reliability assessment when the system is stable and no changes are being made
to it. In this case, it provides an indication of how long the software will remain operational before
a failure occurs.
Test data adequacy criteria as continuous measures
Test data adequacy criteria are measures of the quality of testing. that is, they measure the ability
of a test set to reveal a particular feature of software. Hence. a degree of adequacy is associated
with each test set. Indeed. the coverage of code as a percentage is often used as an adequacy
measure. Therefore. test sets are not simply classified as good or bad. Thus. an adequacy criterion
C can be formally defined to be a function C from a program p. a specification s and a test set
t to a real number, the degree of adequacy (Zhu. Hall & May. 1994). The greater the real number
is the more adequate the testing.
Test adequacy criteria is divided into fault-based testing and error-based testing by the
underlying testing approach. Testing is fault-based when it seeks to demonstrate that prescribed
faults are not in a software and focuses on the detection of faults in the software. An adequacy
30

criterion of this approach is some measure of the ability of test sets to detect the faults in the
software. Error-based testing requires test cases to check the program on certain error-prone
points identified by the testers' previous empirical knowledge about software errors. This
classification is not always easy to make, however, for example mutation testing.
Experimental works
Basili and Selby (Basili & Selby, 1987) looked at code reading by stepwise abstraction (static
testing), functional testing using equivalence partitioning and boundary value analysis
(black-box testing) and statement testing (white-box testing) in three aspects of software
testing-fault detection effectiveness, fault detection cost and classes of faults detected. They
found that, among the professional programmers, code reading detected more faults and had a
higher fault detection rate than both functional and statement testing. Functional testing
discovered more faults than statement testing, but the detection rate was the same. Among the
less-experienced programmers, in one group statement testing was outperformed by the other
techniques, and in the other group no difference was found. Code reading detected more interface
faults and functional testing detected more control faults.
The efficiency of deterministic and random testing methods has been exemplified by
experimental work performed on a program which is a piece of a software from the nuclear field
using mutation analysis (Marre, Thevenod-Fosse, Waeselynck, Gall & Crouzet, 1995). Mutation
analysis (DeMilIo, Lipton & Perlis, 1979) is a technique for the measurement of test data
adequacy. In practice, a tester interacts with an automated mutation system to determine the
adequacy of the current set of test data and to improve that test data. This forces the tester to test
for specific types of faults. These faults are represented by a set of simple syntactic changes to
the test program. These changed programs are mutants of the original and a mutant is killed by
distinguishing the output of the mutant from that of the original program. High mutation scores
were observed in this work. In fact, deterministic test sets left alive only two of the entire set of
1345 mutants and random test sets killed all of them.
Although the detection of more failures does not always help us identify more faults, in practice
31

it is often desirable to reveal as many failures as possible. Intuitively, the more failures the testing
reveals, the more information we are likely to get about the faults and the higher the chance of
detecting more faults. From this point of view, a best or most effective testing strategy is one
which results in a test suit that can discover as many failures in the program execution as possible.
However, we believe that there is probabl y no single "best" measure. Whichever one is the most
appropriate to use depends very much on the purpose of the testing. Different measures based
on different intuitions should complement each other to provide a more comprehensive
understanding of deterministic and random testing.
2.4 Software Testing Tools
Software testing is inherently an extremely difficult task. Exhaustive testing entails two
elements' repetition and tedium, which can discourage human operators and make them prone
to mistakes. Testing techniques lead to methods that cannot be implemented manually except by
consuming labour hours. The labour hours now given to software testing represent the single
most important target for improving productivity and reducing cost. Automated test tools
improve productivity by reducing cost through speed and accuracy.
2.4.1 Why Automated Software Testing
Software testing is a very time--consuming and tedious activity and therefore a very expensive
process. This accounts for over 30% of the cost of software system development (Myers, 1979;
Norman, 1993), because software testing requires numerous test data to demonstrate correctness
with a high probability. In addition to its high cost, manual testing is unpopular and often
inconsistently executed. If the testing process could be automated (Ince, 1987; Febguson &
Korel, 1996), the cost of developing software could be reduced significantly. Some of the key
benefits of automated testing are (Nair, Gulledge & Lingevitch, 1996):
• To save time: One of the main benefits of automating software testing is the time it saves.
Manual testing is an error prone, labour-intensive process that takes the same amount of time
with each iteration. Automated tests may take longer to create, but, once created, can be run
without human intervention. Hierarchical test suites allow modularized tests that can be
32

adapted to different environments. Automated tests also makes regression testing a lot easier,
thereby preventing unintentional feature defects caused by fixing existing defects.
• To save money: Most products require multiple iterations of a test suite. For that reason,
automated testing can lead to significant cost savings. In fact, a company typically passes the
break-even point in labour costs after two or three iterations of an automated test suite.
Because automated testing has low labour costs, companies can afford to test more frequently,
resulting in improved software qUality. In addition, automated tests can run at night on
machines used for development during the day, thus helping to reduce hardware costs as well
as labour costs.
• To produce results faster: Automated tests also produce results faster than manual tests
because: Firstly, in general, computers work faster than humans, secondly, fatigue is not a
factor, computers can run 24 hours and thirdly, developers can divide a test suite among
multiple computers and run them in parallel. As a result a complex test suite may take one or
two days instead of three to four weeks to run.
• To eliminate human error: Finally, automated testing helps eliminate human error. A human
tester may inadvertentl y skip items or may not notice that the result of an action differs in some
way from the expected result. An automated test does not make such errors - it runs exactly
the same every time. However, this does not apply to distributed software, as a result of the
existence of non-deterministic behaviour.
2.4.2 Taxonomy of Software Testing Tools
One reason for the current interest in software testing is the support from CAST (Computer Aided
Software Testing) tools that has been developing rapidly in the past few years (Graham &
Herzlich, 1993). One of the difficulties which faces anyone trying to understand CAST is the lack
of a standard terminology and taxonomy of products. A number of tool classification schemes
have been presented (Ramamoorthy & Ho, 1975; DeMilIo, McCracken, Martin & Passafiume,
1987; Graham & Herzlich, 1993), but not have been entirely successful (Norman, 1993) because
there is no clear distinction between tools that actually test and tools that support the test effort.
What one ends up with is a shallow non-hierarchy (one tool may belong to several categories)
33

with many classes on the top level, without clear and intuitively satisfying distinctions between
them. As a result of this view, Norman (Nonnan, 1993) presents just the top two levels of a
taxonomy for CAST, with a sketch of how a third level may be developed for the dynamic testing
tools. There are four basic types of CAST tools: static, dynamic, test management and utilities.
These are grouped into two categories: firstly the fault finding tools and secondly the support
tools. These types are as shown in Figure 2.8 and are defined as follows:
Support tools
Figure 2.8: Taxonomy of CAST tools
• Static tools analyze the source code of the program. Typical output from static tools include
complexity measurement, redundant code analysis, structured design analysis and flow
graphs, automatic fault finding and automatic test case generation.
• Dynamic tools achieve their results by actually running the Application Under Test (AUT).
Dynamic tools inspect real output from the AUT; for example, screens, reports, database
records or 110 activity. Typical output from dynamic tools includes: difference reports,
perfonnance reports and test run log file.
• Test management tools assist in the management of the test process. Typical output from test
management tools include: quality and reliability statistics, defect tracking,
time-to-completion estimates, new test plans and new test data and test cycle reports.
• "Other utilities" is a catch-all category for software which does not perfonn or manage testing
but which in some way aids the test process. For example, perfonnance coverage analysers
provide the tester with data showing how thoroughly a test cycle has exercised the AUT and
also suggest ways of improving the test plan.
34

2.4.3 Test Data Generators
Of the problems involved in testing software, one is of particular relevance here: the problem of
developing test data. Test data generation in software testing is the process of identifying
program input data which satisfy selected testing criterion. A test data generator is a tool which
assists a user in the generation of test data for a software. There are several types of test data
generators (Roper, 1994; Ferguson & Korel, 1996): path wise, specification~riented and random
test data generators.
Path wise test data generators
The basic idea of the pathwise test data generator is to select input data from the input domain
associated with program paths in order to satisfy a selected testing criterion such as statement
coverage or branch coverage. Its basic operation consists of four main steps (DeMilio,
McCracken, Martin & Passafiume, 1987; Ferguson, 1993):
(1) Program digraph construction. The source program is pre-processed to create a digraph
representation of the control flow in the program. This digraph is a flow graph which consists
of nodes representing decisions and edges showing flow of control.
(2) Path selection. Path selection is concerned with selecting program paths (automatically or by
the user) that satisfy a testing criterion such as total path coverage, statement coverage and branch
coverage. In these criteria, either every feasible path, every statement or every branch statement
must be executed at least once.
(3) Symbolic execution. Once a path is selected, symbolic execution ( Ramamoorthy, Ho &
Chen, 1976) is used to generate path constraints which consist of a set of equalities and
inequalities on the program's input variables such that input data satisfying these constraints will
result in the execution of that path.
(4) Test data generation. This step involves selecting test data that will cause the execution of
selected paths. Most systems use linear programming algorithms to find a numerical solution to
35

the inequalities of path constraints.
The primary differences among these types of systems are in the techniques of test path selection
and in early detection of infeasible test paths. Other differences include the breadth of their
symbolic execution capability and capacity for the symbolic simplification of algebraic
expressions. The weakness associated with the pathwise test data generator is the significant
computational effort wasted in analyzing infeasible paths, loop and array reference problems in
symbolic execution.
Specification-oriented test data generators
These systems generate test data from a data specification language describing the input data. The
user (tester) writes a description of the input data of the software under test and then quantities
of test data conforming to this description are generated.
One example of this approach (Roper, 1994) is systems that take as their input grammatical
descriptions of a language and generate programs from this description in order to test compilers.
Another example (Lyons, 1977) is the automatic data generating program (ADG).1t is a compiler
which translates the ADG code, an English-like language, describing the characteristics of a data
file into a PLll program which will generate the specified data file.
GENTEXTS (DeMillo, McCracken, Martin & Passafiume, 1987) is another system with a
similar basic operation. It is designed to prepare test programs for compiler testing. Its data
specification language is in the form of command grammars describing the desired test programs.
The system processes the grammar to generate SIMULA programs which are then compiled and
executed to generate the actual test programs.
Less sophisticated systems are those that generate test data from descriptions of input files. One
drawback of using such an approach in isolation is that large quantities of test data might be
generated which only exercise a small percentage of the code.
36

Random test data generators
Test data for each input to the program are generated randomly according to different profiles.
One approach is to distribute the data over the different path domains in the program, another is
to distribute data according to a user profile (if it is available), thus simulating the likely usage
of the software (Roper, 1994).
There are a number of advantages associated with random testing (Ince, 1987; Duran & Ntafos,
1984). Firstly, large sets of test patterns can be generated cheaply, that is, without requiring any
preliminary analysis of the software. It only requires a random number generator and a small
amount of support software. Secondly, it is straightforward to derive estimates of the operational
reliability from random testing results. Thirdly, the use of random numbers is more stressing to
software than manual test cases. For this reason it is very useful to employ random test data during
the stress testing component of system and acceptance testing.
There are also disadvantages. Firstly, there is no assurance that full coverage can be attained. For
example, random inputs may never exercise large sections of the program code which require
equality between variables to be stable. Secondly, it can be expensive in terms of human
resources. It may mean examining the output from thousands of tests.
2.4.4 Testing Tools with Capture/Playback Paradigm
Test execution is a process of feeding test input data to the application and collecting information
to determine the correctness of the test run. It is natural to assume that automating test execution
must involve the use of a test execution tool which requires an environment to run it, to accept
inputs and to produce outputs (Fewster & Graham, 1998). Some tools require additional
special-purpose hardware as part of their environment; some require the presence of a software
development language environment.
For a sequential software, this process can be accomplished without difficulty. Many testers do
not have strong programming skills. This combined with the repetitive nature of much testing,
leads people to use capture/playback techniques and tools. Beizer (1997) illustrates the essence
37

with his first capture/playback tool, a teletype with a paper tape reader and punch, as follows.
1. The capture phase: When we key-in a test case with the punch turned on, the teletype captures
all incoming and outgoing characters and puts them on the tape.
2. The playback phase: Then we place the tape into the reader (it is clever enough to distinguish
incoming from outgoing characters) and set it to output the appropriate characters: the punch is
also turned on for this phase.
3. The compare phase: We then hold the two tapes to the light and see which, if any, holes differ.
If they all match, the test has been passed. If not, there is a discrepancy to be explained.
All capture/playback tools are an elaboration and more modern implementation of these simple
ideas. Although simplistic, the importance and impact of capture/playback should not be
under-estimated. These tools are often the first test tool a tester may see and are also the primary
means by which the test process is migrated from a purely manual process to a mostly automated
process.
Indeed there are many tools that allow test scripts to be recorded and then played back, using
screen captures for verification. However, there are some inherent problems with the
capture/playback paradigm (Zallar, 1997; Pettichord, 1996): Firstly, test automation is only
applied at the final stage of testing when it is most expensive to go back and correct the problem.
Secondly, the testers do not get an opportunity to create test scripts until the application is finished
and turned over and thirdly, the problem that always crops up is that application modifications
are made, invalidating the screen captures and then the interface controls change, making
playback fail. Moreover, for distributed applications, some test scripts can be very hard to
capture/playback automatically (Quinn and Sitaram, 1996): Firstly, the communication
mechanism between clients and servers uses technology like an RPC protocol that current
capture/playback tools cannot effectively capture. Secondly, simulation and thirdly, there are
38

non-detenninistic behaviours in a distributed application. Repeated executions of a distributed
application with the same test script may execute different paths and produce different results.
This is called the non-reproducible problem. Therefore, some mechanisms are required in order
to exercise these test scripts.
2.S Software Testing Strategy
2.5.1 Comparison of Software Testing Techniques
Static versus dynamic
Experimental evaluation of code inspections and code walkthroughs has found these static testing
techniques to be very effective in finding 30% to 70% of logic design and coding errors in a
typical software (Demilio, McCracken, Martin & Passafiume, 1987; Fagan, 1986). Mills et al.
(Mills, Dyer & Linger, 1987) suggest that a more formal approach, using mathematical
verification, can detect more than 90% of the errors in a program. Gilb and Graham (1993) also
found that static testing was more effective and less expensive than dynamic testing in
discovering software faults.
Lauterbach and Randall (1989) compared branch testing, functional testing, random testing and
some static analysis techniques including code reviews. On average, code reviews were found
to be the most effective, but in many instances were out-performed by branch testing. Of the
testing techniques, the highest coverage level was achieved by branch coverage.
Proof of correctness (DeMillo, Lipton & Pedis, 1979), a static-semantic testing (Chu, 1997) and
the most complete static technique (Vliet, 1994), is a mathematical method of verifying the logic
or function of a program or program segment. The use of formal specifications allows detection
of errors and inconsistencies early during the software development process, however, the
program will be executed on a hardware that may fail, will use an operating system that no one
expects to be expects to be error free and will be compiled using a compiler that has been
39

developed traditionally (HOrcher & Peleska, 1995). Therefore, the dynamic testing will still be
needed.
Black-box versus white-box
Poston (1996) applied both white-box and black-box testing to the famous Myers Triangle
Problem (Myers, 1979) to show how each kind of testing operates and the results that each
produces. The Myers Triangle problem is the testing of the following program:
The program reads three integer values from a card. The three values are interpreted as
representing the lengths of the sides of triangle. The program prints a message that states whether
the triangle is scalene, isosceles, or equilateral.
There were two reasons for them to select this problem: Firstly although it is small and simple
to understand but it is rich in testing complexity; secondly the lessons learned from testing the
sample Myers Triangle software can be generalized and scaled up.
They first performed both kinds of testing manually and then performed black-box testing using
tools. For both kinds of testing they manually evaluated test quality (TQ), which has three
determinants: requirement coverage (RC), defect coverage (DC) and code coverage (CC).
Experimental results from Poston (poston, 1996) were:
1. The white-box testing approach produced test cases that exercised or covered 100 percent of
the statements, branches and control flow paths in the code. Therefore TQ in terms of code
coverage was high. However, those test cases did not find four defects in the code, so TQ in terms
of defect or failure detection was low. In addition, the example showed that white-box testing
did not address the requirements, so TQ in terms of the requirements coverage was unknown.
2. The black-box testing approach produced test cases that exercised 100 percent of the
requirements and probed large samplings of the input domain and output range. TQ relative to
requirements coverage was high. When the black-box test cases were exercised, they caused the
40

execution of 100 percent of the statements, branches and control flow paths in the code.
Therefore, TQ relative to code coverage was high. In addition, the black-box test cases found
defects that were missed by the white-box test cases. TQ pertaining to defect detection was higher
with black-box testing than with white-box testing.
Deterministic versus random
Some empirical work on the comparison of deterministic and statistical (random) testing with
respect to the percentages of revealed faults was presented by Thevenod-Fosse and Waeselynck
(Thevenocl-Fosse & Waeselynck, 1991). For purposes of comparison, program faults were
divided into two classes, 'regular' faults and 'marginal' faults. More generally, regular faults are
those which lead to failure due to the incorrect behaviour of the software in respect of anyone
test criterion used to select test inputs, while the remainder are marginal. In the case of regular
faults, selected deterministic input data are appropriate for ensuring that they are uncovered while
random data provide only a high, but always less than 1, probability of revealing them. Hence,
it can reasonably be expected that statistical testing reveals a lower percentage of regular faults.
On the other hand, in the case of marginal faults, no data specifically aimed at revealing these
faults has been purposely included in the set of deterministic patterns. The probability of
revealing these faults is then an increasing function of the number of executions. Therefore,
statistical testing should reveal a higher percentage of marginal faults. Since a real limitation of
current test criteria is their lack of connection with the actual faults, most of the faults are likely
to be marginal. Hence, the fault revealing power of statistical testing should not be ignored.
2.5.2 Proposal Of Strategy
As shown in the previous Section (2.4.1) there are two points of view about the relative merits
of static versus dynamic testing. Some researchers have suggested that static testing techniques
should completely replace dynamic testing techniques in the verification and validation process
and that dynamic testing is unnecessary (Sommerville, 1996). However, static testing can only
check the correspondence between a program and its specification but it cannot demonstrate that
the software is operationally useful. Although static testing techniques are becoming more widely
used, dynamic testing is necessary for reliability assessment, performance analysis, user interface
validation and to check that the software requirements are what the user really wants. Today, if
41

we want to prevent all the faults that we can and expose those that we cannot prevent, we must
review, inspect, read, do walkthroughs and then test, that is, use static testing first and dynamic
testing later.
In current dynamic testing the strategies used are deterministic test data, random test data or both.
In practice, the choice of strategy is most often related to various factors such as available testing
tools, time limit, allocated budget, cultural background and usage. Since random testing makes
minimal use of the available knowledge about the software, one might expect it to be very
ineffective when compared with deterministic testing techniques. However, a number of
practitioners still propose the use of random testing, especially for the final testing of software.
The dynamic testing strategy advocated here combines deterministic and random testing. The
way to mix the two testing techniques is deduced from their complementary features, that is, to
use the deterministic testing techniques first for removing the more easily discovered faults and
to use the random testing techniques later for assessing the reliability of the reSUlting software.
The strategy proposal for software testing (Chu, 1997) is shown in Figure 2.9.
Improvement feedback ~- ----------------------------------. ----------------------
A A A I I I
_So_ft_wa;::. .--------, ~~f~~S __ J ! Static analysis
,-. ,--_fO_f _err_o_f_s_....J
Static
requirements t Static testing
techniques and tools
Faults:
Error-free software ----.
Dynamic analysis
for faults 1----' '--------' - .. - ..
Error- and fault-free software
I
Failures :
Adequacy
cfiterion t ----. Dynamic analysis - - - ~
1----' l..-_ti_O
_f
_faI_·I_ur_es_ ......
t Deterministic testing
techniques and tools
Confidence level Reliable software
Random testing
techniques and tools
Figure 2.9: The strategy proposal for software testing
42
An error is a mental mistake by a programmer or designer. It may result in textual problem with
the code called afault. Afailure occurs when a program computes an incorrect output for an input
in the domain of the specification. For example, a programmer may take an error in analysing
an algorithm. This may result in writing a code fault, say a reference to an incorrect variable.
When the program is executed it may fail for some inputs.
2.6 Statistical Software Testing
With a non-statistical approach, the determination of how much testing and in what order, is a
subjective decision based on the tester's experience and project schedules. However, it cannot
provide the user with a precise index in order to explain the quality of software. All one can do
is to ask when to stop testing a piece of software and how good the software is after testing.
Statistical software testing involves exercising a piece of software by supplying it with test data
that are randomly drawn according to a defined probability distribution on its input domain. It
provides a scientific basis for making inferences, from testing, about operational environment.
Therefore, if test data are randomly drawn from an input distribution representative of some
particular user profile, statistical testing becomes an experimental way to determine whether or
not a product meets its dependability requirements (Thevenod-Fosse & Waeselynck, 1991).
2.6.1 The Problem of Statistical Testing
Current statistical testing techniques involve exercising a piece of software by supplying it with
test data that are randomly drawn according to a single, unconditional probability distribution
on the software's input domain (Curritt, Dyer & Mills, 1986; Dyer, 1992; Thevenod-Fosse &
Waeselynck, 1991). This distribution represents the best estimate of the operational frequency
of use for each input. The main benefit of statistical testing is that it allows the use of statistical
inference to compute probabilistic aspects of the results of the testing process, such as reliability,
mean time to failure (MTTF) and mean time between failures (MTBF). However, these
techniques are insufficient for many types of software, because the probability of applying an
input can change when the software is executed (Deck, 1996; Whittaker & Tomason, 1994).
43

This had earlier been recognised by Cho (1988) presents the inverse concept. Each execution of
the software is considered equivalent to 'sampling' an output from the output population. The
goal of software testing is to find certain characteristics of the population such as the ratio of the
number of defective outputs in the population to the total number of outputs in the population.
It uses the number of executions of the software to assess the software reliability, which is
different from above mentioned measures which use the execution time. Gathering the data for
the error history of a piece of software requires a long period of time, and even then, the reliability
measure is often difficult to quantify. However, a piece of software is not subject to deterioration
such as wear, tear or burn, that is, the reliability of a piece of software is independent of time but
dependent on the frequency and nature of software usage. Cho (1988) gives the following
definition;:
Software reliability is 1 - e, the probability that the software perfonns successfully, according
to software requirements, independent of time.
where e is the defective rate of the software output population. This definition is a natural
consequence of following the principles of software engineering with statistical quality control.
From this point of view, detennining the defective or non-defective outputs from software
requires corresponding input data. The input domain is the source from which input data are
constructed for the software. If the input domain is not well defined, the input data will not be
properly constructed and will be of a poor quality.
Cho (1988) specifies the input domain of a software by means of a "Symbolic Input Attribute
Decomposition" (SIAD) tree, which is a syntatic structure representing the input domain of a
piece of software in a fonn that facilitates construction of random test data for producing random
output for quality inspection. The SIAD tree is a way to achieve clarity, conciseness,
completeness and measurability in the specification of input requirements. It enforces the
development of well-defined requirements, and imposes disciplines in both design and
implementation. Further details of the SIAD tree which is an important starting point for any
44

work are provided in Section 3.3.
From a fault forecasting point of view, a comparative analysis (Thevenod-Fosse & Waeselynck,
1991) concluded that the best evaluation is provided by Cho's approach, particularly when few
failures are observed during a test experiment.
2.6.2 FAST: A Framework for Automating Statistics-based Testing
In quality programming as introduced by Cho, the generation of test data can be automatically
achieved based on the SIAD tree, but it lacks a clear framework to tell us how to achieve
automated testing. To address this problem, we (Chu & Dobson, 1996; Chu, Dobson & Liu, 1997)
propose a Framework for Automating Statistics-based Testing (FAST), which is an extension
of the testing concept in quality programming to achieve automated testing. In FAST, we present
a "Symbolic Output Attribute Decomposition" (SOAD) tree, which is similar to the structure of
the SIAD tree, to represent the syntactic structure of product unit and product unit defectiveness.
Based on this tool, inspection of the product unit can be achieved automatically.
FAST, which is based on a statistical approach (random testing), has been proposed to help
develop good quality and cost effective software. It addresses the two major software testing
issues: when to stop testing and how good the software is after testing. FAST can automatically
generate test data with an iterative sampling process which determines the sample size n (exit
criterion); the software quality can be estimated with the inspection of test results which can be
automatically achieved and the product unit of population defect rate e which can be estimated
from the sample defect rate eO (test quality). The basis of this framework is the definitions of input
domain, of product unit and of product unit defectiveness by the SIAD/SOAD tree (forinspecting
product unit by static testing).
The major advantages of FAST are: firstly, testing can be completely automated, from the
generation of test data based on the SIAD tree to the inspection oftest results based on the SOAD
tree; secondly, changing distributions over the same input domain do not need to be
acknowledged since the SIAD tree is represented explicitly; thirdly, the software quality can be
45

assessed using statistical techniques (such as sampling or inference); fourthly, the test data do not
need to be stored for regression testing, because it only requires a small space to keep the random
number seeds; fifth, after the specification of requirements is developed, the generation of test
data is independent from the software design and implementation and finally, testing can be
performed based on the user's actual execution of the software.
2.7 Testing Of Distributed Software Systems
A distributed software is a set of sequential software units called tasks, modules or processes.
Since the processes of a distributed software must cooperate to achieve a common goal, processes
on different processors can execute in parallel and communicate with each other whether within
the same process or across processors (Singhal & Casavant, 1991; Umar, 1993). The status ofthis
interprocess communication provides an alternati ve, high-level view of the state of a distributed
software. The correctness of such interprocess communication depends on the contents and
sequence of messages transmitted between processes.
In recent years, considerable research efforts have been devoted to various aspects of distributed
software. These efforts have concentrated on the analysis, design, implementation and debugging
of distributed software. The area of testing distributed software, however, has received little
attention (Chow, 1980; Ferguson, 1993; Schwarz & Mattern, 1994; Shatz & Wang, 1987).
2.7.1 The problems of Testing Distributed Software Systems
Reproducible testing
The major problem in dynamic testing of distributed software (Shatz & Wang, 1988) is
reproducible software execution. To test software, we should prepare test cases to execute this
software. Reproducible testing capability is necessary for effective testing. If there is an error in
the execution, we need to replay the erroneous condition for locating the error. Repeated
executions of sequential deterministic software with the same input always exercise the same
path in the software and thus always produce the same behaviour. Unfortunately, distributed
software may not have this capability owing to the phenomenon of non-determinism. Because
of indeterminacy, repeated execution of distributed software with the same input may produce
46

different behaviours. In distributed software, the different behaviours may be caused by variable
processor speeds, random delays in message deli very or any other system dependent reasons that
affect the execution of software. When distributed software exhibits non~eterminism, its
execution may be dependent on arbitrary delays in the execution environment. Therefore, this
non-cleterministic behaviour makes distributed software more difficult to test than sequential
software.
Testing coverage
In the testing process, we need some rules, referred to as test coverage criteria, for measuring the
thoroughness of the tests of software. An ideal test coverage criterion is to select test cases which
are able to uncover all errors in the software. But, because it is generally impossible to know
where errors exist in software, the required coverage may be very large. An ideal criterion is
inapplicable in practice.
Various test coverage criteria have been defined for sequential software testing. One class of test
coverage criteria, called software based coverage criteria, is based on the information obtained
from the software structure such as control flow criteria and message flow criteria. These
software based coverage criteria, defined for sequential software testing, can also be used in
distributed software testing for measuring test coverage of each individual process since an
individual process can be regarded as an item of sequential software, having its own control flow
and message flow. However, these criteria have some weaknesses when one tries to use them in
measuring the test coverage of message exchanges between separate processes of distributed
software. The main weakness is that it is possible that there may be some synchronisation
dependent behaviours which have not been covered when the conventional coverage criteria have
been defined in testing distributed software. Therefore, some new coverage criteria need to be
defined for measuring the test coverage of different aspects of the synchronisation behaviour of
distributed software.
47

2.7.2 Needs to be Tested
The definition of test case
Asynchronous execution implies that the order in which two processes send a message to a third
process may not be deterministic. In other words, during one test run with given input values
process A may send its message first, while on another test run - with the same input values -
process B may send its message first. If the receiving process accepts messages in FIFO order,
independent of the sources of the messages, the two test runs may result in different software
behaviours. Consequently, using input values as a test case in testing distributed software, we
would not know what execution behaviour has been tested after an execution with the test case
and it becomes difficult to analyse the correctness of the test case when different execution
outputs are produced in different executions. Moreover, when one execution is correct but
another is incorrect (failure) we may be forced to say that a test case is both correct and incorrect
in that test execution. Such inconsistency may complicate the test analysis.
Therefore, to get reproducible execution for distributed software, it seems that the definition of
a test case must be altered. Assuming that we want a test run to be reproducible, we must define
a test case as a set of input values plus a sequence of events that can be used to externally resolve
any nondeterministic choices that are possible during the test execution of distributed software.
In other words, if we can record a test case as the triple (input data, the sequence of
non-deterministic choices, output) for each test, then based on this triple the tester can always
make the software run in such a way that it can be determined whether execution follows the same
sequence choices and produces the same outputs.
The casual message ordering
Because of the existence of non-deterministic behaviour, it is generally impossible to test all
distinct execution behaviours of distributed software by proper selection of test cases and
reproduce previous test results by repeating execution with the same input. Based on the analysis
of execution behaviour of distributed software, a conventional graph model is not suited for
modeling the execution behaviour of distributed software. Therefore, a Distributed Message
Flow Graph (DMFG) is proposed in our research.
48

A message flow graph (MFG) of a software S is a directed graph which shows how input messages
are transformed to output messages through a sequence of functional transformations (events)
in a sequential software. A Distributed message flow graph (DMFG) of a distributed software
DS consists of a set of MFGs and a set of communication edges showing message flow amongst
processers in distributed software. This is a useful and intuitive way of describing execution
behaviour in a distributed software and this is understandable without special training. It is suited
for modeling distributed software as basis for creating the SMAD tree in my work.
An EventlMessage Path (EMP )(Jorgensen & Erickson, 1994) is a sequence of event executions
and the messages issued by each event. An Atomic System Function (ASF) is an input message,
followed by a set of EMPs, and terminated by an output message. An EMP starts with an event
and ends when it reaches an event which does not issue any messages of its own. An ASF is an
elemental function visible at the system level. As such, ASFs constitute the point at which
integration and system testing meet, which results in a more seamless flow between these two
forms of testing. A Distributed Event/Message Path (DEMP) is a sequence of event executions
communicating by messages in the same process or between different processes. An Distributed
Atomic System Function (DASF) is an input message, followed by a set of DEMPs, and
terminated by an output message. Based on DASF, the causality relation between messages can
be built as follows.
The causality relation between messages is a fundamentally new approach to the analysis and
control of execution behaviour of distributed software. The definition of causality relation is
actually identical to the "happened before" relation defined by Lamport in (Lamport, 1978). We
would like to use the term "causality" rather than "happened before" because the definition of
causality relation is causal rather than temporal. In other words, if mj -> mj, mj should be
"happened before" mj in causality relationships. However, if mj and mj are pseudosimultaneous,
mj mayor may not be "happened before" mj in temporal relationships. Ifwe are given an accurate
representation of the message orderings, we can see all causal relationships and derive all possible
temporal ordered interIeavings. As a result, the technique greatly reduces the number of tests
49

required. It is never necessary to perform the same computation more than once to see whether
different message orderings (interleavings) are possible. However, we need to test the causal
message ordering to guarantee that order of delivery of messages does not violate causality in
systems of communicating processes.
One of the major problems in testing of distributed software is reproducible software execution.
Distributed software often makes non-deterministic selections of interleaving events. Repeated
executions of distributed software with the same test data may result in the execution of different
DEMPs. Therefore, we can examine repeated executions of different software paths which derive
from the same input message to test the causal message ordering.
2.7.3 An Approach for Testing Distributed Software Systems
In our approach to distributed software testing we present a dynamic testing method which
combines black- and white-box testing. According to the requirements, we specify all possible
messages between events by means of a" Symbolic Message Attribute Decomposition" (SMAD)
tree. Based on the SMAD tree, test data are derived from specifications and test results can be
inspected to see if they conform to the requirements and expected traces by black-box testing.
The path analysis approach is a kind of white-box testing whose objective is to exercise every
independent execution path through the component. There is an infinite number of path
combinations in a distributed software, so it is practically impossible for testing to be exhaustive.
However, we propose a graph model which applies the path analysis approach to test the
asynchronous relationship between processes in a distributed software system by white-box
testing. Figure 2.10 shows how my approach will fit into the framework as shown in Figure 2.2.
50

How does the technique select the test data? ->
What the type of the test data _> does the technique generate?
.. c.~~s!f!~D:.~o.n .................. t ...................... t ........... . Evaluation
When should testing stop?
How good is the software after testing?
-Test Quality Measurement
Figure 2.10: My approach fitted in the framework as shown in Figure 2.2
51

2.8 Conclusion
To achieve software quality, software testing is an essential component in all software
development. Software testing is characterized by the existence of many methods, techniques and
tools, that must fit the test situation, including technical properties, goals and restrictions
(Liggesmeyer, 1996). There is no single ideal software testing technique for assessing software
quality. Therefore, we must ensure that the testing strategy is chosen by a combination of testing
techniques at the right time on the right work products. From this viewpoint, this chapter has
briefly surveyed the software testing techniques based firstly on classification and evaluation.
Next, in addressing the two major software testing issues, that is when should testing stop and
how good the software is after testing, I presented a scheme using a data flow diagram for
evaluating software testing techniques. Following this diagram step by step, all the activities
involved and the relative techniques were described. A strategy proposal for software testing in
the development of distributed applications was then advocated later. Based on this framework,
I presented the framework of automating statistics-based testing (FAST), discussed how to
extend it to testing distributed software systems and showed how this approach fitted into the
framework for surveying software testing techniques.
52

Chapter 3
An Integrated Test Environment for Distributed Applications
3.1 Introduction
The Statistics-based Integration Test Environment (SITE) provides a test environment based on
statistical testing which secures automated support for the testing process, including modeling,
specification, statistical analysis, test data generation, test results inspection and test path tracing.
Testing of a distributed application is very complex because such a system is inherently
concurrent and non-deterministic. It adds another degree of difficulty to the analysis of the test
results. Therefore, a systematic and effecti ve test environment for the distributed applications is
highly desirable. To address these problems, the SITE is developed on the Java Development Kit
(10K) which provides Java Application Programming Interface (API) and Java tools for
developing distributed client/server applications.
In Section 3.2 of this chapter, a basic architecture of automated software testing is introduced.
An overview of my approach is shown in the end of this section. In Section 3.3, the architecture
of SITE is described and the relation of the main components is also shown. An operational
environment for testing distributed software is presented in Section 3.4. A comparison of STEs
using the SAAM structure is discussed in Section 3.5. Section 3.6 summarizes my research work.
3.2 A Basic Architecture of Automated Software Testing
In this section, wc describe a process of automated testing for distributed applications. Testing
is a method to validate that the behaviour of an object is conforming to its requirements
specification. Therefore, before testing, the requirements specification activity should be to
specify thc detai I input data, expected results and non-deterministic or deterministic behaviour
of a distributed application. Formal or semi-formal specification techniques may be appropriate

for expressing such a specification which can act as a basis for test data generation, test execution
and test result validation. The basic architecture of automated testing is shown as in Figure 3.1.
Test Data Generator
Test Data
Specification • + Specification
Test Bed with Specification
(SMAD Tree or Z specifications)
Test Results Validator
t S 'fi . + pecl lcation
Figure 3.1: The basic architecture of automated testing
3.2.1 Requirements Specification
A specification is defined broadly to mean any description of expected behaviour and
characteristics of a software product (Poston, 1996). Not only do testers need
specified-behaviour information in order to detect whether or not the test results satisfy their
requirements but other software developers must have that information, too. Designers must
know how software is expected to behave when they need to change or repair designs;
programmers must understand what programs are supposed to do and then they can write code
that performs as expected. Therefore, in order to achieve high quality, we must specify what we
mean by high quality and then implement that specification.
A specification presented to a tester could be as informal as a set of notes scribbled during a
meeting or as formal as a document written in a specification language.
Informal specification
Requirements information can be captured informally without rules. In workplaces where people
use text editors or word processors to write specifications, requirements usually are recorded in
a natural language such as English. The only rules applied to the writing are the syntactic or
grammar-and-punctuation rules of the natural language; semantic rules that restrict meanings
and use of meanings are not applied. Therefore, we say the natural language used in the
54

specification as well as the specification itself are informal because neither adheres to semantic
rules. Informal specifications may appeal to developers and end users who are not familiar with
formal languages. If the natural language of developers and users is English, they will need no
training to read an informal specification written in English. On the other hand, these people may
have difficulty reading a formal-language specification without training.
Unfortunately, the benefit of easy-ta-read informal specifications is outweighed by a major
disadvantage. An informal specification does not incorporate semantic rules, yet automated
versifiers as well as tools such as design, code and test data generators depend on semantic rules
to parse and verify information. The information in an informal specification, therefore, cannot
be checked by tools for correctness. Neither can that information be processed automatically for
output to other tools. Informal specifications condemn us to manual verification, testing and
development.
Formal specification
The formal specification of a system occurs ideally after requirements have been achieved and
analysis have been undertaken. In this ideal situation, the requirements are accepted uncritically.
In practice, it is possible that a lack of precision or inconsistencies in the requirements are
uncovered during the process of specifying the system. This is not surprising given the attention
to detail that is necessary in order to produce a formal specification and it can be argued that this
is one of benefits of producing a formal specification.
One natural model of a specification for a single operation is to regard it as a pre- and a
post-condition. Technically, the pre-condition can be viewed as a truth-valued function of states:
those states which satisfy the pre-condition are to be handled by the implementation. The second
part of the specification is a post-condition which is a truth-valued function of two states: for
states which satisfy the pre-condition, an implementation must create a final state and that final
state must, when paired with the initial state, satisfy the post-condition. One advantage of this
view of specifications is that it handles partial and non-deterministic software. Software rarely
works for all possible inputs and, indeed, it would often be uneconomic to attempt to make it do
55
so. It is therefore reasonable that, for much software, a pre--condition documents exactly those
assumptions under which the software should work. Non-determinism may not be an eventual
part of the implementation of software, but during the design process a non-deterministic
specification can often be used as a way of deferring a design decision. It is clear that testing
non-deterministic software which runs in an environment which interferes with and can thus
change its execution path makes the testing process extremely unreliable. Therefore, it is
important that post-conditions give non-deterministic specifications.
To overcome the problem in informal specification, we need not reject the methods used in
informal specification. We can use these tools successfully for capturing specifications in
English, if we apply a few semantic rules to our writing. By applying semantic rules to
specification writing, the specification languages are created. Whereas syntactic rules concern
the form and structure of a language, semantic rules bear on the meanings a language conveys.
For software developers and testers, a formal language provides an interface for completely
specifying the behavioural and characteristic information of applications. Formal languages
such as Z, VDM, LOTOS, etc. (Poston, 1996) have been promoted strongly by the academic
community in recent years although their take up in industry has been patchy. They are
particularly well suited for specification-based testing.
3.2.2 Test Data Generator
Test data generation is a process of selecting execution path/input data for testing. Most of the
approaches dealing with automatic test data generation are based on the implementation code,
using either stochastical methods for generation or symbolic execution. This seems quiet natural,
since in a traditional software development process this usually is the only "specification" that
has formal semantics allowing detailed, automatic analysis. Using formal specifications these
tasks can now be carried out based on along the specification. Other work with formal
specification has been done as well, describing either manual or automatic test data generation
(Hlircher & Peleska, 1995).
56

A test data generator is a tool which assists a tester in the generation of test data for software. It
takes fonnally recorded specification infonnation, treats it as though it were a database and
applies test design rules to this base to automatically create test data. If a requirement changes
in the database, new test data can be designed, generated, documented and traced.
3.2.3 Test Execution
Test execution is a process of feeding test data to the software and collecting infonnation to
detennine the correctness of the test run. For sequential software, this process can be
accomplished without difficulty. However, for distributed applications, some test cases can be
very hard to execute because by having more than one process executing concurrently in a
system, there are non-deterministic behaviours. Repeated executions of a distributed software
with the same input may execute different paths in the distributed software and produce different
results. This is called the non-reproducible problem. Therefore, some mechanism is required in
order to exercise these test cases. Non-determinism has two effects in testing. Firstly, some test
cases might be very hard to exercise, because the behaviour of a distributed application depends
not only on the input data but also on the ordering of the messages and events transmitted between
processes. Secondly, the interference of the testing mechanism might alter the behaviour of a
distributed application. Because the execution speed affects the timing of events, the testing
mechanisms, such as breakpoints, code segments to output event historys, assertions, etc., will
alter the event orderings which in tum affect the behaviour of the system. Therefore, a test
execution environment, which can manage the non-determinism and interference, is required for
the testing of distributed applications.
3.2.4 Test Results Validator
Validation of test results is a process of analyzing the correctness of the test run. For sequential
software, the correctness of an execution can be observed by comparing the output the software
generated with the correct output of the software. However, for distributed applications, again
because of non-detenninism, there are more than one, possible infinite, possible outputs for one
execution. Validation of test results of such systems is much more difficult than that of the
sequential case.
57

The behaviour of a distributed application can be represented by sequences of communication
events. Each such sequence represents a possible interaction of communication events.
Generally, the event sequence is long and the number of all possible sequences is usually
extremely large. Because of the non-determinism of distributed applications, using breakpoints
to validate the execution result is not acceptable. To reduce the interference of testing to the
system, it is required that the sequence of events transmitted during the execution be recorded
in a so-called execution history file for an off-line analysis. However, it is error-prone and
tedious work if this analysis is done by a human. Thus, an automated analysis tool is required.
3.3 My Approach
The following sections describe a novel approach to statistical testing which, it is claimed,
overcome some of these difficulties in testing distributed applications.
3.3.1 The Concept of The SIAD/SOAD Tree
Input is constructed from data of different characteristics that are called input attributes.
Associated with each input attribute is a syntax structure. The structure can be decomposed into
a lower level substructure and so on, until further decomposition is not possible. The lowest level
substructure is called a basic element. If the basic element is numerical then the lower bound and
the upper bound of the element are given under the element. The overall structure is a tree. The
tree can be arranged as a linear list with the structure preserved by a set of symbols called the tree
symbols. The list is called a "Symbolic Input Attributed Decomposition" (SIAD) tree which is
a syntactic structure describing the characteristics of all possible input messages. It is used to
represent the hierarchical and "network" relation between input elements and incorporate rules
into the tree for using the inputs.
58

The SIAD tree consists of the following components: the tree structure and the rules. The tree
structure describes the relationship amongst elements. An example of the structure of the SlAD
tree is shown in figure 3.2.
X1,2,1 X1,2,2
index symbol element rule
1 2 3 4 5
Xl X1,1 X1,2 X1,2,1 X1,2,2
(a)
A B 1 C 1
D, K1 bytes 2 E, K1 bytes 2
rule index rule description subrule index
1 Excluding characters 0123456789
2 K1 1,2
(b)
subrule index subrule description remark
1 1 ~ K1 ~ 7 length of D, E 2 K1 is integer
(c)
Figure 3.2: The structure of the SIAD Tree
The symbols A, B, .. , E are called the tree elements. The tree itself is shown in Figure 3.2 (a).
A tree symbol in Figure 3.2 (a) shows the relationship of an element to other elements. For
example, the symbol Xl ,2, 1 indicates that element D is subordinate to element C (whose symbol
is Xl,2), which, in turn, is subordinate to element A (whose symbol is Xl).
The rules governing the use of input elements in a process are those that define the order and, in
many cases, the timing with which the elements must be input into stages of the process. In Figure
3.2 (b), rules for using the inputs are incorporated into the tree. In order to use a rule in Figure
3.2 (b), a number of subrules must be applied. A subrule is listed in Figure 3.2 (c) for rule 2 in
Figure 3.2 (b).
59

According to the different types of software applications. we can use a number of different types
of SIAD trees (a detailed description of these trees is given in Cho). For example. in Liu et al.
(1992). we apply the weighted and ruled SIAD trees for the Command File Interpreter (CFI)
software. the regular SIAD tree for interface software in a relational database system and the
regular SIAD tree for a LEX generator.
The following example is a demonstration of a SIAD tree representing an input test data for a
transaction in a grade report database system.
An example: a database system for a grade report
Consider a Grade Report database system that has three relations is shown in Figure 3.3.
COURSE STUDENT course id course name
student id student name
first name surname CS2010 DataBase
945216775 Huey-Der Chu GRADE
student id course id score
945216775 CS2010 85
Figure 3.3: A database system for grade report
Query: Given a student id and several course id to get the grade report of figure 3.4.
60

A Grade Report for Huey-Der Chu
Course id Course name Grade
CS2010 Data Base 85 CS2015 Algorithm 80
Figure 3.4: A Grade Report
According to this query, the input test data can be decomposed into student id and course id. A
course id can be decomposed into course type and then course number. The results can be
arranged in a tree, as shown in Figure 3.5.
Input test data (X I)
(XI,I) (XI,2)
(X1,2,2)
(XI,2,1,1)
Figure 3.5: A tree structure of an input test data
The tree may be represented in a SIAD tree, as in Figure 3.6 (a). The tree has four columns: the
index, the symbol, the element and the rule index. The indices are for sampling use. The symbols
preserve the tree structure of the tree elements in Figure 3.5. A tree element is a node in Figure
3.5 with some explanation of the node. A rule index points to a rule that governs the use of the
tree element in constructing an input unit.
61

index
I 2 3 4 5 6
rule index
I 2 3 4 5
6
sxmbol element rule index Xl input test data XI,I student id, KI bytes 1,6 Xl,2 course id, K2 bytes 2 XI,2,1 course type, K3 bytes 3 X,I,2,1,! course number, K4 bytes 4,5 XI,2,2 course type, K3 bytes
(a)
rule description
KI K2=K3+K4 K3 K4 Only including characters 0,1,2,3,4,5,6,7,8,9
Excluding characters
3
subrule index
I 2,3
2 3
+* jlll<>$&#@;:)(!?=][ %£
(b)
subrule index subrule description remark
I 2 3
I ~ KI ~ 9 length of student id "CS", "AM", "ST" type of course
I ~ K4 ~ 4 length of course number
(c)
Figure 3.6: The SIAD tree of a grade report database system
The rules governing the use of tree elements in a SIAD tree can be listed as shown in Figure 3.6
(b). A rule index is used to identify the rule to be used. The rule description is the rule of interest.
The sub-rule index indicates a sub-rule to supplement the use of the rule, as shown in Figure 3.6
(c). The symbol Xl ,2,2 is designed for constructing invalid or incomplete test data to test whether
this software can detect input data error or not. For example, the rule index for symbol of Xl.2.2
is 3 which is governed by subrule index 2. According to subrule index 2, the course type can be
"CS", "AM" or "ST".
We extend this concept to the "Symbolic Output Attribute Decomposition" (SOAD) tree which
describes the characteristics of the product unit that its usability for the user. A product unit of
a grade report in Figure 3.4 can be specified by the following SOAD tree as shown in Figure 3.7:
62

index s~mbol element rule index I XI expected result 2 XI,I student name, KI bytes I 3 XI,I,I first name, K2 bytes 2,9,10 4 X,I,!,I,I surname, K3 bytes 3,9,10 5 XI,2 grade report, K4 bytes 4 6 XI,2,! course id, K5 bytes 5,10 7 XI,2,2 course name, K6 bytes 6,9,10 8 Xl,2,3 score, K7 bytes 7,8
(a)
rule index rule descri:Qtion subrule index 1 Kl =K2+K3 1,2 2 K2 I 3 K3 2 4 K4 = K5+K6+K7 3,4,5 5 K5 3 6 K6 4 7 K7 5 8 integer 9 Excluding characters
0,1,2,3,4,5,6,7,8,9 10 Excluding characters
+* /'II<>$&#@;:)(!?=][ %£
(b)
subrule index subrule descri:Qtion remark
1 2 3 4 5
2~K2~20 I~K3~1O I~K5~1O 1 ~ K6 ~ 20 1 <K7 <4
(c)
length of first name length of surname length of course id
length of course name length of score value
Figure 3.7: The SOAD tree of a grade report database system
3.3.2 The SMAD Tree
In addition, for a distributed computation, the tool, the "Symbolic Message Attribute
Decomposition" (SMAD) tree which lies between formal and informal specification, is presented
(Chu & Dobson, 1997). The processes which will be considered in a distributed system are
message-dri ven. An input message could be a request from another process to perform a service
or a report that an event has occurred. As a response to an input, the process will become active
and an output message will be produced as a result. An intermediate message will be used to
63

denote a sequence of input/ (expected) output pairs, which drive the message routing from its
input message to its output message. An output message could be a command to another process
or null. After the output message has been produced, the process either terminates itself or waits
for further input. Extending the concept of the SIAD/SOAD tree in FAST (Chu, Dobson & Liu,
1997), we attempt to specify all possible delivered messages between events by means of the
SMAD tree. It combines with the classification and syntactic structure to specify all delivered
messages. In the upper level of the SMAD tree, we classify all delivered messages into three types
of message: input message, intermediate message and output message. Each type of message has
a syntactic sub-tree describing the characteristics of messages with a happens-before
relationship so that it can be determined whether messages were delivered in an order consistent
with the potential causal dependencies between messages.
The SMAD tree is used to define the test case, which consists of an input message plus a sequence
of intermediate messages, to resolve any non-deterministic choices that are possible during
software execution, e.g., the exchange of messages between processes. In other words, the
SMAD tree can be used in two ways. Firstly it describes the abstract syntax of the test data
(including temporal aspects) and secondly it holds data occurring during the test. A test data
input message can be generated based on the input message part of the SMAD tree and rules for
setting up the ordering of messages which are incorporated into the tree (initial event) .The
intermediate message part of the SMAD tree can trace the test path and record the temporal
ordered relationship during the lifetime of the computation. The test results also can be inspected
based on the output message part of the SMAD tree (final event), both with respect to their
syntactic structure and the causal message ordering under repeated executions. How these tree
data structures are used together in testing is described in the next section.
3.4 SITE: A Statistics-based Integrated Test Environment
The objective of SITE is to build a fully automated testing environment which includes with the
statistical analysis. The architecture of SITE suggested in Figure 3.8 consists of computational
components, control components and an integrated database. The computational components
include the modeller, the SMAD tree editor, the quality analyst, the test data generator, the test
64

paths tracer, the simulator and the test results validator. There are two control components, the
test manager and the test driver.
Specification
C Modeller )
At
An Integrated Database
D Control Component
o Computational Component
Figure 3.8: The architecture of SITE
Test Manager
Control flow
Data flow
According to the following test requirements, SITE is designed for distributed applications.
• To set up test requirements, including the functional requirements and quality requirements,
• To execute automated testing until it has been sufficiently tested (when to stop testing),
• To re-execute the input units which have been tested (regression testing),
• To execute the component-testing first and the interaction testing later.
• To test all "interface" paths among processes which should be traversed at least once,
• To enhance testing in areas that are more critical,
• To produce the test execution report, the test failure report and the test quality report.
65

For a distributed application, the test environment will model the executing behaviour, edit
'messages' specification into SMAD tree file, automatically generate test data based-on
statistical testing, receive some test software, run the software with the generated test data, trace
the test paths recording in the path records file for re-tests, inspect the test results and finally
generate a test report to the tester.
3.4.1 Test Manager
Software testing is an extremely complicated process consisting of many activities and dealing
with many files created during testing. The test manager includes two main tasks: control
management and data management.
The task of control management provides an application programmatic interface (API) between
tester and SITE. This API receives the command from the tester and corresponds with the
functional module to execute the action and achieve the test requirements. It will trigger the test
driver to start test and get the status report of test execution back which will be saved in the test
report repository.
The task of data management provides the support for creating, manipulating and accessing data
files as well as the relations among these data files which are maintained in a persistent database
in the test process. This database consists of static and dynamic data files. The static data files
include a message-flow paths file, a SMAD tree file, a random number seeds file and a quality
requirement file. The dynamic data files include an input unit file, a product unit file, a test paths
recording file, a defect rate file, a file for the range of defect rate and a sample size file.
A conceptual data model for this database is shown in Figure 3.9. These data files will be
described more fully through this chapter as they arise. SITE supports relationships between test
data files and analysis data files. Through interaction with other software tools, the test manager
in the SITE supports interaction with development activities; test data files can be related to
synthesis and/or analysis data files from which they are derived or for which there are to test.
66

Generatelnput ProvldeSeed
InspectPAthl InspectOutput
Figure 3.9: A conceptual data model for SITE
3.4.2 Modeller
A model is a representation of an existing or a conceptual object, an abstraction of a real world
phenomenon that will be the basis for development of a piece of software. It is constructed for
a specific purpose and the design of the model will consequently reflect that purpose. There are
two main viewpoints about a model (Bottaci & Jones, 1995): firstly, a model is not necessarily
a poor substitute for the real thing. For example, a model railway is specifically designed so that
children can watch a train moving along a track and be able to stop and start it and control its
journey at will. Secondly, a model is often used to communicate ideas. For example, an architect
may use a model to describe a proposed building and hopefully impress a client who will pay for
it.
The modelling activity includes (Cho, 1988): modelling of inputs and outputs as well as
modelling of the software. Inputs are modelled in terms of types of input data, rules for
constructing inputs and sources of inputs. The modelling of output includes the crucial
67

definitions of product unit and product unit defectiveness on which the design and testing of the
software must be based. The software itself, as distinct from its output, is modelled in terms of
the description of the process being automated, rules for using inputs, methods for producing
outputs, data flows, process control and methods for developing the software system.
A distributed application is a system seen as a set of communicating processes, where each
process holds its own local data and the processes communicate by message passing. In SITE,
the modelling component describes a set of asynchronous processes in a distributed application
to be tested with message-flow routings to gather information about an application's desired
behaviour from which all tests are then automatically derived.
This model is used as the basis of a specification in the SMAD tree that can be used to describe
the abstract syntax of the test cases as well as to the trace data occurring during the test. The
message-flow routings will provide an elemental function visible at the system level and
constitute the point at which integration and system testing meet, which results in a more seamless
flow between these two forms of testing. This information provides support for test planning (a
component testing and an interaction testing) to the test driver as well as the SMAD tree editor
for specifying messages between events.
The modelling of output also includes output quality planning, in which sampling methods and
parameters for software testing and the acceptance procedure are determined. These parameters
include firstly a definition of the defectiveness of the product unit so that the quality of a product
unit can be evaluated and secondly an identification of the tolerance limits in defining the
defectiveness of a product unit. This information provides support for test planning and test
measurement to the statistical analyst.
3.4.3 SMAD Tree Editor
Requirements specification is the activity of identifying all of the requirements necessary to
develop the software and fulfil the user's needs. It covers all input, processing and output
requirements. In particular, the input/output domain of the software, that is, the types of
68

input/output, rules for using the input or examining the output and constraints on using the
input/output, are identified from the modelling process and refined. Here, the SMAD tree is a
powerful tool to represent the input/output domain in a convenient form for the crucial part of
requirements specification.
The SMAD tree editor is a graphical editor that supports the editing and browsing of the SMAD
tree. The SMAD tree and the model will be built at the same time. The modeller will trigger the
SMAD tree editor when each message links two events during the modelling process. The result
of editing will be saved in a SMAD tree file which allows the test data generator to generate test
data by a random method and the test results validator to inspect the product unit.
3.4.4 Test Driver
The test driver calls the software being tested and keep track of how it performs. More
specifically, it should
• Set up the environment needed to call the software being tested. This may involve
setting up and perhaps opening some files.
• Make a series of calls. The arguments for these calls could be read from a file or
embedded in the code of the driver. If arguments are read from a file, they should be
checked for appropriateness, if possible.
There are some different activities between component testing and interaction testing. Therefore,
the test driver invokes different computational components/sub-components in testing at the
different levels. During component testing, the test driver triggers the test data generator to
generate input according to the requirements determined by the statistical analysis of the quality
analyst, makes a series of calls to execute the application and produces the product unit to the test
results validator for evaluation of the tests and software. After component testing, the test driver
performs the interaction testing. It starts by calling the call test data generator to generate an input
message plus a sequence of intermediate messages which are selected to correspond to the
message-flow paths file and sets up the ordering of messages using 'happened before'
relationships which are incorporated into the SMAD tree. When the test runs, the test driver
69

invokes the test paths tracer to trace the test path and record the temporal ordered relationship
into the path recordings file during the lifetime of the computation. The test results also can be
saved into the product unit file to the test results validator for inspecting the product unit, both
with respect to their syntactic structure and the causal message ordering under repeated
executions using the path recordings file.
3.4.5 Quality Analyst
Statistical analysis for component testing
Testing a piece of software is likely to find the defect rate of the product unit population generated
by the software. Therefore, each execution of the software in SITE is considered equivalent to
'sampling' an output from the output population. The goal of statistics-based testing is to find
certain characteristics of the population such as the ratio of the number of defective outputs in
the population to the total number of outputs in the population. Clearly a mass inspection of the
population to find the rate is prohibitive. An efficient method is through statistical random
sampling. A sample of n units is taken randomly from the population. If it contains d defective
units, then the sample defect rate, denoted by 9°, is 9° = din. If n is large enough, then the rate
eO can be used to estimate the product unit population defective rate 9. Addressing the two major
testing issues, when to stop testing and how good the software is after testing, the statistical
analyst provides an iterative sampling process that determines the sample size n.1l also provides
a mechanism to estimate the mean, denoted by Il. of the product unit population. Once the value
of Il is estimated, the product unit population defect rate 9 can be computed by Il = n9. If the value
of e is acceptable, then the product unit population is acceptable. The piece of software is
acceptable only when the product unit population is acceptable. Therefore, the estimated product
unit population defect rate 9 can be viewed as the software quality index.
The statistical analyst receives quality statements from a quality requirement file. The quality
statement defines software quality that is equivalent to p% of the output population being
non-<iefective (the acceptance level). The result of the iterating sampling process, sample n, will
be dynamically saved into a sample size file for providing information to the test data generator.
70

The values of the confidence interval also is computed and will be saved into a file for the range
of defect rate for supporting the evaluation of software quality by the test results validator.
Test coverage analysis for interaction testing
The objective of interaction testing is to to verify the message exchanges among processes. One
reasonable cover would be to require that all "interface" messages between a pair of process
should be exercised at least once. The "interface" message is the message sent out and received
from different processes. In SITE, we can use the path recordings file in comparison with the
message-flow paths to examine whether or not there are "interface" messages which have not
been verified. If so, more tests are added until the test set is sufficient for the quality level
required.
3.4.6 Test Data Generator
After the sample size is determined, the SMAD tree file is used for automatically generating input
test data through random sampling with a random number seed. The input test data will be
temporarily saved in the input unit file for re-executing according to the test requirements. For
interaction testing, the test generator addresses how to select the input test data plus event
sequences from the SMAD tree with the "happened before" relationship. Due to the
unpredictable progress of distributed processes and the use of non-deterministic statements,
multiple executions of an application with the same input may exercise different message-flow
paths. Therefore, the input test data plus event sequences are generated with reference to the
message-flow paths file.
3.4.7 Test Path Tracer
The reproducibility of tests is important, particular in testing distributed applications. Therefore,
we need a mechanism for tracing and recording the test path during the test. The tracer consists
of correlated views that allow the testers to compare different information about a path routing
in the software execution. The path tracer records events from currently executing tasks into a
path records file, where the trace is played in "real time". Once a path record file has been created,
the tester can replay the trace for re-tests.
71

3.4.8 Test Results Validator
A test results validator in SITE is like a compiler. Much as a compiler reads and analyses source
code, the test results validator reads and analyses the test results with the SMAD tree
(specification information). It introduces the static testing method to inspect the test results
during dynamic testing. The main advantage of using the SMAD tree here is that we do not need
a test oracle to compute expected results, because the SMAD tree can be used directly for
automatic inspection whether or not the results produced by the software are correct with respect
to the specification. In the interaction testing, the test results validator examines the execution
of different test paths which drive from different test data or from the same test data (repeated
execution) to test the causal message ordering with the "happened before" relationships in the
SMAD tree.
The test results validator receives the test results during test execution. After inspecting the test
results, it will compute the defect rate and store it in the defect rate file thus providing data to the
quality analyst dynamically. According to test requirements, the test failure report is produced
by the test results validator.
3.5 An Operational Environment for Testing Distributed Software
3.5.1 Overview
Distributed applications have traditionally been designed as systems whose data and processing
capabilities reside on multiple platforms, each performing an assigned function within a known
and controlled framework contained in the enterprise. Even if the testing tools were capable of
debugging all types of software components, most do not provide a single monitoring view that
can span multiple platforms. Therefore, developers must jump between several
testing/monitoring sessions across the distributed platforms and interpret the cross-platform gap
as best they can. That is, of course, assuming that comparable monitoring tools exist for all the
required platforms in the first place. This is particularly difficult when one server platform is the
mainframe as generally the more sophisticated mainframe testing tools do not have comparable
PC- or Unix-based counterparts. Therefore, testing distributed applications is exponentially
more difficult than testing standalone applications.
72

To overcome this problem, we present an operational environment for testing distributed
applications based on the Java software as shown in Figure 3.10, allowing testers to track the flow
of messages and data across and within the disparate platforms.
Java Abstract
Windowing Toolkit (AWT)
menus)
Test Data
Generator
B Remote Method Invocation (RMI)
Test Results Quality
Validator Analyst
SMADTree Test Editor Driver
Java Network Programming
Java Development Kit (JDK) 1.1.3
Solaris OS
Sun SPARC stations
Test Path
Tracer
Test Manager
Figure 3.10: An operational environment for testing distributed applications
The primary goal of this operational environment is an attempt to provide a coherent, seamless
environment that can serve as a single platform for testing distributed applications. The hardware
platform of the testbed at the lowest level in Figure 3.10, is a network of SUN workstations
running the Solaris 2.x operating system which often plays a part in distributed and client-server
system. The widespread use of PCs has also prompted an ongoing effort to port the environment
to the PC/Windows platform. On the top of the hardware platform is Java Development Kit
(10K).
It consists of the Java programming language core functionality, the Java Application
Programming Interface (API) with multiple package sets and the essential tools such as Remote
73

Method Invocations (RMI), Java DataBase Conncetivity (JDBC) and Beans for creating Java
applications. On top of this platform is the SITE which provides automated support for the testing
process, including modeling, specification, statistical analysis, test data generation, test results
inspection and test path tracing. At the top of this environment are the distributed applications.
These can use or bypass any of the facilities and services in this operational environment. This
environment receives commands from the users (testers) and produces the test reports back.
The picture gi ven in Figure 3.10 is not completely accurate, but an approximate idea of how the
various parts of the operational environment fit together. It gives an indication of the gross
structure, so henceforth we will use it as our model.
I am going to build a 3-tier client/server application with Java RMI and JDBC and set up an
integrated test environment under the Java Development Kit in the Chapter 5, therefore, an
introduction to the Java Development Kit is described in the following section.
3.5.2 The Java Development Kit
Why}ava?
Java is a new high-level programming languages that provides simple, object-oriented,
distributed, interpreted, robust, secure, architecture neutral, portable, high-performance,
multithreaded and dynamic features to make interactive applications with classes and methods
(Niemeyer & Peck, 1997). Java is both a compiled (a stand-alone application) and an interpreted
(an applet) language. Java source code is turned into simple binary instructions called bytecode,
much like ordinary microprocessor machine code. However, whereas C++ source is refined to
native instructions for a particular model of processor, Java source is complied into a universal
format - instructions for a virtual machine. It means that Java code is portable. The same Java
application can run on any platform that provides a Java run-time environment as shown in
Figure 3.11.
74

Java Source Programs
t JDKl.l.l
Java compiler Java API Java tools
t
Bytecode
• • • 8] I I
PC Sun SPARC Macintosh
Figure 3.11: Java virtual machine environment
In addition to the platform-specific runtime system, Java has approximately 22 fundamental
classes that contain architecture-dependent methods. These native methods serve as Java's
gateway to the real world. These methods are implemented in a native language on the host
platform. They provide access to resources such as the network, the windowing system and the
host file system. The rest of Java is written entirely in Java and is therefore portable. This include
fundamental Java utilities like the Java compiler which is also a Java application and is therefore
immediately available on all Java platforms.
lava network programming
The network is the soul of Java (Hughes, Hughes, Shoffner & Winslow, 1997; Niemeyer & Peck,
1997). Most of what is new and exciting about Java centres around the potential for new kinds
of dynamic, networked applications. The core API comes with a standard set of classes, Java's
sockets interface and URL (Uniform or Universal Resource Locators) classes, which provide
uniform access to networking protocols across all of the platforms to which the Java Virtual
Machine has been ported. Basic network access is provided through classes from the java. net
75

package. These are complemented by classes from the java.io package that provide a uniform
streams-based interface to communications channels. These classes can be extended to provide
sophisticated high level functionality to serve custom communication needs.
(1) Java's Socket API:
Java offers socket-based communication that enables applications to view networking as if it
were file 110 - a program can read from a socket or write to a socket as simply as reading from
a file or writing to a file. There are two types of sockets, stream sockets and datagram sockets.
With stream sockets a process establishes a connection to another process. While the connection
is in place, data flows between the processes in one continuous stream. Stream sockets are said
to provide a connection-oriented service. The protocol ensures that no data is lost and that it
always arrives in order. The protocol used for transmission is the popular Transmission Control
Protocol (TCP). With datagram sockets, individual packets of information are transmitted. This
is not the right protocol for everyday users because unlike TCP, the protocol used, the User
Datagram Protocol (UDP), is a connectionless service. Applications can send short messages to
each other, but no attempt is made to keep the connection open between messages, to keep the
messages in order or even to guarantee that they arrive. Therefore, with UDP, significant extra
programming is required on the user's part to deal with these problems. Stream sockets and the
rep protocol will be the most desirable for the vast majority of Java programmers.
When writing network applications, it is common to talk about clients and servers. The client
requests that some action be performed and the server performs the action returning the result
(if any) to the client. The client first attempts to establish a connection to the server. The server
can accept or deny the connection. If the connection is accepted, then the client and server
communicate through sockets in much the same manner as if they were doing file 110.
Figure 3.12 shows the typical scenario that takes place for a Java connection-oriented service.
An application acting as a server creates a ServerSocket object and waits, blocked in a call to its
Accept() method until a connection arrives from a client which creates a socket and intiates the
76

Client}
Server (connection-oriented service)
I ListenO I
Clientz
~ .. __ ----------~ .. ~ 1 ~ .. __ ----------~ .. ~ connection , connection
communication (request/reply data)
establishment establishment
communication (request/reply data)
Figure 3.12: A client/server relationship for Java connection-oriented service
communication. When it does, the Accept() method creates a Socket object the server uses to
communicate with the client. A server carries on multiple conversations at once; there is only a
single ServerSocket, but one active Socket object for each client.
(2) Manipulating URLs:
The Internet offers many protocols. The HyperText Transfer Protocol (HTTP) that forms the
basis of the World Wide Web uses URLs to locate data on the Internet. The Java URL classes
provide an API for accessing well-defined networked resource, like documents and applications
on servers. The classes use an extensible set of prefabricated protocol and content handlers to
perform the necessary communication and data conversion for accessing URL resources. With
URLs, an application can fetch a complete file or database record from a server on the network
withjust a few lines of code. Applications like Web browsers, which deal with networked content,
use the URL class to simplify the task of network programming. They also take advantage of the
dynamic nature of Java which allows handlers for new types of URLs to be added on the fly. As
new types of servers and new formats for content evolve, additional URL handlers can be
supplied to retrieve and interpret the data without modifying the original application.
77

Remote Method Invocation (RMI)
The Java Remote Method Invocation (RMI) system (Hughes, Hughes, Shoffner & Winslow,
1997) provides all the underlying layers necessary for Java objects to communicate with each
other using normal method calls, even if the objects are running in virtual machines on opposite
sides of the world. It enables the programmer to create distributed Java-tcrJava applications, in
which the methods of remote Java objects can make a call on a remote object once it obtains a
reference to the remote object, either by looking up the remote object in the bootstrap naming
service provided by RMI or by receiving the reference as an argument or a return value. A client
can call a remote object in a server, and that server can also be a client of other remote objects.
As long as the runtime systems can communicate via Internet, client/server applications can be
developed without streams and sockets. This allows the programmer to avoid complex
communication protocols between applications and instead adopt a higher level method-based
protocol. RMI is an alternative to the more low level streams/socket communication and the
specific implementation is hidden from programmers.
(1) The RMI Architecture:
The purpose of Java remote method invocation implementation is to provide a framework for
Java objects to communicate via their methods, regardless of their location. It like a Remote
Procedure Call (RPC) mechanism in other languages. One object makes a method call into an
object on another machine and gets a result back. To create a class that will be remotely accessible,
remote methods are defined by remote interfaces. That is, a remote interface defines a set of
methods that can be called remotely. The class must implement this interface, plus any other
interfaces and methods it needs for its own local use. A stub and skeleton are then generated
automatically using rmic, a tool available in the Java RMI distribution. The stub which runs on
the client side is a class that automatically translates remote method calls into network
communication set-up and parameter passing. The skeleton which runs on the server side is a
corresponding class that resides on the same virtual machine as the remote object, and which
accepts these network connections and translates them into actual method calls on the object.
Figure 3.13 shows the relationship between a client, a server, a stub and a skeleton.
78

Client-side
Object
methodO
~-------- .. ,
I
" __ )_n!~rfl!c_e __ ~ I Server-side
__ 1' '., methodO," ~, ,
~: - - - -~~t~~~i~; , , '" Remote Object
Skeleton
Figure 3.13: The RMI architecture
When a client wishes to make calls to a remote object, it must first look up the object in the naming
service. This returns a remote reference to the object which automatically informs the object that
it has a remote client. RMI provides a simple name lookup object that allows a client to get a stub
for a particular server based on the server's name. The naming service that comes with the RMI
system is fairly simplistic but is useful for most cases. How a client uses the naming service to
find a server is shown in Figure 3.14.
client-side
Object
methodO
:2 lookup
5
connection
(her~l_ . r-__ N_,,_m_i_n..:..g_--i"-'
rmi:llserver/name 3
Server-side
Remote Object
\------. methodO _4 - '-----T""--
remote reference
1 bindl rebind
,....---..!..----,
Naming Registry
--------~ name
Figure 3.14: The naming service
The steps of the naming service is as follows:
I. Remote objects register themselves using the bind or rebind method, which uses a URL-based
naming scheme,
2. Clients using the lookup method to look up the remote objects in the naming service.
3. The naming service requests the name of remote object via Network,
79

4. The naming service obtains remote reference back.
S. Remote clients will connect to the registry and locate the object based on this name.
(2) The Procedure To Write An Application
The procedure to build an application using RMI is shown in Figure 3.15.
Define a Remote Interface
(server-side and client-side)
Write an Implementation
Class
(server-side) Write a Client that Uses the
Remote ob"ect
(client-side) Generate the
stub and skeleton
Compile Phase (stub: client-side, skeleton server-side)
.. -------------------------------. ----------------------------Execute Phase
~ Start the Server -
Run the Client
(client-side)
(server-side)
Start the Registry
(server-side)
Figure 3.15: The procedure to build an application
• Define a remote interface: An interface must be written for the remote object defining
all methods that should be public. This interface must extendjava.rmi.Remote , an API
interface which identifiers that a reference is to a remote object.
• Write an implementation class: To write a remote object, a class will be written to
implement one or more remote interfaces. The implementation class needs: firstly. to
specify the remote interface(s) being implemented, secondly, to define the constructor
for the remote object, thirdly, to provide implementations for the methods that can be
invoked remotely, fourthly, to create and install a security manager, fifthly, to create one
80

or more instances of a remote object and finally, to register at least one of the remote
objects with the RMI remote object registry for bootstrapping purposes.
• Write a Client that uses the remote object: The client is very simple; it looks up the
remote object in the naming service, collects a reference to it, makes a call to its remote
method, prints the result and then quits.
• Generate the stub and skeleton: To generate the stub and skeleton, programmers compile
the implementation class first and then use the rmic command with this implementation
class. Two class files will be generated, one for the stub which will be used by the client
machine and one for the skeleton which will be used by the server machine.
• Start the registry: The RMI registry is a simple server-side bootstrap name server that
allows remote clients to get a reference to a remote object. To start the registry on the
server, execute the rmiregistry command.
• Start the server: When starting the server, thejava.rmi.server:codebase property must
be specified so that references to the remote objects created by the server can be include
the URL from which the stub class can be dynamically downloaded to the client.
• Run the client: Once the registry and server are running, the client can be run.
Java DataBase Conncetivity (JDBC)
Java Database Connectivity (JDBC) is a Java API for executing SQL statements. It consists of
a set of classes and interfaces written in the Java programming language. JDBC provides a
standard API for tool/database developers and makes it possible to write database applications
using a pure Java API. Using JDBC, it is easy to send SQL statements to virtually any relational
database. In other words, with the JDBC API, it is not necessary to write one program to access
a Sybase database, another one program to access an Oracle database, another program to access
an Informix database and so on. One can write a single program using the JDBC API and the
program will be able to send SQL statements to the appropriate database. The combination of
Java and JDBC lets a programmer write it once and run it anywhere.
81

\1icrosoft's ODBC (Open DataBase Connectivity) API is probably the most widely used
programming interface for accessing relational databases. It offers the ability to connect to almost
all databases on almost all platforms. However, ODBC is a C interface to DBMSs and thus is not
readily convertible to Java. Therefore, The JDBC retains the basic design features of ODBC and
its interfaces are based on the XlOpen SQL Call Level Interface (CLI) with a Java interface that
is consistent with the rest of the Java system.
Figure 3.16 shows the JDBC communication layer alternatives. The application/applet and the
JDBC layers communicate in the client system and the driver takes care of interacting with the
database over the network.
let
JDBC Driver Mana
I JDBC-ODBC Bridge ~ I ~ ,
,-----------,
let
JDBC~Net Driver
Database!HTTP Listener Process/
RPC/ Jeeves Servlet
Database Server
Figure 3.16: JDBC communication layer alternatives
The JOBC classes are in thejava.sql package and all Java programs use the objects and methods
in the j(/\·u.sql package to read from and write to data sources. A program using the JDBC \\ill
82

need a driver for the data source with which it wants to interface. This driver can be a native
module (like the JDBCODBC.DLL for the Windows JDBC-ODBC Brifge developed by
Sun/Intersolv) or Jeeves Servlet or an HTTP talker-listener protocol.
JDBC defines a set of API objects and methods to interact with the underlying database. A Java
application first opens a connection to a database, makes a statement object, passes SQL
statements to the underlying DBMS through the statement object and retrieves the results as well
as information about the results sets.
Typically, the JDBC class files and the Java appletlapplication reside in the client. They could
be downloaded from the network also. To minimize the latency during execution, it is better to
have the JDBC classes in the client. The Database Management System and the data source are
typically located in a remote server.
The Java GUI component
Graphical User Interface (GUl) programs provide more features than the structured navigation
and data entry in non-GUl applications. The user can select a variety of functions from each
screen. GUls are characterized by (Sommerville, 1996): firstly, multiple windows allows
different information to be displayed simultaneously on the user's screen; secondly, icons
represent files or processes; thirdly, command selection via menus rather than a command
language; fourthly, a pointing device such as a mouse for selecting choices from a menu or
indicating items of interest in a window and finally, support for graphical as well as textual
information display.
The Abstract Windowing Toolkit (A WT) provides a large collection of classes for building a GUl
in Java. It is divided into two large chunks: a user-interface chunk that provides the buttons, check
boxs. menu bars and other user-interface components; and a graphics chunk that handles drawing
and image rendering. Figure 3.17 demonstrates the user-interface of SITE by the pull-down
menu.
83
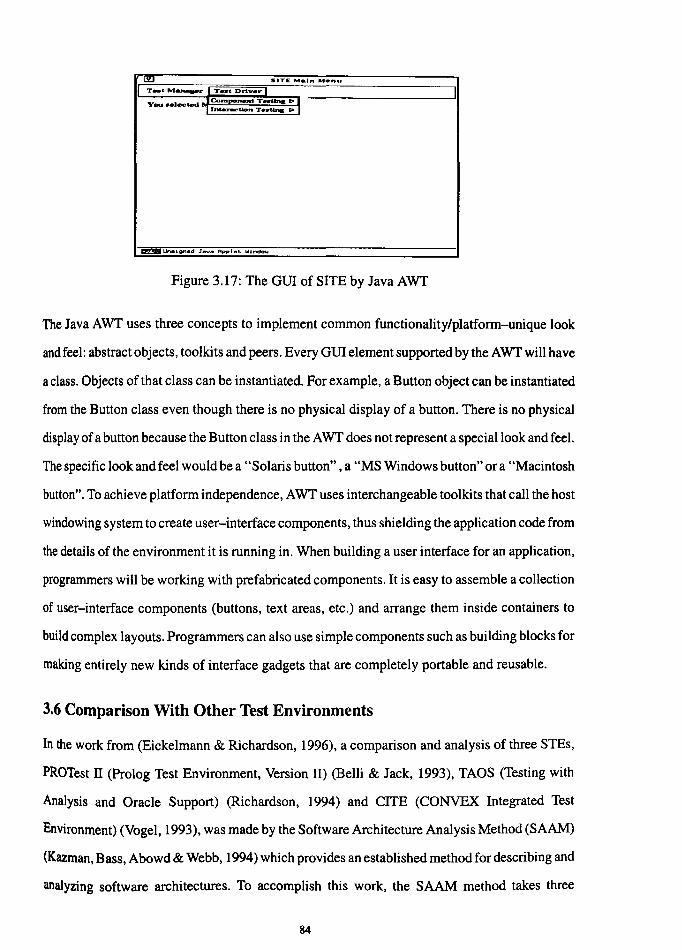
SITE "".In "".nu
T .. t.M ...... r
You •• lect.ed
Figure 3.17: The GUI of SITE by Java AWT
The Java AWT uses three concepts to implement common functionality/platform-unique look
and feel: abstract objects, toolkits and peers. Every GUI element supported by the A WT will have
a class. Objects of that class can be instantiated. For example, a Button object can be instantiated
from the Button class even though there is no physical display of a button. There is no physical
display of a button because the Button class in the AWT does not represent a special look and feel.
The specific look and feel would be a "Solaris button" ,a "MS Windows button" or a "Macintosh
button". To achieve platform independence, A WT uses interchangeable toolkits that call the host
windowing system to create user-interface components, thus shielding the application code from
the details of the environment it is running in. When building a user interface for an application,
programmers will be working with prefabricated components. It is easy to assemble a collection
of user-interface components (buttons, text areas, etc.) and arrange them inside containers to
build complex layouts. Programmers can also use simple components such as building blocks for
making entirely new kinds of interface gadgets that are completely portable and reusable.
3.6 Comparison With Other Test Environments
In the work from (Eickelmann & Richardson, 1996), a comparison and analysis of three STEs,
PROTest II (Prolog Test Environment, Version II) (Belli & Jack, 1993), TAOS (Testing with
AnalYSis and Oracle Support) (Richardson, 1994) and CITE (CONVEX Integrated Test
Environment) (Vogel, 1993), was made by the Software Architecture Analysis Method (SAAM)
(Kazman, Bass, Abowd & Webb, 1994) which provides an established method for describing and
analyzing software architectures. To accomplish this work, the SAAM method takes three
84

perspectives: a canonical functional partition of the domain, system structure and allocation of
functionality to system structure. Each is first described as originally diagramed and discussed
by the authors and then recast in the graphical notation used by SAAM along with an allocation
of the canonical function partition. According to this work, the three architectural analysis
perspectives used by SAAM are described in this section.
3.6.1 Canonical Function Partition
The test process evolution and canonical functional partition resulting from the STE domain
analysis provide the foundation for the Software Test Environment Pyramid (STEP) model
(Eickelmann & Richardson, 1996). The STEP model, shown in Figure 3.18, stratifies test
functionalities from the apex of the pyramid to its base in a corresponding progression of test
process evolution in (Gelperin & Hetzel, 1988) - the debugging, demonstration, destruction,
evaluation and prevention periods.
Canonical Functional Partitions
Test Process Evolution
Test Measurement
Test Management
Test Planning
Debugging
Demonstration
Destruction
Evaluation
Preventio,
~----------------------------------~-------
Figure 3.18: STEP Model, adapted from (Eickelmann & Richardson, 1996)
• Test execution includes the execution of the source code and recording of execution traces.
Test artifacts recorded include test output results, test execution traces and test status. It is
85

clearly required by any test process. The test process focus of the debugging-oriented period
was solely on test execution.
• Test development includes the specification and implementation of a test configuration. It
played a more significant role in the overall test process during the demonstration-oriented
and destruction-oriented periods due to the manual intensive nature of test development at that
time. Test development methods have not significantly changed, although they have improved
in reliability and reproducibility with automation. Thus, their role in the test process has
diminished in significance as the test process evolution has moved ahead.
• Test failure analysis includes behaviour verification and documentation and analysis of test
execution pass/fail statistics. It was less important when performed manually, as interactive
checking by humans added little benefit for test behaviour verification. The methods applied
to test failure analysis have increased in their level of sophistication, making test failure
analysis more significant to the overall test process.
• Test Measurement includes test coverage measurement and analysis. It is required to support
the evaluation-oriented period, which represents the point of departure from a phase approach
to a life cycle approach. A significant change in the test process focus is that testing is applied
in parallel to development, not merely at the end of development. Test measurement also
enables evaluating and improving the test process.
• Test Management includes support for test artifact persistence, artifact relations persistence
and test execution state preservation. It is essential to the evaluative test process due to the
sheer volume of information that is created and must be stored, retrieved and re-used. Test
management is critical for test process reproducibility.
• Test planning includes the development of a master test plan, the features of the system to be
tested and detailed test plans. Included in this function are risk management (e.g. what tests
not to do, when to stop testing), organizational training needs, required and available
resources, comprehensive test strategy, resource and staffing requirements, roles and
responsibility allocations and overall schedule. It is the essential component of the
prevention-oriented period. Test planning introduces the test process before requirements, so
86

that rather than being an after-thought, testing is pre-planned and occurs concurrently with
development.
3.6.2 SAAM Structure
A system's software structure reveals how it is constructed from smaller connected pieces and
represents the decomposition of the system components and their inter--<:onnections. The
graphical notation used by SAAM is a concise and simple lexicon (Kazman, Bass, Abowd &
Webb, 1994), which is shown in Figure 3.19.
Components Connections
D Process .- Uni-/
0 Computational .--. Bi-directional Component
Data Flow
D Passive Data • Uni-/ Repository
• • Bi-directional
0 Active Data Repository Control Flow
Figure 3.19: SAAM architectural notations
In the notation used by SAAM there are four types of components: a process (unit with an
independent thread of control); a computational component (a procedure or module); a passive
repository (a file); and an active repository (database). There are two types of connectors, control
flow and data flow, either of which may be uni or bi-directional.
SAAM's goal is to provide a uniform representation by which to evaluate architectural qualities.
The simplicity of the notation is achieved by abstracting away all but a necessary level of detail
for a system level comparison. The field of software architecture, not unlike hardware design,
recognizes a number of distinct design levels, each with its own notations, models, components
and analysis techniques.
87

3.6.3 SITE SAAM Description and Functional Allocation
The allocation of domain functionality to the software structure of an STE completes the
graphical representation of the STE. The allocation provides the mapping of a system's intended
functionality to the concrete interpretation in the implementation. SAAM focuses most closely
on allocation as the primary differentiating factor amongst architectures of a given domain. In
this and the following subsections SAAM is used to characterise SITE and compare it with three
other STEs that have been described in the literature.
: Test Planning '.-------.
: Tes~:~~;in ....... __ --t( MOdelling) :
, Test Quality Report
,
i ................................ ... -.
'Test Failure Analysis: , ,
Test Failure Report
,- --------t --!
._-----------. , , Test Execution
, Test Executio Report
Test Driver
: J , r: -, : : .. _ -' --... ' , , ,--t-, : :-, , , -, , , ,,... __ _ .,.. ___ _ .... __ ~ ___ ....-~S-..Ioftw--L.are , under Test , Test Management
Object Management System Test Manager
, , ..... _-- ... _-------------- ... ------------------_ ...... -----_.
Figure 3.20: The SITE system structure and functional allocation through SAAM
The SAAM graphical depiction of SITE is shown in Figure 3.20. SITE supports statistics-based
testing on the top of specification-based testing with two main issues in software testing. when
to stop testing and how good the software is after testing. It provides automatic support for test
execution by the test driver, test development by the SMAD tree editor and the test data generator,
test failure analysis by the test results validator, test measurement by the quality analyst. test
88

management by the test manager and test planning by the modeller. These tools are integrated
around an object management system which includes a public, shared data model describing the
data entities and relationships which are manipulable by these tools. SITE enables early entry of
the test process into the life cycle due to the definition of the quality planning and message-flow
routings in the modelling. After well-prepared modelling and requirements specification are
undertaken, the test process and the software design and implementation can proceed
concurrently.
3.6.4 PROTest II SAAM Description and Functional Allocation
The objective of PROTest II is build a fully automated test environment for a Prolog program
(Belli & Jack, 1993). It is a prototype system which performs a declarative (structure) check by
the structure checker, automatically generates test inputs by the test input generator for structural
coverage provided by the test coverage analyser, receives a test program, runs the program
triggered by the test dri ver and finally generates a test report by test report generator for the users.
A detailed textual description of the system can be found in (Belli & Jack, 1993).
,--- ... _-------------------------------- ... _--, : Test Development I : Test Execution
, I .......................................................................................................................... 1- ...................................................... I
I I
I Test Measurement
Structure Repott
Manual Source ¥~ '--_--I Code
Instrumentatio L ________________________________ _
DLTIl Program
, , ----- ... -----------------------------------_.
I
Test Report
Test Driver
1 __ - __ ---------_·
Prolog Source Code
Figure ."'.21: The PROTest II system structure and functional allocation through SAA\1. adapted from (Eickelman & Richardson, 1996)
89

The PROTest II SAAM description and functional allocation is shown in Figure 3.21. It includes
three of the canonical functional partitions: test execution, test development and test
measurement. Test failure analysis, test management and test planning are missing. It does not
achieve the goal which is a fully automated test environment but rather provides an interactive
test environment that partially automates test execution, test development and test measurement.
Eickelmann and Richardson (1996) point a major deficiency highlighted in PROTest II, which
does not have structural separation between the functions of test development and test
measurement. The test input generation process is interdependent with the test coverage process.
3.6.5 TAOS SAAM description and functional allocation
TAOS provides a toolkit that automates many tasks for supporting the testing process
(Richardson, 1994). This support includes test artifact management, test development, test
execution and test process measurement. TAOS consists of several components: a test data
generator, test criterion deriver, artifact repository, parallel test executor, behaviour verifier and
coverage analyzer. A unique aspect of TAOS is its support for test oracles and their use to verify
behavioural correctness of test executions. TAOS also supports structural/dependence coverage
by measuring the adequacy of the test criteria coverage and regression testing by identifying tests
associated or dependent upon modified software artifacts. This is accomplished by the integrating
the ProDAG (Program Dependence Analysis Graph), Artemis (source code instrumentor) and
LPT (Language Processing Tools) with TAOS. A complete detailed textual description of TAOS
and its integration with the Arcadia SDE is given in (Richardson, 1994). Specification-based test
oracles as automated by TAOS are described in (Richardson, Aha & O'Malley, 1992).
The TAOS SAAM description and functional allocation is shown in Figure 3.22. It provides
support for test execution, test development, test failure analysis, test measurement and test
management. TAOS does not support the test planning. As shown in Figure 17, TAOS achieves
loosely coupled components through separation of concerns with respect to system
functionalities. Test generation and test execution are independent processes without connecting
to other functional areas. Test failure analysis and test measurement are invoked by the test driver,
but remain highly cohesive components within their respective functional partitions. The high
90

.. ------------. I Test Development:
Test Generator
-------------. I Test Measurement:
Coverage Report
. - - - -- --- - -- - -. I
, Test Execution
I Test Execution
Task
:~ , ' I
Source Code
--------------. : Test Failure Analysis: , ,
Test Failure Report
I , ,
--------+-- '-----1---+---· '------+------
~- ----------- --* --------------* ----. L--__ ~
Ada ~ Source LPT Language Code
Object Management Process Management
TAOS Manager
, Process Tools .. _-----------------------------------------
Figure 3.22: The TAOS system structure and functional allocation through SAAM, adapted from (Eickelman & Richardson, 1996)
degree of separation of concerns is facilitated by the primary component integration mechanism
which is the object management system. It supports persistence of data and data relations in an
active repository.
TAOS integrates several multipurpose components: ProDAG, LPT and Artemis. Effective data
integration is achieved through a consistent internal data representation in the Language
Processing Tools (LTP) which is also used by ProDAG and Artemis. Integration of generic
analysis tools supports multiple test and analysis purposes. ProDAG, for instance supports the
usc of program dependence graphs for test adequacy criteria, test coverage analysis and
optimizing efforts in regression testing.
91

3.6.6 CITE SAAM description and functional allocation
CITE consists of many components and each component covers a specific area of automated test
management. It includes a test driver (TD), test coverage analyzer (TCA), test data reviewer
(TDReview and TDPP) , test generator and databases and a rule base. Additional tools have been
integrated for use with the system, such as the GCT test coverage tool and the Expect interactive
session simulator which are based on utilities obtained from the public domain. A complete
textual description of CITE is given in (Vogel, 1993).
, .......... _-_ .. _--. Test Measurement
Test Coverage Report
, , Test
, Development Test Failure Analysis
Test Failure ' Report
,-------------. Test
Execution
Test Report
.------t,--, Test
Driver
TD
, I I I I
, ... t . :I ... , ... ' ~ ~ J ~ ~ l ~ ~ ~ , ... '~ ~ ~ J ~ 1 ~ ~ ~ , .. ~ : t : 1" ..... , : Test Management
: Object Management
,
Rule-Based Process Template
,
,------ ________________________________________________ J
Source
Code
Figure 3.23: The CITE system structure and functional allocation through SAAM, adapted from (Eickelman & Richardson, 1996)
As shown in Figure 3.23, the SAAM graphical depiction of CITE reflects the structural
separation desired in a system that automatically controls the test process. It provides support for
test C\cclltinn, test development, test failure analysis, test measurement and test management.
Testing planning, howe vcr, is not supp0l1ed.

CITE has achieved the desired functionalities through allocation to structurally cohesive
components. The process control exercised by the rule-based is evidenced in direct control to
each functional area. This clean separation of concerns supports the primary goal of a fully
automated and general purpose software test environment.
3.6.7 STE Comparison
The stated goals of automating the test process are shared by four STEs, PROTTest II, TAOS,
CITE and SITE. The use of SAAM clarifies how well each STE achieves this goal and to what
degree. The use of SAAM provides a canonical functional partition to characterize the system
structure at a component level. The functionalities supported and structural constraints imposed
by the architecture are more readily identified when compared in a uniform notation. A
comparison of four STEs, PROTest II, TAOS, CITE and SITE, made by the SAAM is shown in
Figure 3.24.
Test Test Test Failure Test Test Test Execution Development Analysis Measurement Management Planning
PROTest II J/ J/ J/
TAOS J/ J/ J/ J/ J/
CITE J/ J/ J/ J/ J/
SITE J/ J/ J/ J/ J/ J/
Figure 3.24: A comparison of four STEs by SAAM
However, test process focus was identified for each STE across the software development life
cycle, shown in Figure 3.25.
93

Analyze Software Test Test Case Test Problem Design Coding Design Generation Execution Evaluate Tests
~ implementation-based testing ~
Analyze Software Coding Problem Design Test with Test Test Case
Evaluate Tests Execution
Specification Design Generation
~ specification-based testing ~
Analyze Software Coding Problem Design
Specification Test Evaluate Tests with Test Test Case Execution and Software Modelling Design Generation
~ statistics-based testing •
Software Development Life Cycle
Figure 3.25: Test process focus appears the life cycle
• PROTest II and CITE support implementation-based testing and have a destructive testing
process focus. This focus has a limited scope of life cycle applicability, as it initiates testing
after implementation for the purpose of detecting failures.
• TAOS SUppOltS specification-based testing and has an evaluative test process focus. An
evaluative test process focus provides complete life cycle support, as failure detection extends
from requirements and design to code.
• SITE supports statistics-based testing and has a prevention testing process focus. It focuses
on fault prevention through parallel development and test processes. SITE uses the way that
timely testing impro\cs software specifications by building models that show the
consequences of the software specifications.
94

There exist some differences amongst implementation-based, specification-based and
statistics-based testing. With implementation-based testing, only a set of input data can be
generated from an implementation, but the expected outputs can not be derived from the
implementation. In this case, the existence of an oracle (in the human mind) must be assumed
and checking the test results against the oracles has to be done. With specification-based testing,
both test input data and the expected outputs can be generated from a specification. The
statistics-based testing is on the top of specification-based testing with the quality plan before
specification. The quality plan addresses testing issues such as the testing strategy, test tools
needed, acceptance criteria, what reviews are to be performed, risk management (e.g. what tests
not to do, when to stop testing). With statistics-based testing, the tests are developed according
to prevailing standards and at the right time as well as the software quality will be achieved.
3.7 Conclusion
The support of fully automated test environment for distributed applications is a significant issue
for the software development process. In this chapter, an operational environment for testing
distributed applications is proposed. An essential component for developing quality software is
SITE in this operational environment. It consists of control components (test manager, test
driver), computational components (Modeller, SMAD tree editor, quality analyst, test data
generator, test paths tracer, test results validator, simulator) and an integrated database. The
activities of the test process are integrated around an object management system which includes
a public, shared data model describing the data entities and relationships which are manipulable
by these tools. SITE provides automated support for test execution, test development, test failure
analysis, test measurement, test management and test planning.
95

Chapter 4
A Statistics-based Framework For Testing Distributed Software
4.1 Introduction
In this chapter, we extend the concept of the SIADISOAD tree from FAST (Chu, Dobson & Liu,
1997) to the SMAD tree making it a more powerful technique for test data generation and test
result inspection in distributed software. Based on the SMAD tree, we develop a framework
which not only can generate the input messages and a sequence of intermediate message pairs
(in/out events) with their causality relations, but can inspect the test results, both with respect to
their syntactic structure and the causal message ordering under repeated executions.
In Section 4.2 of this chapter, the related work in statistical testing is surveyed. A graph model
is introduced to represent the behaviour both sequential and distributed software in Section 4.3.
Section 4.4 introduces the SIAD/SOAD tree and the SMAD tree as well. In Section 4.5, we
present a framework of distributed software testing based on SMAD tree. Section 4.6 summarizes
my research.
4.2 Statistical Software Testing
.t.2.1 Quality Programming
In quality programming as introduced by Cho, a statistical approach to control the quality of
software is used. When software is viewed as a factory, processing of input units into product
units becomes conceptually equivalent to taking random product units from the software
popUlation. If the product units in the population are all of a good quality, then the units taken
will be of a good quality. A simplified view of the process of quality programming is shown in
Figure 4.1.
96

8-'" H b 'ld "i t "?~ Requirement ow to UI ac ory, S 'f" .....
peCI lcatlon " , What are the inputs/outputs ~ and what is their quality?
Figure 4,1: The process of Quality Programming
Examination
Software testing and software acceptance
As shown, the process is divided into the following stages: model, requirements specification,
design and implementation and examination, This process ensures that quality is built into
software from the beginning of its development.
• Model: given a system to be developed, a model is developed to analyse and understand the
problem, Models including a description of the problem and product to be generated by the
software are built to form the basis of product design and the concept of the software being
developed.
• Requirements specification: requirements are then generated as a result of the modeling
activity. Included in the requirements are software and test requirements. Software
requirements define the functions the software is to perform and the quality characteristics
such as response time, throughput, understandability and portability. Test requirements define
the product units and product unit defectiveness for statistical sampling, sampling methods
for estimating the defective rate of the software population with which to judge software
quality, statistical inference methods and the confidence levels of software output population
quality, the acceptable software defect rate and the generation methods of test input units.
• Design and implementation: with well-defined requirements, software development can be
divided into two channels which can proceed concurrently: software design and
implementation and software test design and implementation. Top-Down programming and
critical-module-first implementation methods are used in the software channel. Methods
97

using the fonnulation of sampling plans are used in the test channel. During the design and
implementation phases, interfaces between the channels are incorporated to ensure that
quality is built into the software at every stage of development.
• Examination: software testing is perfonned again on a most--critical-module-first basis to
ensure that the software is integrated on a secure-quality-part basis. If the software passes the
test requirements, delivery to the user takes place. The user employs quality control tools to
determine the acceptability of the software output population, and this becomes the basis for
accepting or rejecting the software.
4.2.2 FAST: a Framework for Automating Statistics-based Testing
FAST (Chu, Dobson & Liu, 1997), which is an extension of the testing concept in qUality
programming, has been proposed to help develop good quality and cost effective software. In
FAST, we present a "Symbolic Output Attribute Decomposition" (SOAD) tree, which is similar
to the structure of the SIAD tree, to represent the syntactic structure of the product unit and
product unit defectiveness. Based on this tool, automated inspection of the product unit can be
achieved. It is a starting point based on single thread software. Extension to distributed software
will be introduced in Section 4.3 and Section 4.4. The role of the FAST is shown in Figure 4.2.
• Requirement specification: The test requirement can be divided into two groups: functional
and quality requirements. These requirements define the input domain, product units and
product unit defectiveness for statistical sampling, sampling methods for estimating the
defective rate of the software population with which to judge software quality, statistical
inference methods and the confidence levels of software output population quality, the
acceptable software defect rate and the generation methods oftest input units. From functional
requirements, the input domain and the product units are defined. From quality requirements,
we can define the product unit defectiveness and specify the quality statement. Without the
definitions of input domain, product unit and product unit defectiveness, it is not possible to
control the quality of the data produced by a piece of software.
98

Function Specification ~----.
provide --.
t!!enerate
Generate Random Number
generate Define r---.
Input Domain provide --.--~ information for generating test data
Automated ..-___ ..J When to stop testing
Test ..------------.
Data Generator ---.
Quality Specification
+
Statistical Analysis
input generate
How good the software is ..-__ ....l
+ The range of defecti ve rate
Requirement Specification ---'------.
Define Product Unit and its Defecti veness
Quality
+-----. '--_A_n_i .... l_yS_i_S-..J
generate '--::.------. c::::7 '-------. ~ Quality Index
Figure 4.2: FAST: a framework for automating statistics-based testing
• The SIAD/SOAD tree: One of the major problems in software development is ambiguity in
requirements specification, particularly specification of the input domain and product unit.
The SIAD tree is a syntax structure representing the input domain of a piece of software in
a form that facilitates construction of random test data for producing random output for quality
inspection. It is used to represent the hierarchical and "network" relation between input
elements and incorporate rules into the tree for using the inputs. Input is constructed from data
of different characteristics that are called input attributes. Associated with each input attribute
is a syntax structure. The structure can be decomposed into a lower level substructure and so
on, until futther decomposition is not possible. The lowest level substructure is called a basic
element. If the basic element is numerical then the lower bound and the upper bound of the
99

element are given under the element. The overall structure is a tree. The tree can be arranged
as a linear list with the structure preserved by a set of symbols called the tree symbols. In FAST,
the specification of the product unit and product unit defectiveness is addressed by the
"Symbolic Output Attribute Decomposition" (SOAD) tree which is similar to the structure
of the SIAD tree.
• Statistical Analysis: Testing a piece of software is equivalent to finding the defect rate of the
product unit population generated by the software. The defect rate is defined as the ratio of
the number of product units that are defective to the total number of product units that the
software has generated. The total number of product units, denoted by N, of any non-trivial
piece of software ranges from extremely large to infinite, but can still be treated as an object
of statistical interest. Although impossible in practice, it can be conceptually assumed that all
N units have been produced and analysed. Each of them can be classified as defective or
non-defective. If there are D units that are defective, then the product unit population defect
rate, denoted bye, is e = DIN. Since it is impossible to obtain all N units, the best approach
is to estimate by means of statistical sampling.
• Test Process: Based on the SIAD/SOAD tree, FAST can automatically generate test data with
an iterative sampling process which dynamically determines the sample size n (when to stop
testing); the software quality can be estimated with the inspection of test results which can be
automatically achieved by lexical and syntax analysis and the product unit of population
defect rate which can be estimated from the sample defect rate which may be imposed on the
software as the software quality index (how good is the software after testing).
• The major advantages of FAST are: Firstly, testing can be completely automated using a
statistical approach, from the generation of test data based on the SIAD tree to the inspection
of test results based on the SOAD tree; secondly, changing distributions do not need to be
acknowledged since the SIAD tree is static; thirdly, the software quality can be assessed using
statistical techniques (such as sampling or inference); fourthly, the test data do not need to be
stored for regression testing, as it only requires a small space in which to keep the random
number seeds; fifthly, after the specification of requirements is developed, the generation of
test data is independent from the software design and implementation; sixthly, we do not need
100

the test oracle to compute expected results and finally, testing can be performed based on the
user's actual execution of the soft~are. A comparison of FAST with Clearnroom (Dyer, 1992)
and formal testing (deterministic testing from formal specification) presented by Horcher and
Peleska (1995) is shown in Table 4.1.
Table 4.1: Software testing method comparison
Formal testing Cleanroom FAST
Test data selection deterministic random random
Dependabili ty biased by the selective unbiased by using the unbiased by using
evaluation choice of the test inputs operational input profile random sampling on
output population
# test data low high high
Test data generation automatic automatic automatic
Output inspection automatic manual automatic
Sampling no input domain output population
(SIAD tree)
Test data storage yes yes no (keep random
number seeds)
Reliability no execution time execution number assessment
• In any software factory, it is difficult to attain fault-free software. If users require high-quality
software, the cost of software development is correspondingly high. In comparing FAST and
other testing methods, we find that there is more front-end test planning in FAST in
developing the SIAD/SOAD tree, but this is effectively balanced by lower cost in the test
operation, since testing can be automatically achieved. We now discuss the relation between
FAST and other testing techniques. Current software testing strategies use either conventional
testing approaches, statistical testing approaches or both. The strategy of software testing
advocated here is to use FAST on the most critical module and to use other conventional testing
techniques on the remaining modules, or to use the conventional testing techniques first for
removing the more easily discovered faults and use FAST for assessing the quality of the
101

resulting software. The best way to mix the testing techniques is deduced from an analysis of
their complementary features.
4.3 Modelling Distributed Software
4.3.1 A Graph Model for Modelling Distributed Software
Distributed software is constructed from a collection of sequential processes and a network
capable of implementing unidirectional communication channels between pairs of processes for
message exchange. Channels are reliable but may deliver messages out of order. It means that
the communication network is assumed to be strongly connected.
A distributed computation describes the execution of distributed software by a collection of
processes. The activity of each sequential process is modelled as executing a sequence of events.
An event may be internal to a process and cause only a local state change, or it may involve
communication with another process.
From an abstract point of view, a distributed computation can be described by the types and
relative order of events occurring in each process. Let ~ denote the set of events occurring in
process Pj, and let E = El U .... U En denote the set of all events of the distributed computation.
These event sets are evolving dynamically during the computation; they can be obtained by
collecting traces issued by the running processes. As we assume that each Pi is strictly sequential,
the events in Ei are totally ordered by the sequence of their occurrence. Thus, it is convenient to
index the events of a process Pi in the order in which they occur: ~ = {eil, ei2, ei3, ... }. We will
refer to this occurrence order as the standard enumeration of ~ (Schwarz & Mattern, 1994).
A graph model is used to define both sequential and distributed software as follows:
102

Definition 4.1: A message flow graph (MFG) of a software S is a directed graph G = (E,M,s,r,
1,0), where
(1) E is a set of events,
(2) M is a set of messages. It is a binary relation on E (a subset of E X E), referred to as a set
of directed edges,
(3) s and r are, respectively, unique send-message and unique receive-message events, s,r E E,
(4) I and 0 are, respectively, input and output messages.
The MFG is a representation of a directed graph which shows how input messages are
transformed to intermediate messages and output messages through a sequence of functional
transformations in a single-thread software.
The MFG is deterministic, however, the execution behaviour of a distributed computation is
nondeterministic. Because of indeterminacy, it is difficult to know the possible execution
behaviours of a distributed software, to exactly identify the execution behaviour to be tested, and
to control the software execution for testing a specific execution behaviour. Based on the analysis
of execution behaviour of distributed software, a message-flow-graph-based model is not suited
for modeling the execution behaviour of distributed software. Therefore, a Distributed Message
Flow Graph (DMFG) is proposed.
Definition 4.2: A Distributed message flow graph (DMFG) of a distributed software DS is a pair
(D,W), where D is a set of MFG, D = {GpI. Gp2, ... , GPm } where MFG Gpi corresponds to
process i and W set of communication edges, W = { Cij, ... , cm,n } in a distributed software. Cij
is a subset of Ei X Ej , where Ei in Gpi , Ej in GPj and Gpi #- Gpj.
The DMFG consists of a set of MFGs and a set of communication edges showing message flow
amongst processers in distributed software and provides us a useful and intuitive way of
expressing execution behaviour in a distributed software.
103

We also need the concept of the EventlMeesage Path (EMP) and the Distributed EventlMessage
Path (DEMP) as basis for building the SMAD tree in my work.
Definition 4.3: An Event/Message Path (EMP) (Jorgensen & Erickson, 1994) is a sequence of
event executions communicated by messages. An Atomic System Function (ASF) is an input
message, followed by a set of EMPs, and terminated by an output message. A Distributed
EventIMessage Path (DEMP) is a sequence of event executions communicates by messages in
the same process or between different processes. An DistributedAtomic System Function (DASF)
is an input message, followed by a set of DEMPs, and terminated by an output message.
An EMP starts with an event and ends when it reaches an event which does not issue any messages
of its own. An ASF is an elemental function visible at the system level. Since DEMPs are
composed oflinked event-message pairs in a distributed computation, they interleave and branch
off from other DEMPs to provides analogous descriptive capabilities to the integration testing.
The construction of the DASF reflects the even-driven nature of distributed software. Execution
of distributed software begins with an event, which we refer to as a port input event. This
system-level input message triggers the event-message sequence of an DEMP. This initial
DEMP may trigger other DEMPs. Finally the sequence of DEMPs should end with some
system-level response (a port output event). Together, the initial and final events together with
the intermediate distributed events constitute a DASF. As such, DASFs constitute the point at
which integration and system testing meet, which results in a more seamless flow between these
two forms of testing.
We now have all the concepts we need to describe causality and the 'happens before' relationship.
4.3.2 The Causality Relation
In a DMFG, it is sometimes impossible to say that one of two events occurred first. The relation
'happened before' is therefore only a partial order of events in this graph (Lamport, 1978). In
contrast, events on a MFG are totally ordered, so this order can easily be determined, since it is
104

possible to use the same clock to determine the time at which each event occurs. The 'happened
before' relation defined over E in DMFG determines the causal order of those events. We can
formalize this relation by defining the causality relation as follows:
Definition 4.4: In DMFG, the causality relation -> ~ E X E is the smallest transitive relation
satisfying:
(1) If eJej, ekj E Ek occur in the same process Pk, and i < j in DEMP, then eki -> ekj.
(2) If eJej E Sk is a send event and ekj E rk is the corresponding receive event in the same Pk,
then eJej -> ekj.
(3) If (ekh elj )E W, then eJej -> elj, where eki E Ek and elj EEl, Ek ;z!:EI.
What this means is that the causality relation extends the partial order relation defined by the
standard enumeration of EI, E2, ...... , and En by defining a new relation "->". Informally, the
causal relationship between events can be stated in terms of the causality relation as follows: An
event ej may causally affect another ej if and only if ej -> ej-
Any pair of events not related by the causal order are logically concurrent and cannot affect each
other. The determination of an ordering of events in a distributed system can be described in a
system of causal timestamps based on partially ordered logical clocks (Fidge, 1991; Lamport,
1978; Schwarz & Mattern, 1994). When a receive event is executed, the logical clock in the clock
vector is updated to be greater than both the previous local value and the logical clock of the
inCOming message. The recording of causal timestamps is useful for detecting whether or not the
determination of an ordering of events in distributed systems.
While causal timestamps allow us to determine the relative order of any pair of events, they
cannot be used to determine if there are any intervening events (Cherirton & Skeen, 1993). This
means that messages can be delivered in an order that violates causality. As an improvement, we
extend the -> relationship to include messages. Following definition 4.4 of the causality relation
-> of events, we define the causality relation of two messages as follows:
105

Definition 4.5: In DMFG, the causality relation -> ~ (MUW) X (MUW) is the smallest
transitive relation satisfying:
(1) If mj, mj E Mk occur in the same process Pk, and i < j in DEMP, then ffij -> mj.
(2) If a process receives mj prior to m} then mj -> mj.
What this means is that there is the same causality relation between message send events and the
corresponding message receive events. It states that messages between processes can be only be
delivered in a causal order, since there is no notion of a deadline or expiration time to the data.
Causal message ordering guarantees that the order of delivery of messages does not violate
causality in systems of communicating processes. Typically, messages are delayed at the receiver
until all causally preceding messages are delivered. Specifically, if two input messages are
sending to execute the same DASF and the sending of one input message happens before the
sending of another input message, then the output message corresponding to the first input
message is delivered before the second output message at all processes in the DASF.
One of the major problems in dynamic testing of distributed software is reproducible software
execution. Distributed software often makes non-deterministic selections of interleaving events.
Thus repeated executions of distributed software with the same test data may result in the
execution of different DEMPs. We also can examine repeated executions of different software
paths which derive from the same input message to test the casual relation between messages.
4.4 The SMAD Tree
The processes which will be considered in distributed system are message-driven. An input
message could be a request from another process to perform a service, or a report that an event
has occurred. As a response to an input, the process will become active and an output message
will be produced as a result. An intermediate message will be used to denote a sequence of
inputl(expected) output pairs, which drive the DASF from its input message to its output message.
An output message could be a command to another process or null. After the output message has
106

been produced, the process either terminates itself or waits for further input messages. In this
section, we extend the concept of SlAD tree for the Quality Programming by Cho (1988) to
SMAD tree specifying all possible delivered messages between events.
To guide testers in testing distributed software, the tool, the SMAD tree, is presented. Extending
this concept of the SIAD tree, we can specify all possible delivered messages between events by
means of the "Symbolic Message Attribute Decomposition" (SMAD) tree. It combines with
classification and syntactic structure to specify all delivered messages in the DMFG. In the upper
level of the SMAD tree, we classify all delivered messages into three types of message: input
message, intermediate message and output message. Each type of message has a syntactic subtree
describing the characteristics of messages with a time domain so that it can be determined
whether messages were delivered in an order consistent with the potential causal dependencies
between messages. The structure of the SMAD tree is shown in Figure 4.8:
'1' '1' happen I happen I before I before I
s_name c_name
XI,Xl.l,X1.2,X1.3,Xl.l.l.l, ... are tree symbols, s_name, c_name ... are tree elements
Xl
'1' happen I before I
c_name
Syntactic Structure
'1' '1' happen I I happen before I I before
s_id c_id
Figure 4.8: A tree structure of the SMAD tree
The SMAD tree is used to define test cases, which consist of an input message plus a sequence
of intermediate message corresponding to messages in DEMPs, to resolve any non-deterministic
choices that are possible during software execution, e.g., exchange of messages between
processes. In other words, there are two uses of the SMAD tree: one is to describe abstract syntax
oftest data (including temporal aspects); another one is that one SMAD tree is instantiated for
each test, to hold data occurring during the test.
107

Example: A distributed database system for a Grade Report
Consider a grade report database system that has four relations (shown in Figure 4.9) distributed
over two different processes which communicate with each other by message exchange.
STUDENT COURSE
student id student name
first name surname
course id course name teacher id
CS2010 Data Base N4508 945216775 Huey-Der Chu
TEACHER
GRADE teacher id teacher name
student id course id score N4508 Michael Lee
945216775 CS2010 B
Figure 4.9: A distributed database system for grade report
Query: Give a Student name and Course name to find the score of this student in this course.
To answer this query, we use the DMFG to describe their behavior in Figure 4.10:
e20 : Initial event , elO: Ini!ial event _____ _
,'student name \ ' course name.': -~-.
, \
........ - ...... Process 1
Process 2 e23 : Final event
- EMP
••• DEMP
- -:.- Message
Figure -+ 10: A DMFG for a computation for a grade report
108

In the get-c_id event, we can get the course id for the given course name from the COURSE
relation and pass this course id to the show-score event. In the get-s_id event, we also can get
the student id for the given student name from the STUDENT relation and pass it to the
show-score simultaneously. When receiving both the course id and the student id, we can get the
value of score from the Grade relation. The simple SMAD tree for messages in this DMFG is
shown in Figure 4.11. A detailed SMAD tree describes the decompositions of messages.
index
1 2 3 4 5 6 7 8 9 10 11 12
rule index
1 2 3 4 5 6 7 8 9 10
subrule index
1 2 3 4
symbol
Xl X1.1 X1.l.1 Xl. l. l.1 X1.1.l.l.1 Xl.l.2 Xl.2 Xl.2.1 Xl.2.2 Xl.2.3 Xl.3 Xl.3.1
tree element
!llessage mput message studenCname, K1 bytes first name, K2 bytes last name, K3 bytes course_name intermediate message studenUd teachecid course_id output message score, K4 bytes
(a)
rule
1,7 2,4 3,4
4,8,9
5,10 5
5,10
4,6
rule description subrule index
Kl = K2 + K3 1,2 K2 1 K3 2
Excluding characters + * /' "< > & $ ; : ... Including characters 0 1 2 3 4 5 ... K4 3,4
Happened before studenUd Happened before course_id
Happened before teachecid Happened before score
(b)
subrule description
lsK2s20 2 s K3 s 15 1 s K4 s 3 K4 is an integer
(c)
remark
length of first name length of last name length of score
Figure 4.11: A simple SMAD tree for a grade report database system
109

4.5 A Framework For Testing Distributed Software
In this section, we develop a framework for the test data generation and test result inspection of
distributed software. We have extended the concept of the SIAD/SOAD tree to a new construct
which we term the SMAD tree making it a more powerful technique for test data generation and
test result inspection in distributed software.
A test data input message can be generated based on the input message part in the SMAD tree
and rules for setting up the time domain of messages which are incorporated into the tree (initial
event). The causal message ordering can be inspected based on the 'happen before' rule in the
SMAD tree during the lifetime of the computation. The test results can also be inspected based
on the output message part in the SMAD tree (final event), both with respect to their syntactic
structure and the causal message ordering under repeated executions. The framework is shown
in Figure 4.12.
Statistical Analysis --------------------------T------------------------ ...-When to stop testing
~sarnPle size
Test Data Generator of Messages
provide information
I
How good is the software
Distributed , Software ~_~:
under Test
t quality , measurement
Test Results
Validator
-
~ provide t information ,
Test Bed with Specification (SMAD Tree)
Functional Requirements t Quality Requirements
Problem Modelling I---
Figure 4.12: A framework for distributed software testing
110

4.5.1 Statistical Analysis
Testing a piece of software is equivalent to finding the defect rate of the product unit population
generated by the software. The defect rate is defined as the ratio of the number of product units
that are defective to the total number of product units that the software has generated. The total
number of product units, denoted by N, of any non-trivial piece of software ranges from
extremely large to infinite, but can still be treated as an object of statistical interest. Although
impossible in practice, it can be conceptually assumed that all N units have been produced and
analyzed. Each of them can be classified as defective or non-defective. If there are D units that
are defective, then the product unit population defect rate, denoted bye, is e = DIN. Since it is
impossible to obtain all N units, the best approach is to estimate by means of statistical sampling.
If the population is conceptually shuffled, it provides a basis for applying the principle of
binomial distribution sampling. The application of the distribution often arises when sampling
from a finite population consisting of a finite number of units with replacement, or from an
infinite population consisting of an infinite number of units with or without replacement. The
probability of getting x defectives in a sample of n units taken from a population having a defect
rate of e is given by the binomial distribution:
b(x) = (:) 9'(1- a)~' The mean and variance of the distribution are given by:
J.t = ne
cr2 = ne(1 - e)
A sample of n units is taken randomly from the population. If it contains d defective units, then
the sample defect rate, denoted by eO, is eO = din. If n is large enough, then the rate eO can be
used to estimate the product unit population defective rate e. These two major testing issues are
discussed in the following sections.
How good the software is after testing
The defect rate of the population can then be estimated from d. The estimate may be expressed
in an interval called JOOc% confidence interval, where 0 $ c $1. An approximation of the JOOc%
confidence interval of the population defective rate may be computed by:
11l

° v' a°(1 - aO) J ' a + tn-l, CY/2 ----n
(4.1)
where tn-l,CY/2 is called the value of the Student t-distribution at n - 1 degrees of freedom and
ex = 1 - c is called a risk factor (In statistics, a binomial distribution can be approximated by a
normal distribution). Formula (4.1) can be used to estimate the mean of the product unit
population, denoted by 1.1 • Once the value of 1.1 is estimated, the product unit population defect
rate e can be computed by 1.1 = na. If the value of a is acceptable, then the product unit population
is acceptable. The piece of software is acceptable only when the product unit population is
acceptable. Therefore, the estimated product unit population defect rate a can be viewed as the
software quality index.
When to stop testing
The accuracy of the estimates depends on the sample size. In general, the larger the size, the more
accurate the estimate. The value of n may be computed by the formula:
n= (4.2)
where a is the desired accuracy factor such that I a - aO I = aa, and z is the value of z aJ2, which
is the number of standard deviations in the normal distribution such that the area to its right under
the normal curve is al2. The value of z aJ2 is the same as tn-l, CY/2 if n is large, e.g., n ~ 30. Since
the population defect rate a is unknown, the determination of n requires dynamic adjustment
during sampling. An adjustment procedure, which is iterative in nature, is given as follows:
112

Stepl: Take an initial sample of a small size, no units (e.g., 50) from a software product population
by executing no input units.
Step2: Let 00° be the defect rate of the sample of size no,
Step3: Compute the sample size 11i+l by formula (4.2) as follows:
11i+l = z2(1 - 8iO)
u20iO
where 8iO is the cumulative defect rate of the cumulative sample units 11i already taken
after the ith iteration, for i = 0,1,2, ... ,
Step4: If 11i+ 1 > 11i, then take (11i+ 1 - 11i) additional units and repeat Step3 and Step4.
StepS: Else stop. The total number of sample units taken is sufficient.
The final sample defect rate is then used to estimate /..I. and cr2. In any factory it is almost
impossible to produce a defect-free product lot: therefore, the conformance of product quality
is usually measured by the defect rate being less than an acceptable number, e.g., 8 < 0.01. With
a statistical sampling method, a confidence level of 98% certainity can be imposed on the final
value of the estimated defect rate.
4.5.2 Quality analysis
If the software output is defined in terms of the "product unit", then the output is a coIlection of
product units called the output population of the software. For any non-trivial software, the
population contains a very large number of units. The goal of software testing is to find certain
characteristics of the population such as the ratio of the number of defective units in the
population to the total number of units in the population. The ratio may be called the defect rate
of the population and may be imposed on the software as the software quality index.
The sampling processing procedure discussed in section 4.5.1 above represents the drawing of
a product unit at random from a binomial distribution. If the number of defective product units
in the sample is less than the tolerable number of defecti ves determined by the selected sampling
plan, then the software can be delivered to users as acceptable. Otherwise, the developer should
improve the quality by correcting the errors found during the test.
113

The quality statement defines software quality that is equivalent to p% of the output population
being non-defective (the acceptance level). The result of the iterating sampling process, sample
n, will be dynamically saved into a sample size file for providing an information to the test data
generator. The values of confidence interval also is computed and will be saved into a file for the
range of defect rate for supporting the evaluation of software quality by the test results validator.
To analyse the failure data collected during the statistical testing a reliability model is need. The
model is based on a control chart with three regions, reject, continue and accept, as shown in
Figure 4.13.
Reject Continue
sampling
Accept
r
Sr: the cumulative number of defectives in the sample of r units
Figure 4.13: A control chart for statistical analysis
The defect rate is plotted in the chart. As long as the plots fall in the continue region, the testing
has to continue. If the plot falls in the rejection region, the software reliability is so bad that it
has to be rejected and re-engineered. If the plots fall in the acceptance region, the software can
be accepted based on the required quality statement with given confidence and the testing can
be stopped.
114

4.5.3 Test Data Generator of Messages
The process of automated test data generation follows as the following steps:
Stepl: Generate the number of test data M for each sample by random number seed,
Step2: The construction of test data using the input message part of the SMAD tree can be
accomplished as follows:
2.1 Let K be the number of elements in the SMAD tree. Each element in the tree is indexed
by a number ranging from 1 to K. A random number selected from [1,K] is produced
by using a random number generator.
2.2 The element with its index equal to the random number is selected.
2.3 If the element has a parent in the SMAD tree, then go backtracking to select it.
Step3: A total of M elements will be randomly sampled from tree for designing test data.
For example, there are 6 elements in the SIAD tree of Figure 4.6. A test data includes one student
id and several course ids. The student id is generated from the index 2 of the SIAD tree. Two
course ids are to be chosen for a sample using random number generation producing 5 and 6. The
elements in index 5 and 6 are drawn for constructing the test data with the student id. According
to this process, the test data can be generated as Table 4.2:
Index
2
4
5
6
Table 4.2: A test data is drawn from SIAD tree
Tree Symbol
X1,l
X1,2,1
X1,2,1,l
Xl,2,2
Tree Element Remarks
student id Sampled element
CS Descriptive element
0210 Sampled element
AM Sampled element
In this sampling, it takes two course ids - 'CS021O' and' AM'. The second course id is used
to conduct the invalid test (incomplete data).
115

4.5.3 The Construction of the Causality Relation
The 'happened before' rule in the SMAD tree can be used for examining the causal message
ordering. A partial order of all possible messages between events can be built based on the
'happened before' rule in the SMAD tree. For example, there are six messages, studenCname,
course_name, studenCid, teachecid, course_id and score, in SMAD tree for a grade report
database system as shown in Figure 4.11. The rules 8,9, 10 are therefore only a partial order of
messages in this system. According to definition 4.5, Figure 4.14 shows a space-time diagram
for the causality relation.
Porc 1
Porc 2
Figure 4.14: A causality relation for messages
4.5.4 Test Results Valida tor
The output message part in the SMAD tree can be used as a tool for describing the expected result
which satisfies the user's requirement and as a basis for analyzing the output messages
automatically, particularly in non-numerical applications such as an interpreter and updating a
data base.
Validate the syntactic structure
The result of executing an input by the software can be classified into two categories: defective
and non-defective. Each product unit must be carefully analyzed for its conformance to the
software requirements in order to reach the classification. The outcome of the analysis leads to
classifying the output into either of the categories which, in turn, results in the acceptance or
rejection of the software. Any unfair bias can increase the producer's risk of having good software
rejected or can increase the user's risk of accepting poor software.
116

Test results can be inspected by manual, semi-manual or automatic means, which depend on
software applications. A SMAD tree can be used as a tool for describing the expected result which
satisfies the user's requirement and as a basis for analysing the product unit automatically,
particularly in non-numerical applications such as an interpreter and updating a data base. It is
a data structure containing a record for each output element with fields for the attributes of the
output element.
Based on the SMAD tree, the process of automated test result analysis is shown in Figure 4.15:
read cliaracter
lexical analyzer
pass token I-----~
get next token
syntax analyzer
match the token with the tree element and examine
~-...-:;.-~ the rules
Figure 4.15: The process of test result analysis
The lexical analyzer is the first phase of inspection. It main task is to read the characters of test
results and produce as output a sequence of tokens. In this process, the syntax analyser obtains
a string of tokens from the lexical analyser, as shown in Figure 4.15, and verifies that the string
is defective or nondefective by matching the token with the tree element and examining the rules
in the SMAD tree. According to the different types of software applications, the algorithm of
inspection based on its SMAD tree can be separately designed. The main advantage of using the
SMAD tree here is that we do not need a test oracle to compute expected results. The SMAD tree
can be used directly for automatic inspection whether or not the results produced by the software
are correct.
Examine the causal message ordering
Because of the existence of non-deterministic behaviour, it is generally impossible to test all
distinct execution behaviours of distributed software by proper selection of test cases and
reproduce previous test results by repeating execution with the same input. The causality relation
117

between messages is a fundamentally new approach to the analysis and control of execution
behaviour of distributed software. Based on the 'happen before' rule in the SMAD tree, we can
receive an accurate representation of the message orderings, see all causal relationships, and
derive all possible totally ordered interleavings. As a result, the technique greatly reduces the
number of tests required. It is never necessary to perform the same computation more than once
to see whether different message orderings (interleavings) are possible. However, we need to test
the causal message ordering to guarantee that order of delivery of messages does not violate
causality in systems of communicating processes.
We can examine the execution of different software paths which derive from different test data
or from the same test data (repeated execution) to test the causality relation between messages.
Specifically, if two input messages are sending to execute the same DASF and the sending of one
input message happens before the sending of another input message, then the output message
corresponding first input message should be delivered before the second output message at all
processes in the DASF. Figure 4.16 describes this behaviour in DMFG.
Clientj
for a grade report
Clientj
Figure 4.16: A DASF with two clients in distributed software
Consider a DASF on a distributed computation with receiving two input messages mj and m} We
can test the output messages corresponding mj and Illj using causality relation to ensure the causal
consistency of processes in this distributed software.
For example, there are two EMPs and one DEMP in Figure 4.10:
118

According to this query, we can get the DASFi based SMAD tree as shown in following:
DASFj : eilO -> ei20 -> EMFil -> DEMFi -> ei23,
where eilO is an event for generating student name ( input message mi ),
ei20 is an event for generating course name (input message mi),
ei23 is an event for inspecting test result (output message).
Figure 4.17 shows a space-time diagram for the events in the computation with two different
input messages in two different cases. There are two input messages mi and mj corresponding
two different execution behaviours: DASFi for clienti and DASFj for clientj, where
, ",I 2 ' 3 4
eilO eill ",ejlO ejll Pore I •
~ • \. :.( :.(
Pore 2 • 0 • • • :.( 1 , :(3 4 5 6 7 8 ei20 ci21 • ej20 e",,'") ej21 ej22 ei23 ej23 1_-
eilO -> ejlO ~ ei23 -> ej23 (true)
(a) Case 1: causal message ordering is consistent ,
Porc 1
, , 1 '2 3 4 ~eilO ~ ejlO ei11 ejll
: • :::;: :.( :.(
• • • • • ,.." 1 "
,.." 3 4 5 6 7 8 ei20 Ci21 • ej20 ej21 e"." e·')", ej23 ei23 J-- 1_-
Pore 2
eiIO-> ejlO~ ei23-> ej23 (false)
(b) Case 2: causal message ordering is inconsistent
Figure 4.17: A space-time diagram of a distributed computation
119

I can observe the execution behaviour from this space-time diagram. In case 1 in (a), I can test
that the causal message ordering is consistent. However, when we examine case 2 in (b) , we can
see that it violates causality, because the message for clientj at e22 should arrive later then the
message for clientj according to my expectation. In this case, student i will get a grade report with
studentj's grades.
4.6 Conclusion
In the rapid advance of computer technology, distributed computing systems will be the major
trend of current computer system design. In order to take the advantages of these new systems,
distributed software engineering become very important. Because of indeterminacy, it is
generally accepted that testing distributed software is more difficult than testing sequential ones.
However, the area of distributed software testing has received little attention previously.
In this chapter, a graph model suited for testing purposes is proposed for modeling the execution
behaviour of distributed software. To guide testers in testing distributed software, the SMAD tree
which specifies all possible delivered messages is presented. The SMAD tree is used to define
test cases, which consist of an input message plus a sequence of intermediate message, to identify
the execution behaviour to be tested. Based on the SMAD tree, I develop a framework which not
only can generate the input messages and a sequence of intermediate message pairs (in/out
events) with their time domain, but can inspect the test results, both with respect to their syntactic
structure and the causal message ordering under repeated executions.
120

Chapter 5
The Design And Implementation of SITE For A Simple Banking Application
5.1 Introduction
Theory is a wonderful thing, but from the perspective of the practicing engineer, the most
elegant theory ever devised is entirely useless if it does not help us build systems for the
real world.
- Grady Booch (1991)
The framework of automating statistics-based testing and the statistics-based integrated test
environment have been presented and described in previous chapters. In this chapter, a banking
application written using Java Remote Method Invocation (RMI) and Java DataBase
Connectivity (IDBe) will show the testing process of fitting it into SITE. Based on the
framework of automating statistics-based testing, this chapter is arranged in the following
sections as shown in Figure 5.1.
- - - - - - - - - - - - - - - - - - - - - - - - - - - - - - -- - - - - - - - - - - -- - - --
III
5.3
Ba App
nking Iicatton
FAST
, , ,
5.4
~ Modelling
5.7
~ SITE
design
i I
I
5.5 I
I
I --. Requirement I
specification I
I
I
5.8.2
--. SITE t--coding
i I
,It I
I 5.9 I
I Test and I
I integration I
I t_'----------'--- ----00--.
5.6 5.8.1
o 0 - • - 0 - - .- - 0 0 0 - - - f -0 - - - - -,
Application --. Application-design coding
--. I
Delivery
Figure 5.1: The process of developing the banking application with SITE
121

What this implementation would look like to the industrial user is described in Section 5.2. A
simple banking application is described in Section 5.3. Section 5.4 discusses modelling activities
of a physical or conceptual phenomenon being considered for automation via a piece of software.
The requirements specification for the application design and SITE design is defined in Section
5.5. Section 5.6 and Section 5.7 show that application design and SITE design are to proceed
concurrently based on the requirement documents prepared. Section 5.8 shows concurrent
implementations of application design and SITE design. The test and integration is illustrated
in Section 5.9. On successful completion, software delivery takes place. How the test of the
application is conducted together with some comments are given in Section 5.10.
S.2 What The Tool Looks Like
SITE, a statistics-based integrated test environment, provides an operational environment that
automates many tasks in the testing process for Java client/server applications which can be run
across the SUN/Solaris and the PCIWindows platforms. The capabilities provided by the
environment can be divided into control components (the Test Manager and the Test Driver),
computational components (the Modeller, the SMAD Tree Editor, the Test Data Generator, the
Test Results Validator, the Test Paths Tracer and the Quality Analyst) and an integrated database.
SITE provides an easy to use menu-driven interface and searnlessly handles the complexities of
the automated testing of client/server applications.
The cost of testing with SITE is higher, because there is more front-end test planning in the work
of developing the activities of Modelling and Requirement Specifications, however, this is
effectively balanced by less test operation, since testing can be automatically achieved and the
quality index can be estimated. Before using of SITE for automated test execution, a user need
to do some tasks as follows:
• Modelling. The modelling activity includes: firstly, modelling of inputs and outputs. Inputs
are modelled in terms of types of input data, rules for constructing inputs and sources of inputs.
The modelling of output includes the crucial definitions of product unit and product unit
defectiveness on which the design and testing of the application must be based. This part of
122

the modelling includes output quality planning, in which sampling methods and parameters
for software testing and the acceptance procedure are determined. Secondly, modelling of the
application. This activity is analogous to the modelling of a factory. The application itself, as
distinct from its output, is modelled in terms of the description of the process being automated,
rules for using inputs, methods for producing outputs, data flows, process control and methods
for development the software system. A Distributed Message Flow Graph (DMFG) can be
used for modelling the application.
The result of the modelling activities is a document that represents a through understanding
of the problem that the proposed application is intended to solve .
• Requirements Specification. It is the activity of identifying all of the requirements necessary
to develop the application and fulfill the user's needs. This requirements cover all input,
processing and output requirements. The input domain of the application, that is, the types of
input, rules for using the input and constraints on using the input, is identified from the
modelling document and refined. The output requirements are specified for both the software
system and for each module of the system and include refinement of the product unit and
product defectiveness definitions. the SMAD Tree Editor in the SITE is a tool to edit these
requirements and it saves back to the SMAD tree file in the integrated database.
• Modification of the Test Data Generator and the Test Results Validator. The design and
implementation of these two tools depends on the SMAD tree file, therefore, some procedures
inside these two tools are need to be modified for different applications with different SMAD
tree files.
Once these works have been done, the test can be automatically run by the Test Driver. An
example, a simple banking application, which will help to clarify the use of SITE for the
automated testing of client/server applications in following sections.
123

5.3 The Simple Banking Application
A banking application is an embedded software system which is commonly seen inside or outside
banks to drive the machine hardware and to communicate with the bank's central banking
database. This application accepts customers requests and produces cash, account information,
database updates and so on. In this chapter, a Simple Banking Application (SBA) will be designed
as a 3-tier client/server application as shown in Figure 5.2 within a banking enterprise, more
specifically a corporate and distributed database collection for the personal data of customers,
the balance status of customers, the password data and account type data. The corporation seeks
to assimilate their data sources into one virtual data store and access it through a common
interface.
Client 1
'" on Anick Application Database
Server Server _(RMI) (mSQL)
Remote Object ... ... I ~uslQm!.:d
Client 2 ... ... I check I I balance I on Kieldcr balance
Database
• I I on Kenton
• deposit ... .... II pa:"11 •
/ I I type I I withdraw
Database Client n on Kielder on Kielder
on Anick
Figure 5.2: Three-tier System Structure
There are four business activities at this application: check balance, deposit money, withdraw
money and print the statement. One of transactions is as shown in Figure 5.3.

Input : account id, account type and password
~-------------------------------------Business activities:
1. Check the balance
2. Deposit 500 pounds
3. Check the balance
4. Withdraw 250 pounds
5. print the statement ~-------------------------------------
OUtput: balance or a banking statement
Figure 5.3: A transaction of the banking application
This standard transaction will accept customer requests (checking, depositing, withdrawing and
printing) after the customer has input the account id, the account type and the correct password
on the Client site. SBA will retrieve the balance from the database on the Database Server site,
process the request on the Application Server site and save the balance back to the database. It
also will produce the balance or print a banking statement to the customer.
5.4 Modelling
The modelling tasks are to develop a product description and process description, based on the
concept that an application is analogous to a factory. The results of performing these tasks are
recorded in a modelling document.
5 .... 1 Manufacturing Process
The stages of the application process are identified. As a supplement, a DistributedMessage Flow
Graph (DMFG) for the banking behaviour is shown in Figure 5.4.
125
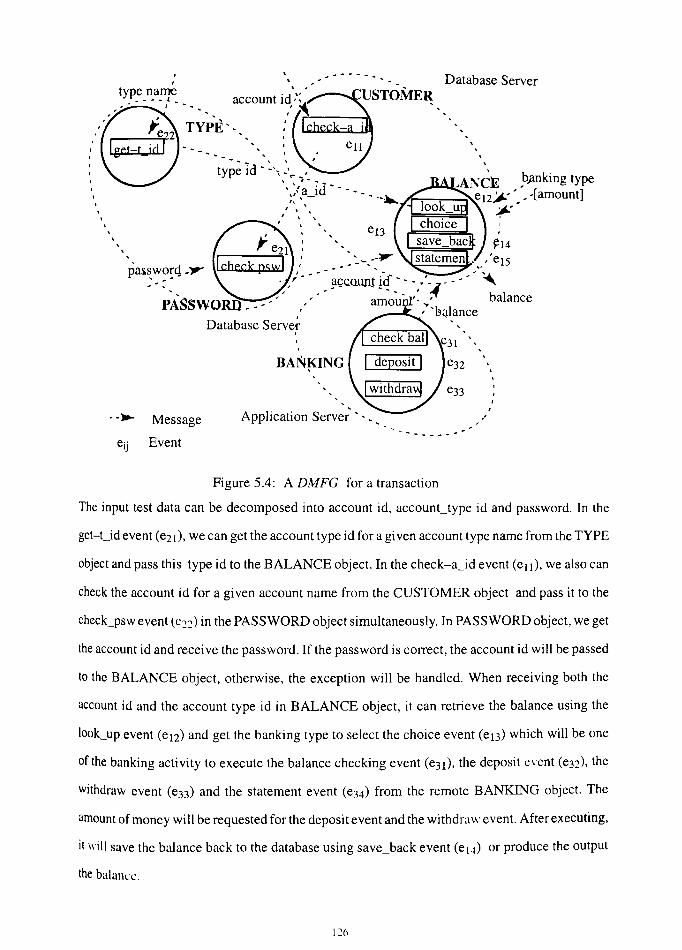
, ,
. -.. Message
eij Event
, ,
Database Serve~
BAN!<ING
Application Server' , , , ,
Database Server
,b;mking type
........ -....
Figure 5.4: A DMFG for a transaction
The input test data can be decomposed into account id, accounCtype id and password. In the
get-Ud event (e21), we can get the account type id for a gi ven account type name from the TYPE
object and pass this type id to the BALANCE object. In the check-a_id event (ell), we also can
check the account id for a given account name from the CUSTOMER object and pass it to the
check_psw event (e22) in the PASSWORD object simultaneously. In PASSWORD object, we get
the account id and recei ve the password. If the password is correct, the account id will be passed
to the BALANCE object, otherwise, the exception will be handled. When receiving both the
account id and the account type id in BALANCE object, it can retrieve the balance using the
look_up event (el2) and get the banking type to select the choice event (e13) which will be one
of the banking activity to execute the balance checking event (e31), the deposit event (e32), the
withdraw event (e33) and the statement event (e34) from the remote BANKING object. The
amount of money will be requested for the deposit event and the withdraw event. After executing,
it will save the balance back to the database using save_back event (eI4) or produce the output
the balance.
1~6

5.4.2 Type of Raw Materials
The raw materials are the inputs to the application. In this application, the raw materials are: the
value of the accounUd, the accounCtype, the password, the types of banIGng activities and the
amount of money in relation to the type of banking activity.
5.4.3 Characteristics of The Raw Materials
Once the types of raw materials have been identified, the characteristics of each material must
be analysed.
I. The accounUd. The value of the account id will consist of 6 numerical characters. The first
two characters will denote the year in which the customer opened the account and the latter four
characters will be made up of any of the characters in the set {0123456789}, for example, 980321
is an id for an account that has been opened by a customer in 1998.
2. The account_type. There are three types of account in this application, the current account, the
high rate account and the capital account.
3. The password. The value of the password will consist of 4 numerical characters which are
chosen by a customer from any of the characters in the set {0123456789}.
~. The types of banIGng activities. There are four types of activities in this application, checking
the balance, depositing the money, withdrawing the money and printing the statement. These will
be shown in menu style on the screen and the customer wiII select one of the activities.
5. The amount. The value is the numerical amount to be cashed and will be represented by a
decimal number, for example, 1324.50.
127

5.4.4 Rules for Using the Raw Materials
The following rules for using the raw materials are identified:
1. The order of input will be to input the accounUd and the account_type first and the password
later. After checking the password, the selection menu of banking activities will be shown on the
screen requesting the customer to select one business activity. The amount of money will be
requested if customers select the deposit and withdraw activities.
2. The account id will be created identically. No customer will have the same account id as
another.
3. When the data for new customers is created, it must be saved on the banking database with the
customer's name, address and their mother's maiden name.
5.4.5 Definition of Product Unit
Product unit is what is under inspection. This can be either the result of a process or the order of
execution of the process. In this application, the product unit on the client site is defined to be
the bank statement which includes the customer's name, address and balance. The product unit
on the server side is the ordeling of behaviours during the execution of the application.
5.4.6 Definition of Production Unit Defectiveness
Based on the product unit definition, a product unit on the client site will be considered defective
if the amount of balance is wrong after execution of the application or the value is out of range
and a product unit on the server site will be considered defective if it does not concur with the
causal message ordering.
5 .... 7 Data Modelling
In the banking application, a distributed database is created for the application being developed.
The way of defining the logical form of the data which is manipulated by the application is to
Use the Entity-Relation (E-R) Model. The E-R Model for the transaction is as shown in Figure
\3 and the banking application is as shown in Figure 5.5.
128

Customer ....... ___ ---'.....'m
Password
Figure 5.5: A E-R model for the banking application
5.5 The Requirements Specification
The major activity of the requirements specification is to specify the detailed input, output and
processing requirements for the design of the application. The result of the requirements
specification phase of application development is a requirements specification document that can
be used to communicate with the application developers, designers, test designers and users.
Following the steps of requirements specification, the software design and test requirements for
the development of the banking application are identified below.
5.5.1 Software Design Requirements
The software design requirements include input domain and processing.
11Iput Domain
The input domain of the software is defined using a SMAD tree and input domain rules, as shown
in Figure 5.6.
129

index symbol element rule index
Xl account - id 6 2 XU open_year 1 3 Xl.1.1 accouncnumber 2 4 X2 account_name 5 X2.1 firsCname
6 X2.1.l surname
7 X3 address 8 X3.1 number 9 X3.1.l streeCname 10 X3.1.l.1 posCcode II X4 accounctype 3,8
12 X5 password 2,6 13 X6 banking type 14 X6.1 check_balance 4 15 X6,2 deposicmoney 4,7 16 X6.2,1 money _amount 5 17 X6.3 wi thdra w _money 4,7
18 X6.3.1 money _amount 5 19 X6.4 statement 4 20 X6,5 exicbanking 4
rule index rule description remark
1 80,81, ...... ",,99 2 integer, length = 4 3 "Current", "High rate", "Capital" 4 check=" 1", deposit="2", withdraw="3"
statement="4", exit="5" 5 positive real number with floating point 6 happened before banking type 7 happened before money _amount 8 happened before type id (intermediate message)
Figure 5,6: The input message of SMAD tree for a banking application
Processing
All of the functions that the application must perform should be specified, including
manipulation of data, methods of producing outputs, data flO\vs, process control features and so
on, Whether the designer follows a function-oriented or object-oriented design approach, all
functional requirements should be identified at this stage of software de\elopment. The use of
an Ada-based Program Description Language (POL) for the function of withdrawing and
depositing money in the banking application is shown in Figure 5.7,
130

procedure Withdraw_money (AC_ID: accounUd; TP _ID: type_id; CASH: amount; BAL: in out balance) is
- Function checks the balance in the database to see if the amount is - enough to take from this transaction
begin
GeCbalance_from_BALANCE_table;
if balance >= amount then
balance := balance - amount; Save_balance_back_BALANCE_table;
else princerror _message;
end if; end Withdraw_money;
procedure Deposicmoney (AC_ID: accounUd; TP _ID: type_id; CASH: amount; BAL: in out balance) is
begin
Get_balance_from_BALANCE_table; balance := balance - amount; Save_balance_back_BALANCE_table;
end Deposit_money;
Figure 5.7: Requirements specification using a PDL
5.5.2 Test Requirements
The test requirements for the development of test environment includes the definitions of product
unit and product unit defectiveness, software acceptance criteria and sampling methods.
Definition of Output Domain
The definition of output domain includes the product unit and the product unit defectiveness. It
can be defined using the SMAD tree as shown in Figure 5.8.
131

index symbol
1 Xl 2 Xl.l 3 Xl.l.1 4 X2 5 X2.1 6 X2.1.1 7 X3 8 X3.1 9 X3.1.1 10 X3.1.1.1 11 X4
rule index
2
3
4 5 6
element
account _id open_year
accounCn umber accounCname
firsCname surname address number streeCname posCcode balance
rule description
80,81, ......... ,99
integer, length = 4
integer, correct amount
happened before accounCname happened before address happened before balance
rule index
4,5,6 1 2
3
remark
Figure 5.8: The output message of SMAD tree for a banking application
Software Acceptance Criteria
The acceptance critelia for the sampling method in this application are: a sample of II units is
to be taken randomly from the product unit population such that the sample defect rate eO and
the population defect rate e differ with an accuracy factor of 0.1, that is I e - eO I = 0.1 e and
e < 0.01.
Sampling Method
The construction of a sampling input unit starts with random sampling of elements from the SIAD
tree of the piece of software. The sampled elements are used to construct the test input unit. The
software processes the unit and generates a product unit. There are three test methods employed
in this implementation:
I. One for functional testing, to test whether or not every function is tested: the test coverage is
to test all banking types (check, deposit, withdraw and print) which should be traversed at least
once.
132

2. One for statistical testing, to test whether or not the quality can be achieved: the rule of "when
to stop testing" is that a sample ofn units is to be taken randomly from the product unit population
to estimate the defect rate of the software product population. This process is equivalent to
sampling a product unit from the product unit population of the application.
3. One for invalid testing, to test whether the application can handle erroneous input test data.
In other words, the invalid test is for testing a piece of software's capability to handle imalid
data. The input test data are constructed by generating data that go against the rules and
sub-rules defined in the SIAD tree.
5.6 The design of the Banking Application
According to the software design requirements, this application is designed as a three-tier
client/server system which has three basic components: the client, the database server and the
application server as shown in Figure 5.2. SBA consists of three modules with two remote
databases as shown in Figure 5.9.
Client Site
Database Server on Kielder
Application Server Site
Database Server on Kenton
Figure 5.9: The design of the simple banking application
(Kielder and Kenton are the names of the two machines used during the actual experiment.) Each
module function in this application is described below:
133

5.6.1 The Password Checker
The Password Checker will receive input data, the account id and the password, from the user
on the client site. It initiates the database on the database server and uses the account id and the
input password to check the input password with the password in the PASSWORD table. If these
two passwords do not match, it will print the error message. If the password is valid, the account
id will be passed to the Banking Data Manager.
5.6.2 The Banking Data Manager
The Banking Data Manager has three main tasks on remote databases. They are to look up, to
save back and to print the banking statement.
1. To look up. The Banking Data Manager will retrieve the account type id from the TYPE table
in the database according to the account type name which is an input data from the user. To get
the balance with the account id and the type id, the SQL command SELECT is used as follows:
SELECT balance FROM BALANCE WHERE accounUd='970001' and accounUd= '01';
The value of balance will be delivered to the Banking Activity Executor which will call a remote
object on application server site.
2. To save back. When the business activity is completed, the value of balance will be saved back
to the database using the SQL command UPDATE as follows:
UPDATE BALANCE SET balance= balance WHERE accounUd='970001' and accounUd= '01';
3. To print the banking statement. When the user selects the business activity for printing a
statement, the Banking Data Manager will retrieve the account id, the type name, the customer's
name, the customer's address and the balance from remote databases and produce a banking
statement for the customer.
134

5.6.3 The Banking Activity Executor
The Banking Activity Executor receives the account object and executes three acti\ities,
checking the balance, depositing money and withdrawing money, according to the selection from
the user on the client site. The account object includes five data items (the client's host name, the
account id, the account name, the address name and the balance) and methods for getting these
data items. The banking activity executor uses the Java RMI to make calls to a remote object on
the application server on to execute the balance checking, the deposit event and the withdrawal
event.
I. The balance checking. It is a simple procedure to return the value of balance.
2. The deposit event. It adds an amount to the account's balance.
3. The withdrawal event. It checks whether or not the account's balance exceeds the withdrawal
amount. If yes, it subtracts this amount from the account's balance, otherwise, it raises an
exception event.
It will send the account object back to the banking data manager. The banking activity executor
can allow as many connections to itself from client sites as it wants and display the ordering of
the events.
5.7 The Design of the Integrated Test Environment
According to the following test requirements, SITE is designed for the banking client/server
application.
• To set up test requirements, including the functional requirements and quality requirements,
• To execute automated testing until it has been sufficiently tested (when to stop testing),
• To re-execute the input units which have been tested (regression testing),
• To execute the testing first for only one client and later for several clients,
135

• To test all business activities which should be traversed at least once (test coverage)
• To produce the test execution report, the test failure report and the test quality report.
The environment of the automated software testing consists of seven modules as shown in Figure
5.lD. The function of each module in the testing environment is described below:
SOAD file t . ....J..::t
4 ~ Control flow line
~... Data flow line
Ordering
File
+ traclnl! , paths
Figure 5.10: An Integrated Test Environment for the Banking Application
5.7.1 Test Manager
The Test Manaoer receives a command from the tester and communicates with the functional b
module to execute the action and achieve the test requirements. It executes two main tasks: data
management and control management.
136

1. Data management: in this implementation, the test manager maintains two databases, Testing
and SMAD, as shown in Figure 6. The Testing database saves the values of the accuracy factor,
the deviation factor and the initial sample size from the Modeller and the values of the defect rate ,
the sample size and the testing result from the Quality Analyst. It provides the values of the
accuracy factor and the deviation factor to the Quality Analyst for the dynamic sampling process
and the values of the sample size and the random number seed to the Test Data Generator for
generating test data based on the SIAD tree file in the SMAD database. Three dynamic files, the
input unit file, the product unit file and the testing ordering file, will be produced during the
testing process. The contents of these files will be seen through the Test Manager.
2. Control Management: the Test Manager controls three main functional modules: the Modeller,
the SMAD Tree Editor and the Test Driver. The Modeller is used for receiving the test plan such
as test requirements and test methods from the user, creating the test plan documentation and
saving some values for the Testing database. The documentation provides support for test
planning to the test dri ver as well as the SMAD tree editor for specifying messages among events.
The SMAD Tree Editor is used to create the SIAD/SOAD tree file that can be used to describe
the abstract syntax of the test cases as well as to trace data occurring during the test. The SMAD
database provides the structure to the Test Data Generator for generating the input unit and to the
Quality Analyst to inspect the product unit. The Test Driver executes the main task of testing
which is described in more detail in the next section.
5.7.2 Test Driver
The Test Driver sets up the test execution environment for the banking application, which
involves valid testing with Test Coverage, valid testing using the statistical approach and invalid
testing. In the valid testing with the statistical approach, the Test Driver sets up the values of the
initial sample size, the accuracy factor and the deviation factor, initiating the Test Data Generator
to generate an input unit, sending it to the Test Execution to execute the application and getting
the product unit and delivering it to the Test Results Validator. When the sample size is satisfied
from the Dynamic Sampling Process, the Test Driver passes the latest value of the defect rate to
137

the Statistical Inference Process for estimating the confidence interval of the mean and variance
of the population. This is used to determine the acceptability of the application. The activities of
the Test Driver are shown in Figure 5.11.
r::L ,-_1I_e_st_D_a_ta--l o ~ Generator
Test data generator
Test
Execution
Dynamic
Sampling
Test Results
Validator
Figure 5.11: The activities of Test Driver
Statistical
Inference
The input unit can be automatically generated and stored in the input unit file for re-executing
according to the test requirements. The input unit file is also passed to the Test Execution as a
input file for the banking application. There are three types of tree elements that can be specified
in a SIAD tree; numerical, non-numerical and a data value. The construction of a random input
unit can be based on anyone of these types.
I. Numetical Elements: If LA and UA are two tree elements representing the lower and upper
bounds of a variable A in a SIAD tree, then the value of A may be generated randomly by:
A = LA + (UA - LA) r, where r is a random number, 0 < r < l.
2. Non-Numerical Elements: If a tree element randomly sampled from a SIAD tree represents
non-numerical data, the actual data are to be selected by the designer. In the banking application,
the account id is combined of an open year with the two last digits (98 means 1998) and a4-length
integer. The data of an open year is selected between 90 to 100 and the 4-length integer is selected
between 0 to 9 using a random selection process .f times.
138

3. Data Value Elements: If the data is specified directly in the SIAD tree, then it is entered into
an input unit directly, if sampled. For example, the accounCtype in the SIAD tree as shown in
Figure 5.6 is directly defined as "Current", "High rate" and "Capital". These data values are
saved in an array and directly selected by random sampling.
Test execution
As with all applications, this banking application requires an environment to run it. It will receive
an input unit and produce a product unit. The test execution is invoked by the Test Driver with
a valid input unit to check whether the test works correctly or with an invalid input unit to check
whether the application can detect the erroneous input and produce the product unit on the client
site and the ordering file on the server side to the Test Results Validator. The ordering file is
produced for checking for asynchronous messages or events. The process of test execution on
serval client sites is complex and will be discussed in the next Chapter.
Test results validator
The inspection of the test results is based on the SOAD tree. Two files, the product unit on the
client site and the ordering file on the server site, needed to be inspected. The result of the
inspection is used to compute the defect rate and thus provide data to the sampling process in the
Quality Analyst dynamically. This inspection can be done in two ways, either dynamically while
the application is running or after the Test Execution has finished running the application. Either
way, the expected results from the the SOAD tree file in the SMAD database must be set up for
comparison purposes as part of the process of automating testing. In this implementation, the
product unit is inspected using the SOAD tree file and the ordering file is examined by the causal
message ordering which is recorded in the SMAD database.
Quality analyst
Testing a piece of software is equivalent to finding the defect rate of the product unit population
generated by the application. The defect rate is defined as the ratio of the number of product units
that are defective to the total number of product units that the software has generated. A sample
of n units is taken randomly from the population. If it contains d defective units, then the sample
defect rate, denoted by eO, is eO= din. Ifn is large enough, then the rate eO can be used to estimate
the product unit population defective rate e.
139

5.8 Concurrent Implementation of Software Design and Test Design
The software design and test design discussed in Section 5.5 and Section 5.6 are implemented
in a multi-platfonn, multi-DBMS environment as shown in Figure 5.12. The hardware platfonn
SITE for SBA
The Simple Banking Application
Java Development Kit (JDK) 1.1.3
~- -~-:-: -1;-- -~--7"-
__ _ __ 'L~_ _ ___ _
Figure 5.12. An operational environment for implementation
of the testbed at the lowest level in Figure 5.12, is a network of UNIX machines running the
Solaris 2.x operating system which often plays a part in distributed systems. The widespread use
of the Personal Computer (PC) has also prompted an ongoing effort to port the environment to
the PCIMS-DOS platfonn. On the top of the hardware platfonn is Java Development Kit (JDK)
and mSQL. JDK consists of the Java programming language core functionality, the Java
Application Programming Interface (API) with multiple package sets and the essential tools such
as Java Abstract Windowing Toolkit (AWT) , Java DataBase Conncetivity (JDBC) and Java
Remote Method Invocation (RMJ). Mini SQL (mSQL) is a lightweight database engine designed
to provide fast access to stored data with low memory requirements. As its name implies, mSQL
offers a subset of SQL as its query interface.
5.8.1 The Implementation of the Simple Banking Application
The customers can run the client class (BankingClient.class) to input their account id, password
and account type on client sites. The client class uses the Java JDBC Driver to access all of the
critical database servers: the password database on the mSQL DBMS (version 2.0 B6 for Solaris
140

2.5) on Kielder and the dbbanking database on the mSQL DBMS (version 2.1 for SunOS 4.1.3)
on Kenton. If the customer passes the checking procedure, the client class will wait for transaction
selection: Check Balance, Deposit, Withdrawal, Statement and Exit. According to the selection,
the client class uses the Java RMI to make calls to a remote object (BankingImpl.class) on the
application server on Kielder to execute the balance checking, the deposit event or the withdrawal
event. The application server will send back the results to the client class.
The database servers with JDBC and mSQL
The rnSQL database system includes a program called msql which provides with users a SQL
interface to a particular database. In this implementation, the contents of two databases, the
password with the password table and the type table on Kielder and the dbbanking with the
customer table and the balance table on Kenton displayed using a mSQL command, relshow, are
as shown in Figure 5.13.
The JDBC Driver for mSQL is a user--<:ontributed package by George Resse. If offers the Java
developers access to an mSQL database using the standard JDBC API. It was downloaded from
ftp;l/ftp.imaginary.comland installed on the Kielder SUN Solaris system.
Communicating with two mSQL database servers, the developer should simply instantiate two
URL strings, each with its own host-name and port-number. The application can then instantiate
two Connection objects: firstly, one to each URL specified, using the appropriate user name and
password in each connection instantiation and secondly, two statements should be created from
each connection object.
The Java application opens two connections to the two databases after the Driver Manager loads
drivers into the workspace. Once the connection to the remote database has been established, the
code may begin using the Statement object to communicate with the database server.
These database servers are managed by the Banking Data Manager. They will check if the account
141

kielder:529> relshow password
Database • password
+---------------------+ Table
+---------------------+ I password I type +---------------------+
kielder:530> msql password
Welcome to the miniSQL monitor. Type \h for help.
mSQL > select· from password\g
Query OK. 3 row(s) modified or retrieved.
+------------+----------+ I account_id I password I +------------+----------+ I 970001 I 1112 I 970002 I 2223 I 970003 I 3334 +------------+----------+
mSQL > select· from type\g
Query OK. 3 row(s) modified or retrieved.
i-t~~;=id-i-t~~;=~;~;--i-~;t;---------i i-01------i-c~~~;~t----i-1~5----------i I 02 I Highrate I 2.5 I I 03 I Capital I 3.5 I +---------+------------+--------------+
-
I J
r~ ---------------------------- ---- sl~.ellto--o--I---/--b-i-n-/-c-s-,,------------------------------------
kenton: 123> rel5l10w Cf5Danki ng
Database - dbbanking
+---------------------+ Table I
+---------------------+ I customer I I bal ance I +---------------------+
kenton:124> msql dbbanking
Welcome to the miniSQL monitor. Type \h for help.
mSQL > select· from customer\g
Query OK. 2 row(s) modified or retrieved.
+------------+---------------------------+--------------------------------+------------------+ I account_ i d I account_name I add ress I mother _, ast_nalle I +------------+---------------------------+--------------------------------+------------------+ I 970002 I Donna Mai I Heaton Road Newcastl e I Wang I 970001 I Joseph Chu I 25 Larchwood Avenue. NE3 2AP I Hwang +------------+---------------------------+--------------------------------+------------------+
mSQL > select ~ from balance\g
Query OK. 6 row(s) modified or retrieved.
+------------+---------+--------------+ I account_id I type_id I balance I +------------+---------+--------------+ I 970001 01 I 500 I 970001 02 I 2500 I 970002 01 I 345.5 I 970002 02 I 3500 I 970002 03 I 5000 I 970003 01 I 2375.45 I +------------+---------+--------------+
Figure 5.13: Database Servers on two different sites
exists and if the password is correct through the Password Checker and provide the data to the
Banking Activity Executor and save back on the database.

The application server with RMI
The client class (BankingCLient.class) uses the Java RMI to make calls to a remote object
(Bankinglmpl.class) on the application server on KieIder to execute the balance checking, the
deposit event or the withdrawal event. To create this class that will be remotely accessible, remote
methods are defined by remote interfaces in an interface class (Banking.c1ass). A stub
(BankingImpl_Stub.class) which runs on the client side and a skeleton (Bankinglmpl_Skel.class)
which runs on the application server side are generated using nnic tool. In this implementation.
Figure 5.l4 shows the relationship between a client, a server, a stub and a skeleton.
--- ... -----, ,
,'Banking.class '. ,-----------..1 : checkBalanceO : : withdrawO:
',- _ Aep9~i!Q.:' .. "f' ... - _ Application
server side Client side Both-side
BankingClicnLclas,
methodO connection
lookup
(here} _ ' t--_N_am_in....:;g_--iA-.••
rmi:/lkicldcr,ncl.ac.ukINetBan ........................ ...
Bankinglmpl_Stub.class
8ankinglmpl.class
\----. methodO
remote bindl rebind reference
r----'----, Naming Registry
... ............... - ... ..,. Ilkielder.ncLac ukf.'\t.'tB .. mk
Bankinglmpl_Skel.class
Figure 5.14: The RMI structure for SBA
When a client wishes to make calls to a remote object it must first look up the object in the naming
service. This retull1s a remote reference to the object which automatically informs the object that
it has a remote client. RMI provides a simple name lookup object that allows a client to get a stub
for a particular server based on the server's name.
5.8.2 The Implementation of SITE for SBA
The design of the statistics-based integrated test environment for SBA in Section 5.6 has been
implemented using the Java Development Kit (JDK) 1.1 and mSQL. In this implementation the
Java language is used as a general purpose programming language for application development.
Most tools in this implementation do not include World Wide Web compatibili ty and their GUIs
j·B

extend the Frame class in the core Java API. Inheriting the Applet class is an alternative for applet
programmers, as it provides access to many of same AWT functions that the Frame class does.
According to the design of integrated test environment described in Section 5.6, the
implementation structure of this test environment is arranged as shown in Figure 5.15.
Test Manager
I I
Data Control Management Management
I I I ~
Database Files Test Smad_Tree Modelling Management Management Driver Editor
I I
Valid Testing Valid Testing Invalid Testing (Test Coverage (Statistical)
I I 1 i I I I
Test Data Test Test Result Test Data Test Test Result Quality Test Data Test
Generato Executior Validator Generator Execution Validator Analyst Generato Executior
Figure 5.15: The structure of implementation
The GUI of the main menu has been implemented by lavaAWT as shown in Figure 5.16 and can
be seen on the WWW at http://kielder.ncl.ac.ukl-n4521677/site!site.html.
Data Management
The Data Management component maintains a database (site) and files (input files, output files
and a file for recording the order) which are produced during the testing process. There are two
tables in the site database, the siad_tree table and the sampling table on Kenton. They can be
displayed using a mSQL command, relshow, as shown in Figure 5.17.
144

r "Test Manager .. ;;;,;...,"U"UN .... """~n' ...... "Nu .... '..,'n"""NN''' .. '''''' .. '' ...... '...,h~ __ ..., ........ "" ... u .. ,,,,'N' .... "N...,,,
Monitor Help , ~ WWAW#/////#///#/M
~Data Management r» WT//,W
Control Manager > Modeller
Exit SIlE SMPJ) Tree Editor
Test Driver > Valid Testing (Test Coverage)
Valid Testing (Statistical Metho d)
Invalid Testing
a ..... d ~Unsi9ned Java Applet Window
Figure 5.16: The GUI of the main menu
nton~33> msq site
W.lcome to the m1 n1 SQL mon1 tor~ Type \h fof'" hel p.
MSQL > sal Get ... from s1 ad_tree \9
Query OK. 20 row(s) modi f1 ad or retri eyed.
i-~~d;~i~d;~-i-~~;b~l---------------j-;l~;;~t---------i-~~;;~t---i +------------+----------------------+-----------------+----------+
3 X1.1.1 number 1 2 )(1.1 year 1 1)(1 account_1 d -1 ")(2 accound_name-1 5 )(2.1 first_name 1 6 )(2.1.1 sur_name 1 7)(3 add ress -1 8 )(3.1 number 1 9 )(3.1 .1 st reet_name 1 10 )(3.1.1.1 post_code 1 11)(4 account_type-1
~ ~ ~~ ~:~kr~~~type:~ 14 X6.1 chec~bal ance -1 1S X6.2 deposit_money -1 16 X6.2.1 money amount 1 17 )(6.3 wi thdraw_money -1 18 X6.3.1 money_amount 1 19 )(6.4 statement-1 20 )(6.5 exi t_banki ng -1
+------------+----------------------+-----------------+----------+
IIISQl) select ... from sampling \9
Qu.ry OK. 1 row(s) modified or retrieved.
i:~~~~;~~~~~=~~~~~~~~=====t=~~~~~~~~~~===t=~~~~~~;~~~~=t=~~~~~~;~~~~==~=~~~~~~~;~~~~~~=~=~~~~~~;~~~~=~ + --------+--------------+--------------+-------------+--------------+----------------+-------------+
.SQL >
Figure 5.17: A database for developing SITE
Based-on the IDBe driver, the database management will create the different siad_tree,
SO(/('-tn'c and sampling tables for different applications. It can also display the structure and
Contents of these tables as users require.
1~5
,
=
C'

To extend the dialog class of the A WT package, the file management builds a dialog box to handle
related events such as the removal or display of files which are created during the testing process.
Control Management
The Control Management component consists of three components: the Modeller, the
SMAD_Tree Editor and the Test Driver.
1. The Modeller: This receives the input data, the testin8-id, the % of confidence interval and
the accuracy factor from the users or testers. It computes the standard deviation factor according
to the % of confidence interval, for example, if the probability is 0.95 the standard deviation
factor is found to be 1.96. The data for testing_id, the deviation factor and the accuracy will be
saved back in the sampling table in the site database as shown in Figure 5.17.
At this stage, the Modeller is simply used in the sampling process in the Test Driver. It does not
include a process to model the application using the GUI. It could be improved to display the
graphic of modelling as shown in Figure 4 on the screen or on the WWW.
2. The SMAD_Tree Editor: Based-on the JDBC driver, the contents of the siad_tree table and
the soad_tree table are inserted and updated by the SMAD_Tree Editor and provide data for the
Test Data Generator to generate input test data and the Test Result Validator to inspect the test
results. The SMAD_Tree Editor has been implemented by Java as a standalone application as
shown in Figure 5.18 and can insert the data of the SIAD/SOAD tree from users and save them
on the siad_tree table as shown in Figure 5.16 and the soad_tree table.
146

shellt:ool /bin/csh kielder:75> java Smad Editor Standalone
********************************************* ... SHAD Tree Edi to r ... *********************************************
1) Insert the SIAD Tree 2) Insert the SOAD Tree 3) Update the SIAD Tree 4) Update the SOAD Tree 5) Di spl ay the SIAD Tree 6) Display the SOAD Tree 7) Exit
Ente r choi ce : 1 ........................ Create SIAD Tree Database ..................... ...
Tree Node Index: 1
Ente r Tree Symbol : X1
Enter Tree Element :account_id
Does it have parent? (O=No/1=Ves) :~
Figure 5.18: The running of SMAD_Tree Editor standalone application
Ic:;u
The GUI version for the SMAD_tree Editor has also been implemented by Java AWT as shown
in Figure 5.19 and can be seen on the WWW at http://kielder.ncl.ac.ukl-114521677ltree.html.At
the moment, it does not connect to the database and can be improved in the future.
The SMAD Tree Editor
Edit Preference History Window
SMAD TREE Tree Element Input Area
Index: D Symbol r-p----------, Element: 1""1 ______ ___
Rule IL,,,,,,,,_, ___ ,,,,,,,,,,,,,,,J
Parent: PWithout Parent Node '''''''''''''''''''''''''''''''''''''''''1
i Without Parent Node c::J
l::::l
Figure 5.19: The GUI of the SMAD_Tree Editor
147

3. The Test Driver: The test driver has been implemented with a standalone application using the
Java 10K 1.1 and mSQL. It consists of valid testing component with test coverage, valid testing
component with statistical testing and invalid testing component as referred to the Section 5.6.2.
In order to generate the random input units for the valid testing, a random number generator is
required. The scenario for running the test driver for testing a simple banking application is as
shown in Figure 5.20.
shelltool - /bin/csh ki el der: 57> Java Test_Dn ver _Standalone
************************************************* •• *** * Test Driver for Banking * ******************************************************
1) Valid Testing (Test Coverage) 2) Valid Testing (Statistical Testing) 3) Invalid Testing 4) Exit
Enter choice 1 Testing Size is 18 determined randomly. Generate Test Data 1 ..... . testcov1.in Test Executi on 1 •.... Test Validator 1 Generate Test Data 2 ..... . testcov2.in Test Execution 2 •...• Test Validator 2 ....•
Figure 5.20: The main menu of the test driver
.,
I I~
c."
The sampling size of valid testing with test coverage between 0 and 50 is determined by the
random number generator. The input date file is generated with file name, testcovX.in, where X
is the number of samples. Based on the siad_tree table, the input test data is generated through
the random number generator and the JDBC driver. After test execution, a output file with file
name, testcovX.out, will be generated.
The sample size for valid testing with the statistical testing is dynamically adjusted by the
sampling processor which implements the dynamic sampling process as referred to Section 6.2.4.
The defect rate will be computed during the dynamic sampling process and will be saved on the
sampling table. The invalid input test data is generated when the invalid testing is selected for
eXamining whether or not the application can detect the wrong input. All source codes for this
implementation can be downloaded at http://www.ncl.ac.ukl-n4521677lbankingl.
148
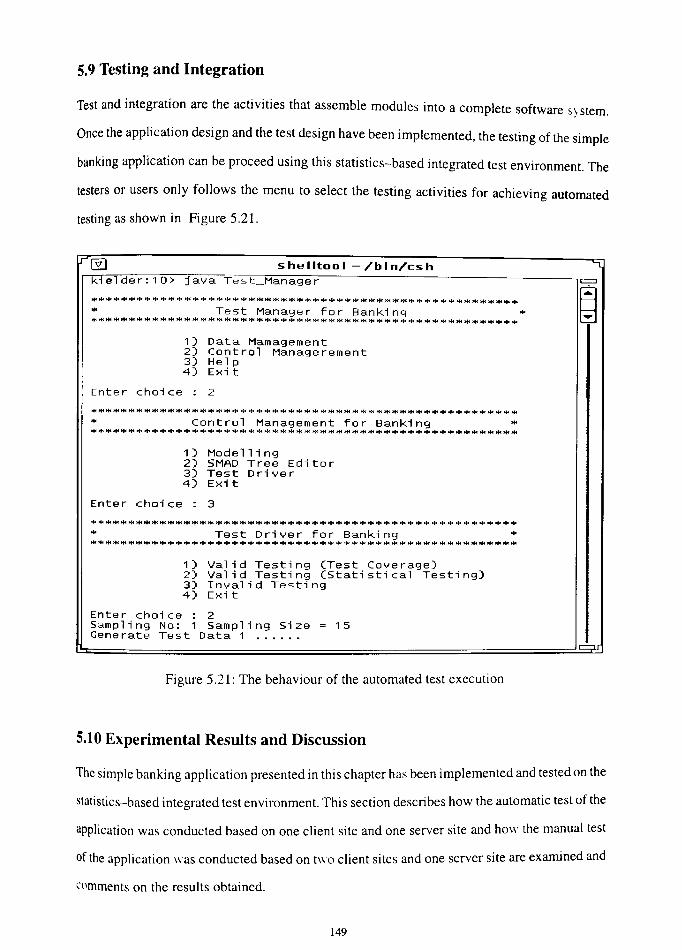
5.9 Testing and Integration
Test and integration are the activities that assemble modules into a complete software s;. stem.
Once the application design and the test design have been implemented, the testing of the simple
banking application can be proceed using this statistics-based integrated test environment. The
testers or users only follows the menu to select the testing activities for achieving automated
testing as shown in Figure 5.21.
shelltool - /bin/csh r1k~ire~l~d"e~r~:11rO~>~~j~a~v~a~Tr.e~~~t~_'M~a~n~a~g~e~r~--------------------------------------'~
~ ~~.~ •••• ~~**~***************************************.* • Test Manager for Banking • ******************************************************
1) Data Mamagement 2) Control Managerement 3) Help 4) Exit
Enter choice: 2
~.****************************************************
• Control Management for Banking • ********************************************++++++++++
1) Modelling 2) SMAD Tree Editor 3) Test Driver 4) Exit
Enter choice: 3
• Test Dri ver for Banki ng • **++++++++++++++++++++++++************++++++++++++++++
1) Valid Testing (Test Coverage) 2) Valid Testing (Statistical Testing) 3) Invalid Testing 4) Exit
Enter choi ce : 2 Sampl i ng No: 1 Sampl i ng Si ze = 15 Generate Test Data 1 ..... .
Figure 5.21: The behaviour of the automated test execution
5.10 Experimental Results and Discussion
The simple banking application presented in this chapter has been implemented and tested on the
statistics-based integrated test environment. This section describes how the automatic test of the
application was conducted based on one client site and one server site and how the manual test
of the application \\as conducted based on two client sites and one server site are examined and
comments on the results obtained.
149

5.10.1 Automatic Testing on One Client Site
Valid testing with test coverage
Following the menu to select the item "Valid Testing (Test Coverage)", the sample size of valid
testing with test coverage between 0 and 50 is determined by the random number generator. The
input date file is generated with a file name, testcovX.in, where X is the number of sampling. All
input data files will cover all banking activities at least once. In this implementation, we can get
zero-defect for each valid testing with test coverage.
Valid testing with statistical testing
In my experience of running the test on this application on one client site, no defects were
reported. In order to demonstrate the sampling process with statistical testing, I added a random
number generator into the Test Results Validator. If the number is less then 10, the Test Results
Validator will return 'fail' value.
The acceptance criteria for the sampling method in this application are: a sample of n units is
to be taken randomly from the product unit population such that the sample defect rate eO and
the population defect rate 8 differ with an accuracy factor of 0.1, that is 18 - 8° I = 0.1 8 and
e < 0.D1. In this implementation, given the probability is 0.95, the standard deviation factor z is
found to be 1.96 from (Cho, 1988). As discussed in the Section 4.5.1, in this implementation the
sampling plan implements the formula
n=
with z= 1.96 and a. = 0.1. The results of sampling are as shown in Figure 5.22.
150

Iteration n (i+ 1) n (i) n (i+l) - nO) Defective Rate
2019 100 1919 0.16
2 3194 2019 1175 0.1074
3 3107 3194 -87 0.1101
Sample size = 3194 Defective rate = 0.1101
Figure 5.22: An iterative sampling test results in testing
The sampling process stops at iteration 3 with a sample size of 3194 units and a sample defective
rate of 0.110 1. In other words, at iteration 1 the sample size is determined by
I1J =
at iteration 2:
112 =
and at iteration 3:
113 =
1.962(1- 0.16) = 2019
01 X 0.1 X 0.16
1.962(1- 0.1074) = 3194
01 X 0.1 X 0.1074
1.962(1- 0.1101) ------- = 3107
01 X 0.1 X 0.1101
Since 113 = 3107 is less than 112 = 3194, the total number of units sampled at iteration 2, the
sampling process stops.
The 95-percent confidence interval of the mean of the population (for z= 1.96) can be estimated
by:
s lieD + tn-1 a/2 , .
s ] where /leO = 319-l X 0.1101 = 352 and
151

s = v' neo (1- eO) = v' 3194 X 0.1101 X (1- 0.1101) = 17.7
tn-i. a/2 = t2492.0.0112 = 2.576 from Appendix 4 of (Cho, 1988)
= v' 3194 = 56.52
Thus, the range of population mean is found to be:
[351.193,352.807]
The defective rate of the output population of the routine is estimated from this mean. Therefore,
the 95-percent confidence interval of the defective rate is:
[ or:
351.193
3194
352.807
3194 ] = [0.1099,0.1105]
In other words, the test results documented in the testing document show that the estimated
product unit defective rate at the 95-percent confidence level is from 0.1099 to 0.1105. The
software acceptance and test requirements documented in the requirements specification state
that to be accepted, the software must have a product unit population defective rate of e < 0.01.
Clearly, the value between 0.1099 and 0.1105 > 0.01, and therefore, the software product
population does not meet the acceptance criteria. In this situation, the software developer should
conclude that the application is not ready for delivery to the user. Further development is required
to reduce the defective rate and improve the quality of the application.
152

Invalid testing
The invalid test is for testing a piece of software's capability to handle invalid data. The input
test data are constructed by generating data that go against the rules and sub-rules defined in
the SIAD tree. In this implementation, I created input test data without saving the password on
the database and ran the test with this test data to examine whether ornot the application can detect
the wrong password. All the invalid input test data can be detected in this application in these
tests.
5.10.2 Manual Testing on Two Client Sites
At this stage of implementation, I can only automatically run the tests on one client site, therefore,
I tried to send test data files on two client sites (Anick.ncl.ac.uk and Kielder.ncl.ac.uk) to run the
tests by hand. Two different types are given as following:
Two different inputs with two different DASFs
There are two test data files test1.in and test2.in corresponding two different execution paths:
DASFa run on Anick.ncl.ac.uk and DASFk run on Kielder.ncl.ac.uk, where,
DASFa : eall -> ea21 -> ea22 -> ea12 -> ea13 -> ea32 -> ea14 -> ea13 -> ea31 -> ea13 -> ea33
-> ea14 -> ea13 -> ea32 -> ea14
DASFk : ekll -> ek21 -> ek22 -> ek12 -> ek13 -> ek33 -> ek14 -> ek13 -> ek32 -> ek14 -> ekl3
-> ek33 -> ek14 -> ek13 -> ek31
Figure 5.23 shows the relation among test data files, test results files and the trace file on server
site when the application under tests.
153

Current 1112 2 500 1 3 350 2 57
testl.in on Anick
824 Highrate 4239 3 164 2 222 3 46 1
test2.in on Kielder
Application
Deposited £500.00 balance is: 2234.0
The balance is: 2234.0
Withdrew £350.00 balance is: 1884.0
Deposited £57.00 balance is: 1941.0
testl.out on Anick
Withdrew £164.00 balance is: 8730.0
Deposited £222.00 balance is: 8952.0
Withdrew £46.00 balance is: 8906.0
The balance is: 8906.0
test2.out on Kielder
** Account No: 970001 from ->anick.ncl.ac.uk Deposit (e32) ** Account No: 970001 from ->anick.ncl.ac.uk Check Balance (e31) ** Account No: 970001 from ->anick.ncl.ac.uk Withdraw (e33) ** Account No: 964824 from ->kielder.ncl.ac.uk Withdraw (e33) ** Account No: 964824 from ->Kielder.ncl.ac.uk Deposit (e32) ** Account No: 964824 from ->Kielder.ncl.ac.uk Withdraw (e33) ** Account No: 970001 from ->anick.ncl.ac.uk Deposit (e32) ** Account No: 964824 from ->Kielder.ncl.ac.uk Check Balance (e31)
testorder on Kielder
Figure 5.23 The application under test with two different inputs
The test results are satisfied and the test order followed the causality relation.
Two identical inputs with the same DASFs
In this case, two identical test data files test l.in and test l.in are corresponding the same execution
paths: DASFa run on Anick.ncl.ac.uk and DASFk run on Kielder.ncl.ac.uk, where,
DASFa : eall -> ea21 -> ea22 -> ea12 -> ea13 -> ea32 -> ea14 -> ea13 -> ea31 -> ea13 -> ea33
-> ea14 -> ea13 -> ea32 -> ea14
154

Figure 5.24 shows the relation among test data files, test results files and the trace file on server
site when the application under tests.
970001 Current 1112 2 500 1 3 350 2 57 5
testl.in on Anick
97 1 Current 1112 2 500 1 3 350 2 57 5
testl.in on Kielder
Application
Deposited £500.00 balance is: 2441.0
The balance is: 2941.0
Withdrew £350.00 balance is: 2591.0
Deposited £57.00 balance is: 2705.0
test Lout on Anick
Withdrew £500.00 balance is:2941.0
The balance is: 2941.0
Withdrew £350.00 balance is: 2591.0
Deposited £57.00 balance is: 2648.0
test Lout on Kielder
"'* Account No: 970001 from ->anick.ncl.ac.uk Deposit (e32) "'''' Account No: 970001 from ->Kielder.ncl.ac.uk Deposit (e32) "'''' Account No: 970001 from ->anick.ncl.ac.uk Check Balance (e31) "'''' Account No: 970001 from ->Kielder.ncl.ac.uk Check Balance (e31) "'''' Account No: 970001 from ->Kielder.ncl.ac.uk Withdraw (e33) "'''' Account No: 970001 from ->anick.ncl.ac.uk Withdraw (e33) "'''' Account No: 970001 from ->Kielder.ncl.ac.uk Deposit (e32) "'''' Account No: 970001 from ->anick.ncl.ac.uk Deposit (e32)
testorder on Kielder
Figure 5.24 The application under test with two identical inputs
The test results are not satisfied, because the expected balance on Anick is 2298 and on Kielder
is 2355. This application didn't consider the problem of concurrent access control which caused
that the causal message ordering was inconsistent as shown in Figure 5.25.
155
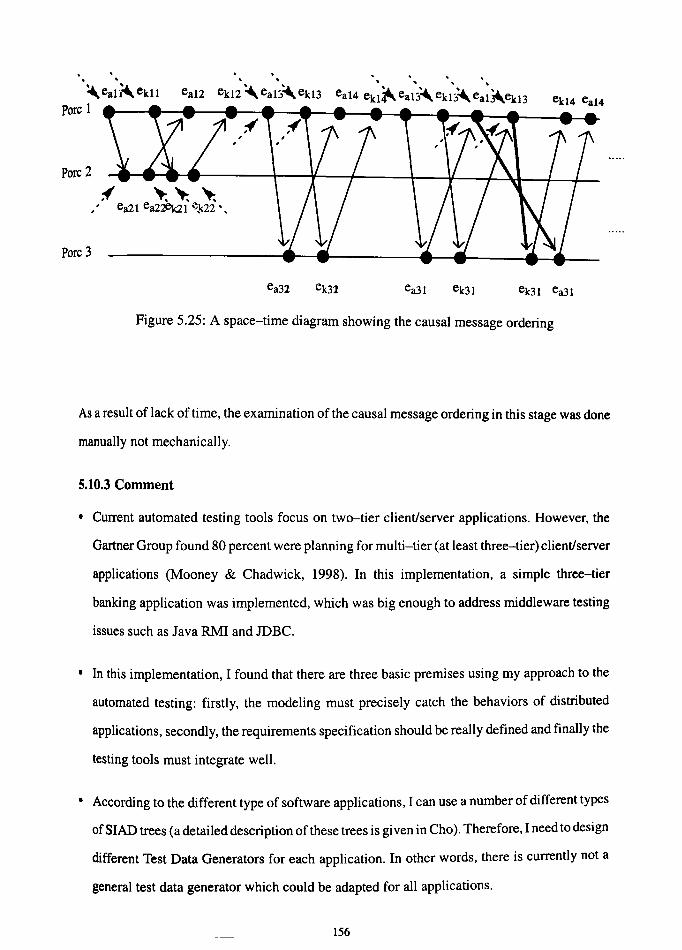
· '~ea;~ekl1
" " " " " . ea12 ek12'" eat:;'" ek13 ea14 ek~i'. eal~'" ek;:'''' ea;~ek13
pore 1
Pore 2
Pore 3
Figure 5.25: A space-time diagram showing the causal message ordering
As a result of lack of time, the examination of the causal message ordering in this stage was done
manually not mechanically.
5.10.3 Comment
• Current automated testing tools focus on two-tier client/server applications. However, the
Gartner Group found 80 percent were planning for multi-tier (at least three-tier) client/server
applications (Mooney & Chadwick, 1998). In this implementation, a simple three-tier
banking application was implemented, which was big enough to address middleware testing
issues such as Java RMI and JDBC.
• In this implementation, I found that there are three basic premises using my approach to the
automated testing: firstly, the modeling must precisely catch the behaviors of distributed
applications, secondly, the requirements specification should be really defined and finally the
testing tools must integrate well.
• According to the different type of software applications, I can use a number of different types
of SIAD trees (a detailed description of these trees is given in Cho). Therefore, I need to design
different Test Data Generators for each application. In other words, there is currently not a
general test data generator which could be adapted for all applications.
156

• At this stage of implementation, I can only automatically run the tests on one client site and
inspect the tracing file on the server site using a manual approach because the file can not be
sent back by itself.
• According to the sampling method in this implementation, a large number of test data are
needed to achieve high quality. In other words, the larger the size, the more accurate the
estimate. However, the cost of sampling is almost negligible compared with that of a
lOO-percent inspection. In fact, if a population contains millions and millions of units,
sampling is the only practical way to determine the defective rate of the popUlation.
• The cost of testing with this approach was higher, because there was more front-end test
planning in the work in developing the SMAD tree, however, this is effectively balanced by
less test operation, since testing can be automatically achieved and the quality index can be
estimated.
• In this implementation, I constructed invalid test data using invalid testing component to test
whether the application could detect erroneous test data. In this work, the error message of the
input data was displayed in the executing record file (product unit), which satisfies our
expectation.
• From this implementation, I found the syntax of test results can be inspected based on the
SMAD tree, However, the semantic analysis for test results can not be achieved. In this work,
I counted the value of the same account id on the server site to compare with the value of this
account id on the client site. Differences between these values highlight defects of the simple
banking application.
• In this implementation, I tried to seed the code with known artificial errors to evaluate the
fault-finding capability. As a result of this work, these faults were detected by this application.
For example, the input unit did not save back on the database server in early implementation.
The error message "the account id is not exist" was displayed in the product unit after the
application ran with this input unit.
• In this implementation, the same test data cannot automatically be sent to two or more client
sites at the same time, therefore, I tried to copy a test data file and send it to another client site.
157

When I ran the tests on two client sites simultaneously by manual test execution, a problem
might arise when the database is accessed with the same account id without the consideration
of mutual exclusive access. Therefore, I need to consider how to generate the test data and
broadcast it to multiple client sites to find out a solution to this problem.
5.11 Conclusion
The implementation of the simple banking application written using Java Remote Method
Invocation (RMI) and Java DataBase Connectivity (JDBC) shows the testing process of fitting
it into SITE. This application is simple, however, it is big enough to address middleware testing
issues such as Java RMI and JDBC which is a new area in client/server testing.
After the behaviour of this application is modelled by a DMFG and messages amongst events are
defined by the SMAD tree, the concurrent design and implementation of this application and
SITE are processed. How the test of the application was conducted and comments on the results
obtained are described in the final section.
158
Chapter 6
Automated Test Execution Through Mobile Agents and Multicast
6.1 Introduction
Test execution is a process of feeding test input data to the application and collecting infonnation
to determine the correctness of the test run. It is natural to assume that automating test execution
must involve the use of a test execution tool which requires an environment to run it, to accept
inputs and to produce outputs (Fewster & Graham, 1998). Some tools require additional
special-purpose hardware as part of their environment; some require the presence of a software
development language environment. The remaining problems in this research are how to run the
test on the multi-client sites and server site and how to perfonn repeated executions for
distributed applications.
In this chapter, the concept of mobile agents is applied to launch the test driver to different client
sites and send the test order file from the server site back to the tester and the multicast technique is
used for broadcasting test data files to multi-client sites simultaneously to perfonn repeated
executions. A dynamic test plan based-on the blackboard model is proposed for automated test
execution later.
The agent-based architecture of VISITOR, which can support flexible communication and
co--opcration between mobile agents and local agents which may provide some services through
the agent broker, is described in Section 6.2. Section 6.3 illustrates the application of VISITOR to
the client/server test execution. In the Section 6.4, the concept of the multicast system is firstly
introduced. We illustrate the multicast framework for the client/server test execution later. The
blackboard-based test plan for automating test execution is proposed in Section 6.5. Section 6.6
summaIizes our research and offers suggestions for future researches.
159
6.2 An agent-based architecture of VISITOR
6.2.1 Mobile Agents
An agent is an object that is autonomous enough to act independently even when the user or
application that created it is not available to provide guidance and handle error. Agents can
receive requests from external sources, such as other agents, but each individual agent decides
whether or not to comply with external requests. In the computer world, an agent is a computer
program whose purpose is to help a user perform some tasks (or set of tasks) (Lingnau & Drobnik,
1995). To achieve this aim, it maintains a persistent state and can communicate with its owner,
other agents and the environment in general. Agents can do routine work for users or assist them
with complicated tasks. In addition, they can mediate between incompatible programs and thus
generate new, modular and problem-oriented solutions thus saving work.
Mobile agents (Chen, 1997; Chess, Harrison & Kershenbaum, 1997) provide a new alternative
paradigm for distributed object computing on the WWw. A mobile agent is a computer object
that can move through a computer network under its own control, migrating from host to host and
interacting with other agents and resources in order to satisfy requests made by its clients. They
may move around on behalf of their users seeking out, filtering and forwarding information or
even doing business in their own name. Possible applications for mobile agents include
information retrieval, data-mining, network management, electronic commerce, mobile
computing, remote control and monitor, etc. Therefore, mobile agents show a way to think about
solving software problems in a networked environment that fits more naturally with the real
world.
The concept of mobile agents is in contrast to the concept of Java Applets. In the latter case, a
program is downloaded from remote computers to execute locally, while in the former, a program
is sent to remote machines to execute remotely, When mobile agents execute remotely, there may
not be any transactions in the home machine. The advantages of mobile agents are (Chess,
Harrison & Kershenbaum, 1997; Gray, Kotz, Nog, Rus, & Cybenko, 1997): firstly, they offer an
effective paradigm for distributed applications, particularly in partially connected computing;
160

secondly, they can provide a pervasive, open, generalized framework for the development and
personalization of network services; thirdly, they move the programmer away from the rigid
client/server model to the more flexible peer-to-peer model in which programs communicate as
peers and act as either clients or servers depending on their current needs and fourthly, they allow
ad-hoc, on-the-fly applications that represent what would be an unreasonable investment of time
if a code had to be installed on each network site rather than dynamically dispatched.
Nowadays, there are already some frameworks for mobile agents, such as the Aglet and the
Java-to-go. They all support dispatching a segment of code to remote machines to execute,
however, they do not give proper support to the co-operation between mobile agents and services
in remote machines. This section presents a flexible infrastructure for mobile agent computing:
VISITOR (Chen, Greenwood & Chu, 1998), which can support flexible communication and
co-operation between mobile agents and local agents which may provide some services through
the agent broker. Furthermore, combining with the Java Remote Method Invocation (RMI),
mobile agents can make use of distributed objects to accomplish such tasks as sending the results
back to the home machine. VISITOR shows a paradigm for service-providers to provide services
and for service-clients to get services in a networked environment that fits more naturally with
the real world.
The application of VISITOR to software testing, Mobile Testing Agent (Chu, Dobson, Chen &
Greenwood, 1998), has been implemented and can be downloaded at the MObile Software
Testing (MOST) wesite (http://www.casq.orglmostl) constructed and maintained by Huey-Der
Chu 1998.
161

6.2.2 The Architecture of VISITOR
The architecture of the VISITOR is shown as in Figure 6.1 which consists of a network of
agent-servers, agent clients and a security server.
Agent Serverl A B k I . gent ro er. Agent Client
reg/,
& RMI ,,-, 0
,:-_~ ,'--_~---. 0 0 Launch
Agents to launch Objects
Figure 6.1: The architecture of VISITOR
These components communicate with one another based on Java sockets. Agent servers are
destinations which mobile agents want to visit. Agent Servers are also the hosts which
accommodate mobile agents and provide services to them. Agent Clients are applications which
launch mobile agents to the agent servers for accomplishing their particular tasks. In this
framework, the agent servers are like offices which receive visitors and provide some services to
them, while the mobile agents are like visitors which move around one office to another for their
particular goals.
Agent servers
In each agent-server, there are five types of components: The Agent Broker (AB), service agents,
the receiving agent, mobile agents and the network class server.
An AB is a stockbroker among agents. All other agents have to be registered with the AB. TheAB
keeps them as resources. When an agent is created, it sends a message to the AB to register its
existence and address. When an agent A wants to communicate with another agent B, A first
162

transmits a message to the AB to ask B's address. The AB would acknowledge with B's address if
B exists. When B first receives Jil s message, it also need to ask the AB for Jils address. Afterwards,
A and B would communicate with each other directly.
Furthermore, if an agent, for example a service agent, could provide some service, it would send
the AB a message to register that service. When some agent, for example a new coming mobile
agent wants the service, it would request the AB. If the service has been registered, the AB would
return the agent's address that can provide that service. Then, they would dialogue directly as
normal.
Service agents provide services for other agents. When they are created, they would register the
service with the AB which they can provide. The services they can provide are various, from
general information services (e.g. databases) to particular commercial services (e.g. purchasing
some CD at the lowest price).
It is the receiving agent that is responsi ble for recei ving and instantiating corning mobile agents. It
also creates execution environments and forks a thread for the agent run. There is only one
receiving agent in each agent-server. For the structure of the receiving agent, see section 6.2.4.
Mobile agents come from remote agent clients. When they arrive, the receiving agent creates the
execution environment for them and they would register with the AB. Together with main classes,
a knowledge base which include initial information is sent. The receiving agent will save this
knowledge as a specific file. A mobile agent will run in a separate thread to accomplish its tasks. It
can also make use of services which are provided by execution environments or service agents.
For the structure of mobile agents, see section 6.2.5.
The network class server listens to the network. If there is a request for loading a class from this
machine, it is responsible for finding, loading and sending the class to the destination. When a
163

mobile agent is launched, only the main class is sent. the auxiliary classes are loaded on demand
from the home machine or the previous machine, where a network class server is set up.
Agent clients
Agent clients design and launch mobile agents for accomplishing their particular tasks. The
clients may be located in an agent-server or in a separate machine. For the latter, a network class
server has to be set up for remote class loading. In the case where there is no network class server
set up, the agent launcher has to send all class of the agent, or the class loader would fail.
Arriving at remote agent servers, mobile agents can execute home transactions by the Java RMI.
For example, when a mobile agent retrieves information in remote agent servers, it can make use
of the RMI to display the result on the home machine simultaneously.
The picture above characterises a flexible agent-oriented method of constructing client
applications, producing a new paradigm for distributing computing.
Security server
The security Server is listening to the network. When clients want to launch a mobile agent for
accomplishing their particular tasks, they have to register with the security server to gain a key,
which the mobile agent will bring with it. The agent servers will check the key to see whether or
not it is valid. If the key is valid, the process will continue, if not the server will send back an error
message to the client.
6.2.3 A General Structure of Agents
The static structure of an agent is designed following the Java Agent Template (JAT). An agent
consists of three parts: a message handler, a resource manager and a knowledge base. The
message handler sends and receives Knowledge Query and Manipulation Language (KQML)
messages by the communication interface Comminterface. The message handler is also
responsible for message processing.
164

The resource manager is responsible for managing resources which the agent possesses. There are
five types of resources: Languages, interpreters, classes, files and addresses in the JAT.
The knowledge base includes the initial information of agents and the information about the
services which it can provide. When the agent moves from one machine to another, the
information in the knowledge base will move along.
An agent executes within a AgentContext which is the execution environment of the agent.
Agents could make use of services in the agent-server by the Contextlnterface which is
implemented by the AgentContext. When an agent arrives at a new agent-server, the receiving
agent will initiate the agent with the knowledge base, which is sent with the underlying agent.
When an agent leaves the machine, it will clean up the environment. The initiate and cleanup
methods are provided by the Agentlnterface.
Dynamically, an agent is a thread. When an agent moves to a new agent-server, a new thread is
created, on which the agent is running.
6.2.4 Structure of the Receiving Agents
The receiving agent inherits from a general agent but the receiving agent has its specific functions
in VISITOR. The layers of a receiving agent are as shown in Figure 6.2.
Agent Server
Receiving Agent Network Class Router Server
Listener I Transmission
Communication
Figure 6.2: Layers of a Receiving Agent
When the receiving agent starts up, it forks a thread to execute the Router, which in tum forks a
Ii ., I er thread to execute the Listener. Based on Java Sockets and severSockets, the ransmlssron ay
. . .... th etwork to provides semantics of the agent-packet transffilSSlon. The Listener IS momtonng en
165

see if a new packet is coming. If so, the Listener makes use of the methods provided by the
Transmission layer to receive the packet and pass it to the Router. The Router unpacks the packet
and instantiates the coming agent first, then checks if the underlying machine is the destination of
the agent. If not, the Router would rout the agent to the correct machine. If it is true, the Router
would initiate the agent, create its execution environment and pass it to the receiving agent. The
receiving agent forks a new thread to execute the new coming agent.
It is the Network Class Server (NCS) that implements the dynamic class loading. The principle of
Dynamic class loading is shown as in Figure 6.3. The NCS is listening on the network, when a
Network Class Loader (NCL) asks for classes it will find, load and transport the classes. The NCS
not only can load classes from the local class library but can also load classes from a remote class
library.
Local Class Lib.
Network
Class Loader
o Class
Remote Class Lib.
Figure 6.3: Dynamic Class Loading
The layer structure of a NCS is as shown in Figure 6.4. Like the agent-server, it is also based on
Java Sockets and serverSockets.
Network Class Server
Listener I Transmission
Socket and Server Socket
Figure 6.4: The layers of Network Class Server
166

In the context of VISITOR, when the Router in the agent server instantiates a coming mobile
agent, it will load the classes relevant to the agent dynamically.
6.2.5 Communication between Agents
Agents communicate with each other using the KQML (Mayfield, Labrou & Finin, 1996), which
is a high-level language intended for the run-time exchange of knowledge between intelligent
systems.
Logically the KQML message consists of three layers: the content layer, the message layer, and
the communication layer. The content layer includes the actual content of the message in the
programs' own know ledge representation of the message. KQML can carry expressions encoded
in any representation language such as the Knowledge Interchange Format (KIF), the KQML or
even ASCII strings.
The communication layer encodes a set of message features which describe the lower level
communication parameters, such as the identity of the sender and recipient, anda unique identity
associated with the communication.
It is the message layer that is used to encode a message that one application would like to transmit
to another. The message layer forms the core of the KQML and determines the kinds of
interaction one can have with a KQML-speaking agent. A primary function of the message is to
identify the protocol to deliver the message and to supply a speech act or performative which the
sender attaches to the content (such as an assertion, a query, a command or any of a set of known
performatives). In addition, since the content may be opaque to the KQML-peaking agent, this
layer also includes optical features which describe the content language, the ontology it assumes
and some type of description of the content such as a descriptor naming a topic with the ontology.
Syntactically, a KQML message is a ASCII string called a performative, which consists of a
performative's name and a list of its parameters. A parameter is represented as keyword/value
pair. The keyword, that is the parameter name must begin with a colon and must precede the
167

corresponding parameter value.
Here is an example of a KQML message, which is used as an initial message in our framework:
(evaluate :sender kbase :receiver agent
:Ianguage KQML :ontology agent
:content ( tell-resource :type address
:name AS :value kielder.ncl.ac.uk:5001))
In this message, the KQML performative is the evaluate, the content is (tell-resource :type
address :name AB :value kielder.ncl.ac.uk:5001), another KQML message which tells the agent
that the AB's address is kielder.ncl.ac.uk:500I, the ontology assumed is agent, the receiver and
sender of the message are agent and kbase respectively, and the content is written in the language
KQML.
The value of the content keyword is content level, the values of :sender and :receiver belong to
communication level, and the performative s name (evaluate) with : language and :ontology form
message layer.
When an agent ClientA moves to an agent-server, it would transmit a message like the following
to the AB for telling its existence:
(evaluate :sender ClientA
content (tell-resource :type address :name ClientA
:value kielder.ac.uk:541 00)
ontology agent : receiver AS :Ianguage KQML)
Suppose that there was already another agent ClientB which sent the following message to the AB
When it started up.
168

(evaluate :sender ClientS
:content (tell-resource :type address :name ClientS
:value kielder.ac. uk:541 03)
:ontology agent : receiver AS :Ianguage KOML)
When the agent ClientA wants to communicate with the ClientB, it would first send the following
message to AB:
(evaluate :sender ClientA
:content (ask-resource :type address :name ClientS)
:ontologyagentreceiver AS :Ianguage KOML)
The AB would answer with the message below:
(evaluate :sender AS
:content (tell-resource :type address
:value kielder.ncl.ac.uk:54103 :name ClientS)
:ontology agent :receiver AS :Ianguage KOML)
After that, the ClientA would dialogue with ClientB directly.
169

6.3 Automated Test Execution Through VISITOR
The application of VISITOR to the automated test execution on the banking application is as
shown in Figure 6.5.
est result t b m
ack by obile ~ent
MI) a (
TR
TR
~
TD
'-------
[;I ~
TD
-
~R
---.
lent on Aidan
~ Application
Server (RMI)
cr 1 ,
Remote Object ~
Client 2 on Kielder ~ ~ check
balance
• ; deposit I • ...
•
/ I withdraw I r------
Client n on Glororan on Aidan
the test dliver launched by mobile agent (RMI)
'---
--1 ~ Test Results ..- Test
~ Validator Execution ~
Database Server
(mSQL)
~ I custome~ I balanc9
Database on Kenton
~ lpasswor~
I type I Database
on Kielder
paths trace file
Test Data ...... Generator
Figure 6.5: Automated Client/Server Test Execution through a mobile agent
Aidan, Kie1der, Kenton and Glororan are the UNIX machines that were used for this
implementation.
The test driver is launched by a mobile agent to remote client sites to run the tests. During the
testing, the mobile agent will use the network class se",erto dynamically load the classes relevant
to this test such as the Test Data Generator and the Test Results Validator. The test result (pass/fail)
on each client site will be sent back by the mobile agent with Java RMI. The mobile agent roams
across different platforms and finally it arrives at the application server site to bring back the paths
170

trace file for inspecting the testing order.
This framework has been implemented with the Java Agent Template (JAT) and the Java Remote
Method Invocation (RMI). The JAT provides a fully functional template for constructing agents
which communicate peer-to-peer with a community of other agents distributed over the Internet.
However, JAT agents are not migratory but rather have a static existence on a single host. As an
improvement, the Java RMI is used to let JAT agents dynamically migrate to foreign hosts in this
implementation. As a result of the Java RMI not currently working effectively well on the
Netscape Browser currently, the implementation of MTA (Mobile Testing Agent), the name of a
mobile agent for the automated testing in this implementation, is not available with Java Applet,
but with stand-alone style. It can be downloaded at the MObile Software Testing (MOST) web
site (http://www.casq.org/mostl) which is under the web site for Chinese Association for
Software Quality (CASQ) constructed and maintained by Huey-Der Chu 1998.
To implement MTA, an operational environment is presented based on the Java software as
shown in Figure 6.6, allowing MTA to roam cross the disparate platforms.
Home
MTA ------------------ ... I Re~ote M~th~d Invocation (RMI)
Java Network Programming
c::: Java Agent Template (JATU ,
Java Abstract Windowing Toolkit
Java Development Kit (JDK) 1.1.3
Figure 6.6: An operational environment for implementing MTA
171

The hardware platfonn of the test-bed at the lowest level in Figure 5.6, is a network of C;-';IX
machines running the Solaris 2.x operating system which often plays a part in the distributed
system. The widespread use of the Personal Computer (PC) has also prompted an ongoing effort
to port the environment to the PCIMS-DOS platfonn. On the top of the hardware platfonn is Java
Development Kit (JDK) and JAT. JDK consists of the Java programming language core
functionality, the Java Application Programming Interface (API) with multiple package sets and
the essential tools such as Java Abstract Windowing Toolkit (AWT) and Java RMl. On top of this
platform is VISITOR which consists of aserversite, a client site and a home site. \1TA is launched
by the user on the Home site, migrates to the Client and Server sites and sends results back to the
user.
Before launching the Mobile Testing Agent on the Home site, we set up two Tools Brokers on the
Server and Client sites on two different hosts: Tools Broker A on Glororan and Tools Broker Bon
Walton. The name of the Tools Broker is the name of an Agent Broker for the automated testing in
this implementation. The GUI includes a menu bar and a text area fordisplaying system messages
as shown in Figure 6.7 and shows it receives three messages from MTA, the local service agent
and the receiving agent in the initial status.
r Action Message Resource He I p
Messages received: 3
Messages sent: 0
o utgoi ng buffer: 0
I ncom i ng buffer: 0
S ste m M essaqes
Figure 6.7: GUI for Tool Brokers and MTAs
The system messages with KQML can be displayed on another window as shown in Figure 6.8
after clicking on the "System Messages" button. Each message is written to a log file.
172
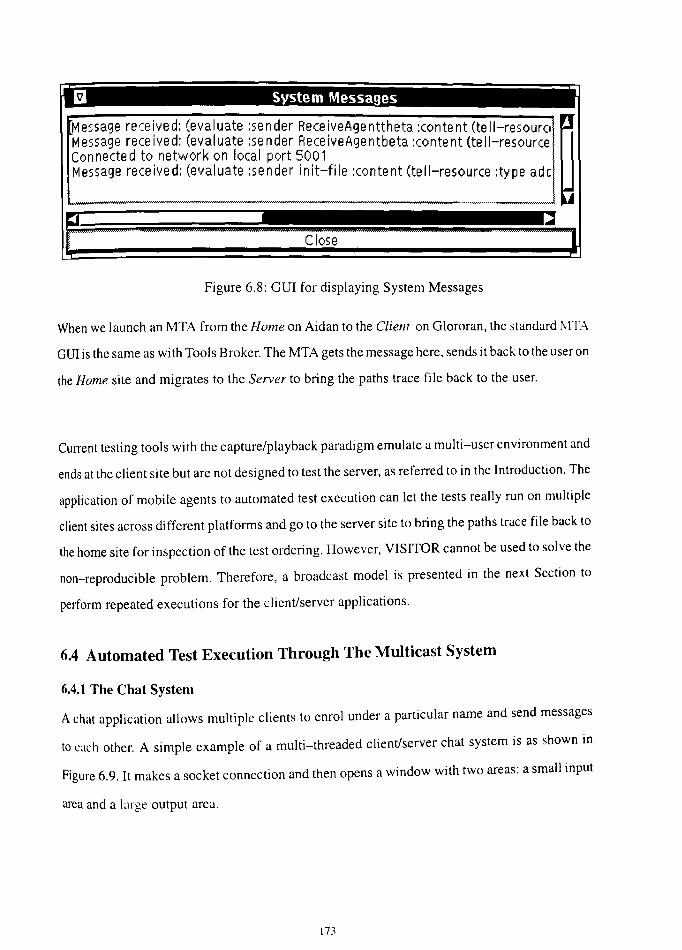
Message rece !ve d: (eval uate :se n der Rece iveAge nttheta :conte nt (te II-resouro Message rece Ive d: (eval uate :se n der Rece iveAge ntbeta :conte nt (te II-resource Connected to network on local port 5001 Message rece ive d: (eval uate :se n der in it-fi Ie :conte nt (te II-resource :ty pe ad c
Figure 6.8: GUI for displaying System Messages
,
When we launch an MTA from the Home on Aidan to the Client on Glororan, the standard l"-.ITA
QUI is the same as with Tools Broker. The MTA gets the message here, sends it back to the useron
the Home site and migrates to the Server to bring the paths trace file back to the user.
Current testing tools with the capture/playback paradigm emulate a multi-user environment and
ends at the client site but are not designed to test the server, as referred to in the Introduction. The
application of mobile agents to automated test execution can let the tests really run on multiple
client sites across different platforms and go to the server site to bring the paths trace file back to
the home site for inspection of the test ordering. However, VISITOR cannot be used to solve the
non-reproducible problem. Therefore, a broadcast model is presented in the next Section to
perform repeated executions for the client/server applications.
6.4 Automated Test Execution Through The Multicast System
6.4.1 The Chat System
A chat application allows multiple clients to enrol under a particular name and send messages
to each other. A simple example of a multi-threaded client/server chat system is as shown in
Figure 6.9. It makes a socket connection and then opens a window with two areas: a small input
area and a large output area.

(!) CSR Chat System on: klelder.ncl.ac.uk ~ CSR Chat System en: klelder .ncl.ac.uk
.IONt~ ~ ~~ I m joseph. Andrl~ f Andrej from Hlxham
Andre~ l' Andrej from Hexham Josep ]: How are you?
p How are you? r.'droJ Fine. How about yo ... work?
Andrej 1: Fine. How about your work?
~".Phl:l g
~Andr.Jl:I I II
I III tmlpd JIJII. fWlet Window I!aII hi.,... Joy. Applet WI_
(a) Joseph chats on Kenton machine (b) Andrej chats on Hexham machine
Figure 6.9: A multi-threaded client/server chat system
After the user types the user name and the text into the input area on the client side, the text is
transmitted to the server. The server echoes back everything that is sent by the user. The screen
on the client site displays everything received from the server in the output area. When multiple
clients connect to one server, a simple chat system is given.
The concept of the multi-threaded client/server chat system provides a direction to perform
repeated executions for the client/server applications. When a client wishes to join the test, it
enrols this chat system and waits for messages from the server site. The test data file is generated
and broadcast to clients on the server site. The clients receive the test data file and execute the
test simultaneously and the test results are transmitted to the server. In the next Section, the
concept of the multicast system is firstly introduced. The multicast framework for the
client/server test execution is illustrated later.
6.4.2 The Multicast System
This multicast system based on the client/server chat system consists of a simple chat client and
a multi-threaded broadcast chat server (Hughes, Hughes, Shoffner & Winslow, 1997). A client
class, ChatClient, implements the chat client and involves setting up a basic user interface,
handling user interaction and receiving messages from the server. A multi-threaded server
contains two classes: a ChatServer class and a ChatHandler class. The framework of this chat
174

system is shown as in Figure 6.10.
runO
new ChatClient
mainO register
Class ChatHandler
ChatHandler 2
runO
_. mainO
Figure 6.10: The framework of the multicast system
The ChatServer class is a server that accepts connections from clients and assigns them to new
connection handler objects. The ehatHandler class actually does the work of listening for
messages and broadcasting them to all connected clients. One thread (the main thread) handles
new connections and there is a thread for each client.
6.4.3 Automated Test Execution Through the Multicast System
In the simple banking application implemented in Chapter 5, when the same test data file ran the
test on two different client sites, the results were wrong as a result of the race condition on the
database server. This can not be tested using the mobile agents to send the same test data to two or
more remote client sites to run the tests simultaneously. Therefore, the framework of automated
test execution through the multicast system as shown in Figure 6.10 is introduced to perform
repeated executions.
175

"4 Test Data Client 1
Generato on Aidan
~ Application Database
Server Server
: (RMI) (mSQL)
Remote Object ""4 ~ I custome~
Client 2 "4 ~ check I balanc9 ~ on Kielder balance
File Database
• ; deposit I
on Kenton
: • "4 ~ I passwor~ •
/ I with~w I type I est Resul s Client n
Database
Validator on Aidan on Glororan on Kielder
"4 Test Result
Figure 6.10: Automated Client/Server Test Execution through Multicast
In this framework, the ChatServer class accepts connections from the clients of the simple
banking application and assigns them to the connection handler objects. The ChatHalldlerclass
does the work of broadcasting the test data files which are generated from the Test Data Generator
as well as the Test Execution and listening for the test results from clients to the home site for the
inspection of the test results using the Test Results Validator.
As a result of lack of time, this framework has not been implemented, however, some chat
systems have been implemented using Java RMI (Wutka, 1997). Therefore, learning
programming skills from these systems could fit this framework as follows. To connect to a
server, this framework could use the RMI name registry to get a remote reference to the
ChatServerclass which includes the ChatHalldlerclass. A CliellfCliellfclass could be created for
the clients of application to invoke the connection to the server to request the test data file and the
Test Execution. When multiple clients connect to one server, the repeated test executions could be
performed.
176

This approach could solve the non-reproducible problem. However, it cannot bring the paths
trace file from the application server, which can be achieved using mobile agents. Therefore, the
dynamic testing strategy advocated here combines two approaches in Section 6.3 and Section 6.4
to achieve the goal of the automated client/server testing. The way to mix the two testing
techniques is deduced from their complementary features, that is, before the multi-user test
executions, a dynamic test plan to classify the testing types between multiple users on different
platforms. A blackboard-based test plan for test automation is proposed in the next Section.
6.5 A Blackboard-based Dynamic Test Plan for Test Automation
6.5.1 Blackboard Architecture
The proposed framework for the dynamic test plan is a blackboard architecture with multiple
agents. A blackboard architecture consists of a control unit, a blackboard and knowledge sources
(agents) (Corkill, 1991; Imam, 1996) as shown in Figure 6.11.
[ Control J _V_nit j control
Blackboard
Knowledge
........ Sources
control (Agents)
Figure 6.11: The blackboard architecture
The control unit makes runtime decisions about the course of problem solving and is responsible
for all communications amongst agents and between the user and the whole system. The
hlackboard is a global database containing input data, partial solutions and other data that is
shared by all agents and managed by the control unit. The agents are systems that are responsible
for performing certain tasks or controlling other agents.
177

6.5.2 Illustration of the Framework
To explain how the blackboard works on the dynamic test planning before the test execution,
consider the following framework on the simple banking application as shown in Figure 6.12.
; .... r ... ~ti;; .. J. ~ ........ ~ .......... . r - - - - - - - - - - - - - -. ,
Blackboard
_1~' _1_,._ . .J _ _ p_,_~,::.J_ ~Iients in Client 1 Client 2 • • • t e banking on UNIX on PC with application machine WinOS
Testin o Tool wfth obile agents
lo~~tWfth he multicast
S stem
• • •
Current Testing tool
_1~' _l_,~ .. J_
o~IB~\~ machine
Figure 6.12: A blackboard-based framework for the dynamic test plan
Assume that the global goal of testing addresses issues of indeterminacy, scalability and
multi-user interaction that often determine the successful deployment of a client/server system.
The initial input into the framework are testing tools with different approaches and clients wiII
enrol the testing. The expected output is a dynamic test plan to aIlocate testing tasks to these
testing tools to clients before the test is executed, such as which clients wiII use a testing tool
through mobile agents.
Whenever, a new client in the client/server banking application is to be enroIled, the control unit
sends a signal to the client agent to acquire the necessary information about the given client, such
as what is the base of the operating system, what testing tools are suitable on this client site and
What is the IP address. The client agent stores this information in the blackboard and sends a signal
to the control unit so that it can accomplish its job.
178

The control unit sends a message to the planning agent to generate a partial plan for the dynamic
test execution using the information in the blackboard. In this case, the test execution using the
framework of VISITOR is working effectively across platforms which are UNIX machine.
Therefore, if a client under the UNIX platform wants to enrol the test, the planning agent will
notice the tool agent whether or not the client is accepted for joining the testing of the multi-user
interaction. The tool agent will send its decision back to the planning agent. If it is acceptable for
the testing of multi-user interaction, the planning agent sends a vector which records the
assignment of the testing tool to the client agent and the IP address of the given client will be
added into the scripts (a visiting list for remote testing) to VISITOR through the tool agent. The
planning agent sends a signal to the control unit that it has accomplished its job and waits for the
coming of the next client.
The process of the dynamic test planning will be repeated until no clients join. The planning agent
will check whether or not the test plan achieves the global goal for testing the client/server
banking application. If so, the mission of the dynamic test planning is complete and the automated
test execution will be ignited based on this test plan. Otherwise, the planning agent will re-plan
(re-assign the tasks amongst clients) until the global goal is achieved.
This section gives a reasonable proposal of the dynamic test planning for the automated test
execution of client/server applications. However, undertaking the development of Multi-Agent
Design Systems (MADS) has been challenging, because both theory and software support have
been limited (Lander, 1997). Therefore, the design and implementation of this framework will be
extended in future study.
6.6 Conclusion
Current testing tools with a capture/playback paradigm have some limitations for client/server
applications. The common one is a lack of consideration of the real world operating environment
across multiple platforms. A mobile agent is a computer object that can roam over the Internet
under its own control, migrating from host to host and interacting with other agents and resources
in order to satisfy requests made by its clients. Based on the concept of mobile agents, the test
179

driver can be launched by a mobile agent to remote client sites to run the tests and the paths trace
file on the server side can also be sent back to the user for inspecting the test ordering. This
concept has been implemented on a 3-tier banking client/server application with Java RMI and
JDBe. It is completely different from current automated testing tools.
The major advantages of this approach are: firstly, changing the layouts does not need to be
acknowledged during test execution since the SMAD tree file is static, secondly, some testing
activities such as the Modeller and the SMAD_Tree Editor can be done early, thirdly, the
interaction behaviours between clients and server can be recorded in a paths tracer file which can
be inspected based on the SMAD tree database and finally, the tests can be really run on multiple
clients across different platforms.
However, this approach can not perform repeated executions. The concept of the chat system was
introduced to automated test execution. This framework can let the same test data file broadcast to
multiple client sites to run the tests simultaneously and can listen to the test results which return
from client sites. These two approaches are complementary to achieve the global goal of
client/server testing. Therefore, a framework based on the blackboard architecture is proposed
for a dynamic test plan to mix these two approaches to the automated testing of client/server
applications.
180

7.1 The Problem
Chapter 7
Summary and Conclusions
The straightforward definition of a high quality system is that it meets its users' requirements.
Software testing is traditionally performed at the end of a release, however, market-driven
schedule pressures often forces organizations to release products before they are adequately
tested. The long-term effect has been increased warranty costs due to a products' poor reliabi lity
and poor quality (Blackburn, 1998). Much focus has been placed on the front-end development
efforts, not realizing that testing accounts for 40 to 75 percent of the cost and effort and can
significantly delay product release (Beizer 1990). If the testing process could be automated, the
cost of developing software could be significantly reduced (lnce, 1987). It is axiomatic that a
problem is cheaper to fix if it is identified early, therefore, the sooner tests can be executed after
the application is written, the more likely defects will not be carried forward. A strategy for test
automation should consider automating these tests as early as possible as well as later in the
testing life cycle. Client/server architectures allow complex systems to be assembled from
components, therefore, the complexity of client/server also makes testing more difficult
(GeITard, 1997), consequently some mechanisms are required.
The hypothesis presented in this thesis is of the automated testing of distributed applications to
achieve high quality software by means of a statistics-based framework which is an extension
of the testing concept in Quality Programming and a statistics-based integrated test environment.
The following assertions are made:
181

• It may be possible to propose A Distributed Message Flow Graph (DMFG) for modeling the
execution behaviour of distributed applications.
• Quality Programming introduced by Cho can automatically generate data for testing, based
on a so-called 'SIAD tree' which is used to represent the hierarchical and syntactic relation
between input elements and also incorporates rules into the tree for using the inputs. In my
research, it is possible to extend the concept of SIAD tree to the 'Symbolic Message Attribute
Decomposition' (SMAD) tree which specifies all possible delivered messages between
events.
• Based on the SMAD tree, it is possible to develop a framework which is based on a statistical
approach. It could automatically generate the test data with an iterative sampling process
which determines the sample size n; the software quality could be estimated with the
inspection of test results, both with respect to their syntactic structure and the causal message
ordering under repeated execution.
• Based on the framework , it is possible to propose a Statistics-based Integrated Test
Environment (SITE) which could secure automated support for the testing process, to address
two main issues, when to stop testing and how good the software is after testing.
• To run the test on the multi-client sites and the server site, it is possible to apply the concept
of mobile agents to the automated testing of client/server testing. A mobile agent is a computer
object that can move through a computer network under its own control, migrating from host
to host and interacting with other agents and resources in order to satisfy requests made by its
clients. In our research, the test driver could be launched by a mobile agent to remote client
sites to run the tests and the tracing file on the server site could also be brought back to the
user for inspecting.
The validation of this thesis takes the implementation of a simple banking application which
incorporates the framework and the integrated environment. A simple banking application is an
embedded software system which is commonly seen inside or outside banks to drive the machine
hardware and to communicate with the bank's central banking database. This application accepts
182

customers requests and produces cash, account information, database updates and so on. In our
research, a Simple Banking Application (SBA) has been designed as a 3-tier client/server
application. The validation of the hypothesis against this implementation will take the following
components:
• A Distributed Message Flow Graph was developed for modeling this simple banking
application. The behaviour of this application was shown in this graphic model. (See Section
5.3 of Chapter 5)
• The definition of the input domain, of the product unit and of product unit defectiveness for
this simple application was specified by SMAD tree. (See Section 5.4.1 of Chapter 5 and
Section 5.4.2 of Chapter 5).
• This simple banking application written using Java Remote Invocation (RMI) and Java
DataBase Connectivity (JDBC) showed the testing process of fitting it into a statistics-based
integrated test environment. (See Section 5.6 of Chapter 5).
• The concept of the automated test execution through mobile agents across multiple platforms
was implemented on this simple banking application. (See Section 6.3 of Chapter 6).
7.2 Contribution of Current Understanding
Software testing is an expensive process and consumes at least 30% of the total costs involved
in developing software, while adding nothing to the functionality of the product. It remains,
however, the primary method through which confidence in software is achieved. Therefore,
automation of the testing process is desirable both to reduce development costs and also to
improve the quality of software. Many development managers are now comfortable tackling the
issues of creating client/server applications, because the market is flooded with client/server
development tools. However, there is a real void in the area of automated testing facilities to test
the complex distributed applications that client/server configurations enable ..
In this thesis a statistics-based framework which is an extension of the testing concept in Quality
183

Programming is presented for automating testing of client/server applications. The main
contributions of this thesis can be summarized as follows:
• A framework for surveying software testing techniques is presented in Section 2.2 of Chapter
2. After the classification of testing techniques, based on when to stop testing and how good
the software is after testing, a classification scheme for testing techniques is presented in
Section 2.3 of Chapter 2. This scheme enables infonned judgements to be made concerning
choice of testing strategy.
• In Section 4.4 of Chapter 4, we specify all possible delivered messages between events by
means of the "Symbolic Message Attribute Decomposition" (SMAD) tree. It combines
classification and syntactic structure to specify all possible delivered messages in a
client/server application. In the upper level of the SMAD tree, all delivered messages are
classified into three types of messages: input messages, intermediate messages and output
messages. Each type of message has a syntactic subtree describing the characteristics of
messages with a "happens before" relationship so that it can be determined whether messages
were delivered in an order consistent with the potential causal dependencies between
messages. With the SMAD tree, a statistics-based framework for testing distributed
applications (see Chapter 4) not only can generate the test script on client sites, but can inspect
the test ordering on the server site, with respect to the causal message ordering under repeated
executions.
• Based on the testing framework described in Chapter 2, this thesis proposes a Statistics-based
Integrated Test Environment (SITE) which secures automated support for the testing process,
to address two main issues, when to stop testing and how good the software is after testing (see
Chapter 3). It consists of computational components, control components and an integrated
database. The computational components include the Modeller for modelling the applications
as well as the quality plan, the SMAD Tree Editor for specifying input and output messages,
the Quality Analyst which includes the statistical analysis for determining the sample size for
the statistical testing and the test coverage analysis for evaluating the test data adequacy, the
Test Data Generator for generating test data, the Test Tracer for recording testing behaviours
on the server side and the Test Results Validator for inspecting the test results as well as
184
examining the "happens before" relationship.
There are two control components, the Test Manager and the Test Driver. The Test Manager
receives the command from the tester and corresponds with the functional module to execute
the action and achieve the test requirements. It executes two main tasks: the data management
and the control management. In the data management, the Test Manager maintains an
integrated testing database which consists of static data files and dynamic data files which will
be created, manipulated and accessed during the test process. The static files include a SMAD
tree file, a random number seed file and a quality requirement file. The dynamic files include
an input unit file, a product unit file, a test ordering file, a defect rate file, a file for the defect
rate range and a sample size file.
In control management, the Test Manager controls three main functional modules: the
Modeller, the SMAD Tree Editor and the Test Driver. The Modeller is used for receiving the
test plan such as test requirements and test methods from the users, creating test plan
documentation and saving some values for the testing database. The documentation provides
support for test planning to the Test Driver as well as the SMAD Tree Editor for specifying
messages among events. The SMAD Tree Editor is used to create the SMAD tree file that can
be used to describe the abstract syntax of the test cases as well as to trace data occurring during
the test. The SMAD tree file provides the structure to the Test Data Generator for generating
input unit and the Quality Analyst to inspect the product unit. The Test Driver executes the
main task of testing which includes the Test Data Generator, the Test Execution, the Test
Results Validator and the Sampling Processor. The implementation of a 3-tier client/server
application which incorporates the framework is also described in Chapter 5.
• To assist a solution to the problem of the test environment spanning multiple platforms, the
concept of mobile agents was introduced in Chapter 6. The test driver can be launched by a
mobile agent to remote client sites to run the tests and the paths trace file on the server site can
also be sent back to the tester for inspecting the test ordering. It has been implemented on a
3-tier banking client/server application as described in Section 6.3 of Chapter 6.
185

Often, automated testing is introduced very late in the implementation process and is restricted
to regression testing. The earlier the testers incorporate an automated test approach into the
development process, the greater the return on the investment. In this implementation for
automated testing through mobile agents, changing syntactic structures such as screen layouts
does not interfere with test execution since any changes for these structures can be done by
the SMAD_Tree Editor before the test execution. In other words, some testing activities
involving components such as the Modeller and the SMAD_Tree Editor can be done early.
To address the problem for repeated executions, the concept of the chat system was introduced
in Section 6.4 of Chapter 6. Based on the multicast framework, the same test data file can be
broadcasted to multiple clients sites to run the tests simultaneously and the test results can be
returned from the client sites. Moreover, the interaction behaviour between client and server
sites can be inspected by the SMAD tree file based on the causal message ordering. Finally,
the tests can be really run on multiple clients across different platforms. The combination of
all these features into a single automated test environment is a considerable advance, not
before achieved in test environments for distributed applications.
7.3 Future Research
This thesis has concentrated on the extension of Quality Programming to the automated testing
of client/server applications. A statistics-based integrated test environment was proposed for
testing distributed applications. One way to check the usefulness of the software test environment
presented in this thesis is to perform further applications. Within this thesis one worked
application, a simple banking application with Java RMI and JDBC, is presented through this
thesis.
As a result of lack of time and resources, not all features will be available at the same time with
full functionality. In this thesis, the causality relation is presented for examining the test results
with the casual ordering message in the distributed computation. However, this concept has not
been implemented. In my implementation, the testing order of interactive behaviours between
two client sites is traced by writing codes in events inside the application. If I had more time and
186

resource, the tool, the Test Paths Tracer, should be developed for instrumenting the source code
to monitor test execution. It could allow the user to select the "level" of instrumentation and the
instrumented execution could produce a trace of the execution behaviour. The choices should
include statement, branch, remote method call, task entry and exception etc. These traces could
be used for behaviour verification.
Automated behaviour verification is one of the innovative claims of SITE. Most testing tools
provide limited, if any, support for test oracles and behaviour verification. In particular, some
provide the ability to specify expected output for specific test inputs or they may provide
capture/playback capabilities that are useful in re-testing. Very few capabilities are provided for
first time test execution or for general specification of expected behaviour. This is a major
shortcoming in testing tools, as leaving behaviour verification totally to the user can be extremely
error prone. After execution of each test data, the Test Results Validator in the SITE should apply
all valid procedures associated with the input messages, intermediate messages and output
messages using the SMAD tree file. The valid procedure could basically compare the execution
trace, intermediate messages and out messages with the information of the causality relation in
the SMAD tree file and determines if this test execution has passed or failed. If the test fails, a
failure report generated by the Test Results Validator.
Accurate process and product measurement is required to support continuous improvement of
products and processes. Automation of the testing process should support automatic metric
collection. SITE currently performs the statistical analysis, however, it is a limited coverage
measurement of testing. Therefore, SITE should be developed with the hooks in place to collect
more metrics and do more coverage measurement.
A test criterion does not explicitly define test cases by actual inputs but rather describes the
requirements on test inputs or test execution. SITE should use these descriptions to measure
whether and how much of a test criterion is adequately satisfied. When a test with test coverage
is executed, the Quality Analyst in the SITE should determine whether a test suite (providing the
187

environment for the test case) is to be checked against any test criterion. IT it is related, then the
execution traces produced by executing each test case in the suite are compared with each element
of the test criterion to determine which, if any, criterion elements were covered by the test
execution.
The statistics-based integrated test environment could be further developed in one of five
directions:
• Firstly a more detailed and complex application could be undertaken. In our implementation
in Chapter 5, the simply banking application with Java RMI and JDBC was implemented
under UNIX platforms and the integrated database in SITE was implemented using mSQL
and Java JDBC. Therefore, a complex application with other programming languages and
across different operating system platforms would serve to show the ability of SITE. In
addition, the integrated database in SITE could be implemented by other database systems to
examine how Java JDBC works on a multiple database environment.
• The second direction is the expansion of SMAD Tree Editor for wider applications. According
to the different types of software applications, we can use a number of different types of SIAD
trees (a detailed description of these threes is given in Cho). In Chapter 5, I apply the rule
SIAD/SOAD tree for the simply banking application. In (Liu, Yang, Chu, Liu & Chang.
1992), we applied the weighted and ruled SIAD trees for the Command File Interpreter (CFI)
software, the regular SIAD tree for interface software in a relational database system and the
regular SIAD tree for a LEX generator. Therefore, the expansion of SMAD Tree Editor would
allow us to build different types of SMAD tree files for different applications.
• The third is to build up a general Test Data Generator which can automatically generate test
data for different applications. In my implementation in Chapter 5, I found out the Test Data
Generator depended on the SMAD tree file to generate test data. In other words, a new
application could not use the Test Data Generator in Chapter 5 to generate test data. We must
replace some procedures for this new application. Therefore, we need to develop a compatible
tool which could be used for replace these procedures for different applications to let Test Data
Generator become a flexible tool.
188

• The four direction is the design and implementation of the proposed framework in Section 6.5
of Chapter 6. A dynamic testing strategy advocated in this thesis to combine two approaches
in Section 6.3 and Section 6.4 to achieve the global goal of the automated client/server testing.
The way to mix these two testing approaches is deduced from their complementary features,
that is, before the multi-user test executions, a dynamic test plan to classify the testing types
between multiple users on different platforms. The proposed framework under a blackboard
architecture with multiple agents is a reasonable framework. However, undertaking the
development of Multi-Agent Design System (MADS) has been challenging, because both
theory and software support have been limited (Lander, 1997). Therefore, the design and
implementation of this framework will be extended in future study.
• The final direction is to extend SITE for testing Graphical User Interface (GUI) applications.
Most modern client/server applications include a GUI, these interfaces can be extremely
simple to agonizingly complex depending on the application. In many companies the testing
of the GUI interface is a critical part of the plan for product release (Schroeder & Apfelbaum,
1998). The use of a graphical model to describe the behaviour of a GUI combined with an
automated test generation system could dramatically reduce the time required to test an
client/server application. Therefore, it is necessary to apply SITE for testing GUI applications
189

REFERENCE LIST
Basili, V.R & Selby, RW. (1987). Comparing the Effectiveness of Software Testing Strategies,
IEEE Transactions on Software En&ineerin&, SE-13(12), 1278 - 1296.
Beizer, B. (1990). Software Testin& Techniques (Second ed.). Van Nostrand Reinhold, New York.
Beizer, B. (1995). Black-Box Testin&: Techniques for Functional Testin& of Software and
Systems. John Wiley & Sons, Inc., New York.
Beizer, B. (1997). The Future of Software Quality. In International Software Ouality Week
Europe (QWE'97), Brussels.
Belli, F. & Jack, O. (1993). Implementation-based analysis and testing of prolog programs. In
International Symposi urn on Software Testin& and Analysis, Cambridge, Massachusetts, 70 - 80.
Berry, A. (1995). An Application-level Implementation of Causal Timestamps and Causal
Ordering. Distributed System En&ineer, (2), 74-86.
Bertolino, A. (1991). An Overview of Automated Software Testing. Journal Systems Software,
15, 133 - 138.
Blackburn, M. (1998). Specification Transformation to Support Automated Testing. In 15th
International Conference and Exposition on Testing Computer Software (TCS'98), Washington,
D.C.
Bottaci, L. & Jones, J. (1995). Formal Specification Using Z: A Modellin& Approach.
International Thomson Publishing, London.
Chaar, J. K., Halliday, M. J., Bhandari, I. S. & Chillarege, R (1993). In-Process Evaluation for
Software Inspection and Test. IEEE Transactions on Software Engineering, SE-19(U), 1055-
1070.
Chen, T. Y. & Yu, Y. T. (1996). On the Expected Number of Failures Detected by Subdomain
Testing and Random Testing. IEEE Transactions on Software En&ineering, SE-22(2), 109 - 119.
Chen, J. (1997). A flexible framework for mobile agent systems. Available at
<http://www.casg.or&/most/chen.ps>.
190

Chen, J., Greenwood, S. & Chu, H. D. (1998). In 10th International Conference on Software
Engineering and Knowledge Engineering (SEKE'98), San Francisco, CA.
Cheriton, D. R. & Skeen, D. (1993). Understanding the Limitations of Causally and Totally
Ordered Communication. In 14th ACM Symposium on Operating Systems Principles, 44-57.
Chess, D., Harrison, C. & Kershenbaum, A. (1997). Mobile agents: Are they a good idea?
Lecture Notes in Computer Science 1222, 25-45.
Cho, C. K. (1988). Quality Programming: Developing and Testing Software with Statistical
Quality Control. John Wiley & Sons, Inc., New York.
Chow, T. S. (1980). Integration Testing of Distributed Software. In IEEE Conference on
Distriuted Computing, 706-711.
Chu, H. D. & Dobson, J. (1996). A Statistics-based Framework for Automated Software Testing.
In 9th International Software Quality Week (QW'96), San Francisco, CA.
Chu, H. D. (1997). An Evaluation Scheme of Software Testing Techniques. Reliability, Quality
and Safety of Software-Intensive Systems. Ed. Dimitris Gritzalis. Chapman & Hall, London,
259 - 262.
Chu, H. D., Dobson, J. E. & Liu, I. C. (1997). FAST: A Framework for Automating
Statistics-based Testing. Software Quality Journal, 9.(1), 13-36.
Chu, H. D. & Dobson, J. E. (1997). An Integrated Test Environment for Distributed Applications.
In 10th International Software Quality Week (QW'97), San Francisco, CA.
Chu, H.D., Dobson, J., Chen, J. & Greenwood, S. (1998). The Application of Mobile Agents to
Software Testing. In 15th International Conference and Exposition on Testing Computer
Software (TCS'98), Washington, D.C.
Corkill, D. D. (1991). Blackboard Systems. AI Expert, 9.(9),40-47.
Currit, P. A., Dyer, M. & Mills, H. D. (1986). Certifying the Reliability of Software. IEEE
Transactions on Software Engineering, SE-12(1), 3 - 11.
Deck, M. (1996). Cleanroom practice: a theme and variations. in 9th International Software
Quality Week (QW'96), San Francisco, CA.
191

DeMillo, R. A., Lipton, R. J. & Perlis, A. J. (1979). Social Processes and the Proofs of Theorems
and Programs. Communications of the ACM, 22(5), 271 - 280.
DeMillo, R. A., McCrracken, W. M., Martin, R. J. & Passafiume, J. F. (1987). Software Testing
and Evaluation, The Benjamin/Cummings Publishing Company, Inc., Workingham.
Deutsch, M. S. & Willis, R. R. (1988). Software Quality Engineering: A Total Technical and
Management Approach. Prentice-Hall Inc., Englewood Cliffs.
Duran, J. W. & Ntafos, S. C. (1984). An Evaluation of Random Testing. IEEE Transactions on
Software Engineering. SE-1O(4), 438 - 444.
Eickelmann, N. S. & Richardson, D. J. (1996). An Evaluation of Software Test Environment
Architectures. In 18th International Conference on Software Engineering, 353 - 364.
Dyer, M. (1992). The Cleanroom Approach to Quality Software Development. John Wiley &
Sons, New York.
Fagan, M. E. (1976). Design and Code Inspections to Reduce Errors in Program Development.
IBM Systems journal, 15(3), 182 - 211.
Fagan, M. E. (1986). Advances in Inspections, IEEE Transactions on Software Engineering.
SE-12(7), 744 -751.
Ferguson, R, C. (1993). Test Data Generation for Sequential and Distributed Programs. Ph.D.
Thesis, Wayne State Univetsity.
Ferguson, R. C. & Korel, B. (1996). The Chaining Approach for Software Test Data Generation.
ACM Transactions on Software Engineering and Methodology . .2(1), 63 - 86.
Fewster, M. & Graham, D. (1998). Automating Software testing, Addison WesleyPublishing
Company, Wokingham, England (To be published later 1998).
Fidge. C. (1991). Logical Time in Distributed Computing Systems. IEEE Computer. 24(8), 28
-33.
Frankl, P. G. & Weyuker, E. J. (1993). A Formal Analysis of the Fault-Detecting Ability of
Testing Methods. IEEE Transactions on Software Engineering, SE-19(3), 202 - 213.
192

Gelperin, D. & Hetzel, B. (1988). The Growth of Software Testing. Communication of the ACM, 1l(6), 687 - 695.
Gerrard, P. (1997). Testing Client/Server Systems. Available at <http://www.ftech.net/-evolutif/articJes/cstestin~.html>.
Gilb, T. & Graham, D. (1993). Software Inspection. Addison-Wesley Publishing Company, Wokingham.
Goodenough, J. B. & Gerhart, S. L. (1975). Toward a Theory of Test Data Selection. IEEE
Transactions on Software En~ineerin~, SE-1(2), 156 - 173.
Graham, D. R. & Herzlich, P. (1993). The CAST Report (second ed.). Cambridge Market
Intelligence Limited, London.
Gray, R. Kotz, D., Nog, S., Rus, D. and Cybenko, G. (1997). Mobile Agents: The next
generation in distributed computing. In Int. Symposium on Parallal Al~orithms Architecture
Synthesis, Japan.
Hamlet, D. (1988). Special Section on Software Testing. Communication of the ACM,.ll(6), 662
-667.
Hamlet, D. & Taylor, R. (1990). Partition Testing Does Not Inspire Confidence. IEEE
Transactions on Software En~ineerin~, SE-19(3), 202 - 213.
Horcher, H. M. & Peleska, J. (1995). Using Formal Specifications to Support Software Testing.
Software Quality Journal, 4, 309-327.
Hughes, M., Hughes, c., Shoffner, M. & Winslow, M. (1997). JAVA Network Programming.
Manning Publication Co., Greenwich.
Humphrey, W. S. (1989). Characterizing the Software Process: a maturity framework. IEEE
Software. March.
IEEE (1983). IEEE Standard for Software Test Documentation: IEEElANSI Srandard
829-1983. New York: Institute of Electrical and Electronic Engineers.
193

Imam, I. F. (1996). A Proposed Framework for Automating Software Testing. In 9th Florida
Artifical Intellit:ence Research Symposium, 478-481, Florida, U.S.A.
Ince, D. C. (1987). The Automatic Generation of Test Data. The Computer Journal, 30(1), 63-69.
Jorgensen, P. C. & Erickson, C. (1994). Object-Oriented Integration Testing. Communication of the ACM, 37(9), 30 - 38.
Kazman, R., Bass, L., Abowd, G. & Webb, W. (1994). SAAM: A Method for Analyzing the
Properties of Software Architectures. In 16th International Conference On Software Ent:ineering,
81 - 90. Sorrento, Italy.
Kit, E. (1995). Software Testing in the Real World: improving the process. Addison-Wesley
Publishing Company, Workingham.
Korel, B. (1990). Automated Software Test Data Generation. IEEE Transactions on Software
Engineering, SE-16(8), 870 - 879.
Lamport, L. (1978). Time, Clocks, and the Ordering of Events in a Distributed System.
Communications of the ACM, 21(7), 558 - 565.
Lander, S. E. (1997). Issues in Multiagent Design Systems. IEEE Expert, March-April, 18 - 26.
Lauterbach, L. & Randall, W. (1989). Experimental Evaluation of Six Test Techniques. In
Proceedings COMPASS 89,36 - 41.
Laprie, J. C. (1995). Dependability - Its Attributes, Impairments and Means. In Predictably
Dependable Computing Systems. (pp. 3 - 18). Springer.
Liggesmeyer, P. (1996). Selecting Test Methods, Techniques, Metrics and Tools Using
Systematic Decision Support. In 9th International Software Quality Week (OW'96), San
Francisco, CA.
Lingnau, A. & Drobnik, O. (1995). An HTTP-based infrastructure for mobile agents,
Available at <http://www.w3.org!pub/Conferences/WWW4>.
Liu, I C., Yang, R.D., Chu, H.D., Liu, F.H. & Chang, C.S. (1992). Software Statistical Ouality
Assurance ,Technical Report, Institute for Information and Industry, Taiwan.
194

Lyons, N. R. (1977). An Automatic Data Generation System for Data Base Simulation and
Testing. Data Base, B.(4), 10 - 13.
Marre, B., Thevenod-Fosse, P., Waeselynck, H., GaIl, P. L. & Crouzet, Y. (1995). An
Experimental Evaluation of Formal Testing and Statistical Testing. In Predictably Dependable
Computin~ Systems. (pp. 273 - 281). Springer.
Mayfield, J., Labrou, Y., & Finin, T. (1996). Evaluation of KQML as an agent communication
language, Available at <http://www.cs.umbc.eduflaitlpapers!kqml-eval.ps>.
Mills, H.D., Dyer, M. & Linger, R. (1987). Cleanroom Software Engineering. IEEE Software,
~(5), 19 - 25.
Mooney, K. & Chadwick, D. (1998). Overcoming the Challengs of Testing Client/Server
Applications. Available at <http://www.rational.comlsupport/techpapers/challen~es/>
Musa, J. D. & Ackerman, A. F. (1989). Quantifying Software Validation: When to Stop Testing?
IEEE Software, May.
Myers, GJ. (1978). The Art of Software Testin~. John Wiley & Sons, New York.
Nair, B., Gulledge, K. & Lingevitch, R. (1996). Using OLE Automation for Efficiently
Automating Software Testing. In 9th International Software Ouality Week (OW'96), San
Francisco, CA.
Niemeyer, P. & Peck, J. (1997). Explorin~ JAVA (Second ed.). O'Reilly & Associates, Inc., USA.
Norman, S. (1993). Software Testin~ Tools. Ovum Ltd, London.
Ould, M. A. & Unwin, C. (1986). Testin~ in Software Development. Cambridge University
Press, Cambridge.
Parnas, D., Schouwen, J. V. & Kwan, S. P. (1988). Evaluation of Safety-Critical Software.
Communication of the ACM, 31(6),636 - 648.
Parrish, A. & Zweben, S. H. (1991). Analysis and Refinement of Software Test Data Adequacy
Properties. IEEE Transactions on Software En~ineerin~. SE-17(6), 565 - 58l.
195
Petti chord, B. (1996) .Success with Test Automation. In 9th International Software Ouality Week
(OW'96), San Francisco, CA.
Poston, R. M. (1994). Automated Testing from Object Models. Communication of the ACM , J1(9), 48 - 58.
Poston, R. M. (1996). Automating Specification-Based Software Testing. IEEE Computer
Society Press, Los Alamitos, CA, US.
Quinn, S.R. & Sitaram, M. (1996). Shrink-wrapped and custom tools ease the testing of
client/server applications, Byte, September, 97-102.
Ramamoorthy, C. V. & Ho, S. F. (1975). Testing Large Software with Automated Software
Evaluation Systems. IEEE Transactions on Software Engineering, SE-1(3), 46 - 58.
Ramamoorthy, C. V., Ho, S. F. & Chen, W. T. (1976). On the Automated Generation of Program
Test Data. IEEE Transactions on Software Engineering, SE-2(4), 293 - 300.
Rapps, S. & Weyuker, E. J. (1985). Selecting Software Test Data Using Data Flow Information.
IEEE Transactions on Software Engineering, SE-11(4), 367 - 375.
Richardson, D.J., Aha, S.L. & O'Malley, T. O. (1992). Specification-based Test Oracles for
Reactive Systems. In 14th International Conference on Software Engineering, 105 -118. Melpq
lbourne, Australia.
Richardson, D.J. (1994). TAOS: Testing with Oracles and Analysis Suport. In International
Symposium on Software Testing and Analysis, 138 - 153. Seattle, Washington.
Roper, M. (1994). Software Testing. McGraw-Hill Book Company, London.
Schroeder, J. & Apfelbaum, L. (1998). Automating Test Generation for Gills. In 15th
International Conference and Exposition on Testing Computer Software (TCS'98). Washington.
U.S.A.
Schwarz, R. & Mattern. F. (1994). Detecting Causal Relationships in Distributed Computations:
in Search of the Holy Grail. Distributed Computing, 1.149 - 174.
Shatz. S. M. & Wang. J. P. (1987). Introduction to Distributed-Software Engineering. IEEE
Computer, m(10), 23 - 31.
196

Shatz, S. M. & Wang, J. P. (1988). Tutoial: Distributed-Software Engineering. IEEE Computer
Society Press, Los Angeles, CA.
Singhal, M. & Casavant, T. L. (1991). Distributed Computing Systems, IEEE Computer, 24(8),
12 -14.
Smith, D. 1. & Wood, K. B. (1989). Engineering Ouality Software: A review of Current Practices
Standards and Guidelines including New Methods and Development Tools (Second ed.).
Elsevier Science Publishers Ltd., Essex.
Sommerville, 1. (1996). Software Engineering (Fifth ed.). Addison-Wesley Publishing
Company, Wokingham, England._
Spillner, A. (1995). Test Criteria and Coverage Measures for Software Integration Testing.
Software Ouality Journal, 1,275 - 286.
Thevenod-Fosse, P. & Waeselynck, H. (1991). An Investigation of Statistical Software Testing.
Journal of Software Testing. Verification and Reliability. 1(2), 5 - 25.
Thevenod-Fosse, P. & Waeselynck, H. (1996). Towards a Statistical Approach to Testing
Object-Oriented Programs. Design for Validation. First Year Report, 403 - 424.
Thevenod-Fosse, P. Waeselynck, H., & Crouzet, Y. (1995). Software Statistical Testing. In
Predictably Dependable Computing Systems. (pp. 253 - 272). Springer.
Umar, A. (1993). Distributed Computing: A Practical Synthesis. Prentice-Hall, International,
Inc., London.
Vliet, H. V. (1994). Software Engineering: Principles and Practice. John Wiley & Sons, New
York, US.
Vogel, P. A. (1993). An Integrated General Purpose Automated Test Environment. In
International Symposium on Software Testing and Analysis, 61-69. Cambridge, Massachusetts.
Weyuker, E. J. (1986). Axiomatizing Software Test Data Adequacy. IEEE Transactions on
Software Engineering, SE-12(12), 1128 - 1138.
Weyuker, E. J. & Jeng, B. (1991). Analyzing Partition Testing Strategies. IEEE Transactions on
Software Engineering, SE-17(7), 703 - 711.
197

Whittaker, J.A. & Thomason, M.G. (1994). A Markov Chain Model for Statistical Software
Testing, IEEE Transcations on Software Engineering. SE-20(10), 812-824.
Wutka, M. (1997). Hacking Java: The java Professional's Resource Kit, Oue Corporation,
Indianapolis, U.S.A.
Zallar, K. (1997) Automated Software Testing - A Perspective. In 10th International Software
Quality Week (OW'97), San Francisco, CA.
Zhu, H., Hall, P.A.V. & May, J.H.R. (1994). Software Test Coverage and Adequacy. Technical
Report No. 94115, The Open University.
Zhu, H. (1996). A Formal Analysis of the Subsume Relation Between Software Testing
Adequacy Criteria. IEEE Transactions on Software Engineering, SE-22(4), 248 - 255.
198