university of minnesota: biennial budget reporting
TRANSCRIPT

University of Minnesota: Biennial Budget Reporting Requirements Minnesota Statutes 2018, Section 135A.031, Subd. 7
1
This document is made available electronically by the Minnesota Legislative Reference Library as part of an ongoing digital archiving project. http://www.leg.state.mn.us/lrl/lrl.asp

Table of Contents
1. Subdivision 7(1): Expenditures.......................................................................................... 4
2. Subdivision 7(2): Instructional Expenditures by FYE Student .......................................... 4
3. Subdivision 7(3): Revenues ............................................................................................... 6
4. Subdivision 7(4): Allocation Method ................................................................................ 7
5. Subdivision 7(5): Reallocations ......................................................................................... 8
6. Subdivision 7(6): Tuition History and Comparisons ....................................................... 11
7. Subdivision 7(7): Graduation Rates ................................................................................ 11
8. Subdivision 7(8): Under-Represented Students ............................................................. 12
9. Subdivision 7(9): Support of Research / Technology Commercialization ..................... 12
10. Subdivision 7(10): Consulting Contracts ......................................................................... 15
11. Subdivision 7(11): Aggregate Data .................................................................................. 16
• Student Demographics .......................................................................................... 16
• Student Enrollment by Legislative District ............................................................ 16
• Student Debt ......................................................................................................... 16
• Mandatory Student Fees ....................................................................................... 17
• Employee Headcount & Demographics ................................................................ 18
• Facilities ................................................................................................................. 18
• Administrative Costs ............................................................................................. 21
• University Operating Budget ................................................................................. 23
12. Appendix ........................................................................................................................... 25
2

Introduction The following tables and paragraphs are provided by the University of Minnesota in response to reporting requirements under Minnesota Statutes, Section 135A,031, Subdivision 7. The expenditure and revenue data is either directly from the audited Financial Statements or a query from the general ledger for the years indicated. In some cases, the tables include adjusting information in order to make the displays clearer for the general reader. While not all nuances or definitions of the data can be footnoted in a report like this, there are a few points that are important to understand when reviewing the following tables:
• In the audited financial statements for the University, adjustments are made to certain revenues and expenditures related to scholarship/student aid spending, to reflect accrual accounting requirements for institutions of higher education. Specifically, in each year, the total amount of revenue recorded in the ledger for tuition, auxiliary and other sales revenues generated from student payments, are reduced equal to the amount of scholarships that were used to pay those “bills”. Similarly, that same scholarship expenditure is also then eliminated. This set of adjustments has the impact of reducing recorded revenues and expenditures in the exact same amount, and results in a more accurate display of net activity. An example of the resulting flow of transactions may be helpful:
1. A gift received by a University department for scholarships - $10,000 is recorded by the University as gift revenue
2. Tuition is charged to student (before financial aid awards) - $10,000 is recorded as gross tuition revenue by the University, and as tuition owed by the student
3. The gift revenue is spent by the department when scholarships are awarded for merit aid - $10,000 is recorded as scholarship expenditure when tuition is billed to the student and then credited to his/her student finance account
4. Tuition revenue earned in step 3 is spent by department - $10,000 is recorded as instructional salaries/supplies expenditures
In this example, the $10,000 scholarship expense (noted in step 3) is offset against the $10,000 gross tuition revenue (noted in step 2), to eliminate “double counting” of the same $10,000 – as both gift and tuition revenue, and as both scholarship and salaries/supplies expenditures. What remains in the totals are the original gift revenue received and the final expenditure for salaries/supplies.
• A second point to note is that the audited financial statements do not report the expenditures for capital assets. Rather, the annual depreciation of capital asset purchases is reported as the expense, rather than the actual asset purchase. Therefore, the “Depreciation” line of table 7-1 represents the annual expense for capital assets. Additional descriptive information, as requested in the legislation or to clarify data presented in the tables, is included in the subdivision sections below as appropriate.
3

Subdivision 7(1): Expenditures University of Minnesota, Fiscal Years 2013 to 2017
Table 7-1i: Expenditures by Functional Area
FY 2013 FY 2014 FY 2015 FY 2016 FY 2017
Instruction $737,596 $769,479 $770,325 $785,085 $827,780
Research 656,551 679,718 700,208 688,240 763,410
Public Services 249,257 253,141 248,451 256,376 304,268
Academic Support 367,265 394,927 366,992 384,476 461,542
Student Services 110,230 116,575 116,016 116,751 144,826
Institutional Support 197,319 256,641 243,153 259,120 297,379
Scholarships & Fellowships* 50,435 54,519 57,879 60,415 62,060
Auxiliary Enterprises 235,411 256,068 256,271 256,431 292,784
Operations/Maint. Of Plant 266,994 285,938 276,783 290,691 288,588
Depreciation 193,139 192,705 218,565 212,969 208,645
Other (net) 583 93 157 294
Total $3,064,197 $3,260,294 $3,254,736 $3,310,711 $3,651,576
(Dollars in Thousands) – source: Audited Financial Statements Fiscal Years 2013 through 2017
Due to the methodology required by the audited financial statements for the elimination of tuition and other revenues supported by scholarships, and the corresponding elimination of scholarship expenditures, the following scholarship amounts are excluded – all dollars in thousands: $246,894 (FY13); $257,481 (FY14); $263,707 (FY15); $275,112 (FY16); and $290,725 (FY17)
Table 7-1ii: Expenditures by Object of Expenditure
FY 2013 FY 2014 FY 2015 FY 2016 FY 2017
Salaries $1,462,577 $1,549,612 $1,576,587 $1,632,614 $1,687,080
Fringe Benefits* 493,528 515,159 447,768 429,175 778,743
Student Aid** 39,319 42,386 44,017 46,643 48,840
Purchased Services 378,010 408,054 410,489 406,425 404,309
Supplies 180,033 218,551 213,447 228,720 205,567
Repairs, Maintenance 138,137 153,070 160,281 173,525 133,967
Depreciation 193,139 192,705 218,565 212,969 208,645
Grants to Other Organizations 110,373 123,270 127,120 125,196 127,812
Other Expense 69,081 57,487 56,462 55,444 56,613
Total $3,064,197 $3,260,294 $3,254,736 $3,310,711 $3,651,576
(Dollars in Thousands) – source: Audited Financial Statements Fiscal Years 2013 through 2017
4

*Effective FY15 and fiscal years going forward, the University is required to record an adjustment for GASB 68/71 (net pension liability) for its percentage share participation in state pension plans (MSRS and PERA). This adjustment affects the fringe benefits line item in Table 7-1ii.
**Due to the methodology required by the audited financial statements for the elimination of tuition and other revenues supported by scholarships, and the corresponding elimination of scholarship expenditures, the following scholarship amounts are excluded – all dollars in thousands: $246,894 (FY13); $257,481 (FY14); $263,707 (FY15); $275,112 (FY16); and $290,725 (FY17)
One category of spending in the table above had a material increase in the most recent biennium: fringe benefits increased $349.6 million, or 81.5%, from FY16 to FY17. The magnitude of this change is due to the required GASB 68/71 net pension liability entry as explained in the footnote to the table. Without that adjustment, the growth from FY16 for Fringe Benefits would have been 4.5%. In addition, two categories of spending experienced a material decrease from FY16 to FY17: supplies decreased $23.2 million, or 10.1% and repairs and maintenance decreased $39.6m, or 22.8%. The decrease in supplies was primarily related to a growth in Internal Sales Organization (ISO) activity (subtracted from total expenditures as it represents products and services sold by one University department to another); a drop in royalty distributions to inventors and other third parties; and a decrease in costs for software maintenance, electronic licenses and noncapital equipment purchases. The decrease in repairs and maintenance expenditures was largely driven by a decrease in funds appropriated to the University for that purpose and project timing. In general, these two categories of spending (supplies and repairs/maintenance) can experience larger variances as there are a significant number of one-time purchases or costs that ebb and flow differently across fiscal years. A larger capital project or significant facility renovations in one year, for example, can be followed by a fiscal year with more moderate or small projects.
Subdivision 7(2): Instructional Expenditures by FYE Student University of Minnesota, Fiscal Years 2013 to 2017
Below are the direct instructional costs (salaries, supplies etc. directly associated with delivering instruction; excludes overhead or indirect costs) per full-year equivalent student, using data provided through annual IPEDS reporting. Though the University has begun to conduct its own study of the fully allocated (direct and indirect) cost of mission (instruction, research and public service), it does not have five consecutive years of analysis available. Therefore, the next best option is to provide direct instructional costs through the use of IPEDS data. The use of the instruction function code as required by IPEDS and other federal reporting requirements is the same base data used for the University’s broader cost of mission study.
Undergraduate 2012-13 2013-14 2014-15 2015-16 2016-17
University of Minnesota-Crookston
$5,804 $6,197 $6,424 $6,877 $6,937
University of Minnesota-Duluth $6,191 $6,904 $6,766 $6,970 $7,067
University of Minnesota-Morris $8,451 $8,474 $9,136 $9,566 $9,634
University of Minnesota-Rochester
$7,495 $7,057 $7,657 $8,129 $7,631
5

Undergraduate 2012-13 2013-14 2014-15 2015-16 2016-17
University of Minnesota-Twin Cities
$10,761 $11,227 $11,243 $11,595 $11,709
Graduate/Professional 2012-13 2013-14 2014-15 2015-16 2016-17
University of Minnesota-Duluth $11,609 $12,583 $13,554 $14,111 $14,489
University of Minnesota-Twin Cities
$23,807 $24,681 $24,691 $24,842 $24,822
Two points should be noted when viewing these data:
1) These costs represent the direct instructional costs on each campus. No attempt in this analysis was made to allocate the indirect or support costs of instruction.
2) Given the limitations of the IPEDS data, the University was unable to distinguish between lower division and upper division coursework at the undergraduate level.
Subdivision 7(3): Revenues University of Minnesota, Fiscal Years 2013 to 2017
FY 2013 FY 2014 FY 2015 FY 2016 FY 2017
O&M State Appropriation $483,881 $515,211 $529,511 $559,111 $560,011
Tuition (gross)* 863,479 879,973 901,625 920,295 947,448
State Specials 85,870 89,307 95,031 90,963 90,981
Sales, Fees, Misc. Income 318,041 325,558 349,058 371,519 359,113
Indirect Cost Recovery 149,933 145,279 142,624 144,441 144,076
Auxiliary Enterprises 313,550 331,686 354,334 355,296 354,838
Federal Appropriations 12,841 17,495 23,930 17,302 10,533
Gifts & Endowment Income 189,705 226,915 234,748 264,788 258,618
Restricted Grants/Contracts 306,812 331,415 341,085 243,966 268,554
Sponsored Grants 557,362 543,854 529,137 558,862 560,974
Scholarship Adjustment* (246,894) (257,481) (263,707) (275,112) (290,725)
Total $3,034,580 $3,149,212 $3,237,376 $3,251,431 $3,264,421
(Dollars in Thousands) – source: University Budget Office ledger query and Audited Financial Statements Fiscal Years 2013 through 2017
*For this display of revenues, tuition represents gross tuition charges. It has not been reduced to “net tuition” after scholarship expenditures (and the same is true for other sources which are paid by scholarships, such as auxiliary room and board charges). Instead, the “Scholarship Adjustment” line has been included so as to result in a total revenue amount that corresponds to the total expenditure lines in the tables under Subdivisions 7(1) and 7(2).
6

Subdivision 7(4): Allocation Method University of Minnesota, Fiscal Years 2018 and 2019 Combined
Allocation of the state appropriations from the current biennium (FY18 plus FY19):
Unit O&M Appropriation
General Fund State Special
Appropriation
Health Care Access Fund Allocation
Cigarette Tax
Allocation
Crookston 23,046,209 0 0 0
Duluth 86,495,402 8,905,892 0 0
Morris 44,204,477 0 0 0
Rochester 15,481,093 0 0 900,000
Twin Cities
Academic Hlth Ctr Shared 74,841,554 12,948,422 0 9,20,324
Ag Experiment Station 6,489,563 4,214,658 0 0
Biological Sciences 47,948,411 719,602 0 0
Carlson School of Mgmt 12,292,184 1,613,052 0 0
Continuing/Profssnl Studies 11,309,190 0 0 0
Dentistry 28,725,480 200,000 0 288,000
Design 15,255,683 902,888 0 0
Education & Human Dev 42,122,601 1,975,314 0 0
Food, Ag, Nat. Resource Sci. 67,738,301 43,986,108 0 0
Humphrey/Public Affairs 11,834,636 183,884 0 0
Law 23,463,359 0 0 0
Liberal Arts 92,947,060 0 0 0
Medicine 189,163,742 1,231,612 4,314,000 29,795,676
MN Extension 23,704,364 31,671,472 0 0
Nursing 10,713,578 0 0 888,000
Pharmacy 7,064,999 0 0 2,888,000
Public Health 14,172,708 681,486 0 0
Science & Engineering 115,569,054 2,280,000 0 0
Veterinary Medicine 35,359,253 6,001,250 0 720,000
Total Twin Cities Academic 830,715,720 108,609,748 4,314,000 43,600,000
President’s Office 770,847 0 0 0
Executive VP & Provost
Executive VP & Provost 23,591,156 1,970,994 0 0
7

Unit O&M Appropriation
General Fund State Special
Appropriation
Health Care Access Fund Allocation
Cigarette Tax
Allocation
Undergraduate Education 5,911,801 0 0 0
Equity & Diversity 2,218,008 0 0 0
Global Programs 777,055 0 0 0
Student Affairs 4,545,642 0 0 0
Total Executive VP & Provost 37,43,663 1,970,994 0 0
Sr. VP Finance & Operations
Auxiliary Services 427,144 0 0 0
VP Research 43,507,461 1,407,366 0 0
Special Allocations
Unallocated Initiatives 31,940,532 0 0 0
Graduate Assistant Support 7,126,131 0 0 0
Special Study-FY18 NR 50,000 0 0 0
U/Mayo Partnership 0 15,982,000 0 0
Debt Service Pool 19,746,181 0 0 0
New Building Operations 4,323,189 0 0 0
Repair/Renovation FY18 NR 10,000,000 0 0 0
Utility Reserve 1,979,481 0 0 0
Total Special Allocations 75,165,514 15,982,000 0 0
Total Allocations $1,170,466,000 $136,876,000 $4,314,000 $44,500,000
Allocation of state appropriations to the units within the University is done in accordance with state law for the restricted state specials, and as part of the internal budget development process for the remainder. The allocation of the Operations & Maintenance appropriation is not determined by formula, but instead is a set of discrete leadership decisions made every year as part of a comprehensive review under a base +/-, or “incremental budgeting” process. The budget model of the University incorporates the base +/- process for unrestricted state appropriations, and revenue and expense forecasting for all other funding sources. Decisions are made in the context of an all-funds resource review of each unit, incorporating an analysis of available revenues from tuition, sales, clinical income and so forth before determining final reallocation expectations and the distribution of unrestricted state appropriations. The model is transparent, responsive, supportive of the values of the institution, allows for long-term financial investments, and addresses the overhead needs of the University while providing reliable, stable and predictable incentives for sound financial planning and strong fiscal management.
8

Subdivision 7(5): Reallocations University of Minnesota
Internal reallocation of resources from lower priority to higher priority items is an important and consistent part of the University’s budgeting process. Each year, most units are required to reallocate in order to pay for a portion of known cost increases related to compensation, facilities, programmatic expansions , and so forth. Reallocation is considered one resource available to balance the annual budget, in addition to projected revenue increases from tuition, gifts, research grants, endowment earnings, sales income and so on. The most significant reallocations each year are achieved in the “O&M” budget: spending supported by the pool of unrestricted resources that includes the Operations and Maintenance state appropriation and tuition. During the budget process, each Twin Cities college, system campus and major support unit is required to provide descriptive plans on proposed actions and impacts in response to potential reallocation targets. Leadership then considers those plans, the projected revenue increases from all sources, and the projected costs and desirable investments in each unit before finalizing the required reallocation. Incremental revenue increases and final reallocation targets are considered in total as available to fund the increased costs and investments within each unit. As a result, individual revenue changes or reallocation decisions are not aligned with a specific cost or investment increase: the combined resource changes pay for the combined cost increases/initiatives.
As part of the FY18 annual approved operating budget, $20.4 million was reallocated to balance the “O&M” budget (operations & maintenance appropriation plus tuition) and to reduce administrative costs in other funds as follows:
Unit Type Direct Mission
Activities
Mission Support & Facilities and
Leadership & Oversight
Assigned: Not Yet
Reported
Total
Campuses/Colleges, Auxiliaries
$7,800,000 $8,200,000 $1,700,000 $17,700,000
Twin Cities/System Support Units
$300,000 $2,400,000 $0 $2,700,000
Totals $8,100,000 $10,600,000 $1,700,000 $20,400,000
Because the University’s total revenues grew in FY18, most major units, whether academic or support, did receive additional revenues or remained stable. Individual departments within those units experienced increases or decreases in resources depending on their unique circumstances. An itemized list of all reallocations actually implemented in FY18 will be finalized by the University Budget Office over the next several months. The categorical breakdown of reallocations already identified as either “Direct Mission” or “Mission Support & Facilities and Leadership & Oversight” is in line with an internal University cost-benchmarking analysis that resulted in defining all expenditures based on their primary purpose. Amounts in the “Net Yet Reported” column will be identified within those same categories as the information is processed. The three categories of spending are defined as follows:
9

• Direct Mission Delivery – the expenses of the ‘doers’ of the mission (faculty, scientists, health science professionals, etc., plus the corresponding equipment, supplies etc. coded as for instruction, research and public service)
• Mission Support & Facilities – the expenses to ‘support’ the delivery of mission activities (advisors, librarians, finance and technology personnel, skilled trades, etc. – all nonsupervisory – plus supplies, services and so forth coded as for academic support, institutional support, facility operations, etc.)
• Leadership & Oversight – the expenses for the ‘leadership, direction, control and management’ of the mission (President, vice presidents, deans, chancellors, directors, all supervisory/management positions throughout the University plus their associated proportion of supplies and equipment)
The cost benchmarking analysis was developed to build a common understanding of how expenditures would be analyzed for purposes of managing the reallocation process and providing direction to units on the annual expectations or target for changes in spending.
As part of the FY18 approved budget, many reallocations were implemented across a variety of functions. Examples include:
• Elimination of administrative positions – support and service staff within parking & transportation services and bookstores; information technology and desktop support within the College of Science and Engineering; communications and finance staff within the School of Public Health and the College of Liberal Arts; project managers within the Office of Information Technology; and so forth.
• Reduction of staff costs without eliminating positions – decreased salary augmentations in the School of Dentistry and College of Biological Sciences; reduced positions from full-time to part-time in the School of Nursing; salary savings through natural attrition (hiring replacement personnel at a lower cost) in the Office of the General Counsel, Internal Audit and the Morris Campus; and so forth.
• Reduction of general operating budgets throughout – decreased spending on supply purchases, project management costs, temporary/consulting services, travel, good, equipment, and so forth.
For the FY19 annual budget, $24.0 million in planned reallocations were approved to balance the “O&M” budget (operations and maintenance appropriation plus tuition) and to reduce administrative costs in other funds as follows:
Unit Type Direct Mission
Activities
Mission Support & Facilities and
Leadership & Oversight
Assigned: Not Yet
Reported
Total
Campuses/Colleges, Auxiliaries $6,000,000 $8,900,000 $4,100,000 $19,000,000
Twin Cities/System Support Units $2,300,000 $2,700,000 $0 $5,000,000
Totals $8,300,000 $11,600,000 $4,100,000 $24,000,000
10

During the FY19 fiscal year, actual implementation of the planned reallocations will be tracked and the final results will be summarized. Once again, total revenues for the University are projected to increase for FY19 compared to FY18, so available resources at the unit level will generally remain stable or increase slightly. Individual departments within those units will experience increases or decreases in resources depending on their unique circumstances.
Examples of planned reallocations as part of the FY19 approved budget (specified as of this date) include:
• Elimination of administrative positions – administration and support staff within the MedicalSchool through streamlining structures with University of MN-Physicians; director andmanagement positions within MN Extension and the College of Education and HumanDevelopment; support positions in the Carlson School of Management’s centers and programoffices; second truck mount custodial crew in Facilities Management; and so forth.
• Reduction of staff costs without eliminating positions – reduction in percentage timeappointments for personnel in the Humphrey School of Public Affairs, the Vice President forClinical Affairs and the Academic Health Center; salary savings through attrition and turnoverwithin the College of Biological Sciences, Internal Audit and the University of MN Rochester;salary savings from restructuring positions into different job classifications within AuxiliaryServices, Facilities Management and the Law School.
• Reduction of general operating budgets throughout – decreased spending on utilities and facilityoperations, supply purchases, professional services, travel, good, equipment, and so forth.
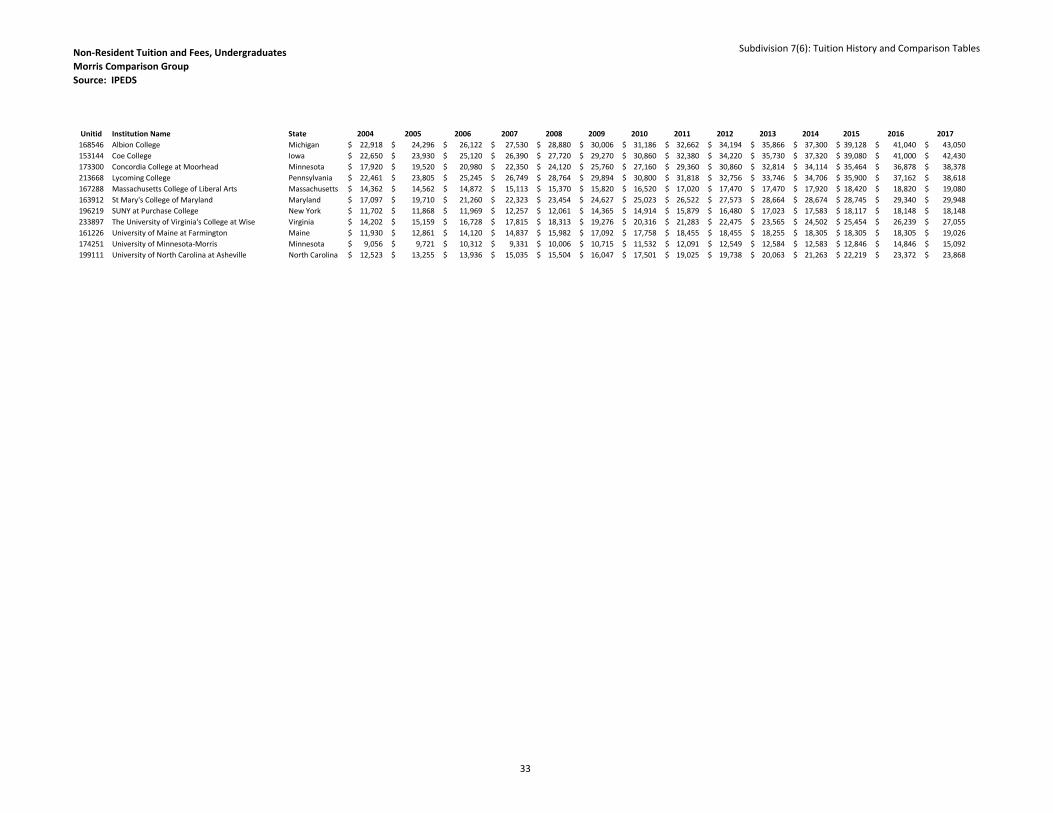
Subdivision 7(6): Tuition History and Comparisons University of Minnesota
The University of Minnesota establishes a peer group for each of its campuses, with the exception of the Rochester campus which is still in its formative stage and fulfills an important but unique mission. For each campus, 10 years of tuition and fee data is provided as reported to IPEDS for the University of Minnesota campuses and their peer groups, at the undergraduate and graduate levels, and for the first professional degree programs of Medicine, Law, Dentistry, Pharmacy, and Veterinary Medicine. Provided as well are separate resident and non-resident tuition and fee rate comparisons. Finally, national averages for undergraduate tuition and fees are provided for all public bachelor degree granting institutions in all 50 states.
Tables can be found in the Appendix labeled Subdivision 7(6) – Tuition History and Comparisons.
Subdivision 7(7): Graduation Rates University of Minnesota
Attached tables show four, five, and six year graduation rates by campus, by gender and by race/ethnicity, for the most recent eight reporting years in the Integrated Postsecondary Education Data System (IPEDS). These data are arrayed by entering year cohort, taking the first time – full time cohort of freshman students on each campus and then showing the number and percent of the cohort graduating four, five, and six years later. Following IPEDS reporting rules, only new freshman starting
11

and graduating from the campus are counted in these totals. Transfer students, even students that may start at one University of Minnesota campus and finish at another, are not counted in these graduation totals.
The University reports on retention and graduation annually through its Plan, Performance, and Accountability report, the latest of which can be found at: http://www.academic.umn.edu/accountability/.
Tables can be found in the Appendix labeled Subdivision 7(7) – Graduation Rates.
Subdivision 7(8): Under-Represented Students University of Minnesota
Beyond gender and diversity measures, the University has studied and concentrated on ensuring that traditionally under-represented lower-income and first generation students are enrolled and retained. Attached tables detail enrollment changes of the past five years for both Pell eligible students and first-generation students on each of our campuses. The tables can be found in the Appendix labeled Subdivision 7(8) – Under-represented students.
The University of Minnesota began a series of initiatives in 2016 collectively under the umbrella of “Retaining all Our Students”, focused on improving the first-year retention of low-income University students, defined as Pell grant recipients. The four-year program is expected to impact close to 5,000 students on the Twin Cities campus.
In addition, the University had several programs already operating in this area, including:
• The U Promise scholarship program, which provides undergraduates from low and middle-income families additional need-based financial aid (above and beyond Pell grants andMinnesota State Grants) for the entire four years of the student’s education. This programprovides nearly $30 million of aid to over 13,000 students system-wide.
• The President’s Emerging Scholars (PES) program, which now enrolls over 2000 students on theTwin Cities campus. A majority of the participants are low income, students of color and/or firstgeneration students. The program combines enhanced advising, peer mentoring, and targetedcareer advisement.
• A financial literacy program called “Live Like a Student Now (So You Don’t Have to Later)”,available to all students, focuses on helping students make financially prudent decisions while incollege to reduce future debt.
The University has as one of its Progress Card goals to increase four-year graduation rates of Pell eligible students system-wide. That rate currently stands at 50.9%, an increase of nearly ten percentage points over the past five years.
Subdivision 7(9): Support of Research / Technology Commercialization University of Minnesota
Sources for total R&D spending during FY17 as reported to the National Science Foundation for the Higher Education R&D (HERD) Survey:
12

U.S. Federal Government $462,780
State and Local Government 72,222
Business 36,414
Nonprofit Organizations 24,072
Institutional Funds (research plus overhead) 314,441
All Other (such as foreign governments, gifts, etc.) 33,420
Total Reported FY17 $948,349 (Dollars in Thousands)
Annually, the University of Minnesota, the state’s fifth largest employer and a top ten public research university, spends approximately $950 million on research and development (R&D) with an economic impact of $8.6 billion a year to the state of Minnesota, supporting more than 77,000 jobs across Minnesota and generating more than $470 million in state taxes. (Source: University’s most recently completed economic impact study, see https://government-relations.umn.edu/content/universitys-impact)
Over the past five years, the University’s Office for Technology Commercialization (OTC) has produced year over year growth in nearly every important measure of technology transfer success, including: new licenses, invention disclosures, new U.S. patents and number of start-ups (see 2017 OTC Annual Report https://drive.google.com/file/d/1fH90bIUJM5q3-uX7DKnN0YI2kot9XU7W/view).
Systemwide Strategic Plan (SWSP): Research and Discovery R&D, economic development and technology commercialization areas are a top priority and focus in the University’s systemwide strategic framework, approved in June 2017 by the University’s Board of Regents. SWSP Website: https://president.umn.edu/strategic-vision/system-wide
Below are specific examples of research and technology commercialization investment that are managed through the Office of the Vice President for Research.
1. Enhance Research Excellencea. Over the past five years, research advancement funding programs under the Office of the
Vice President for Research (OVPR) have provided more than $24.1 million ($33.3 millionwith college matching funds) to researchers.
b. Through the Provost’s Grand Challenges Research Initiative, the University is implementingnew strategies to engage interdisciplinary teams of faculty, students, and communitypartners in collaborative research addressing the most significant problems of Minnesota andthe world. See Grand Challenges Research Initiative Phase 3http://strategic-planning.umn.edu/gc-research-initiative-phase3
2. Accelerate the Transfer of Knowledge for the Public Gooda. The University experienced another record year in FY17 with 18 startup companies, the
eighth consecutive year that the number of startups has increased.
13

b. The University has launched 119 startups, with 78 percent still active, and has developed a strong startup pipeline of technologies with the potential to spin out into new companies.
c. A survey of University startup companies found that since the OTC-Venture Center was formed in 2006, these startups have raised approximately $400 million in outside investment capital.
d. These University startup companies are also moving to the next stage of startup growth: business transitions, where startup companies scale up, go public, or are acquired. Towards the end of FY17, several startup companies were positioning themselves for acquisition or initial public offering in early FY18.
e. Minnesota Innovation Partnerships (MN-IP) is a series of programs designed to make it easier for industry to work with the University, both in sponsoring research and in licensing technology. MN-IP has two programs:
i. Try and Buy, a low-risk, low-cost means for companies to test University technology, including pre-set, industry-friendly licensing terms, which was expanded in FY17 to include 151 available technologies.
ii. MN-IP Create, a program designed and updated in response to industry feedback, which streamlines the process for industry-sponsored research and licensing of resultant IP. The menu of licensing options from which companies can choose includes fixed-fee and exclusive or non-exclusive licensing. Since its inception, MN-IP Create has led to 333 agreements with 190 unique companies with a value of $53.9 million in research sponsorship.
3. Advance Trans-disciplinary Partnerships & Serendipity
a. The success of the state sponsored MnDRIVE (https://mndrive.umn.edu/) investments that through today have involved more than 1,070 researchers in more than 100 departments and dozens of colleges across three campuses (Twin Cities, Duluth, and Morris) have been involved in MnDRIVE research. With these funds and others leveraged, 767 people have been hired to date. These hires include 31 new faculty who, in turn, are responsible for 146 hires, including lab technicians, graduate students, undergraduate researchers, and post-doctoral fellows.
b. During calendar year 2017 alone, researchers involved in MnDRIVE work disclosed more than 70 inventions for patents or licensing and received more than $44 million in external funding – 10 percent of which came from business and industry, including Pepsico, Xcel Energy, Medtronic, and Zoetis, Inc. The newly-funded MnDRIVE Minnesota Cancer Clinical Trials Network has identified 18 sites that will begin offering intervention cancer clinical trials affecting 47 counties across the state.
c. The University’s Academic Research Computing includes services provided by the Minnesota Supercomputing Institute, the University of Minnesota Informatics Institute, and U-Spatial. These three units offer increasingly customized resources for computer- and data-intensive research to the University research community. The Minnesota Supercomputing Institute (MSI) is a nexus for leading-edge research in scientific computing, for fostering interdisciplinary research on campus, and for enabling public-private collaborations. With over 850 research groups and over 4,500 users, MSI enables high-impact research across the
14

life, health, and social sciences and the high-performance computing tasks common to the engineering and physical sciences.
Subdivision 7(10): Consulting Contracts University of Minnesota, Fiscal Years 2017 and 2018
In some circumstances each fiscal year, hiring consultants to perform work for the University is the most effective and most efficient way to achieve business goals. Generally this is done in the following circumstances, when the work involved:
• addresses a one-time or nonrecurring need • is to be completed over a defined time period • requires a skill set or expertise that is not needed at the University on an ongoing basis and is
therefore not currently held by existing University employees • is less expensive purchased from experts in the field outside the University compared to hiring,
training and maintaining a position or group of positions as University employees
In the last two completed fiscal years, two consulting contracts met the required reporting characteristics (exceeding $500,000 and for “management, investment and financial advisory services, project management, computer/technology advisory services and construction project management”). Both were initiated in FY17. No contracts meeting these criteria were initiated in FY18.
(note-contracts reported in the fiscal year the contract is first initiated):
FY17 - Consultant/Supplier Value of Contract
Description of Work
Definitive Logic Corporation $2,306,660 IT project management and consulting services related to the first Enterprise Asset Management System at the University; designed to optimize management of the physical assets on all campuses, including portfolio management, work requests, real estate, operations & maintenance, space management, capital projects and sustainability.
ECIFM Solutions, Inc. $3,001,034 Implementation staffing for the first Enterprise Asset Management System at the University; designed to optimize management of the physical assets on all campuses, including portfolio management, work requests, real estate, operations & maintenance, space management, capital projects and sustainability.
15

Subdivision 7(11): Aggregate Data University of Minnesota
11-i: Student Demographics
Official University census enrollments, by campus, displayed by ethnicity and gender consistent with subdivision 7(7) of this report. These data may be found in the Appendix tables labeled Subdivision 7(11)-i Student Demographics.
11-ii: Student Enrollment by Legislative District
Three tables in this section display University official student headcount, by home location (i.e., the student’s original address at the time of initial application to the University), and our best attempt to match home location zip code data to congressional districts, and state senate and house districts. Where zip code data overlap with two or more legislative districts, a proportionality algorithm was used to assign students to districts.
Note that there are “Unknown” categories at the bottom of each table. These represent students where zip code data was not present in the data files. “Minnesota unknowns” are students that we can identify as being from Minnesota, but cannot accurately place in a legislative district. A high majority of these students are likely College in Schools students, where we collect data through an alternate process to our standard admissions systems.
These data may be found in the Appendix tables labeled Subdivision 7(11)-ii Student Enrollment by Legislative District.
11-iii: Student Debt
As reported to the Office of Higher Education and displayed on its web site (http://www.ohe.state.mn.us/sPages/grad_debt.cfm):
Graduate Median Debt by Academic Award Received – weighted average of the cumulative median debt for graduates by award level. Graduates with no debt are not included in the calculation.
Sub-Baccalaureate
Certificate
Bachelor’s Degree
Master’s Degree
Doctoral Degree
First Professional
Degree
2013 $22,847 $24,977 $36,144 $45,719 $157,671
2014 $25,402 $24,728 $35,277 $44,788 $152,793
2015 $22,035 $24,567 $35,906 $44,760 $152,551
2016 $23,501 $24,135 $35,941 $54,562 $165,693
2017 $20,552 $23,745 $36,817 $61,111 $166,926
16

Percent of Graduates with Debt by Academic Award Received:
Sub-Baccalaureate
Certificate
Bachelor’s Degree
Master’s Degree
Doctoral Degree
First Professional
Degree
2013 40% 66% 54% 32% 91%
2014 29% 65% 49% 37% 88%
2015 7% 64% 49% 35% 84%
2016 8% 61% 48% 31% 81%
2017 5% 61% 46% 32% 85%
11-iv: Mandatory Student Fees
FY 2013 FY 2014 FY 2015 FY 2016 FY 2017
Crookston $1,425 $1,418 $1,438 $1,466 $1,520
Duluth $1,065 $1,095 $1,122 $1,184 $1,242
Morris $829 $863 $863 $950 $950
Rochester $636 $636 $636 $636 $636
Twin Cities $1,399 $1,495 $1,500 $1,552 $1,596
The fees in the table above represent totals for the full academic year and are charged to all students unless granted a specific waiver. The activities and items funded by these fees varies by campus but generally fall within three categories:
1. Student Services Fees: as allowed by Board of Regents Policy - https://regents.umn.edu/sites/regents.umn.edu/files/policies/Student_Services_Fee.pdf Each campus has its own autonomous review and recommendation process and each is governed by a student-majority committee appointed by the student association on that campus. Recommendations from the committees are submitted to the Provost and the President for potential inclusion in the President’s annual operating budget, ultimately approved by the Board of Regents. On all campuses these fees provide funds for student clubs and organizations, student unions/centers, health services and recreational sports. In addition, for Crookston, Duluth and Morris these fees encompass their campus “athletic fees” in support of intercollegiate athletics.
2. Campus/Collegiate/Durable Goods Fees: as allowed by Board of Regents Policy – “Subd. 3. Academic Fees. (a) Campus/Collegiate Fees. Campus/collegiate fees are campus- and college-wide fees that may be assessed to all students enrolled on a campus or in a college for goods and services that directly benefit students but that are not part of actual classroom instruction. Allowable goods and services include advising, career services, computer labs, special equipment, orientation activities, and other goods or activities intended to enhance the student experience outside of actual classroom instruction. Each campus shall assess no more than one
17

campus-wide fee and each college shall assess no more than one college-wide fee. (b) Durable Goods Fees. Durable goods fees may be charged by a campus or a college to their enrolled students (or any cohort or subset of their enrolled students) for educational materials and equipment that will be owned by, potentially owned by, or assigned to a specific student for their use during the entire term. Durable goods fees may not be charged for services, or for use of any equipment owned and retained by the University, with the exception of computer or other specialized equipment assigned for a full term to a specific student.”
Where these fees differ by college (on the Duluth and Twin Cities Campuses) the amounts in the table above represent an average of the undergraduate programs for six or more credits.
Other Required Fees: charged only on two campuses. They include a transportation fee on the Duluth Campus, and the MN Student Association fee, the capital enhancement fee, the stadium fee and a transportation fee on the Twin Cities Campus
11-v: Employee Headcount & Demographics
Official University of Minnesota employee headcounts are taken on the 9th payroll period annually (usually late October). The tables provided do not include undergraduate student employees, graduate student employees, or other fellows or professionals in training. These data may be found in the attached Excel workbook labeled Subdivision 7(11)-v Employee Headcounts and Demographics.
11-vi: Facilities Summary
1. Physical Space Overview
University of Minnesota facilities comprise thirty million gross square feet (GSF) across five campuses and nineteen Research and Outreach Centers and Field Stations. These 900 buildings are home to the classrooms, research labs, clinics, office and libraries needed to deliver the University’s mission. While impressive due to magnitude and reach, the facility portfolio requires significant ongoing renewal to keep buildings safe and reliable for students, faculty, staff and visitors. Fifty percent of buildings are now 50 years old or more; combined with current levels of funding, the backlog of deferred renewal and projected upkeep for the next 10 years is $2.2B and $4.5B respectively.
Managing this magnitude of need across a large and diverse portfolio starts with a thorough understanding of what is owned, what shape it is in, and what level and type of resources are needed to keep it functioning. To this end, the U employs a third party Facility Condition Assessment (FCA) advisor to evaluate the condition and quality of facilities and infrastructure, culminating in prioritized recommendations for renewal.
Multiple funding strategies are used to address facility renewal. HEAPR is the primary source, followed by other stand-alone state investments in major facility renovation projects. In addition, the University invests its own funds through major renewal projects, repair & replacement funds from the operating budget, utility infrastructure renewal projects from self-assessed utility charges, and self-generated auxiliary funds that are reinvested in auxiliary-supported buildings (note – auxiliary activities are those that generate income from sales of goods and services to the “public”,
18

such as housing, food service, bookstores, parking, athletics and so forth). Furthermore, the University has embarked on a renewal cost avoidance program by investing its own funds in the demolition of obsolete facilities.
Combined, these sources of funding fall short of identified need. During the past ten years (FY10 – FY19), enterprise renewal investments from all sources had an impact averaging $115 million per year. This level of reinvestment translates to just under $4 per square foot, while the FCA has identified a target of $8 per square foot to simply maintain existing condition. The University’s mission will be compromised without continued, sustained investment in buildings and infrastructure.
2. Square Footage by Campus and by DEED Economic Development Region:
Campus City County DEED Econ Dev Region
Bldg Count
GSF
Minneapolis Campus Minneapolis Hennepin 11-7 County TC 165 19,548,530
St. Paul Campus St. Paul Ramsey 11-7 County TC 100 4,231,756
Subtotal Twin Cities Campus - - - 265 23,780,286
Duluth Campus Duluth St. Louis 03-Arrowhead 81 3,244,481
Morris Campus Morris Stevens 04-West Central 36 993,166
Crookston Campus Crookston Polk 01-Northwest 41 723,407
Rochester Campus Rochester Olmsted 10-Southeast 1 36,668
N Central Rsrch Outreach Ctr Grand Rapids Itasca 03-Arrowhead 34 117,531
SW Central Rsrch Outreach Ctr Lamberton Redwood 08-Southwest 25 67,042
W Central Rsrch Outreach Ctr Morris Stevens 04-West Central 37 146,066
NW Rsrch Outreach Ctr Crookston Polk 01-Northwest 36 139,960
Southern Rsrch Outreach Ctr Waseca Waseca 09-S Central 42 259,458
UMORE-Rosemount Real Est Rosemount Dakota 11-7 County TC 30 112,668
UMORE-Rosemount ROC Rosemount Dakota 11-7 County TC 55 154,963
Horticultural Rsrch Ctr Excelsior Hennepin 11-7 County TC 17 43,305
MN Landscape Arboretum Chanhassen Carver 11-7 County TC 35 157,080
Lake Itasca Forestry/Bio Ctr Park Rapids Hubbard 02-Headwaters 61 74,643
Cloquet Forestry Ctr Cloquet Carlton 03-Arrowhead 26 62,869
Cedar Creek Ecosystem Rrve Bethel Anoka 11-7 County TC 35 55,664
MN Poultry Testing Lab Willmar Kandiyohi 06E-SW Central 1 11,894
Obrien Observatory St Croix Washington 11-7 County TC 1 1,245
W. Metro Equine Campus Long Lake Hennepin 11-7 County TC 1 0
Sands Plain Research Farm Becker Sherburne 07W-Central 8 15,154
Coleraine Minerals Rsrch Lab Coleraine Itasca 03-Arrowhead 18 93,303
19

Campus City County DEED Econ Dev Region
Bldg Count
GSF
Soudan Underground Lab Soudan St Louis 03-Arrowhead 1 48,397
Magnusson Research Farm Roseau Roseau 01-Northwest 1 2,400
Hubachek Wilderness Ctr Ely St Louis 03-Arrowhead 27 17,872
Subtotal Research Centers - - - 491 1,581,514
GRAND TOTAL - - - 915 30,359,522 (UM Space Data Export: 2018-09-13; DEED count to EDR data: https://apps.deed.state.mn.us/assets/lmi/areamap/edr)
3. a. Facility Condition by Campus – Sq. Footage by Condition Category
Campus Excellent Good Fair Below Average
Poor Critical Grand Total
Crookston 0.64% 0.72% 0.25% 0.74% 0.09% 0.12% 2.56%
Duluth 0.98% 2.15% 0.93% 3.16% 0.82% 0.55% 8.58%
Morris 0.85% 0.03% 0.24% 0.96% 1.01% 0.42% 3.50%
Twin Cities 11.97% 14.89% 13.30% 15.57% 9.15% 17.64% 82.52%
Rsrch Outreach Centers
0.34% 0.52% 0.70% 0.90% 0.16% 0.22% 2.83%
Grand Total 14.78% 18.30% 15.41% 21.34% 11.22% 18.95% 100.00%
b. Deferred Renewal by Campus and Condition Category
Campus Excellent Good Fair Below Average
Poor Critical Grand Total
Crookston $33 $3,081 $5,428 $14,162 $3,260 $3,137 $29,099
Duluth $378 $10,615 $9,617 $95,263 $33,659 $29,927 $179,459
Morris $0 $0 $1,512 $28,292 $42,588 $18,925 $91,318
Twin Cities $1,471 $64,982 $202,268 $535,390 $361,332 $930,910 $1,914,353
Rsrch Outreach Centers
$162 $1,869 $6,501 $16,068 $3,975 $5,004 $33,578
Grand Total
$2,043 $80,547 $225,325 $507,175 $444,813 $987,903 $2,247,806
(Dollars in Thousands)
20

c. Ten-Year Renewal by Campus and Condition Category
Campus Excellent Good Fair Below Average
Poor Critical Grand Total
Crookston $164 $13,397 $10,224 $44,446 $5,280 $11,814 $87,138
Duluth $9,247 $48,878 $31,195 $162,991 $67,537 $58,778 $378,626
Morris $3,540 $101 $6,127 $48,820 $70,863 $32,176 $161,628
Twin Cities $35,505 $308,106 $499,129 $718,209 $685,641 $1,528,348 $3,774,938
Rsrch Outreach Centers
$2,386 $9,091 $19,267 $36,545 $8,422 $11,428 $87,138
Grand Total $50,842 $379,573 $565,941 $1,011,010 $837,744 $1,642,545 $4,487,654
(Dollars in Thousands)
4. Capital Bonding Requested and Received (2018 session)
Project Name Project Total University/Non-State
Investment
Request Received
Higher Ed Asset Preservation & Replacement $200.0 $0.0 $200.0 $45.0
Greater MN Academic Renewal $15.8 $5.3 $10.5 $6.4*
Pillsbury Hall Capital Renewal $36.0 $12.0 $24.0 $24.0
Glensheen Capital Renewal $8.0 $4.0 $4.0 $4.0
Total $259.8 $21.3 $238.5 $79.4
(Dollars in Millions)
*$6.4 million for Dowell Hall and Owen Hall at Crookston, and Humanities Building and Blakely Hall at Morris.
11-vii: Administrative Costs
Six years ago the University of Minnesota developed a “cost benchmarking analysis” for the purpose of defining and categorizing the University’s costs to build a shared understanding of University spending and improve the University’s ability to set spending benchmarks and monitor changes in spending over time. In part, it was created to answer questions related to “administrative costs” at the University. Prior to this analysis, there was no shared definition of those costs, so there was no accepted and standard way to answer questions related to them. Through a consultative process involving stakeholders throughout the institution, the analysis was shaped in a way to define mission related spending separately from all other spending on support functions and basic infrastructure. Within the analysis, categories of spending are identified as the following:
• Direct Mission Delivery – the expenses of the ‘doers’ of the mission • Mission Support & Facilities – the expenses to ‘support’ the delivery of mission activities
21

• Leadership & Oversight – the expenses for the ‘leadership, direction, control and management’ of the mission
Expenses in all three categories occur throughout the organization (in academic and support units) and are supported by multiple funding sources. The benchmarking analysis focuses on current operating funds, including sponsored activity. The intent is to categorize expenditures that relate to the regular ongoing operations of the University supported by annual revenues. As a result, it excludes non-current and agency funds, internal service organization (ISO) funds, and cross-unit charges (with the exception of transfers for facility projects).
Within the analysis, different types of costs are distributed among the spending categories in different ways. Personnel costs are distributed based on job code: each individual job code has been reviewed and assigned to one of the three spending categories based on the definitions of those categories and a reasonable judgement of the function represented by the job code description. Non-personnel expenditures are distributed based on a combination of function designation (research, instruction, etc.) and/or account code definition (consulting, supplies, etc.). Examples of the types of expenditure included in each spending category are noted in the table below. Note that direct student aid is treated as a separate category related to but not included in the delivery of mission.
Expenditures by Expense Category
Direct Mission Delivery: “doers” of the mission Personnel: tenured and tenure-track professors, adjunct instructors, lecturers, clinical professors, extension educators, health science professionals, scientists and laboratory technicians, student in teaching assistant, research assistant or fellowship roles
Non-personnel: all non-personnel expenses with instruction, research or public service function codes in the general ledger (excludes facility related activity: utilities, rents, leases and repairs & maintenance)
Mission Support & Facilities: “support” the delivery of the mission Personnel (non-supervisory): audit/finance/HR/info tech/legal, clerical support, advisors, librarians, curators, child care workers, coaches, coordinators, analysts, building and grounds workers, skilled trades, engineers, safety technicians, environmental health and safety workers, police, temporary and casual workers Non-personnel: prorated share of supplies and services, etc. in non-mission functions; equipment purchases in non-mission functions, all co0nsulting in non-mission functions, facilities costs (utilities, rents, leases, repairs & maintenance, transfers for facility projects, debt)
Leadership & Oversight: “leadership, direction, control and management” of the mission Personnel: executive leadership – president, vice presidents, chancellors, provost, vice provosts; academic leadership – deans, associate deans, department chairs; directors – program, department, campus and system-wide; supervisor and managerial titles across the organization Non-Personnel: prorated share of supplies and services, non-capital equipment, etc. in non-mission functions
Note that the definition for Leadership & Oversight encompasses all supervisory and manager positions regardless of their function in the institution. For example, job codes that designate someone as a
22

manager of x are included in that category, rather than in the Mission Support & Facilities category, for example, where their “functional” home might be.
The Leadership & Oversight category of expenditures best corresponds to the request for total administrative costs at the University for purposes of responding to the statutory reporting requirements of M.S. 135A. In FY17, the most recent completed year of the cost benchmarking analysis, the totals associated with that category of spending were as follows:
Total Leadership & Oversight expenditures = $288.8 million Total Leadership & Oversight expenditures as a percent of total expenditures = 8.2% Total Leadership & Oversight headcount = 1,972 (fall 2016 point in time) Total Leadership & Oversight headcount as a percent of total headcount = 7.5%
11-viii: University Operating Budget
The Board of Regents of the University of Minnesota approves the annual operating budget for the institution in June of each year. Those documents can be accessed from the University Budget Office web site (http://finance.umn.edu/budget_anops.html).
For the current biennium, the approved revenue and expenditure estimates (including “internal sales”) were as follows:
FY 2018 FY 2019
Revenues
Operations & Maintenance Appropriation $590,248,000 $580,198,000
Gross Tuition 954,789,469 990,717,114
State Special Appropriations 92,485,000 92,845,000
Indirect Cost Recovery 138,719,310 148,813,553
Federal Appropriations 17,662,568 17,600,000
Grants & Contracts (nonsponsored) 258,781,598 287,338,548
Private Practice 92,079,681 105,769,927
Gifts & Endowment Income 259,769,208 253,365,512
Auxiliary Enterprise Revenue 349,135,120 376,188,709
Internal Sales 229,931,236 235,405,052
Sales, Fees, Misc. Unrestricted 370,548,089 363,744,003
Sponsored Grants (revenue = reimbursed expenses) 575,000,000 575,000,000
Total Revenue $3,929,149,279 $4,026,985,419
Expenditures
Instruction $838,133,026 $852,451,534
Research 302,915,862 315,319,168
23
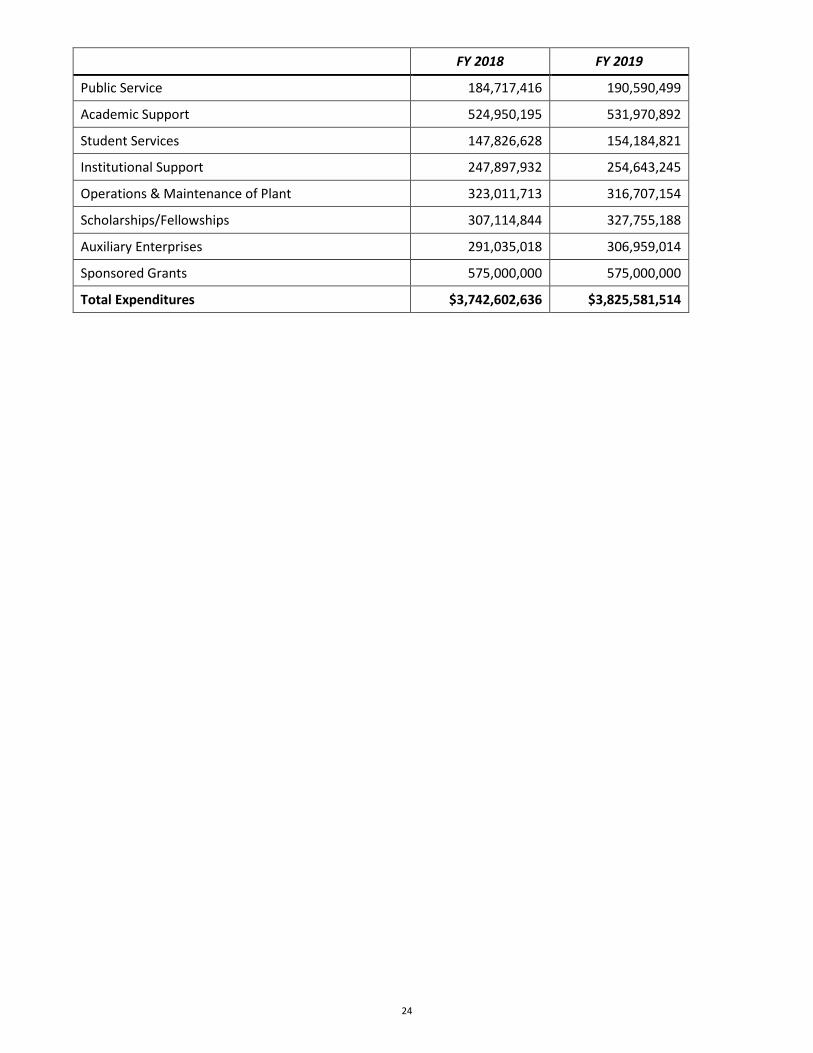
FY 2018 FY 2019
Public Service 184,717,416 190,590,499
Academic Support 524,950,195 531,970,892
Student Services 147,826,628 154,184,821
Institutional Support 247,897,932 254,643,245
Operations & Maintenance of Plant 323,011,713 316,707,154
Scholarships/Fellowships 307,114,844 327,755,188
Auxiliary Enterprises 291,035,018 306,959,014
Sponsored Grants 575,000,000 575,000,000
Total Expenditures $3,742,602,636 $3,825,581,514
24

Appendix Tables
25

In-State Tuition and Fees Averages, UndergraduatesTwin Cities Comparison GroupSource: IPEDS
Unitid Institution Name State 2004 2005 2006 2007 2008 2009 2010 2011 2012 2013 2014 2015 2016 2017204796 Ohio State University-Main Campus Ohio 7,542$ 8,082$ 8,667$ 8,676$ 8,679$ 8,679$ 9,420$ 9,735$ 10,037$ 10,037$ 10,037$ 10,037$ 10,037$ 10,592$ 214777 Pennsylvania State University-Main Campus Pennsylvania 10,856$ 11,508$ 12,164$ 12,844$ 13,706$ 14,416$ 15,250$ 15,984$ 16,444$ 16,992$ 17,502$ 17,514$ 17,900$ 18,436$ 228778 The University of Texas at Austin Texas 5,735$ 6,972$ 7,630$ 7,670$ 8,532$ 8,930$ 9,418$ 9,794$ 9,790$ 9,798$ 9,830$ 9,806$ 10,092$ 10,398$ 110635 University of California-Berkeley California 6,730$ 6,512$ 6,654$ 7,165$ 7,656$ 8,353$ 10,940$ 12,834$ 12,874$ 12,864$ 12,972$ 13,431$ 13,509$ 14,170$ 110662 University of California-Los Angeles California 6,586$ 6,504$ 6,522$ 7,165$ 7,551$ 8,266$ 10,781$ 12,686$ 12,692$ 12,697$ 12,705$ 12,763$ 12,920$ 13,261$ 134130 University of Florida Florida 2,955$ 3,094$ 3,206$ 3,256$ 3,778$ 4,373$ 5,044$ 5,657$ 6,143$ 6,263$ 6,313$ 6,381$ 6,381$ 6,381$ 145637 University of Illinois at Urbana-Champaign Illinois 7,944$ 8,634$ 9,882$ 11,130$ 12,106$ 12,528$ 13,713$ 14,581$ 15,489$ 16,210$ 16,759$ 17,086$ 17,184$ 17,293$ 170976 University of Michigan-Ann Arbor Michigan 8,201$ 9,213$ 9,723$ 10,447$ 11,037$ 11,659$ 11,837$ 12,634$ 13,819$ 13,977$ 14,336$ 14,729$ 15,310$ 15,761$ 174066 University of Minnesota-Twin Cities Minnesota 8,029$ 8,622$ 9,173$ 9,598$ 10,634$ 11,293$ 12,203$ 13,022$ 13,459$ 13,555$ 13,560$ 13,790$ 14,142$ 14,417$ 236948 University of Washington-Seattle Campus Washington 5,286$ 5,610$ 5,985$ 6,385$ 6,802$ 7,692$ 8,701$ 10,574$ 12,383$ 12,397$ 12,394$ 11,839$ 10,753$ 10,974$ 240444 University of Wisconsin-Madison Wisconsin 5,862$ 6,280$ 6,726$ 7,184$ 7,564$ 8,310$ 8,983$ 9,665$ 10,378$ 10,403$ 10,410$ 10,415$ 10,488$ 10,533$
26
Subdivision 7(6): Tuition History and Comparison Tables

In-State Tuition and Fees Averages, UndergraduatesDuluth Comparison GroupSource: IPEDS
Unitid Institution Name State 2004 2005 2006 2007 2008 2009 2010 2011 2012 2013 2014 2015 2016 2017110422 California Polytechnic State University-San Luis Obispo California 3,974$ 4,245$ 4,349$ 4,689$ 5,043$ 6,498$ 6,480$ 7,911$ 8,507$ 8,724$ 8,918$ 9,001$ 9,075$ 9,432$ 217819 College of Charleston South Carolina 6,202$ 6,668$ 7,234$ 7,778$ 8,400$ 8,988$ 10,314$ 9,616$ 9,918$ 10,626$ 10,981$ 11,322$ 11,805$ 12,422$ 173920 Minnesota State University-Mankato Minnesota 5,088$ 5,402$ 5,840$ 6,050$ 6,263$ 6,429$ 6,725$ 7,148$ 7,531$ 7,557$ 7,574$ 7,836$ 7,858$ 8,164$ 219356 South Dakota State University South Dakota 4,802$ 5,046$ 5,052$ 5,373$ 5,808$ 6,155$ 6,444$ 6,887$ 7,404$ 7,713$ 7,713$ 8,172$ 8,172$ 8,441$ 149231 Southern Illinois University Edwardsville Illinois 4,859$ 5,209$ 5,938$ 7,033$ 7,819$ 8,336$ 7,822$ 8,236$ 8,506$ 8,938$ 9,084$ 9,442$ 9,796$ 10,214$ 167987 University of Massachusetts-Dartmouth Massachusetts 7,802$ 8,036$ 8,309$ 8,592$ 8,858$ 10,358$ 10,358$ 11,135$ 11,681$ 11,681$ 11,681$ 12,588$ 13,188$ 13,571$ 171137 University of Michigan-Dearborn Michigan 5,711$ 6,392$ 6,907$ 7,452$ 7,937$ 8,469$ 8,799$ 9,406$ 10,250$ 10,614$ 10,952$ 11,304$ 12,032$ 12,637$ 174233 University of Minnesota-Duluth Minnesota 7,934$ 8,512$ 9,042$ 9,188$ 10,430$ 11,193$ 11,808$ 12,486$ 12,785$ 12,815$ 12,802$ 13,082$ 13,139$ 13,344$ 199139 University of North Carolina at Charlotte North Carolina 3,473$ 3,549$ 3,895$ 4,153$ 4,295$ 4,427$ 5,138$ 5,440$ 5,873$ 6,107$ 6,277$ 6,532$ 6,763$ 6,832$ 154095 University of Northern Iowa Iowa 5,387$ 5,602$ 6,112$ 6,190$ 6,376$ 6,636$ 7,008$ 7,350$ 7,635$ 7,685$ 7,749$ 7,817$ 8,309$ 8,699$ 172699 Western Michigan University Michigan 5,668$ 6,478$ 6,866$ 7,260$ 7,928$ 8,382$ 9,006$ 9,606$ 9,982$ 10,355$ 10,685$ 11,029$ 11,493$ 11,943$ 237011 Western Washington University Washington 4,452$ 4,737$ 5,002$ 5,291$ 5,535$ 6,159$ 6,858$ 7,756$ 8,805$ 8,863$ 8,965$ 8,611$ 7,653$ 7,933$
27
Subdivision 7(6): Tuition History and Comparison Tables

In-State Tuition and Fees Averages, UndergraduatesMorris Comparison GroupSource: IPEDS
Unitid Institution Name State 2004 2005 2006 2007 2008 2009 2010 2011 2012 2013 2014 2015 2016 2017168546 Albion College Michigan 22,918$ 24,296$ 26,122$ 27,530$ 28,880$ 30,006$ 31,186$ 32,662$ 34,194$ 35,866$ 37,300$ 39,128$ 41,040$ 43,050$ 153144 Coe College Iowa 22,650$ 23,930$ 25,120$ 26,390$ 27,720$ 29,270$ 30,860$ 32,380$ 34,220$ 35,730$ 37,320$ 39,080$ 41,000$ 42,430$ 173300 Concordia College at Moorhead Minnesota 17,920$ 19,520$ 20,980$ 22,350$ 24,120$ 25,760$ 27,160$ 29,360$ 30,860$ 32,814$ 34,114$ 35,464$ 36,878$ 38,378$ 213668 Lycoming College Pennsylvania 22,461$ 23,805$ 25,245$ 26,749$ 28,764$ 29,894$ 30,800$ 31,818$ 32,756$ 33,746$ 34,706$ 35,900$ 37,162$ 38,618$ 167288 Massachusetts College of Liberal Arts Massachusetts 5,417$ 5,617$ 5,927$ 6,168$ 6,425$ 6,875$ 7,575$ 8,075$ 8,525$ 8,525$ 8,975$ 9,475$ 9,875$ 10,135$ 163912 St Mary's College of Maryland Maryland 9,617$ 10,833$ 11,418$ 11,989$ 12,604$ 13,234$ 13,630$ 14,445$ 14,773$ 14,864$ 13,824$ 13,895$ 14,192$ 14,496$ 196219 SUNY at Purchase College New York 5,442$ 5,608$ 5,709$ 5,997$ 5,801$ 6,465$ 6,504$ 6,829$ 7,230$ 7,573$ 7,933$ 8,267$ 8,298$ 8,498$ 233897 The University of Virginia's College at Wise Virginia 4,782$ 5,081$ 5,692$ 6,151$ 6,439$ 6,748$ 7,194$ 7,721$ 8,107$ 8,509$ 8,868$ 9,220$ 9,539$ 9,825$ 161226 University of Maine at Farmington Maine 5,240$ 5,631$ 6,408$ 7,157$ 8,206$ 8,676$ 9,022$ 9,367$ 9,367$ 9,167$ 9,217$ 9,217$ 9,217$ 9,458$ 174251 University of Minnesota-Morris Minnesota 9,056$ 9,721$ 10,312$ 9,331$ 10,006$ 10,715$ 11,532$ 12,091$ 12,549$ 12,584$ 12,583$ 12,846$ 12,846$ 13,072$ 199111 University of North Carolina at Asheville North Carolina 3,323$ 3,455$ 3,811$ 4,045$ 4,174$ 4,330$ 4,729$ 5,393$ 5,916$ 6,241$ 6,392$ 6,605$ 6,977$ 7,145$
28
Subdivision 7(6): Tuition History and Comparison Tables

In-State Tuition and Fees Averages, UndergraduatesCrookston Comparison GroupSource: IPEDS
UMC Peers--Older Group
Unitid Institution Name State 2004 2005 2006 2007 2008 2009 2010 2011 2012 2013 2014 2015 2016 2017173124 Bemidji State University Minnesota 5,652$ 6,016$ 6,488$ 6,738$ 6,995$ 7,201$ 7,497$ 7,858$ 8,107$ 8,124$ 8,134$ 8,366$ 8,394$ 8,678$ 219082 Dakota State University South Dakota 4,614$ 4,831$ 5,060$ 5,381$ 5,816$ 6,165$ 6,455$ 6,897$ 7,212$ 7,506$ 7,506$ 7,974$ 8,927$ 9,147$ 211981 Delaware Valley College Pennsylvania 20,738$ 21,814$ 23,000$ 24,410$ 26,428$ 27,742$ 29,284$ 30,646$ 31,746$ 32,890$ 33,826$ 35,256$ 36,710$ 38,000$ 219259 Northern State University South Dakota 4,448$ 4,699$ 4,962$ 5,280$ 5,712$ 6,063$ 6,351$ 6,951$ 7,269$ 7,563$ 7,563$ 7,887$ 7,887$ 8,280$ 161226 University of Maine at Farmington Maine 5,240$ 5,631$ 6,408$ 7,157$ 8,206$ 8,676$ 9,022$ 9,367$ 9,367$ 9,167$ 9,217$ 9,217$ 9,217$ 9,458$ 174075 University of Minnesota-Crookston Minnesota 7,607$ 8,097$ 8,568$ 8,821$ 9,381$ 9,988$ 10,623$ 11,097$ 11,456$ 11,448$ 11,468$ 11,646$ 11,700$ 11,814$ 174251 University of Minnesota-Morris Minnesota 9,056$ 9,721$ 10,312$ 9,331$ 10,006$ 10,715$ 11,532$ 12,091$ 12,549$ 12,584$ 12,583$ 12,846$ 12,846$ 13,072$ 215284 University of Pittsburgh-Johnstown Pennsylvania 9,932$ 10,540$ 10,876$ 11,332$ 11,754$ 11,754$ 12,078$ 12,528$ 12,892$ 13,130$ 13,374$ 13,374$ 13,624$ 13,876$ 240471 University of Wisconsin-River Falls Wisconsin 4,674$ 5,080$ 5,446$ 5,885$ 6,220$ 6,533$ 6,894$ 7,277$ 7,700$ 7,721$ 7,751$ 7,937$ 7,981$ 8,013$ 240417 University of Wisconsin-Stout Wisconsin 6,263$ 6,592$ 6,963$ 7,272$ 7,584$ 7,821$ 8,099$ 8,542$ 8,944$ 8,968$ 9,025$ 9,203$ 9,395$ 9,456$
UMC Peers--Newer Group UnitID Institution Name State 2008 2009 2010 2011 2012 2013 2014 2015 2016 2017
151333 Indiana University-Kokomo Indiana 5,591$ 5,838$ 6,109$ 6,323$ 6,541$ 6,675$ 6,811$ 6,941$ 7,073$ 7,207$ 170639 Lake Superior State University Michigan 7,894$ 8,284$ 8,764$ 9,364$ 9,640$ 9,960$ 10,253$ 10,580$ 11,019$ 11,427$ 219259 Northern State University South Dakota 5,712$ 6,063$ 6,351$ 6,951$ 7,269$ 7,563$ 7,563$ 7,887$ 7,887$ 8,280$ 178624 Northwest Missouri State University Missouri 5,530$ 5,626$ 5,638$ 5,947$ 6,175$ 6,390$ 6,525$ 6,767$ 7,343$ 7,657$ 207306 Northwestern Oklahoma State University Oklahoma 4,247$ 4,247$ 4,479$ 4,968$ 5,347$ 5,642$ 5,821$ 6,112$ 6,691$ 7,066$ 175078 Southwest Minnesota State University Minnesota 6,696$ 6,932$ 7,244$ 7,743$ 8,074$ 8,074$ 8,074$ 8,336$ 8,347$ 8,610$ 196033 SUNY College of Agriculture and Technology at Cobl New York 5,611$ 6,306$ 6,321$ 7,768$ 8,262$ 7,149$ 7,609$ 7,719$ 7,929$ 8,139$ 221768 The University of Tennessee-Martin Tennessee 5,255$ 5,769$ 6,190$ 6,716$ 7,049$ 7,507$ 8,024$ 8,326$ 9,088$ 9,236$ 174075 University of Minnesota-Crookston Minnesota 9,381$ 9,988$ 10,623$ 11,097$ 11,456$ 11,448$ 11,468$ 11,646$ 11,700$ 11,814$ 215284 University of Pittsburgh-Johnstown Pennsylvania 11,754$ 11,754$ 12,078$ 12,528$ 12,892$ 13,130$ 13,374$ 13,374$ 13,624$ 13,876$ 240462 University of Wisconsin-Platteville Wisconsin 6,147$ 6,456$ 6,772$ 7,113$ 7,457$ 7,484$ 7,491$ 7,488$ 7,484$ 7,536$ 240471 University of Wisconsin-River Falls Wisconsin 6,220$ 6,533$ 6,894$ 7,277$ 7,700$ 7,721$ 7,751$ 7,937$ 7,981$ 8,013$
29
Subdivision 7(6): Tuition History and Comparison Tables

Average Tuition & Fees for In-State Resident UndergraduatesPublic Institutions, Baccalaureate and AboveSource: IPEDS
State, district, territory
Number of public baccalaureate and above institutions 2008 2009 2010 2011 2012 2013 2014 2015 2016 2017
Alabama 14 4,255$ 4,439$ 4,680$ 4,971$ 5,245$ 5,178$ 5,353$ 5,728$ 5,995$ 6,159$ Alaska 3 5,403$ 5,552$ 5,899$ 6,402$ 6,836$ 7,229$ 7,539$ 7,947$ 8,179$ 8,499$ American Samoa 1 1,320$ 1,320$ 2,900$ 2,940$ 3,400$ 3,550$ 3,550$ 3,550$ 3,550$ 3,950$ Arizona 9 4,569$ 4,675$ 5,260$ 5,466$ 5,718$ 5,987$ 6,232$ 6,432$ 6,659$ 6,927$ Arkansas 11 3,951$ 4,522$ 5,245$ 6,050$ 6,575$ 7,792$ 7,821$ 7,952$ 8,103$ 8,568$ California 32 5,021$ 6,165$ 6,894$ 8,395$ 8,482$ 8,513$ 8,608$ 8,683$ 8,756$ 9,111$ Colorado 15 5,205$ 5,636$ 6,001$ 6,571$ 7,189$ 7,753$ 8,111$ 8,455$ 8,944$ 9,329$ Connecticut 7 6,659$ 6,997$ 7,373$ 7,089$ 7,407$ 7,816$ 8,190$ 8,586$ 8,999$ 9,280$ Delaware 2 4,899$ 6,183$ 7,186$ 7,045$ 7,325$ 7,535$ 6,720$ 6,918$ 7,305$ 7,518$ District of Columbia 1 3,140$ 5,370$ 7,000$ 7,000$ 7,244$ 7,255$ 5,251$ 5,251$ 5,612$ 5,756$ Florida 39 2,672$ 3,050$ 3,357$ 3,688$ 3,958$ 4,017$ 4,070$ 4,048$ 4,040$ 4,037$ Georgia 28 3,418$ 4,052$ 4,501$ 4,988$ 5,221$ 5,320$ 5,513$ 5,629$ 5,635$ 5,805$ Guam 1 5,342$ 5,818$ 5,818$ 5,058$ 5,098$ 5,098$ 5,098$ 5,338$ 5,578$ 5,578$ Hawaii 4 4,038$ 4,566$ 5,104$ 5,661$ 5,935$ 6,362$ 6,852$ 7,164$ 7,538$ 7,500$ Idaho 4 5,829$ 6,169$ 6,631$ 7,066$ 7,338$ 7,458$ 7,603$ 7,705$ 8,160$ 8,450$ Illinois 12 4,930$ 5,298$ 5,773$ 6,216$ 6,498$ 6,762$ 7,250$ 7,313$ 7,558$ 7,743$ Indiana 14 8,264$ 8,783$ 8,918$ 9,394$ 9,808$ 10,287$ 10,968$ 11,278$ 11,500$ 11,801$ Iowa 3 5,621$ 6,177$ 6,466$ 6,748$ 7,036$ 7,236$ 7,378$ 7,518$ 7,727$ 7,900$ Kansas 8 4,559$ 4,878$ 5,025$ 5,245$ 5,506$ 5,828$ 6,091$ 6,358$ 6,816$ 7,038$ Kentucky 8 6,517$ 6,816$ 7,135$ 7,502$ 7,927$ 8,189$ 8,703$ 8,987$ 9,451$ 9,809$ Louisiana 16 3,912$ 4,113$ 4,492$ 4,996$ 5,569$ 6,277$ 6,878$ 7,852$ 8,210$ 8,455$ Maine 8 7,980$ 8,963$ 9,157$ 9,566$ 10,061$ 10,139$ 10,311$ 10,949$ 11,515$ 11,942$ Maryland 13 7,234$ 7,374$ 7,651$ 7,927$ 8,182$ 8,423$ 8,600$ 9,024$ 9,237$ 9,437$ Massachusetts 14 7,423$ 7,699$ 8,060$ 8,402$ 8,524$ 8,648$ 8,711$ 8,933$ 9,058$ 9,351$ Michigan 19 7,614$ 8,072$ 8,338$ 8,901$ 9,251$ 9,583$ 9,927$ 10,341$ 10,819$ 11,392$ Minnesota 12 7,800$ 8,455$ 8,953$ 9,458$ 9,807$ 9,826$ 9,834$ 10,138$ 10,194$ 10,449$ Mississippi 8 6,723$ 6,886$ 6,933$ 7,307$ 7,551$ 7,793$ 7,851$ 7,990$ 8,064$ 8,285$ Missouri 13 6,356$ 6,490$ 6,526$ 6,899$ 7,118$ 7,316$ 7,368$ 7,484$ 7,630$ 7,832$ Montana 6 4,839$ 4,936$ 5,146$ 5,519$ 5,965$ 6,363$ 6,562$ 6,814$ 7,104$ 7,582$ Nebraska 7 5,132$ 5,245$ 5,362$ 5,625$ 5,897$ 5,982$ 6,036$ 6,117$ 6,204$ 6,580$ Nevada 6 4,170$ 4,357$ 5,017$ 5,493$ 5,936$ 6,312$ 6,397$ 6,719$ 6,903$ 7,064$ New Hampshire 5 5,051$ 5,399$ 5,538$ 5,697$ 5,768$ 5,937$ 6,071$ 6,173$ 6,264$ 6,436$ New Jersey 13 5,225$ 5,607$ 5,851$ 6,045$ 6,233$ 6,334$ 6,491$ 6,652$ 6,839$ 7,211$ New Mexico 9 7,485$ 8,073$ 8,606$ 9,477$ 10,110$ 10,152$ 10,265$ 10,512$ 10,843$ 11,300$ New York 42 7,030$ 7,387$ 7,821$ 8,268$ 8,636$ 8,827$ 8,988$ 9,231$ 9,452$ 9,766$ North Carolina 16 6,056$ 6,319$ 6,686$ 7,022$ 7,293$ 7,642$ 7,904$ 8,229$ 8,549$ 8,811$ North Dakota 9 3,575$ 3,811$ 4,172$ 4,572$ 4,856$ 5,025$ 5,108$ 5,337$ 5,621$ 5,797$ Northern Marianas 1 2,820$ 2,820$ 2,820$ 2,820$ 2,820$ 2,820$ 2,820$ 2,820$ 4,038$ 4,038$ Ohio 29 6,334$ 6,503$ 6,850$ 7,097$ 7,440$ 7,544$ 7,671$ 7,752$ 7,768$ 7,819$ Oklahoma 16 4,351$ 4,351$ 4,605$ 4,893$ 5,188$ 5,401$ 5,751$ 6,007$ 6,492$ 6,781$ Oregon 8 7,375$ 7,883$ 8,323$ 8,853$ 9,123$ 9,510$ 9,686$ 10,085$ 10,355$ 10,993$ Pennsylvania 42 10,177$ 10,557$ 11,026$ 11,567$ 11,903$ 12,164$ 12,509$ 12,698$ 13,074$ 13,395$ Puerto Rico 14 2,218$ 2,251$ 2,717$ 3,408$ 3,022$ 2,503$ 2,480$ 2,481$ 2,537$ 2,576$ Rhode Island 2 7,225$ 7,968$ 8,731$ 9,317$ 10,024$ 10,026$ 10,054$ 10,530$ 10,545$ 11,284$ South Carolina 13 8,867$ 9,345$ 10,054$ 10,304$ 10,589$ 10,945$ 11,302$ 11,607$ 11,951$ 12,346$ South Dakota 7 5,446$ 5,817$ 6,070$ 6,655$ 7,023$ 7,324$ 7,293$ 7,764$ 7,899$ 8,047$ Tennessee 10 5,524$ 5,886$ 6,235$ 6,797$ 7,216$ 7,630$ 8,123$ 8,582$ 9,003$ 9,205$ Texas 43 5,307$ 5,649$ 5,981$ 6,400$ 6,721$ 6,775$ 7,058$ 7,220$ 7,601$ 7,830$ Utah 7 3,800$ 4,095$ 4,352$ 4,729$ 5,000$ 5,252$ 5,522$ 5,710$ 5,914$ 6,124$ Vermont 5 8,181$ 8,592$ 9,600$ 10,417$ 10,856$ 11,663$ 12,229$ 12,863$ 13,422$ 13,916$ Virgin Islands 1 3,965$ 4,100$ 4,310$ 4,594$ 4,594$ 4,794$ 4,794$ 5,014$ 5,234$ 5,235$ Virginia 15 7,854$ 8,284$ 8,906$ 9,539$ 9,909$ 10,458$ 10,887$ 11,409$ 11,826$ 12,256$ Washington 28 3,803$ 4,188$ 4,629$ 5,236$ 5,769$ 5,812$ 5,911$ 5,799$ 5,538$ 5,673$ West Virginia 12 6,572$ 6,974$ 7,360$ 7,764$ 8,181$ 8,224$ 8,263$ 8,316$ 8,431$ 8,325$ Wisconsin 15 4,707$ 5,009$ 5,098$ 5,417$ 5,716$ 6,041$ 6,295$ 6,581$ 6,836$ 7,069$ Wyoming 1 3,057$ 3,162$ 3,333$ 3,501$ 3,642$ 3,756$ 3,968$ 4,178$ 4,311$ 4,443$
Institutions included: All Title IV-participating US public institutions that are four-year and above; the three military academies that do not charge tuition are excluded from the state counts and averages.
30
Subdivision 7(6): Tuition History and Comparison Tables

Non-Resident Tuition and Fees, UndergraduatesTwin Cities Comparison GroupSource: IPEDS
Unitid Institution Name State 2004 2005 2006 2007 2008 2009 2010 2011 2012 2013 2014 2015 2016 2017204796 Ohio State University-Main Campus Ohio 18,129$ 19,305$ 20,562$ 21,285$ 21,918$ 22,251$ 23,604$ 24,630$ 25,445$ 25,757$ 26,537$ 27,365$ 28,229$ 29,696$ 214777 Pennsylvania State University-Main Campus Pennsylvania 20,784$ 21,744$ 22,712$ 23,712$ 24,940$ 25,946$ 27,114$ 28,066$ 28,746$ 29,566$ 30,452$ 31,346$ 32,382$ 33,664$ 228778 The University of Texas at Austin Texas 14,435$ 16,310$ 20,364$ 24,544$ 27,760$ 30,006$ 31,218$ 32,506$ 33,128$ 33,842$ 34,836$ 34,676$ 35,682$ 36,744$ 110635 University of California-Berkeley California 23,686$ 23,961$ 25,338$ 26,785$ 28,264$ 31,022$ 33,819$ 35,712$ 35,752$ 35,742$ 35,850$ 38,139$ 40,191$ 42,184$ 110662 University of California-Los Angeles California 23,542$ 24,324$ 25,206$ 26,658$ 28,159$ 30,935$ 33,660$ 35,564$ 35,570$ 35,575$ 35,583$ 37,471$ 39,602$ 41,275$ 134130 University of Florida Florida 15,827$ 17,222$ 17,791$ 17,841$ 20,623$ 23,744$ 27,321$ 27,934$ 28,420$ 28,541$ 28,591$ 28,659$ 28,659$ 28,659$ 145637 University of Illinois at Urbana-Champaign Illinois 20,864$ 22,720$ 23,968$ 25,216$ 25,890$ 26,670$ 28,840$ 29,953$ 31,116$ 31,943$ 32,621$ 33,222$ 34,011$ 34,719$ 170976 University of Michigan-Ann Arbor Michigan 26,027$ 27,601$ 29,131$ 29,131$ 33,069$ 34,937$ 36,001$ 37,782$ 40,496$ 41,811$ 43,377$ 45,002$ 47,004$ 49,142$ 174066 University of Minnesota-Twin Cities Minnesota 19,659$ 20,252$ 20,803$ 21,228$ 14,634$ 15,293$ 16,503$ 18,022$ 18,709$ 19,805$ 20,810$ 22,210$ 23,806$ 26,603$ 236948 University of Washington-Seattle Campus Washington 17,916$ 19,907$ 21,283$ 22,131$ 23,219$ 24,367$ 25,329$ 28,058$ 29,938$ 31,971$ 33,513$ 34,143$ 34,791$ 35,538$ 240444 University of Wisconsin-Madison Wisconsin 19,862$ 20,280$ 20,726$ 21,434$ 21,814$ 23,059$ 24,233$ 25,415$ 26,628$ 26,653$ 26,660$ 29,665$ 32,738$ 34,783$
31
Subdivision 7(6): Tuition History and Comparison Tables

Non-Resident Tuition and Fees, UndergraduatesDuluth Comparison GroupSource: IPEDS
Unitid Institution Name State 2004 2005 2006 2007 2008 2009 2010 2011 2012 2013 2014 2015 2016 2017110422 California Polytechnic State University-San Luis Obispo California 14,144$ 14,415$ 14,519$ 14,859$ 15,213$ 17,658$ 17,640$ 19,071$ 20,165$ 19,884$ 20,078$ 20,161$ 20,235$ 21,312$ 217819 College of Charleston South Carolina 14,140$ 15,342$ 16,800$ 18,732$ 20,418$ 21,846$ 23,172$ 24,330$ 25,304$ 27,090$ 27,971$ 28,866$ 29,963$ 30,810$ 173920 Minnesota State University-Mankato Minnesota 9,998$ 10,750$ 11,668$ 12,112$ 12,508$ 12,861$ 13,478$ 14,270$ 15,010$ 15,036$ 15,053$ 15,580$ 15,602$ 16,216$ 219356 South Dakota State University South Dakota 9,969$ 10,366$ 10,239$ 6,611$ 7,128$ 7,528$ 7,941$ 8,602$ 9,350$ 9,795$ 10,485$ 11,053$ 11,403$ 11,689$ 149231 Southern Illinois University Edwardsville Illinois 10,889$ 11,734$ 13,075$ 14,874$ 16,594$ 17,638$ 14,886$ 10,478$ 15,488$ 15,322$ 11,244$ 11,306$ 11,194$ 11,134$ 167987 University of Massachusetts-Dartmouth Massachusetts 17,302$ 17,536$ 17,809$ 18,174$ 18,561$ 20,061$ 20,420$ 21,952$ 23,028$ 24,156$ 24,619$ 26,173$ 27,473$ 28,285$ 171137 University of Michigan-Dearborn Michigan 12,687$ 14,202$ 15,345$ 16,558$ 17,634$ 18,815$ 19,549$ 20,899$ 22,664$ 23,124$ 23,150$ 23,520$ 24,272$ 24,871$ 174233 University of Minnesota-Duluth Minnesota 19,039$ 19,619$ 20,150$ 18,814$ 12,430$ 13,193$ 13,808$ 14,996$ 15,450$ 16,480$ 16,467$ 17,032$ 17,485$ 18,462$ 199139 University of North Carolina at Charlotte North Carolina 13,585$ 13,961$ 14,307$ 14,565$ 14,707$ 15,039$ 16,185$ 17,205$ 18,402$ 18,636$ 19,448$ 19,703$ 19,934$ 20,266$ 154095 University of Northern Iowa Iowa 12,705$ 13,214$ 14,028$ 14,282$ 14,596$ 14,900$ 15,348$ 16,106$ 16,721$ 17,181$ 17,647$ 18,005$ 18,851$ 19,241$ 172699 Western Michigan University Michigan 13,823$ 15,856$ 16,806$ 16,806$ 18,420$ 19,502$ 20,894$ 22,338$ 23,262$ 24,109$ 24,917$ 25,713$ 26,851$ 14,699$ 237011 Western Washington University Washington 13,839 14,688$ 15,550$ 16,365$ 17,166$ 17,190$ 17,205$ 18,103$ 19,152$ 19,752$ 20,407$ 20,963$ 21,567$ 22,445$
32
Subdivision 7(6): Tuition History and Comparison Tables
Non-Resident Tuition and Fees, UndergraduatesMorris Comparison GroupSource: IPEDS
Unitid Institution Name State 2004 2005 2006 2007 2008 2009 2010 2011 2012 2013 2014 2015 2016 2017168546 Albion College Michigan 22,918$ 24,296$ 26,122$ 27,530$ 28,880$ 30,006$ 31,186$ 32,662$ 34,194$ 35,866$ 37,300$ 39,128$ 41,040$ 43,050$ 153144 Coe College Iowa 22,650$ 23,930$ 25,120$ 26,390$ 27,720$ 29,270$ 30,860$ 32,380$ 34,220$ 35,730$ 37,320$ 39,080$ 41,000$ 42,430$ 173300 Concordia College at Moorhead Minnesota 17,920$ 19,520$ 20,980$ 22,350$ 24,120$ 25,760$ 27,160$ 29,360$ 30,860$ 32,814$ 34,114$ 35,464$ 36,878$ 38,378$ 213668 Lycoming College Pennsylvania 22,461$ 23,805$ 25,245$ 26,749$ 28,764$ 29,894$ 30,800$ 31,818$ 32,756$ 33,746$ 34,706$ 35,900$ 37,162$ 38,618$ 167288 Massachusetts College of Liberal Arts Massachusetts 14,362$ 14,562$ 14,872$ 15,113$ 15,370$ 15,820$ 16,520$ 17,020$ 17,470$ 17,470$ 17,920$ 18,420$ 18,820$ 19,080$ 163912 St Mary's College of Maryland Maryland 17,097$ 19,710$ 21,260$ 22,323$ 23,454$ 24,627$ 25,023$ 26,522$ 27,573$ 28,664$ 28,674$ 28,745$ 29,340$ 29,948$ 196219 SUNY at Purchase College New York 11,702$ 11,868$ 11,969$ 12,257$ 12,061$ 14,365$ 14,914$ 15,879$ 16,480$ 17,023$ 17,583$ 18,117$ 18,148$ 18,148$ 233897 The University of Virginia's College at Wise Virginia 14,202$ 15,159$ 16,728$ 17,815$ 18,313$ 19,276$ 20,316$ 21,283$ 22,475$ 23,565$ 24,502$ 25,454$ 26,239$ 27,055$ 161226 University of Maine at Farmington Maine 11,930$ 12,861$ 14,120$ 14,837$ 15,982$ 17,092$ 17,758$ 18,455$ 18,455$ 18,255$ 18,305$ 18,305$ 18,305$ 19,026$ 174251 University of Minnesota-Morris Minnesota 9,056$ 9,721$ 10,312$ 9,331$ 10,006$ 10,715$ 11,532$ 12,091$ 12,549$ 12,584$ 12,583$ 12,846$ 14,846$ 15,092$ 199111 University of North Carolina at Asheville North Carolina 12,523$ 13,255$ 13,936$ 15,035$ 15,504$ 16,047$ 17,501$ 19,025$ 19,738$ 20,063$ 21,263$ 22,219$ 23,372$ 23,868$
33
Subdivision 7(6): Tuition History and Comparison Tables

Non-Resident Tuition and Fees, UndergraduatesCrookston Comparison GroupSource: IPEDS
UMC Peers--Older Group
Unitid Institution Name State 2004 2005 2006 2007 2008 2009 2010 2011 2012 2013 2014 2015 2016 2017173124 Bemidji State University Minnesota 11,146$ 6,016$ 6,488$ 6,738$ 6,995$ 7,201$ 7,497$ 7,858$ 8,107$ 8,124$ 8,134$ 8,366$ 8,394$ 8,678$ 219082 Dakota State University South Dakota 9,457$ 9,819$ 6,251$ 6,767$ 7,136$ 7,538$ 7,952$ 8,612$ 9,077$ 9,506$ 9,986$ 10,556$ 11,843$ 12,077$ 211981 Delaware Valley College Pennsylvania 20,738$ 21,814$ 23,000$ 24,410$ 26,428$ 27,742$ 29,284$ 30,646$ 31,746$ 32,890$ 33,826$ 35,256$ 36,710$ 38,000$ 219259 Northern State University South Dakota 9,291$ 9,687$ 10,149$ 10,674$ 11,470$ 12,049$ 12,867$ 8,666$ 9,133$ 9,562$ 10,042$ 10,469$ 10,803$ 11,210$ 161226 University of Maine at Farmington Maine 11,930$ 12,861$ 14,120$ 14,837$ 15,982$ 17,092$ 17,758$ 18,455$ 18,455$ 18,255$ 18,305$ 18,305$ 18,305$ 19,026$ 174075 University of Minnesota-Crookston Minnesota 7,607$ 8,097$ 8,568$ 8,821$ 9,381$ 9,988$ 10,623$ 11,097$ 11,456$ 11,448$ 11,468$ 11,646$ 11,700$ 11,814$ 174251 University of Minnesota-Morris Minnesota 9,056$ 9,721$ 10,312$ 9,331$ 10,006$ 10,715$ 11,532$ 12,091$ 12,549$ 12,584$ 12,583$ 12,846$ 14,846$ 15,092$ 215284 University of Pittsburgh-Johnstown Pennsylvania 19,802$ 20,428$ 20,468$ 20,912$ 21,314$ 21,314$ 21,878$ 22,720$ 23,288$ 23,734$ 24,190$ 24,190$ 24,646$ 25,120$ 240471 University of Wisconsin-River Falls Wisconsin 14,720$ 15,126$ 12,920$ 13,458$ 13,793$ 14,106$ 14,467$ 14,850$ 15,273$ 15,294$ 15,324$ 15,510$ 15,554$ 15,586$ 240417 University of Wisconsin-Stout Wisconsin 16,588$ 16,925$ 14,613$ 15,018$ 15,330$ 15,566$ 15,845$ 16,287$ 16,690$ 16,714$ 16,771$ 16,949$ 17,141$ 17,423$
UMC Peers--Newer GroupUnitID Institution Name State 2008 2009 2010 2011 2012 2013 2014 2015 2016 2017
151333 Indiana University-Kokomo Indiana 13,754$ 14,527$ 15,374$ 16,430$ 17,486$ 17,778$ 18,081$ 18,379$ 18,683$ 19,038$ 170639 Lake Superior State University Michigan 15,718$ 16,468$ 17,428$ 13,996$ 14,410$ 14,880$ 15,317$ 15,788$ 11,019$ 11,427$ 219259 Northern State University South Dakota 11,470$ 12,049$ 12,867$ 8,666$ 9,133$ 9,562$ 10,042$ 10,469$ 10,803$ 11,210$ 178624 Northwest Missouri State University Missouri 9,307$ 9,403$ 9,919$ 10,638$ 11,062$ 11,391$ 11,526$ 11,823$ 12,399$ 12,908$ 207306 Northwestern Oklahoma State University Oklahoma 10,478$ 10,478$ 10,478$ 10,703$ 11,478$ 11,764$ 12,271$ 12,562$ 13,538$ 14,183$ 175078 Southwest Minnesota State University Minnesota 6,696$ 6,932$ 7,244$ 7,743$ 8,074$ 8,074$ 8,074$ 8,336$ 8,347$ 8,610$ 196033 SUNY College of Agriculture and Technology at Cobl New York 11,871$ 14,206$ 14,731$ 16,818$ 17,512$ 16,599$ 16,759$ 17,569$ 17,779$ 17,789$ 221768 The University of Tennessee-Martin Tennessee 15,897$ 17,155$ 18,600$ 19,126$ 20,205$ 21,451$ 21,968$ 22,270$ 14,848$ 14,996$ 174075 University of Minnesota-Crookston Minnesota 9,381$ 9,988$ 10,623$ 11,097$ 11,456$ 11,448$ 11,468$ 11,646$ 11,700$ 11,814$ 215284 University of Pittsburgh-Johnstown Pennsylvania 21,314$ 21,314$ 21,878$ 22,720$ 23,288$ 23,734$ 24,190$ 24,190$ 24,646$ 25,120$ 240462 University of Wisconsin-Platteville Wisconsin 13,720$ 14,029$ 14,345$ 14,685$ 15,030$ 15,057$ 15,064$ 15,338$ 15,334$ 15,386$ 240471 University of Wisconsin-River Falls Wisconsin 13,793$ 14,106$ 14,467$ 14,850$ 15,273$ 15,294$ 15,324$ 15,510$ 15,554$ 15,586$
34
Subdivision 7(6): Tuition History and Comparison Tables

In-State Tuition and Fees, Graduate StudentsTwin Cities Comparison GroupSource: IPEDS
Unitid Institution Name State 2004 2005 2006 2007 2008 2009 2010 2011 2012 2013 2014 2015 2016 2017204796 Ohio State University-Main Campus Ohio 8,250$ 8,832$ 9,438$ 9,972$ 10,440$ 10,683$ 11,298$ 11,823$ 12,201$ 12,425$ 12,425$ 12,425$ 12,425$ 12,425$ 214777 Pennsylvania State University-Main Campus Pennsylvania 11,796$ 13,002$ 13,742$ 14,508$ 15,468$ 16,258$ 17,202$ 18,032$ 18,552$ 19,172$ 19,746$ 20,270$ 20,912$ 21,752$ 228778 The University of Texas at Austin Texas 6,085$ 6,381$ 7,013$ 7,047$ 8,766$ 9,572$ 10,154$ 10,610$ 10,918$ 10,842$ 10,878$ 10,934$ 11,300$ 11,490$ 110635 University of California-Berkeley California 7,457$ 7,268$ 7,410$ 9,579$ 10,214$ 11,233$ 10,880$ 12,834$ 12,874$ 12,864$ 12,971$ 13,431$ 13,509$ 14,170$ 110662 University of California-Los Angeles California 7,479$ 7,180$ 7,210$ 8,968$ 9,670$ 10,658$ 10,600$ 12,562$ 12,566$ 12,571$ 12,571$ 12,629$ 12,683$ 13,003$ 134130 University of Florida Florida 5,484$ 6,234$ 6,826$ 7,478$ 8,191$ 9,476$ 10,915$ 11,954$ 12,590$ 12,642$ 12,682$ 12,737$ 12,737$ 12,737$ 145637 University of Illinois at Urbana-Champaign Illinois 8,310$ 8,878$ 10,152$ 11,216$ 11,988$ 12,534$ 14,909$ 15,727$ 16,612$ 17,216$ 17,745$ 18,041$ 18,289$ 18,224$ 170976 University of Michigan-Ann Arbor Michigan 13,585$ 14,271$ 14,991$ 15,747$ 16,541$ 17,475$ 17,973$ 18,860$ 19,434$ 19,792$ 20,406$ 20,966$ 21,794$ 22,696$ 174066 University of Minnesota-Twin Cities Minnesota 9,525$ 10,230$ 10,887$ 11,388$ 12,603$ 13,495$ 14,344$ 15,240$ 15,854$ 16,416$ 16,853$ 17,289$ 17,735$ 18,232$ 236948 University of Washington-Seattle Campus Washington 7,616$ 8,257$ 8,818$ 9,417$ 10,047$ 10,727$ 11,449$ 12,898$ 14,358$ 15,303$ 16,296$ 16,278$ 16,266$ 16,272$ 240444 University of Wisconsin-Madison Wisconsin 8,316$ 8,734$ 9,180$ 9,638$ 10,018$ 10,514$ 10,937$ 11,369$ 11,833$ 11,858$ 11,865$ 11,870$ 11,943$ 11,988$
35
Subdivision 7(6): Tuition History and Comparison Tables

In-State Tuition and Fees, Graduate StudentsDuluth Comparison GroupSource: IPEDS
Unitid Institution Name State 2004 2005 2006 2007 2008 2009 2010 2011 2012 2013 2014 2015 2016 2017110422 California Polytechnic State University-San Luis Obispo California 4,460$ 4,827$ 4,931$ 5,331$ 5,751$ 7,434$ 7,456$ 9,177$ 9,773$ 9,990$ 10,184$ 10,267$ 10,341$ 10,866$ 217819 College of Charleston South Carolina 6,202$ 6,668$ 7,234$ 7,778$ 8,400$ 9,886$ 11,346$ 10,580$ 10,910$ 11,694$ 12,074$ 12,450$ 12,984$ 13,658$ 173920 Minnesota State University-Mankato Minnesota 5,129$ 5,458$ 5,909$ 6,125$ 6,336$ 6,623$ 6,891$ 7,106$ 6,855$ 7,060$ 7,265$ 7,547$ 7,563$ 7,856$ 219356 South Dakota State University South Dakota 4,522$ 4,731$ 5,027$ 5,322$ 5,739$ 6,059$ 6,391$ 6,924$ 7,529$ 7,889$ 7,889$ 8,329$ 8,330$ 8,553$ 149231 Southern Illinois University Edwardsville Illinois 4,469$ 5,203$ 6,280$ 7,043$ 7,363$ 7,662$ 7,723$ 8,054$ 7,308$ 7,490$ 7,524$ 8,240$ 7,954$ 8,308$ 167987 University of Massachusetts-Dartmouth Massachusetts 8,939$ 9,173$ 9,446$ 9,729$ 10,017$ 11,517$ 11,517$ 12,381$ 12,988$ 13,624$ 13,952$ 14,699$ 15,399$ 15,854$ 171137 University of Michigan-Dearborn Michigan 6,510$ 7,287$ 7,874$ 8,677$ 9,115$ 8,967$ 9,229$ 9,867$ 10,228$ 10,584$ 10,920$ 11,280$ 12,022$ 12,466$ 174233 University of Minnesota-Duluth Minnesota 9,397$ 10,103$ 10,739$ 11,228$ 12,606$ 13,535$ 14,370$ 15,176$ 15,635$ 16,103$ 16,540$ 17,030$ 17,483$ 18,056$ 199139 University of North Carolina at Charlotte North Carolina 3,548$ 3,924$ 4,270$ 4,547$ 4,698$ 4,830$ 5,558$ 5,887$ 6,349$ 6,593$ 6,763$ 7,032$ 7,278$ 7,357$ 154095 University of Northern Iowa Iowa 6,173$ 6,420$ 6,962$ 7,084$ 7,298$ 7,596$ 8,026$ 8,418$ 8,743$ 8,793$ 9,013$ 9,219$ 9,803$ 10,193$ 172699 Western Michigan University Michigan 6,981$ 6,154$ 8,466$ 8,964$ 9,801$ 10,367$ 11,128$ 11,879$ 12,354$ 12,812$ 13,226$ 13,650$ 14,235$ 15,233$ 237011 Western Washington University Washington 5,880 6,252$ 6,607$ 6,975$ 7,305$ 7,329$ 7,344$ 8,228$ 9,276$ 9,582$ 9,931$ 10,182$ 10,503$ 10,964$
36
Subdivision 7(6): Tuition History and Comparison Tables

Non-Resident Tuition and Fees, Graduate StudentsTwin Cities Comparison GroupSource: IPEDS
Unitid Institution Name State 2004 2005 2006 2007 2008 2009 2010 2011 2012 2013 2014 2015 2016 2017204796 Ohio State University-Main Campus Ohio 20,133$ 21,429$ 22,791$ 24,126$ 25,302$ 25,923$ 27,228$ 28,548$ 29,513$ 30,089$ 30,969$ 31,897$ 32,873$ 33,897$ 214777 Pennsylvania State University-Main Campus Pennsylvania 21,946$ 23,488$ 24,582$ 25,710$ 27,084$ 28,210$ 29,480$ 30,516$ 31,256$ 32,148$ 33,110$ 34,084$ 35,214$ 36,606$ 228778 The University of Texas at Austin Texas 13,237$ 14,271$ 15,137$ 15,373$ 17,344$ 18,302$ 19,316$ 20,108$ 20,790$ 20,710$ 20,698$ 20,762$ 21,518$ 22,178$ 110635 University of California-Berkeley California 22,396$ 22,229$ 22,371$ 24,567$ 25,220$ 26,269$ 25,982$ 27,936$ 27,976$ 27,966$ 28,073$ 28,533$ 28,611$ 29,272$ 110662 University of California-Los Angeles California 22,418$ 22,141$ 22,171$ 23,956$ 24,676$ 25,694$ 25,702$ 27,664$ 27,668$ 27,673$ 27,673$ 27,731$ 27,785$ 28,105$ 134130 University of Florida Florida 21,358$ 21,358$ 21,951$ 22,603$ 23,316$ 26,869$ 28,310$ 29,348$ 29,983$ 30,036$ 30,076$ 30,130$ 30,130$ 30,130$ 145637 University of Illinois at Urbana-Champaign Illinois 20,310$ 21,718$ 22,992$ 24,056$ 24,742$ 25,800$ 27,313$ 27,955$ 29,160$ 29,787$ 30,419$ 31,231$ 31,529$ 31,811$ 170976 University of Michigan-Ann Arbor Michigan 27,311$ 28,689$ 30,137$ 31,657$ 33,255$ 35,133$ 36,133$ 37,920$ 39,076$ 39,798$ 40,892$ 42,016$ 43,674$ 45,484$ 174066 University of Minnesota-Twin Cities Minnesota 16,624$ 17,330$ 17,985$ 18,486$ 19,701$ 20,593$ 21,442$ 22,694$ 23,604$ 24,398$ 25,075$ 25,953$ 26,615$ 27,388$ 236948 University of Washington-Seattle Campus Washington 17,816$ 19,307$ 20,641$ 21,464$ 22,519$ 24,067$ 24,789$ 25,768$ 26,768$ 27,552$ 28,344$ 28,326$ 28,314$ 28,320$ 240444 University of Wisconsin-Madison Wisconsin 23,586$ 24,004$ 24,450$ 24,908$ 24,940$ 25,068$ 25,104$ 25,127$ 25,159$ 25,184$ 25,191$ 25,196$ 25,269$ 25,314$
37
Subdivision 7(6): Tuition History and Comparison Tables

Non-Resident Tuition and Fees, Graduate StudentsDuluth Comparison GroupSource: IPEDS
Unitid Institution Name State 2004 2005 2006 2007 2008 2009 2010 2011 2012 2013 2014 2015 2016 2017110422 California Polytechnic State University-San Luis Obispo California 14,630$ 14,997$ 15,101$ 15,501$ 15,921$ 18,594$ 16,384$ 18,105$ 19,319$ 21,150$ 21,344$ 19,195$ 19,269$ 20,370$ 217819 College of Charleston South Carolina 14,140$ 15,342$ 16,800$ 18,732$ 20,418$ 24,030$ 25,490$ 26,764$ 27,834$ 29,804$ 30,764$ 31,748$ 32,958$ 33,884$ 173920 Minnesota State University-Mankato Minnesota 7,722$ 8,598$ 9,331$ 9,684$ 10,002$ 10,471$ 10,529$ 7,106$ 6,855$ 7,060$ 7,265$ 7,547$ 7,563$ 7,856$ 219356 South Dakota State University South Dakota 9,779$ 10,147$ 10,658$ 11,179$ 11,992$ 9,785$ 10,446$ 11,567$ 12,803$ 13,526$ 14,078$ 14,774$ 15,263$ 15,521$ 149231 Southern Illinois University Edwardsville Illinois 10,229$ 12,043$ 14,380$ 15,548$ 16,121$ 16,680$ 16,741$ 17,522$ 14,850$ 15,178$ 13,344$ 14,582$ 12,938$ 13,100$ 167987 University of Massachusetts-Dartmouth Massachusetts 17,302$ 17,536$ 17,809$ 18,174$ 18,561$ 20,061$ 20,420$ 21,952$ 23,028$ 24,156$ 24,619$ 26,173$ 27,473$ 28,285$ 171137 University of Michigan-Dearborn Michigan 14,812$ 14,838$ 14,858$ 16,230$ 17,046$ 16,897$ 17,394$ 18,591$ 19,282$ 19,672$ 19,698$ 20,026$ 20,720$ 21,098$ 174233 University of Minnesota-Duluth Minnesota 16,496$ 17,203$ 17,837$ 18,326$ 19,704$ 20,633$ 21,468$ 22,630$ 23,385$ 24,085$ 24,762$ 25,694$ 26,363$ 27,212$ 199139 University of North Carolina at Charlotte North Carolina 13,755$ 14,131$ 14,477$ 14,754$ 14,905$ 15,237$ 16,391$ 17,424$ 18,636$ 18,880$ 19,050$ 19,703$ 20,449$ 20,791$ 154095 University of Northern Iowa Iowa 13,697$ 14,244$ 15,100$ 15,392$ 15,726$ 16,052$ 16,534$ 17,352$ 18,013$ 18,507$ 19,007$ 19,389$ 20,277$ 20,667$ 172699 Western Michigan University Michigan 14,978$ 13,052$ 18,214$ 18,214$ 19,967$ 21,143$ 22,647$ 24,217$ 25,222$ 26,139$ 27,018$ 27,881$ 29,118$ 29,823$ 237011 Western Washington University Washington 16,722 16,800$ 16,843$ 16,639$ 16,980$ 17,004$ 17,019$ 17,908$ 18,957$ 19,752$ 19,644$ 20,177$ 20,787$ 21,608$
38
Subdivision 7(6): Tuition History and Comparison Tables
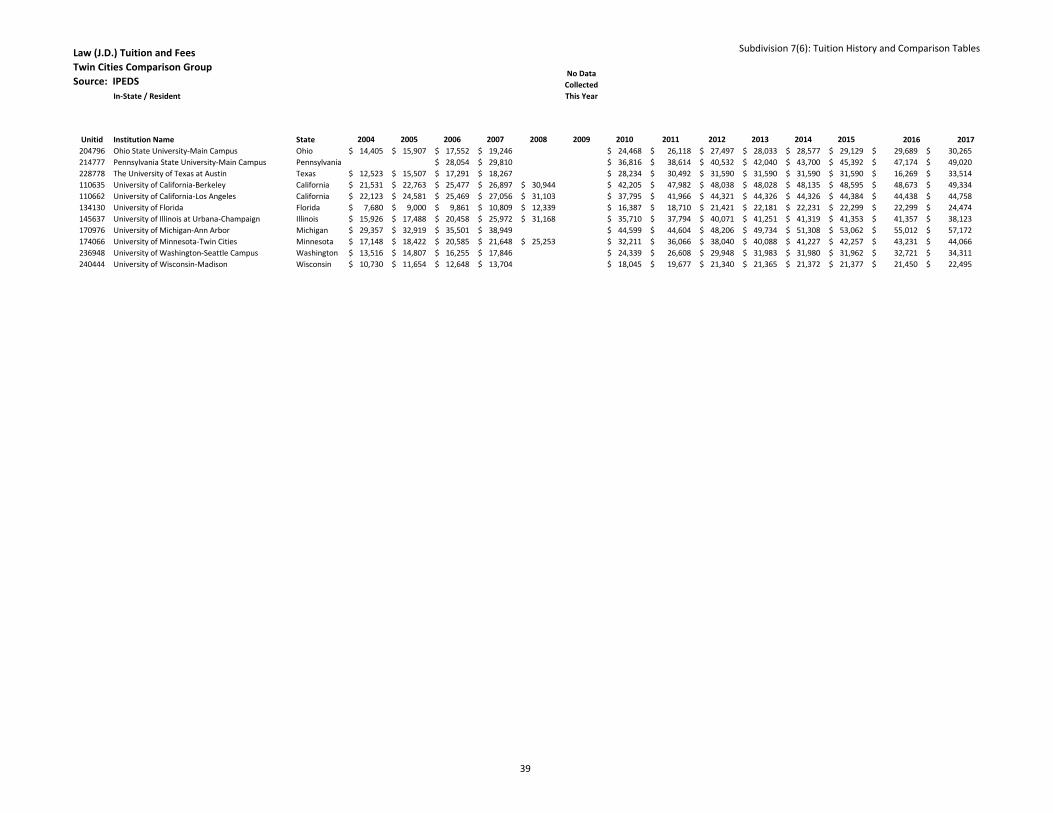
Law (J.D.) Tuition and FeesTwin Cities Comparison GroupSource: IPEDS
In-State / Resident
Unitid Institution Name State 2004 2005 2006 2007 2008 2009 2010 2011 2012 2013 2014 2015 2016 2017204796 Ohio State University-Main Campus Ohio 14,405$ 15,907$ 17,552$ 19,246$ 24,468$ 26,118$ 27,497$ 28,033$ 28,577$ 29,129$ 29,689$ 30,265$ 214777 Pennsylvania State University-Main Campus Pennsylvania 28,054$ 29,810$ 36,816$ 38,614$ 40,532$ 42,040$ 43,700$ 45,392$ 47,174$ 49,020$ 228778 The University of Texas at Austin Texas 12,523$ 15,507$ 17,291$ 18,267$ 28,234$ 30,492$ 31,590$ 31,590$ 31,590$ 31,590$ 16,269$ 33,514$ 110635 University of California-Berkeley California 21,531$ 22,763$ 25,477$ 26,897$ 30,944$ 42,205$ 47,982$ 48,038$ 48,028$ 48,135$ 48,595$ 48,673$ 49,334$ 110662 University of California-Los Angeles California 22,123$ 24,581$ 25,469$ 27,056$ 31,103$ 37,795$ 41,966$ 44,321$ 44,326$ 44,326$ 44,384$ 44,438$ 44,758$ 134130 University of Florida Florida 7,680$ 9,000$ 9,861$ 10,809$ 12,339$ 16,387$ 18,710$ 21,421$ 22,181$ 22,231$ 22,299$ 22,299$ 24,474$ 145637 University of Illinois at Urbana-Champaign Illinois 15,926$ 17,488$ 20,458$ 25,972$ 31,168$ 35,710$ 37,794$ 40,071$ 41,251$ 41,319$ 41,353$ 41,357$ 38,123$ 170976 University of Michigan-Ann Arbor Michigan 29,357$ 32,919$ 35,501$ 38,949$ 44,599$ 44,604$ 48,206$ 49,734$ 51,308$ 53,062$ 55,012$ 57,172$ 174066 University of Minnesota-Twin Cities Minnesota 17,148$ 18,422$ 20,585$ 21,648$ 25,253$ 32,211$ 36,066$ 38,040$ 40,088$ 41,227$ 42,257$ 43,231$ 44,066$ 236948 University of Washington-Seattle Campus Washington 13,516$ 14,807$ 16,255$ 17,846$ 24,339$ 26,608$ 29,948$ 31,983$ 31,980$ 31,962$ 32,721$ 34,311$ 240444 University of Wisconsin-Madison Wisconsin 10,730$ 11,654$ 12,648$ 13,704$ 18,045$ 19,677$ 21,340$ 21,365$ 21,372$ 21,377$ 21,450$ 22,495$
No Data Collected This Year
39
Subdivision 7(6): Tuition History and Comparison Tables

Dentistry (D.D.S. or D.M.D.) Tuition and FeesTwin Cities Comparison GroupSource: IPEDS
In-State / Resident
Unitid Institution Name State 2004 2005 2006 2007 2008 2009 2010 2011 2012 2013 2014 2015 2016 2017204796 Ohio State University-Main Campus Ohio 18,405$ 20,667$ 22,686$ 27,627$ 31,965$ 33,375$ 34,401$ 35,009$ 35,633$ 36,265$ 36,913$ 37,577$ 214777 Pennsylvania State University-Main Campus Pennsylvania228778 The University of Texas at Austin Texas110635 University of California-Berkeley California110662 University of California-Los Angeles California 22,290$ 24,704$ 25,587$ 26,266$ 28,093$ 32,826$ 36,722$ 36,726$ 36,731$ 36,731$ 37,997$ 38,051$ 39,130$ 134130 University of Florida Florida 15,382$ 17,569$ 19,274$ 21,150$ 24,202$ 30,735$ 35,170$ 40,326$ 41,561$ 41,627$ 41,718$ 41,718$ 41,718$ 145637 University of Illinois at Urbana-Champaign Illinois 18,564$ 21,380$ 23,374$ 26,596$ 29,172$ 17,490$ 37,542$ 32,250$ 39,872$ 40,954$ 42,130$ 43,298$ 44,142$ 145600 University of Illinois at Chicago170976 University of Michigan-Ann Arbor Michigan 21,581$ 23,387$ 24,567$ 26,543$ 30,443$ 22,284$ 22,962$ 23,386$ 24,088$ 24,750$ 25,726$ 26,792$ 174066 University of Minnesota-Twin Cities Minnesota 18,917$ 20,326$ 21,371$ 22,324$ 34,514$ 41,232$ 44,292$ 46,062$ 47,168$ 48,499$ 50,118$ 51,657$ 54,029$ 236948 University of Washington-Seattle Campus Washington 13,316$ 14,459$ 15,872$ 17,425$ 23,869$ 27,388$ 32,948$ 36,150$ 39,654$ 43,494$ 46,875$ 48,255$ 240444 University of Wisconsin-Madison Wisconsin
No Data Collected This Year
40
Subdivision 7(6): Tuition History and Comparison Tables

Veterinary Medicine (D.V.M.) Tuition and FeesTwin Cities Comparison GroupSource: IPEDS
In-State / Resident
Unitid Institution Name State 2004 2005 2006 2007 2008 2009 2010 2011 2012 2013 2014 2015 2016 2017204796 Ohio State University-Main Campus Ohio 16,413$ 17,955$ 19,629$ 21,342$ 25,908$ 27,153$ 28,065$ 28,609$ 28,609$ 30,564$ 31,148$ 31,740$ 214777 Pennsylvania State University-Main Campus Pennsylvania University of Pennsylvania228778 The University of Texas at Austin Texas Texas A &M University-College Station110635 University of California-Berkeley California University of California-Davis110662 University of California-Los Angeles California University of California-Davis134130 University of Florida Florida 13,093$ 15,297$ 16,775$ 18,401$ 21,041$ 24,566$ 26,936$ 28,100$ 28,629$ 28,629$ 28,787$ 28,787$ 28,787$ 145637 University of Illinois at Urbana-Champaign Illinois 14,858$ 15,958$ 17,566$ 20,282$ 21,468$ 24,450$ 25,474$ 27,826$ 28,856$ 28,856$ 29,852$ 29,990$ 30,408$ 170976 University of Michigan-Ann Arbor Michigan Michigan State University174066 University of Minnesota-Twin Cities Minnesota 17,142$ 18,416$ 19,529$ 20,847$ 23,017$ 26,678$ 28,538$ 29,688$ 30,642$ 30,642$ 31,105$ 31,335$ 31,614$ 236948 University of Washington-Seattle Campus Washington Washington State University240444 University of Wisconsin-Madison Wisconsin 15,878$ 15,932$ 16,378$ 16,836$ 18,135$ 18,567$ 19,030$ 19,055$ 19,055$ 20,818$ 22,841$ 26,886$
No Data Collected This Year
41
Subdivision 7(6): Tuition History and Comparison Tables

Medicine (M.D.) Tuition and FeesTwin Cities Comparison GroupSource: IPEDSIn-State / Resident
Unitid Institution Name State 2004 2005 2006 2007 2008 2009 2010 2011 2012 2013 2014 2015 2016 2017204796 Ohio State University-Main Campus Ohio 22,005$ 23,406$ 25,293$ 27,234$ 30,948$ 32,448$ 29,141$ 29,701$ 30,277$ 30,277$ 30,277$ 30,277$ 214777 Pennsylvania State University-Main Campus Pennsylvania 28,280$ 29,704$ 31,192$ 33,058$ 37,842$ 40,052$ 42,542$ 44,852$ 47,310$ 49,416$ 50,526$ 50,534$ 228778 The University of Texas at Austin Texas 19,292$ 19,871$ 110635 University of California-Berkeley California 28,381$ 31,470$ 32,788$ 32,778$ 32,885$ 33,942$ 34,635$ 35,926$ 110662 University of California-Los Angeles California 19,784$ 21,506$ 22,036$ 22,551$ 24,173$ 28,101$ 31,198$ 32,480$ 32,485$ 32,485$ 33,140$ 34,220$ 35,617$ 134130 University of Florida Florida 17,527$ 20,036$ 21,042$ 23,095$ 26,439$ 30,680$ 33,661$ 35,412$ 36,500$ 36,566$ 36,657$ 36,657$ 36,657$ 145637 University of Illinois at Urbana-Champaign Illinois 24,578$ 26,426$ 27,670$ 28,572$ 30,308$ 18,942$ 38,784$ 36,948$ 37,624$ 38,534$ 38,564$ 39,526$ 33,658$ 170976 University of Michigan-Ann Arbor Michigan 21,355$ 22,433$ 23,565$ 24,755$ 28,117$ 29,096$ 29,546$ 30,150$ 31,482$ 34,378$ 36,080$ 174066 University of Minnesota-Twin Cities Minnesota 18,574$ 19,220$ 19,855$ 20,466$ 32,360$ 35,668$ 37,554$ 39,020$ 39,949$ 39,893$ 39,922$ 40,025$ 39,965$ 236948 University of Washington-Seattle Campus Washington 13,316$ 14,459$ 15,872$ 17,425$ 23,049$ 25,548$ 28,268$ 30,186$ 32,220$ 33,759$ 34,728$ 35,745$ 240444 University of Wisconsin-Madison Wisconsin 21,760$ 21,814$ 22,260$ 22,718$ 24,017$ 24,449$ 24,912$ 24,937$ 24,944$ 27,259$ 29,865$ 32,689$
No Data Collected This Year
42
Subdivision 7(6): Tuition History and Comparison Tables
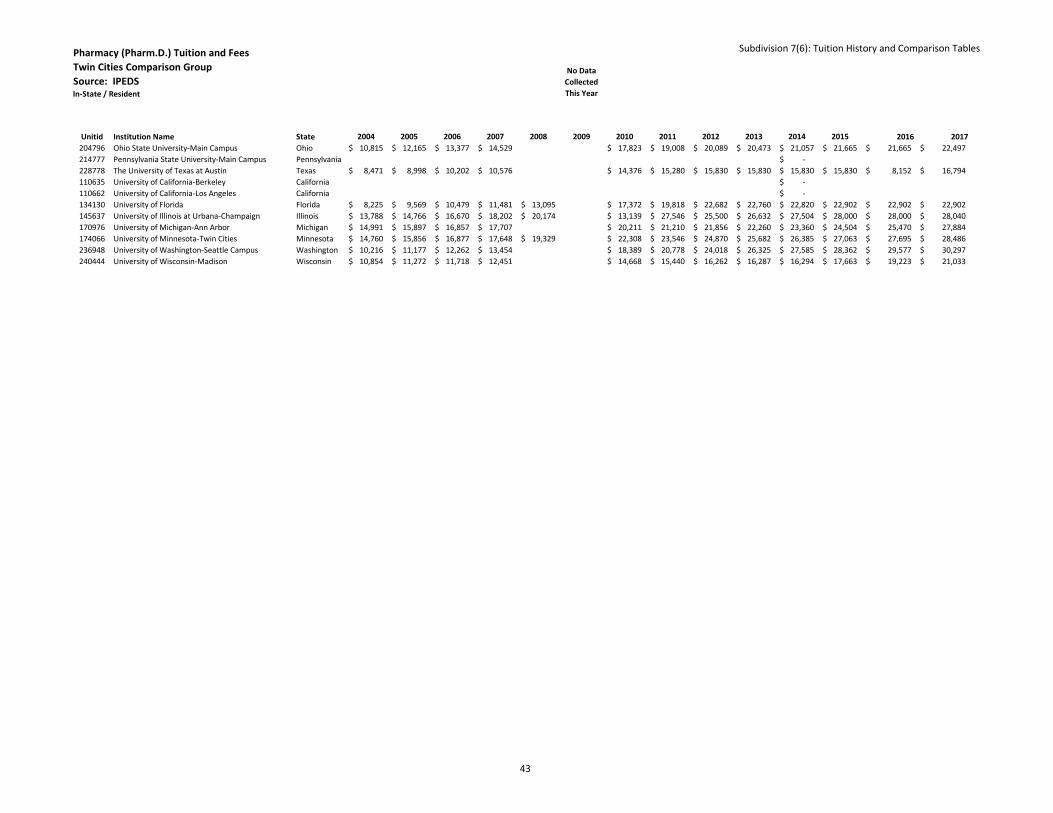
Pharmacy (Pharm.D.) Tuition and FeesTwin Cities Comparison GroupSource: IPEDSIn-State / Resident
Unitid Institution Name State 2004 2005 2006 2007 2008 2009 2010 2011 2012 2013 2014 2015 2016 2017204796 Ohio State University-Main Campus Ohio 10,815$ 12,165$ 13,377$ 14,529$ 17,823$ 19,008$ 20,089$ 20,473$ 21,057$ 21,665$ 21,665$ 22,497$ 214777 Pennsylvania State University-Main Campus Pennsylvania -$ 228778 The University of Texas at Austin Texas 8,471$ 8,998$ 10,202$ 10,576$ 14,376$ 15,280$ 15,830$ 15,830$ 15,830$ 15,830$ 8,152$ 16,794$ 110635 University of California-Berkeley California -$ 110662 University of California-Los Angeles California -$ 134130 University of Florida Florida 8,225$ 9,569$ 10,479$ 11,481$ 13,095$ 17,372$ 19,818$ 22,682$ 22,760$ 22,820$ 22,902$ 22,902$ 22,902$ 145637 University of Illinois at Urbana-Champaign Illinois 13,788$ 14,766$ 16,670$ 18,202$ 20,174$ 13,139$ 27,546$ 25,500$ 26,632$ 27,504$ 28,000$ 28,000$ 28,040$ 170976 University of Michigan-Ann Arbor Michigan 14,991$ 15,897$ 16,857$ 17,707$ 20,211$ 21,210$ 21,856$ 22,260$ 23,360$ 24,504$ 25,470$ 27,884$ 174066 University of Minnesota-Twin Cities Minnesota 14,760$ 15,856$ 16,877$ 17,648$ 19,329$ 22,308$ 23,546$ 24,870$ 25,682$ 26,385$ 27,063$ 27,695$ 28,486$ 236948 University of Washington-Seattle Campus Washington 10,216$ 11,177$ 12,262$ 13,454$ 18,389$ 20,778$ 24,018$ 26,325$ 27,585$ 28,362$ 29,577$ 30,297$ 240444 University of Wisconsin-Madison Wisconsin 10,854$ 11,272$ 11,718$ 12,451$ 14,668$ 15,440$ 16,262$ 16,287$ 16,294$ 17,663$ 19,223$ 21,033$
No Data Collected This Year
43
Subdivision 7(6): Tuition History and Comparison Tables

University of Minnesota
IPEDS definition Graduation Rates
First-Time Full-Time New Entering Freshmen
Crookston Campus
Entry Year Ethnicity Total4 Year Degree
N4 Year Degree
%5 Year Degree
N5 Year Degree
%6 Year Degree
N6 Year Degree
%
2004 African American 9 1 11.1 1 11.1 2 22.2
2004 American Indian 1 1 100.0 1 100.0 1 100.0
2004 Asian 2 1 50.0 1 50.0 1 50.0
2004 Hispanic 3 0 0.0 3 100.0 3 100.0
2004 Non-res Alien 3 0 0.0 0 0.0 0 0.0
2004 White 163 39 23.9 59 36.2 63 38.7
2004 XUnknown 14 0 0.0 2 14.3 2 14.3
2004 ZTOTAL 195 42 21.5 67 34.4 72 36.9
2005 African American 8 1 12.5 1 12.5 1 12.5
2005 American Indian 2 0 0.0 0 0.0 0 0.0
2005 Asian 3 0 0.0 1 33.3 2 66.7
2005 Hispanic 1 0 0.0 0 0.0 0 0.0
2005 Non-res Alien 3 1 33.3 1 33.3 1 33.3
2005 White 159 60 37.7 77 48.4 79 49.7
2005 XUnknown 7 1 14.3 2 28.6 2 28.6
2005 ZTOTAL 183 63 34.4 82 44.8 85 46.5
2006 African American 7 2 28.6 4 57.1 4 57.1
2006 American Indian 1 0 0.0 0 0.0 0 0.0
2006 Asian 3 2 66.7 2 66.7 2 66.7
2006 Hispanic 4 0 0.0 1 25.0 1 25.0
2006 Non-res Alien 7 0 0.0 0 0.0 0 0.0
2006 White 174 57 32.8 84 48.3 86 49.4
2006 XUnknown 5 2 40.0 2 40.0 2 40.0
2006 ZTOTAL 201 63 31.3 93 46.3 95 47.3
2007 African American 8 0 0.0 0 0.0 1 12.5
2007 American Indian 1 0 0.0 0 0.0 0 0.0
2007 Asian 3 0 0.0 0 0.0 0 0.0
2007 Hispanic 12 2 16.7 2 16.7 2 16.7
2007 Non-res Alien 11 2 18.2 2 18.2 2 18.2
2007 White 176 67 38.1 84 47.7 89 50.6
2007 XUnknown 6 2 33.3 2 33.3 2 33.3
2007 ZTOTAL 217 73 33.6 90 41.5 96 44.2
2008 African American 12 0 0.0 0 0.0 1 8.3
2008 American Indian 3 1 33.3 1 33.3 1 33.3
2008 Asian 1 0 0.0 1 100.0 1 100.0
2008 Hispanic 4 0 0.0 1 25.0 1 25.0
44
Subdivision 7(7): Graduation Rates Tables

2008 Non-res Alien 9 2 22.2 3 33.3 3 33.3
2008 White 192 74 38.5 102 53.1 103 53.7
2008 XUnknown 17 1 5.9 4 23.5 4 23.5
2008 ZTOTAL 238 78 32.8 112 47.1 114 47.9
2009 African American 18 1 5.6 3 16.7 3 16.7
2009 American Indian 3 0 0.0 0 0.0 0 0.0
2009 Asian 3 0 0.0 0 0.0 0 0.0
2009 Hispanic 8 3 37.5 4 50.0 4 50.0
2009 Non-res Alien 9 2 22.2 3 33.3 3 33.3
2009 White 196 71 36.2 97 49.5 98 50.0
2009 XUnknown 10 1 10.0 2 20.0 2 20.0
2009 ZTOTAL 247 78 31.6 109 44.1 110 44.5
2010 African American 23 9 39.1 11 47.8 13 56.5
2010 American Indian 7 2 28.6 2 28.6 2 28.6
2010 Asian 4 1 25.0 1 25.0 1 25.0
2010 Hispanic 4 2 50.0 2 50.0 2 50.0
2010 Non-res Alien 12 3 25.0 6 50.0 6 50.0
2010 White 198 89 44.9 107 54.0 112 56.6
2010 XUnknown 2 0 0.0 0 0.0 0 0.0
2010 ZTOTAL 250 106 42.4 129 51.6 136 54.4
2011 African American 11 3 27.3 4 36.4 4 36.4
2011 American Indian 4 1 25.0 1 25.0 1 25.0
2011 Asian 5 1 20.0 1 20.0 1 20.0
2011 Hispanic 9 3 33.3 5 55.6 5 55.6
2011 Non-res Alien 12 5 41.7 6 50.0 7 58.3
2011 White 195 83 42.6 106 54.4 107 54.9
2011 XUnknown 3 2 66.7 3 100.0 3 100.0
2011 ZTOTAL 239 98 41.0 126 52.7 128 53.6
2012 African American 17 1 5.9 3 17.6
2012 American Indian 2 0 0.0 0 0.0
2012 Asian 6 3 50.0 3 50.0
2012 Hispanic 7 2 28.6 2 28.6
2012 Non-res Alien 6 3 50.0 3 50.0
2012 White 173 81 46.8 90 52.0
2012 XUnknown 1 0 0.0 0 0.0
2012 ZTOTAL 212 90 42.5 101 47.6
2013 African American 7 1 14.3
2013 American Indian 2 0 0.0
2013 Asian 6 1 16.7
2013 Hispanic 5 0 0.0
2013 Non-res Alien 3 0 0.0
2013 White 153 74 48.4
45
Subdivision 7(7): Graduation Rates Tables

2013 XUnknown 4 1 25.0
2013 ZTOTAL 180 77 42.8
46
Subdivision 7(7): Graduation Rates Tables

University of Minnesota
IPEDS definition Graduation Rates
First-Time Full-Time New Entering Freshmen
Duluth Campus
Entry Year Ethnicity Total4 Year Degree
N4 Year Degree
%5 Year Degree
N5 Year Degree
%6 Year Degree
N6 Year Degree
%
2004 African American 29 2 6.9 7 24.1 8 27.6
2004 American Indian 14 2 14.3 5 35.7 5 35.7
2004 Asian 71 13 18.3 29 40.8 35 49.3
2004 Hispanic 20 4 20.0 11 55.0 13 65.0
2004 Non-res Alien 12 6 50.0 8 66.7 8 66.7
2004 White 2,021 531 26.3 1,016 50.3 1,101 54.5
2004 XUnknown 37 10 27.0 18 48.6 19 51.4
2004 ZTOTAL 2,204 568 25.8 1,094 49.6 1,189 54.0
2005 African American 21 2 9.5 4 19.0 5 23.8
2005 American Indian 10 0 0.0 1 10.0 1 10.0
2005 Asian 51 13 25.5 23 45.1 29 56.9
2005 Hispanic 19 2 10.5 3 15.8 6 31.6
2005 Non-res Alien 17 5 29.4 8 47.1 8 47.1
2005 White 1,969 537 27.3 996 50.6 1,099 55.8
2005 XUnknown 24 6 25.0 11 45.8 12 50.0
2005 ZTOTAL 2,111 565 26.8 1,046 49.5 1,160 55.0
2006 African American 20 3 15.0 6 30.0 8 40.0
2006 American Indian 12 2 16.7 3 25.0 3 25.0
2006 Asian 63 9 14.3 21 33.3 31 49.2
2006 Hispanic 19 3 15.8 7 36.8 7 36.8
2006 Non-res Alien 24 7 29.2 14 58.3 15 62.5
2006 White 2,122 599 28.2 1,063 50.1 1,149 54.2
2006 XUnknown 23 6 26.1 12 52.2 14 60.9
2006 ZTOTAL 2,283 629 27.6 1,126 49.3 1,227 53.8
2007 African American 31 3 9.7 9 29.0 14 45.2
2007 American Indian 22 4 18.2 6 27.3 7 31.8
2007 Asian 62 16 25.8 29 46.8 31 50.0
2007 Hispanic 27 5 18.5 11 40.7 12 44.4
2007 Non-res Alien 21 12 57.1 16 76.2 17 81.0
2007 White 2,006 600 29.9 1,100 54.8 1,196 59.6
2007 XUnknown 27 9 33.3 15 55.6 16 59.3
2007 ZTOTAL 2,196 649 29.6 1,186 54.0 1,293 58.9
2008 African American 31 6 19.4 14 45.2 17 54.8
2008 American Indian 18 5 27.8 8 44.4 8 44.4
2008 Asian 81 17 21.0 33 40.7 37 45.7
2008 Hispanic 21 6 28.6 9 42.9 9 42.9
2008 Non-res Alien 32 13 40.6 20 62.5 20 62.5
2008 White 1,999 705 35.3 1,131 56.6 1,208 60.4
47
Subdivision 7(7): Graduation Rates Tables

2008 XUnknown 31 8 25.8 12 38.7 13 41.9
2008 ZTOTAL 2,213 760 34.3 1,227 55.4 1,312 59.3
2009 African American 29 3 10.3 10 34.5 12 41.4
2009 American Indian 15 3 20.0 4 26.7 4 26.7
2009 Asian 80 21 26.3 37 46.3 41 51.3
2009 Hispanic 32 8 25.0 14 43.8 14 43.8
2009 Non-res Alien 22 11 50.0 14 63.6 15 68.2
2009 White 1,887 678 35.9 1,086 57.6 1,152 61.1
2009 XUnknown 14 4 28.6 9 64.3 9 64.3
2009 ZTOTAL 2,079 728 35.0 1,174 56.5 1,247 60.0
2010 African American 42 8 19.0 18 42.9 19 45.2
2010 American Indian 33 10 30.3 14 42.4 16 48.5
2010 Asian 90 25 27.8 51 56.7 60 66.7
2010 Hispanic 31 13 41.9 18 58.1 19 61.3
2010 Non-res Alien 17 8 47.1 9 52.9 9 52.9
2010 White 2,098 753 35.9 1,189 56.7 1,253 59.7
2010 XUnknown 5 2 40.0 4 80.0 4 80.0
2010 ZTOTAL 2,316 819 35.4 1,303 56.3 1,380 59.6
2011 African American 50 7 14.0 20 40.0 23 46.0
2011 American Indian 26 7 26.9 12 46.2 13 50.0
2011 Asian 97 27 27.8 41 42.3 44 45.4
2011 Hispanic 46 13 28.3 16 34.8 18 39.1
2011 Non-res Alien 15 6 40.0 8 53.3 8 53.3
2011 White 1,851 689 37.2 1,076 58.1 1,128 60.9
2011 XUnknown 10 2 20.0 5 50.0 7 70.0
2011 ZTOTAL 2,095 751 35.8 1,178 56.2 1,241 59.2
2012 African American 65 12 18.5 24 36.9
2012 American Indian 24 8 33.3 11 45.8
2012 Asian 79 19 24.1 33 41.8
2012 Hispanic 49 11 22.4 19 38.8
2012 Non-res Alien 19 3 15.8 6 31.6
2012 White 1,621 608 37.5 915 56.4
2012 XUnknown 15 7 46.7 10 66.7
2012 ZTOTAL 1,872 668 35.7 1,018 54.4
2013 African American 60 22 36.7
2013 American Indian 33 8 24.2
2013 Asian 88 21 23.9
2013 Hispanic 42 15 35.7
2013 Non-res Alien 31 14 45.2
2013 White 1,788 686 38.4
2013 XUnknown 4 1 25.0
2013 ZTOTAL 2,046 767 37.5
48
Subdivision 7(7): Graduation Rates Tables

University of Minnesota
IPEDS definition Graduation Rates
First-Time Full-Time New Entering Freshmen
Morris
Entry Year Ethnicity Total4 Year Degree
N4 Year Degree
%5 Year Degree
N5 Year Degree
%6 Year Degree
N6 Year Degree
%
2004 African Ameri 6 3 50.0 3 50.0 3 50.0
2004 American Indi 36 12 33.3 19 52.8 20 55.6
2004 Asian 17 5 29.4 8 47.1 8 47.1
2004 Hispanic 7 5 71.4 5 71.4 6 85.7
2004 Non-res Alien 6 3 50.0 4 66.7 4 66.7
2004 White 303 172 56.8 201 66.3 204 67.3
2004 XUnknown 8 5 62.5 6 75.0 7 87.5
2004 ZTOTAL 383 205 53.5 246 64.2 252 65.8
2005 African Ameri 7 0 0.0 1 14.3 1 14.3
2005 American Indi 41 12 29.3 17 41.5 18 43.9
2005 Asian 14 6 42.9 7 50.0 7 50.0
2005 Hispanic 6 4 66.7 5 83.3 5 83.3
2005 Non-res Alien 2 0 0.0 0 0.0 0 0.0
2005 White 274 147 53.6 176 64.2 179 65.3
2005 XUnknown 8 2 25.0 3 37.5 3 37.5
2005 ZTOTAL 352 171 48.6 209 59.4 213 60.5
2006 African Ameri 14 3 21.4 6 42.9 6 42.9
2006 American Indi 42 16 38.1 19 45.2 22 52.4
2006 Asian 16 10 62.5 11 68.8 11 68.8
2006 Hispanic 6 1 16.7 3 50.0 3 50.0
2006 Non-res Alien 7 4 57.1 4 57.1 4 57.1
2006 White 283 142 50.2 171 60.4 177 62.5
2006 XUnknown 8 3 37.5 5 62.5 5 62.5
2006 ZTOTAL 376 179 47.6 219 58.2 228 60.6
2007 African Ameri 6 4 66.7 5 83.3 5 83.3
2007 American Indi 29 10 34.5 13 44.8 15 51.7
2007 Asian 15 6 40.0 8 53.3 8 53.3
2007 Hispanic 9 3 33.3 4 44.4 5 55.6
2007 Non-res Alien 8 1 12.5 4 50.0 4 50.0
2007 White 281 153 54.4 179 63.7 186 66.2
2007 XUnknown 10 3 30.0 4 40.0 4 40.0
2007 ZTOTAL 358 180 50.3 217 60.6 227 63.4
2008 African Ameri 11 2 18.2 5 45.5 5 45.5
2008 American Indi 38 12 31.6 15 39.5 18 47.4
2008 Asian 14 10 71.4 11 78.6 11 78.6
49
Subdivision 7(7): Graduation Rates Tables

2008 Hispanic 4 3 75.0 4 100.0 4 100.0
2008 Non-res Alien 11 3 27.3 4 36.4 4 36.4
2008 White 286 165 57.7 199 69.6 201 70.3
2008 XUnknown 9 5 55.6 6 66.7 6 66.7
2008 ZTOTAL 373 200 53.6 244 65.4 249 66.8
2009 African Ameri 5 2 40.0 3 60.0 3 60.0
2009 American Indi 58 10 17.2 21 36.2 24 41.4
2009 Asian 10 6 60.0 6 60.0 6 60.0
2009 Hispanic 7 3 42.9 3 42.9 4 57.1
2009 Non-res Alien 6 3 50.0 4 66.7 4 66.7
2009 White 315 181 57.5 220 69.8 222 70.5
2009 XUnknown 3 1 33.3 1 33.3 1 33.3
2009 ZTOTAL 404 206 51.0 258 63.9 264 65.4
2010 African Ameri 15 7 46.7 9 60.0 9 60.0
2010 American Indi 71 27 38.0 36 50.7 39 54.9
2010 Asian 18 10 55.6 13 72.2 13 72.2
2010 Hispanic 10 2 20.0 3 30.0 3 30.0
2010 Non-res Alien 6 1 16.7 1 16.7 2 33.3
2010 White 296 162 54.7 196 66.2 199 67.2
2010 XUnknown 2 2 100.0 2 100.0 2 100.0
2010 ZTOTAL 418 211 50.5 260 62.2 267 63.9
2011 African Ameri 9 3 33.3 5 55.6 5 55.6
2011 American Indi 70 27 38.6 33 47.1 33 47.1
2011 Asian 16 4 25.0 6 37.5 6 37.5
2011 Hispanic 10 2 20.0 3 30.0 3 30.0
2011 Non-res Alien 9 4 44.4 5 55.6 5 55.6
2011 White 345 188 54.5 212 61.4 218 63.2
2011 XUnknown 3 1 33.3 1 33.3 1 33.3
2011 ZTOTAL 462 229 49.6 265 57.4 271 58.7
2012 African Ameri 9 3 33.3 5 55.6
2012 American Indi 75 30 40.0 43 57.3
2012 Asian 19 4 21.1 7 36.8
2012 Hispanic 11 3 27.3 3 27.3
2012 Non-res Alien 12 3 25.0 5 41.7
2012 White 281 169 60.1 198 70.5
2012 XUnknown 2 1 50.0 1 50.0
2012 ZTOTAL 409 213 52.1 262 64.1
2013 African Ameri 15 7 46.7
2013 American Indi 70 20 28.6
2013 Asian 16 8 50.0
2013 Hispanic 16 5 31.3
2013 Non-res Alien 8 3 37.5
50
Subdivision 7(7): Graduation Rates Tables

2013 White 343 175 51.0
2013 Unknown
2013 ZTOTAL 468 218 46.6
51
Subdivision 7(7): Graduation Rates Tables

University of Minnesota
IPEDS definition Graduation Rates
First-Time Full-Time New Entering Freshmen
Rochester Campus
Entry Year Ethnicity Total4 Year Degree
N4 Year Degree
%5 Year Degree
N5 Year Degree
%6 Year Degree
N6 Year Degree
%
2009 African Ameri 1 0 0.0 0 0.0 0 0.0
2009 American Indian
2009 Asian 2 1 50.0 1 50.0 1 50.0
2009 Hispanic
2009 Non-res Alien
2009 White 39 18 46.2 20 51.3 20 51.3
2009 XUnknown 8 5 62.5 6 75.0 6 75.0
2009 ZTOTAL 50 24 48.0 27 54.0 27 54.0
2010 African Ameri 5 1 20.0 3 60.0 3 60.0
2010 American Indi 1 1 100.0 1 100.0 1 100.0
2010 Asian 4 3 75.0 3 75.0 3 75.0
2010 Hispanic 4 2 50.0 2 50.0 2 50.0
2010 Non-res Alien
2010 White 77 38 49.4 41 53.2 42 54.6
2010 XUnknown 1 0 0.0 0 0.0 0 0.0
2010 ZTOTAL 92 45 48.9 50 54.3 51 55.4
2011 African Ameri 11 7 63.6 8 72.7 8 72.7
2011 American Indi 1 0 0.0 0 0.0 0 0.0
2011 Asian 9 4 44.4 4 44.4 4 44.4
2011 Hispanic 5 2 40.0 2 40.0 2 40.0
2011 Non-res Alien 1 1 100.0 1 100.0 1 100.0
2011 White 81 49 60.5 51 63.0 52 64.2
2011 XUnknown 3 1 33.3 1 33.3 1 33.3
2011 ZTOTAL 111 64 57.7 67 60.4 68 61.3
2012 African Ameri 4 2 50.0 4 100.0
2012 American Indi 1 0 0.0 1 100.0
2012 Asian 8 3 37.5 3 37.5
2012 Hispanic 3 3 100.0 3 100.0
2012 Non-res Alien 1 1 100.0 1 100.0
2012 White 122 63 51.6 69 56.6
2012 XUnknown 1 0 0.0 0 0.0
2012 ZTOTAL 140 72 51.4 81 57.9
2013 African Ameri 10 5 50.0
2013 American Indi 1 0 0.0
2013 Asian 16 15 93.8
52
Subdivision 7(7): Graduation Rates Tables

2013 Hispanic 4 0 0.0
2013 Non-res Alien 1 0 0.0
2013 White 123 65 52.8
2013 Unknown
2013 ZTOTAL 155 85 54.8
53
Subdivision 7(7): Graduation Rates Tables

University of Minnesota
IPEDS definition Graduation Rates
First-Time Full-Time New Entering Freshmen
Twin Cities
Entry Year Ethnicity Total4 Year Degree
N4 Year Degree
%5 Year Degree
N5 Year Degree
%6 Year Degree
N6 Year Degree
%
2004 African Ameri 265 49 18.5 92 34.7 121 45.7
2004 American Indi 51 9 17.6 15 29.4 18 35.3
2004 Asian 596 224 37.6 338 56.7 369 61.9
2004 Hispanic 106 37 34.9 60 56.6 62 58.5
2004 Non-res Alien 37 13 35.1 22 59.5 23 62.2
2004 White 4,428 2,189 49.4 3,120 70.5 3,276 74.0
2004 XUnknown 72 33 45.8 43 59.7 50 69.4
2004 ZTOTAL 5,555 2,554 46.0 3,690 66.4 3,919 70.6
2005 African Ameri 249 50 20.1 95 38.2 104 41.8
2005 American Indi 56 16 28.6 22 39.3 23 41.1
2005 Asian 537 190 35.4 295 54.9 326 60.7
2005 Hispanic 127 41 32.3 61 48.0 67 52.8
2005 Non-res Alien 78 35 44.9 58 74.4 58 74.4
2005 White 4,163 2,133 51.2 2,959 71.1 3,102 74.5
2005 XUnknown 62 28 45.2 38 61.3 41 66.1
2005 ZTOTAL 5,272 2,493 47.3 3,528 66.9 3,721 70.6
2006 African Ameri 284 70 24.6 131 46.1 142 50.0
2006 American Indi 57 14 24.6 23 40.4 25 43.9
2006 Asian 639 251 39.3 387 60.6 429 67.1
2006 Hispanic 109 49 45.0 69 63.3 75 68.8
2006 Non-res Alien 69 30 43.5 45 65.2 50 72.5
2006 White 4,194 2,290 54.6 3,066 73.1 3,192 76.1
2006 XUnknown 65 35 53.8 47 72.3 51 78.5
2006 ZTOTAL 5,417 2,739 50.6 3,768 69.6 3,964 73.2
2007 African Ameri 261 84 32.2 139 53.3 151 57.9
2007 American Indi 64 17 26.6 32 50.0 35 54.7
2007 Asian 598 257 43.0 380 63.5 418 69.9
2007 Hispanic 128 58 45.3 87 68.0 91 71.1
2007 Non-res Alien 154 75 48.7 103 66.9 107 69.5
2007 White 3,989 2,351 58.9 3,033 76.0 3,134 78.6
2007 XUnknown 61 26 42.6 38 62.3 40 65.6
2007 ZTOTAL 5,255 2,868 54.6 3,812 72.5 3,976 75.7
2008 African Ameri 259 87 33.6 137 52.9 150 57.9
2008 American Indi 67 27 40.3 43 64.2 43 64.2
2008 Asian 591 281 47.5 392 66.3 419 70.9
54
Subdivision 7(7): Graduation Rates Tables

2008 Hispanic 123 64 52.0 82 66.7 86 69.9
2008 Non-res Alien 277 148 53.4 200 72.2 208 75.1
2008 White 3,729 2,350 63.0 2,969 79.6 3,056 82.0
2008 XUnknown 43 20 46.5 29 67.4 31 72.1
2008 ZTOTAL 5,089 2,977 58.5 3,852 75.7 3,993 78.5
2009 African Ameri 244 91 37.3 124 50.8 134 54.9
2009 American Indi 72 25 34.7 37 51.4 42 58.3
2009 Asian 586 291 49.7 416 71.0 440 75.1
2009 Hispanic 127 68 53.5 88 69.3 92 72.4
2009 Non-res Alien 346 196 56.6 246 71.1 270 78.0
2009 White 3,986 2,511 63.0 3,100 77.8 3,177 79.7
2009 XUnknown 20 9 45.0 10 50.0 11 55.0
2009 ZTOTAL 5,381 3,191 59.3 4,021 74.7 4,166 77.4
2010 African Ameri 222 88 39.6 125 56.3 140 63.1
2010 American Indi 55 31 56.4 34 61.8 35 63.6
2010 Asian 545 290 53.2 385 70.6 422 77.4
2010 Hispanic 134 71 53.0 85 63.4 88 65.7
2010 Non-res Alien 244 144 59.0 188 77.0 201 82.4
2010 White 4,080 2,613 64.0 3,174 77.8 3,260 79.9
2010 XUnknown 30 14 46.7 18 60.0 20 66.7
2010 ZTOTAL 5,310 3,251 61.2 4,009 75.5 4,166 78.5
2011 African Ameri 202 102 50.5 141 69.8 151 74.8
2011 American Indi 61 28 45.9 35 57.4 38 62.3
2011 Asian 588 320 54.4 421 71.6 443 75.3
2011 Hispanic 139 75 54.0 100 71.9 106 76.3
2011 Non-res Alien 310 175 56.5 240 77.4 259 83.6
2011 White 4,032 2,692 66.8 3,186 79.0 3,274 81.2
2011 XUnknown 19 10 52.6 15 78.9 15 79.0
2011 ZTOTAL 5,351 3,402 63.6 4,138 77.3 4,286 80.1
2012 African Ameri 187 97 51.9 131 70.1
2012 American Indi 60 32 53.3 38 63.3
2012 Asian 670 397 59.3 499 74.5
2012 Hispanic 155 96 61.9 120 77.4
2012 Non-res Alien 283 175 61.8 226 79.9
2012 White 4,122 2,790 67.7 3,243 78.7
2012 XUnknown 20 10 50.0 14 70.0
2012 ZTOTAL 5,497 3,597 65.4 4,271 77.7
2013 African Ameri 215 95 44.2
2013 American Indi 56 25 44.6
2013 Asian 637 421 66.1
2013 Hispanic 165 103 62.4
2013 Non-res Alien 283 171 60.4
55
Subdivision 7(7): Graduation Rates Tables

2013 White 4,166 2,958 71.0
2013 XUnknown 8 7 87.5
2013 ZTOTAL 5,530 3,780 68.4
56
Subdivision 7(7): Graduation Rates Tables

University of Minnesota
IPEDS definition Graduation Rates
First-Time Full-Time New Entering Freshmen
Crookston Campus
Entry Year Gender Total4 Year Degree
N4 Year Degree
%5 Year Degree
N5 Year Degree
%6 Year Degree
N6 Year Degree
%
2004 Female 85 21 24.7 32 37.6 33 38.8
2004 Male 108 21 19.4 34 31.5 38 35.2
2004 Unknown 2 0 0.0 1 50.0 1 50.0
2004 Total 195 42 21.5 67 34.4 72 36.9
2005 Female 81 34 42.0 41 50.6 42 51.9
2005 Male 100 29 29.0 41 41.0 42 42.0
2005 Unknown 2 0 0.0 0 0.0 1 50.0
2005 Total 183 63 34.4 82 44.8 85 46.5
2006 Female 96 32 33.3 47 49.0 48 50.0
2006 Male 101 30 29.7 45 44.6 46 45.5
2006 Unknown 4 1 25.0 1 25.0 1 25.0
2006 Total 201 63 31.3 93 46.3 95 47.3
2007 Female 95 41 43.2 48 50.5 49 51.6
2007 Male 122 32 26.2 42 34.4 47 38.5
2007 Unknown
2007 Total 217 73 33.6 90 41.5 96 44.2
2008 Female 86 32 37.2 47 54.7 47 54.7
2008 Male 151 46 30.5 65 43.0 67 44.4
2008 Unknown 1 0 0.0 0 0.0 0 0.0
2008 Total 238 78 32.8 112 47.1 114 47.9
2009 Female 116 41 35.3 58 50.0 58 50.0
2009 Male 127 36 28.3 49 38.6 50 39.4
2009 Unknown 4 1 25.0 2 50.0 2 50.0
2009 Total 247 78 31.6 109 44.1 110 44.5
2010 Female 132 65 49.2 78 59.1 80 60.6
2010 Male 116 39 33.6 49 42.2 54 46.6
2010 Unknown 2 2 100.0 2 100.0 2 100.0
2010 Total 250 106 42.4 129 51.6 136 54.4
2011 Female 107 47 43.9 56 52.3 57 53.3
2011 Male 127 50 39.4 69 54.3 70 55.1
2011 Unknown 5 1 20.0 1 20.0 1 20.0
2011 Total 239 98 41.0 126 52.7 128 53.6
57
Subdivision 7(7): Graduation Rates Tables

2012 Female 109 54 49.5 59 54.1
2012 Male 101 36 35.6 42 41.6
2012 Unknown 2 0 0.0 0 0.0
2012 Total 212 90 42.5 101 47.6
2013 Female 88 44 50.0
2013 Male 91 33 36.3
2013 Unknown 1 0 0.0
2013 Total 180 77 42.8
58
Subdivision 7(7): Graduation Rates Tables

University of Minnesota
IPEDS definition Graduation Rates
First-Time Full-Time New Entering Freshmen
Duluth Campus
Entry Year Gender Total4 Year Degree
N4 Year Degree
%5 Year Degree
N5 Year Degree
%6 Year Degree
N6 Year Degree
%
2004 Female 1,149 360 31.3 584 50.8 621 54.1
2004 Male 1,047 208 19.9 509 48.6 566 54.1
2004 Unknown 8 0 0.0 1 12.5 2 25.0
2004 Total 2,204 568 25.8 1,094 49.6 1,189 54.0
2005 Female 1,015 319 31.4 520 51.2 557 54.9
2005 Male 1,078 241 22.4 515 47.8 591 54.8
2005 Unknown 18 5 27.8 11 61.1 12 66.7
2005 Total 2,111 565 26.8 1,046 49.5 1,160 55.0
2006 Female 1,094 352 32.2 559 51.1 592 54.1
2006 Male 1,173 270 23.0 558 47.6 626 53.4
2006 Unknown 16 7 43.8 9 56.3 9 56.3
2006 Total 2,283 629 27.6 1,126 49.3 1,227 53.8
2007 Female 1,098 404 36.8 632 57.6 659 60.0
2007 Male 1,092 243 22.3 551 50.5 630 57.7
2007 Unknown 6 2 33.3 3 50.0 4 66.7
2007 Total 2,196 649 29.6 1,186 54.0 1,293 58.9
2008 Female 1,107 452 40.8 645 58.3 676 61.1
2008 Male 1,095 304 27.8 576 52.6 630 57.5
2008 Unknown 11 4 36.4 6 54.5 6 54.6
2008 Total 2,213 760 34.3 1,227 55.4 1,312 59.3
2009 Female 1,022 429 42.0 629 61.5 648 63.4
2009 Male 1,048 295 28.1 538 51.3 592 56.5
2009 Unknown 9 4 44.4 7 77.8 7 77.8
2009 Total 2,079 728 35.0 1,174 56.5 1,247 60.0
2010 Female 1,110 463 41.7 641 57.7 667 60.1
2010 Male 1,191 351 29.5 655 55.0 705 59.2
2010 Unknown 15 5 33.3 7 46.7 8 53.3
2010 Total 2,316 819 35.4 1,303 56.3 1,380 59.6
2011 Female 998 416 41.7 579 58.0 598 59.9
2011 Male 1,094 333 30.4 596 54.5 640 58.5
2011 Unknown 3 2 66.7 3 100.0 3 100.0
2011 Total 2,095 751 35.8 1,178 56.2 1,241 59.2
59
Subdivision 7(7): Graduation Rates Tables

2012 Female 886 369 41.6 517 58.4
2012 Male 982 299 30.4 500 50.9
2012 Unknown 4 0 0.0 1 25.0
2012 Total 1,872 668 35.7 1,018 54.4
2013 Female 970 410 42.3
2013 Male 1,074 357 33.2
2013 Unknown 2 0 0.0
2013 Total 2,046 767 37.5
60
Subdivision 7(7): Graduation Rates Tables

University of Minnesota
IPEDS definition Graduation Rates
First-Time Full-Time New Entering Freshmen
Morris Campus
Entry Year Gender Total4 Year Degree
N4 Year Degree
%5 Year Degree
N5 Year Degree
%6 Year Degree
N6 Year Degree
%
2004 Female 234 132 56.4 152 65.0 156 66.7
2004 Male 148 73 49.3 94 63.5 96 64.9
2004 Unknown 1 0 0.0 0 0.0 0 0.0
2004 Total 383 205 53.5 246 64.2 252 65.8
2005 Female 206 108 52.4 126 61.2 127 61.7
2005 Male 145 63 43.4 83 57.2 86 59.3
2005 Unknown 1 0 0.0 0 0.0 0 0.0
2005 Total 352 171 48.6 209 59.4 213 60.5
2006 Female 213 113 53.1 137 64.3 141 66.2
2006 Male 160 66 41.3 82 51.3 87 54.4
2006 Unknown 3 0 0.0 0 0.0 0 0.0
2006 Total 376 179 47.6 219 58.2 228 60.6
2007 Female 205 115 56.1 134 65.4 135 65.9
2007 Male 153 65 42.5 83 54.2 92 60.1
2007 Unknown
2007 Total 358 180 50.3 217 60.6 227 63.4
2008 Female 209 120 57.4 140 67.0 141 67.5
2008 Male 164 80 48.8 104 63.4 108 65.9
2008 Unknown
2008 Total 373 200 53.6 244 65.4 249 66.8
2009 Female 235 132 56.2 160 68.1 163 69.4
2009 Male 169 74 43.8 98 58.0 101 59.8
2009 Unknown
2009 Total 404 206 51.0 258 63.9 264 65.4
2010 Female 241 130 53.9 151 62.7 153 63.5
2010 Male 176 81 46.0 109 61.9 114 64.8
2010 Unknown 1 0 0.0 0 0.0 0 0.0
2010 Total 418 211 50.5 260 62.2 267 63.9
2011 Female 281 150 53.4 164 58.4 166 59.1
2011 Male 181 79 43.6 101 55.8 105 58.0
2011 Unknown
2011 Total 462 229 49.6 265 57.4 271 58.7
61
Subdivision 7(7): Graduation Rates Tables

2012 Female 227 134 59.0 158 69.6
2012 Male 182 79 43.4 104 57.1
2012 Unknown
2012 Total 409 213 52.1 262 64.1
2013 Female 280 144 51.4
2013 Male 188 74 39.4
2013 Unknown
2013 Total 468 218 46.6
62
Subdivision 7(7): Graduation Rates Tables

University of Minnesota
IPEDS definition Graduation Rates
First-Time Full-Time New Entering Freshmen
Rochester Campus
Entry Year Gender Total4 Year Degree
N4 Year Degree
%5 Year Degree
N5 Year Degree
%6 Year Degree
N6 Year Degree
%
2009 Female 34.0 18 52.9 19 55.9 19 55.9
2009 Male 16.0 6 37.5 8 50.0 8 50.0
2009 Unknown
2009 Total 50.0 24 48.0 27 54.0 27 54.0
2010 Female 67.0 28 41.8 32 47.8 32 47.8
2010 Male 25.0 17 68.0 18 72.0 19 76.0
2010 Unknown
2010 Total 92.0 45 48.9 50 54.3 51 55.4
2011 Female 75.0 44 58.7 47 62.7 47 62.7
2011 Male 35.0 19 54.3 19 54.3 20 57.1
2011 Unknown 1.0 1 100.0 1 100.0 1 100.0
2011 Total 111.0 64 57.7 67 60.4 68 61.3
2012 Female 113.0 58 51.3 65 57.5
2012 Male 27.0 14 51.9 16 59.3
2012 Unknown
2012 Total 140.0 72 51.4 81 57.9
2013 Female 112.0 65 58.0
2013 Male 42.0 20 47.6
2013 Unknown 1.0 0 0.0
2013 Total 155.0 85 54.8
63
Subdivision 7(7): Graduation Rates Tables

University of Minnesota
IPEDS definition Graduation Rates
First-Time Full-Time New Entering Freshmen
Twin Cities Campus
Entry Year Gender Total4 Year Degree
N4 Year Degree
%5 Year Degree
N5 Year Degree
%6 Year Degree
N6 Year Degree
%
2004 Female 3,069 1,554 50.6 2,090 68.1 2,193 71.5
2004 Male 2,473 993 40.2 1,590 64.3 1,716 69.4
2004 Unknown 13 7 53.8 10 76.9 10 76.9
2004 Total 5,555 2,554 46.0 3,690 66.4 3,919 70.6
2005 Female 2,849 1,466 51.5 1,955 68.6 2,045 71.8
2005 Male 2,413 1,024 42.4 1,567 64.9 1,670 69.2
2005 Unknown 10 3 30.0 6 60.0 6 60.0
2005 Total 5,272 2,493 47.3 3,528 66.9 3,721 70.6
2006 Female 2,959 1,580 53.4 2,071 70.0 2,167 73.2
2006 Male 2,438 1,149 47.1 1,683 69.0 1,782 73.1
2006 Unknown 20 10 50.0 14 70.0 15 75.0
2006 Total 5,417 2,739 50.6 3,768 69.6 3,964 73.2
2007 Female 2,927 1,683 57.5 2,164 73.9 2,244 76.7
2007 Male 2,328 1,185 50.9 1,648 70.8 1,732 74.4
2007 Unknown
2007 Total 5,255 2,868 54.6 3,812 72.5 3,976 75.7
2008 Female 2,813 1,752 62.3 2,162 76.9 2,225 79.1
2008 Male 2,276 1,225 53.8 1,690 74.3 1,768 77.7
2008 Unknown
2008 Total 5,089 2,977 58.5 3,852 75.7 3,993 78.5
2009 Female 2,849 1,811 63.6 2,180 76.5 2,237 78.5
2009 Male 2,532 1,380 54.5 1,841 72.7 1,929 76.2
2009 Unknown
2009 Total 5,381 3,191 59.3 4,021 74.7 4,166 77.4
2010 Female 2,810 1,823 64.9 2,175 77.4 2,254 80.2
2010 Male 2,500 1,428 57.1 1,834 73.4 1,912 76.5
2010 Unknown
2010 Total 5,310 3,251 61.2 4,009 75.5 4,166 78.5
2011 Female 2,793 1,904 68.2 2,226 79.7 2,274 81.4
2011 Male 2,558 1,498 58.6 1,912 74.7 2,012 78.7
2011 Unknown
2011 Total 5,351 3,402 63.6 4,138 77.3 4,286 80.1
64
Subdivision 7(7): Graduation Rates Tables

2012 Female 2,791 1,964 70.4 2,237 80.2
2012 Male 2,706 1,633 60.3 2,034 75.2
2012 Unknown
2012 Total 5,497 3,597 65.4 4,271 77.7
2013 Female 2,908 2,118 72.8
2013 Male 2,622 1,662 63.4
2013 Unknown
2013 Total 5,530 3,780 68.4
65
Subdivision 7(7): Graduation Rates Tables

University of Minnesota
First Generation Students
IPEDS Definition
First-Time Full-Time New Entering Freshmen
Campus TERM Year
First Generation Headcount
Non First Generation Headcount
Total Headcount
Crookston Fall 2008 2008 35 203 238
Crookston Fall 2009 2009 60 187 247
Crookston Fall 2010 2010 67 183 250
Crookston Fall 2011 2011 66 173 239
Crookston Fall 2012 2012 75 137 212
Crookston Fall 2013 2013 62 118 180
Crookston Fall 2014 2014 65 75 140
Crookston Fall 2015 2015 94 113 207
Crookston Fall 2016 2016 NA NA NA
Duluth Fall 2008 2008 301 1,912 2,213
Duluth Fall 2009 2009 506 1,573 2,079
Duluth Fall 2010 2010 538 1,778 2,316
Duluth Fall 2011 2011 531 1,564 2,095
Duluth Fall 2012 2012 518 1,354 1,872
Duluth Fall 2013 2013 610 1,436 2,046
Duluth Fall 2014 2014 666 1,521 2,187
Duluth Fall 2015 2015 576 1,411 1,987
Duluth Fall 2016 2016 658 1,464 2,122
Morris Fall 2008 2008 42 331 373
Morris Fall 2009 2009 89 315 404
Morris Fall 2010 2010 64 354 418
Morris Fall 2011 2011 161 301 462
Morris Fall 2012 2012 166 243 409
Morris Fall 2013 2013 171 297 468
Morris Fall 2014 2014 173 238 411
Morris Fall 2015 2015 162 252 414
Morris Fall 2016 2016 153 222 375
Twin Cities Fall 2008 2008 1,653 3,436 5,089
Twin Cities Fall 2009 2009 1,530 3,851 5,381
Twin Cities Fall 2010 2010 1,474 3,836 5,310
Twin Cities Fall 2011 2011 1,389 3,962 5,351
Twin Cities Fall 2012 2012 1,375 4,122 5,497
Twin Cities Fall 2013 2013 1,303 4,227 5,530
Twin Cities Fall 2014 2014 1,315 4,205 5,520
Twin Cities Fall 2015 2015 1,319 4,437 5,756
Twin Cities Fall 2016 2016 1,288 4,570 5,858
66
Subdivision 7(8): Under-Represented Students Tables

Rochester Fall 2009 2009 11 39 50
Rochester Fall 2010 2010 26 66 92
Rochester Fall 2011 2011 34 77 111
Rochester Fall 2012 2012 63 77 140
Rochester Fall 2013 2013 67 88 155
Rochester Fall 2014 2014 55 57 112
Rochester Fall 2015 2015 23 65 88
Rochester Fall 2016 2016 44 101 145
67
Subdivision 7(8): Under-Represented Students Tables

University of Minnesota
Students Receiving a PELL Grant Their first Year
IPEDS Definition
First-Time Full-Time New Entering Freshmen
Campus TERM YearPell Eligible Headcount
Non-Pell Eligible
HeadcountTotal
Headcount
Crookston Fall 2008 2008 78 160 238
Crookston Fall 2009 2009 101 146 247
Crookston Fall 2010 2010 115 135 250
Crookston Fall 2011 2011 87 152 239
Crookston Fall 2012 2012 85 127 212
Crookston Fall 2013 2013 83 97 180
Crookston Fall 2014 2014 57 83 140
Crookston Fall 2015 2015 69 138 207
Crookston Fall 2016 2016 60 120 180
Duluth Fall 2008 2008 367 1,846 2,213
Duluth Fall 2009 2009 428 1,651 2,079
Duluth Fall 2010 2010 627 1,689 2,316
Duluth Fall 2011 2011 548 1,547 2,095
Duluth Fall 2012 2012 466 1,406 1,872
Duluth Fall 2013 2013 510 1,536 2,046
Duluth Fall 2014 2014 537 1,650 2,187
Duluth Fall 2015 2015 483 1,504 1,987
Duluth Fall 2016 2016 491 1,631 2,122
Morris Fall 2008 2008 100 273 373
Morris Fall 2009 2009 128 276 404
Morris Fall 2010 2010 145 273 418
Morris Fall 2011 2011 152 310 462
Morris Fall 2012 2012 137 272 409
Morris Fall 2013 2013 161 307 468
Morris Fall 2014 2014 136 275 411
Morris Fall 2015 2015 144 270 414
Morris Fall 2016 2016 130 245 375
Twin Cities Fall 2008 2008 952 4,137 5,089
Twin Cities Fall 2009 2009 1,079 4,302 5,381
Twin Cities Fall 2010 2010 1,248 4,062 5,310
Twin Cities Fall 2011 2011 1,198 4,153 5,351
Twin Cities Fall 2012 2012 1,170 4,327 5,497
Twin Cities Fall 2013 2013 1,150 4,380 5,530
Twin Cities Fall 2014 2014 1,129 4,391 5,520
Twin Cities Fall 2015 2015 1,076 4,680 5,756
Twin Cities Fall 2016 2016 1,053 4,805 5,858
68
Subdivision 7(8): Under-Represented Students Tables

Rochester Fall 2009 2009 10 40 50
Rochester Fall 2010 2010 28 64 92
Rochester Fall 2011 2011 33 78 111
Rochester Fall 2012 2012 39 101 140
Rochester Fall 2013 2013 39 116 155
Rochester Fall 2014 2014 36 76 112
Rochester Fall 2015 2015 34 54 88
Rochester Fall 2016 2016 54 91 145
69
Subdivision 7(8): Under-Represented Students Tables

University of MinnesotaStudent HeadcountsBy Race/Ethnicity
Fall 2013 Crookston Duluth Morris Rochester Twin Cities Total
Am. Indian 44 237 306 6 571 1164
Asian/Pacific 52 428 64 36 4627 5207
Black 128 258 50 35 2045 2516
Hispanic 41 194 47 15 1340 1637
Intl 129 302 179 3 6208 6821
White 1781 9338 1291 390 34443 47243
zUnknown 664 484 9 10 2292 3459
Total 2839 11241 1946 495 51526 68047
Fall 2014 Crookston Duluth Morris Rochester Twin Cities Total
Am. Indian 25 224 326 3 559 1137
Asian/Pacific 64 445 72 42 4706 5329
Black 139 271 36 36 2093 2575
Hispanic 55 219 51 13 1401 1739
Intl 82 295 176 3 6372 6928
White 1758 9045 1227 385 33817 46232
zUnknown 727 594 11 6 2199 3537
Total 2850 11093 1899 488 51147 67477
Fall 2015 Crookston Duluth Morris Rochester Twin Cities Total
Am. Indian 32 227 317 1 596 1173
Asian/Pacific 58 453 67 43 4767 5388
Black 137 301 41 30 2197 2706
Hispanic 71 235 55 13 1547 1921
Intl 118 281 193 3 6438 7033
White 1751 8822 1170 322 33116 45181
zUnknown 656 559 13 4 2017 3249
Total 2823 10878 1856 416 50678 66651
Fall 2016 Crookston Duluth Morris Rochester Twin Cities Total
Am. Indian 30 250 315 5 693 1293
Asian/Pacific 55 479 69 60 4974 5637
Black 129 299 43 35 2361 2867
Hispanic 66 241 55 15 1649 2026
Intl 104 319 201 3 6470 7097
White 1466 8527 1072 308 33213 44586
zUnknown 826 903 16 9 2220 3974
Total 2676 11018 1771 435 51580 67480
Fall 2017 Crookston Duluth Morris Rochester Twin Cities Total
Am. Indian 34 250 320 7 697 1308
Asian/Pacific 59 528 68 64 5181 5900
Black 131 306 41 37 2516 3031
70
Subdivision 7(11)-i Student Demographics Tables

Hispanic 76 269 55 22 1820 2242
Intl 100 295 188 2 6363 6948
White 1411 8619 944 328 32980 44282
zUnknown 1023 901 11 12 2291 4238
Total 2834 11168 1627 472 51848 67949
71
Subdivision 7(11)-i Student Demographics Tables

University of Minnesota System Wide
Student HeadcountsBy Gender
Fall 2013 Crookston Duluth Morris Rochester Twin Cities Total
Female 1389 5312 1071 350 26179 34301
Male 1213 5870 873 142 24710 32808
Unknown 237 59 2 3 637 938
Total 2839 11241 1946 495 51526 68047
Fall 2014 Crookston Duluth Morris Rochester Twin Cities Total
Female 1394 5196 1019 346 26171 34126
Male 1225 5863 874 139 24396 32497
Unknown 231 34 6 3 580 854
Total 2850 11093 1899 488 51147 67477
Fall 2015 Crookston Duluth Morris Rochester Twin Cities Total
Female 1366 5207 1009 297 26082 33961
Male 1238 5642 845 116 23964 31805
Unknown 219 29 2 3 632 885
Total 2823 10878 1856 416 50678 66651
Fall 2016 Crookston Duluth Morris Rochester Twin Cities Total
Female 1218 5185 987 319 26663 34372
Male 1104 5795 777 114 24190 31980
Unknown 354 38 7 2 727 1128
Total 2676 11018 1771 435 51580 67480
Fall 2017 Crookston Duluth Morris Rochester Twin Cities Total
Female 1243 5257 914 356 27217 34987
Male 1128 5735 709 115 23888 31575
Unknown 463 176 4 1 743 1387
Total 2834 11168 1627 472 51848 67949
72
Subdivision 7(11)-i Student Demographics Tables
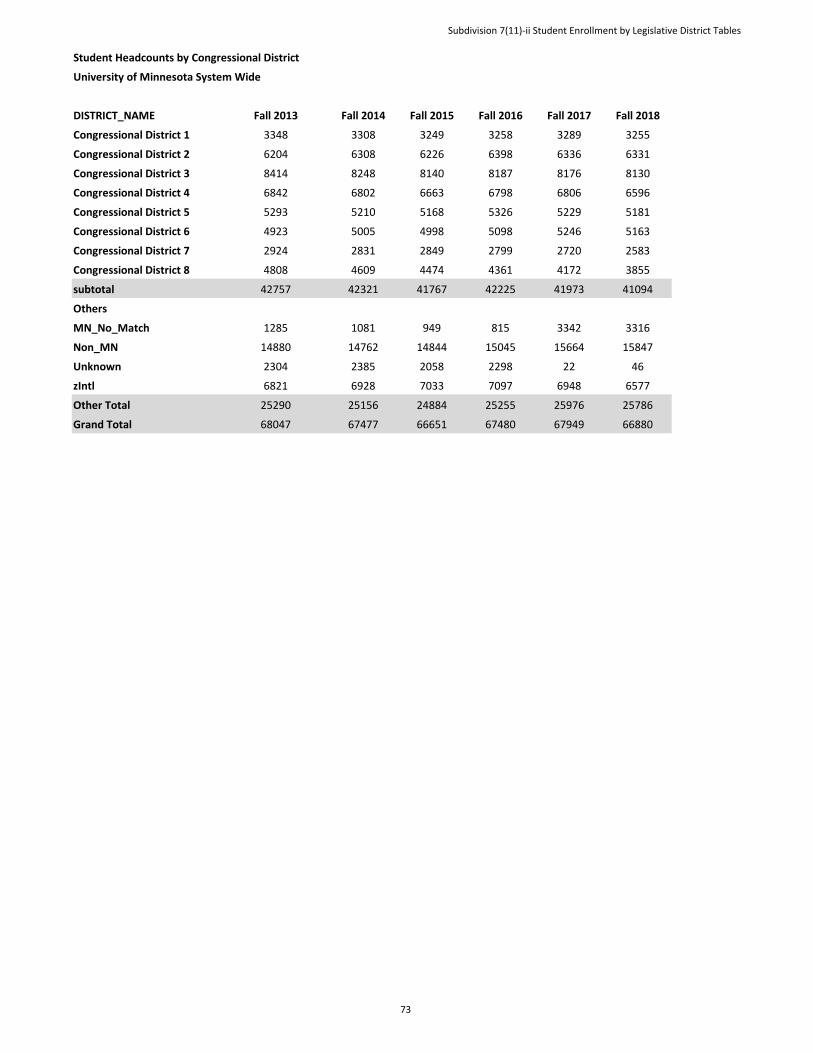
Student Headcounts by Congressional District
University of Minnesota System Wide
DISTRICT_NAME Fall 2013 Fall 2014 Fall 2015 Fall 2016 Fall 2017 Fall 2018
Congressional District 1 3348 3308 3249 3258 3289 3255
Congressional District 2 6204 6308 6226 6398 6336 6331
Congressional District 3 8414 8248 8140 8187 8176 8130
Congressional District 4 6842 6802 6663 6798 6806 6596
Congressional District 5 5293 5210 5168 5326 5229 5181
Congressional District 6 4923 5005 4998 5098 5246 5163
Congressional District 7 2924 2831 2849 2799 2720 2583
Congressional District 8 4808 4609 4474 4361 4172 3855
subtotal 42757 42321 41767 42225 41973 41094
Others
MN_No_Match 1285 1081 949 815 3342 3316
Non_MN 14880 14762 14844 15045 15664 15847
Unknown 2304 2385 2058 2298 22 46
zIntl 6821 6928 7033 7097 6948 6577
Other Total 25290 25156 24884 25255 25976 25786
Grand Total 68047 67477 66651 67480 67949 66880
73
Subdivision 7(11)-ii Student Enrollment by Legislative District Tables

Student Headcounts by Senate District
University of Minnesota System Wide
DISTRICT_NAME Fall 2013 Fall 2014 Fall 2015 Fall 2016 Fall 2017 Fall 2018
Senate District 1 484 487 492 469 485 419
Senate District 2 302 288 313 316 296 268
Senate District 3 780 754 739 719 695 598
Senate District 4 261 245 252 251 250 228
Senate District 5 457 491 483 442 422 371
Senate District 6 478 464 455 423 381 359
Senate District 7 1132 1061 1023 1008 948 810
Senate District 8 402 372 362 370 362 337
Senate District 9 301 306 279 263 256 278
Senate District 10 425 398 365 388 382 385
Senate District 11 563 554 545 551 496 486
Senate District 12 365 332 334 321 304 298
Senate District 13 405 424 436 450 434 447
Senate District 14 449 413 392 402 396 391
Senate District 15 351 341 329 317 310 314
Senate District 16 312 308 287 305 295 289
Senate District 17 367 354 373 359 342 356
Senate District 18 428 412 428 419 409 412
Senate District 19 306 298 301 303 329 321
Senate District 20 544 577 564 551 606 587
Senate District 21 429 415 409 395 380 392
Senate District 22 212 213 208 207 192 194
Senate District 23 262 247 247 233 238 218
Senate District 24 360 360 358 367 362 365
Senate District 25 640 633 627 631 643 648
Senate District 26 717 718 691 702 696 688
Senate District 27 307 279 268 247 251 269
Senate District 28 302 285 289 291 265 255
Senate District 29 510 547 517 554 556 542
Senate District 30 555 600 614 654 662 672
Senate District 31 662 643 627 645 681 672
Senate District 32 528 476 471 457 480 465
Senate District 33 1123 1128 1146 1186 1143 1092
Senate District 34 1132 1120 1117 1124 1120 1134
Senate District 35 694 675 680 680 691 671
Senate District 36 922 846 812 859 863 844
Senate District 37 683 704 713 724 757 752
Senate District 38 907 903 916 898 886 843
Senate District 39 851 869 860 875 860 826
Senate District 40 543 524 539 581 585 586
Senate District 41 720 724 689 692 707 700
Senate District 42 1008 927 895 882 860 861
Senate District 43 764 746 701 721 709 665
74
Subdivision 7(11)-ii Student Enrollment by Legislative District Tables

Senate District 44 1118 1124 1075 1038 1058 1042
Senate District 45 699 691 668 667 669 646
Senate District 46 747 711 699 708 691 689
Senate District 47 786 804 832 816 893 911
Senate District 48 1418 1356 1321 1288 1260 1243
Senate District 49 1024 989 1012 1008 978 1033
Senate District 50 558 547 551 545 579 562
Senate District 51 1060 1061 1039 1045 975 976
Senate District 52 717 733 700 688 687 705
Senate District 53 1092 1159 1207 1252 1325 1255
Senate District 54 564 556 610 616 630 629
Senate District 55 659 709 695 863 873 826
Senate District 56 893 873 829 866 831 849
Senate District 57 810 843 855 829 848 810
Senate District 58 818 857 828 842 837 874
Senate District 59 501 480 491 510 496 491
Senate District 60 610 644 644 643 602 564
Senate District 61 747 728 720 744 748 772
Senate District 62 638 628 605 644 618 621
Senate District 63 666 665 656 701 688 647
Senate District 64 856 838 832 862 868 830
Senate District 65 611 618 604 603 581 578
Senate District 66 675 689 657 670 690 692
Senate District 67 549 558 496 550 565 541
subtotal 42757 42321 41767 42225 41973 41094
Others
zMN_No_Match 1285 1081 949 815 3342 3316
zNon_MN 14880 14762 14844 15045 15664 15847
zUnknown 2304 2385 2058 2298 22 46
zIntl 6821 6928 7033 7097 6948 6577
Other Total 25290 25156 24884 25255 25976 25786
Grand Total 68047 67477 66651 67480 67949 66880
75
Subdivision 7(11)-ii Student Enrollment by Legislative District Tables

Student Headcounts by House District
University of Minnesota System Wide
DISTRICT_NAME Fall 2013 Fall 2014 Fall 2015 Fall 2016 Fall 2017 Fall 2018
House District 1A 214 220 212 217 229 193
House District 1B 269 267 280 253 255 226
House District 2A 156 148 160 163 144 127
House District 2B 147 140 153 154 153 141
House District 3A 236 227 214 213 216 181
House District 3B 543 527 524 506 480 417
House District 4A 125 119 115 115 105 103
House District 4B 136 125 137 136 145 125
House District 5A 171 185 176 158 151 144
House District 5B 287 307 308 283 271 227
House District 6A 210 184 194 180 157 151
House District 6B 268 279 261 243 224 208
House District 7A 687 624 593 579 541 476
House District 7B 445 437 430 428 407 334
House District 8A 202 173 169 168 159 149
House District 8B 200 199 194 201 203 187
House District 9A 143 143 131 126 117 114
House District 9B 158 164 148 138 138 164
House District 10A 234 209 204 218 215 217
House District 10B 190 189 161 170 168 167
House District 11A 383 387 372 377 338 325
House District 11B 180 166 172 174 158 162
House District 12A 204 176 160 152 150 151
House District 12B 160 155 174 169 154 147
House District 13A 175 180 185 199 189 184
House District 13B 230 244 250 250 245 262
House District 14A 243 229 225 228 221 222
House District 14B 206 184 167 175 175 168
House District 15A 136 129 123 116 105 102
House District 15B 215 212 206 201 205 212
House District 16A 130 136 123 129 128 126
House District 16B 182 172 164 176 167 163
House District 17A 170 160 162 150 135 147
House District 17B 197 194 210 208 207 209
House District 18A 219 204 211 201 191 197
House District 18B 209 208 216 218 218 214
House District 19A 189 184 193 190 198 198
House District 19B 117 113 108 113 131 123
House District 20A 283 312 308 318 346 329
House District 20B 260 264 256 234 260 258
House District 21A 229 228 210 208 180 193
House District 21B 200 187 198 187 200 199
House District 22A 105 100 95 95 92 98
76
Subdivision 7(11)-ii Student Enrollment by Legislative District Tables

House District 22B 107 113 113 112 100 96
House District 23A 134 125 120 103 104 89
House District 23B 128 122 127 130 134 130
House District 24A 187 191 195 190 204 188
House District 24B 173 169 162 176 158 177
House District 25A 258 261 256 258 263 274
House District 25B 382 371 370 373 379 374
House District 26A 365 362 352 357 362 365
House District 26B 352 356 339 345 333 323
House District 27A 140 136 134 128 125 126
House District 27B 167 143 134 119 127 143
House District 28A 145 133 130 131 125 114
House District 28B 157 152 159 160 140 141
House District 29A 245 263 255 259 266 252
House District 29B 265 284 262 295 290 290
House District 30A 284 294 295 301 306 313
House District 30B 271 306 319 352 356 359
House District 31A 241 240 235 237 251 256
House District 31B 421 402 392 408 430 416
House District 32A 224 200 198 191 203 192
House District 32B 303 277 273 266 277 273
House District 33A 526 516 524 552 535 528
House District 33B 597 611 622 633 608 564
House District 34A 481 496 508 519 523 536
House District 34B 651 624 609 605 597 598
House District 35A 321 319 329 317 330 320
House District 35B 373 356 351 363 361 351
House District 36A 503 448 401 399 383 360
House District 36B 419 398 411 460 480 484
House District 37A 353 346 333 334 330 325
House District 37B 330 359 380 389 427 427
House District 38A 407 416 446 423 428 412
House District 38B 500 488 469 475 459 431
House District 39A 341 344 322 329 332 306
House District 39B 511 525 538 546 528 521
House District 40A 236 234 241 268 281 285
House District 40B 307 290 298 313 304 302
House District 41A 352 354 343 343 346 342
House District 41B 368 370 346 349 361 358
House District 42A 467 426 416 410 408 404
House District 42B 541 501 478 471 452 457
House District 43A 397 375 366 376 363 341
House District 43B 368 370 336 345 346 323
House District 44A 604 617 596 585 617 633
House District 44B 514 507 479 453 441 409
House District 45A 337 330 317 316 326 318
House District 45B 362 362 351 350 343 328
77
Subdivision 7(11)-ii Student Enrollment by Legislative District Tables

House District 46A 398 387 381 374 376 365
House District 46B 349 325 318 334 315 324
House District 47A 332 329 331 310 360 353
House District 47B 454 475 501 506 533 558
House District 48A 679 656 625 608 589 558
House District 48B 739 701 696 680 671 685
House District 49A 461 456 488 491 475 495
House District 49B 562 533 524 517 503 539
House District 50A 237 229 238 231 244 230
House District 50B 321 319 314 314 335 332
House District 51A 333 324 328 327 304 301
House District 51B 728 737 711 718 671 675
House District 52A 302 321 306 283 292 306
House District 52B 414 412 394 405 395 399
House District 53A 599 643 632 648 684 655
House District 53B 493 517 575 604 641 600
House District 54A 268 270 286 293 305 314
House District 54B 297 286 324 323 326 315
House District 55A 259 293 292 423 411 388
House District 55B 400 416 403 440 462 438
House District 56A 441 446 431 473 454 450
House District 56B 451 428 397 393 376 399
House District 57A 476 487 496 466 474 451
House District 57B 334 356 359 363 373 359
House District 58A 503 518 502 508 517 537
House District 58B 315 339 326 335 319 337
House District 59A 212 203 207 212 206 201
House District 59B 289 276 284 298 290 290
House District 60A 325 326 324 311 296 278
House District 60B 286 318 320 332 306 286
House District 61A 364 351 338 348 337 343
House District 61B 383 376 382 397 412 430
House District 62A 288 290 275 288 280 275
House District 62B 351 338 330 356 338 346
House District 63A 334 348 333 374 350 309
House District 63B 332 317 323 326 338 338
House District 64A 443 440 422 428 421 410
House District 64B 413 398 409 434 447 420
House District 65A 351 348 335 319 327 319
House District 65B 259 269 268 284 254 259
House District 66A 440 442 405 405 407 395
House District 66B 235 247 253 265 283 296
House District 67A 276 278 246 274 282 271
House District 67B 273 280 250 276 284 271
subtotal 42757 42321 41767 42225 41973 41094
Others
MN_No_Match 1285 1081 949 815 3342 3316
78
Subdivision 7(11)-ii Student Enrollment by Legislative District Tables

Non_MN 14880 14762 14844 15045 15664 15847
Unknown 2304 2385 2058 2298 22 46
zIntl 6821 6928 7033 7097 6948 6577
Other Total 25290 25156 24884 25255 25976 25786
Grand Total 68047 67477 66651 67480 67949 66880
79
Subdivision 7(11)-ii Student Enrollment by Legislative District Tables

University of Minnesota System WideEmployee HeadcountsBy EthnicityFall 2013 Crookston Duluth Morris Rochester Twin Cities Total
American Indian/Alaska Native 3 46 9 1 113 172Asian/Pacific Islander 6 69 13 7 1211 1306Black, non-Hispanic 6 24 2 3 893 928Hispanic 2 22 9 1 351 385Nonresident Alien 4 34 4 4 432 478Race/ethnicity unknown 1 10 1 2 110 124White, non-Hispanic 259 1489 393 86 13972 16199Total 281 1694 431 104 17082 19592
Fall 2014 Crookston Duluth Morris Rochester Twin Cities Total
American Indian/Alaska Native 40 8 1 113 162Asian/Pacific Islander 4 71 12 6 1240 1333Black, non-Hispanic 6 21 3 3 916 949Hispanic 2 21 10 339 372Nonresident Alien 7 35 4 4 443 493Race/ethnicity unknown 4 12 1 3 293 313White, non-Hispanic 250 1439 392 83 13847 16011Total 273 1639 430 100 17191 19633
Fall 2015 Crookston Duluth Morris Rochester Twin Cities Total
American Indian/Alaska Native 2 40 11 1 137 191Asian/Pacific Islander 8 74 13 6 1295 1396Black, non-Hispanic 8 19 4 5 953 989Hispanic 6 19 13 360 398Nonresident Alien 4 29 6 3 442 484Race/ethnicity unknown 5 15 6 2 367 395White, non-Hispanic 274 1439 385 76 13725 15899Total 307 1635 438 93 17279 19752
Fall 2016 Crookston Duluth Morris Rochester Twin Cities Total
American Indian/Alaska Native 1 43 14 1 148 207Asian/Pacific Islander 7 81 11 7 1351 1457Black, non-Hispanic 7 22 5 3 1007 1044Hispanic 5 24 12 385 426Nonresident Alien 6 33 7 2 455 503Race/ethnicity unknown 4 16 5 2 416 443White, non-Hispanic 275 1450 380 75 13799 15979Total 305 1669 434 90 17561 20059
Fall 2017 Crookston Duluth Morris Rochester Twin Cities Total
American Indian/Alaska Native 2 40 16 161 219Asian/Pacific Islander 8 82 8 7 1423 1528Black, non-Hispanic 7 23 5 2 1065 1102
80
Subdivision 7(11)-v Employee Headcounts and Demographics Tables

Hispanic 7 22 13 427 469Nonresident Alien 6 32 8 2 474 522Race/ethnicity unknown 3 2 1 1 272 279White, non-Hispanic 283 1457 379 76 14075 16270Total 316 1658 430 88 17897 20389
81
Subdivision 7(11)-v Employee Headcounts and Demographics Tables

University of Minnesota System Wide Employee HeadcountsBy Gender
Fall 2013 Crookston Duluth Morris Rochester Twin Cities Total
Female 144 880 235 64 9338 10661Male 137 814 196 40 7744 8931Total 281 1694 431 104 17082 19592
Fall 2014 Crookston Duluth Morris Rochester Twin Cities Total
Female 136 855 235 65 9400 10691Male 137 784 195 35 7791 8942Total 273 1639 430 100 17191 19633
Fall 2015 Crookston Duluth Morris Rochester Twin Cities Total
Female 155 848 235 55 9467 10760Male 152 787 203 38 7812 8992Total 307 1635 438 93 17279 19752
Fall 2016 Crookston Duluth Morris Rochester Twin Cities Total
Female 155 885 232 50 9686 11008Male 150 784 202 40 7875 9051Total 305 1669 434 90 17561 20059
Fall 2017 Crookston Duluth Morris Rochester Twin Cities Total
Female 175 870 235 50 9856 11186Male 141 788 195 38 8041 9203Total 316 1658 430 88 17897 20389
82
Subdivision 7(11)-v Employee Headcounts and Demographics Tables