university of michigan comprehensive cancer center patient
TRANSCRIPT

University Of MichiganComprehensive Cancer Center
Patient Flow AnalysisApril 30, 1999
Summer ColeEun-Jee ChungKatharine Yu
Industrial & Operations Engineering 481

Table of Contents
1.0 Executive Summary 2
2.0 Introduction and Background 62.1 Project Purpose 62.2 Goals/Objectives 62.3 Scope 62.4 Background Affecting Project 72.5 Limitations 7
3.0 Project Plan 8
4.0 Project Team 84.1 Support Team 8
5.0 Current Process Flow Charts 9
6.0 Sample Data Findings 9A. Late vs. EarlyArrivals 9B. Value Added Time 10C. Non Value Added Time 11
6.1 All Data Findings 12A. Room Utilization 12B. Value Added Room Utilization 13C. First Patient Analysis 14D. Physician Time 14
7.0 Conclusions 15
8.0 Recommendations 16
9.0 Continuous Improvement 17
10.0 Appendix A 18
11.0 Appendix B: Team 2Appendix C: Team 3Appendix D: Team 5
1
0
Team5-PatientFlowChart
7)
0
Encounter1

1.0 Executive Summary
The University of Michigan’s Comprehensive Cancer Center is known for meeting thehighest standards in patient care, education, cancer research and community outreach.In recent years the Comprehensive Cancer Center’s patient number has grown immenselymaking it difficult for each clinic to schedule patients efficiently. A team from theProgram and Operations Analysis Department was assigned to study Teams 2,3,and 5 ofthe Comprehensive Cancer Center and to analyze patient flow and room utilization.Another Group was assigned to Teams 1,4 and 6. The purpose of this report is todescribe the processes, analyze data, and provide recommendations in order to increaseefficient exam room utilization and to decrease patient wait times.
Scheduling and Patient Arrival
Overall, for all three teams, around 80% of the patients arrive early within a 20-30 minutetime frame of their scheduled appointment time, and 20% of the patients arrive latewithin a 15-30 minute time frame of a scheduled appointment time. Even though thepercentage of late arrivals is low, the number is very significant. Whenever a patientarrives late to his/her scheduled appointment, the current schedule must be modified inorder to accommodate for the loss of time. This results in patients being pushed to a latertime, thus increasing the number of delays in the day.
Even though all the patients are scheduled to be seen at certain times, patients are seen ona first come, first serve basis. Patients realize that the earlier they arrive, the earlier theywill be seen. This process disrupts the flow of patients that arrive during their scheduledappointments pushing their initial start times later.
The definition of an appointment time also causes difficulties in when a patient arrives tothe clinic. The patient perceives the appointment time as when he/she must arrive to theclinic whereas, the doctors believe the appointment time to be the time that they arescheduled to see the patient. When a patient arrives “on time,” he/she is actually late tosee the physician. Physicians end up seeing patients later than scheduled and if they fallbehind, wait times for the patients increase.
The three problems indicated: patients checking in early, the liberal admittance policy,and the definition of an appointment time, form a major problem in the patient flow. Thedata indicates that, on average, patients spend between 15-30 minutes during the check-inprocess. The process includes checking in, filling out paperwork, getting vitals, andwaiting for an exam room. A patient who checks in on time will fall behind in theschedule about 15 minutes.
2

Provider and Wait Times
Provider times varied between patient type for each clinic. Value added time was higherfor new patients than for return patients in all three clinics. Wait times accounted foraround 70% of a patient’s total visit. Overall, the physician’s time with a patient, for allthree teams, was an average of 15 minutes. This number matches with the template givenfor each clinic, but is a small fraction of the total visit time.
Room Utilization
Room utilization is a percentage that describes how effectively the examination rooms arebeing utilized. Room utilization was calculated by using the following formula:
Room Utilization = Sum of all patients time in exam room for a particular physician’ssessionl{(minutes physician has room scheduled)*(number of rooms allocated forphysician)]
Percentages over 100% mean that a physician is using more rooms than they are allocatedfor that session. The goal of the CCC is to have exam room utilization greater than 60%.
The data shows that team 3 had a wide range of room utilization between 17% and 62%while the percent of value added room utilization was almost less than half the amount ofroom utilization for each doctor. While most of team 5’s room utilization percentages arebelow 60%, a few of team 2’s room utilizations are aver 100%. Teams 2 and 5 shareexam rooms and the data indicates that team 2 is using some of team 5’s exam rooms fortheir patients.
Most of a patient’s visit is spent in the exam room for all the various activities that thepatient encounters. During their visit, the consult rooms remain unused and empty formost of the day. Activities that should be performed in the consult rooms are insteadperformed in the exam rooms preventing other patients from using them for activities thatrequire an exam room.
Recommendations
Some suggestions for improvement for the University of Michigan’s ComprehensiveCancer Center Teams 2,3,and 5 include:
• Review patient scheduling and implement a buffer of 15 minutes to the appointmenttime given to the patient to account for the check-in process.
• Ensure that all CCC team members understand the definition of an appointment time.• Condition patients to arrive on time by admitting them according to their appointment
times and not on a first come, first serve basis.• Use exam rooms properly and only for their required uses
3

• Use consult rooms to their full effects• Use only the rooms appointed to each team on any given day• Implement another study for New Patient Data due to the low number of new patients
that were seen during the time of this study• Review the clinics again for continuous improvement after the recommendations of
this study has been implemented
By adding 15 minutes to the patient’s scheduled appointment times, patients will comeprior to their scheduled time with the physician. This allows the patients to go throughthe check-in process and allows the doctors to see their patients on time. The 15 minutebuffer will only be added to the patient appointment cards while the doctor’s appointmentschedule will remain the same.
If patients are conditioned to be seen only at their appointed times, the schedule flow willrun smoother with patients being ready to see their physicians at their appointed times.
By having a strict policy on the rooms that are available to each clinic and by using theconsult rooms for proper activities, the wait times to be placed into an exam room willdecrease. Also, by placing patients into the consult rooms when exam room activities arefinished will free up the exam rooms for other patients.
On-going Recommendations
• Perform monthly and/or quarterly checks regarding room utilization and patient flows• Reallocate exam rooms when necessary by analyzing the collected data• Investigate a push button system to accurately record data• Provide more extra-curricular activities for the patients to pass the time more quickly
Monthly checks consist of data collection from 5 to 10 return visits and just a few newpatients. Quarterly checks should represent a larger sample size, such as 15 to 20 returnvisits and 5-10 new patients. This data can be collected in the same manner as this studywas performed.
By implementing checks, the clinic can evaluate and compare last month’s, or quarter’s,data to the present month or quarter. This is a way of observing any progress that is beingmade within the clinic. Also, by performing room utilization checks, exam rooms can bereallocated based on the data.
A push button system will provide more accurate data for the data collection. When aprovider enters an exam room, they push the button and the timer starts. Upon leavingthe room, the provider pushes the button again to stop the timer. This reduces errors indata collection if used correctly.
Extra-curricular activities, other than magazines, can help reduce patient complaints. Ifthe patient is not thinking about waiting, the actual wait time to the patient will seem less.
4

Crossword puzzle books, hand held electronic games, a checker board, interactive gamesbetween patients, etc. are a few suggestions to keep the patient from realizing the amountof time that they are waiting.
5

2.0 Introduction and Background
2.1 Project Purpose
In response to the Comprehensive Cancer Center, the purpose of this project is to analyzeTeams 2,3, and 5 performance in order to make suggestions for their continuousimprovement. This includes the balancing of efficient exam room scheduling and todecrease patient wait time. The focus of this project is to document room utilization andpatient flow. This information will allow the teams to make decisions regarding resourceallocations.
2.2 Project Goals/Objectives
This study was aimed for improving examination room utilization at the ComprehensiveCancer Center, Team’s 2,3,and 5. Time durations with the patient by all providers(physicians, residents, fellows, nurse practitioners, nurse assistants, nurses, clerks, andmedical assistants) were collected.
The project’s goal is to examine patient flow, efficient exam room utilization, and overallprocess improvements which includes:
• Increase room utilization• Decrease patient wait time by reducing non-value added time• Increase value-added time within the exam room
Through this study, recommendations will be given to the University Of MichiganComprehensive Cancer Center in order to improve the existing methods and the qualityof each patient’s stay. In the future, we also hope to develop a continuous monitoringsystem for internal performance evaluations in order to incorporate a “BalancedScorecard.”
2.3 Scope
This project does not include an analysis of Teams 1,4,6, and Infusion. Another groupwas assigned to evaluate Teams 1,4, and 6. Infusion is outside the scope of a visit.Therefore the data collected is only based on a limited number of variables, whichincludes:• Activities a patient encounters from check-in to check-out• Early and late arrivals are calculated for wait times• Omitting treatments such as infusion, lab tests, and blood draws that are performed
outside of the exam room
6

2.4 Background Affecting Project
The Cancer Center was established in 1986 and is ranked among the best in cancerprevention diagnosis, treatment, research, and education. “The National Cancer Institutehas selected University Of Michigan as one of only a small number of “comprehensive”centers.” Comprehensive means that the cancer center receives federal funding andmeets the high standards in patient care and education, cancer research and communityoutreach.
The University Of Michigan Comprehensive Cancer Center is incorporated of sevenTeams, one of which includes Infusion. These health care teams are led by highly trainedprofessionals at the Medical Center to bring together in one setting, methods to developcomplete diagnosis and treatment plans.
The project will include both staff and patients from Teams 2, 3, and 5. Factors such astime, patient and staff compliance with the data collection form, number of exam rooms,patient scheduling, and number of staff will affect the outcome of the results of this study.Physicians’ individual scheduling formats vary, but in general, new patients are scheduledevery half an hour and returning patients are scheduled every fifteen minutes. Schedulingpractices are reviewed in the data to determine their effect on patient flow.
All teams have a limited amount of staff and space but an unlimited amount of patients.The growing volume of cancer patients affects the amount of people the center can treat.A key issue is decreasing patient wait times and thus, decreasing their overall visit timeby effectively using the staff and exam rooms.
2.5 Limitations
Any data collection method has limitations. These limitations required other techniquesto be used in conjunction with the collection. The limitations for this project follow:
Data Collection Forms:
• Patients are responsible for the data collection forms and may not know all theinformation that is needed such as provider, room number, times, and activity.
• Forms may be only partially filled out due to the nature of the patient’s condition.• Check-in and Check-out clerks may not have filled in the correct information or
distributed the collection forms to the patients.
Clinic Environment:
• Patients that had more than one appointment during the time of study may not havewanted to fill in the form again.
• Utilization is difficult to determine when teams share exam rooms.
7

Add-on, “Sick”, and New Patients:
• New patients are not familiar with clinic scheduling set-up.• Add-on patients may not have received a data collection form.• Some sick patients did not want to fill out the form.
Sample Size:
• Two weeks worth of data collection limits the sample size in some clinics.• On some instances, the sample size per physician was too small to draw conclusions.
3.0 Project Plan
In this study, a data collection form was used in order to collect relevant information suchas patient name, appointment time, physician name, type of patient, start and end timesfor activities such as check-in, check-out, and various examinations with a provider. Thepatients completed the time study sheets. This data was collected and processed everyweek in order to get an understanding of how each team’s patient flow process works.The schedules were used in tandem with the sample data to extrapolate a completesession’s room utilization. Also, along with collecting new data, old data was evaluatedas well. By observing, interviewing, collecting data, and using analytical software theexpected impact will be changes in quality, service, organization, and the systems.
4.0 Project Team and Experience
Client Manager: Chen “Ely” Kuo-Vasher, Clinical Department Associate(representing Comprehensive Cancer Center’s Operations Lead Team)
Project Team: Summer Cole, Katharine Yu, Eun-Jee ChungProject Coordinator: Mary Duck, Senior Management Engineer
4.1 Support Required From Operating Entity
Team 2: Barb Wilson, Clinic CoordinatorKelly Ziehler, Leah Schults, Team NursesDr. Bruce Redman, Physician Lead
Team 3: Tammy Derry, Clinic CoordinatorJanet Dumas, Team NurseDr. William Ensminger, Physician Lead
Team 5: Mary Jo Rice, Clinic CoordinatorRuta Lacis, Team NurseDr. Alfred Chang, Physician Lead
Operations Team: Marcy Bohm Waldinger, Administrative Director
8
Janet Goldberg, Nurse ManagerDr. Larry Baker, Deputy Director/Associate Director for Clinical ResearchSusan MrGuire and Kathleen Martin
The support provided by the three teams included information about how each clinicoperates and the processes used for patient care. They aided in the project by completingforms needed for the time study. Other types of support that were used are managementsupport, data collection, software, and prior studies.
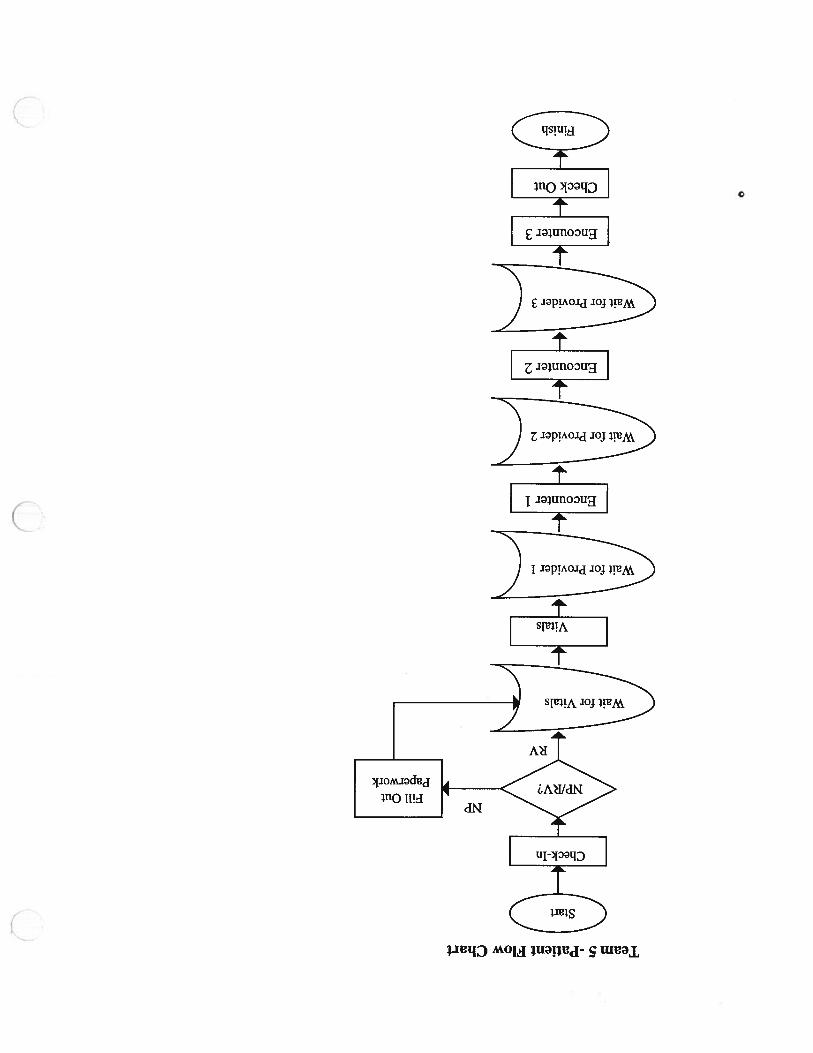
5.0 Current Process Flow Charts
A general patient flow consists of several steps. A chart can be found for each teamwithin their separate reports.
6.0 Sample Data Findings
The patient collected sample data was captured from about 25% of the patients. This dataallows for a review of the patient flow through a visit. Key elements can be derived fromthe patient flow data. The results are presented in this section in team summaries. Eachteam is evaluated separately with data stratified to the physician level. The elementsreviewed here include:
• Late vs. Early Arrivals• % Value Added Time
Wait Time
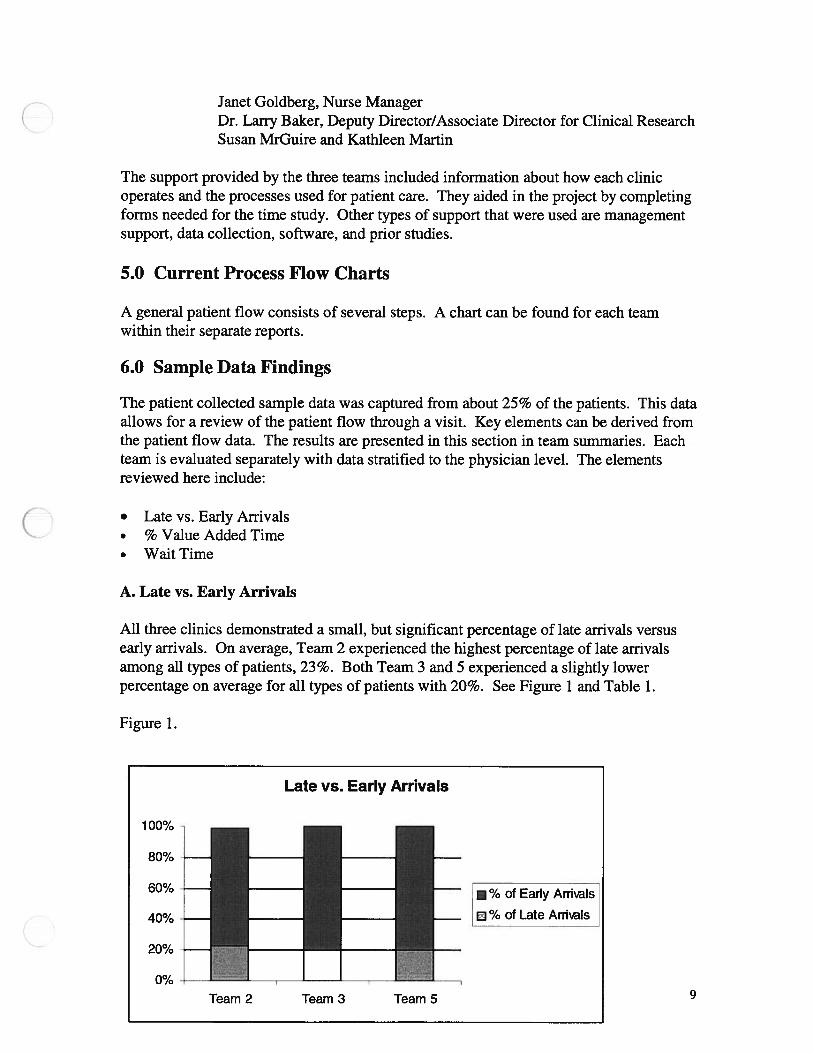
A. Late vs. Early Arrivals
All three clinics demonstrated a small, but significant percentage of late arrivals versusearly arrivals. On average, Team 2 experienced the highest percentage of late arrivalsamong all types of patients, 23%. Both Team 3 and 5 experienced a slightly lowerpercentage on average for all types of patients with 20%. See Figure 1 and Table 1.
Figure 1.
100%
Late vs. Early Arrivals
80% —
60% -
40% -
20% -
(O/1.1/0 -
— %ofEar1yArriaIs— %ofLateArth’aIs
Team 2 Team 3 Team 5 9

Table 1.Team 2 Team 3 Team 5
% of Late Arrivals 23% 20% 20%% of Early Arrivals 76% 80% 80%
Table 1 a is a summary table that displays standard deviations as well as averages for lateand early arrivals. It also distinguishes between new patients and return visit patients. Asthe data shows, 94% of Team 2’s new patients showed up early. On average, thesepatients arrived 21 minutes early.
Table la.Early vs. Late Statistics for New and Return
PatientsTeam 2 Team 3 Team 5
NP RV NP RV NP RVTotal # Patients 35 220 42 173 28 97# Early Arrivals 33 162 33 138 24 76
Avg. Minutes Early 21 17 28 28 26 18Std. Deviation of Minutes Early 17 13 17 46 56 15
% Early Arrivals 94% 74% 79% 80% 86% 78%# Late Arrivals 2 58 9 35 4 21
Avg. Minutes Late 16 16 15 16 18 28Std. Deviation of Minutes Late 13 1 7 13 15 15 34
% Late Arrivals 6% 26% 21 % 20% 14% 22%
B. Value Added Time
Value-added time is the time in which a patient is experiencing an activity with anyprovider or team member. Any staff member that provides a service to the patient isconsidered to be adding value to the patient’s visit. The goal of the CCC is to maintain60% value-added time with the patient. However, non of the three teams met this goal.Team 2 achieved the highest value-added time of 35%. The other two followed closelybehind with 33% for Team 3 and 32% for Team 5. Table 2 shows the average number ofminutes for each team regarding total clinic time, value added time, and non-value addedtime for all patients.
10
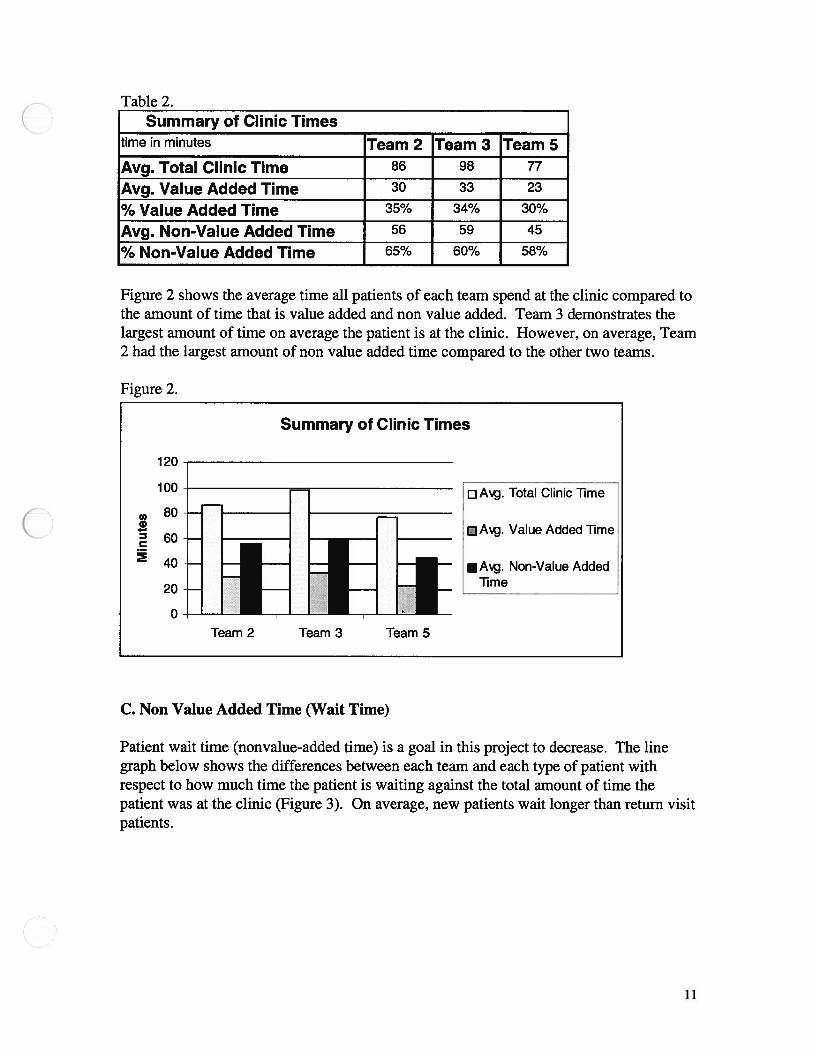
Table 2.Summary of Clinic Times
time in minutes Team 2 Team 3 Team 5Avg.TotalClinicTime 86 98 77
Avg. Value Added Time 30 33 23
% Value Added Time 35% 34% 30%
Avg. Non-Value Added Time 56 59 45
% Non-Value Added Time 65% 60% 58%
Figure 2 shows the average time all patients of each team spend at the clinic compared tothe amount of time that is value added and non value added. Team 3 demonstrates thelargest amount of time on average the patient is at the clinic. However, on average, Team2 had the largest amount of non value added time compared to the other two teams.
Figure 2.
C. Non Value Added Time (Wait Time)
Patient wait time (nonvalue-added time) is a goal in this project to decrease. The linegraph below shows the differences between each team and each type of patient withrespect to how much time the patient is waiting against the total amount of time thepatient was at the clinic (Figure 3). On average, new patients wait longer than return visitpatients.
120
Summary of Clinic Times
0a)
C
100
80
60
40
20
0
DAg. Total Clinic lime
Value Added Time
Non-Value AddedTime
Team 2 Team 3 Team 5
11
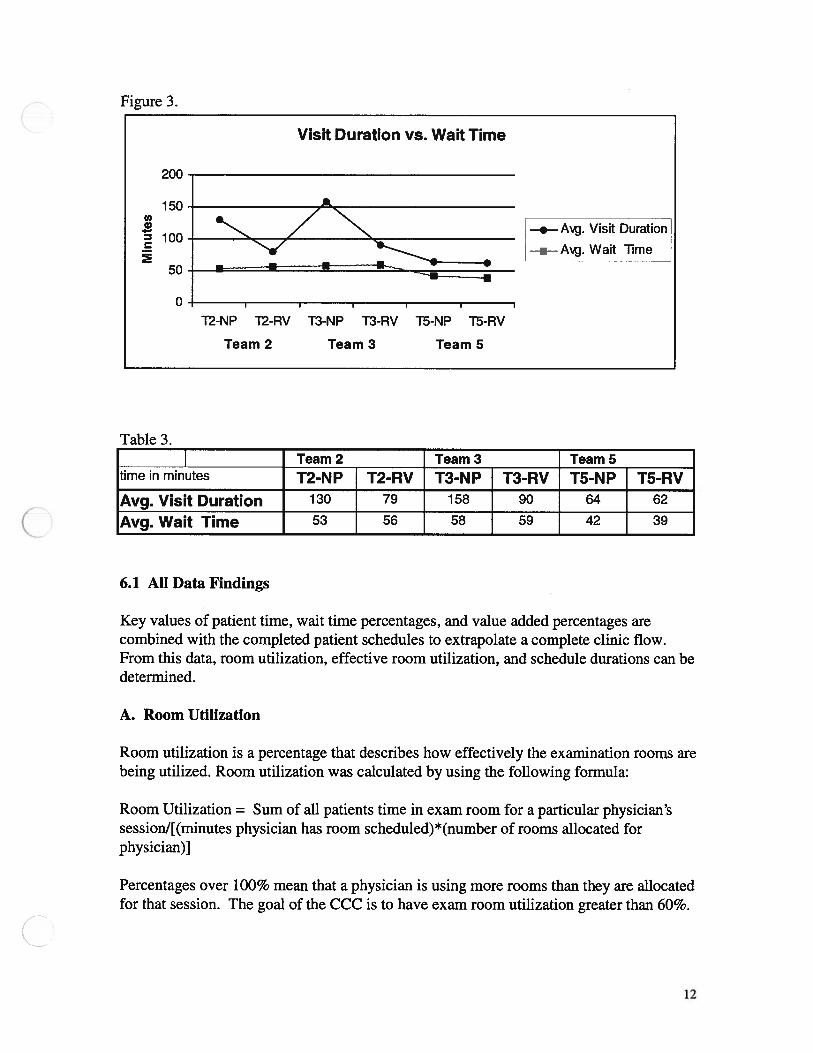
Figure 3.
Table 3.Team 2 Team 3 Team 5
time in minutes T2-NP T2-RV T3-NP T3-RV T5-NP T5-RVAvg. Visit Duration 130 79 158 90 64 62
Avg. Wait Time 53 56 58 59 42 39
6.1 All Data Findings
Key values of patient time, wait time percentages, and value added percentages arecombined with the completed patient schedules to extrapolate a complete clinic flow.From this data, room utilization, effective room utilization, and schedule durations can bedetermined.
A. Room Utilization
Room utilization is a percentage that describes how effectively the examination rooms arebeing utilized. Room utilization was calculated by using the following formula:
Room Utilization = Sum of all patients time in exam room for a particular physician’ssessionl[(minutes physician has room scheduled)*(number of rooms allocated forphysician)]
Percentages over 100% mean that a physician is using more rooms than they are allocatedfor that session. The goal of the CCC is to have exam room utilization greater than 60%.
200
Visit Duration vs. Wait Time
150‘I,0•1
100
50
0
—,—A. Visit Duration
a - A. Wait Time
T2-NP T2-RV T3-NP T3-RV T5-NP T5-RV
Team 2 Team 3 Team 5
12

Figure 4 displays the average percentages per team for exam room utilization. As thefigure shows, Team 2 exhibits the highest room utilization percentage. Both Team 3 andTeam 5 show similar room utilizations.
Figure 4.
Team 2 Team 3 Team 5Room Utilization 84% 42% 43%
B. Value Added Room Utilization
Value added room utilization is the value-added time a patient spends in the exam roomout of the total room time allocated. This differs from room utilization by taking intoaccount the time a patient spends with a physician or provider. Effective room utilizationis a percentage that describes how effectively the exam room is being utilized by anyprovider.
100%
Team Room Utilization
80%
60%
40%
20%
0%
Team 2
•Team 3
Team 5
Room Utilization
Team 2 Team 3 Team 5
13

Figure 4.
Team 2 Team 3 TeamS% Room Utilization 84% 42% 43%% Value Added 41% 20% 20%
The percentages above 100% suggests that there are more rooms used than assigned tothe physicians for the volume of patients that are seen within the clinic. Benchmarktargets for both should be about 60%. Team 3 and 5 have work to reach the target.
B. First Patient Analysis
Appointment time is the time in which the patient encounters the first provider in theexam room. This time does not include vitals. In order to paint a daily picture of eachdoctor’s session, first patient analysis was used. If the first patient of the day arrived latefor his/her appointment, then this pushes the schedule ahead, and causes a delay in therest of the day’s scheduled appointments. The same holds true for the physician or otherprovider. Since not all of the data collection forms were filled out and turned in, averageswere used to calculate first patient statistics. From the data, most of the patients that werelate caused a delay into the next patient. Other times, when the patient arrived early, andhad their vitals taken before their scheduled appointment time, the first provider arrivedin the room late. Figure 5 states the average first patient statistics for each team. Teams2 and 5 demonstrates the highest average amount of time the patient is late and Team 3demonstrates the highest average amount of time the first provider was late.
Figure 5.First Patient Analysis
Team 2 Team 3 Team 5
Provider Late in Minutes 19 33 25Patient Late in Minutes 8 7 8
100%
80%
60%
40%
20%
0%
% Room Utilization vs. % Value Added RoomUtilization
Room Utilization
j Effecth.e RoomUtilization
Team 2 Team 3 Team 5
14

C. Physician Time
The physician time with each patient is defined as the amount of time the physician is inthe exam room with the patient. As the attached data shows (see Visit StatisticsSummary) each physician spends different amounts of time with a patient depending onthe patient’s status (new or return) and the nature of the physician. New patients arescheduled every half an hour and return visit patients are scheduled every fifteen minutes.Therefore, physician time was determined to compare the scheduled appointments andthe actual appointments. Figure 6 shows the average amount of time a physician spendswith new and return patients for each team.
Figure 6
7.0 Conclusions
Late versus Early Patients
On average, for Teams 2,3 and 5, 80% of patients showed up early or on-time for theirappointments. Although patients arrived early on average, that still leaves 20% thatarrived late on an average of 20 minutes. This forces the schedule to be modified andshifts the patients around to accommodate for the loss of time.
To the physician, an appointment time is defined as the time they see a patient, where tothe patient, an appointment time is when the patient must show up to the clinic. All threeteams demonstrated that a vast majority of the providers were late for the patient’sappointment.
Average Physician Time vs. Averagein Exam Room
Patient Time
140
120
1000.1
. 60
40
20
0
i••••••i
•Açj. Patient lime inExam Room
Physician Timewith Patient
NP RV NP RV NP RV
Team 2 Team 3 Team 5
15

Value Added versus Non-Value Added (wait time) Times
From the data, it can be seen that more than 50% of the total clinic visit is non-valueadded time. The percent of value added time is very low in all three teams compared tothe goal of 60%. By decreasing the amount of wait times for each patient, value addedtime percentage will increase.
Also, some patients are complaining about other patients being seen before them whenthe other patient’s appointment time is set later and they arrived at the same time. This isa misunderstanding of the patient because they do not realize that several doctors are in atthe same time. The physicians’ schedules are different, one physician may be runningahead of schedule, while another is behind.
Service Order
Patients are scheduled to be seen in a specific order, but are seen instead on a first comefirst serve basis. If a patient checks in early, he/she is seen right away instead of at thetime that they are scheduled. This order of service disrupts the patient flow and increasesthe wait times for patients who come at their specified times. In addition, a patient mayrealize that even though their appointment is set, if they show up earlier, they may be seenearlier as well.
Exam Room Activities
According to our data, exam rooms are being utilized for more than just exam roomprocedures. A patient is made to wait in the exam room and is seen by every type ofprovider during his/her whole visit in the exam room. While the exam rooms are used forevery type of activity, the consult rooms remain empty and unused throughout most of theday.
New Patient Data
Due to the low number of new patients that enter each team’s clinic, it is concluded thatthere is insufficient data from the study given for new patients.
Recommendations
Recommendations are divided between specific items that affect patient flow as well ascontinuous improvements.
Appointment times
Patients should be advised to arrive early to their appointments by 15 minutes. Thiswould result in a more steady flow in the schedule and create a buffer. This buffer wouldallow the patient time to execute the necessary activities required before being examined
16
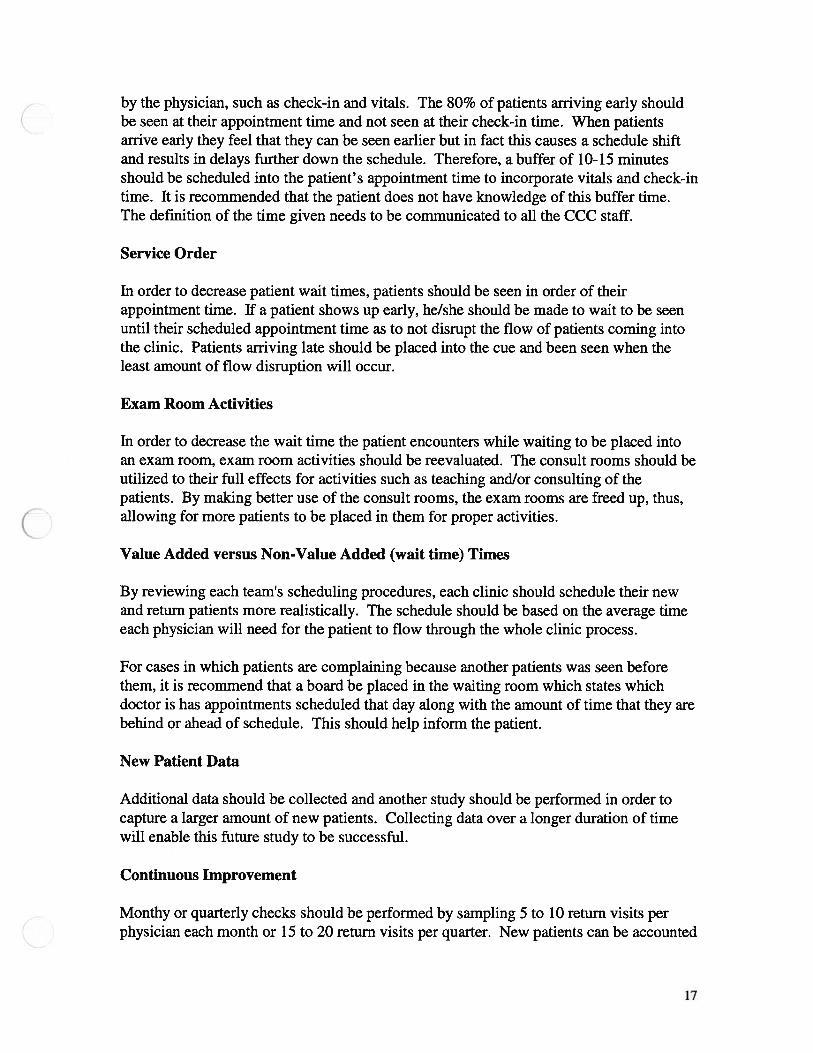
by the physician, such as check-in and vitals. The 80% of patients arriving early shouldbe seen at their appointment time and not seen at their check-in time. When patientsarrive early they feel that they can be seen earlier but in fact this causes a schedule shiftand results in delays further down the schedule. Therefore, a buffer of 10-15 minutesshould be scheduled into the patient’s appointment time to incorporate vitals and check-intime. It is recommended that the patient does not have knowledge of this buffer time.The definition of the time given needs to be communicated to all the CCC staff.
Service Order
In order to decrease patient wait times, patients should be seen in order of theirappointment time. If a patient shows up early, he/she should be made to wait to be seenuntil their scheduled appointment time as to not disrupt the flow of patients coming intothe clinic. Patients arriving late should be placed into the cue and been seen when theleast amount of flow disruption will occur.
Exam Room Activities
In order to decrease the wait time the patient encounters while waiting to be placed intoan exam room, exam room activities should be reevaluated. The consult rooms should beutilized to their full effects for activities such as teaching andlor consulting of thepatients. By making better use of the consult rooms, the exam rooms are freed up, thus,allowing for more patients to be placed in them for proper activities.
Value Added versus Non-Value Added (wait time) Times
By reviewing each team’s scheduling procedures, each clinic should schedule their newand return patients more realistically. The schedule should be based on the average timeeach physician will need for the patient to flow through the whole clinic process.
For cases in which patients are complaining because another patients was seen beforethem, it is recommend that a board be placed in the waiting room which states whichdoctor is has appointments scheduled that day along with the amount of time that they arebehind or ahead of schedule. This should help inform the patient.
New Patient Data
Additional data should be collected and another study should be performed in order tocapture a larger amount of new patients. Collecting data over a longer duration of timewill enable this future study to be successful.
Continuous Improvement
Monthy or quarterly checks should be performed by sampling 5 to 10 return visits perphysician each month or 15 to 20 return visits per quarter. New patients can be accounted
17

for by collecting data with a smaller sample size. The data from these checks will enablestaff to compare previous months or quarter with the current. Room utilization checksshould also be performed using the same manner.
At the end of each year, it is recommended that an accurate room utilization study andanalysis be performed. This project should be in much more detail and involve largesample sizes. This data will serve as an aid in the reallocation of exam rooms as well as aprogress report for comparison.
Since a small part of the problem is the amount of complaints from the patients, workshould be done to try to reduce complaints. In order to accomplish this, more extracurricular activities should be provided for the patient. Board games, hand heldelectronic games, cards, crossword puzzle books, etc can be left in the waiting room aswell as the exam rooms. These activities can keep the patient’s mind off of waiting.
18

Appendix

UNIVERSITY OF MICHIGAN HOSPITALSCLINIC SCHEDULING SYSTEM - CLINIC REGISTER
Clini....: SXO SURGERY ONCOLOGYPr-riec1. . : 03/29/99 13:24Appts for: TUE, MAR 30, 1999 From 07:00 To 17:00
;Q0 :: 8
Edt: 02/21/1943 Age: 56 Appt Type: RV Ref Code: Arrival Time:Mom: 616-267-9312 Status. . . : A C R N
_____________
Cnt: 616-267-9312- Chart Loc:
__________
Managed Care:Audit Num.
____________________
Diagnosis:
__________
Authorization:Res: SXOLAB Fin Class: 6Full Reg: 03/12/1999 Forms Rev: 10/03/1997* MSP Question Rev: *
Insi: BPR BLUE PREFERRED Y 03/18/99 UPDATED VIA BATCH
CHANG2745CBP, PT/PTT***PRE OP DX: 174.9
1030 075-17O-2-9O84 BEIL, CAP..OL S Sex:1t: 02/21/1943 Age: 56 Appt Type: ef Code:
fl: 616-267-9312 Status. . . : A C R N
____________
it: 616-267-9312- Chart Loc:
____________
Audit Num. ‘.2 Diagnosis:
__________
Res: SXOH&P Fin Class: 6Full Reg: 03/12/1999 Forms Rev: 10/03/1997*Insi: BPR BLUE PREFERRED Y 03/18/99 UPDATED VIA BATCH
Fain: PHYS, UNABLE TO IDENTIFY
Lic: Upin:OTHER APPTS:SXOLAB 1000-1015 9084
Ref: YAHANDA, ALAN1500 E MEDICAL CENTERANN ARBOR MI 48109
-- Lic: Upi 313-936-5855
OP OR DATE: 033199 R. CHANGDX: MET. BREAST CANCERPROC: EXC. (R) AXILLARY NODE R NCEANES: GENLTEST DONE: NONENEEDED: CBP, PT/PTT, INSTRUCTION, CONSENT, EKG C?)SPOKE TO PTSJR
::..Szc:Bdt: 01/14/1927 Age: 72 Appt Type: RV Ref Code: Arrival TimeTrmm: 517-826-3858 Status. . . : A C R N
_____________
- -
- Chart Loc:
___________
Managed Care:
_______________________
Diagnosis:
____________
Authorization:Fin Class: 1
udit Num.Res: SXOLABFull Reg: 09/21/1998
Total Appts : 005New Patient : 000Return Visit: 005Uncoded : 000
Fain: PHYS, UNABLE TO IDENTIFY
Lic: Upin:OTHER APPTS:SXOH&P 1030-1130 9084
Ref: YAHANDA, ALAN1500 E MEDICAL CENTERANN ARBOR MI 48109
Lic: Upin: 313-936-5855
SJR
__________
Ar,Ll ime
___________
Managed are:
____________
Authorization:
MSP Question Rev: *
Forms Rev * MSP Question Rev: 09/21/1998

University of Michigan Comprehensive Cancer Center Data Collection Form
Visit Info Patient Type Patient Stamp
Date: EJ New Patients Add-On
cialty: El Routine RV Other
Physician:Visit Note
Appt. Time:_______________
Check InTime:
Directions:
We are working to reduce wait times in the Cancer Center. We need your help to do this. Please record the time that eachactivity begins and ends. This is for the clinic visit portion only; it does not include Infusion or Blood Draw. Also, check theprovider of each service. Please give the sheet to the clerk at Check Out. This information will help us improve ourprocesses to better serve you. Thank you.
Feel free to ask your Check-In or Check-Out clerks any questions regarding this form.
Provider Activity Location Start Time End Time Notes
Medical Assistant Vitals Vitals Station
Time placed into Exam Room:ou are not sure of the provider type, just indicate the total number of provi
j Staff Physician Q History/Physical/Exam
[1 Resident/Fellow # ofEl Nurse Practitioner Providers: El Teaching) ConsultEl Physician’s Assistant
El Nurse El Procedure:El Other:
lers that you saw today.
Room #
El Staff Physician El History/Physical/Exam
El Resident/Fellow # of
El Nurse Practitioner Providers: El Teaching! Consult Room #El Physician’s Assistant
El Nurse El Procedure:
El Other:
Staff Physician Q History/Physical/Exam
El Resident/Fellow # of
El Nurse Practitioner Providers: El Teaching) Consult Room #El Physician’s Assistant
El Nurse El Procedure:
El Other:
During visit did you leave clinic for?: D Lab X-Ray(between check in and check out times)
Time out of Exam Room:Comments:
Q Other
Check Out Time:

Appendix BTeam 2
Comprehensive Cancer CenterTeam 2
This section displays Team 2’s findings and conclusions. This data further stratifies thedata displayed in the summary findings.
1.0 Team Timeline
“Timeline Duration Summary Statistics”, as seen in Appendix B, displays informationon patient flow within Team 2. On the average, all patients that visited Team 2 duringthe study experienced the most non-value added time waiting for vitals to begin. Arounda 24 minute wait was experienced by the 254 patients studied. New patients spent alonger time waiting for vitals than did return patients. The wait times betweenencounters ranged from 8- 13 minutes for all patients.
The bottom portion of the figure displays information pertaining to the amount of valueadded time a patient experiences. New patients encounter the longest total visit time, asto be expected. The length of stay is about 40% longer for new patients than returningpatients. New patients also experience more value-added time and less non value addedtime than return patients. Figures B 1 and B2 break up value added time and non-valueadded time by physician and new and return patients. The data shows that the Head andNeck specialists have the most value added time compared to non-value time for newpatients and Dr. Baker’s team has the most value added time compared to non-value timefor return patients.
2.0 Team Timeline by Physician
Value added time percentages, as well as average time line statistics, are broken down byphysician within the figure labeled “Timeline”, as seen in Appendix B. The CCCbelieves that 60% value added time is a goal to strive for. As the figure shows, thephysicians and staff of the Head and Neck clinic display the highest amount of valueadded time for new patients, 55%. Dr. Urba and staff, also provides a large amount ofvalue added time with the patient, 52%. Dr. Baker and staff, as well, perform efficiently,46%. Dr. Baker and staff and Dr. Urba and staff also provide the highest amount of valueadded time for returning patients. However, these staff members that exhibit good valueadded times should also be working towards continuous improvement and trying todecrease the amount of time their patients are waiting. These providers with higher valueadded percentages can be treated as models for the others to help decrease the patient’swait time. Figures B3 and B4 show the percentages of non-value added time and valueadded time for each physician.
3.0 Exam Room Utilization
Room utilization is the total amount of time that all the patients in one physician’ssession spent in the exam room divided by the amount of room that physician is allocatedduring that session times the number of minutes the physician’s session is scheduled tolast. A percentage greater than 100% means that the physician is using more rooms thanhe/she is allocated for that session. The CCC would like to establish a goal of 60% roomutilization. Effective exam room utilization is the amount of time that a patient is with aprovider who is performing an activity with the patient. This percentage differs fromexam room utilization because it helps see if a patient is being “parked” in the examroom. With this number, one can ask if the clinic is using the exam room effectively.Another name for this is Value Added Room Utilization. A session is described to be theamount of time the physician is scheduled to be in the clinic on a certain day. Theattached sheet labeled “Room Utilization Summary” , as seen in Appendix B, gives thesummary statics for each doctor each day of the week they are working in the clinic.These averages were calculated using the two weeks of data collected 3/17/99 — 4/2/99.
4.0 Team Summary Statistics
“Team Summary Statistics”, as seen in Appendix B, displays late and early arrivalfigures, as well as the amount of time the patient spends with a provider, just thephysician, in the exam room, and the total visit duration. Of the 256 patients recorded,23% were late. On average, this time was 16 minutes. However, 76% of the patientsarrived early on an average of 18 minutes. Only 1% of all late patients were newpatients.
As expected, new patients spent the most time with any provider. Therefore, a newpatient’s visit duration and exam room times are longer. However, the amount of timethat a new patient spent with the physician is the same amount of time that a physicianspent with a returning patient. Figures B5 and B6 display actual visit duration of thepatient and the amount of non-value added time each type of patient encounters. Fromthese graphs, Dr. Redman and staff’s patients experience the longest visits and thehighest amount of non-value added time for both new and return patients.
5.0 Team Summary Statistics by Physician
Broken down by physician, “Visit Statistics Summary”, as seen in Appendix B, showsthe average amounts of time that a patient spends with: all providers, just the physician,and the exam room. This figure also gives average visit duration and wait time perdoctor. Figures B7 and B8 display the average amount of time a physician spends with apatient compared to the amount of time the patient is in the exam room.

6.0 First Patient Summary by Physician
“First Patient Summary”, as seen in Appendix B, shows data collected from March 19,1999 to March 31, 1999. If the first patient of the day scheduled to see a particular doctoris late, this may cause problems and hold ups throughout the rest of the day. The datashows that if the first patient was late, they were late by an average of 8 minutes. If thefirst patient of the day was early, they were early by an average of 14 minutes. In mostcases, however, the first provider that saw the first patient arrived late for theappointment. Only one time did the provider arrive early. On average the first providerarrives 20 minutes late for the scheduled appointment time of the patient. It should benoted that 5 of the first patients showed up for their scheduled appointment on time.
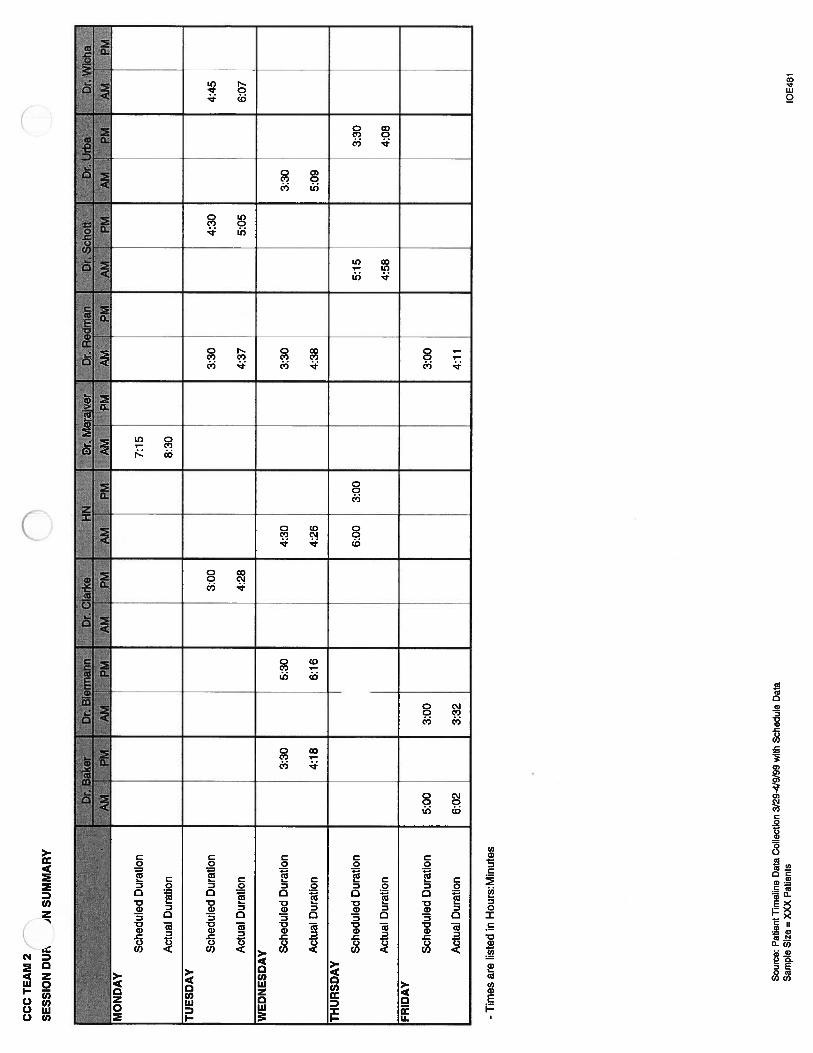
7.0 Physician Session Duration
“Physician Session Duration”as seen in Appendix B, shows the amount of time that thephysician is scheduled to work against the amount of time that that the session actuallylasts. This number was calculated by subtracting the time that the first patient checked infrom the time that the last patient checked out. As this table shows, nearly all thephysicians go over their allocated time.
8.0 Recommendations
The recommendations given below are specific to Team 2. General recommendations forthe rest of the clinic are covered in the full report.
• The sharing of exam rooms with team 5 may contribute to the high percentages ofexam room utilization. In order to evaluate these percentages realistically, the examrooms should be reallocated to match the demand of the physician.
• To increase value added room utilization, the time that a patient spends “parked” inthe exam room should be decreased.
• To account for the amount of time the patient spends at check-in and vitals, a 15minute buffer should be implemented. This will keep the time schedule flowingsmoothly.
• In order to reduce the time a patient spends waiting to get into an exam room, onlyuse the exam room for their required uses. Utilize the consult rooms to their fullpotential.
• Condition the patients to arrive at their scheduled appointment time and admit themby appointment time, not on a first-come first-serve basis. This will reduce delaysand wait times the patient may experience.
• Implement another study to capture new patient data due to the low sample size ofnew patients in this study.A

CC
CT
EA
M2
TIM
EL
INE
CT
ION
SUM
MA
RY
ST
AT
IST
ICS
*A
vera
geT
otal
Tim
e,V
alue
Add
edT
ime
and
Non
-Val
ueA
dded
Tim
ear
eth
esu
mof
each
even
tsti
me
mul
tiplie
dby
the
%of
pati
ents
that
expe
rien
ced
that
even
t.
-G
Mse
tsgo
alfo
rva
lue
adde
d%
at60
%.
Sou
rce:
Pat
ient
Tim
elin
eD
ata
Col
lect
ion
3/19
-4/2
/99
with
Sch
edul
eD
ata
Sam
ple
Siz
e=
256
Pat
ient
s
Che
ckIn
%of
Patie
nts
Ave
ragó
St.
.Dev
.N
ewP
ati
en
ts:j
..:j
äti
entS
V0:
0110
0%0:
0110
0%0:
0110
0%
bØ
até
té
Wai
tfo
rV
itals
NV
0:24
0:22
100%
0:27
0:24
100%
0:23
0:22
100%
Vita
lsV
0:02
0:01
100%
0:02
0:01
100%
0:02
0:01
100%
Wai
tfo
rE
ncou
nter
1N
V0:
130:
1210
0%0:
150:
1310
0%0:
130:
1210
0%E
ncou
nter
1V
0:15
0:13
100%
0:23
0:17
100%
0:13
0:11
100%
Wai
tfo
rE
ncou
nter
2N
V0:
120:
1189
%0:
200:
1386
%0:
100:
0971
%E
ncou
nter
2V
0:11
0;09
89%
0:18
0:12
86%
0:09
0:08
71%
Wai
tfo
rEn
counte
r3N
V0:
080:
1167
%0:
130:
1854
%0:
050:
0630
%E
ncou
nter
3V
0:13
0:13
67%
0:15
0:12
54%
0:12
0:14
30%
Che
ckO
utV
0:03
0:04
100%
0:04
0:05
100%
0:03
0:04
100%
Ave
rage
Tot
alV
isit
Tim
e*1:
260:
402:
100:
381:
190:
35
Val
ueA
dded
Tim
e*0:
300:
200:
540:
220:
260:
17
Non
Val
ueA
dded
Tim
e*1:
150:
310;
530:
340:
540:
34
%V
alue
Add
edT
ime
35%
42%
33%
——
IOE
481

CC
CT
EA
h‘
TIM
ELIN
E
-T
imes
are
liste
din
Hou
rs:M
inut
es
Sour
ce:P
atie
ntfl
mel
ine
Dat
aC
olle
ctio
n3/
12-4
/2/0
9w
ithSc
hedu
leD
ata
Sam
ple
Size
=25
6Pa
tient
s
——
Che
ckIn
ur. b
aK
0rW
rnnann
m1.)
r;1arK
0:-
;u.M
era
fver
Wai
tfo
rVita
lsE
ncou
nter
Avg
.St
d.0e
v.V
itals
Enc
ount
erA
vg.
Sid.
Dev
.W
aitf
orE
ncou
nter
1A
vg.
Std.
Dev
.E
ncou
nter
1A
vg.
Std.
Dev
.W
aitf
orE
ncou
nter
2A
vg.
Std.
0ev.
Enc
ount
er2
Avg
.St
d.D
ev.
Wai
tfor
Enc
ount
er3
Avg
.St
d.0e
v.E
ncou
nter
3A
vg.
Std.
Dev
.
ur
Heam
8n
w,
yr.c
nou
Ur.urD
a;
MD
<
0:01
0:33
0:23
0:02
0:00
0:12
0:03
0:47
0:27
0:05
0:10
0:03
0:01
0:19
0:17
0:02
0:00
0:10
0:09
0:13
0:09
0:31
0:06
0:07
0:04
0:04
0:20
0:22
0:03
0:02
0:01
0:09
0:10
0:02
0:00
0:10
0:10
0:10
0:07
0:25
0:12
0:13
0:10
0:16
0:05
0:17
0:07
0:05
0:04
0:01
0:16
0:11
0:02
0:00
0:14
0:14
0:08
0:05
0:09
0:11
0:09
0:08
0:04
0:03
0:04
0:03
0:03
0:01
0:26
0:15
0:02
0:00
0:34
0:09
0:24
0:11
0:20
0:13
0:18
0:13
0:03
0:03
0:05
0:01
0:05
0:06
0:01
0:26
0:16
0:02
0:00
0:20
0:15
0:11
0:07
0:13
0:14
0:04
0:03
0:07
0:02
0:03
0:02
0:01
0:01
1:06
0:18
0:51
0:15
0:02
0:02
0:00
0:00
0:06
0:03
0:06
0:08
0:04
0:04
0:18
0:10
0:04
0:07
0:10
0:13
0:07
0:07
0:07
0:07
Che
ckO
ut
0:01
0:01
0:24
0:24
0:20
0:28
0:02
0:02
0:01
0:00
0:07
0:09
0:03
0:07
0:27
0:09
0:23
0:05
0:11
0:13
0:09
0:09
0:27
0:12
0:07
0:06
0:09
0:05
0:12
0:03
0:14
0:16
0:11
0:14
0:08
0:06
0:09
0:08
Avg
.St
d.0e
v.
0:01
0:01
0:32
0:35
0:23
0:33
0:02
0:02
0:00
0:01
0:22
0:14
0:19
0:10
0:35
0:15
0:19
0:17
0:25
0:08
0:14
0:06
0:13
0:11
0:07
0:11
0:31
0:06
0:30
0:07
0:14
0:06
0:10
0:04
0:02
0:03
0:04
0:02
0:01
0:01
0:30
0:25
0:40
0:23
0:04
0:02
0:01
0:02
0:20
0:16
0:08
0:18
0:19
0:15
0:05
0:10
0:31
0:14
0:11
0:08
0:13
0:10
0:02
0:06
0:08
0:12
0:09
0:12
0:12
0:06
0:06
0:03
0:03
0:04
0:01
0:01
0:20
0:11
0:09
0:13
0:02
0:02
0:02
0:02
0:19
0:11
0:02
0:11
0:14
0:23
0:04
0:23
0:15
0:09
0:18
0:07
0:30
0:04
0:26
0:03
0:04
0:02
0:02
0:37
0:12
0:10
0:05
0:02
0:01
0:01
0:01
0:01
0:01
0:46
0:25
0:36
0:17
0:02
0:02
0:00
0:00
0:28
0:16
0:02
0:09
0:27
0:11
0:03
0:07
0:02
0:02
0:07
0:04
0:01
0:02
0:03
0:05
0:04
0:05
0:11
0:02
0:02
0:08
0:09
0:02
0:03
Clin
icV
isitT
ime
Avg
.2:
051:
101:
431:
042:
171:
232:
071:
221:
571:
142:
381:
382:
171:
292:
241:
201:
511:
01St
d.0e
v.0:
130:
250:
460:
260:
150:
350:
430:
420:
480:
300:
260:
480:
440:
310:
420:
550:
380:
24V
alue
Add
edT
ime
Avg
.0:
570:
260:
380:
200:
530:
181:
090:
300:
270:
261:
010:
280:
460:
301:
140:
310:
330:
10St
d.0e
v.0:
200:
180:
110:
110:
100:
090:
270:
190:
050:
120:
200:
230:
060:
130:
090:
220:
070:
10N
onV
alue
Add
edT
ime
Avg
.1:
080:
441:
050:
441:
241:
050:
570:
511:
300:
471:
371:
091:
300:
591:
090:
491:
180:
48St
d.0e
v.0:
070:
240:
380:
240:
100:
280:
320:
360:
420:
280:
250:
490:
390:
340:
360:
520:
310:
23%
Vat
ueA
dded
Tim
e%
45.8
2%37
.67%
36.77
%I31
.33%
38.98
%I
21.8
8%54
.66%
I37
.31%
23.0
8%I
35.9
6%38
.61%
I28
.97%
34.06
%I
3373%
51.62
%I
38.3
3%29
.60%
I28.6
8
10E4
81

CCC
TEA
M2
ROO
MU
TILI
ZATI
ON
SUM
a%
Dcd/I
irn
iAM
PMI4I
PMA
MPM
m
7:15
10:4
4:00
17:5
4:00
61.7
2%
37
01
%
TUES
DA
Y
#oI
Roo
ms
Allo
cate
d3
34
3
Hou
rsA
vaila
ble
33:
304:
464:
45
Prov
ider
Tim
e(S
um>
7:51
:00
26:0
2:00
21:4
6:00
11:4
1:0
0
Roo
mTi
me
(Sum
)20
:06:
0058
:48:
0046
:46:
0020
:15:
00
%R
oom
Util
izat
ion
(Ali
oca
te11
1.67
%12
6.03
%88
.77%
71.0
5%
%V
AR
oom
Util
izat
ion
(Allo
c.)
4361
%56
.75%
38.1
7%40
.99%
WED
NES
DA
Y Uat
Roo
ms
Allo
cate
d4
68
34
Hou
rsA
vaila
ble
3:30
5:30
4:30
3:30
3:30
Prov
ider
Tim
e(S
um)
40:0
0:00
19:0
2:00
27:3
5:00
5:21
:00
Roo
mT
hou
(Sum
)35
:45:
0043
:03:
0058
:19:
009:
09:0
0
%R
oom
Util
izat
ion
(Allo
cate
d)67
.08%
50.2
5%76
.00%
138.
81%
99.6
0%
%V
AR
oom
Util
izat
ion
(Allo
c.)
39.4
6%23
.16%
45.3
0%61
.35%
54.4
4%(H
UR
SDA
Y
tOt
Roo
ms
Allo
cate
d4
34
Hou
rsA
oaila
ble
4:30
5:15
3:30
Pro
vlde
rTko
e(S
urn)
821
:10:
0011
:11:
00
Roo
mT
ine
(Sum
)so
ten
ough
data
39:4
7:00
25:1
6:00
%R
oom
Util
izat
ion
(Allo
cate
d)83
.54%
70.4
0%
%V
AR
oom
Util
izat
ion
(AlIo
c.)
45.2
9%26
.67%
FRID
AY
#01
Roo
ms
Allo
cate
d4
33
Hou
rsA
vaila
ble
53
3
Prov
ider
Thou
(Sum
)39
:55:
0024
:59:
0043
:l9:
00
Roo
mTi
me
(Sum
)72
:05:
0057
:00:
0058
:09:
00
%R
oom
Util
izat
ion
(Ato
cale
d)88
.83%
83.0
9%15
3.83
%
%V
AR
oom
Util
izat
ion
(AIm
.)90
.83%
33.4
6%68
.58%
Tin
esar
eto
ted
inH
osro
:Mio
utes
Sou
rce:
Pat
ien
tT
imel
ine
Dat
aC
olle
ctio
n3/
19-4
/2/9
9w
ithS
ched
ule
Dat
aS
ample
Siz
e=
496
Pat
ien
ts
#01
Roo
ms
Allo
cate
d
Hou
rsA
vaila
ble
Prov
ider
Tin
e(S
am)
Roo
mTi
me
(Sum
)
%R
oom
Uhf
lzal
lon
(Allo
cate
d)
%VA
Roo
mU
tiliz
atio
n(A
lIoc.
t
61.7
2%
17
01%
10E
481

T’
‘2
Not
es:
*P
rovi
der
tim
eis
the
aver
age
tim
ew
ithan
ycl
inic
ian
per
visi
t.**
Phy
sici
anti
me
isth
eav
erag
etim
ew
ithth
est
aff
phys
icia
npe
rvi
sit.
-T
imes
are
liste
din
hour
s:m
inut
es
SUM
MA
R(A
TIS
TIC
S
Sou
rce:
Pat
ient
Tim
elin
eD
ata
Col
lect
ion
3/12
-4/2
199
with
Sch
edul
eD
ata
Sam
ple
Siz
e=
256
Pat
ient
s
.N
éw
Pat
ient
sR
etur
n_P
atie
nts
atI
ent
St.
Dev
.%
ofP
atin
tsA
vera
geSt
.%
ofP
aUen
ts5
.5
5
55
5;
.ene
rai
......cs:
#P
atie
nts
256
100%
3514
%22
086
%
#E
arly
Arr
ival
s19
576
%33
13%
162
63%
Ear
lyT
ime
0:18
0:14
0:21
0:17
0:17
0:13
#L
ate
Arr
ival
s60
23%
21%
5823
%
Lat
eTim
e0:
160:
170:
160:
130:
160:
17
Key
Tim
esS
umm
ary:
Pro
vide
rT
ime*
0:30
0:20
0:54
0:22
0:26
0:17
Phy
sici
anT
ime
**
0:12
0:01
14%
0:12
0:02
9%0:
120:
0115
%
Exa
mR
oom
Tim
e0:
540:
321:
340:
370:
480:
26
Clin
icT
ime
1:26
0:40
2:10
0:38
1:19
0:35
lOE
481

CC
CTE
AM
2V
ISIT
ST
AT
ISU
MM
AR
Y
Tim
ew
ithP
rovi
der
(Avg
.)0:
280:
270:
280:
240:
270:
230:
510:
430:
250:
260:
320:
330:
280:
310:
400:
420:
240:
20
Tim
ew
ithP
rovi
der
(Std
.D
ev.)
0:21
0:19
0:14
0:13
0:19
0:16
0:31
0:28
0:28
0:12
0:24
0:25
0:14
0:13
0:29
0:27
0:12
0:11
Tim
ein
Exa
mR
oom
(Avg
.)0:
480:
461:
010:
530:
560:
521:
171:
030:
380:
441:
071:
061:
020:
581:
121:
190:
410:
32
Tim
ein
Exa
mR
oom
(Std
.D
ev.)
0:25
0:22
0:41
0:35
0:36
0:32
0:39
0:36
0:36
0:14
0:43
0:41
0:27
0:23
0:45
0:54
0:16
0:12
Wai
tT
ime
(Avg
.)0:
450:
450:
500:
491:
071:
081:
080:
530:
490:
481:
171:
141:
131:
010:
540:
551:
020:
50
Wai
tT
ime
(Std
.D
ev.)
0:27
0:24
0:32
0:29
0:29
0:28
0:35
0:34
0:34
0:27
0:48
0:47
0:38
0:35
0:31
0:47
0:30
0:25
-T
imes
are
hste
din
Hou
rs:M
inut
es-
/m
eans
not
enough
dat
ato
calc
ula
te
Sou
rce:
Pat
ient
Tim
elin
eD
ata
Col
lect
ion
3/19
-4/2
/99
with
Sch
edule
Dat
aS
amp
leS
ize
=25
6P
atie
nts
Sam
ple
Siz
e
%O
nT
ime/
Ear
lyA
mva
ls
%L
ate
Arr
ival
s
2
100%
0%
50 64%
36%
PP
!e4rn
pr
:R
man
:àr,
__
__
__
__
__
_
619
83%
74%
17%
26%
Key
Tim
eS
um
mar
y
Tim
ew
ithP
hysi
cian
(Avg
.)
Tim
ew
ithP
hysi
cian
(Std
.D
ev.)
P:R
V:”
:N
Pj:
t4’
3
100%
0%
13 69%
31%
816
88%
81%
13%
19%
0:10
0:06
0:07
2
100%
0%
0:13
0:10
15 53%
47%
0:09
0:08
0:19
0:09
633
100%
85%
0%15
%
0:11
0:07
3
100% 0%
0:27
0:07
44 82%
18%
0:12
0:06
3
100%
0%
0:15
0:07
8
50%
50%
0:13
0:07
2
100% 0%
0:13
0:07
22 82%
18%
0:11
0:11
0:13
0:02
Vis
itD
urat
ion
(Avg
.)
Vis
itD
urat
ion
(Std
.D
ev.)
0:10
0:06
0:14
0:02
0:14
0:04
1:13
0:31
0:27
0:03
1:12
0:27
0:11
0:07
1:18
0:40
0:53
0:35
1:34
0:43
1:31
0:39
2:00
0:43
1:37
0:47
1:14
0:47
1:15
0:29
1:50
0:53
1:47
0:50
1:41
0:38
1:32
0:33
1:34
0:51
1:38
0:58
1:27
0:34
1:10
0:28
10E
481

CC
CTE
AM
2FI
RST
PAT
IEN
TSU
M
PM
-T
imes
are
liste
din
Hou
rs:M
inut
es
Sour
ce:
Pat
ient
Tim
elin
eD
ata
Col
lect
ion
3119
-313
1/99
wilt
,S
ched
ule
Dat
aSa
mpl
eSi
ze=2
56P
atie
nts
1:
8:30
12:4
58:
30
AM
PM
,
12:3
08:
00
AMP
MM
Ati
frP
M
10:0
08:
30
3/23
/99
3130/9
9i
41
3/2S
/91IW
iI
12:3
012
:30
8:00
13:0
08:
31)
8:30
8:00
ii=
ofl““=
‘The
cktn
Tw
ne8:
1712
:45
8:30
12:1
67:
5310
:00
8:13
12:4
012
:28
8:00
13:0
38:
198:
357:
59
Vita
lslim
e8:
2312
:58
8:45
12:2
47:
5910
:17
8:16
12:5
112
:39
8:07
13:0
88:
258:
378:
03
lim
ein
toE
xam
Roo
m8:
2513
:00
8:47
12:2
68:
0310
:18
8:18
15:5
212
:42
8:08
13:0
98:
278:
398:
05
Tim
eot
1st
enco
unte
r8:
3013
:15
8:55
12:4
48:
1210
:21
8:20
12:5
81:
198:
0913
:18
8:37
8:39
8:09
App
oinb
ient
Tim
e00
—&
30—
00
—00
—30
—30
—1
30
——
12
000
—00
—0
0—
—1230
00—
00
—
Che
ctcl
nTim
e9:
008:
188:
398:
418:
408:
0011
:21
12:2
68:
088:
107:
3812
:39
8:34
7:40
Vlt
stsf
lme
9:18
82
68:
488:
478:
518:
1211
:31
12:3
88:
118:
138:
0412
:48:
387:
45
lim
einto
Exam
Room
921
82
88:
498:
508:
528:
2411
:34
12:4
08:
128:
158:
0512
:42
8:39
7:47
Tim
eofl
aten
coun
ter
9:40
8:34
9:10
9:07
8:57
8:32
11:3
612
:45
8:17
8:25
8:24
12:5
38:
588:
18
10E4
81
CC
CTE
AM
2
SESS
ION
DU
FN
SUM
MA
RY
iI
AM
TU
ESD
AY
Sch
edul
edD
urat
ion
3:00
3:30
4:30
4:45
Act
ual
Dur
atio
n4:
284:
375:
056:
07
WE
DN
ESD
AY S
ched
uled
Dur
atio
n3:
305:
304:
303:
303:
30
Act
ual
Dur
atio
n4:
186:
164:
264:
385:
09
THU
RSD
AY
Sch
edul
edD
urat
ion
6:00
3:00
5:15
3:30
Act
ual
Dur
atio
n4:
584:
08
FRID
AY
Sch
edul
edD
urat
ion
5:00
3:00
3:00
Act
ual
Dur
atio
n6:
023:
324:
11
-T
imes
are
liste
din
Hou
rs:M
inut
es
Sou
rce:
Pat
ient
Tim
elin
eD
ata
Col
lect
ion
3/29
-4/9
/99
with
Sch
edul
eD
ata
Sam
ple
Siz
e=
XXX
Pat
ient
s
Sch
edul
edD
urat
ion
7:15
Act
ual
Dur
atio
n8:
30
:;
10E
481

Figure B 1.
Value Added Time and Non-value Added TimeDistribution for New Patients
3:00. 2:30
2:001:30
• Non-Iue Added Time
0
I I I I I
VaIue Added Time
__ _,‘_Physin
Figure B2.
Value Added Time and Non-value Added TimeDistribution for Return Patients
3:00.S 2:30
2:001 30
• Non-,aIue Added Time
1:00 VaIue Added Time
Physician

Figure B3.
Figure B4
% Value Added 1in and % Non-value Added line forNew Paents
120%100% • — — — • • •
____________
I 1.11 11111
_________
2 4O% • I I • • Q%VueAdded1ime
0L1 H H H U U
Physidan
% Value Added Time and % Non-value AddedTime for Return Patients
120%
IJJ[I[1I111111.1• % Non-eIue Addã
lime
% Value Added Time
,_v :$z-zPhysician

Figure B5.
Actual Visit Duration versus Non-value Added Time forNew Patients
,3:00. 2:30
2:00
________
r • Actual Visit Duration
_______________________________
I Non-value Added me
0:30I I I I I I
__$_
Physiclan
Figure B6.
Actual Visit Duration versus Non-value Added Time forReturn Patients
,3:00. 2:30
2:00
_____________________________________
• Actual Visit Duration1:30
1 :oo
____
—
____
I Non-value Added Time
o 0:300:00
__v _c__
Physician

Figure B7.
Figure B8.
ij
Physician Time and Patient Exam Room Time forNew Patients
g2:3O
1:OO
i.• • Patient Exam RoomTime
j Physician lime
_c;_
_,Physician
Physidan Time and Palient Exam Room lime forReturn Palients
• Patient Exam Fbomlime
Physician lime
APhycian

Team 2 Patient Flow Chart
Note: Wait times are times in which patient is waiting for a provider and are represented by the crescent.Decisions are represented by diamonds and process are rectangles.

C
Appendix CTeam 3

Comprehensive Cancer Center
Team 3-Medical Oncology Specializing in Lung, GL GU Cancers; Surgeons inUrologic Oncology and Multidisciplinary Urologic Clinic
1.0 Overall Summary of Team 3’s dataThis section displays Team 3’s findings and conclusions. This data further stratifies thedata displayed in the summary findings.
1.1 Summary Statistics“Summary Statistics”, (Appendix C) displays late and early arrival figures as well as theamount of time the patient spends with a provider, just the physician, in the exam room,and the total visit duration. New patients make up 20% of all patients and 79% of thenew patients arrived early by 28 minutes. Therefore, 21% of the new patients arrived lateby 15 minutes. Their average physician time was 27 minutes and average provider timewas 56 minutes. New patients spent, on average, 93 minutes in the exam room and 131minutes at the clinic. Return patients make up 80% of all patients and 80% of the returnpatients arrived early by 28 minutes and 20% of the return patients arrived late by 16minutes. The average physician time for return patients was 15 minutes and averageprovider time was 27 minutes. Return patients spent, on average, 61 minutes in the examroom and 95 minutes at the clinic. Overall, 80% of all patients arrived early and theyarrived early by 27 minutes. That left only 20% of all patients arriving late by 15minutes The average physician time for all patients was 17 minutes and average
) -; provider time was 33 minutes. Finally, for all patients, the average time spent in an examroom was 67 minutes and average time spent at the clinic was 102 minutes. Figures 7Cand 8C depicts a line graph of wait times versus visit duration.
As expected, new patients spent the most time with any provider. Therefore, a newpatient’s visit duration and exam room time was longer.
1.2 Timeline Duration Summary Statistics“Timeline Duration Summary Statistics” displays information on patient flow withinTeam 3 as seen Appendix C. The wait time for vitals was the longest for both new andreturn patients. The wait time was almost double compared to the wait times forencounters 1,2, or 3. This was due to the fact that 80% of all patients arrived early andvitals were the first activity a patient went through. Value added time was the timeduration a patient was being seen by a physician or any other provider excluding check-inand checkout clerks and medical assistants. The value-added time for new patients was55 minutes and 29 minutes for return patients. Non-value added time was the time apatient was waiting for any activity to occur. The average non-value added time for newpatients was 58 minutes and 59 minutes for return patients. The goal for the CCC is toreach 60% value added time. For new patients their percent value added time was 35%and for return patients it was 32%.
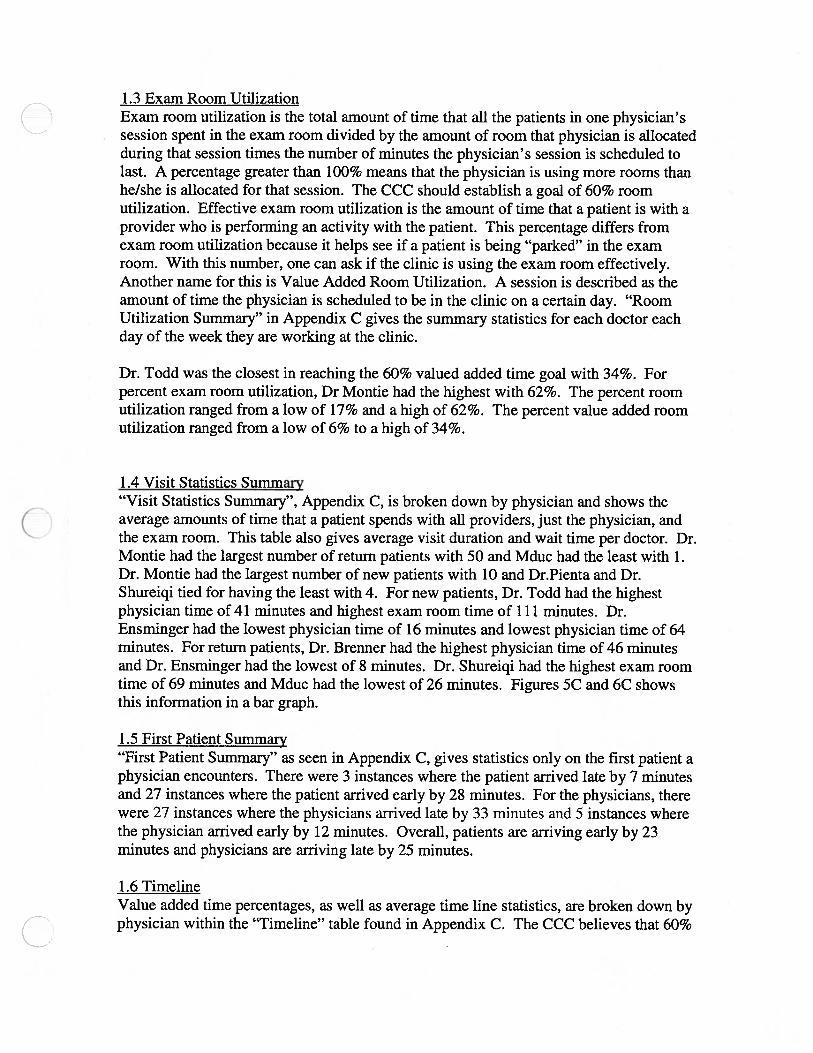
1.3 Exam Room UtilizationExam room utilization is the total amount of time that all the patients in one physician’ssession spent in the exam room divided by the amount of room that physician is allocatedduring that session times the number of minutes the physician’s session is scheduled tolast. A percentage greater than 100% means that the physician is using more rooms thanhe/she is allocated for that session. The CCC should establish a goal of 60% roomutilization. Effective exam room utilization is the amount of time that a patient is with aprovider who is performing an activity with the patient. This percentage differs fromexam room utilization because it helps see if a patient is being “parked” in the examroom. With this number, one can ask if the clinic is using the exam room effectively.Another name for this is Value Added Room Utilization. A session is described as theamount of time the physician is scheduled to be in the clinic on a certain day. “RoomUtilization Summary” in Appendix C gives the summary statistics for each doctor eachday of the week they are working at the clinic.
Dr. Todd was the closest in reaching the 60% valued added time goal with 34%. Forpercent exam room utilization, Dr Montie had the highest with 62%. The percent roomutilization ranged from a low of 17% and a high of 62%. The percent value added roomutilization ranged from a low of 6% to a high of 34%.
1.4 Visit Statistics Summary“Visit Statistics Summary”, Appendix C, is broken down by physician and shows theaverage amounts of time that a patient spends with all providers, just the physician, andthe exam room. This table also gives average visit duration and wait time per doctor. Dr.Montie had the largest number of return patients with 50 and Mduc had the least with 1.Dr. Montie had the largest number of new patients with 10 and Dr.Pienta and Dr.Shureiqi tied for having the least with 4. For new patients, Dr. Todd had the highestphysician time of 41 minutes and highest exam room time of 111 minutes. Dr.Ensminger had the lowest physician time of 16 minutes and lowest physician time of 64minutes. For return patients, Dr. Brenner had the highest physician time of 46 minutesand Dr. Ensminger had the lowest of 8 minutes. Dr. Shureiqi had the highest exam roomtime of 69 minutes and Mduc had the lowest of 26 minutes. Figures SC and 6C showsthis information in a bar graph.
1.5 First Patient Summary“First Patient Summary” as seen in Appendix C, gives statistics only on the first patient aphysician encounters. There were 3 instances where the patient arrived late by 7 minutesand 27 instances where the patient arrived early by 28 minutes. For the physicians, therewere 27 instances where the physicians arrived late by 33 minutes and 5 instances wherethe physician arrived early by 12 minutes. Overall, patients are arriving early by 23minutes and physicians are arriving late by 25 minutes.
1.6 TimelineValue added time percentages, as well as average time line statistics, are broken down byphysician within the “Timeline” table found in Appendix C. The CCC believes that 60%

value added time is a goal to strive for. The highest clinic visit time was demonstratedwhen patients were scheduled with Dr. Shureiqi and the lowest was demonstrated whenpatients were scheduled with by one of the Mduc physicians. For value added time fornew patients, Dr. Todd had the time of 81 minutes and Dr. Ensminger had the lowestwith 39 minutes. For return patients, Dr. Shureiqi had the highest value added time of 33minutes and Dr. Smith had the lowest with 25 minutes. For non-value added time or waittime for new patients, Dr. Shureiqi had the highest with 74 minutes and Dr. Ensmingerhad the lowest with 40 minutes. For the return patients, Dr. Shureiqi had the highest with66 minutes and Dr. Ensminger and Dr. Todd tied for the lowest with 34 minutes. Thiscan be seen in Figures 1C-4C.
1.7 Session Duration“Session Duration Summary” (Appendix C) shows the amount of time that the physicianis scheduled to work against the amount of time that the session actually lasts. Thisnumber was calculated by subtracting the time that the first patient checked in from thetime that the last patient checked out. All the physicians went over their scheduledduration except for Dr. Todd on Thursday mornings. The biggest gap between the actualduration and scheduled duration occurred on Wednesday morning from Dr. Shureiqi.Overall, all physicians went over their scheduled duration by an average of 127 minutes.
2.0 RecommendationsTo better utilize exam rooms for Team 3, scheduling a buffer to incorporate vitals andcheck-in time is recommended. If patients are receiving teaching and/or consulting,utilizing the consult rooms would also be helpful. We recommend for blood draws,vitals, etc. not to be conducted in the exam rooms. And finally, continuous improvementis a must. All of these recommendations are explained in detail in the overall report.

CComprehensive Cancer Center
Team 3 — Medical Oncology Specializing in Lung, GI, GU Cancers; Surgeons inUrologic Oncology and MultidisciplinarY Urologic Clinic

CC
,-A
M3
SUM
MA
R’
kTlS
TIC
S-
1.1
All
Pat
ients
::N
eW
Patient....
iRetu
rflP
ati
entS
eS
t.D
evI
%of
Pat
ients
Ae?
age
St
Dev
%of
Pat
ients
Ave1
St
Dev
%f
Pat
ients
:;4
:•:
#P
atie
nts
215
100%
4220
%17
380
%#
Ear
lyA
rriv
als
172
80%
3379
%13
780
%E
arly
Tim
e0:
280:
420:
280:
170:
280:
46
#L
ate
Arr
ival
s43
20%
921
%34
20%
Lat
eTim
e0:
150:
150:
150:
130:
160:
15a’
—K
eyT
imes
Sum
mar
y:P
rovi
der
Tim
e**
0:33
0:22
0:56
0:25
0:27
0:17
Phy
sici
anT
ime
**
*0:
170:
150:
270:
210:
150:
13—
Exa
mR
oom
Tim
e1:
070:
321:
330:
311:
010:
29
Cli
nicT
ime
1:42
0:50
2:11
0:50
1:35
0:48
Not
es:
*%
ofal
lpa
tien
tsan
dsa
mpl
efo
rN
P&
RV
**
Pro
vide
rti
me
isth
eav
erag
etim
ew
ithan
ycl
inic
ian
enco
unte
rspe
rvi
sit.
Phy
sici
antim
eis
the
aver
age
time
with
the
staf
fph
ysic
ian
per
visi
t.
-T
imes
are
liste
din
hour
s:m
inut
es
Sou
rce:
Pat
ient
Tim
elin
eD
ata
Col
lect
ion
3/29
-4/9
/99
with
Sch
edul
eD
ata
Sam
ple
Siz
e=
215
Pat
ient
slO
E48
1

CC
CT
EA
MT
IME
LIN
EL
AT
ION
SUM
MA
RY
ST
AT
IST
ICS
-1.
2
Tim
elin
e:C
heck
InV
*%
ofal
lpa
tien
tpo
pula
tion
fl
**
Ave
rage
Tot
alT
ime,
Val
ueA
dded
Tim
ean
dN
on-V
alue
Add
edT
ime
are
the
sum
ofea
chev
ents
tim
em
ultip
lied
byth
e%
ofpa
tien
tsth
atex
peri
ence
dth
atev
ent.
-G
Mse
tsgo
alfo
rva
lue
adde
d%
at60
%.
-T
imes
are
list
edin
hour
s:m
inut
es
Sou
rce:
Pat
ient
Tim
elin
eD
ata
Col
lect
ion
3/29
-4/9
/99
with
Sch
edul
eD
ata
Sam
ple
Siz
e=
215
Pat
ient
s
Ave
rage
St.
Dcv
.
0:01
%of
Pat
ient
s
All
Pat
ients
:::
rNeW
Pat
ien
tsR
eturn
Patie
nt&
•NA
vera
ge
100%
0:01
St.D
ev;
.%of
Pat
ient
sA
jg:
100%
0:01
St
Dcv
.:%
ofP
atie
nts
100%
Wai
tfor
Vita
lsN
V0:
310:
4210
0%0:
270:
2310
0%0:
320:
4510
0%V
itals
V0:
020:
0310
0%0:
020:
0110
0%0:
020:
0410
0%W
aitf
orE
nco
unte
rlN
V0:
160:
1510
0%0:
150:
1110
0%0:
160:
1610
0%E
ncou
nter
1V
0:17
0:15
100%
0:27
0:21
100%
0:15
0:13
100%
Wai
tfo
rEn
counte
r2N
V0:
140:
1471
%0:
140:
1088
%0:
130:
1566
%E
ncou
nter
2V
0:09
0:13
71%
0:20
0:17
88%
0:07
0:11
66%
Wai
tfo
rEn
counte
r3N
V0:
060:
1039
%0:
110:
1434
%0:
050:
0939
%E
ncou
nter
3V
0:04
0:07
39%
0:08
0:11
34%
0:03
0:05
39%
Che
ckO
utV
0:05
0:05
100%
0:05
0:05
100%
0:05
0:05
100%
Ave
rage
Tot
alV
isit
Tim
e**
1:38
1:58
1:30
Val
ueA
dded
Tim
e**
0:33
0:55
0:29
Non
-Val
ueA
dded
Tim
e**
0:59
0:58
0:59
%V
alue
Add
edT
ime
34%
47%
32%
JIII
IhII
WII
IIII
PIII
lOE
481

CC
CT
EA
M3
RO
OM
UTI
LIZ.
1SU
MM
AR
Y-
1.3
.D
rS
hure
igi
Dr
Bre
nner
Dr
Ens
min
ger
Dr
Mon
tie4r
Pie
nta
Dr
Smith
Dr
Tod
dyX
AM
PM
..A
MP
MA
MP
MA
MP
M
_____
PMA
MP
MA
MPM
AM
IP
M4
MO
ND
AY
#of
Roo
ms
Allo
cate
d4
14
2
Hou
rsA
vaila
ble
44
44
InR
oom
Prov
ider
Tim
e(S
um)
71.
15.
74.
8
Patie
nt’s
Roo
mTi
me
(Sum
)16
3.0
14.3
8.6
%R
oom
Util
izat
ion
(Allo
cate
d)50
%38
%45
%54
%
%V
AR
oom
Util
izat
iori
(Allo
c.’t
21%
14%
18%
30%
TUES
DA
Y
#of
Roo
ms
Allo
cate
d4
43
3
Hou
rsA
vaila
ble
4.5
4.5
4.5
InR
oom
Prov
ider
Tim
e(S
um)
10.8
9.7
4.2
2.3
Patie
nt’s
Roo
mTi
me
(Sum
)2
2.4
20.1
12.7
6.9
%R
oom
Util
izat
ion
(Allo
cate
d)62
%56
%4
7%
26
%
%V
AR
oom
Util
izat
ion
(Allo
c.)
30%
27%
16%
9%W
EDN
ESD
AY #of
Roo
ms
Allo
cate
d2
23
3
Hou
rsA
vaila
ble
44.
54.
54.
5
InR
oom
Prov
ider
Tim
e(S
um)
2.8
2,2
4.2
1.5
Patie
nt’s
Roo
mT
ime
(Sum
)6.
85.4
12.7
4.6
%R
oom
Util
izat
ion
(Allo
cate
d)38%
30%
47
%17
%
%V
AR
oom
Util
izat
ion
(Allo
c.)
16%
12%
16%
6%TH
UR
SDA
Y #of
Roo
ms
Allo
cate
d4
47
Hou
rsA
vaila
ble
44
4
InR
oom
Prov
ider
Tim
e(S
um)
5.9
10.8
6.4
Patie
nt’s
Roo
mT
ime
(Sum
)14
.919
.613
%R
oom
Util
izat
ion
(Allo
cate
d)4
7%
61%
28%
%V
AR
oom
Util
izat
ion
(Allo
c.)
18%
34
%14
%FR
IDA
Y
#of
Roo
ms
Allo
cate
d4
3
Hou
rsA
vaila
ble
44
InR
oom
Prov
ider
Tim
e(S
um)
3.3
4,4
Patie
nt’s
Roo
mT
ime
(Sum
)8.
18.
1
%R
oom
Util
izat
ion
(Allo
cate
d)25%
34
%
%V
AR
oom
Util
izat
ion
(Allo
c.)
10%
18%
-T
imes
are
liste
din
Hou
rs
Sour
ce:
Patie
ntT
imel
ine
Dat
aC
olle
ctio
n3/
29-4
19/9
9w
ithSc
hedu
leD
ala
Sam
ple
Size
=21
5Pa
tient
s10
E481

Key
Tim
eS
umm
ary
Tim
ew
ithP
hysi
cian
(Avg
.)
Tim
ew
ithP
hysi
cian
(Std
.D
ev.)
-T
imes
are
list
edin
Hou
rs:M
inut
es
Sou
rce:
Pat
ient
Tim
elin
eD
ata
Col
lect
ion
3/29
-4/9
/99
with
Sch
edul
eD
ata
Sam
ple
Siz
e=
215
Pat
ient
s
CC
CT
EA
M‘
VIS
ITS
TA
Ti
CS
SUM
MA
RY
-1.4
0•S
hii
reiq
i1
IÀ
y
Sam
ple
Siz
e
%O
nT
ime/
Ear
lyA
rriv
als
%L
ate
Arr
ival
s
4
100.
00
NP
RV
NP
.<
RV
NP
RV
NP
FV
Dr
Bre
nner
Dr
En
s?ii
iner
Dr
Mon
tleD
rP
ie
7aD
rS
mh
Dr
Todd
>MdU
&
322
816
1050
4
75.0
050
.00
37.5
081
.25
80.0
082
.00
100.
00
21.8
850
.00
62.5
018
.75
20.0
018
.00
0:21
0:23
NP
RV
NP
jR
(N
P}R
V
1732
623
9
70.5
978
.13
83.3
382
.61
88.8
9
29.4
121
.88
16.6
717
.39
11.1
1
100.
00
0:21
0:46
0:16
0:08
0:23
0:14
0:30
0:11
0:13
0:41
0:18
0:22
0:25
0:12
1:02
0:11
0:05
0:14
0:14
0:19
0:07
0:11
0:16
0:07
0:10
Tim
ew
ithP
rovi
der
(Avg
.)0:
560:
300:
510:
370:
140:
430:
240:
430:
200:
231:
180:
270:
580:
25
Tim
ew
ithP
rovi
der
(Std
.D
ev.)
0:22
0:13
0:54
0:12
0:06
0:19
0:19
0:21
0:10
0:13
0:26
0:17
0:20
Tim
ein
Exa
mR
oom
(Avg
.)1:
321:
090:
511:
040:
401:
150:
471:
170:
421:
021:
510:
481:
260:
26
Tim
ein
Exa
mR
oom
(Std
.D
ev.)
0:43
0:44
0:21
0:15
0:21
0:26
0:23
0:30
0:23
0:31
0:27
0:31
0:19
Wai
tT
ime
(Avg
.)1:
141:
560:
420:
400:
340:
500:
540:
490:
371:
011:
010:
340:
450:
20
Wai
tT
ime
(Std
.D
ev.)
0:45
0:44
0:16
0:15
0:22
0:24
0:27
0:13
0:21
0:32
0:35
0:24
0:22
Vis
itD
urat
ion(
Avg
.)2:
511:
561:
171:
351:
032:
151:
311:
491:
181:
452:
391:
181:
531:
00
Vis
itD
urat
ion
(Std
.D
ev.)
1:03
0:39
0:33
0:25
0:25
0:53
0:33
0:24
0:25
0:35
0:28
0:30
0:24
Oth
erS
tati
stic
s
Ave
rage
#C
linic
ians
per
Vis
it1
22
21
22
11
2
Ave
rage
#E
ncou
nter
spe
rV
isit
22
22
22
22
22
32
2
10E
481

So
Peo
rllo
mfr
eD
Cdodio
.30
9-4/
94)9
6th
Sth
od
de
04t
Sam
ple
9-re
33P
eI.e
n/a
0U
al21
5S
rnpIe
Peba
Sa
0_3D
1,-
los
1030
19-3
00-0
09
20
I2
00-0
09(1
07-3
0Io
.vl
8•1
51•3
09-
fIn
1,-
Ic
lin
esar
eho
led
InH
ows:
Mks
uleo
Ofl
——
—=
=
Che
dcln
Tkn
e7:
4011
.31
8:30
12:2
89:
5911
:55
825
12:4
08:
407:
5774
)37:
3112
:06
84)7
12:2
87:
4011
:37
8:13
11:2
58:
3012
308:
2212
:43
827
1205
8:18
7:45
7:45
1213
8:18
7:30
11:5
412
:21
WaI
oT
r.o
8:20
12:0
884
)01:
3811
:03
223
8:36
12:4
79:
0284
)07:
507:
531:
1782
41:
1284
)01
22
08.
2212
-20
839
1236
83
31:
0684
)612
:56
8:24
84)6
7:50
12:2
08.
247:
4214
)914
)5
‘len
eInt
oExa
m,
Roo
m8:
2412
148:
401:
4011
:05
24)5
8:37
12:4
994
)584
)77:
557:
591:
20826
1:15
8:24
12:2
3826
1225
8:41
12.0
88:
3414
)982
712
598:
278:
107:
5412
:24
824
7:45
1:10
14)9
Thse
otl
ote
mo
surd
or
8:35
12:2
78:
521:
4511
:41
2:40
84)7
1257
928
8:15
82
482
01:
248:
521:
4084
)512
:33
828
12:3
59:
0412
:49
8:46
1:50
8:44
1:47
8:34
8:10
8:13
12:5
182
47:
481:
1512
0
8:30
7:44
)12
:15
8:15
8:00
12
15
05461

-T
imes
are
liste
din
Hou
rs:M
inut
es
Sou
rce:
Pat
ient
Tim
elin
eD
ata
Col
lect
ion
3/29
-4/9
/99
with
Sch
edul
eD
ata
Sam
ple
Siz
e=
215
Pat
ient
s
In
Jait
for
Vita
lsE
ncou
nter
Avg
.
0O
:0
1
NP
RV
.
Std.
Dev
.
CC
CT
EA
M‘i
ME
LIN
E-1
.6
0:55
0:33
0:38
0:33
0:01
Or.
Brn
neM
Dr.
Enst
hinQ
erD
rM
ontie
Dr. .
PeDr
.Sm
kh
DlT
àd
dI
NP
.,R
VN
PN
P.
NP
RV
0:01
0:01
0:01
0:01
0:01
0:01
0:01
0:01
0:01
0:01
0:14
0:18
0:12
0:29
0:46
0:18
0:21
0:34
0:35
0:18
0:16
0:19
0:11
0:12
0:14
0:18
1:11
0:16
0:20
0:29
0:25
0:18
0:12
0:00
0:01
%of
Pat
ient
s10
0%10
0%10
0%10
0%10
0%10
0%10
0%10
0%10
0%10
0%10
0%10
0%10
0%10
0%
Vita
lsE
ncou
nter
Avg
.0:
030:
020:
030:
030:
020:
010:
030:
030:
020:
020:
030:
020:
020:
03
SId.
Dev
.0:
020:
010:
000:
000:
010:
010:
070:
000:
010:
010:
010:
010:
000:
00
%of
Pat
ient
s10
0%10
0%10
0%10
0%10
0%10
0%10
0%10
0%10
0%10
0%10
0%10
0%10
0%10
0%
Wai
tfo
rE
ncou
nter
IA
vg.
0:10
0:26
0:27
0:13
0:08
0:17
0:15
0:21
0:09
0:16
0:10
0:11
0:10
0:01
Std
.D
ev.
0:11
0:19
0:05
0:10
0:08
0:09
0:17
0:10
0:12
0:16
0:07
0:10
0:07
0:00
%of
Pat
ient
s10
0%10
0%10
0%10
0%10
0%10
0%10
0%10
0%10
0%10
0%10
0%10
0%10
0%10
0%
Enc
ount
er1
Avg
.0:
2102
10:
460:
160:
080:
230:
140:
300:
110:
130:
410;
180:
22025
Std.
Dev
.0:
230:
121:
020:
110:
050:
140:
140:
190:
070:
110:
160:
070:
100:
00
%of
Pat
ient
s10
0%10
0%10
0%10
0%10
0%10
0%10
0%10
0%10
0%10
0%10
0%10
0%10
0%10
0%
Wai
tforE
nco
unte
r2A
vg.
0:16
0:23
0:00
0:12
0:14
0:17
0:08
0:18
0:11
0:16
0:14
0:12
0:11
-
Std.
Dev
.0:
140:
220:
000:
060:
160:
060:
080:
040:
090:
180:
180:
130:
09-
%of
Pat
ient
s10
0%53
%10
0%88
%81
%67
%81
%75
%65
%81
%10
0%57
%10
0%
Enc
ount
er2
Avg
.0:
300:
080:
050:
130:
030:
160:
070:
120:
070:
070:
300:
070:
25-
Std
.D
ev.
0:16
0:10
0:07
0:07
0:02
0:20
0:15
0:10
0:09
0:06
0:23
0:08
0:14
-
%of
Pat
ient
s10
0%53
%10
0%88
%81
%67
%81
%75
%65
%81
%10
0%57
%10
0%
Wai
tfo
rE
ncou
nter
3A
vg.
0:35
0:04
-0:
040:
060:
450:
05-
0:09
0:05
0:08
0:03
0:07
-
Std
.D
ev.
0:00
0:11
-0:
030:
08-
0:06
-0:
190:
050:
090:
050:
11-
%of
Pat
ient
s25
%3%
-50
%44
%17
%44
%29
%31
%33
%13
%67
%
Enc
ount
er3
Avg
.0:
080:
00-
0:07
0:03
0:06
0:05
-0:
010:
070:
070:
030:
13-
SId.
Dev
.0:
120:
03-
0:09
0:04
0:13
0:06
-0:
020:
060:
150:
070:
11-
%of
Pat
ient
s25
%3%
50%
44%
17%
44%
29%
31%
33%
13%
67%
Wai
tfo
rE
ncou
nter
4A
vg.
--
--
--
--
--
--
Std
.D
ev.
--
--
--
--
--
Enc
ount
er4
Avg
.-
--
--
--
--
--
-
Std
.D
ev.
--
--
.-
--
--
--
-
Che
ckO
utA
vg.
0:05
0:05
0:05
0:05
0:05
0:05
0:05
0:05
0:05
0:05
0:05
0:05
0:05
0:05
Std
.D
ev.
0:05
0:05
0:05
0:05
0:05
0:05
0:05
0:05
0:05
0:05
0:05
0:05
0:05
0:05
Clin
icV
isit
Tim
eA
vg.
2:51
1:56
1:44
1:35
1:03
2:15
1:31
1:49
1:18
1:45
2:39
1:18
1:53
1:00
Std
.D
ev.
1:03
0:39
0:25
0:25
0:25
0:53
0:33
0:24
0:25
0:35
0:28
0:30
0:24
0:00
Val
ueA
dded
Tim
eA
vg.
0:59
0:33
0:54
0:39
0:17
0:45
0:28
0:46
0:22
0:26
1:21
0:30
1:01
0:28
Std
.D
ev.
0:21
0:13
0:54
0:12
0:07
0:19
0:20
0:20
0:10
0:16
0:26
0:17
0:21
0:00
NonV
atueA
dded
Tim
eA
vg.
1:14
1:06
0:42
0:40
0:34
0:50
0:54
0:49
0:37
1:01
1:01
0:34
0:45
0:20
Std
.D
ev.
0:45
0:44
0:04
0:15
0:22
0:24
0:27
0:13
0:21
0:32
0:35
0:24
0:22
0:00
%V
alue
Add
edT
ime
34.5
0%28
.44%
51.9
2%41
.05%
26.9
8%35
.35%
30.7
7%42
.20%
18.6
4%23
.81%
50.9
4%38
.46%
53.9
8%46
.67%
10E
481
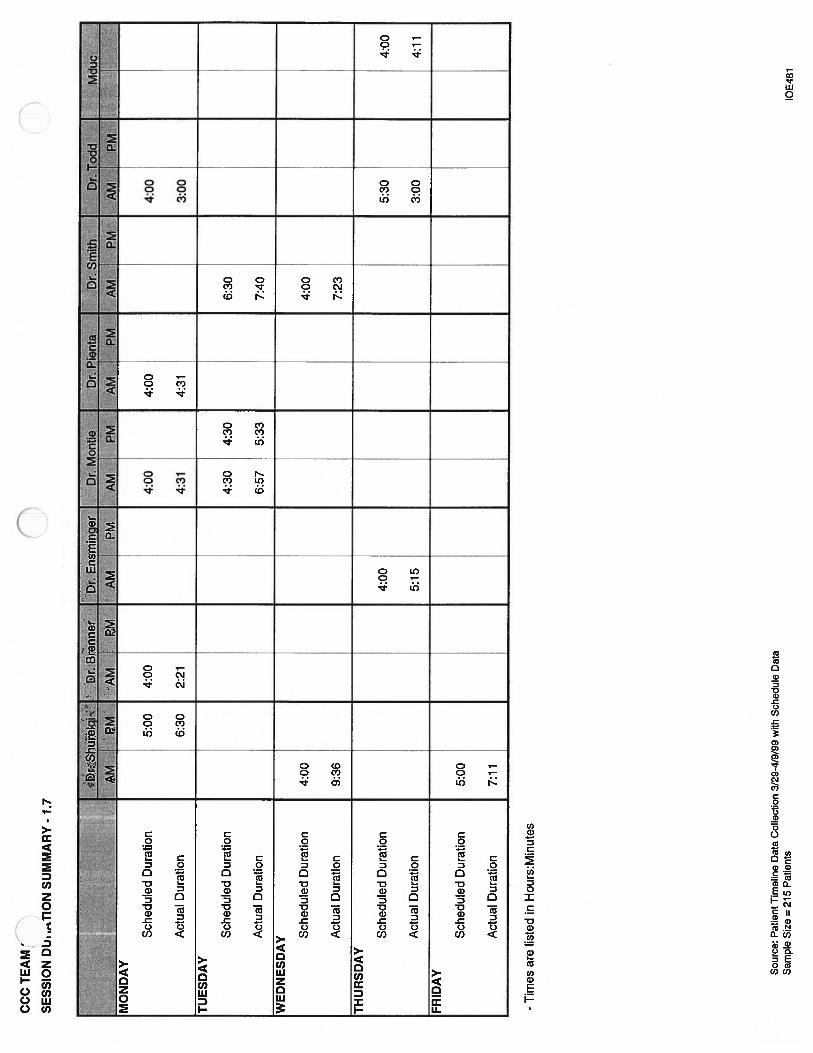
Sch
edul
edD
urat
ion
Act
ual
Dur
atio
n
-T
imes
are
liste
din
Hou
rs:M
inut
es
Sou
rce:
Pat
ient
Tim
elin
eD
ata
Col
lect
ion
3/29
-4/9
/99
with
Sch
edu
leD
ata
Sam
ple
Siz
e=
215
Pat
ients
4:00
3:00
CC
CT
EA
M’
SESS
ION
DL
h.T
ION
SUM
MA
RY
-1.
70
5:00
6:30
4:00
2:21
(fl
4:00
4:31
4:00
4:31
TU
ESD
AY
Sch
edul
edD
urat
ion
4:30
4:30
6:30
Act
ual
Dur
atio
n6:
575:
337:
40
WE
DN
ESD
AY S
ched
uled
Dur
atio
n4:
004:
00
Act
ual
Dur
atio
n9:
367:
23
TH
UR
SDA
Y
Sch
edul
edD
urat
ion
4:00
5:30
4:00
Act
ual
Dur
atio
n5:
153:
004:
11
FRID
AY
Sch
edul
edD
urat
ion
5:00
Act
ual
Dur
atio
n7:
11
10E
481

Fgu
reic
160
140
120
100 80 60 40 20
0
Val
ueA
dd
edv
s.N
on-V
alue
Added
for
New
Pat
ien
ts
Cl)
C)
II
•N
on-V
alue
Add
edLI
Val
ueA
dded

nFi
gure
2C
Val
ueA
dded
vs.
Non
-Val
ueA
dded
for
Ret
urn
Vis
its
In
•N
on-V
alue
Add
edE
Val
ueA
dded

nF
igur
e3C
%V
alue
Add
edvs
.%
Non
-Val
ueA
dded
for
New
Pat
ients
120%
100% 80%
-
60%
40%
20%
(0
/V
/0
II
•%
Non
-Val
ueA
dded
Tim
eE
%V
alue
Add
edT
ime
II

Figu
re4C
120%
100% 40%
20%
2%
Val
ueA
dded
vs.
%N
on-V
alue
Tim
efo
rR
etur
nP
atie
nts
•%
Non
-Val
ueA
dded
Tim
eA
dded
Tim
e
80%
60%
(iO
!V
/0

Figu
re5C
160
140
120
100 80 60 40 20 0
fl
Physi
cian
Tim
ev
s.E
xam
Roo
mT
ime
for
New
Pat
ien
ts
n
0 C
•E
xam
Roo
mT
ime
UP
hysi
cian
Tim
e
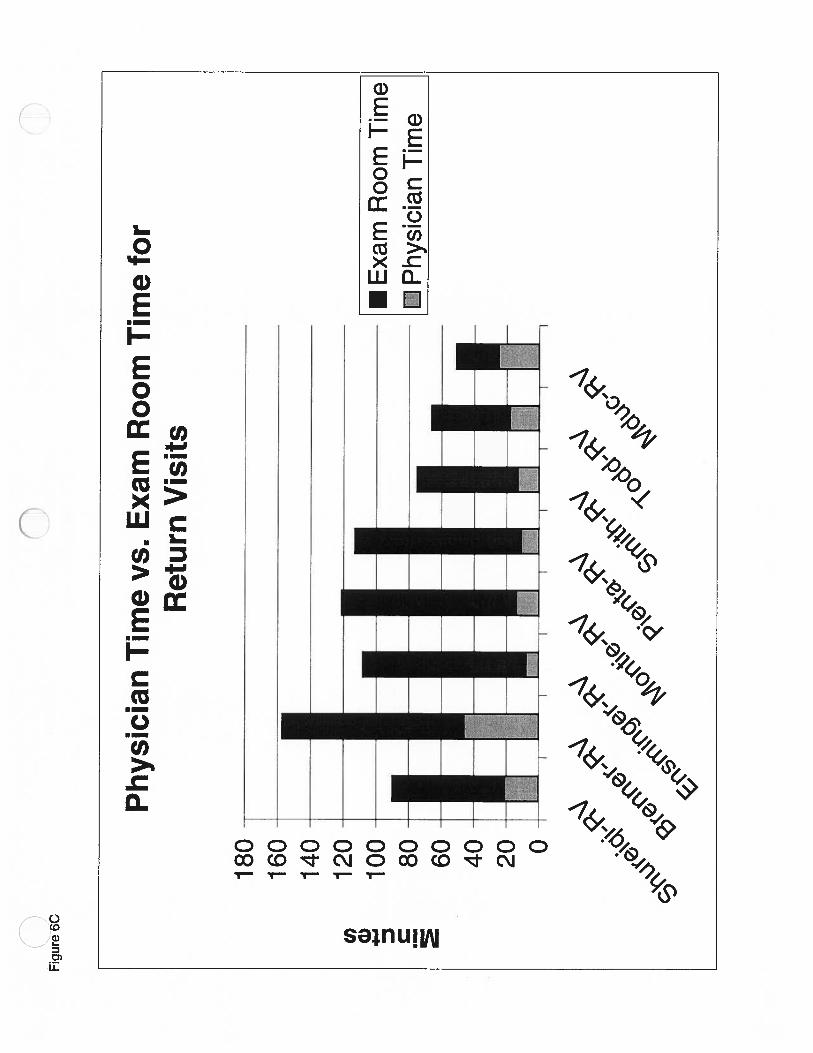
n0
Fig
ure6
C
Physi
cian
Tim
ev
s.E
xam
Roo
mT
ime
for
Ret
urn
Vis
its
180-
160-
140-
120-
100-
80-
_____________
60-
40
-20 0-
ICl
) a)m II
I•II
•E
xam
Roo
mT
ime
EBP
hysi
cian
Tim
e
II
I

Figu
re7C
80 60 40 20 00 80 60 40 200
fl
Wai
tD
urat
ion
vs.
Vis
itD
urat
ion
for
New
Pat
ien
ts
1 1 1 1 1C’
)G) C
\\/N
Wai
tT
ime
Vis
itT
ime

Wai
tD
urat
ion
vs.
Vis
itD
urat
ion
for
Ret
urn
Vis
its
Wai
tT
ime
H”-V
isit
Tim
e
nFi
gure
3Cn
140
120
100 80 60 40 20
0

0

( Comprehensive Cancer Center
Team 5
Tis section displays Team 5’s findings and conclusions. This data further stratifies thedata displayed in the summary findings found in Appendix D.
1.0 Summary Statistics
This sheet describes general statistics of patients that arrive early/on time and late and keytimes of the amount of time a patient spends in the clinic and providers.
On average, about 80% of the patients arrive early or on time by about 19 minutes and20% of patients arrive late by about 27 minutes. Even though the number of late arrivalsis small, it is still very significant. The data indicates that the late patients push backother patients that arrive on time. When a late patient arrive, they are placed into anotherpatient’s time slot disrupting the schedule flow.
The key times summary indicates that, on average, a patient spend 1:17 at the clinic(check-out-check-in) and 50 minutes of that time is spent in the exam room. A patientspends 14 minutes with a physician which is 18% of the total clinic time and 23 minutesis spent with all providers. New patients spend more time in the clinic than returnpatients and spend a higher percentage of time with a physician.
Figures D 1 and D 2 show the breakdown by each type of patient how long their clinictime is in comparison to a patient’s physician time. Non of the physician times exceed50% of the clinic times.
1.2 Timeline Duration Summary Statistics
This information describes the average times and standard deviations of each wait timeand activity a patient encounters during a visit. The data show that new patients spendmore time waiting in the lobby before a vitals encounter than return patients. Thisinformation differs from the previous page as each average time for each encounter isadded up to give an average total visit time. Value Added percentage is calculated asvalue added time/average total visit time. A patient’s percentage value added time is 32%for all patients and 35 % individually for new patients and return visits. Thesepercentages are low and the goal of UMHS is to have a 60% value added time.
The data also indicates that the average time a patients spends waiting (non value added)is much longer than when it is spent with a provider (value added). This is also shown infigures D.3 and D.4 (for new patients and return patients).

1.3 Visit Statistics Summary
This gives a breakdown of the key visit statistics of NP and RV patients by doctor. Formost of the doctors, the data shows that the time with all providers and a physician inmuch lower in comparison to the wait time and visit duration of all the patients.
Figures D.5 and D.6 show the visit durations and wait times of each physician’s patients.This was created by taking wait times listed in the Visit Statistics Summary andcomparing them to the clinic visit time. The wait times are consisitent for each physicianyet the clinic times vary considerably.
Figures D.7 and D.8 show the percentages of value and non value added times for newand return patients by doctor. For all physicians except for Dr. Muliholland in newpatients is the percentage of non value added time greater than the value added time.
1.4 Timeline Summary
This is a breakdown of average times and standard deviations of each activity by doctor.The data indicates that the % value added times range from 15% to 74%. For almost allthe doctors, the non value added times are much longer than the non value added times.This means that the patients are mostly waiting during their visit than meeting with aprovider.
1.5 Room Utilization Summary
This summarizes how effectively the rooms are being by each doctor and for BCC andSXO on Monday. if the % Value Added Room Utilization is lower than the % RoomUtilization, then patients are in the rooms waiting or being parked in the exam rooms.The goal of UMHS is to raise both of these percentages up to 60%.
1.6 Session Duration Summary
The scheduled duration is the scheduled appointment time of each physician’s firstpatient to the scheduled appointment of each physician’s last patient in the morning andafternoon. The actual duration is based upon when the first patient arrives to when thelast patient checks out. if we did not have a data from a first or last patient, informationwas extrapolated from our data. If a first patient’s information was missing, it wasassumed that that patient arrived on time and the first appointment time was used. If thelast patient’s infonuation was not available, an average of the patient’s physician timewas taken and added onto the time of the last appointment.

Most of the time, the scheduled duration is much lower than the actual duration of eachphysician. This could be due to many factors such as patients arriving late, patients beingseen on a first come, first serve basis and others that are given in detail in the full report.
1.7 First Patient Summary
The first patient’s information for each doctor in the morning and afternoon session islisted in this section. This information is only from the data that is received from the datasheets so this information may not be the exact first patient, but of the first patient whoseinformation is available. The data indicates that the first encounter of each patient usuallyfalls after the scheduled appointment time of the patient. The goal of UMHS is to havethe first encounter time to be the scheduled appointment time.
2.0 Recommendations
The recommendations given apply to all clinics and are given in detail in the full report.Following is a list of the recommendations:
• Review patient scheduling and implement a buffer of 15-30 minutes to theappointment time given to the patient to account for the check-in process.
• Condition patients to arrive on time by admitting them according to their appointmenttimes and not on first come, first serve basis.
• Use exam rooms properly and only for their required uses• Use consult rooms to their full effects• Use only the rooms appointed to each team on any given day• Implement another study for New Patient Data sue to the low number of new patients
that were seen during the time of this study• Review the clinics again for continuous improvement after the recommendations of
this study has been implemented
0

Cl)
G) z G) I—C Figu
reD
.1
Ave
rage
Physi
cian
Tim
ever
sus
Ave
rage
Cli
nic
Tim
eof
New
Pat
ients
160
140
120
100 80 60 40 200
•C
linic
Tim
e•
Phy
sici
anT
ime
Doct
or

nfl
Figu
reD
.2
Av
erag
eP
hysi
cian
Tim
ev
s.A
ver
age
Cli
nic
Tim
eof
Ret
urn
Pat
ients
••
——
—r.
CIf
lIC
Tim
e•
••
••
••
•P
hysic
ianT
ime
••••••••
160
—-
-14O
G) 4 z CIV
U
!i
iil
lU.
1111
111
00
00
Doct
or

nIn
Fig
ure
D.3
Val
ue
Ad
ded
vs.
Non
Val
ue
Added
Dis
trib
uti
on
for
New
Pat
ients
Cl)
0 C a) E .1-I
160
140
120
100 80 60 40 200
•N
onV
alue
Add
edJV
aIu
eA
dded
Doct
or

o0
Figu
reD
.4
Valu
eA
dd
ed
vs.
No
nV
alue
Added
fo
rR
eturn
Patients
9O
__
__
__
___
__
__
__
__
__
__
__
___
080
70
—
I IJirn_i I
OO
0
Doct
or

nC
Figu
reD
.5
Non
Val
ue
Added
Tim
ev
s.V
isit
Dura
tion
25
O
(I) a) z C G) E I-
200
150
100 50 0
Non
Val
ueA
dded
Tim
e
.V
isit
Dur
atio
n
II
Doc
tor

Time(minutes)LLL
OF\Z4O)O0000000000
‘Ii
ct
Chang
Colletti
Coon
Eckhauser
Knol
aNurse
Pass
Peariman
Sondak
z01<
D)ECD
CD
-I
CD
j)
C
0)
o.
D
cD
Yahanda
+0 <zlZ
C—
C
DciciCDci

n Figu
reD
.7
%V
alue
Add
edT
ime
vs.
%N
onV
alue
Add
edT
ime
for
New
Pat
ients
C) .1-I C) C.)
C) a-
120.
00%
100.
00%
80.0
0%60
.00%
40.0
0%20
.00%
0.00
%
:m •i!Ji•
iii
rti
I!NL
•%N
onV
alue
Add
edT
ime
D%
Val
ueA
dded
Tim
e
Doc
tor

n Figu
reD
.8
%V
alue
kided
vs.
%N
on
Valu
ek
id
ed
lim
efo
rR
eturn
Pat
ient
s
fl
120.
00%
a E8
o.00%
__
____________
I%
Non
Val
ueA
dded
iin1
4000
<YD
%V
alue
Add
edli
me
D‘D
rrv
—o’
L.’
J.’
JJIO
0.00
4,I
II
II
I
Doc
tor

Not
es:
*P
hysi
cian
tim
eis
the
aver
age
tim
ew
ithth
est
aff
phys
icia
npe
rvi
sit.
**
Pro
vide
rtim
eis
the
aver
age
time
with
any
clin
icia
npe
rvi
sit.
-T
imes
are
liste
din
hour
s:m
inut
es
Sou
rce:
Pat
ient
Tim
elin
eD
ata
Col
lect
ion
3/29
-4/9
/99
with
Sch
edul
eD
ata
Sam
ple
Siz
e=
125
Pat
ient
s
0
neral
lita
tist
[.s:
#P
atie
nts
CC
AM
5SU
MM
Ak
.TA
TlS
TIC
S
.A
ll:P
atie
nts
New
Pat
ient
s••:
Ret
urn
Pat
iehts
Ave
rage
StD
cv%
ofPa
tient
sA
v4ge
StD
ev%
ofP
atie
nts
Ave
rage
StD
ev%
ofPa
tient
s$th
125
100%
2822
%97
78%
#E
arly
Arr
ival
s10
080
%24
86%
7678
%E
arly
Tim
e0:
190:
300:
260:
560:
180:
15
#L
ate
Arr
ival
s25
20%
414
%21
22%
Lat
eT
ime
0:27
0:32
0:18
0:15
0:28
0:34
——
II?f’
I’IM
Iii
IIIiI
êrtiW
!K
eyT
imes
Sum
mar
y:P
hysi
cian
Tim
e*0:
140:
110:
210:
130:
130:
11
Pro
vide
rTi
me*
*0:
230:
190:
310:
260:
210:
16
Exa
mR
oom
Tim
e0:
500:
34r
1:04
0:37
0:45
0:32
Clin
icT
ime
1:17
0:38
1:36
0:40
1:12
0:36
10E
481

CC
CTE
AM
5TI
MEL
INE
DU
ON
SUM
MA
RY
STA
TIS
TIC
S
‘All
Pati
ent
‘‘
‘N
ewP
atie
nts
‘‘-‘
Ret
urn
Pat
ient
s..
Ave
rage
St
Dev
%of
Pat
ient
sA
vera
St
Dev
%of
Pat
ient
sA
vera
geS
tD
ev%
ofT
imel
ine:
Che
ckIn
V1
100%
110
0%1
100%
Wai
tfo
rV
itals
NV
1818
1 00%
2220
100%
1717
100%
Vita
lsV
21
100%
22
100%
21
100%
Wai
tfo
rE
ncou
nter
1N
V16
1410
0%17
1610
0%15
1410
0%E
ncou
nter
1V
1110
100%
1210
100%
1110
100%
Wai
tfo
rE
ncou
nter
2N
V12
1265
%12
1019
%12
1346
%E
ncou
nter
2V
613
65%
1021
19%
610
46%
Wai
tfo
rE
ncou
nter
3N
V11
1627
%10
810
%11
1918
%E
ncou
nter
3V
28
27%
614
10%
16
18%
Wai
tfo
rE
ncou
nter
4N
V0
00%
00
0%0
00%
Enc
ount
er4
V0
00%
00
0%0
00%
Che
ckO
utV
55
100%
55
100%
55
100%
Ave
rage
Tot
alV
isit
Tim
e*73
6462
Val
ueA
dded
Tim
e*23
2322
Non
-Val
ueA
dded
Tim
e*45
4239
%V
alue
Add
edT
ime
,32
%35
%35
%m
wii;
:‘:
‘..tj
*A
vera
geT
otal
Tim
e,V
alue
Add
edT
ime
and
Non
-Val
ueA
dded
Tim
ear
eth
esu
mof
each
even
tsti
me
mul
tiplie
dby
the
%of
pati
ents
that
expe
rien
ced
that
even
t.
-G
Mse
tsgo
alfo
rva
lue
adde
d%
at60
%.
Sou
rce:
Pat
ient
Tim
elin
eD
ata
Col
lect
ion
3/29
-4/9
/99
with
Sch
edul
eD
ata
Sam
ple
Siz
e=
125
Pat
ient
s10
E48
1

-T
imes
are
liste
din
l-lo
urs:
Min
utes
Sou
rce:
Pat
ient
Tim
elin
eD
ata
Col
lect
ion
3/29
-4/9
/99
with
Sch
edul
eD
ata
Sam
ple
Siz
e=
125
Pat
ient
s
10
66.6
780
.00
33.3
320
.00
CC
CT
EA
M1
VIS
ITS
TA
TIS
EJM
MA
RY
aene
ra.
Sam
ple
Siz
e
%O
nT
ime/
Ear
lyA
rriv
als
%L
ate
Arr
ival
s
321
42
100.
0066
.67
100.
0010
0.00
50.0
0
0.00
33.3
30.
000.
0050
.00
Key
Tim
eS
umm
ary
Tim
ew
ithP
hysi
cian
(Avg
.)
Tim
ew
ithP
hysi
cian
(Std
.D
ev.)
8
87.5
0
12.5
0
0:04
0:08
0:16
0:06
0:18
0:01
0:08
0:12
0:06
0:12
100.
00
0.00
2
100.
00
0.00
7
85.7
1
14.2
9
0:07
0:06
0:08
0:03
23
77
29
29
100.
0010
0.00
57.1
485
.71
50.0
088
.89
79.3
1
0.00
0.00
42.8
614
.29
50.0
011
.11
20.6
9
0:50
0:12
#DIV
/0!
0:08
Tim
ew
ithP
rovi
der
(Avg
.)0:
060:
160:
160:
060:
320:
210:
150:
500:
190:
310:
570:
270:
340:
140:
180:
180:
340:
18
Tim
ew
ithP
rovi
der
(Std
.D
ev.)
0:01
0:15
0:12
0:05
0:07
0:10
0:10
#DIV
/0!
0:02
0:16
1:06
0:24
0:15
0:07
0:10
0:18
0:33
0:17
Tim
ein
Exa
mR
oom
(Avg
.)0:
350:
430:
310:
211:
090:
520:
590:
500:
520:
451:
261:
111:
180:
410:
510:
421:
160:
47
Tim
ein
Exa
mR
oom
(Sld
.D
ev.)
0:14
0:35
0:05
0:10
0:06
0:11
0:10
#DIV
/0!
0:43
0:12
1:28
1:05
0:36
0:17
0:21
0:28
0:39
0:36
Wai
tTim
e(A
vg.)
0:36
0:42
0:27
0:21
0:49
1:01
1:03
0:17
0:28
0:35
1:14
0:52
1:17
0:57
0:57
0:46
1:11
0:53
Wai
tT
ime
(Sid
.D
ev.)
0:11
0:30
0:07
0:11
0:13
0:34
0:31
#DIV
/0?
0:10
0:15
0:57
0:45
0:28
0:10
0:18
0:21
0:03
0:32
Vis
itD
urat
ion
(Avg
.)0:
591:
020:
460:
321:
33
Vis
itD
urat
ion
(Std
.D
ev.)
0:04
0:37
0:06
0:09
0:07
0:31
0:04
0:11
0:15
0:09
0:13
0:11
0:05
0:11
0:16
0:04
0:06
0:06
0:00
0:09
0:12
0:04
0:07
Oth
erS
tati
stic
s
Ave
rage
CC
linic
ians
per
Vis
it1
21
14
32
12
14
33
22
23
2
Ave
rage
#E
ncou
nter
spe
rV
isit
12
11
22
21
21
22
22
22
2
1:26
1:31
1:07
1:13
1:08
2:22
1:32
1:55
1:18
1:18
1:08
1:52
1:20
0:26
0:19
#DIV
/Ol
0:47
0:30
1:21
1:05
0:38
0:19
0:20
029
0:31
0:35
1OE4
81

CC
CT
EA
M5
n
-T
imes
are
liste
din
I-fo
urs
Sou
rce:
Pat
ient
Tim
elin
eD
ata
Col
lect
ion
3)29
-4/9
/99
with
Sch
edul
eD
ata
Sam
ple
Siz
e=
125
Pat
ient
s
12 4-5
22.5
3
48.1
45%
21%
12 4.5
4.77
10.1
8
9% 4%
4 4-5
3.4
7
14.2
7
40%
10%
4 4.5
4.98
20.5
1
57%
14%
RO
OM
UT
ILIZ
AT
kJM
MA
RY
#of
Roo
ms
Allo
cate
d
Hou
rsA
vaila
ble
InR
oom
Pro
vide
rT
ime
(Sum
)
Pat
ient
’sR
oom
Tim
e(S
um)
%R
oom
Util
izat
ion
(Allo
cate
d)
%V
AR
oom
Util
izat
ion
(Allo
c.l
TU
ESD
AY
#of
Roo
ms
Allo
cate
d1
1
Hou
rsA
vaila
ble
4.5
4.5
Pro
vide
rT
ime
(Sum
)3.
79t5
2
Roo
mT
ime
(Sum
>6.
672.
67
%R
oom
Util
izat
ion
(Allo
cate
d)74
%30
%
%V
AR
oom
Util
izat
ion
(Allo
c.)
42%
17%
WE
DN
ESD
AY
#ofR
oom
sAll
oca
ted
56
6
Hou
rsA
vaila
ble
44
4
Pro
vide
rT
ime
(Sum
)1
.33
0.8
06.7
7
Roo
mT
ime
(Sum
)6.
937.
6021
.93
%R
oom
Util
izat
ion
(Allo
cate
d)35
%32
%46
%
%V
AR
oom
Util
izat
ion
(Allo
c.)
7%
3%14
%T
HU
RSD
AY #
ofR
oom
sA
lloca
ted
34
61
33
62
Hou
rsA
vaila
ble
4.5
45
44
44
44
Pro
vide
rTim
e(S
um)
3.00
3.40
3.90
0.60
4.93
5.32
3.95
5.68
Ro
om
Tim
e(S
um
)10
.63
12
.04
6.3
02.1
016.1
312.8
35.1
014.3
0
%R
oom
Util
izat
ion
(Allo
cate
d)39
%33
%13
%53
%67
%53
%11
%89
%
%V
AR
oom
Util
izat
ion
(Allo
c.)
11
%9%
8%15
%21
%44
%8%
36%
FRID
AY
#of
Roo
ms
Allo
cate
d
Hou
rsA
vaila
ble
Pro
vide
rT
ime
(Sum
)
Roo
mT
ime
(Sum
)
%R
oom
Util
izat
ion
(Allo
cate
d)
%V
AR
oom
Ufi
lizat
ion_
(Allo
c.)
10E
481
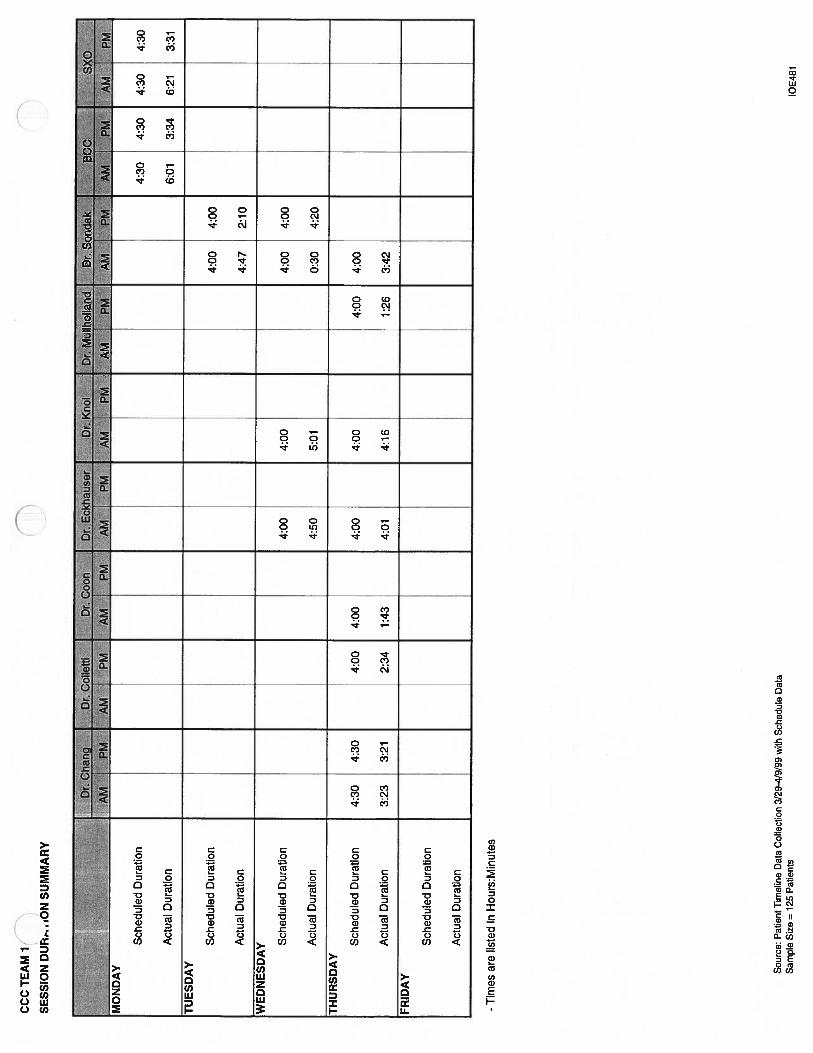
NC
CC
TE
AM
1
SE
SS
ION
DU
R,-
..iO
NSU
MM
AR
Y
Sch
edul
edD
urat
ion
Act
ual
Dur
atio
n
-T
imes
are
liste
din
Hou
rs:M
inut
es
Sou
rce:
Pat
ient
Tim
elin
eD
ata
Col
lect
ion
3129
-4/9
/99
with
Sch
edul
eD
ata
Sam
ple
Size
=12
5P
atie
nts
0
4:30
6:01
4:30
3:34
4:30
6:21
4:30
3:31
TU
ESD
AY
Sch
edul
edD
urat
ion
4:00
4:00
Act
ual
Dur
atio
n4:
472:
10
WE
DN
ESD
AY S
ched
uled
Dur
atio
n4:
004:
004:
004:
00
Act
ual
Dur
atio
n4:
505:
010:
304:
20
TH
UR
SDA
Y
Sch
edul
edD
urat
ion
4:30
4:30
4:00
4:00
4:00
4:00
4:00
4:00
Act
ual
Dur
atio
n3:
233:
212:
341:
434:
014:
161:
263:
42
FRID
AY
Sch
edul
edD
urat
ion
Act
ual
Dur
atio
n
10E
481
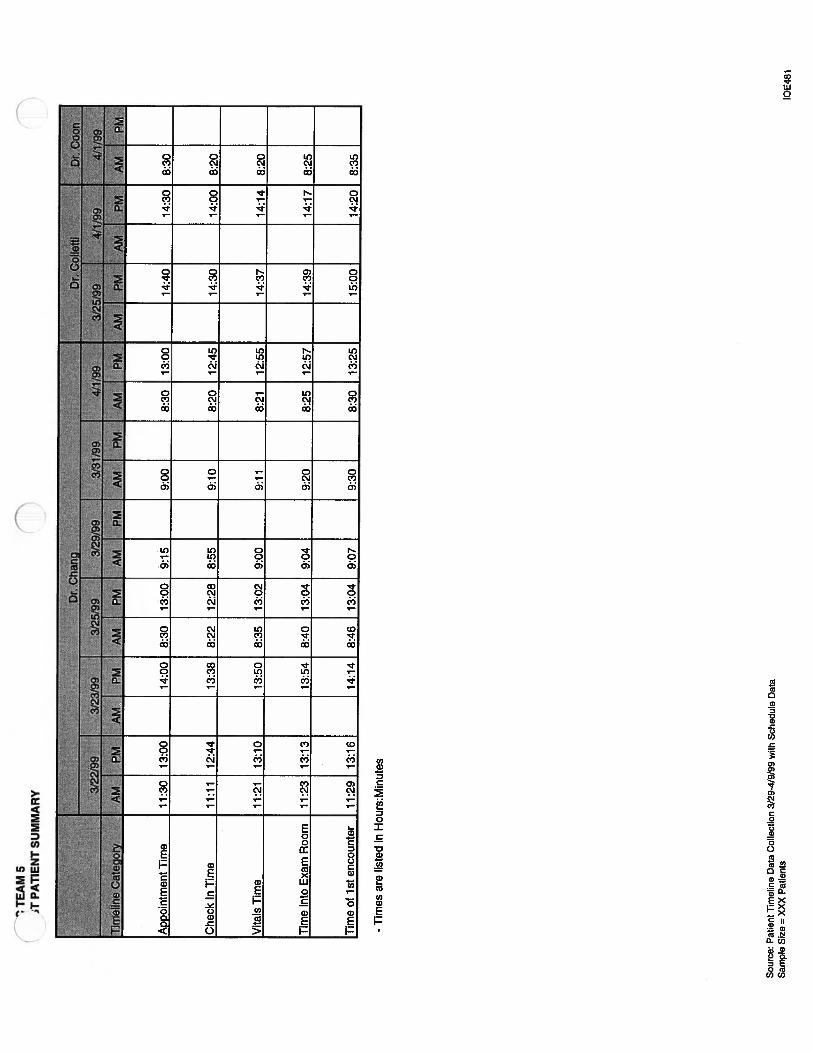
Che
ckIn
Tim
e11
:11
12:4
413
:38
8:22
12:2
88:
559:
108:
2012
:45
14:3
014
:00
8:20
Vit
alsl
ime
11:2
113
:10
13:5
08:
3513
:02
9:00
9:11
8:21
12:5
514
:37
14:1
48:
20
Tim
ein
toE
xam
Roo
m11
:23
13:1
313
:54
8:40
13:0
49:
049:
208:
2512
:57
14:3
914
:17
8:25
Tim
eofi
sten
counte
r11
:29
13:1
614
:14
8:46
13:0
49:
079:
308:
3013
:25
15:0
014
:20
8:35
-T
imes
are
list
edin
Hou
rs:M
inut
es
Sou
rce:
Pat
ient
Tim
elin
eD
ata
Col
lect
ion
3/29
-4/9
/99
with
Sch
edul
eD
ata
Sam
ple
Siz
e=
XX
XP
atie
nts
‘TE
AM
5T
PAT
IEN
TSU
MM
AR
Y
AD
coin
tmen
tTim
e11
:30
13:0
014
:00
8:30
13:0
09:
159:
008:
3013
:00
14:4
014
:30
8:30
10E
481

Che
ckIn
Tim
e7:
349:
408:
3511
:05
7:40
14:5
011
:36
15:3
0
Vit
alsT
ime
8:40
9:55
8:36
11:1
37:
5015
:04
11:4
216
:01
Tim
ein
toE
xam
Roo
m8:
409:
588:
4211
:15
7:54
15:0
611
:45
16:0
2
Tim
eof
1st
enco
unte
r9:
309:
588:
4311
:51
7:54
15:1
012
:02
16:1
3
Sou
rce:
Pat
ient
Tim
elin
eD
ata
Col
lect
ion
3/29
-4/9
/99
with
Sch
edul
eD
ata
Sam
ple
Siz
e=
XXX
Pat
ient
s
App
oint
men
tT
ime
8:45
9:45
8:45
11:0
08:
0015
:00
12:0
015
:30
10E
481

Dr.
i-’as
sD
r.P
eari
ma
3/22
/99
3/23
/99
3/25
/99
3/29
/99
3/31
/99IF
4,
22
19
9Ii
I1%
f,J1
1f5
jInatgofA
MIP
MA
M1P
MA
MI.
PM
AM1P
MA
M1P
MA
M1P
jtJI
App
oint
men
tTim
e8:
1513
:10
11:0
014
:30
12:3
013
:00
8:10
9:30
Che
ckIn
Tim
e8:
1312
:30
11:0
013
:42
7:50
13:0
17:
559:
25
Vit
alsT
ime
8:24
12:4
611
:12
13:4
28:
0013
:06
8:19
9:32
Tim
ein
toE
xam
Roo
m8:
2612
:49
11:1
413
:55
8:03
13:2
68:
209:
40
Tim
eof
1st
enco
unte
r8:
3313
:13
11:1
814
:04
8:25
13:2
68:
269:
55
Sou
rce:
Pat
ient
Tim
elin
eD
ata
Col
lect
ion
3/29
-4/9
/99
with
Sch
edul
eD
ata
Sam
ple
Siz
e=
XX
XP
atie
nts
10E
481

iat
IbdIIii
IbeI
utri
2f4ê3
J22J
99It
3iS
I99
1)2
/99
‘5/99
3129
199!
1&
M9
3/25
/99
3/2
2/Vj
99
i*i
j$Ifj799
II
IT
imeIin
áto
ry4
AM
MM
4P
MA
MPM
AM
PM
AM
PM
‘AM
PM
’A
M.
‘PM
‘AM
’•P
MA
M’
‘PM
&
Arr
noin
tmen
tTim
e14
:00
8:30
12:3
011
:00
13:0
09:
008:
1514
:30
13:1
58:
308:
1512
:30
8:00
9:10
10:3
0
Che
ckIn
Tim
e13
:40
7:50
12:3
010
:48
12:4
58:
348:
0814
:30
12:2
38:
258:
0212
:40
7:33
9:10
10:1
0
Vit
aisT
ime
13:5
07:
5512
:31
11:1
013
:13
9:11
8:15
15:0
012
:30
8:38
8:27
12:4
67:
389:
1110
:17
Tim
ein
toE
xam
Ro
om
13:5
38:
0012
:25
11:1
213
:16
9:13
8:19
15:0
413
:25
8:41
8:29
12:5
08:
119:
2110
:20
Tim
eof
1st
enco
unte
r13
:55
8:25
12:5
111
:13
13:4
59:
348:
3215
:09
13:2
09:
038:
3813
:30
8:14
10:3
510
:30
Sou
rce:
Pat
ient
Tim
elin
eD
ata
Col
lect
ion
3/29
-4/9
/99
with
Sch
edul
eD
ata
Sam
ple
Siz
e=
xxx
Pat
ient
slO
E48
1

Tea
m5
Tim
elin
eS
vy
DtS
oñ
_AL
iv
av
-Tim
esar
elis
ted
inH
ours
:Min
utes
Sour
ce:
Pat
ient
lim
elin
eD
ata
Col
lect
ion
3/29
-4/9
/99
with
Sch
edul
eD
ata
Sam
ple
Size
=X
XX
Pat
ient
s
DM
ulf
holf
and.
NP
Nø-R
.:::
NP
RV
:4P
*BY
::N
urs
Pas.
RV
‘NP
t4R
V’’
__
_
—-
—=
—I
Che
cktn
0:01
0:01
Io:o
i0
:01
0:0
10:
010:
010:
010:
010:
010:
010:
010:
010:
010:
010:
010:
01L
Q:O
lW
aitl
orV
itals
Enc
ount
erA
vg.
0:17
0:10
I0:
110:
000:
1002
80:
210:
000:
090:
180:
120:
100:
320:
300:
230:
200:
300:
17St
d.D
ev.
0:14
0:09
0:23
0:20
0:00
0:06
0:17
0:02
0:05
0:23
0:02
0:21
0:16
0:26
0:23
vita
lsE
ncou
nter
Avg
.0:
020:
020:
020:
020:
060:
020:
020:
000:
010:
020:
030:
020:
020:
020:
020:
020:
000:
01St
d.0e
v.0:
010:
030:
010:
000:
050:
010:
000:
000:
000:
010:
020:
010:
000:
000:
010:
010:
000:
00W
aitf
orE
ncou
nter
IA
vg.
0:12
0:13
0:14
0:12
0:21
0:20
0:21
0:00
0:02
0:14
0:09
0:10
0:24
0:23
0:18
0:15
0:17
0:18
Std.
Day
.0:
160:
120:
100:
080:
200:
200:
190:
000:
020:
040:
110:
090:
120:
090:
200:
120:
200:
23E
ncou
nter
1A
vg.
0:04
0:08
0:16
0:06
0:18
0:08
0:07
0:50
0:12
0:31
0:04
0:11
0:15
0:09
0:13
0:11
0:05
0:11
Std.
Dev
.0:
010:
080:
120:
060:
120:
030:
060:
000:
080:
160:
040:
060:
060:
000:
090:
120:
040:
07W
aitt
orE
ncou
nter
2A
vg.
0:04
0:15
-0:
040:
200:
100:
19-
0:14
-0:
150:
250:
110:
000:
130:
080:
150:
05S
td.D
ev.
0:04
0:11
-0:
000:
000:
100:
19-
0:00
-0:
140:
240:
080:
000:
140:
110:
110:
04E
ncou
nter
2A
vg.
0:02
0:05
00
00:
060:
110:
07-
0:07
-0:
420:
070:
120:
050:
030:
050:
060:
05SI
d.0e
v.0:
020:
10-
0:00
0:09
0:10
0:09
-0:
10-
1:04
0:08
0:06
0:07
0:04
0:10
0:08
0:12
Wai
tfor
Enc
ount
er3
Avg
.-
0:17
--
0:00
0:04
0:03
--
0:02
022
0:14
-0:
170:
060:
100:
12S
td.D
ev.
-0:
30-
-0:
000:
020:
00-
--
0:03
0:25
0:08
-0:
100:
04000
0:00
Enc
ount
er3
Avg
.0:
000:
010:
000:
000:
070:
010:
00-
0:00
-0:
100:
070:
06-
0:01
0:02
0:23
0:00
Std.
Dev
.0:
000:
040:
000:
000:
090:
020:
01-
0:00
-0:
080:
160:
09-
0:03
0:06
0:40
0:01
Che
ckO
utA
vg.
0:02
0:04
0:01
0:01
0:07
0:02
0:07
0:17
0:03
0:02
0:40
0:03
0:02
0:03
0:01
0:03
0:03
0:06
Std.
0ev.
0:00
0:04
0:00
0:01
0:00
0:02
0:06
0:00
0:01
0:02
1:08
0:03
0:03
0:00
0:00
0:04
0:02
0:09
Ctin
icV
isilT
ime
Avg
.0:
591:
020:
460:
321:
331:
261:
311:
071:
131:
082:
221:
321:
551:
181:
181:
081:
521:
20St
d.0e
v.0:
040:
370:
060:
090:
070:
260:
190:
000:
470:
301:
211:
050:
380:
190:
200:
290:
310:
35V
alue
Add
edT
ime
Avg
.0:
090:
180:
180:
080:
380:
230:
180:
500:
210:
331:
000:
290:
360:
170:
210:
200:
350:
19S
td.D
ev.
0:01
0:15
0:13
0:05
0:12
0:10
0:10
0:00
0:02
0:15
1:05
0:23
0:16
0:08
0:10
0:18
0:32
0:17
Non
Val
ueA
dded
Tim
eA
vg.
0:36
0:42
0:27
021
0:49
1:01
1:03
0:17
0:28
0:35
1:14
0:52
1:17
0:57
0:57
0:46
1:11
0:53
Std.
0ev.
0:11
0:30
0:07
0:11
0:13
0:34
0:31
0:00
0:10
0:15
0:57
0:45
0:28
0:10
0:18
0:21
0:03
0:32
%V
alueA
dded
Tlm
e15
.25%
29.0
3%39
.13%
25.0
0%40
.86%
26J4
%19
.78%
74.6
3%28
.77%
48.5
3%42
.25%
31.5
2%31
.30%
21.7
9%26
.92%
29.4
1%31
.25%
23.7
5%
1OE4
81

Pediatric Multi-Specialty ClinicDevelopment of the Report Card Tracking System
Program & Operations Analysis DepartmentApril 23, 1999
Stephanie OngenaStephanie PughTara Radcliffe

Table of Contents
Page
Executive Summary
II. Introduction and Background 2PurposeGoals and ObjectivesBackground
III. Approach and Methodology 3Project ApproachMethodology
IV. Findings, Conclusions and Recommendations 4- 12Report CardQuality Measures
Quality/Clinical IndicatorsCustomer SatisfactionEmployee Satisfaction
Cost MeasuresProductivityResource UtilizationCost EffectivenessProfitability
Professional vs. Technical vs. Indirect Cost SplitRegistered Nurses StudyMedical Assistants and Clinical Coordinators Studies
V. AppendicesAppendix A: Report CardAppendix B: Report Card — Quality and Clinical IndicatorsAppendix C: Report Card — Customer SatisfactionAppendix D: Report Card — Employee SatisfactionAppendix E: Report Card — Customer and Employee SurveysAppendix F: Report Card — ProductivityAppendix G: Report Card — Resource UtilizationAppendix H: Report Card — Cost EffectivenessAppendix I: Registered Nurses Survey and DataAppendix J: Professional vs. Technical vs. Indirect SplitAppendix K: Final Presentation

Executive Summary
The Pediatric Multi-Specialty Clinic at the University of Michigan Health Systemrequested the assistance of the Programs & Operations Analysis staff indeveloping a Report Card to facilitate continuous improvement in the Clinic.Also, the Clinic desired a validation of the Professional versus Technical versusIndirect split for Registered Nurses, Medical Assistants and ClinicalCoordinators. The purpose of this report is to present a comprehensive templatefor the Report Card and our findings on the Professional versus Technical versusIndirect split. This information can be used by the Pediatric Multi-SpecialtyClinic to assist in continually improving its overall performance.
To collect the data on the nursing staff, surveys were developed with theassistance of Jeanette Lamphere. These surveys were distributed to all staffnurses as well as Clinical Coordinators. Surveys were not distributed to MedicalAssistants because their work is 100% Technical. The results of the surveys areas follows:
Registered Nurses spend:• 49.5% of their time performing Professional Activities• 6.8% performing Technical Activities• 43.7% performing Indirect Activities
Clinical Coordinators spend:• 50% of their time performing Professional Activities• 20% performing Technical Activities• 30% performing Indirect Activities
Medical Assistants spend:• 100% of their time on Technical Activities
The Report Card template is broken down into two divisions: Cost Measures andQuality Measures. A further breakdown of each section as well asimplementation methods are found within the body and appendices of thereport. We recommend that the Report Card is updated quarterly and the resultsare promptly displayed or distributed to all clinical staff. This process willfacilitate continuous improvement for all areas of the clinic.

Introduction and Background
Purpose
The purpose of this project is to develop a template for the Report Card at thePediatric Multi-Speciality Clinic and in doing so validate the Professional versusTechnical versus Indirect cost split for Registered Nurses(RN), MedicalAssistants(MA), and Clinical Coordinators(CC).
Goals and Objectives
The following were identified as the primary goals of our project:
• Validate the previous RN Workload Study by conducting interviews andsurveys
• Determine the Professional versus Technical versus Indirect cost split forRNs, MAs, and CCs
• Develop a user-friendly template for the Clinic’s Report Card• Identify data that is currently available at the clinic to be used in the Report
Card• Recommend methods of collecting data to continue development of the
Report Card
Background
The Pediatric Multi-Specialty Clinic at the University of Michigan Health Systemis an outpatient clinic located in the Taubman Center at the University ofMichigan Hospital. Currently, the Clinic collects large amounts of datapertaining to quality and cost measures but it is not accessible to the entire clinicin a user-friendly form. Thus, the Clinic has both the need and desire to developa Report Card Tracking System. The Report Card will make data available bytracking cost and quality measures and displaying them in a standardized formthat is easy to read and understand. The Report Card will display two majorareas of concern for the Pediatric Clinic; costs and level of quality. Costmeasures will include the productivity, resource utilization, cost effectivenessand profitability, while quality measures will include customer satisfaction,employee satisfaction and quality/clinical indicators such as wait time, cycletime and percent of clinical standards met. Some data is currently available todevelop the Report Card, but other data still needs to be gathered to complete it.Once developed, the Report Card will provide a snapshot view of thedepartment that will help facilitate continuous improvement efforts.

Approach and Methodology
Project Approach
The following defines the steps we took to complete this project:• Define project scope, purpose and key phases• Evaluate the data the department currently collects for usefulness to our
project• Attend nursing staff educational meeting to learn more about TSI Standards• Administer survey to all RNs in the department• Review, analyze and compare RN data to previously collected data• Develop Professional versus Technical versus Indirect split for RNs, MAs,
and CCs• Organize findings and recommendations into a formal report• Present findings and recommendations to the Pediatric Multi-Speciality
Clinic Steering Committee and guests
Methodology
Minimal amounts of new data collection were required for this project. Datacollection was performed to validate the Registered Nurses workload study aswell as the Professional, Technical and Indirect cost split for Medical Assistantsand Clinical Coordinators. The technique used to collect this data was a surveydeveloped with assistance from Jeanette Lamphere. The survey dividedcommon activities into three categories and asked for the time spent on eachactivity during an average week. Fourteen nurses chose to participate in thesurvey but two were discarded due to inadequate breakdowns betweencategories. A sample survey as well as individual results can be found inAppendix I.
In developing the template, our team initially determined what the PediatricClinic wanted to report in the Report Card. This information was developedwith our Programs and Operations Analysis Project Coordinator, Mary Duck.Then, our team performed the following steps:
• Determine what measures were involved in each category• Relate the measures to information pertaining to the Pediatric Multi
Speciality Clinic• Identify what information is currently available at the Clinic and Programs
and Operations Analysis office• Develop a template for data collection for each Report Card category

Findings, Conclusions and Recommendations
Report Card
The Report Card is designed to assist the Pediatric Multi-Speciality Clinic incontinually improving its overall performance. We recommend the Report Cardbe distributed and posted quarterly to ensure all staff members have theopportunity to review and improve the Clinic’s performance. Initially, weproposed a monthly Report Card but a quarterly cycle will allow more time toinitiate the change and realize improvement in the Clinic. This Report Card wasdeveloped for use by the Pediatric Clinic as a whole but can easily be convertedto a divisional or team report. The Report Card will consist of two parts: QualityMeasures and Cost Measures.
Quality Measures
The quality measures that we recommend the Pediatric Multi-Specialty Clinictrack are Quality/Clinical Indicators, Customer Satisfaction and EmployeeSatisfaction. Based on the need for continuous improvement and an updatedtracking system, it is necessary that this information be updated often and on aregular schedule. However, collecting the information that is needed for theseareas requires the aid of both the Clinic staff and the patients. We feel thatcollecting the data quarterly will allow the Clinic to effectively track itsperformance throughout the year while not being overly time consuming for thestaff or patients.
Quality/Clinical IndicatorsThe Quality/Clinical Indicators portion of the Report Card consists of threeareas. These areas are Wait Time, Cycle Time, and Percent of Clinical StandardsMet. The data for these areas can be collected by recording the time patientscheck-in, enter the exam room, are visited by a care provider, and checkout. Werecommend that the Clinic distribute enough surveys to ensure that it receivesdata on fifty patients per quarter. This collection can be done during a one-weekperiod. For this collection, we recommend that the Clinic invest in three or fourclipboards with clocks attached.
During the data collection week:• Patients that receive a clipboard with a clock will participate in the study (see
Appendix E for patient survey)• Clerical staff will be responsible for entering the patient’s check-in and
checkout times• Patients will be responsible for noting the time they enter the exam room and
the time the first care provider enters the room

• Data will be entered into the Quality/Clinical Indicators spreadsheet alongwith the Clinic’s Wait Time Standards (see Appendix B)
• Mean wait times and visit duration will be calculated along with the percentof patients who meet the Clinic’s Wait Time Standards
An example of how this data will be presented is shown in Figure 1.
Figure 1. Quality/Clinical Indicators
Customer SatisfactionThe Customer Satisfaction portion of the Report Card consists of the scores fromsurveys given to patients in the Clinic. These scores translate into an overallCustomer Satisfaction Level. Although the hospital collects data on customersatisfaction, we feel it would be beneficial to acquire data that is specific to thePediatric Multi-Specialty Clinic as well. We recommend that the Clinic collectthese data on fifty patients per quarter. The customer satisfaction survey is onthe same survey as the Quality/Clinical Indicators, so the same fifty patients willbe surveyed for both sections.
During the data collection week:• Patients that receive a clipboard with a clock will participate in the study• Patients will be responsible for rating their satisfaction on various areas of
their visit• Data will be entered into the Customer Satisfaction spreadsheet (see
Appendix C)• Overall Percent Customer Satisfaction will be calculated
Another method of collecting Customer Satisfaction Surveys is to attach a self-addressed stamped envelope, allowing the patients to take the survey home, fillit out at their convenience, and mail it back to the Clinic. If this method is
Percent Standard Met
100%
80%j
60% 48%
40%
2O%
_
iiiWaiting Room TotalExam Room

chosen, we recommend that one hundred surveys be sent home with patients toensure that at least fifty are returned.
An example of how this data will be presented is shown in Figure 2.
Figure 2. Percent of Customer Satisfaction
Employee SatisfactionThe Employee Satisfaction portion of the Report Card consists of the scores fromsurveys given in the Clinic. These scores translate into an overall perception ofEmployee Satisfaction Level. As with customer satisfaction, the hospital alsocollects data on employee satisfaction. Again, we fell that acquiring data that isspecific to the Pediatric Multi-Specialty Clinic will be beneficial for continuousimprovement. We recommend that the Clinic collect these data on all staffmembers once per quarter (see Appendix D for spreadsheet and Appendix E forEmployee Survey).
100
Customer Satisfaction
80 7580
60
J 40
85
20
0
1 2 3 4
Quarter
An example of how this data will be presented is shown in Figure 3.

Total Average Employee Satisfaction
Figure 3. Percent of Employee Satisfaction
Cost Measures
The cost measures that we recommend the Clinic track are Productivity,Resource Utilization, Cost Effectiveness, and Profitability. We feel that theseareas should be tracked on a quarterly basis as well.
ProductivityThe Productivity portion of the Report Card needs to track Labor per Unit ofService. We define this as hours spent per case by RNs, MAs and CCs. The datafor this portion can be collected by recording the hours worked by RNs, MAsand CCs each quarter. Also needed to track productivity is the total number ofcases for the Clinic per quarter. These numbers are found through payroll andbilling. When these numbers are entered into the spreadsheet (see Appendix F),the hours spent per case for RNs, MAs, and CCs will be calculated along with thetotal hours spent per case for the clinic.
100 181.6 83.2
80
600
20
01 2 3 4
Quarter
An example of how this data will be presented is shown in Figure 4.
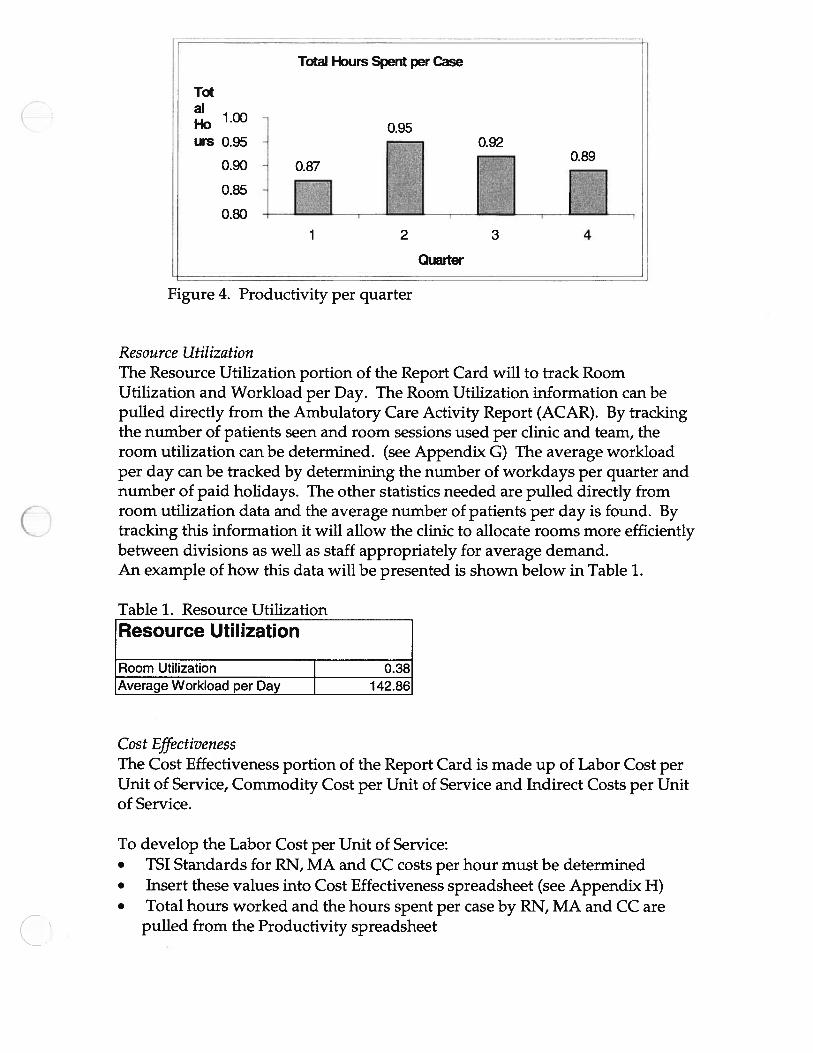
Total Hours Spent per Case
Figure 4. Productivity per quarter
Resource UtilizationThe Resource Utilization portion of the Report Card will to track RoomUtilization and Workload per Day. The Room Utilization information can bepulled directly from the Ambulatory Care Activity Report (ACAR). By trackingthe number of patients seen and room sessions used per clinic and team, theroom utilization can be determined. (see Appendix G) The average workloadper day can be tracked by determining the number of workdays per quarter andnumber of paid holidays. The other statistics needed are pulled directly fromroom utilization data and the average number of patients per day is found. Bytracking this information it will allow the clinic to allocate rooms more efficientlybetween divisions as well as staff appropriately for average demand.An example of how this data will be presented is shown below in Table 1.
Table 1. Resource UtilizationResource Utilization
Room Utilization 0.38Average Workload per Day 142.86
Cost EffectivenessThe Cost Effectiveness portion of the Report Card is made up of Labor Cost perUnit of Service, Commodity Cost per Unit of Service and Indirect Costs per Unitof Service.
To develop the Labor Cost per Unit of Service:• TSI Standards for RN, MA and CC costs per hour must be determined• Insert these values into Cost Effectiveness spreadsheet (see Appendix H)• Total hours worked and the hours spent per case by RN, MA and CC are
pulled from the Productivity spreadsheet
Total
1.00Ho 0.95urs 0.95
0.90
0.85
0.80
0.89
1 2 3
Quarter
4

• Total Labor Cost and Labor Cost per Case per RN, MA and CC are calculatedusing these three values
To develop the Commodity Cost per Unit of Service:• TSI Standard for Commodity Cost must be determined• Insert this value into Cost Effectiveness spreadsheet (see Appendix H)• Number of cases is automatically pulled from Resource Utilization
spreadsheet• Total Commodity Cost is calculated
To develop the Indirect Cost per Unit of Service:• TSI Standard for Indirect Cost must be determined• Insert this value into Cost Effectiveness spreadsheet (see Appendix H)• Number of cases is automatically pulled from Resource Utilization
spreadsheet• Total Indirect Cost is calculated
An example of how this data will be presented is shown in Table 2.
Table 2. Cost EffectivenessCost Effectiveness
Total Costs Cost per Unit Total Quarterlyof Service Cost
Labor $ 18.01 $ 143,800.00
Commodity $ - $ -
Other $ - $ -
Totals $ 18.01 $ 143,800.00
ProfitabilityAt this time the Clinic does not collect enough information to determineProfitability. Specifically, it does not capture its Net Revenue per Unit of Service.The Clinic currently reports its Gross Revenue. Therefore, Gross Revenue perUnit of Service can be calculated. We recommend that this section is developedfurther to make the Clinic aware of its financial status.
Professional vs. Technical vs. Indirect Cost Split
Our team was asked to develop a Professional versus Technical versus IndirectSplit for Registered Nurses, Clinical Coordinators and Medical Assistants.

Registered Nurses StudyPreviously, a nursing workload study was performed on all nurses in the Clinic.An initial Professional, Technical and Indirect split was calculated at this time.For budgetary reasons, our team was asked to validate this split. To perform thisvalidation we surveyed all nurses in the Clinic. Fourteen of the eighteen nurseschose to participate in this study. Two of the surveys were not usable due toincomplete data. After thorough analysis, we found the two studies to have asimilar split.
_______________________________________
The 1998 split was as found:• Professional Activities equal 34%• Technical Activities equal 13%• Indirect Activities equal 53%
The split was validated in 1999 to be:• Professional Activities equal 49.5%• Technical Activities equal 6.8%• Indirect Activities equal 43.7%
A more explicit breakdown by individual staff as well as clinic can be found inAppendix I.
Medical Assistants and Clinical Coordinators StudiesOur team performed surveys on Clinical Coordinators to determine theirProfessional versus Technical versus Indirect split. To determine the Medical
1998 Nurse Split
34%
13%
ProD Tech Indirect
1999 Nurse Split
44%
7%
I Pro C Tech Indirect

Assistant split, it was unnecessary to survey the staff since they perform purelytechnical activities. We found the following results:
Clinical Coordinators:• Professional Activities equal 50%• Technical Activities equal 20%• Indirect Activities equal 30%
Medical Assistants:• Professional Activities equal 0%• Technical Activities equal 100%• Indirect Activities equal 0%
These Professional versus Technical versus Indirect splits can be used to createan accurate budget plan that will be flexed accurately based upon the PediatricMulti-Specialty Clinic’s demand.
1999 Clinical Coordinator Split
) 50%
Pro C Tech l Indirect
1999 Medical Assistants Split
100%
Ro U Techh9ci

Appendix A
Report Card

Pediatric Multi-Specialty Clinic Report Card
COST INDICATORS
Clinic Staff HoursMembers Spent/Case
RN 0.50MA 0.22CC 0.17
Total HoursSpent per
Case 0.90
Cost Effectiveness
Cost per Unit TotalTotal Costs of Service Quarterly
Labor $ - $Commodity $ - $ -
Other $ - $ -
Totals $ - $ -
Resource Utilization
RoomUtilization
ProfitablityProfitablity perUnit of Service
AverageWorkload per
Day
0.38
142.86
Productivity
Total Hours Spent per Case
. 092o 0.95. 0.89
HI:’1JQuarter
Appendix A
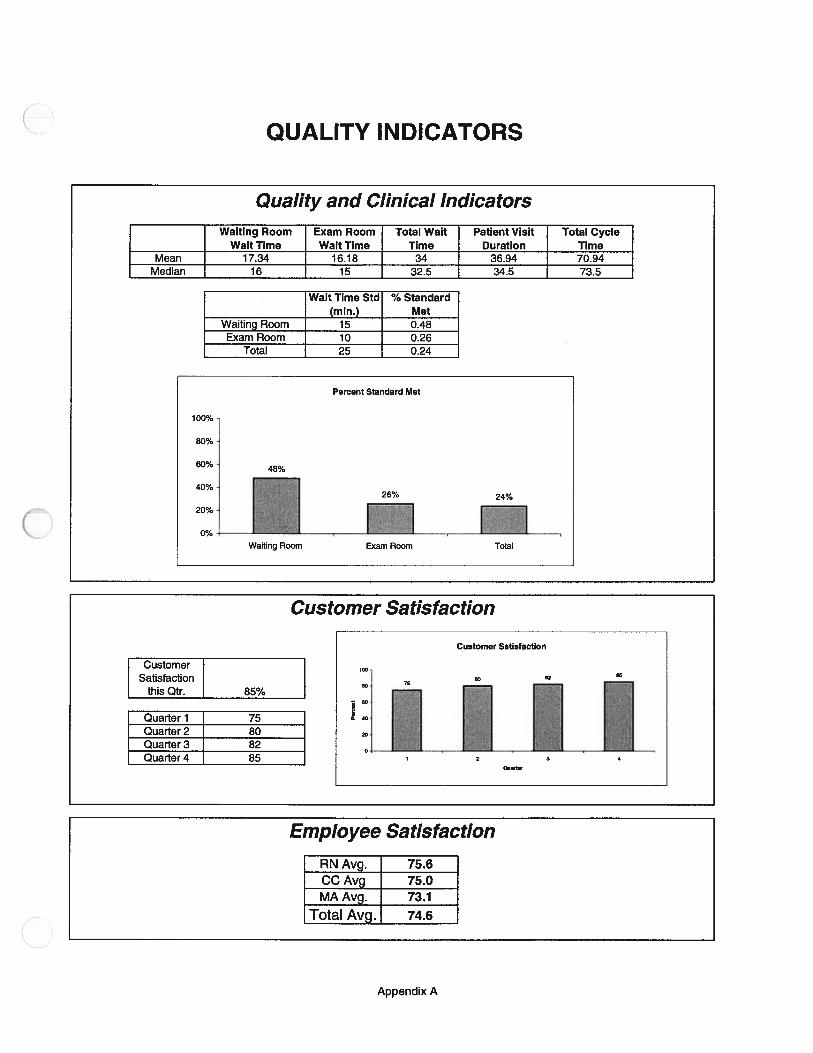
a C CD CD
0 C CD CD
0 C CD CD ()
0 C CD CD I’)
CI)
—C
DC
)C
‘
CDD
01 010)
0101
011’
)001
00
00) 0
0) 00 0
CD 0 CD
CD CD D
p
-I 0 l) p
z (p
C,
C) 0
C) CD 0 0 3
-D CD 0. x
-1 0 CD
m x CD 3 0 0 3
CD 0 0 0 3
CD Cl)
C.)
0
0)
C))
Perc
ent
0)
C)
Cl)
CD Cl)
Cl)
Ce) 0
m ‘C C) 3 0 0 3
F)
010
0101
p.) 01
CD C, CD Cl)
DC 0.
DC 0. CD
CD
5•3 Cl
)0
. ci) CD 0.
30
IDO 3 rn
30
CD
-I 0 CD CD -
0< -I 0 CD 0 0 CD
p 1’)
p r\) 0)
C,
CC 0 3 CD Cl)
DC Co DC C) 0
p 01
0 C) Ce)
C))
I’)
01
C,)
-l 3 (D
0 C I -I C.)
-I 0 C’)
-I 0 C)
Cc)
01
C))
CD
cC)
01
-‘I p CD 4.
-I 3 CD

Appendix B
Report Card — Quality/Clinical Indicators

Quality/Clinical Indicators Data
Instructions: Enter all numbers on spreadsheet that are blue (wait time in waiting room, wait time in exam room, total cycle time, and wait time standard).These numbers should be calculated from the customer satisfaction survey. Wait time standard is set by the Clinic.
Wait time in Waiting Room = Time entered exam room - Time of CheckinWait Time in Exam Room = Time First Caregiver Enters Room - Time Entered Exam RoomTotal Cycle Time = Time of Checkout -Time of Checkin
WaitingExam Room Total Wait Patient Visit Total Cycle
Room WaitWait Time Time Duration TimeTime
Mean 17.34 16.18 34 36.94 70.94
Median 16 15 32.5 34.5 73.5
WaitTimeinWait Time in Total Wait Patient Visit Total CycleNumber WaitingExam Room Time Duration Time
Room1 1 17 34 52 1 1 29 43 73 1 19 644 21 2 4
—r— 3 1 56 24 37 1 3 4 18 1 25 44 4 849 4 8 1
10 1 12 2 811 1 14 2 10412 4 2 6 21 8413 2 6 3 10714 9 5 14
•—W 16 17 3 716 52 10 6 4 1017 6 7 1 1 218 2 23 4 719 10 19 2 920 15 12 2 1 4
0 7 7 322 1 24 3 51 823 18 17 3 30 624 5 15 2 54 725 26 13 3 28 67
***Numbers presently in matrix are scaled from the Fall 1998 Student Project
Wait TimeStandard % Standard
(mm.) Met
WaitingRoom 15 48%ExamRoom 10 26%i’i 25 24%
Wait Time inWait Time in Total Wait Patient Visit Total Cycle
Number WaitingExam Room Time Duration Time
Room26 12 1 2 827 23 1 3 6
9 1 4—s-— ii 3
30 15 2131 20 132 26 3 44 1
—— 4 1 1 4—--— 37 7
35 20 34 5436 17 1
—-— 3 1138 11 2
39 1 740 25 1 44-- 7 4
13 1 343 18 14 244 35 2 4 34 7745 24 11 4 846 6 3 4647 32 3 7648 18 1 1 4349 27 3 1 7750 41 2 6 2 90
Appendix B
Percent Standard Met
Target= 100%100%
80%
60%
40%26%
2:
Waiting Room Exam Room

Appendix C
Report Card — Customer Satisfaction

Customer Satisfaction Survey Results
I Overall Customer Satisfaction this Quarter: 85% IInstructions: Enter all numbers on the spreadsheet that are in blue.Before replacing the numbers, please enter the average into the space provided to the right so that the averages will begraphed by quarter.
________ ________ ________
Satisfaction With (1-5):
_____
Scheduling Staff Clinic Waiting Service of: OverallVisit Friendliness Environment Time Lencith Receptionist Nurse Med. Asst. Physician Service
T 5 4 5 4 5 5 5 4 4 0.912 5 5 3 5 4 4 3 4 5 0.843 5 5 4 4 3 3 4 3 3 0.764 4 5 3 5 4 4 3 4 5 0.825 5 4 4 5 3 3 5 4 4 0.826 5 5 5 5 4 2 3 4 5 0.847 4 5 4 4 5 5 4 4 5 0.898 3 4 3 4 5 4 4 4 5 0.809 5 5 4 4 5 5 5 4 5 0.9310 2 4 5 5 5 4 4 4 5 0.8411 5 5 4 5 4 5 5 4 5 0.9312 4 5 4 4 4 4 4 4 5 0.8413 3 4 5 4 2 5 5 4 5 0.8214 5 5 3 5 4 4 5 4 5 0.8915 5 5 4 4 3 4 4 5 5 0.8716 4 5 5 5 4 4 5 4 5 0.9117 5 4 4 5 3 5 5 5 4 0.8918 5 5 5 5 4 4 3 4 5 0.8919 4 5 4 4 3 5 4 4 5 0.8420 3 4 5 4 3 4 4 5 5 0.8221 5 5 4 4 5 5 3 4 5 0.8922 2 4 5 5 3 4 4 5 5 0.8223 5 5 4 5 4 5 3 5 5 0.9124 4 5 4 4 4 5 4 4 5 0.8725 3 4 5 4 5 5 3 4 4 0.8226 5 5 3 5 4 4 3 4 4 0.8227 5 5 4 4 3 5 4 3 5 0.8428 4 5 3 5 4 4 3 4 5 0.8229 5 4 4 5 5 4 5 3 4 0.8730 5 5 5 5 5 4 3 4 4 0.8931 4 5 4 4 5 3 4 4 4 0.8232 3 4 3 4 5 4 4 3 4 0.7633 5 5 4 4 5 5 3 4 4 0.8734 2 4 5 5 5 4 4 3 4 0.8035 5 5 4 5 4 4 3 3 5 0.8436 4 5 4 4 4 4 4 4 5 0.8437 3 4 5 4 4 5 3 4 4 0.8038 5 5 5 5 4 4 3 4 4 0.8739 5 5 4 4 5 4 4 3 5 0.8740 4 5 5 5 4 4 3 4 4 0.8441 5 4 4 5 4 5 5 3 5 0.8942 5 3 5 5 4 4 3 4 4 0.8243 4 3 4 4 5 4 4 4 5 0.8244 3 4 5 4 4 4 4 5 4 0.8245 5 5 4 5 5 5 3 5 5 0.9346 2 4 5 5 4 4 4 5 4 0.8247 5 3 4 5 4 5 5 5 5 0.9148 4 5 4 4 4 4 4 4 4 0.8249 5 3 4 5 4 4 3 4 5 0.82lp 4 5 4 4 4 4 4 4 4 0.82
Appendix C
Average 0.85

C
Quarter 1 75
Quarter 2 80Quarter 3 82Quarter 4 85
Appendix C
100
Customer Satisfaction
80
604-C
0 40
20
01 2 3 4
Quarter

Appendix D
Report Card — Employee Satisfaction
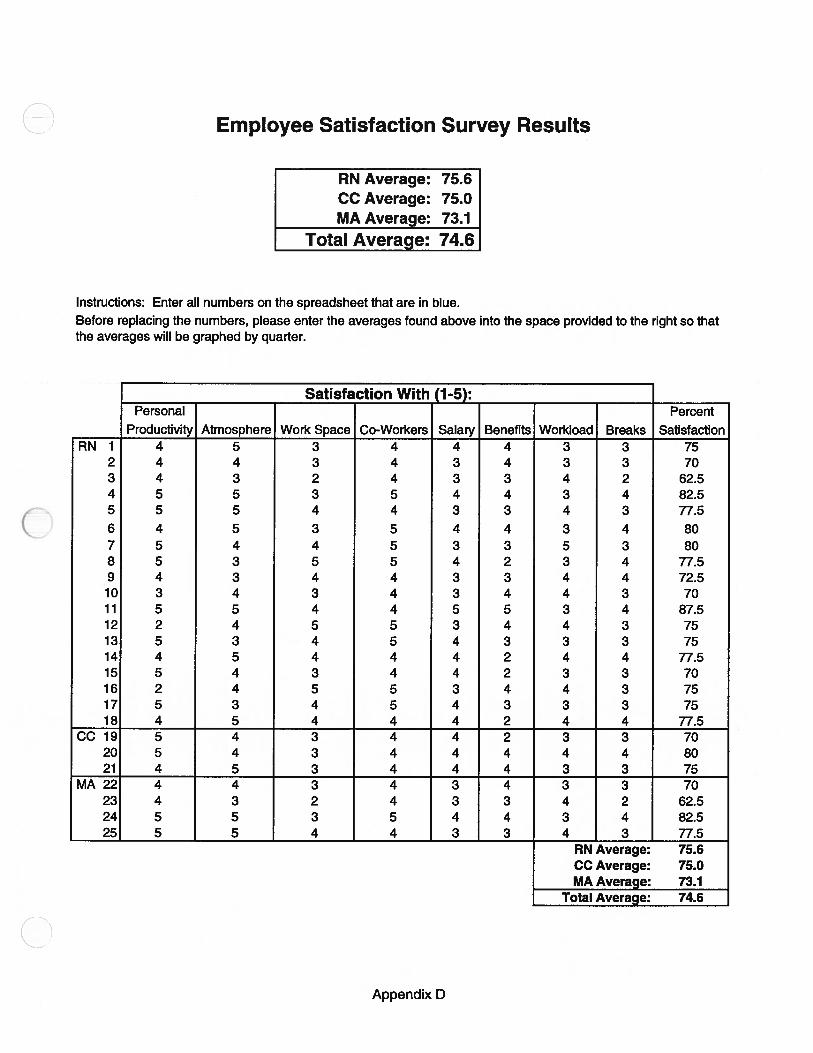
Employee Satisfaction Survey Results
RN Average: 75.6CC Average: 75.0MA Average: 73.1
Total Average: 74.6
Instructions: Enter all numbers on the spreadsheet that are in blue.Before replacing the numbers, please enter the averages found above into the space provided to the right so thatthe averages will be graphed by quarter.
________ ________
Satisfaction With (1-5):
______ ______ ______ ________
Personal Percent
_____
Productivity Atmosphere Work Space Co-Workers Salary Benefits Workload Breaks SatisfactionRN 1 4 5 3 4 4 4 3 3 75
2 4 4 3 4 3 4 3 3 703 4 3 2 4 3 3 4 2 62.54 5 5 3 5 4 4 3 4 82.55 5 5 4 4 3 3 4 3 77.56 4 5 3 5 4 4 3 4 807 5 4 4 5 3 3 5 3 808 5 3 5 5 4 2 3 4 77.59 4 3 4 4 3 3 4 4 72.510 3 4 3 4 3 4 4 3 7011 5 5 4 4 5 5 3 4 87.512 2 4 5 5 3 4 4 3 7513 5 3 4 5 4 3 3 3 7514 4 5 4 4 4 2 4 4 77.515 5 4 3 4 4 2 3 3 7016 2 4 5 5 3 4 4 3 7517 5 3 4 5 4 3 3 3 7518 4 5 4 4 4 2 4 4 77.5
CC19 5 4 3 4 4 2 3 3 7020 5 4 3 4 4 4 4 4 8021 4 5 3 4 4 4 3 3 75
MA22 4 4 3 4 3 4 3 3 7023 4 3 2 4 3 3 4 2 62.524 5 5 3 5 4 4 3 4 82.525 5 5 4 4 3 3 4 3 77.5
Total Average: 74.6
RN Average:CC Average:MA Average:
75.675.073.1
Appendix D
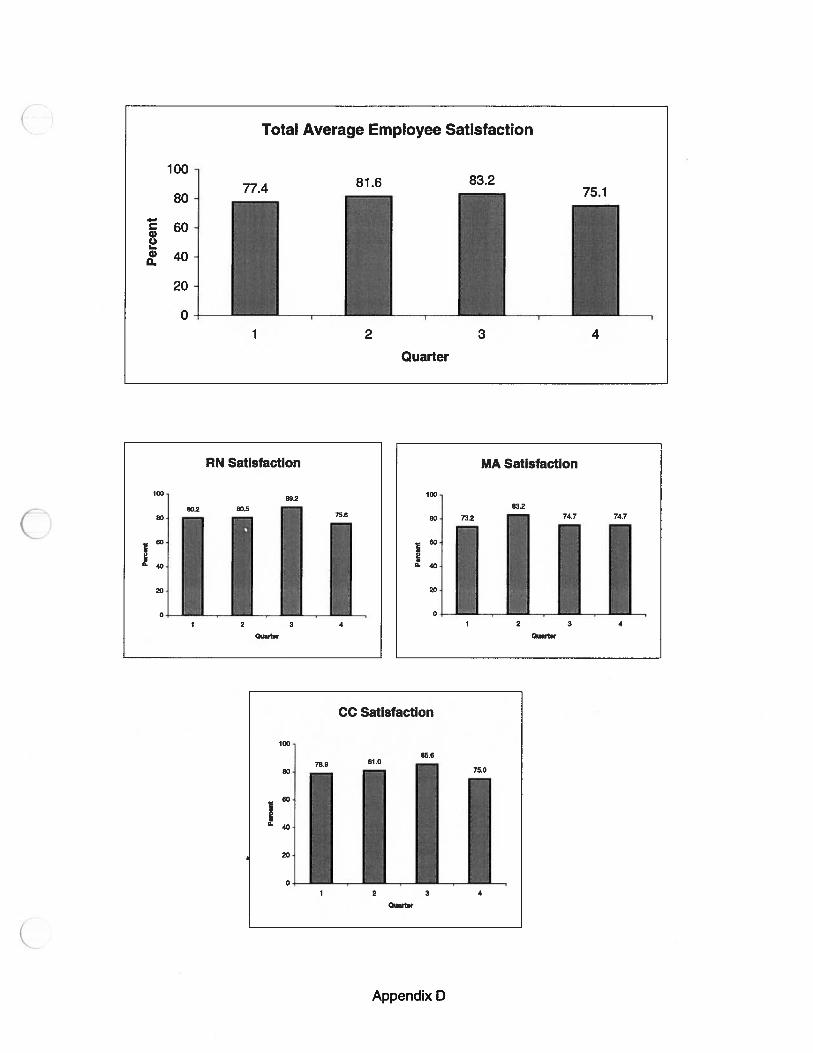
100
80
60
&20
0•
Total Average Employee Satisfaction
81.6 83.275.1
1 2 3
LQuarter
4
RN Satisfaction
10089.2
80]80.2 80.5
75.6
9- 40J18011111H0Quarter
MA Satisfaction
100
83.2
80 73.2 74.7 74.7
Quarter
CC Satisfaction
100
80
2:
1 2 3 4
Quarter
Appendix D

Quarter 1
RN Average: 80.2CC Average: 78.9MA Average: 73.2
Total Average: 77.4
Quarter 2
RN Average: 80.5CC Average: 81.0
MA Average: 83.2
Total Average: 81.6
Quarter 3RN Average: 89.2
CC Average: 85.6MA Average: 74.7
Total Average: 83.2
Quarter 4RN Average: 75.6CC Average: 75.0MA Average: 74.7
Total Average: 75.1
Appendix 0

Appendix E
Report Card —
C’ Customer and Employee Surveys
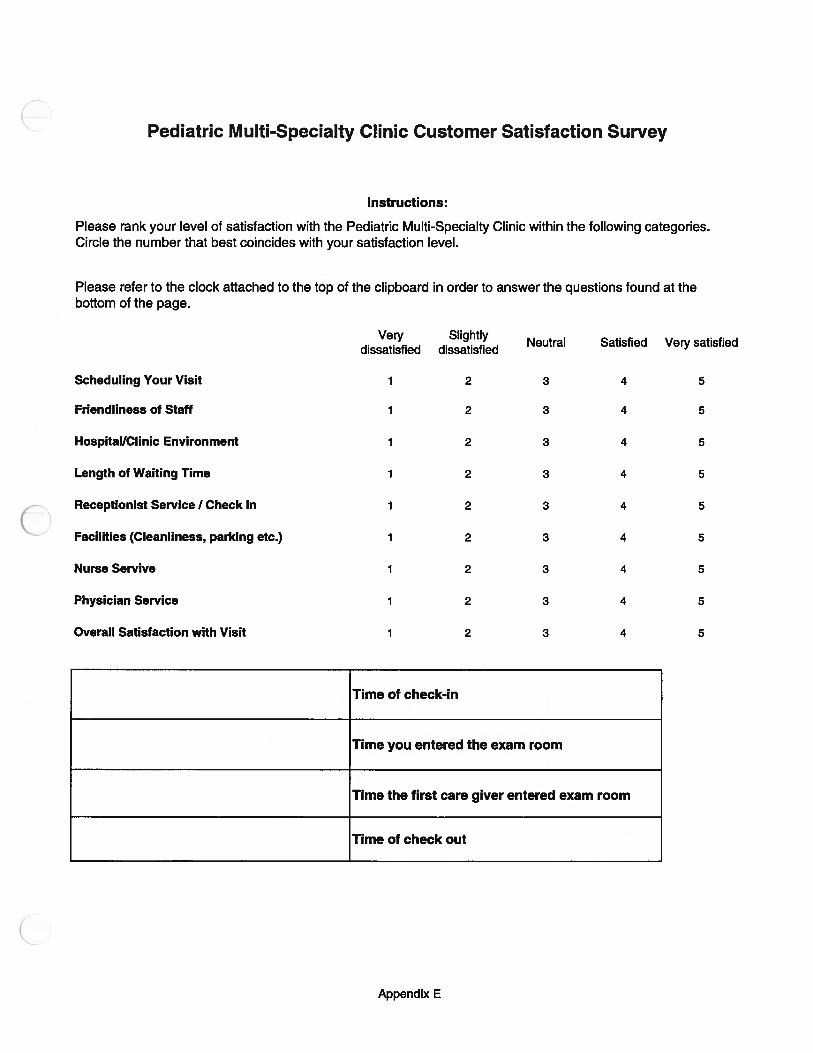
Time of check-in
Time you entered the exam room
Time the first care giver entered exam room
Appendix E
Pediatric Multi-Specialty Clinic Customer Satisfaction Survey
Instructions:
Please rank your level of satisfaction with the Pediatric Multi-Specialty Clinic within the following categories.Circle the number that best coincides with your satisfaction level.
Please refer to the clock attached to the top of the clipboard in order to answer the questions found at thebottom of the page.
Very Slightly Neutral Satisfied Very satisfieddissatisfied dissatisfied
Scheduling Your Visit 1 2 3 4 5
Friendliness of Staff 1 2 3 4 5
Hospital/Clinic Environment 1 2 3 4 5
Length of Waiting Time 1 2 3 4 5
Receptionist Service I Check In 1 2 3 4 5
Facilities (Cleanliness, parking etc.) 1 2 3 4 5
Nurse Servive 1 2 3 4 5
Physician Service 1 2 3 4 5
Overall Satisfaction with Visit 1 2 3 4 5
Time of check out

Pediatric Multi-Specialty Clinic Employee Satisfaction Survey
Instructions: Please rank your level of satisfaction with the following categories. Circle the number that bestcoincides with your satisfaction level.
Very SlightlyNeutral Satisfied Very satisfied
dissatisfied dissatisfied
How my workplace concerns are addressed 1 2 3 4 5
Decision making processes 1 2 3 4 5
Opportunities for job growth 1 2 3 4 5
Cooperation of co-workers 1 2 3 4 5
Salary I Benefits 1 2 3 4 5
Recognition and respect for my ideas 1 2 3 4 5
Workload (amount of work per day) 1 2 3 4 5
Overall satisfaction 1 2 3 4 5
Appendix E

Appendix F
Report Card - Productivity

Productivity
Instructions: Enter the numbers in blue - they represent the total number of hoursworked in the quarter by staff in the clinic
Current QuarterHours Worked
RN 4020MA 1790CC 1380
Total # of Cases 7985Hours Spent per Case for:
RN 0.50MA 0.22CC 0.17
Total Hours Spent per Case 0.90
Appendix F
Total Hours Spent per Case
1.000.95
0.95 0.92
0.90 0.87
2 3 4
Quarter
RN - Total Hours Spent per Case
0.540.52
0.52
___
0.510 0.50
0.50
1 2 3
Quarter

Quarter 1Hours Spent per Case br:
RN 0.48MA 0.21CC 0.18
Total Hours Spent per Case 0.87
Quarter 2Hours Spent per Case for:
RN 0.52MA 0.25CC 0.18
Total Hours Spent per Case 0.95
Quarter 3Hours Spent per Case for:
RN 0.51MA 0.27CC 0.14
Total Hours Spent per Case 0.92
Quarter 4Hours Spent per Case for:
RN 0.50MA 0.22CC 0.17
Total Hours Spent per Case 0.89
Appendix F

Appendix G
Report Card — Resource Utilization

Resource Utilization
Room Utilization
Instructions: Please enter the numbers in blue. They represent the total number of patients seen by each clinic in thequarter, and the number of room sessions used.
# of Patients seen by: Room Sessions IRS) by: Room Utilization for:Team Clinic Clinic Team Total Clinic Team Total Clinic Team Total
2022 1022 0.49Biochemical Genetics 21 36 0.15Gastroenterology 1086 410 0.66ID 123 45 0.68Nephrology 792 531 0.37
2 1611 1045 0.39Adolescent 9 1 2.25Behavioral 222 90 0.62Neonatology 75 75 0.25Neurology 1023 579 0.44Psychology 282 300 0.24
3 2529 1061 0.60Endocrinology 1140 456 0.63Genetics 75 48 0.39Myelodysplasia 24 27 0.22Pulmonology 804 317 0 63Rheumatology 486 213 0.57
4 2124 2300 0.23Cardiology 2124 2300 0.23Total 8286 5428 0.38
Average Workload per Day
Instructions: Please enter the numers in blue. They represent the total number of workdays in the current quarter, andthe number of company paid corporate holidays in the current quarter.
# of Workdays this Qtr. 59# of Paid Holidays this Qtr. 1# of Patients Seen this Qtr. 8286Total Workdays 58
lAverage Workload/Day I 142.86 I
Appendix G

Appendix H
Report Card — Cost Effectiveness

Cost Effectiveness
Labor Cost per Unit of Service
Instructions: The green numbers represent the current TSI Cost Accounting Standards. They should bechanged only when the TSI standards are changed.
Commodity Cost per Unit of Service
Instructions: The green numbers represent the current TSI Cost Accounting Standards. They should bechanged only when the TSI standards are changed.
# of Cases Commodity Cost Total Cost8286 $ - $ -
I Commodity Cost per Case I $- I
Indirect Cost per Unit of Service
Instructions: The green numbers represent the current TSI Cost Accounting Standards. They should bechanged only when the TSI standards are changed.
# of Cases Indirect Cost Total Cost8286 $ - $ -
Total Costs per Unit of Service
Cost per Unit of Total QuarterlyTotal Costs Service CostLabor $ - $ -
Commodity $ - $ -
Other $ - $ -
Totals $ - $ -
II
Total Hours Hours Spent Total Labor Labor CostWorked per Case Cost per Hour Cost per Case
RN 4020 0.50 $ - $ -
MA 1790 0.22 $ - $ -
CC 1380 0.17 $ - $ -
Total 0.90 $ - $ -
Appendix H

Appendix I
Registered Nurses Survey and Data

Nursing Survey( Please fill in the time spent on each activity during a normal work week. If activities
overlap, just draw arrows or label in some manner for us to understand. Thank youfor your time!
Professional Activities Technical Activities Indirect ActivitiesTelephone Management relatedto a professional Visit (symptom
Mgmt)
Telephone Management relatedto a Pediatric procedure
Telephone managementsupporting case mgt. Or non-Pe
billable service
Performing a patient intake Immunizations Inpatient work
taking vitals, charting growth,noting meds, dictation performing billable procedures resident and student education
patient appointment held inconjunction with or independent case management via phone or
of physician PFT support in clinic
scheduling or education relatedpatient education infusions/treatments to a billable procedure
Kids Care case mgt Blood drawing in pediatric clinic
research

Indiv
idu
alN
urs
esP
rofe
ssio
nal
vs.
Tec
hnic
alvs.
Ind
irec
tS
pli
t19
99
Pro
fess
iona
lA
ctiv
itie
sT
echn
ical
Act
ivit
ies
Indi
rect
Act
ivit
ies
No
Nam
eD
iana
Kem
o
Pro
fess
ional
Tec
hnic
alT
reat
men
tsIn
dir
ect
Tre
atm
ents
,R
esid
entl
stT
elep
ho
ne
Pat
ient
Nu
rse
Nu
rse
Vis
itT
elep
hone
and
Tel
eph
on
eC
ase
Pro
cedure
suden
tO
ther
Vac
atio
n,
Nurs
eM
anag
emen
tIn
take
Vis
itW
IP
hy
sici
anR
esea
rch
Man
agem
ent
Pro
ced
ure
sM
anag
emen
tIn
-Pat
ien
tM
anag
emen
t(i
nd
irec
t)E
duca
tion
Act
ivit
ies
Sic
kD
ays
Bre
aks
Kat
hyC
lark
8.2
0.0
23.7
18.5
0.0
1.5
10.4
3.0
0.0
8.2
0.0
0.0
10.0
11.4
6.0
Erm
ee0.
011
.222
.311
.219
.10.
00.
00.
00.
01.
60.
06.
410
.011
.46.
0A
nneJ
ackso
n21
.821
.814
.50.
07.
30.
00.
00.
00.
07.
20.
00.
010
.011
.46.
0A
nnM
arke
r16
.30.
013
.30.
00.
00.
00.
013
.313
.316
.30.
00.
010
.011
.46.
0S
ueA
rmst
rong
8.8
3.0
24.2
11.7
2.2
0.0
1.5
8.8
0.7
8.8
1.5
1.5
10.0
11.4
6.0
Nan
cyM
cln
tosh
31.8
3.4
20.6
6.9
3.4
0.0
1.3
0.0
0.0
5.2
0.0
0.0
10.0
11.4
6.0
Jennif
erS
tein
er0.
81.
516
.30.
00.
00.
730
.44.
40.
015
.63.
00.
010
.011
.46.
0M
argy
Fox
16.4
0.0
35.6
13.7
2.7
0.0
0.0
0.0
0.0
2.7
0.0
1.4
10.0
11.4
6.0
Den
iseG
arden
29.0
0.0
10.9
27.2
0.0
0.0
0.0
1.8
0.0
3.6
0.0
0.0
10.0
11.4
6.0
NoN
ame
14.5
0.0
25.4
10.9
0.0
0.0
0.0
14.5
0.0
7.3
0.0
0.0
10.0
11.4
6.0
Juli
eK
onkl
e11
.77.
316
.10.
70.
05.
12.
96.
62.
26.
60.
013
.210
.011
.46.
0P
atD
elam
iell
eure
1.4
2.8
20.2
3.5
0.0
0.0
27.9
4.2
0.0
2.8
8.4
1.4
10.0
11.4
6.0
Unu
sabl
eda
taco
llect
ed50
%I
I50
%69
%I
0.72
60
0.72
60.
726
0.72
60.
726
010
11.4
6
App
endi
xI

Nursing Professional vs. Technical vs. Indirect Split 1999
TOTAL100.00
Activity Professional Technical IndirectTelephone management 13.4 0.6 4.7
Patient intake 4.3Nurse visits (vitals, charting,
meds, dictation) 20.3Nurse visit with physician 8.7
research 2.9Treatments, procedures
(immunizations, infusions,treatments) 6.2in-patient 1.4
case management 7.2Resident/Student Education 2.0Treatments & Procedures
(indirect) 1.1Other 10.0
Vacation, Sick days 11.4Breaks 6.0
TOTAL PERCENTAGES 49.5 6.8 43.7

Nursing Professional vs. Technical vs. Indirect Split 1998
TOTAL100.0
Activity Professional Technical IndirectTelephone Management 9.5 6.6 18.5
Patient Intake 7.5Nurse Visit (vitals, charting, meds,
dictation) 4.0Nurse Visit with Physician 7.2
Research 6.2Treatments, Procedures
(immunizations, infusions,treatments) 5.9In-Patient 2.0
case Management 24.8Travel, Breaks, Other 7.8
TOTAL PERCENTAGES 34.4 12.5 53.1
Appendix I

Appendix JProfessional vs. Technical vs. Indirect Split
C

Professional vs. Technical vs. Indirect Split
Clinical Coordinators
3OO/’
2S-
Clerical Staff
Pro Tech IndirectAverage 87% 0% 13%
Pro Tech IndirectVeronica 70% 0% 30%Deb 40% 30% 30%Candie 40% 30% 30%Average 50% 20% 30%
Clinical CoordinatorsProfessional I Technical I Indirect
Split
Pro DTech Indirect
.4 ‘)O/I ) /0
)50%
Clerical StaffProfessional I Technical I Indirect
Split
DPro DTech Indirect
Medical Assistants
Pro Tech Indirect
I Average 0% 100% 0%
Medical AssistantsProfessional I Technical I Indirect
100%
DPro DTech Indirect
Appendix J

Nurses - New Survey Nurses - Old Survey
Pro Tech IndirectAverage 34% 13% 53%
1998 Nurse Split
Pro Tech IndirectAverage 50% 7% 44%
1999 Nurse Split
EIPro DTech DIndirec DPro DTech Dindirect
Appendix J

Appendix K
Final Presentation

ectTe
iaEftma
1
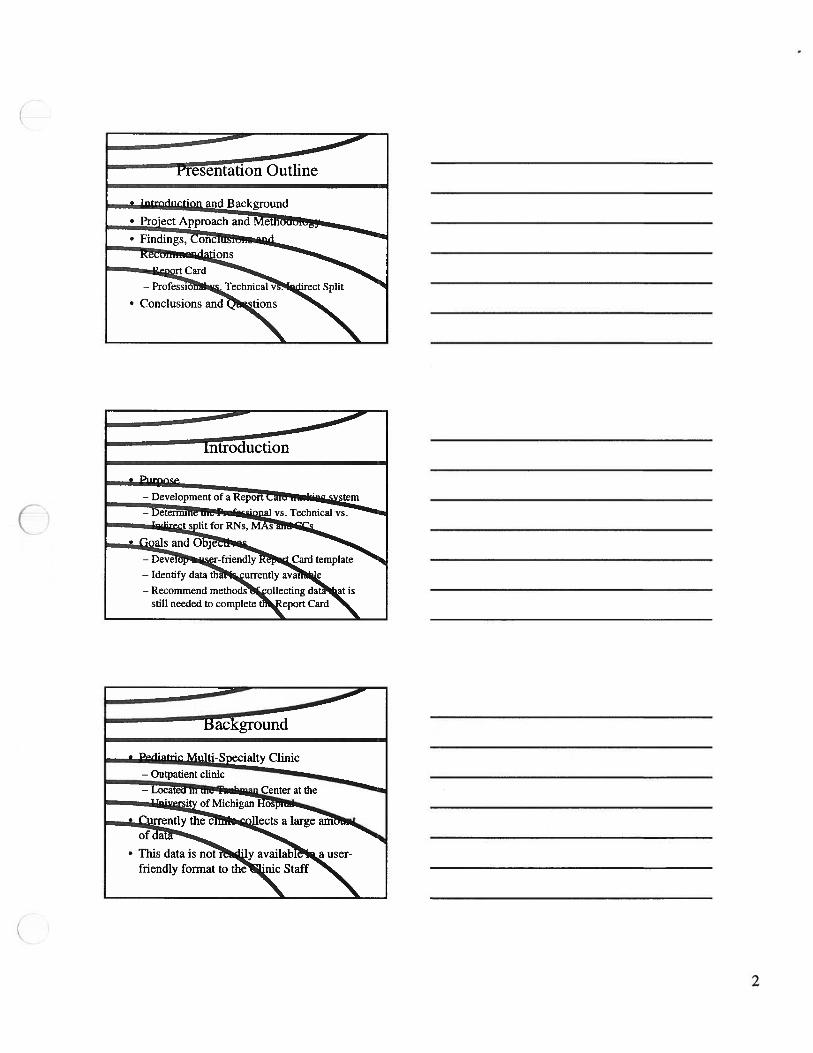
tationOut1in
and Background
• Proect Approach and e
• Findings, oncions
Introduction
lopment ofaRepo stem— Detei-mi nal vs. Technical vs.
— Identify data tha urrently avai e
— Recommend methods collecting dat at isstill needed to complete t eport Card
oun
lti-S ecialty Clinic
— Outpatient clinic
— Loca e Center at thesit of Michigan os
• urrently the c liects a large am
• This data is not 1y availab a user-friendly format to the nic Staff
2

PtAppc
roect scope
• Evaluate the currently co e
• Attend nursing onal meeting
• A mi •n survey
rroject Approach Continued -
fessional vs. Technical vs.Indirect split for s,
• Orgarnze commendations1 report
Methodology
ion— Nursing survey develope from
oTernp:
3

cMeafe
Ja1a is currently collected butnot
There are
uality/Clinica— Custo sfacti
loeSaüs
Tca1Incator
cks Waitof the Report
butednweekpedodequar
— Distribute enou urveys
4
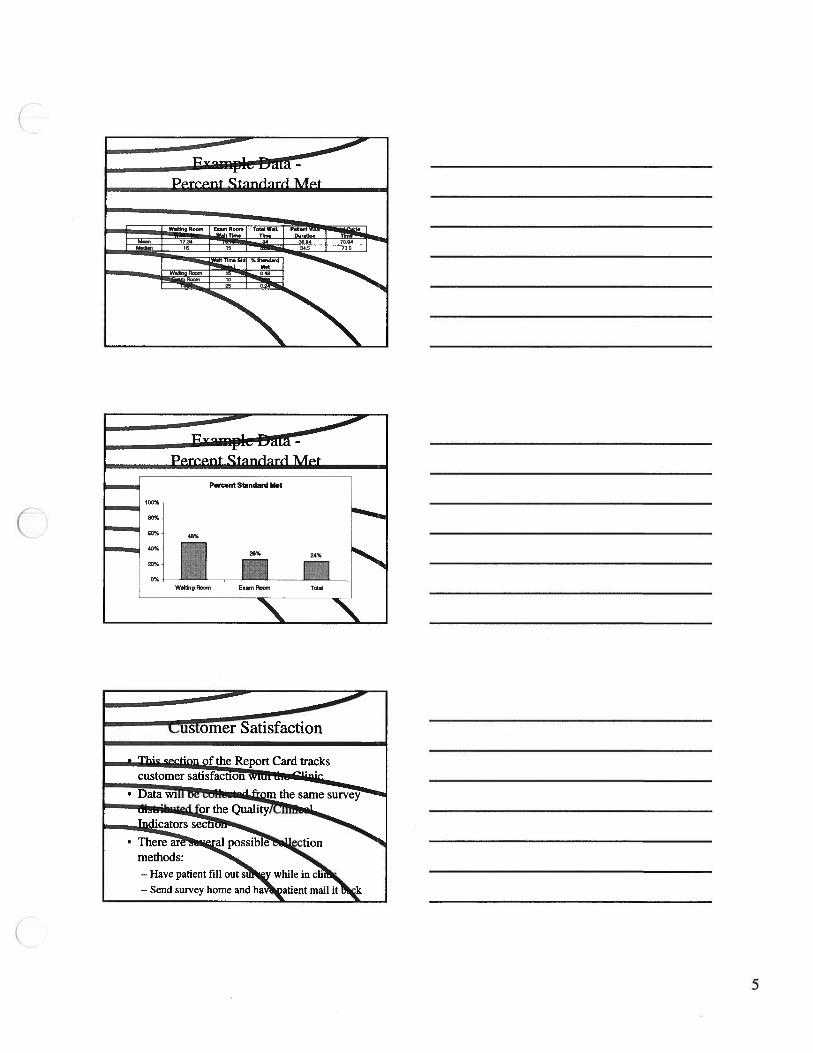
-
Prnnt Stinr1irt1 Mt
J
Pve:kll1 -
PArnnt Strrnclrircl Mtt
Percent Standard Met
100%
80%
60%40%
40%26% 24%
Welling Room Exemn Room Tot4
‘‘
erSatisfactio
of the Report Card trackscustomer satisfaction
• Data wi m the same survey-.
or the Qualitydicators secti
• There ar al possible ectionmethods:
— Have patient fill out su while in cli
— Send survey home and hay atient mail it k
5

mp oyee Satisf
Report C
stributedcollec
ortunities forj— Cooperation of co-workers\
6

Tnti1 Hniirc Snnt nr
T0tI Hr.Sp.ntp.rC..
RN
0950,95
Ptivit
of the Report Card tracks theuntof1aboerun
RNs MAs and
data can be hrough payroll a
7
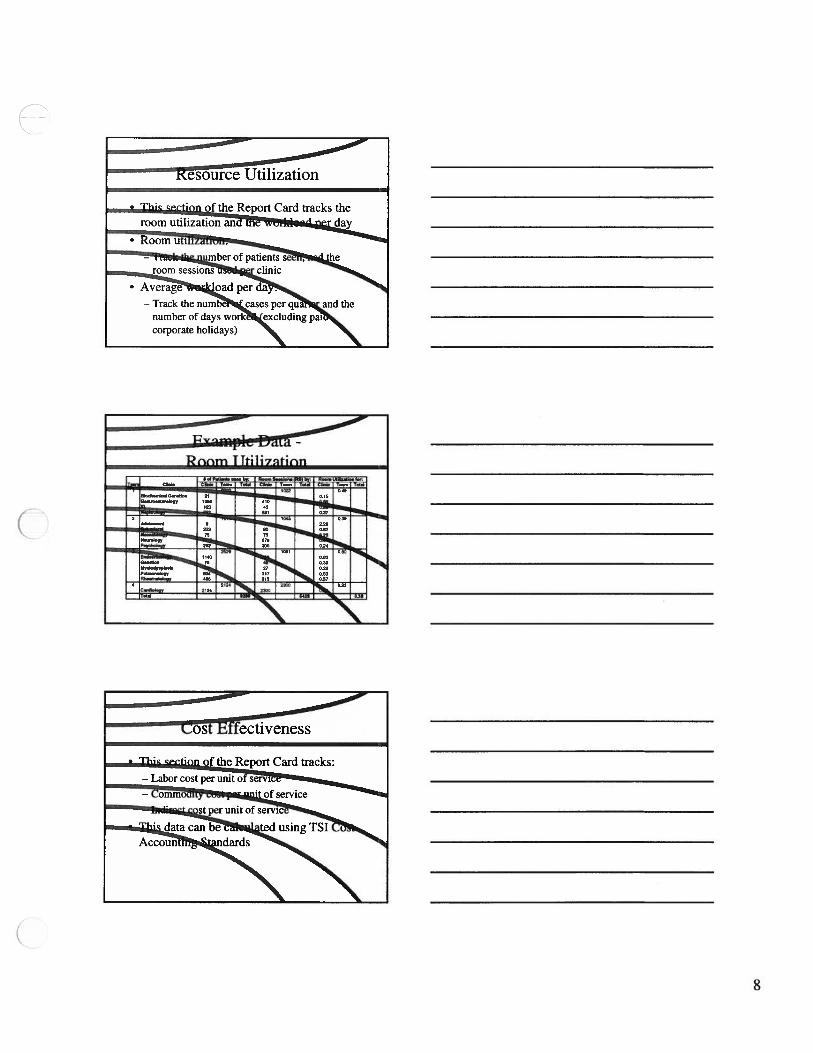
Pcrrn TTt1--
U
0.16
M&.50.5ft 6 2.25
P’rs L — ——!bIIIII%
2525 1000 050
==..
:‘
-__
Lost Effectiveness
of the Report Card tracks
::ostPerutoffSeice
data ca : unit of servi
of the R
Room u ii
— Track the numbe cases per qu and the
ageoadperda
number of days work excluding paicorporate holidays)
8

C’
Casts pr unit nf Srvir
Total Costsflit Total
of Serv,ce
mmodity$
9

