university of maryland upper chesapeake health …
TRANSCRIPT

1 #603975 011888-0023
UNIVERSITY OF MARYLAND UPPER CHESAPEAKE HEALTH
Conversion of University of Maryland Harford Memorial Hospital to a Freestanding Medical Facility
Matter No. 17-12-2403
Responses to Additional Information Questions Dated September 1, 2017
Project Description
1. The proposed FMF (page 6) is described as having 21 exam rooms and a behavioral health crisis center with four exam rooms. The floor plan drawing appears to show 29 rooms labeled as “exam rooms” and, in addition, one room labeled as “seclusion” that appears to be a type of exam room and two rooms labeled as “patient isolation rooms” that also appear to be a type of exam room. Please clarify and reconcile this floor plan with the project description.
Applicants’ Response
Enclosed as a replacement for Exhibit 2 are revised project drawings for UC FMF and UC Behavioral Health. The amended project drawings are now consistent with Table B submitted with Exhibit 1 to the Applicants’ Request For Exemption from Certificate of Need Review for the Conversion of University of Maryland Harford Memorial Hospital to a Freestanding Medical Facility (the “Exemption Application”) and Table B submitted as Exhibit 1 to UM Upper Chesapeake Health’s Certificate of Need Application to develop a special psychiatric hospital. Table 19 below reflects the square footage of both UC FMF and UC Behavioral Health, with shared space allocated 48% to UC FMF and 52% to UC Behavioral Health. Table 19 corrects the Applicants’ square footage descriptions on pages 4-5 and footnote 1 of the Exemption Application.
Table 19 Department Gross Square Footage UC FMF and UC Behavioral Health
UC Behavioral
Health UC FMF Total
Total Floor Plate Square Footage 78,763 (ground floor)
50,800 (first floor)
129,563
Dedicated Departmental Square Footage
53,922 49,857 103,779
Shared Space Allocation 12,918 12,866 25,784
Shared Space Allocation % 52% 48% 100%
Total Gross Departmental Square Feet consistent with Table B
66,840 62,723 129,563
The general emergency department treatment space at the UC FMF according to the current project drawings and project drawings submitted with the initial exemption request on

2 #603975 011888-0023
August 4, 2017, include a total of (21) exam rooms broken down as follows: sixteen (16) standard exam rooms; two (2) isolation exam rooms; two (2) resuscitation exam rooms; one (1) safe exam room. UC FMF also includes six (6) triage rooms. UC FMF’s behavioral health crisis treatment space includes four (4) total exam rooms broken down as follows: three (3) exam rooms and one (1) seclusion room. The seclusion room in the behavioral health crisis unit will be used for patients who have emotional responses that are poorly modulated and who pose a threat to themselves or others on the unit (including staff) such that temporary seclusion provides an effective means to protect the patient and others while the patient receives medical attention.
Submitted herewith as Exhibit 8 are portions of drawing A101 (UC FMF’s floor plan), which was submitted with initial and revised Exhibit 2 to the Exemption Application, with the number of treatment spaces in the emergency department, the behavioral health crisis unit, and the observation unit sequentially numbered in each respective department.
As reflected on Exhibit 8, the “Quiet Room” will be used for family consultation with the emergency department providers and/or chaplain. Also located in the emergency department is a decontamination area, a room for law enforcement, a separate room for UC FMF’s security team, and offices for emergency department physicians and leadership. While not identified for in the design drawings, one of the offices in the emergency department at UC FMF will likely be used for telemedicine connection to a variety of sites.
2. The observation suite is described as having eleven patient rooms. The floor plan drawing appears to show 11 rooms labeled as “patient rooms” and a 12th room labeled “patient isolation room,” which appears to be a 12th patient room. Please clarify and reconcile this floor plan drawing with the project description.
Applicants’ Response
UC FMF’s observation unit includes eleven (11) observation rooms comprised of ten (10) standard patient rooms and one (1) isolation suite. The isolation suite includes three (3) sub-rooms including a patient isolation ante room, an isolation toilet, and the actual patient isolation room. Submitted herewith as Exhibit 8 is a portion of drawing A101 (UC FMF’s floor plan), reflecting the number of treatment spaces in the observation unit. The isolation suite will be utilized for patients suspected of having an active infection that requires isolation during continued testing and monitoring.
State Health Plan Standards
COMAR 10.24.19.04.C, Exemption from Certificate of Need Review to Convert a General Hospital to a Freestanding Medical Facility
C (4), Location
3. In response to this standard, the applicants identify a 13-zip code area primary service area based on the patient origin of HMH’s emergency department (“ED”) patients. What is the primary service area of the converting general hospital, HMH, with respect to the patient origin of patients admitted for inpatient care?

3 #603975 011888-0023
Applicants’ Response
In fiscal year 2016, 62.0% of HMH’s MSGA discharges (primary service area) came from residents of two (2) zip codes in Harford County and one (1) zip code in Cecil County as listed below in Table 20 below.
Table 20 HMH MSGA Primary Service Area Zip Codes and Discharges
FY2016
In fiscal year 2016, 62.7% of HMH’s inpatient psychiatric discharges (primary service area) came from residents of seven (7) zip codes in Harford County as listed in Table 21 below.
Table 21
HMH Psychiatric Primary Service Area Zip Codes and Discharges FY2016
C (5), Compliance with general standards in COMAR 10.24.10.04A COMAR 10.24.10.04A
(2) Charity Care Policy
4. This standard states that, “within two business days following a patient's request for charity care services, application for medical assistance, or both, the hospital must make a determination of probable eligibility.” Does the Financial Assistance Policy provided as Exhibit 4 comply with this requirement? If so, please identify the specific provisions of the Policy that indicate compliance.
Zip Code Community County Discharges % of Discharges
21001 Aberdeen Harford County 913 29.1%
21078 Havre De Grace Harford County 813 25.9%
21904 Port Deposit Cecil County 222 7.1%
Subtotal 2016 Service Area 1,948 62.0%
Out of Service Area 1,192 38.0%
Total MSGA Discharges 3,140 100.0%
Zip Code Community County Discharges % of Discharges
21001 Aberdeen Harford County 193 15.7%
21040 Edgewood Harford County 130 10.6%
21014 Bel Air Harford County 126 10.2%
21078 Havre De Grace Harford County 122 9.9%
21009 Abingdon Harford County 91 7.4%
21015 Bel Air Harford County 66 5.4%
21050 Forest Hill Harford County 43 3.5%
Subtotal 2016 Service Area 771 62.7%
Out of Service Area 459 37.3%
Total Psychiatric Discharges 1,230 100.0%

4 #603975 011888-0023
Applicants’ Response
UM Upper Chesapeake Health’s Financial Assistance Policy submitted as Exhibit 4 to the Exemption Application complies with COMAR 10.24.10.04A(2). Section 4(d) on page 6 of UM Upper Chesapeake Health’s Financial Assistance Policy (Exhibit 4) provides, “[w]ithin two (2) business days following a patient’s request for Financial Assistance, application for Medical Assistance, or both, the hospital will make a determination of probable eligibility.”
COMAR 10.24.10.04A (3) Quality of Care
5. A review of the MHCC Hospital Performance Guide during the week of August 14, 2017 indicates that HMH had a “below average” score on two “Practice Pattern” quality measures, the one noted on page 15 but also on the “Contrast material (dye) used during abdominal CT scan” quality measure. Please address and document each action being taken by UM HMH to improve performance for this quality measure.
Applicants’ Response
HMH’s corrective action plan for “Contrast material (dye) used during abdominal CT scan” quality measure includes the following:
As an initial matter, though the screen shot above indicates HMH is performing below average for the State of Maryland, HMH’s data compares with the average for the nation when
5 #603975 011888-0023
the filter is changed. At UM UCH the average number of patients administered contrast dye during abdominal CT scans is 3.6% and consistent with the nationwide average. Pursuant to the MHCC’s quality measure definition, the denominator is very low at HMH for these type of exams resulting in a somewhat skewed “below average” quality rating.
Nevertheless, UM UCH has adopted the Choosing Wisely Campaign to limit the use of CT scans, and will be implementing clinical decision support for patients with suspected kidney stone to decrease the utilization of CT scans using contrast dye.
Regarding the use of contrast material, it is an evidenced-based practice and supported by the American College of Emergency Physicians that oral contrast is not necessary for simple uncomplicated appendicitis and especially if the patient is above a body mass index of 25. HMH has instituted this practice with General Surgery support. In addition, the same group of Emergency Physicians that would order this test most often commonly work at both UCMC and HMH, thereby enhancing compliance with this policy. Emergency department provider education and monitoring of this metric has been ongoing. Ongoing assessment of efforts to limit the use of CT with contrast dye will be reported to UM UCH’s Performance Improvement Committee.
In addition, there has been initial training and implementation of a Dose Management Program at UM UCH to aid in reviewing best practice for patient exposures during advanced scans such as CT. This has been implemented in all UMMS hospitals and there will be benchmarking reports developed for the entire UMMS system.
C (8)(b), Emergency, urgent, and primary care services
6. Has Upper Chesapeake Health (UCH) gathered market intelligence on the use of the seven urgent care centers identified within 3.7 and 13.6 miles of the UCH-Havre de Grace (UCH- HG) FMF site?
Applicants’ Response
UM UCH has not gathered market intelligence on the use rates of the six independent urgent care centers identified in Table 4 of the Exemption Application. UM UCH is involved in a joint venture with ChoiceOne to operate the urgent care center located in Aberdeen. Despite efforts by UM UCH to direct patients with non-emergent medical conditions to urgent care centers as more fully described in response to Question 8B below, the ChoiceOne/UM UCH urgent care center in Aberdeen has received less patient volume than the joint venture partners initially projected.
A. Is use of these centers growing and, if so, does this explain or partially explain the recent decline in hospital ED visits in the HMH ED service area?
Applicants’ Response
While UM UCH does not have information on the use rates of the six independent urgent care centers identified in Table 4 of the Exemption Application, UM UCH does not attribute slight decreases in HMH’s emergency department visits between fiscal years 2016 and 2017 to increased use rates at urgent care centers or a market shift of emergency department cases to

6 #603975 011888-0023
urgent care centers. Rather, UM UCH attributes slight decreases in HMH’s emergency department utilization between fiscal years 2016 and 2017 to UM UCH’s extensive population health efforts and initiatives, including the WATCH teams and the Comprehensive Care Center as described on pages 20-23 of the Exemption Application.
B. What assumptions were made by UCH about use of urgent care centers when developing use projections for the UCH-HG FMF?
Applicants’ Response
HMH experienced an increase in emergency department visits between fiscal years 2014 and 2016, even with the presence of urgent care centers in the market. As described in the Applicants’ response to Question 6A above, UM UCH attributes the slight decrease in HMH’s emergency department utilization in fiscal year 2017 to extensive population health efforts and initiatives. UM UCH is not aware of the entry of new urgent care centers into the area. As such, the Applicants assume that the presence of urgent care centers will not have an impact on the projection of emergency department visits at the UC FMF.
C. What proportion of ED visits at the HMH ED occur between 8pm and 8am?
In fiscal year 2017, approximately 32% percent of HMH’s emergency department visits occurred between 8 p.m. and 8 a.m. Between these hours, none of the urgent care centers identified in Table 4 of the Certificate of Exemption Application are open.
Table 22
HMH Emergency Department Visits Between 8 p.m. and 8 a.m.
FY2017
Source: HMH FY2017 Internal Utilization
7. Do primary care physician practices not identified as urgent care centers provide an appreciable level of unscheduled, walk-in service in Harford and/or Cecil County?
Applicants’ Response
In Havre de Grace, there are two (2) primary care practices that offer walk in services (Bala Family Practice and Dr. Mrowiec’s practice). To the Applicants’ knowledge, there are no additional primary care practices within UC FMF’s proposed service area or in the Bel Air area that offer health care services to patients on an unscheduled, walk-in basis.
Timeframe 8 a.m. - 8 p.m. 8 p.m. - 8 a.m. Total
Inpatient Visits 2,727 1,021 3,748
Outpatient Visits 16,666 8,062 24,728
Total Visits 19,393 9,083 28,476
% of Total 68.1% 31.9% 100.0%
7 #603975 011888-0023
C (8)(d), Treatment capacity and space
8. ED visit volume at HMH declined an estimated 6.1% between FY 2013 and FY 2017. All hospital ED visits originating in the HMH ED service area declined an estimated 4.3% over that same period. But HMH projects that the Upper Chesapeake Health-Havre de Grace (UCH-HG) FMF will experience a slightly higher visit volume in its first year of operation than the estimated 2017 volume of the HMH ED and also projects that visit volume will grow over the first three years of FMF operation.
Applicants’ Response
UC FMF is expected to continue to serve the emergent health care needs of the population in HMH’s service area upon the closure of HMH. With the exception of 0.4% of historical visits that originate from northeast Cecil County and a limited number (approximately 200) of EMS priority 1, non-stroke patients, it is expected that the residents of HMH’s service area will continue to come to UC FMF when experiencing emergency health conditions. Accordingly, emergency department visits at UC FMF are projected to grow annually with the service area population taking into consideration historic trends.
A. Provide an explanation of the reasoning and assumptions underlying this projection that an ED operation detached from a general hospital, the UCH-HG FMF, is likely to be more heavily utilized than recent experience of the HMH ED would suggest. Why is it not more intuitively likely that demand at the FMF will be lighter than that recently experienced by the hospital ED, given that higher acuity patients seen at the HMH ED will be redirected to hospital EDs after the conversion?
Applicants’ Response
As stated above, the applicants have assumed that with the exception of 0.4% of historical visits that originate from northeast Cecil County and a limited number of EMS priority 1, non-stroke patients, the residents of HMH’s service area will continue to come to UC FMF when experiencing emergency health conditions. These utilization projections are supported by UC FMF’s plans to implement an Acute Stroke Ready Pilot and MIEMMS protocol changes allowing stable priority 2 and priority 1 stroke patients to be transported to UC FMF. The increase in accessibility to Interstate 95 rather than HMH’s landlocked campus in downtown Havre de Grace is also likely to result in an increase in patient walk-ins particularly from surrounding areas such as Aberdeen due to UC FMF being more readily accessible than HMH. Finally, UM UCH has been educating and will continue to educate the community consistently that approximately 90% of their care can be received on the UC Medical Campus at Havre de Grace. The Applicants, therefore, anticipate the community will appropriately seek care at UC FMF when experiencing medical emergencies.
B. Will UCH encourage use of less costly urgent care centers as an alternative to the FMF for non-emergent and low acuity patients whose needs can be met at an urgent care center? If so, how will this guidance and encouragement be implemented?
8 #603975 011888-0023
Applicants’ Response
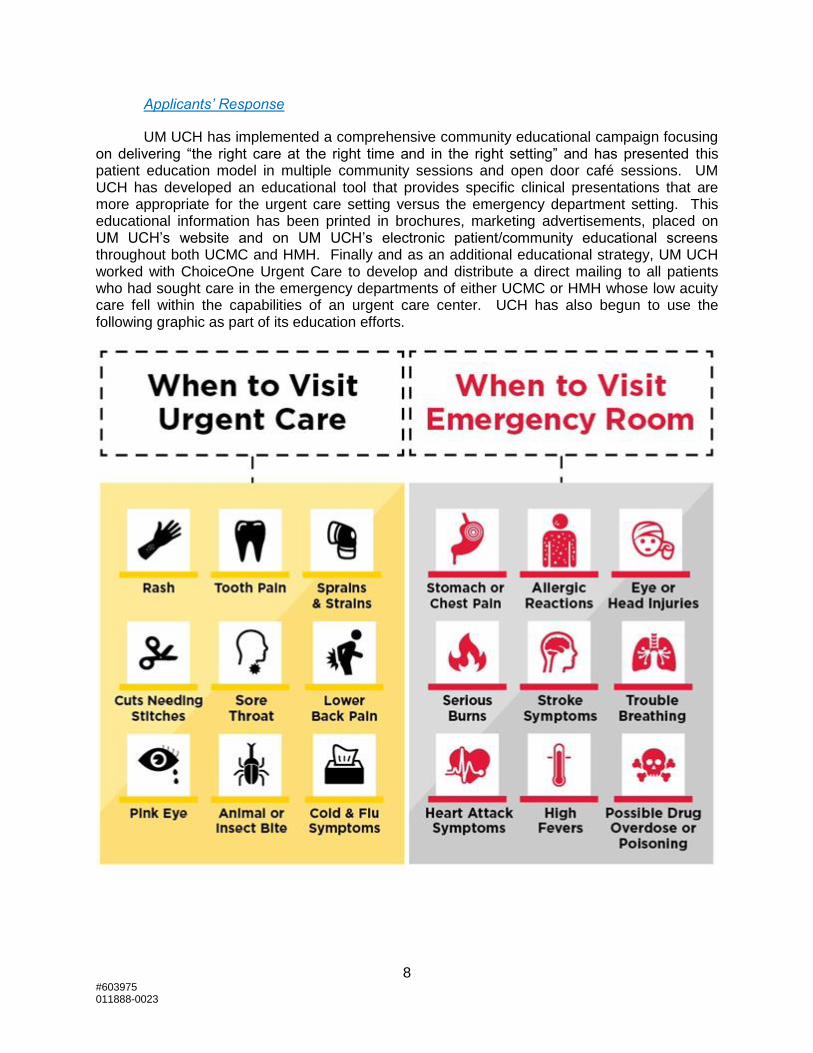
UM UCH has implemented a comprehensive community educational campaign focusing on delivering “the right care at the right time and in the right setting” and has presented this patient education model in multiple community sessions and open door café sessions. UM UCH has developed an educational tool that provides specific clinical presentations that are more appropriate for the urgent care setting versus the emergency department setting. This educational information has been printed in brochures, marketing advertisements, placed on UM UCH’s website and on UM UCH’s electronic patient/community educational screens throughout both UCMC and HMH. Finally and as an additional educational strategy, UM UCH worked with ChoiceOne Urgent Care to develop and distribute a direct mailing to all patients who had sought care in the emergency departments of either UCMC or HMH whose low acuity care fell within the capabilities of an urgent care center. UCH has also begun to use the following graphic as part of its education efforts.
9 #603975 011888-0023
9. Table 5 projects a total of 28,489 ED visits at HMH in FY 2017. Table 6 projects 28,245. Please clarify. Does HMH know the actual number of ED visits in FY 2017 at this time? If so, please provide.
Applicants’ Response
Table 5 presents 28,489 emergency department visits in fiscal year 2017 which was
based on six (6) months of actual St. Paul Computer Center data of non-confidential patient
level detail which was then annualized. Table 6 presents 28,245 emergency department visits in
fiscal year 2017 which was based on HMH’s internal summary utilization report that reflects six
(6) months of actual patient encounters and six (6) months of projected utilization by HMH.
Based on HMH’s internal summary utilization report, the actual number of emergency
department visits in fiscal year 2017 was 28,356. The discrepancy between Tables 5 and 6
does not impact the Applicants’ emergency department treatment space need analysis as set
forth in the Exemption Application.
10. The application states that the treatment capacity and space proposed for the FMF is consistent with the ACEP Guide low range estimate of 21 treatment spaces (pages 24-26), based on an annual visit volume of 30,000 visits, and exclusion of the treatment spaces for behavioral health. However, Eme r gen c y D epartm ent Desi gn’s guidance on the “Preliminary Sizing Chart” used by HMH to make this claim of consistency (page 114) defines “general or universal spaces” to include “general examination rooms, behavioral health, Ob/Gyn room (with adjacent toilets), and geriatric and pediatric spaces.” It also notes that “bariatric rooms” would be included “within this designation.” Thus, it would appear that exclusion of behavioral health treatment spaces as a basis for claiming consistency with the capacity guidelines is not consistent with the ACEP guidance. Please address this seeming contradiction.
Applicants’ Response
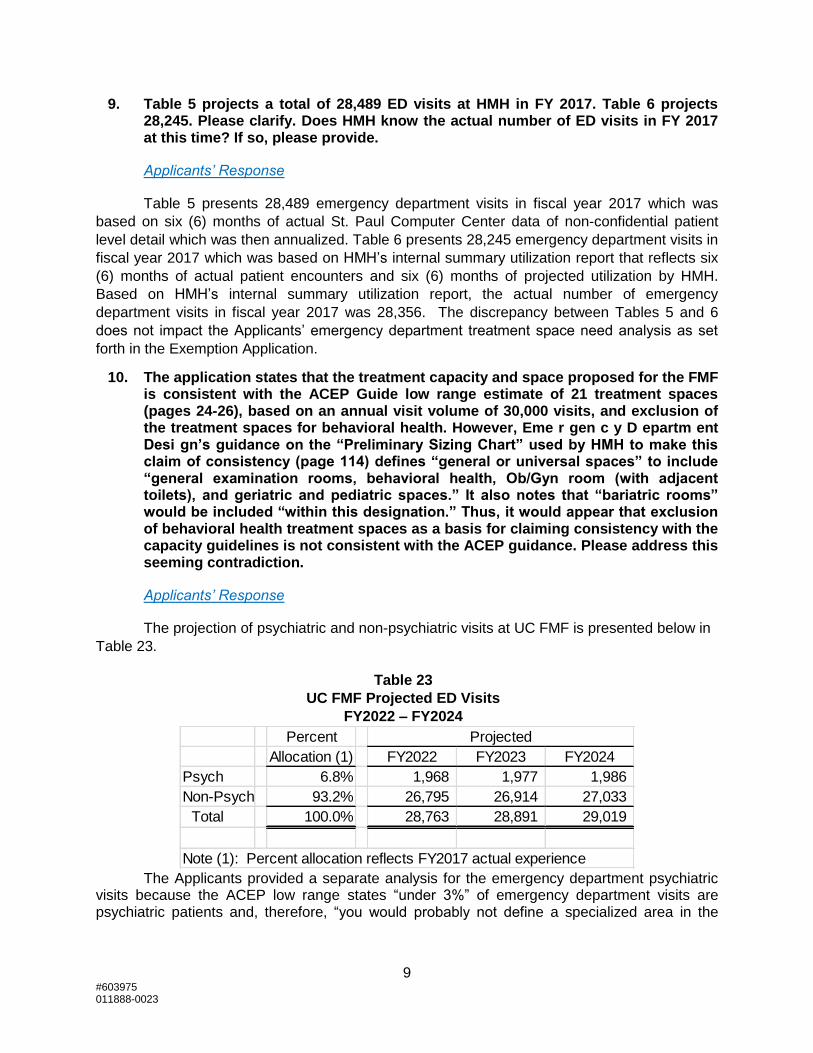
The projection of psychiatric and non-psychiatric visits at UC FMF is presented below in
Table 23.
Table 23
UC FMF Projected ED Visits
FY2022 – FY2024
The Applicants provided a separate analysis for the emergency department psychiatric
visits because the ACEP low range states “under 3%” of emergency department visits are psychiatric patients and, therefore, “you would probably not define a specialized area in the
Percent Projected
Allocation (1) FY2022 FY2023 FY2024
Psych 6.8% 1,968 1,977 1,986
Non-Psych 93.2% 26,795 26,914 27,033
Total 100.0% 28,763 28,891 29,019
Note (1): Percent allocation reflects FY2017 actual experience
10 #603975 011888-0023
emergency department for behavioral health patients.” ACEP Guide at 111. Because the Applicants are planning separate psychiatric treatment space based on the needs of the particular population to be served, the Applicants excluded these treatment spaces from the ACEP low range analysis because the ACEP low range definition is inapt.
Excluding psychiatric emergency department visits, the projected emergency department treatment space need is still within the 30,000 annual visit range and, therefore, appropriate to evaluate separately given the distinct programming. The projection of 27,033 non-psychiatric emergency department visits falls between the ACEP space guidelines for 25,000 and 30,000 visits. Extrapolating between the space guidelines of 18 to 20 spaces for 25,000 visits and 21 to 25 spaces for 30,000 visits, results in an average need for 21 spaces.
Combining psychiatric and non-psychiatric visits results in a need for 25 treatment spaces and 18,259 departmental gross square feet for the emergency department, which is still within the ACEP “high range” of 25 treatment spaces and below the ACEP “high range” of 21,875 departmental gross square feet.
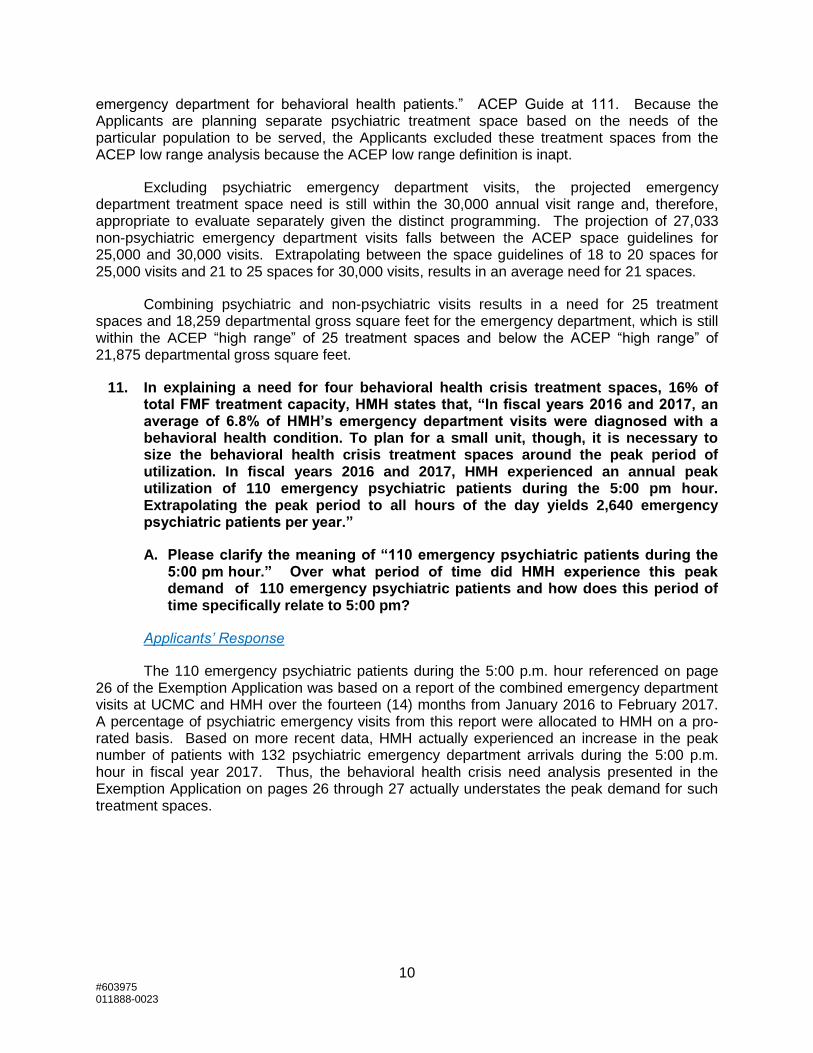
11. In explaining a need for four behavioral health crisis treatment spaces, 16% of total FMF treatment capacity, HMH states that, “In fiscal years 2016 and 2017, an average of 6.8% of HMH’s emergency department visits were diagnosed with a behavioral health condition. To plan for a small unit, though, it is necessary to size the behavioral health crisis treatment spaces around the peak period of utilization. In fiscal years 2016 and 2017, HMH experienced an annual peak utilization of 110 emergency psychiatric patients during the 5:00 pm hour. Extrapolating the peak period to all hours of the day yields 2,640 emergency psychiatric patients per year.”
A. Please clarify the meaning of “110 emergency psychiatric patients during the 5:00 pm hour.” Over what period of time did HMH experience this peak demand of 110 emergency psychiatric patients and how does this period of time specifically relate to 5:00 pm?
Applicants’ Response
The 110 emergency psychiatric patients during the 5:00 p.m. hour referenced on page 26 of the Exemption Application was based on a report of the combined emergency department visits at UCMC and HMH over the fourteen (14) months from January 2016 to February 2017. A percentage of psychiatric emergency visits from this report were allocated to HMH on a pro-rated basis. Based on more recent data, HMH actually experienced an increase in the peak number of patients with 132 psychiatric emergency department arrivals during the 5:00 p.m. hour in fiscal year 2017. Thus, the behavioral health crisis need analysis presented in the Exemption Application on pages 26 through 27 actually understates the peak demand for such treatment spaces.

11 #603975 011888-0023
Table 24
HMH Peak Hour Psychiatric Emergency Department Visits
FY2017
Source: HMH FY2017 internal utilization report
B. The full year extrapolation of 2,640 emergency psychiatric patients per year, offered as an adjustment of actual emergency psychiatric patients per year to account for peak demand levels, translates into an average of 9.1% of average total ED visits over the years FY 2016 and 2017 (based on the data provided in Table 6). How does this provide a basis for creating an FMF in which 16% of total treatment spaces are dedicated to behavioral health patients?
Applicants’ Response
The applicants used an extrapolation at the 5:00 pm hour to ensure a sufficient number of behavioral health treatment spaces to meet peak demand for psychiatric patients who generally have longer lengths of stay. In fiscal year 2017, psychiatric patients had an average visit of 10.9 hours when seen during the 5:00 pm hour as compared to 3.3 hours for non-psychiatric patients over the course of fiscal year 2017. The four behavioral health treatment spaces will not be in peak demand all of the time. Psychiatric patients are projected to be 6.8% not 9.1% of UC FMF’s emergency department visits. To meet the peak demand, though, there is a need for four (4) behavioral health treatment spaces or sixteen percent (16%) of the total twenty-five (25) of treatment spaces in the UC FMF emergency department.
12. The applicant has evaluated the proposed FMF as a high range hospital ED, based on most of the factors outlined in Emergency Department Design for such evaluation, but the discussion of this evaluation (pages 25 to 30) does not provide a clear and comprehensive basis for this evaluation. For some of these factors, this evaluation appears to be an a priori design decision based on unexplained assumptions by the applicant rather than a reasoned explanation of why the FMF must be designed or function in the manner suggested. Many of these decisions are related to the average visit time projection of over four hours. Therefore, we have the following questions:
Applicants’ Response
The Applicants provided a response with data metrics for each of the sixteen (16) factors the author of the ACEP Guide uses to classify emergency departments into the low, mid, and high range tiers. This analysis is set forth at Exhibit 6 and described on page 29 of the Exemption Application. Based on the Applicants’ responses to Questions 12A, 12L, 12M, and 12N, a revised Exhibit 6 is being provided to reclassify three (3) of the criteria to the ACEP “Mid Range,” including the length of stay, turnaround time for diagnostic tests, and the percentage of
FY2017
Hour of Visit 5:00 P.M.
Inpatient Visits 48
Outpatient Visits 84
Total Visits 132
12 #603975 011888-0023
non-urgent patients. Even with these changes, UC FMF projects to be in the Mid to High Range according to Table 5.2 of the ACEP Guide. Of the 16 factors used by the ACEP Guide, UC FMF projects to be in the “High Range” for seven factors, in the “Mid Range” for six factors, and in the “Low Range” for only three factors.
Length of Stay
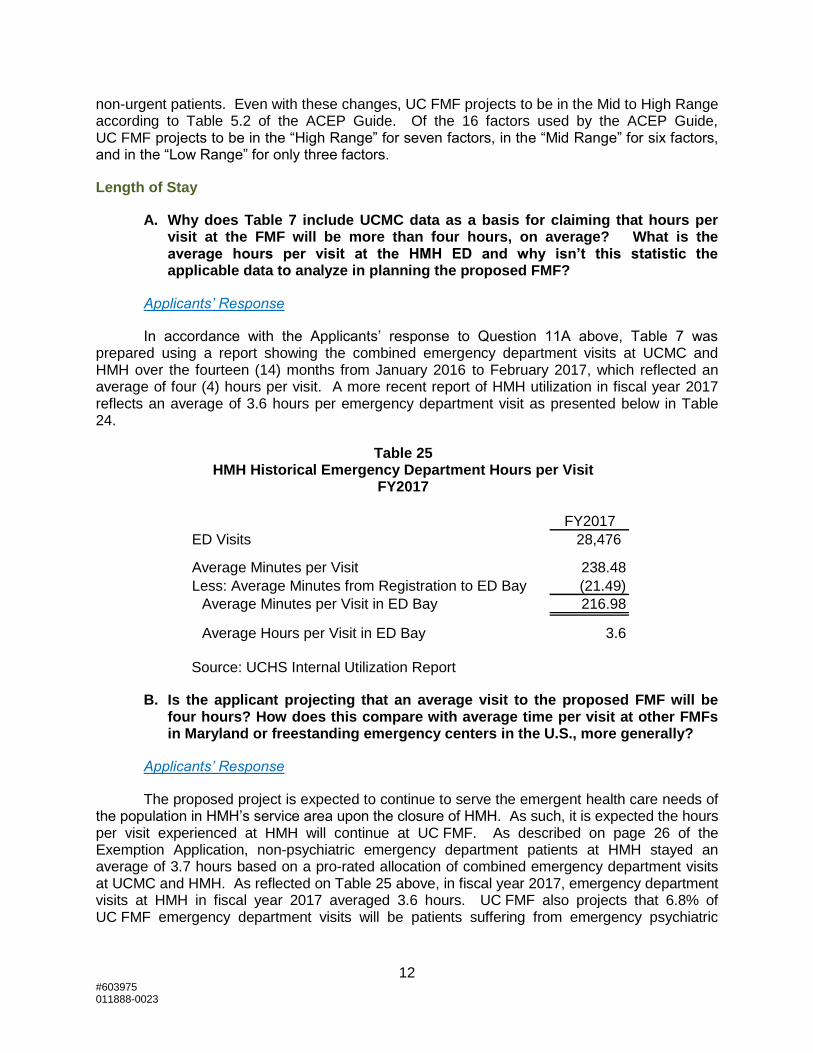
A. Why does Table 7 include UCMC data as a basis for claiming that hours per visit at the FMF will be more than four hours, on average? What is the average hours per visit at the HMH ED and why isn’t this statistic the applicable data to analyze in planning the proposed FMF?
Applicants’ Response
In accordance with the Applicants’ response to Question 11A above, Table 7 was prepared using a report showing the combined emergency department visits at UCMC and HMH over the fourteen (14) months from January 2016 to February 2017, which reflected an average of four (4) hours per visit. A more recent report of HMH utilization in fiscal year 2017 reflects an average of 3.6 hours per emergency department visit as presented below in Table 24.
Table 25 HMH Historical Emergency Department Hours per Visit
FY2017
Source: UCHS Internal Utilization Report
B. Is the applicant projecting that an average visit to the proposed FMF will be four hours? How does this compare with average time per visit at other FMFs in Maryland or freestanding emergency centers in the U.S., more generally?
Applicants’ Response
The proposed project is expected to continue to serve the emergent health care needs of the population in HMH’s service area upon the closure of HMH. As such, it is expected the hours per visit experienced at HMH will continue at UC FMF. As described on page 26 of the Exemption Application, non-psychiatric emergency department patients at HMH stayed an average of 3.7 hours based on a pro-rated allocation of combined emergency department visits at UCMC and HMH. As reflected on Table 25 above, in fiscal year 2017, emergency department visits at HMH in fiscal year 2017 averaged 3.6 hours. UC FMF also projects that 6.8% of UC FMF emergency department visits will be patients suffering from emergency psychiatric
FY2017
ED Visits 28,476
Average Minutes per Visit 238.48
Less: Average Minutes from Registration to ED Bay (21.49)
Average Minutes per Visit in ED Bay 216.98
Average Hours per Visit in ED Bay 3.6

13 #603975 011888-0023
conditions; such patients have a much longer visits the emergency department with the average being 10.9 hours at HMH during the 5:00 pm hour. Factoring in the psychiatric patients, the average visit time is expected to average approximately four (4) hours.
The continuation of services previously provided in a hospital emergency department also limits the ability to compare UC FMF to existing Maryland FMFs. See the Applicants’ Response to Question 12D below regarding the differences between UC FMF’s design and capabilities as compared to existing Maryland FMFs.
C. Does the applicant anticipate that the average time per visit at the FMF will match the average time per visit at the HMH ED?
Applicants’ Response
In short, the Applicants anticipate that the average time per visit will match the average time per visit at HMH’s emergency department. See also Applicants’ Responses to questions 12A and 12B above.
Percentage of Admitted Patients
D. Why does the applicant project that 12 to 20% of the patients seen at the FMF will be admitted to a hospital? Twelve percent of the total visits projected for FY 2022 (28,763) would be 3,452 admissions, which is 273 more admissions than the “inpatient visits” reported for the HMH ED in FY 2016. What evidence exists from the experience of existing freestanding emergency centers, in Maryland or elsewhere, to support such a projection?
Applicants’ Response
The presentation of “Mid 12 to 20%” in the “Evaluation of UC FMF Bed Range” is a restatement of the ACEP Guide Table 5.2 as a “Mid Range” emergency department and based on current admission trends at HMH. As presented in the response to Question 15, the Applicants project 3,723 emergency department visits at UC FMF in fiscal year 2024 that will be admitted to UC Behavioral Health, UCMC, and other hospitals. These emergency department visits that will be admitted represent 12.8% of the total projected 29,019 emergency department visits to UC FMF in fiscal year 2024.
According to the Maryland Health Care Commission’s presentation to the Maryland House Health and Government Operations Committee at a February 10, 2015 hearing, an average of 5.1% of patients treated in fiscal year 2014 at Maryland’s three existing FMFs, UM Queen Anne’s Emergency Center (now Shore Emergency Center at Queenstown (“UM SECQ”)), Bowie Health Center, and Germantown Emergency Center, were admitted as hospital inpatients. Importantly, however, none of the existing FMFs was planned, designed, equipped, or staffed to serve as a replacement for an existing hospital emergency department. Moreover, each of these existing FMFs is limited in its capacity and ability to serve the acuity of patients currently seen at HMH. No existing FMF in Maryland has observation beds, none is accredited by the Joint Commission as an Acute Stroke Ready Hospital and only one, UM Queen Anne’s Emergency Center, has an EMS base station.

14 #603975 011888-0023
Perhaps more significantly in relation to the admission rates at existing Maryland FMFs, in fiscal year 2014, MIEMSS protocols prohibited EMS providers from transporting patients who were experiencing emergency medical conditions to two of the three existing Maryland FMFs. Under MIEMSS protocols, EMS providers could only transport patients who either did not require medical attention at all or who suffered from non-emergent conditions to Bowie Health Center and Germantown Emergency Center. Under a pilot protocol applicable only to UM SECQ in fiscal year 2014, EMS providers could transport stable Priority 2 patients, defined as a patient suffering from a “less serious condition yet potentially life-threatening injury or illness, requiring emergency medical attention but not immediately endangering the patient’s life,” following a consultation with clinical personnel staffing the base station at UM SECQ. As a result, the number of patients suffering from actual emergency medical conditions treated at existing FMFs in Maryland in fiscal year 2014 was largely limited to walk-in patients. The low acuity of patients seen at the existing Maryland FMFs in fiscal year 2014 certainly drove the low hospital admission rate for patients treated at these facilities.
Effective July 1, 2017, MIEMSS protocols have been updated to permit EMS providers to now transport stable Priority 2 patients to all Maryland FMFs with a required medical consultation via base station communication. Assuming Maryland FMFs undertake measures to be able to safely and effectively treat stable Priority 2 EMS patients, the expansion of the MIEMSS freestanding pilot protocol to all Maryland FMFs is likely to increase the acuity of patients seen at FMFs and also increase the percentage of patients admitted for inpatient care. UC FMF is designed and will be staffed to treat such patients. Indeed, as described on page 8 of the Exemption Application, UC FMF will maintain HMH’s EMS base station designation in accordance with a pilot program approved by the EMS Board to allow EMS providers to transport priority 1 stroke patients to UC FMF if a Primary Stroke or Comprehensive Stroke Center is greater than fifteen (15) additional minutes away.
UC FMF’s projected number of inpatient admissions is consistent with utilization trends at HMH, adjusted to eliminate approximately 200 EMS Priority 1 patients that could not be treated at UC FMF. UC FMF’s projection that in fiscal year 2024, 12.8% of emergency patients will be admitted to UC Behavioral Health, UCMC, and other hospitals is below the statewide hospital emergency department admission average of 14.8% inpatient admissions as reported by the Maryland Health Care Commission to the Maryland House Health and Government Operations Committee at the February 10, 2015 hearing.
E. Is the transport of more than nine patients per day from FMF to hospitals being factored into consideration of how development of this FMF will affect emergency transport capabilities in the area? How many patients, on average, are transported from the HMH ED to other hospitals on a daily basis? Please elaborate on this point.
Applicants’ Response
Between fiscal years 2015 and 2017, there was an annual average of 1.3 daily transfers from HMH’s emergency department to other hospitals.
As reflected in Table 29 provided in response to Question 15 below, in fiscal year 2022, the Applicants project that 653 emergency department patients will result in admissions to UC Behavioral Health and an additional 3,037 emergency department visits will be admitted to other hospitals. Excluding inpatient admissions to UC Behavioral Health, UC FMF is projected

15 #603975 011888-0023
to transfer 8.3 patients by ambulance per day to other facilities. In fiscal year 2024, the Applicants’ project an average of 8.4 patient transfers per day to other facilities. To accommodate these projected transfers, the Applicants are actively considering a transport strategy to ensure adequate emergency transport capabilities in the area. Prior to the conversion of HMH to UC FMF, the Applicants will have a final plan for ensuring the ability to make timely ambulance transports in a safe and effective manner that will have minimal impact on the EMS system. The development of a helipad on the campus at the UC Medical Campus at Havre de Grace will eliminate ambulance transfers that currently occur at HMH for patients requiring helicopter ambulance transfers.
Patient care spaces
F. As will be noted in Table 5.2, a low range hospital ED is one that has decided to use “rapid medical evaluation areas, rapid care, and/or vertical areas to get patient assessment and advanced protocols started” thus allowing for “fewer private rooms to be designed in the overall emergency department.” Why cannot an FMF that will see a higher proportion of lower acuity patients than a hospital ED be designed to move patients more rapidly through evaluation and assessment than a traditional hospital ED?
Applicants’ Response
UC FMF has been designed and will be staffed to continue to serve the emergent health care needs of the population in HMH’s service area upon the closure of HMH. An FMF could be developed to see a higher proportion of lower acuity patients than a hospital emergency department and designed with a minimal number of treatment spaces and reduced capabilities. Such a facility, however, would not be capable of continuing to serve the emergent health care needs of HMH’s existing service area. As a consequence, other hospital emergency departments, including UCMC, would be overwhelmed with additional emergency visits necessitating additional capital projects to expand emergency department capacity at such facilities.
G. Why cannot the proposed FMF include private areas that require less space such as curtained cubicles, three-walled patient care areas, and/or patient recliners to assist in advanced protocols or nonurgent patients” as outlined in Table 5.2? Why must every patient, no matter what the emergent or urgent level of care needed, be treated in a private treatment room?
Applicants’ Response
In UC FMF’s emergency department space programming, the Applicants focused on patient and family experience, recognizing that negative patient satisfaction scores are generally associated with small, shared, less private care spaces. Such negative patient satisfaction scores are associated with patient confidentiality concerns as well as infection prevention considerations. The Applicants expect that patient satisfaction will be a significant factor in ensuring that the community utilizes UC FMF to its full potential.

16 #603975 011888-0023
Inner waiting and results waiting areas
H. The high range for this factor is described as, “Patients will remain in private treatment spaces for entire visit. There will be no inner waiting or results waiting spaces in the emergency department.” Why is it necessary for every patient at an FMF to remain in a private treatment space for the entire visit? Why can’t patients waiting for test results wait in another space, freeing up the treatment space and increasing throughput capability of the treatment spaces? Won’t this help reduce the four hour or longer average visit time?
Applicants’ Response
The Applicants do not agree that inner waiting or results waiting spaces in an emergency department are consistent with best practices or better outcomes. Rather, maintaining the patients in triage provides benefits with respect to patient to flow. As the acuity has risen within hospitals and emergency departments, the safety of inner waiting or results waiting spaces has been questioned.
Location of clinical decision unit (CDU) or observation space
I. The high range for this factor, which the applicant states is the apt description for the factor with respect to the proposed FMF, is described as, “Your CDU, observation, or extended stay patients will remain in the emergency department or in an adjacent care module that is part of your architectural project. You will need to add space to accommodate this volume.” The low range for this factor is described as, “Your CDU/observation space will be located outside of the emergency department and is not part of your architectural project. There is, or will be, an area for CDU or observation patients in another area or on another floor. As patients are changed to observation status, they immediately leave the emergency department for another location. You will not need to accommodate this patient volume. Your emergency department can be at the lower range because you don’t have to include those beds in you calculations.” Specifically explain why the latter description does not apply to the proposed FMF and why the description of the high range for this factor does apply.
Applicants’ Response
As reflected on Exhibit 2 to the Exemption Application (drawing A101), the observation unit at UC FMF will be adjacent to the emergency department and is part of the applicant’s architectural project consistent with the ACEP Guide “high range” criteria. However, as patients are changed to observation status, they will leave the emergency department treatment space which consideration falls within the ACEP Guide “low range” criteria.
It should be noted, however, that the State Health Plan Chapter for Freestanding Medical Facilities, COMAR 10.24.17.04(c)(8)(d)(ii), requires an applicant to “demonstrate that the building gross square footage is consistent with the low range guidance, unless, based on the particular characteristics of the population to be served, the applicant demonstrates the need for additional building gross square footage.” Because the ACEP Guide does not contemplate an observation unit as part of the “architectural project” for an emergency
17 #603975 011888-0023
department in the “low range” and only provides for a 1.25 building gross square footage adjustment factor for a “freestanding facility,” if UC FMF is classified in the low range for the “location of clinical decision unit (CDU) or observation space” criterion under Table 5.2 of the ACEP Guide, the observation unit should be excluded from the demonstration required by COMAR 10.24.17.04(c)(8)(d)(ii). As reflected in Exhibit 1, Table B, UC FMF’s observation unit is 6,099 gross departmental square feet and the overall size of UC FMF’s “emergency department” should be reduced by this amount if the observation unit is excluded from the emergency department.
Boarding of admitted patients
J. The high range for this factor is described as, “Emergency department patients who are admitted to the hospital will remain in the department for over 150 minutes after order to admit. This extended time will limit your ability to turn a patient care space over quickly, which means that more spaces will be needed.” Why will occupancy of a treatment space for over 2.5 hours after the order to transfer the patient be a necessary way in which the FMF must function? Why can’t such patients be transferred to the observation unit until all logistical requirements for transfer are completed and transfer can be implemented?
Applicants’ Response
As further clarification to information provided on page 8 of the Exemption Application, the goal for optimal patient management is to achieve an average two-hour transport time for emergent, high acuity patients requiring a higher level of care. This two-hour window will start from the time a decision to admit a patient has been made and continue until the patient arrives at the receiving facility. The two-hour transport window will be accelerated for patients experiencing life threatening conditions; for example, UC FMF will have accelerated transport protocols for stroke and cardiac patients.
For non-emergent transports, a three to four-hour transport window will start from the time the receiving facility confirms bed availability. This transport time is consistent with existing patient boarding times at HMH and UCMC and will include transit time in an ambulance. UC FMF will require time to coordinate placement of most patients in an MSGA unit the receiving facility before transporting the patient. Moreover, UC FMF must still comply with the Emergency Medical Treatment and Labor Act (“EMTALA”), including the requirement to have a prepared room before transporting a patient and confirmation of acceptance from the receiving facility. See 42 C.F.R. §489.24(e)(2). UC FMF will not transfer patients to another emergency department unless the patient’s condition requires surgery or the patient is suffering from time dependent diagnosis that requires immediate transport.
From a clinical perspective, the suggestion that UC FMF emergency department transfers should be routed through UC FMF’s observation unit would not be consistent with the standard of care. The Applicants’ plan is to staff the observation unit with acute care nurse practitioners under the supervision of hospitalists. Patients requiring transfer from UC FMF’s emergency department for an acute inpatient admission will necessarily require a higher level of care than will be provided in UC FMF’s observation unit. Therefore, it would be clinically

18 #603975 011888-0023
inappropriate to admit emergency department patients awaiting an acute inpatient admission to UC FMF’s observation unit.1
From compliance and billing perspectives, admitting patients from the emergency department to the observation while the patient is awaiting transfer to an inpatient facility would also be inappropriate. UC FMF’s observation unit will not be merely a patient holding area but rather a unit dedicated to ongoing assessment and reassessment to determine whether an inpatient admission is necessary or whether the patient can be safely discharged. Medicare guidance, which is followed by Medicaid and most commercial insurers, defines observation care as:
a well-defined set of specific, clinically appropriate services, which include ongoing short term treatment, assessment, and reassessment, that are furnished while a decision is being made regarding whether patients will require further treatment as hospital inpatients or if they are able to be discharged from the hospital. Observation services are commonly ordered for patients who present to the emergency department and who then require a significant period of treatment or monitoring in order to make a decision concerning their admission or discharge. Observation services are covered only when provided by the order of a physician or another individual authorized by State licensure law and hospital staff bylaws to admit patients to the hospital or to order outpatient services.
Centers for Medicare and Medicaid Services, Medicare Claims Processing Manual, Ch. 4 § 290.1 (Effective Date: 07-01-09) (emphasis added). Because a clinical decision to transfer emergency patients to a higher level of care will have already been made, it would not be appropriate to admit a patient awaiting such a transfer to observation status.
K. Since this is an FMF, isn’t the patient simply being transferred to a hospital ED, at UCMC or some other hospital, when determined to need hospital admission? Thus, unlike ED boarding at a hospital ED, the FMF patient for which an order to admit decision has been made is not experiencing a long wait time that involves finding a vacant bed in an appropriate nursing unit of the hospital? Why can’t a patient be transported more quickly, since the actual admission to a hospital bed will be taking place at the receiving hospital and not at the FMF?
Applicants’ Response
See the applicants’ response to Question 12(J) above.
Turnaround time for diagnostic tests
L. Why will it take more than 90 minutes to turnaround laboratory and imaging studies at the FMF? Is this the observed experience at FMFs?
1 In certain cases, patients already admitted to UC FMF’s observation unit may require an inpatient
admission. In such cases, UC FMF’s observation unit staff will be supported by UC FMF emergency department physicians as needed to ensure the observation patient receives medically necessary treatment and intervention before the patient can be admitted.
19 #603975 011888-0023
Applicants’ Response
The applicants’ projected average imaging study turnaround time was presumed to be consistent with historical trends at HMH. In the first and second calendar quarters of 2017, 98.5% of imaging studies during the day and evening shifts had a turnaround time within 60 minutes. For overnight imaging study interpretations, 87.5 % were completed within 60 minutes during the first and second calendar quarters of 2017. For laboratory testing, in fiscal year 2017, 91% of HMH’s emergency department laboratory tests had a turnaround test result within 40 minutes. Based on these figures, HMH and UC FMF are projected to be within the ACEP Guide Mid-Range for this criterion as reflected on Table 5.2 of the ACEP Guide.
Percent of Non-Urgent Patients
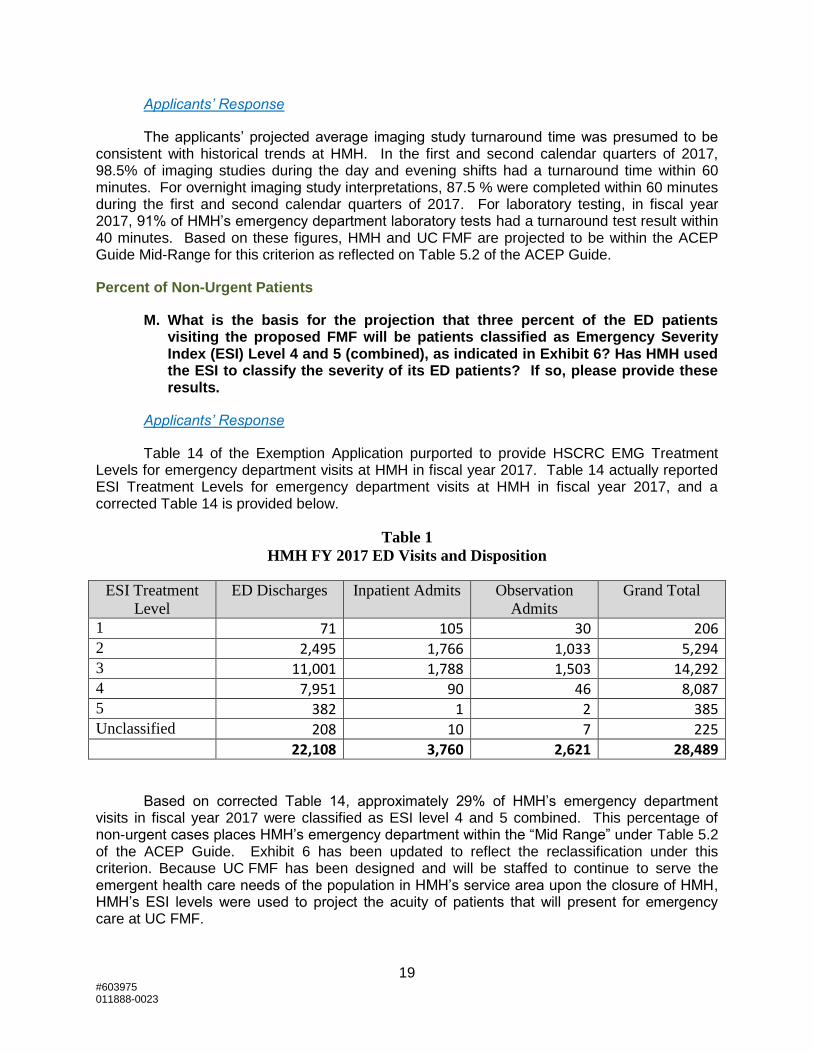
M. What is the basis for the projection that three percent of the ED patients visiting the proposed FMF will be patients classified as Emergency Severity Index (ESI) Level 4 and 5 (combined), as indicated in Exhibit 6? Has HMH used the ESI to classify the severity of its ED patients? If so, please provide these results.
Applicants’ Response
Table 14 of the Exemption Application purported to provide HSCRC EMG Treatment Levels for emergency department visits at HMH in fiscal year 2017. Table 14 actually reported ESI Treatment Levels for emergency department visits at HMH in fiscal year 2017, and a corrected Table 14 is provided below.
Table 1
HMH FY 2017 ED Visits and Disposition
ESI Treatment
Level
ED Discharges Inpatient Admits Observation
Admits
Grand Total
1 71 105 30 206 2 2,495 1,766 1,033 5,294 3 11,001 1,788 1,503 14,292 4 7,951 90 46 8,087 5 382 1 2 385 Unclassified 208 10 7 225 22,108 3,760 2,621 28,489
Based on corrected Table 14, approximately 29% of HMH’s emergency department visits in fiscal year 2017 were classified as ESI level 4 and 5 combined. This percentage of non-urgent cases places HMH’s emergency department within the “Mid Range” under Table 5.2 of the ACEP Guide. Exhibit 6 has been updated to reflect the reclassification under this criterion. Because UC FMF has been designed and will be staffed to continue to serve the emergent health care needs of the population in HMH’s service area upon the closure of HMH, HMH’s ESI levels were used to project the acuity of patients that will present for emergency care at UC FMF.
20 #603975 011888-0023
Based on the foregoing, the second paragraph on page 47 of the Exemption Application should be corrected to state:
While there are seven (7) urgent care centers in UC FMF’s service area (see Table 4 above), in fiscal year 2017, seventy-one (71%) of HMH’s emergency department visits fell within an ESI Treatment Level which could not be successfully transitioned to an urgent care center (Table 14). This assumes that only patients at ESI Levels 4 and 5 who were discharged from HMH’s emergency room could be transitioned to an urgent care center. The remaining 29% represent a patient population who self-selects care at a traditional emergency department rather than an urgent care center. Certainly, there are many factors that drive patient selection for site-of-service; however, one key factor is a patient’s inability to discern the lowest level of care for their presenting need(s). Another factor is the limited hours of operation of urgent care centers. (See Table 4.)
N. With respect to Table 14, purported to classify severity of patient needs for HMH ED patients by using evaluation and management CPT codes, it appears to show that rates of inpatient admission and observation admission are inversely related to severity? Is this correct?
Applicants’ Response
See the Applicants’ response to Question 12M above, including the clarification of the data presented in Table 14.
Age of Patients
O. What is the basis for the projection that 22% of the FMF patients will be older than 65? This proportion appears slightly higher than the age mix of ED patients at the HMH ED in CY 2016, based on our review of the HSCRC Discharge Data Base and Outpatient Files. It is substantially higher than the percentages seen at Maryland’s three existing FMFs in the 2013-2014 period reviewed in MHCC’s last published report on FMF operation. Doesn’t the applicant feel that elderly patients may be more disposed than younger patients, as a first option, to travel or be transported to a hospital ED, resulting in a different age mix in the patient population than that traditionally seen at HMH’s ED? Isn’t this what the experience of existing FMFs suggest?
Applicants’ Response
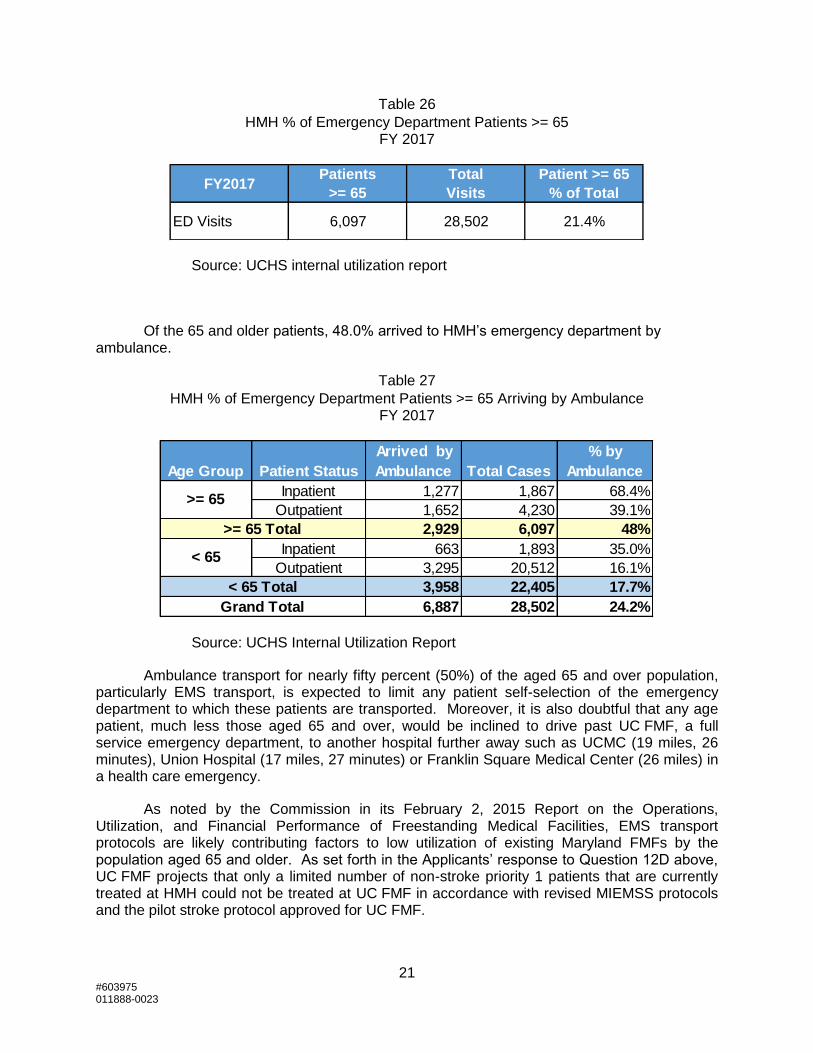
In fiscal year 2017, patients 65 and older comprised 21.4% of the total number of emergency department visits to HMH.
21 #603975 011888-0023
Table 26
HMH % of Emergency Department Patients >= 65 FY 2017
Source: UCHS internal utilization report
Of the 65 and older patients, 48.0% arrived to HMH’s emergency department by ambulance.
Table 27
HMH % of Emergency Department Patients >= 65 Arriving by Ambulance FY 2017
Source: UCHS Internal Utilization Report
Ambulance transport for nearly fifty percent (50%) of the aged 65 and over population, particularly EMS transport, is expected to limit any patient self-selection of the emergency department to which these patients are transported. Moreover, it is also doubtful that any age patient, much less those aged 65 and over, would be inclined to drive past UC FMF, a full service emergency department, to another hospital further away such as UCMC (19 miles, 26 minutes), Union Hospital (17 miles, 27 minutes) or Franklin Square Medical Center (26 miles) in a health care emergency.
As noted by the Commission in its February 2, 2015 Report on the Operations, Utilization, and Financial Performance of Freestanding Medical Facilities, EMS transport protocols are likely contributing factors to low utilization of existing Maryland FMFs by the population aged 65 and older. As set forth in the Applicants’ response to Question 12D above, UC FMF projects that only a limited number of non-stroke priority 1 patients that are currently treated at HMH could not be treated at UC FMF in accordance with revised MIEMSS protocols and the pilot stroke protocol approved for UC FMF.
FY2017Patients
>= 65
Total
Visits
Patient >= 65
% of Total
ED Visits 6,097 28,502 21.4%
Age Group Patient Status
Arrived by
Ambulance Total Cases
% by
Ambulance
Inpatient 1,277 1,867 68.4%
Outpatient 1,652 4,230 39.1%
2,929 6,097 48%
Inpatient 663 1,893 35.0%
Outpatient 3,295 20,512 16.1%
3,958 22,405 17.7%
6,887 28,502 24.2%
>= 65
>= 65 Total
< 65
< 65 Total
Grand Total

22 #603975 011888-0023
Imaging Facilities
P. Are the imaging facilities being developed at the FMF dedicated to the use of FMF patients arriving for urgent and emergent care on an unscheduled basis?
Applicants’ Response
The imaging unit being developed at UC FMF will be used by both UC FMF patients arriving for urgent and emergent care on an unscheduled basis and for patients at the adjacent special psychiatric hospital requiring such services. UC FMF’s imaging unit will not be used for scheduled outpatient use. In fiscal year 2017, HMH outpatient emergency department utilized imaging services as presented below in Table 28. The historical relationship of imaging services to emergency department visits will continue at UC FMF with the exception of nuclear medicine.
Table 28
Imaging Services Utilized by Outpatient Emergency Department Visits FY 2017 (1)
Note (1): Reflects annualized 9 months (July 2016 – March 2017) of St. Paul’s Non-Confidential Patient Level Data.
Q. In what sense, are “multiple imaging rooms, CT(s), mammography room(s), and a potential MRI . . . a part of” the FMF? This is the description of high range in Emergency Department Design (“. . . part of. . .” the hospital ED), which is the description the applicant believes best fits the proposed FMF, based on Exhibit 6. However, the floor plan drawing shows a “diagnostic imaging suite” (so labeled as a distinct “feature” of the FMF on page 6 of the exemption request, distinct from the “emergency department” of the FMF), located adjacent to the “emergency department.” Why is it inaccurate, given this facility design, to say that “imaging studies will not be performed within the department,” the ACEP description of a low range hospital ED?
Applicants’ Response
With respect to imaging facilities, Table 5.2 of the ACEP Guide “low range” provides, “imaging studies will not be performed within the department, so there is no need to add space for imaging rooms.” At UC FMF, an imaging department is a necessary component of the facility to safely and effectively treat emergency and observation patients.
Outpatient % of
Service Utilization ED Visits
Emergency Department Visits 24,412 100.0%
Radiology - Diagnostic 11,301 46.3%
CAT Scanner 5,321 21.8%
Electrocardiography 6,417 26.3%
Nuclear Medicine 344 1.4%
Magnetic Resonance Imaging 564 2.3%
23 #603975 011888-0023
The State Health Plan Chapter for Freestanding Medical Facilities, COMAR 10.24.17.04(c)(8)(d)(ii), requires an applicant to “demonstrate that the building gross square footage is consistent with the low range guidance, unless, based on the particular characteristics of the population to be served, the applicant demonstrates the need for additional building gross square footage.” Because the ACEP Guide does not contemplate an imaging unit as part of the “architectural project” for an emergency department in the “low range” and only provides for a 1.25 building gross square footage adjustment for a “freestanding facility,” if UC FMF is classified in the low range for the “imaging studies” criterion under Table 5.2 of the ACEP Guide, UC FMF’s imaging department and other components not contemplated by the ACEP low range should be excluded from the demonstration required by COMAR 10.24.17.04(c)(8)(d)(ii). As reflected in Exhibit 1, Table B, UC FMF’s imaging department is 8,192 departmental gross departmental square feet and the overall size of UC FMF’s “emergency department” should be reduced by this amount.
13. The applicant projects that a much higher level of patient visits to the proposed FMF will result in hospital admissions (12.6% in FY 2024) than existing Maryland FMFs have historically reported (2.9% to 5.9% in 2014, as reported in MHCC’s 2015 report on FMF operation). The applicant assumes that FMF visits will convert to inpatients at about the same level as ED visits at HMH convert to inpatients.
Applicants’ Response
See the Applicant’s response to Question 12D above.
A. While the proposed FMF would be the first in Maryland established through conversion of a general hospital, why isn’t it reasonable to expect that the service area population will adjust its care-seeking behavior in more significant ways than the assumption underlying this projection indicates, which is that no appreciable adjustment in care- seeking behavior will occur?
Applicants’ Response
As stated above, the Applicants have assumed that with the exception of 0.4% of historical visits that originate from northeast Cecil County and a limited number of non-stroke priority 1 EMS cases, the residents of HMH’s service area will continue to come to UC FMF when experiencing emergency health conditions. These utilization projections are supported by UC FMF’s plans to implement an Acute Stroke Ready Pilot and MIEMMS protocol changes allowing stable priority 2 patient to be transported to FMFs. The increase in accessibility to Interstate 95 instead of HMH’s landlocked campus in downtown Havre de Grace is also likely to result in an increase in patient walk-ins. Finally, UM UCH has been and will continue to educate the community consistently that approximately 90% of their care can be received on the UC Medical Campus at Havre de Grace. The Applicants, therefore, anticipate the community will seek care at UC FMF when experiencing medical emergencies in the same manner as care is currently sought at HMH’s emergency department. Moreover, patients experiencing emergency health conditions are unlikely to be able to self-diagnose and choose to travel 19 miles and approximately 26 minutes to UCMC, 17 miles and approximately 27 minutes to Union Hospital, or 26 miles to Franklin Square Medical Center.
24 #603975 011888-0023
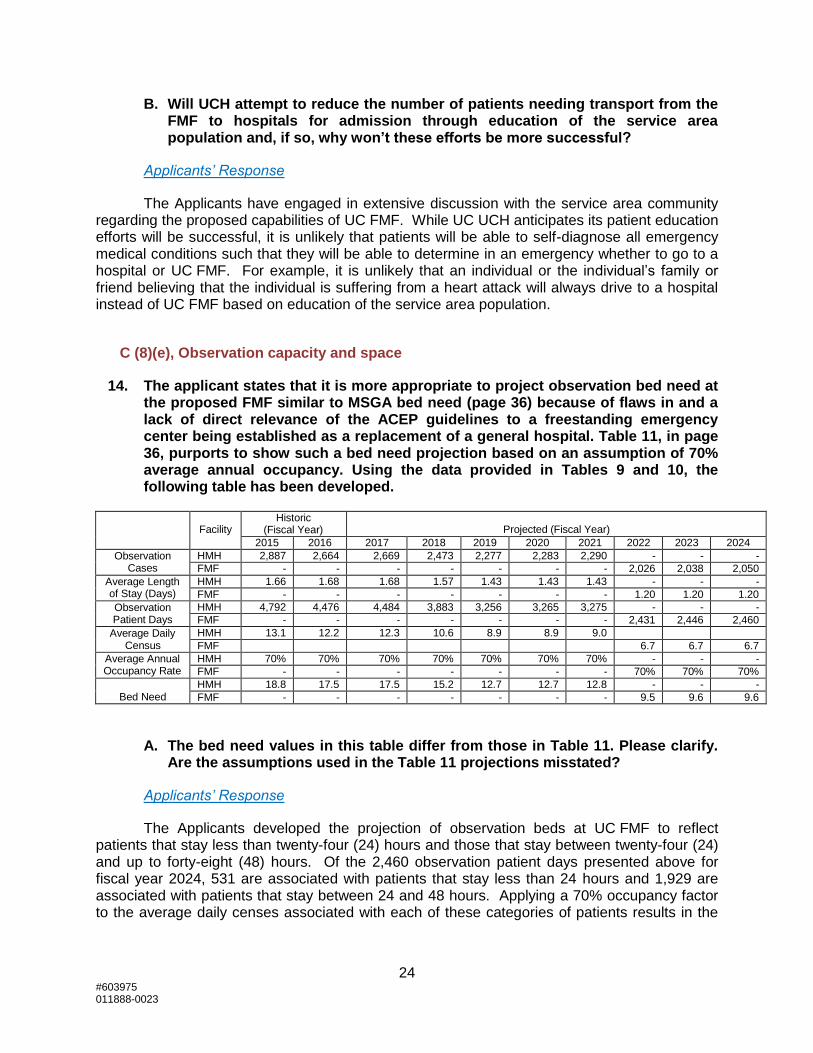
B. Will UCH attempt to reduce the number of patients needing transport from the FMF to hospitals for admission through education of the service area population and, if so, why won’t these efforts be more successful?
Applicants’ Response
The Applicants have engaged in extensive discussion with the service area community regarding the proposed capabilities of UC FMF. While UC UCH anticipates its patient education efforts will be successful, it is unlikely that patients will be able to self-diagnose all emergency medical conditions such that they will be able to determine in an emergency whether to go to a hospital or UC FMF. For example, it is unlikely that an individual or the individual’s family or friend believing that the individual is suffering from a heart attack will always drive to a hospital instead of UC FMF based on education of the service area population.
C (8)(e), Observation capacity and space
14. The applicant states that it is more appropriate to project observation bed need at the proposed FMF similar to MSGA bed need (page 36) because of flaws in and a lack of direct relevance of the ACEP guidelines to a freestanding emergency center being established as a replacement of a general hospital. Table 11, in page 36, purports to show such a bed need projection based on an assumption of 70% average annual occupancy. Using the data provided in Tables 9 and 10, the following table has been developed.
Facility Historic
(Fiscal Year)
Projected (Fiscal Year)
2015 2016 2017 2018 2019 2020 2021 2022 2023 2024
Observation Cases
HMH 2,887 2,664 2,669 2,473 2,277 2,283 2,290 - - -
FMF - - - - - - - 2,026 2,038 2,050
Average Length of Stay (Days)
HMH 1.66 1.68 1.68 1.57 1.43 1.43 1.43 - - -
FMF - - - - - - - 1.20 1.20 1.20
Observation Patient Days
HMH 4,792 4,476 4,484 3,883 3,256 3,265 3,275 - - -
FMF - - - - - - - 2,431 2,446 2,460
Average Daily Census
HMH 13.1 12.2 12.3 10.6 8.9 8.9 9.0 FMF 6.7 6.7 6.7
Average Annual Occupancy Rate
HMH 70% 70% 70% 70% 70% 70% 70% - - -
FMF - - - - - - - 70% 70% 70%
Bed Need HMH 18.8 17.5 17.5 15.2 12.7 12.7 12.8 - - -
FMF - - - - - - - 9.5 9.6 9.6
A. The bed need values in this table differ from those in Table 11. Please clarify. Are the assumptions used in the Table 11 projections misstated?
Applicants’ Response
The Applicants developed the projection of observation beds at UC FMF to reflect patients that stay less than twenty-four (24) hours and those that stay between twenty-four (24) and up to forty-eight (48) hours. Of the 2,460 observation patient days presented above for fiscal year 2024, 531 are associated with patients that stay less than 24 hours and 1,929 are associated with patients that stay between 24 and 48 hours. Applying a 70% occupancy factor to the average daily censes associated with each of these categories of patients results in the
25 #603975 011888-0023
need for 3 beds for patients staying less than 24 hours and 8 beds for patients staying between 24 and 48 hours, for a total of 11 observation beds.
B. Is there substantial variation in observation length-of-stay, and an ability to predict observation length-of-stay, that would allow development of observation space that is not exclusively designed as 183 square foot rooms, exclusive of in-room toilet and bathing areas, i.e., essentially, single-occupancy hospital rooms? Is there enough variation so that a short-stay observation patient, likely to be staying for just a few hours, could be accommodated outside of what is essentially a hospital room, thus reducing the number of hospital-style rooms needed for observation?
Applicants’ Response
Patients who only require care for a few hours would not likely be included in the patient population that would be cared for in the observation unit. As noted in response to Question 12J above, admission to observation status is only appropriate for monitoring and assessing patients while a decision to admit the patient for inpatient care is pending and/or it is expected that the patient’s clinical condition will resolve within 48 hours following treatment.
C (8)(f), Utilization, revenue, and expense projections
15. In Table 12, the “inpatient visit” count for the proposed FMF is the same as the visit count previously “IP psych visits” in Table 6. Isn’t this a large undercount of actual “inpatient visits” projected and, correspondingly, an over-count of projected FMF “outpatient visits?” Please clarify.
Applicants’ Response
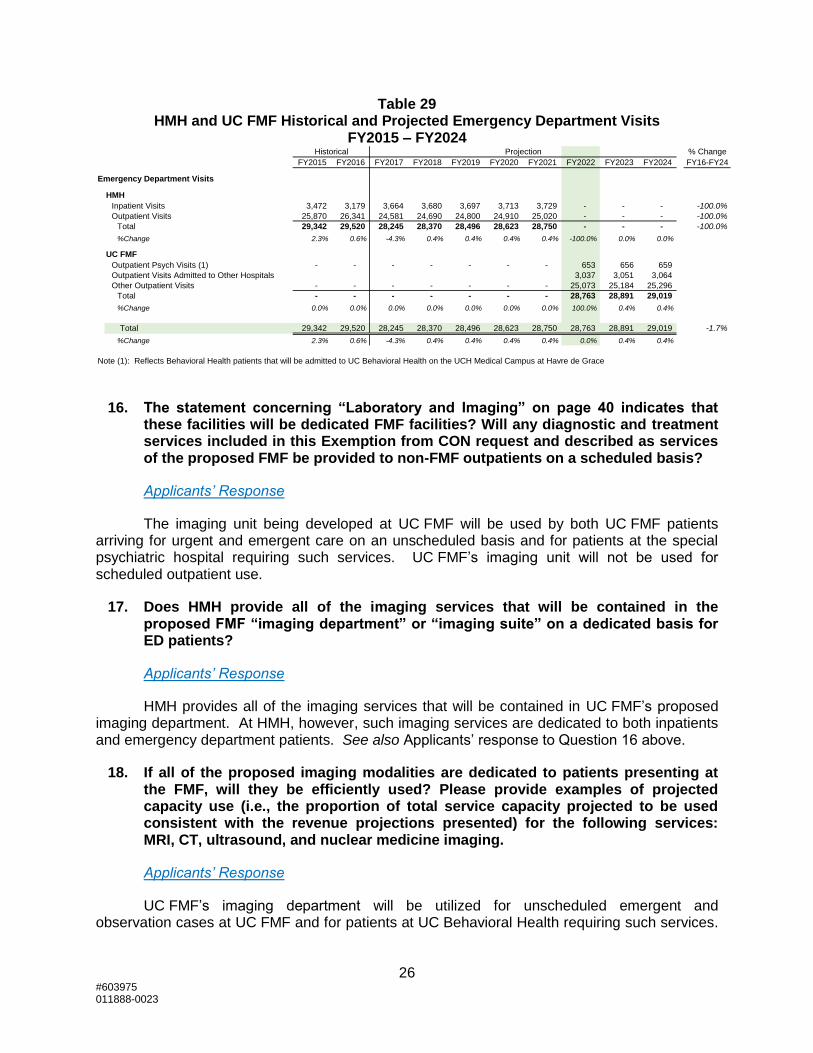
Starting in fiscal year 2022, patients that were previously admitted at HMH will be treated at UC FMF as outpatients and then transferred to other hospitals for inpatient admissions. In fiscal year 2022, there is a projection of 653 emergency department visits that will result in admission to UC Behavioral Health. An additional 3,037 emergency department visits will be admitted to other hospitals in fiscal year 2022 growing to 3,064 by fiscal year 2024.
26 #603975 011888-0023
Table 29 HMH and UC FMF Historical and Projected Emergency Department Visits
FY2015 – FY2024
16. The statement concerning “Laboratory and Imaging” on page 40 indicates that these facilities will be dedicated FMF facilities? Will any diagnostic and treatment services included in this Exemption from CON request and described as services of the proposed FMF be provided to non-FMF outpatients on a scheduled basis?
Applicants’ Response
The imaging unit being developed at UC FMF will be used by both UC FMF patients arriving for urgent and emergent care on an unscheduled basis and for patients at the special psychiatric hospital requiring such services. UC FMF’s imaging unit will not be used for scheduled outpatient use.
17. Does HMH provide all of the imaging services that will be contained in the proposed FMF “imaging department” or “imaging suite” on a dedicated basis for ED patients?
Applicants’ Response
HMH provides all of the imaging services that will be contained in UC FMF’s proposed imaging department. At HMH, however, such imaging services are dedicated to both inpatients and emergency department patients. See also Applicants’ response to Question 16 above.
18. If all of the proposed imaging modalities are dedicated to patients presenting at the FMF, will they be efficiently used? Please provide examples of projected capacity use (i.e., the proportion of total service capacity projected to be used consistent with the revenue projections presented) for the following services: MRI, CT, ultrasound, and nuclear medicine imaging.
Applicants’ Response
UC FMF’s imaging department will be utilized for unscheduled emergent and observation cases at UC FMF and for patients at UC Behavioral Health requiring such services.
Historical Projection % Change
FY2015 FY2016 FY2017 FY2018 FY2019 FY2020 FY2021 FY2022 FY2023 FY2024 FY16-FY24
Emergency Department Visits
HMH
Inpatient Visits 3,472 3,179 3,664 3,680 3,697 3,713 3,729 - - - -100.0%
Outpatient Visits 25,870 26,341 24,581 24,690 24,800 24,910 25,020 - - - -100.0%
Total 29,342 29,520 28,245 28,370 28,496 28,623 28,750 - - - -100.0%
%Change 2.3% 0.6% -4.3% 0.4% 0.4% 0.4% 0.4% -100.0% 0.0% 0.0%
UC FMF
Outpatient Psych Visits (1) - - - - - - - 653 656 659
Outpatient Visits Admitted to Other Hospitals 3,037 3,051 3,064
Other Outpatient Visits - - - - - - - 25,073 25,184 25,296
Total - - - - - - - 28,763 28,891 29,019
%Change 0.0% 0.0% 0.0% 0.0% 0.0% 0.0% 0.0% 100.0% 0.4% 0.4%
Total 29,342 29,520 28,245 28,370 28,496 28,623 28,750 28,763 28,891 29,019 -1.7%
%Change 2.3% 0.6% -4.3% 0.4% 0.4% 0.4% 0.4% 0.0% 0.4% 0.4%
Note (1): Reflects Behavioral Health patients that will be admitted to UC Behavioral Health on the UCH Medical Campus at Havre de Grace

27 #603975 011888-0023
The imaging department at UC FMF will not have nuclear medicine imaging. The imaging RVU projections for fiscal years 2022, 2023, and 2024 as presented in Table F are based on a projection of comparable outpatient services at HMH and will grow with the annual increase in emergency visits and observation cases.
With respect to MRI, CT, and ultrasound, the Applicants do not project that these imaging modalities will be used as efficiently at UC FMF as they are presently used at HMH, where they serve both emergency department patients and inpatients. However, MRI, CT, and ultrasound are necessary to provide clinically appropriate care to emergency and observation patients at UC FMF. More specifically, MRI is necessary to treatment patients with Transient Ischemic Attack (“TIA”) or suspected stroke. Indeed, as described in footnote 5 of the Exemption Application, MRI has been shown as superior to CT to identify acute ischemic stroke as per the AHA/ASA Guidelines in 2010 and 2013. Furthermore, as described in footnote 5 of the Exemption Application, CT and MRI are necessary at UC FMF to maintain Acute Stroke Ready Joint Commission Accreditation under the EMS pilot protocol applicable to UC FMF.
Project Budget, Table E
19. Specify the purpose of the expense at Line 2.c2 and Line 2.d2.
Applicants’ Response
On Table E, Line 2.c2 totaling $143,000 includes fees for UM UCH’s consultants, KPMG, LLP and Andrew Solberg, in support of filing the Exemption Application with the Maryland Health Care Commission. Line 2.d2 totaling $492,000 includes support from several vendors with pre-application tasks such as design, planning, and assessing the financial impact of this project for UM UCH. Vendors include BRG and KPMG, LLP for strategic planning, Morris Richie for architecture and engineering support, and Gallagher, Evelius & Jones, LLP for support commenting on regulation and other pre-application tasks.
Utilization, Revenue, and Expense Projections, Pages 38-46 and applicable utilization, revenue, and expense schedules
20. Tables G and H are accompanied by a statement of assumptions that, for volume projections, references Table F. However, Table F only provided use projections for the FMF while Tables G and H provide revenue and expense projections for UCMC and the FMF. Please provide a Table F-Statistical Projections that cover the entire UCH facility components (thus, UCMC and HMH during the period of FY 2015 to FY 2021) and UCMC and the UCH-HG FMF and UCH-HG psychiatric hospital during the period of FY 2022 to FY 2024. Consistent with the use projection, provide a corresponding Table G (uninflated current year dollars) and a Table H (inflated), showing historic and projected revenues and expenses for UCMC and HMH from FY 2015 to FY 2021 and projected revenue and expenses for UCMC, the UCH-HG FMF, and the UCH-HG psychiatric hospital from FY 2022 to FY 2024. Provide corresponding statements of the assumptions used in development of these tables.

28 #603975 011888-0023
Applicants’ Response
Enclosed as Exhibit 9, are Tables F, G and H that cover the entire UM UCH hospital facility components, including UCMC and HMH during the period from fiscal year 2015 to fiscal year 2021 and UCMC, UC FMF, and UC Behavioral Health between fiscal years 2022 and 2024. Corresponding statements of assumptions are attached.
21. Is this proposed conversion of HMH to an FMF predicated on a global budget that will include revenue from any outpatient services other than the services provided to persons presenting at the FMF for unscheduled urgent or emergent services and the service provided to persons cared for as observation patients after assessment and treatment of their unscheduled urgent or emergency service needs?
Applicants’ Response
UC FMF’s financial projections are based on a global budget that includes revenue only from services provided to persons presenting at UC FMF for unscheduled urgent or emergent services and to persons cared for as observation patients after assessment and treatment of unscheduled urgent or emergency service needs.
More Efficient and Effective Delivery of Health Care Services, pages 46-48
22. From an institutional perspective, this project and the related expansion of UCMC and the consolidation of acute psychiatric hospital services currently provided at HMH and Union Hospital into a single specialty hospital, should create economies of scale in acute care hospital service delivery.
A. Please quantify the reductions in FTEs per MSGA admission and patient day achieved by transitioning from two hospitals in Harford County to one hospital.
Applicants’ Response
As UM UCH consolidates from two acute hospitals to one acute hospital, efficiencies will be realized for both IP admissions and OP visits in Harford County. Because FTEs serve both inpatients and outpatients, the efficiency calculation of FTEs per adjusted average occupied bed (“AOB”) is used to measure this efficiency. In the initial year of the transition, UM UCH will realize an approximate 7% efficiency gain from 4.4 FTEs in fiscal year 2021 to 4.1 FTEs per AOB in fiscal year 2022.

29 #603975 011888-0023
B. Please quantify the reduction in FTEs per ED visit and observation visit and observation day achieved by transitioning from two hospitals in Harford County with two EDs and two observation services to one hospital ED, one FMF, and two observation services.
Applicants’ Response
A reduction in FTEs per ED visit at the FMF is not anticipated at this time. UM Upper Chesapeake Health does anticipate efficiencies in FTEs per observation visit/days. However, because HMH does not have a dedicated observation unit observation and such patients are currently dispersed throughout the facility’s MSGA beds, there is not a methodology to quantify any efficiency gains at this point in time.
Public Interest, pages 48-55
23. Please provide a Table L., Work Force Information, that reflects the current work force for HMH.
Applicants’ Response
Set forth in Exhibit 9 is a Table L that includes the workforce information for HMH in fiscal year 2017.
24. For comparison purposes, please provide a Table L., Work Force Information, that reflects the current FTEs dedicated to the provision of ED services at HMH. We recognize that this will require some estimation of FTEs for services such as laboratory testing and imaging that account for the use of these diagnostic services by ED patients, so please provide a statement explaining how these estimates were produced. This table is intended to provide information that can be compared with the FMF Table L provided in the exemption request, so do not include any FTEs involved in serving HMH ED patients “downstream” from the ED that would not be included in the FMF work force, i.e., surgical services or inpatient services, generally.
Applicants’ Response
Set forth in Exhibit 9, is a Table L that includes the workforce for HMH’s emergency department in fiscal year 2017. Included in these numbers are FTEs dedicated to the provision of ancillary services to patients when they are in the emergency department. It excludes FTEs associated with care provided to patients that came through the emergency department but were ultimately admitted or received surgical services. A methodology was devised based on the current RVU utilization of these HMH ED patients divided by the total RVU’s of that specific ancillary service. This ratio was then applied to the ancillary department’s total workforce to arrive at an approximate percentage of FTEs that support HMH ED patients.

30 #603975 011888-0023
Table of Exhibits
Exhibit Description
2 Revised Exhibit 2 Project Drawings
6 Revised Exhibit 6 – UC FMF Evaluation of Emergency Department Bed Range
8 Exam Room Project Drawings
9 Tables F, G and H, L (HMH Workforce FY 2017); L (HMH ED in FY2017)
Table of Tables
Table Description
Table 19 Department Gross Square Footage UC FMF and UC Behavioral Health
Table 20 HMH MSGA Primary Service Area Zip Codes and Discharges FY 2016
Table 21 HMH Psychiatric Primary Service Area Zip Codes and Discharges FY 2016
Table 22 HMH Emergency Department Visits Between 8 p.m. and 8 a.m. FY 2017
Table 23 UC FMF Projected ED Visits FY 2022 – FY 2024
Table 24 HMH Peak Hour Psychiatric Emergency Department Visits FY 2017
Table 25 HMH Historical Emergency Department Hours per Visit FY 2017
Table 26 HMH % of Emergency Department Patients Older Than 65 FY 2017
Table 27 HMH % of Emergency Department Patients >= 65 Arriving by Ambulance FY 2017
Table 28 Imaging Services Utilized by Outpatient Emergency Department Visits FY 2017
Table 29 HMH and UC FMF Historical and Projected Emergency Department Visits FY2015 – FY2024


#600532 011888-0023
I hereby declare and affirm under the penalties of perjury that the facts stated in
this application and its attachments are true and correct to the best of my knowledge,
information, and belief.
September 18, 2017
Date Andrew L. Solberg
A.L.S. Healthcare Consultant Services

EXHIBIT 2
ALUMINUM STOREFRONT WITHALUMINUM SILL TYP.
ALUMINUM CURTAINWALL
CORRUGATED METAL WITH CONCEALED FASTNERS
ALUMINUM COMPOSITE METAL
CAST STONE CURB
CAST STONE BMU 1 1/2" REVEAL IN BMU 1 ALUMINUM CURTAINWALL
ALUMINUM CURTAINWALL
BMU 1
BMU 1 HEADER COURSE 1/2" PROJECTION
BMU 2
BMU 2 HEADER COURSE 1/2" PROJECTION
BMU 1 SOLDIER COURSE 1/2" PROJECTION
ALUMINUM FASCIA
ALUMINUM COMPOSITE METAL
ALUMINUM CURTAINWALLBMU 1 BMU 1
BMU 1 HEADER COURSE 1/2" PROJECTION
BMU 2
BMU 1 SOLDIER COURSE 1/2" PROJECTION
BMU 1 HEADER COURSE OVER SOLDIER COURSE
ALUMINUM FASCIA
1" INSULATED GLAZING WITH GREY SOLARBAN 60 TYP. UNLESS NOTED OTHERWISE
CORRUGATED METAL WITH CONCEALED FASTNERS
STEEL DOOR
GROUND FLOOR 100'
FIRST FLOOR 115'
ROOF 130'
ALUMINUM WINDOWS WITHPOLYCARBONATE GLAZINGTYPICAL AT ALL BEHAVIORALHEALTH PATIENT TREATMENTAREAS
GROUND FLOOR 100'
FIRST FLOOR 115'
ROOF 130'
CORRUGATED METAL CONCEALED FASTNER ROOF SCREEN
BMU 1
BMU 1 HEADER COURSE 1/2" PROJECTION
BMU 2
BMU 1 SOLDIER COURSE 1/2" PROJECTION
ALUMINUM FASCIA
ALUMINUM STOREFRONT WITH ALUMINUM SILL
ALUMINUM COMPOSITE METAL
CAST STONE CURB
BMU 1
BMU 1 HEADER COURSE 1/2" PROJECTION
BMU 2
BMU 1 SOLDIER COURSE 1/2" PROJECTION
ALUMINUM FASCIA
BMU 1
BMU 1 HEADER COURSE 1/2" PROJECTION
BMU 2
BMU 2 HEADER COURSE 1/2" PROJECTION
BMU 1 SOLDIER COURSE 1/2" PROJECTION
ALUMINUM FASCIA
STEEL DOOR
BMU 1
ALUMINUM STOREFRONT WITH ALUMINUM SILLGROUND FLOOR 100'
FIRST FLOOR 115'
ROOF 130'
ALUMINUM WINDOWS WITH POLYCARBONATEGLAZING TYPICAL AT ALL BEHAVIORAL HEALTHPATIENT AREAS
CORRUGATED METAL CONCEALED FASTNER ROOF SCREEN
CORRUGATED METAL CONCEALED FASTNER ROOF SCREEN
GROUND FLOOR 100'
FIRST FLOOR 115'
ROOF 130'
CORRUGATED METAL CONCEALED FASTNER ROOF SCREENSTANDING SEAM METAL ROOFSTANDING SEAM METAL ROOF
BMU 1
BMU 1 HEADER COURSE 1/2" PROJECTION
BMU 2
BMU 1 SOLDIER COURSE 1/2" PROJECTION
ALUMINUM FASCIA
ALUMINUM WINDOW WITH POLYCARBONATE GLAZINGTYPICAL AT ALL BEHAVIORAL HEALTH PATIENTTREATMENT AREAS
FREESTANDING MEDICAL FACILITY- 49,857 SF
SHARED SERVICES- 24,841 SFBEHAVIORAL HEALTH PAVILION- 53,922 SF
FIRST FLOOR- 50,800 GROSS SF
GROUND FLOOR- 78,763 GROSS SF
SHARED SERVICES- 943 SF
SHARED AREAS- 25,784 GROSS SF
Drn: Chk:
Sheet Name
Scale:
Sheet Number
11 North Washington Street, Suite 300Rockville, Maryland 20850Phone: (301) 217-0826Fax: (301) 217-0751
UNIVERSITY
OF
MARYLAND -
UPPER
CHESAPEAKE
HEALTH
MEDICAL
CAMPUS
Job 628620
HAVRE DE GRACE, MD
© 2
013 E
RD
MA
N C
OM
PA
NY
NOT FOR CONSTRUCTION
3/32" = 1'-0"
C:\
Re
vit P
roje
cts
\ad_
ha
vre
de
gra
ce
_m
d_
62
86
20
_jfo
rd.r
vt
9/1
2/2
01
7 2
:06
:41
PM
EXTERIOR
ELEVATIONS
BHEBERT Checker
A103
Document Release
No. Description Date
3 PROJECT ANALYSIS (CON) 06/05/15
4 PROJECT ANALYSIS (CON)ROUND TWO
07/31/15
8 SCOPE PRICING 05/15/17
9 DRAFT CON SUBMITTAL 06/08/17
11 CON SUBMITTAL 07/19/17
13 CON SUBMITTAL 09/12/17
SCALE: 3/32" = 1'-0"
EAST ELEVATION1
SCALE: 3/32" = 1'-0"
NORTH ELEVATION2
SCALE: 3/32" = 1'-0"
WEST ELEVATION3
SCALE: 3/32" = 1'-0"
SOUTH ELEVATION4
SCALE: 3/32" = 1'-0"
STACKING DIAGRAM5


50,799.66 SFGROSS BUILDING AREA
TRUE NORTH
75°
Drn: Chk:
Sheet Name
Scale:
Sheet Number
11 North Washington Street, Suite 300Rockville, Maryland 20850Phone: (301) 217-0826Fax: (301) 217-0751
PLA
N N
OR
TH
UNIVERSITY
OF
MARYLAND -
UPPER
CHESAPEAKE
HEALTH
MEDICAL
CAMPUS
Job 628620
HAVRE DE GRACE, MD
© 2
013 E
RD
MA
N C
OM
PA
NY
1/16" = 1'-0"
C:\
Re
vit P
roje
cts
\ad_
ha
vre
de
gra
ce
_m
d_
62
86
20
_jfo
rd.r
vt
7/1
9/2
01
7 4
:27
:47
PM
FIRST FLOOR
GROSS BUILDING
AREA
Author Checker
A100C
Document Release
No. Description Date
7 CON DRAFT DOCUMENTS 05/05/17
9 DRAFT CON SUBMITTAL 06/08/17
11 CON SUBMITTAL 07/19/17

15,996.34 SF
EMERGENCY
6,098.71 SF
OBSERV.
2,2
93.3
8 S
F
BH
ED
CR
ISIS
UN
IT
8,192.21 SF
IMAGING
1,973.17 SF
LAB
1,875.78 SF
PHARMACY
4,684.11 SF
ADMIN
4,203.25 SF
PUBLIC
660.90 SF
CIRCULATION
1,453.77 SF
CIRCULATION
211.88 SF
CIRCULATION
206.28 SF
CIRCULATION
1,360.25 SF
EXTERIOR WALL
168.00 SF
MECH
289.23 SF
MECH
72.00 SF
MECH124.06 SF
MECH
211.85 SF
MECH
78.00 SF
MECH
646.75 SF
ADMIN
TRUE NORTH
75°
Drn: Chk:
Sheet Name
Scale:
Sheet Number
11 North Washington Street, Suite 300Rockville, Maryland 20850Phone: (301) 217-0826Fax: (301) 217-0751
PLA
N N
OR
TH
UNIVERSITY
OF
MARYLAND -
UPPER
CHESAPEAKE
HEALTH
MEDICAL
CAMPUS
Job 628620
HAVRE DE GRACE, MD
© 2
013 E
RD
MA
N C
OM
PA
NY
1/16" = 1'-0"
C:\
Re
vit P
roje
cts
\ad_
ha
vre
de
gra
ce
_m
d_
62
86
20
_jfo
rd.r
vt
8/3
/201
7 1
0:1
4:5
5 A
M
FIRST FLOOR
DEPARTMENT
AREA PLAN
Author Checker
A100B
Document Release
No. Description Date
7 CON DRAFT DOCUMENTS 05/05/17
9 DRAFT CON SUBMITTAL 06/08/17
10 DRAFT CON SUBMITTAL 07/14/17
11 CON SUBMITTAL 07/19/17

15
15
14
14
13
13
12
12
11
11
FF
EE
DD
C.2C.2
GG
HH
JJ
16
16
10
10
8
8
7
7
5
5
3
3
2.1
2.1
2
2
1
1
BEHAVIORAL HEALTHFACILITY BELOW
0' 8' 16' 32' 64'
122.2 SFEXAM 2
122.2 SFEXAM 3
193.7 SFSECLUSION 1
179.5 SFCARE TEAM STATION
138.4 SFEXAM RM 1
138.4 SFEXAM RM 2
137.1 SFEXAM RM 4
138.4 SFEXAM RM 5
138.4 SFEXAM RM 6
137.1 SFEXAM RM 7
137.1 SFEXAM RM 3
144.0 SFAMB VEST
169.0 SFEMS/ LAW ENF
124.1 SFELEV
124.1 SFMECH
128.0 SFEXAM 4
100.0 SFB H ELEV 241.4 SF
STAIR
1,645.9 SFAMBULANCE CANOPY
60.1 SFPAT TLT
73.1 SFCLEAN WK
77.2 SFSOIL HOLD
181.7 SFPATIENT RM 1
65.1 SFHSKPG
427.3 SFCT
62.3 SFCT TLT
126.0 SFCT CNTRL
106.3 SFSOIL HOLD
106.3 SFCLEAN WK
108.0 SFTLT/SHR ISO
171.0 SFPAT ISO RM
479.7 SFCARE TEAM STATION
327.7 SFRESESITATION RM 19 142.1 SF
DECON
81.0 SFPAT ANTE RM
61.6 SFTLT/SHR ISO
204.0 SFPAT ISO RM 16
209.7 SFEQUIP ST
676.5 SFSTAFF LOUNGE
56.0 SFSTF TLT
57.5 SFSTF TLT
67.0 SFLKRS
G.1
H.2
H.1
L
K
E.1
F.1
D.1
C.3
C.1
C
B
A
6
6
9
9
4
4
59.2 SFULT TLT
251.0 SFGEN RAD
272.4 SFULT RM
151.7 SFOFFICE
108.0 SFSAFE_RM TLT/SHR
727.3 SFCARE TEAM STATION
36.4 SFNOURISH
208.0 SFRESP CARE WKRM
178.3 SFMEDS
62.6 SFNOURISHMENT
310.9 SFEXAM/SAFE ROOM 17
66.0 SFPAT TLT
STRETCHER STORAGE
269.2 SFMRI CONTROL
500.6 SFMRI
166.0 SFMRI EQUIP
141.8 SFEXAM RM 20
143.0 SFEXAM RM 21
52.7 SFMEDS
51.5 SFSEC. TLT86.1 SF
SEC. VEST
118.8 SF
FAMILYCONS
81.0 SFPAT ANTE RM
34.2 SFWHC ST
168.0 SFSHAFT
66.0 SFPAT TLT
CANOPYCANOPYBELOW
123.3 SFMEDS
54.0 SFDRESS
54.0 SFDRESS
178.7 SFGOWNED WTG
177.8 SFGOWNED WTG
100.9 SFTLT
51.8 SFPAT TLT
101.8 SFTLT
136.0 SFON CALL
134.8 SFON CALL
81.0 SFCLN UTIL
54.0 SFHKPG
514.8 SFADMINISTRATIVE SPACE
54.0 SFSTF TLT
54.0 SFSTF TLT
208.3 SFREHAB WORK
187.5 SFDIR/MGR
166.8 SFREADING RM
89.1 SFSOIL HOLD
216.0 SFCARDIAC ULT
180.0 SFVASCULAR ULT
55.2 SFTLT
248.3 SFEKG/ HOLTER RM
130.5 SFSTRESS TEST
78.0 SFEQUIP. PRO.
48.0 SFST/ SUP.
184.7 SFTECH WORK
20.4 SFMECH
POPULATION HEALTHADMINISTRATIVE SPACE
213.0 SFTECH WK
328.5 SFRESESITATION RM 18
1,991.47 SF
LABORATORY
1,882.65 SF
PHARMACY
4,235.49 SF
PUBLIC SPACE
OBSERVATION EMERGENCY DEPT.
IMAGING
BH
ED
CR
ISIS
UN
IT
EMERGENCY DEPT.
206.3 SF1 ELEVATOR
210.9 SFSTAIR
89.8 SFELECT
142.4 SFDATA
181.7 SFPATIENT RM 2
181.7 SFPATIENT RM 3
182.5 SFPATIENT RM 11
183.8 SFPATIENT RM 10
182.5 SFPATIENT RM 9
174.9 SFPATIENT RM 8
182.5 SFOFFICE
288.5 SFPAT ISOLATION RM 7
181.7 SFPATIENT RM 4
181.7 SFPATIENT RM 5
230.2 SFPATIENT RM 6
----
264.6 SFIT ROOM
156.0 SFWK ADMIN ASSIST
171.1 SFCLINICIAN LOUNGE
180.0 SFPROV DICT
175.7 SFBH CONS MGR
132.2 SFOFF NURSE MGR
108.0 SFOFF CONS PROV
108.0 SFOFF CONS PROV
108.0 SFOFF CONS PROV
168.0 SFBH CONS MGR
132.2 SFOFF NURSE MGR
132.2 SFOFF DIR NURSING
123.0 SFNURSE ADMIN
138.1 SFOFF MED DIR
129.1 SFOFF CASE MGR
96.0 SFCOPY/ WK AREA
329.5 SFSTF LOUNGE
54.0 SFSTF TLT
54.0 SFSTF TLT211.8 SF
MECH
52.0 SFTLT
138.8 SFEXAM RM 8
908.3 SFHOTEL OFFICES
78.0 SFSHAFT
51.8 SFTLT
51.8 SFTLT
52.0 SFTLT
51.8 SFTLT
52.0 SFTLT
111.3 SFSOIL WORK
183.8 SFCLEAN WORK
116.4 SFMED ROOM
185.1 SFCARE TEAM
112.1 SFCENTRAL BATH
113.6 SFNOURISHMENT
43.8 SFHSKPG
158.3 SFPAT ISO ANTE
80.5 SFISO TLT
155.3 SFEXAM RM 10
158.1 SFEXAM RM 11
152.6 SFEXAM RM 12
158.1 SFEXAM RM 13
158.7 SFEXAM RM 14
121.0 SFTRIAGE/ INTAKE
121.0 SFTRIAGE/ INTAKE
124.2 SFTRIAGE/ INTAKE
125.8 SFTRIAGE/ INTAKE
126.4 SFTRIAGE/ INTAKE
123.8 SFTRIAGE/ INTAKE
53.2 SFTLT
46.4 SFTLT 119.9 SF
QUIET RM 15
125.2 SFSECURITY
137.6 SFEXAM RM 9
143.8 SFEQUIP
428.8 SFRECEPTION/QUICK-LOOK
102.0 SFMEDS
102.0 SFSTOR EQUIP
230.9 SFPUB TLT
230.2 SFPUB TLT
196.5 SFSTAIR
3,766.1 SFWAIT/LOBBY
17.5 SFWH CHR
50.6 SFTLT
54.5 SFTLT
20.6 SFSTRETCH
17.7 SFWH CHR
8.7 SFCRASH
8.8 SFHW
8.8 SFHW
27.0 SFSTRETCH
22.3 SFWH CHR
9.2 SFCRASH
18.7 SFCRASH
12.0 SFHW
14.6 SFCRASH
10.2 SFHW
9.5 SFHW
411.7 SFTECH WORK
36.0 SFLKRS
36.0 SFLKRS
20.5 SFLKRS
27.3 SFCOPY/WORK
189.8 SFREHAB STORAGE
1,019.3 SFCORRIDOR
103.8 SFVEST
518.2 SFSIMULATION LAB
113.8 SFOFFICE
119.6 SFOFFICE
114.3 SFOFFICE
137.1 SFOFFICE
FREESTANDINGMEDICALFACILITYENTRANCE
FREESTANDINGMEDICALFACILITYAMBULANCEENTRANCE
FREESTANDINGMEDICALFACILITYSTAFFENTRANCE
51.3 SFPAT TLT
51.5 SFPAT TLT
TRUE NORTH
75°
Drn: Chk:
Sheet Name
Scale:
Sheet Number
11 North Washington Street, Suite 300Rockville, Maryland 20850Phone: (301) 217-0826Fax: (301) 217-0751
PLA
N N
OR
TH
UNIVERSITY
OF
MARYLAND -
UPPER
CHESAPEAKE
HEALTH
MEDICAL
CAMPUS
Job 628620
HAVRE DE GRACE, MD
© 2
013 E
RD
MA
N C
OM
PA
NY
NOT FOR CONSTRUCTION
1/16" = 1'-0"
C:\
Re
vit P
roje
cts
\ad_
ha
vre
de
gra
ce
_m
d_
62
86
20
_jfo
rd.r
vt
9/1
2/2
01
7 2
:10
:02
PM
FIRST FLOOR
PLAN
BHEBERT Checker
A100A
Document Release
No. Description Date
1 PROGRESS PLAN 05/15/15
2 PROGRESS PLAN 05/26/15
3 PROJECT ANALYSIS (CON) 06/05/15
4 PROJECT ANALYSIS (CON)ROUND TWO
07/31/15
5 PLAN REVIEW 7/22/16
6 PLAN TO DATE 12/30/16
8 SCOPE PRICING 05/15/17
9 DRAFT CON SUBMITTAL 06/08/17
11 CON SUBMITTAL 07/19/17
13 CON SUBMITTAL 09/12/17
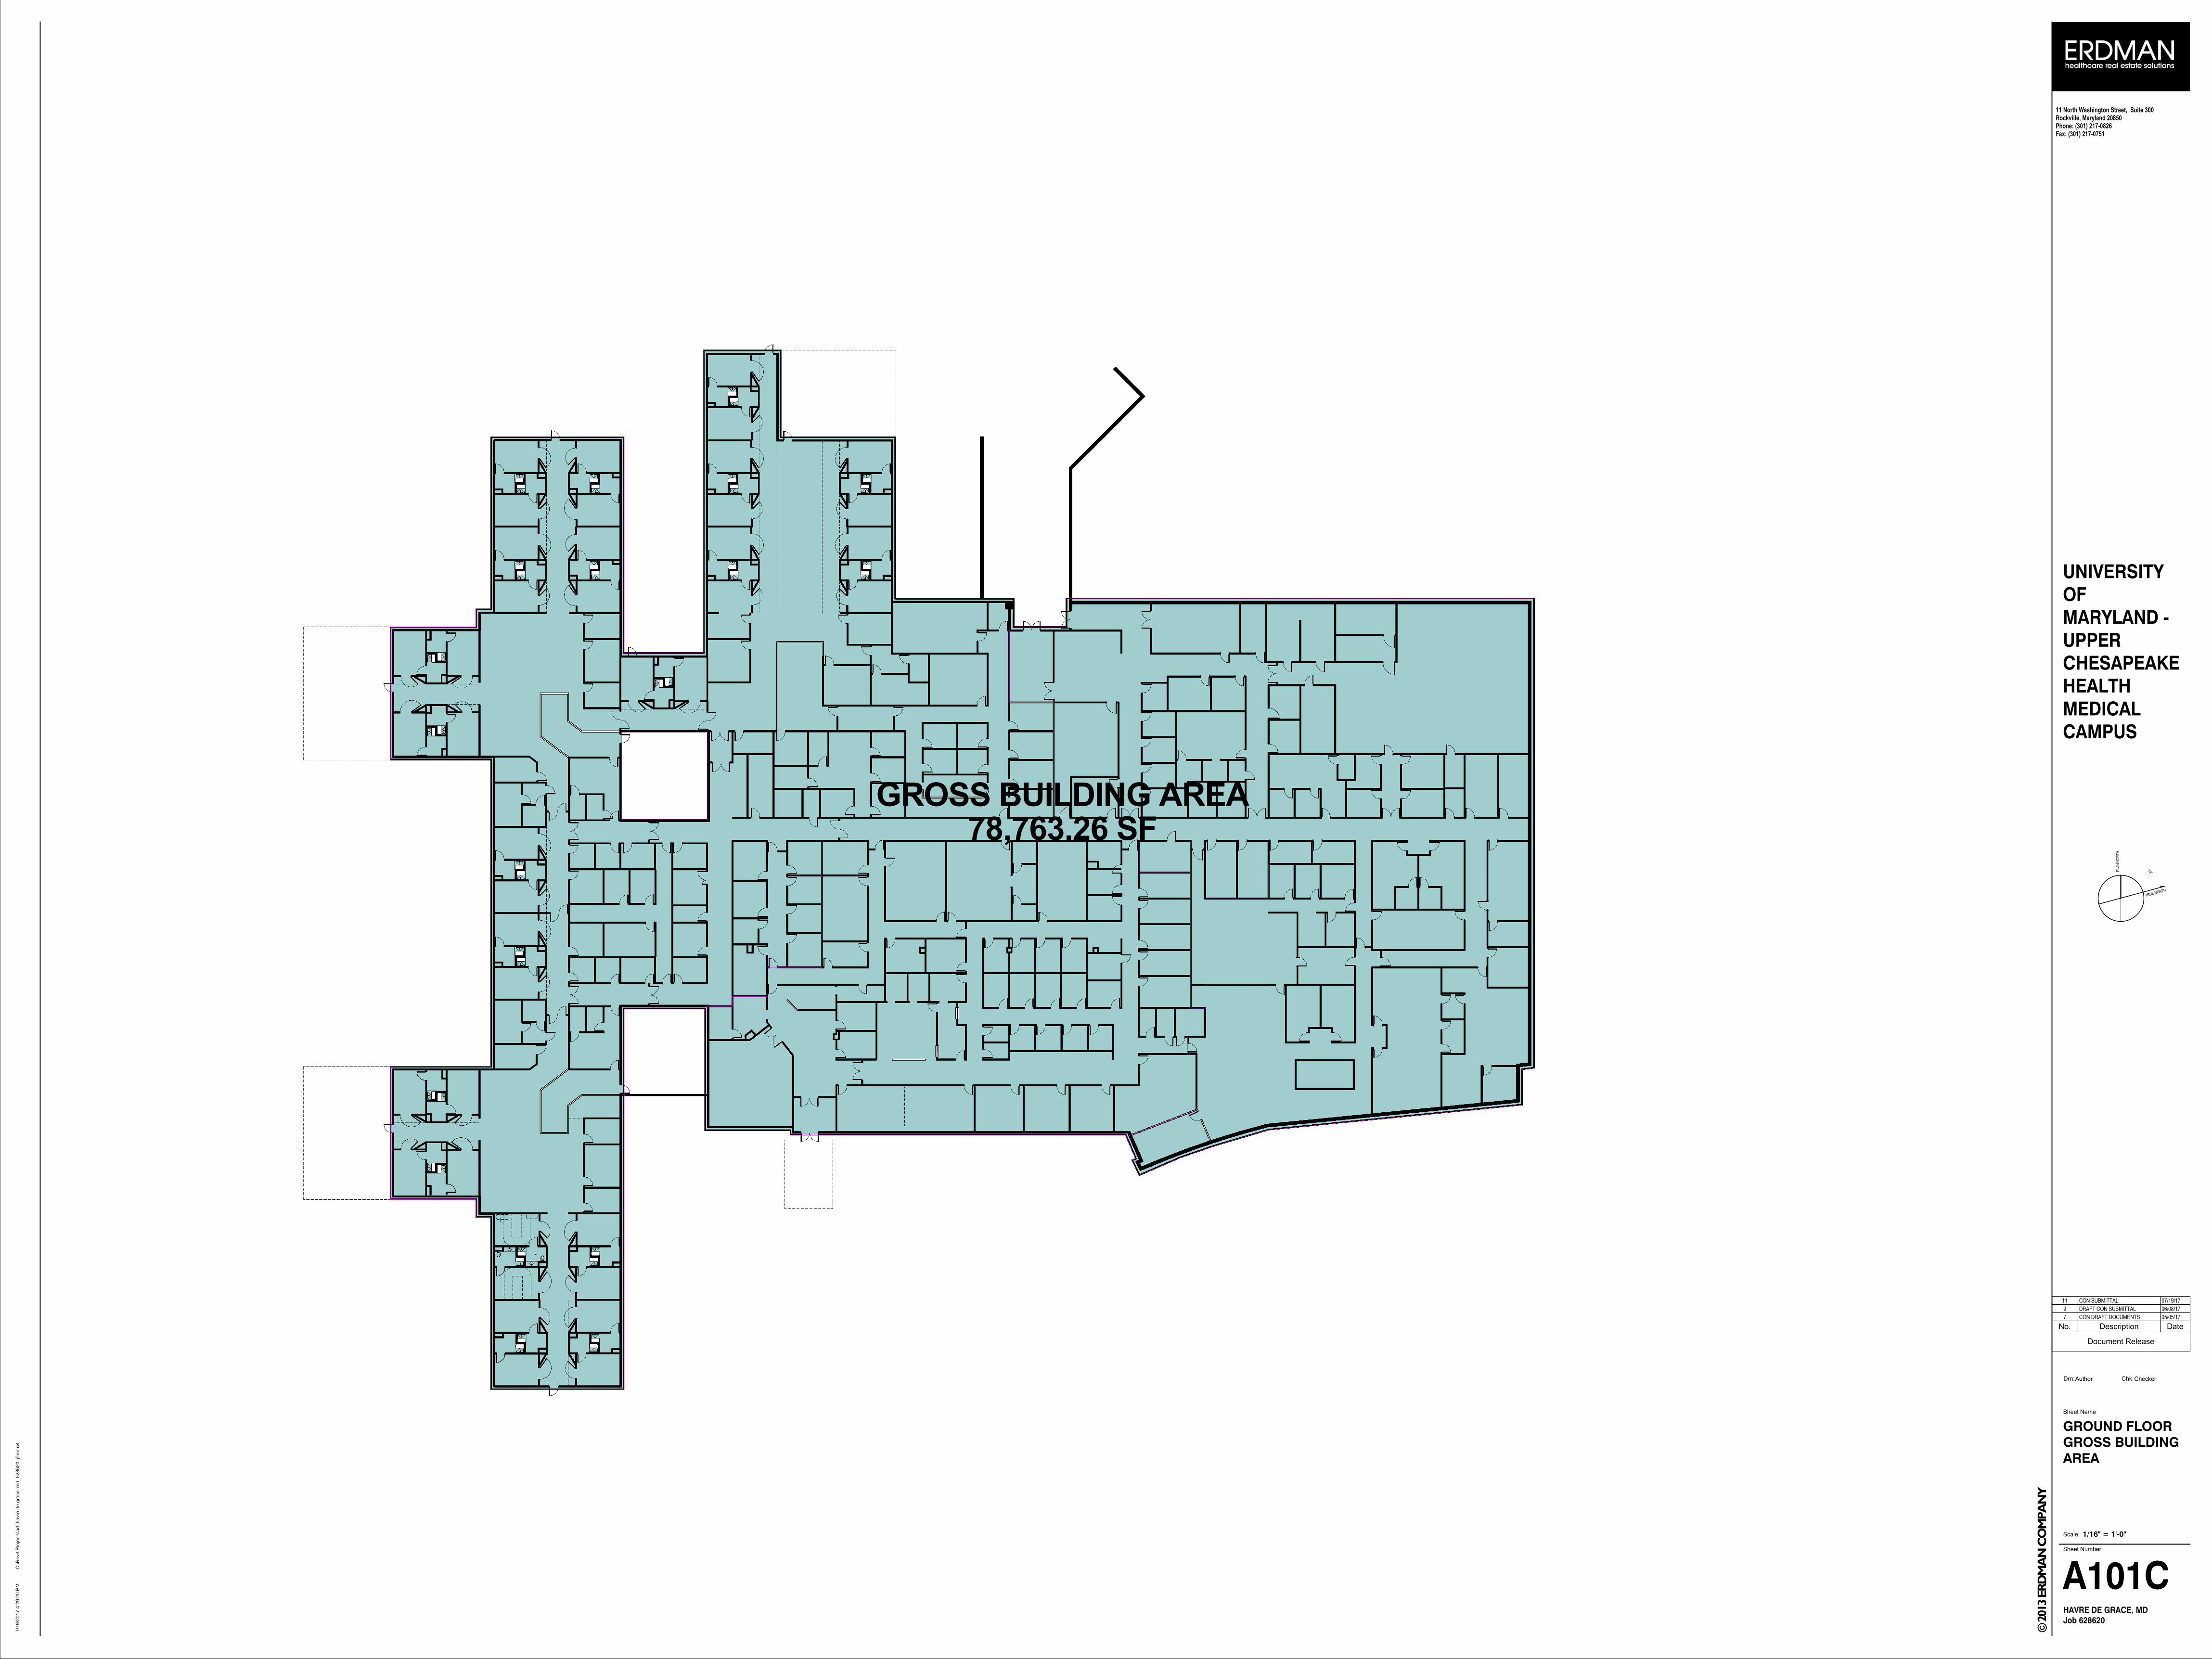
78,763.26 SFGROSS BUILDING AREA
TRUE NORTH
75°
Drn: Chk:
Sheet Name
Scale:
Sheet Number
11 North Washington Street, Suite 300Rockville, Maryland 20850Phone: (301) 217-0826Fax: (301) 217-0751
PLA
N N
OR
TH
UNIVERSITY
OF
MARYLAND -
UPPER
CHESAPEAKE
HEALTH
MEDICAL
CAMPUS
Job 628620
HAVRE DE GRACE, MD
© 2
013 E
RD
MA
N C
OM
PA
NY
1/16" = 1'-0"
C:\
Re
vit P
roje
cts
\ad_
ha
vre
de
gra
ce
_m
d_
62
86
20
_jfo
rd.r
vt
7/1
9/2
01
7 4
:29
:20
PM
GROUND FLOOR
GROSS BUILDING
AREA
Author Checker
A101C
Document Release
No. Description Date
7 CON DRAFT DOCUMENTS 05/05/17
9 DRAFT CON SUBMITTAL 06/08/17
11 CON SUBMITTAL 07/19/17
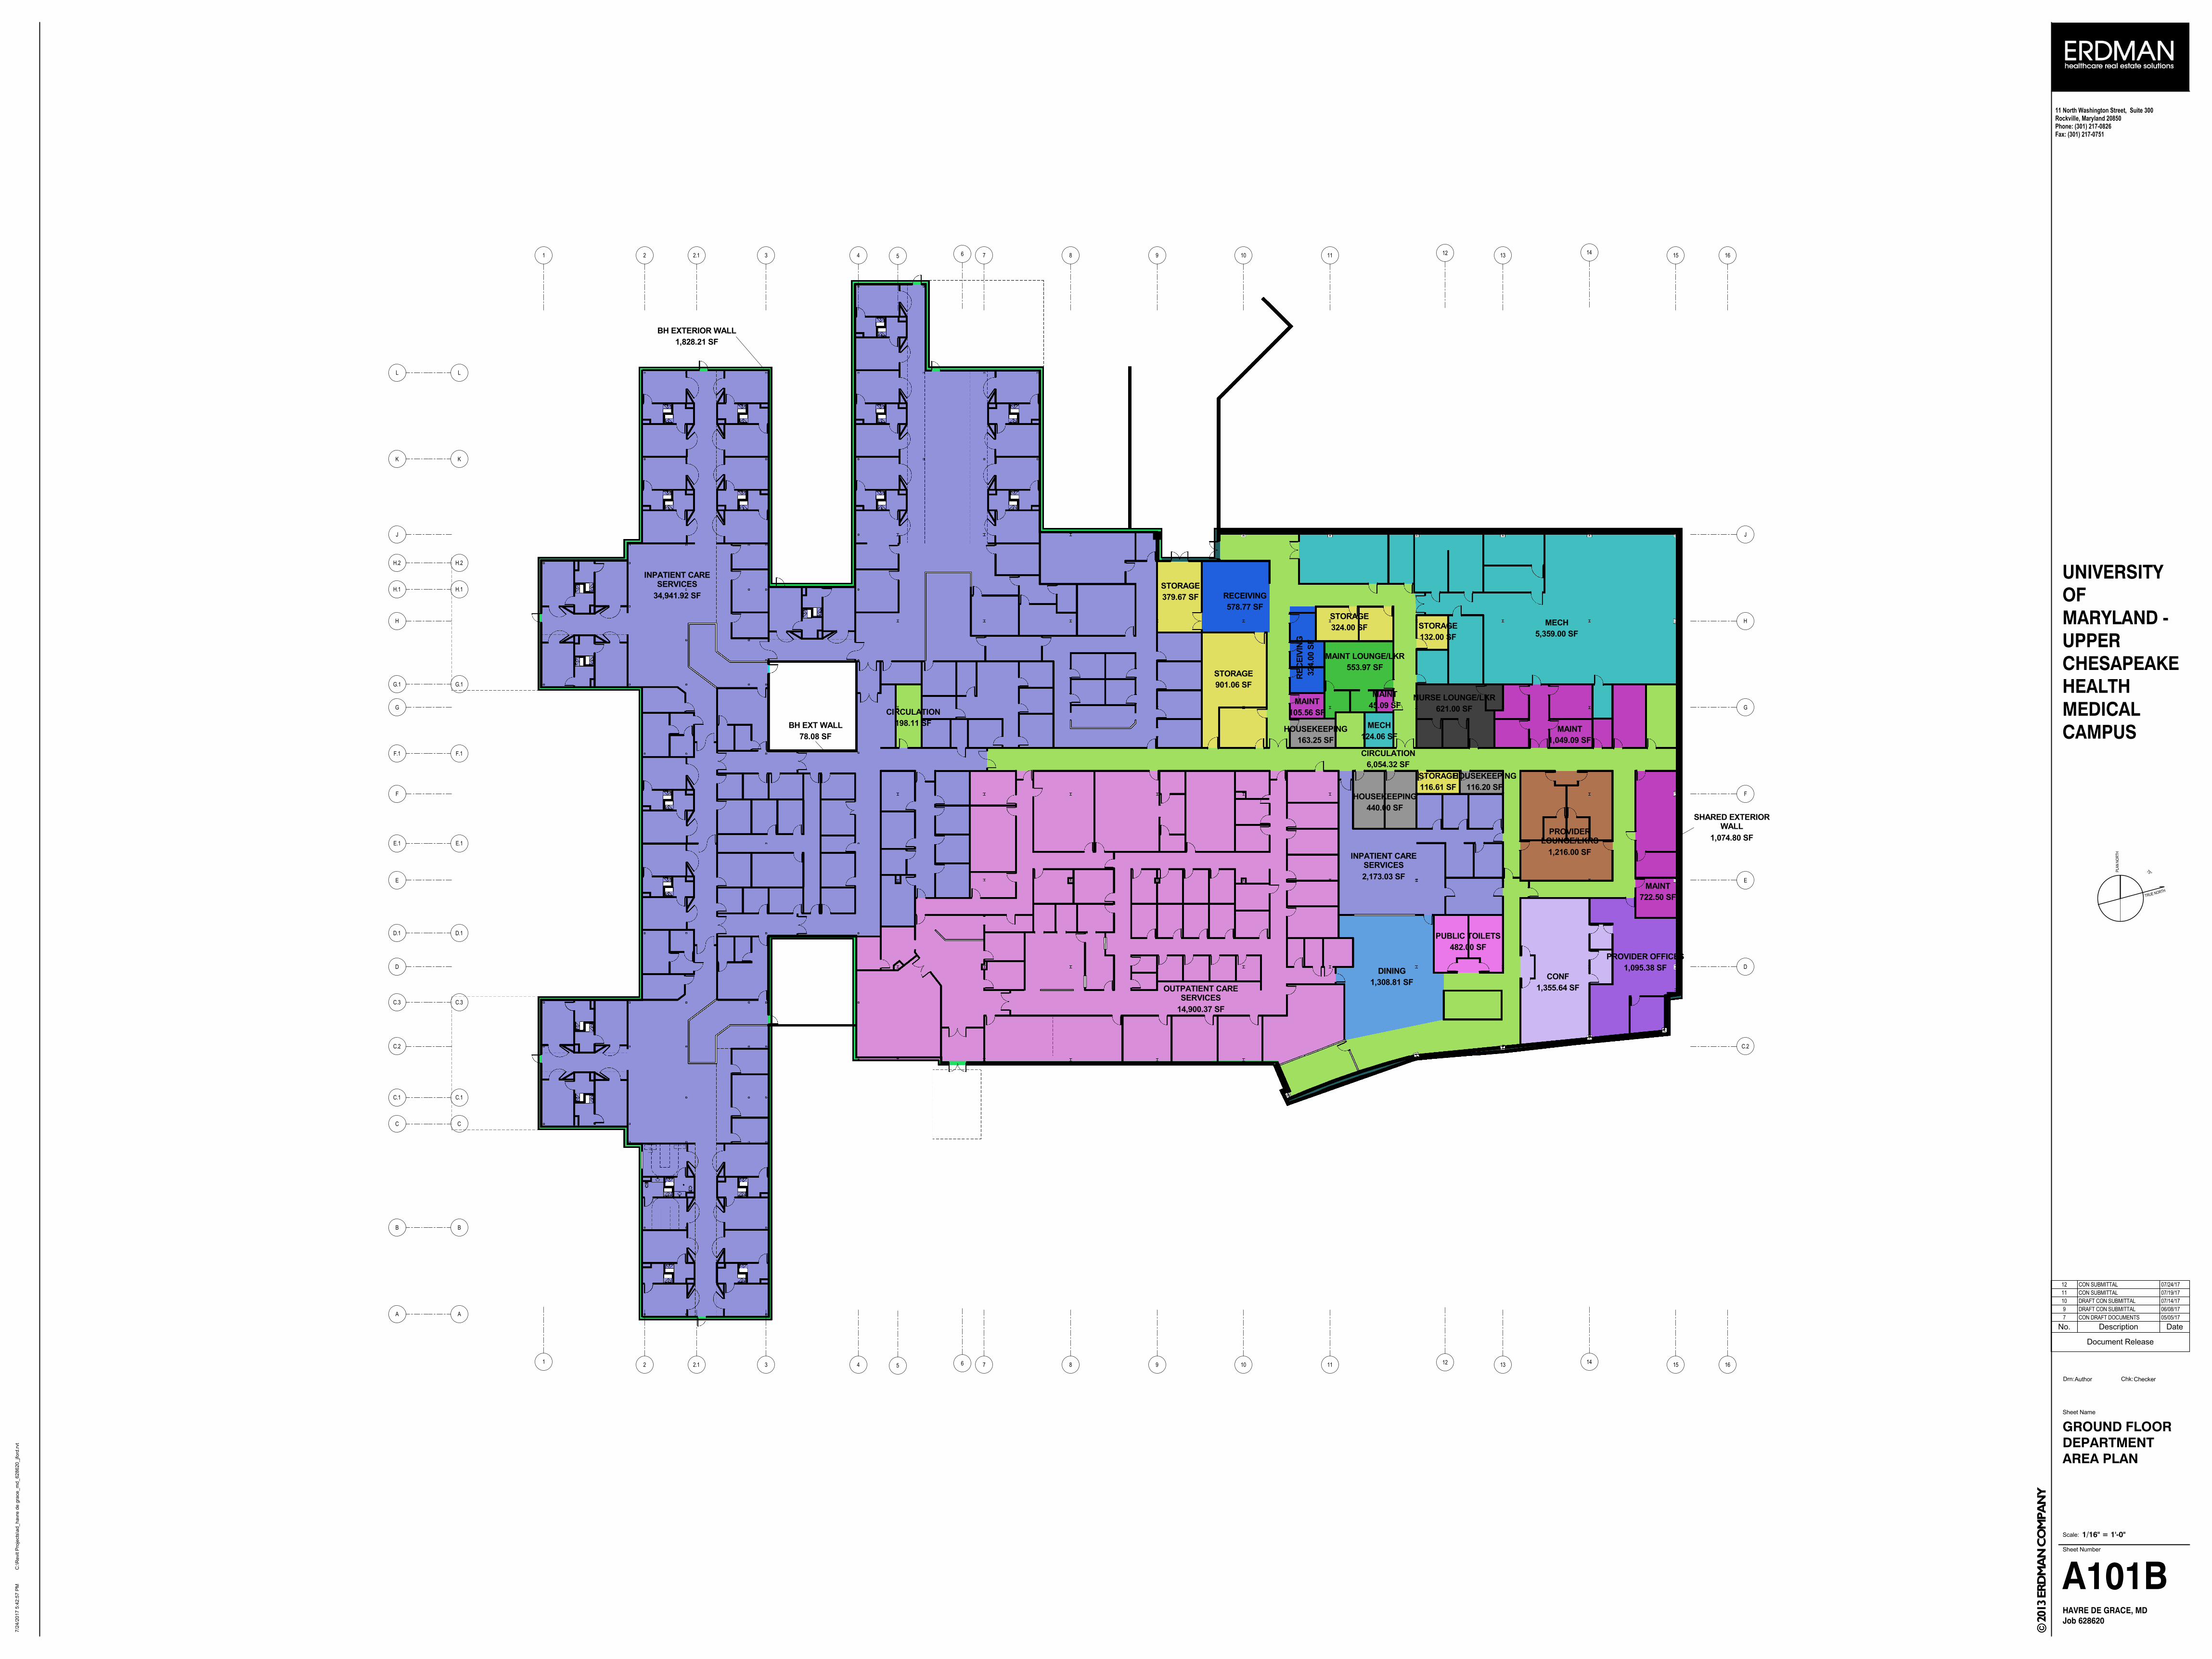
15
15
14
14
13
13
12
12
11
11
FF
EE
DD
C.2C.2
GG
HH
JJ
16
16
10
10
8
8
7
7
5
5
3
3
2.1
2.1
2
2
1
1
G.1G.1
H.2H.2
H.1H.1
LL
KK
E.1E.1
F.1F.1
D.1D.1
C.3C.3
C.1C.1
CC
BB
AA
6
6
9
9
4
4
5,359.00 SF
MECH
1,049.09 SF
MAINT
553.97 SF
MAINT LOUNGE/LKR
116.20 SF
HOUSEKEEPING
440.00 SF
HOUSEKEEPING
163.25 SF
HOUSEKEEPING
45.09 SF
MAINT
124.06 SF
MECH
1,216.00 SF
PROVIDER
LOUNGE/LKRS
578.77 SF
RECEIVING
901.06 SF
STORAGE
379.67 SF
STORAGE
105.56 SF
MAINT
324.0
0 S
F
RE
CE
IVIN
G
324.00 SF
STORAGE
132.00 SF
STORAGE
722.50 SF
MAINT
1,095.38 SF
PROVIDER OFFICES
621.00 SF
NURSE LOUNGE/LKR
116.61 SF
STORAGE
1,308.81 SF
DINING
482.00 SF
PUBLIC TOILETS
1,355.64 SF
CONF
6,054.32 SF
CIRCULATION
198.11 SF
CIRCULATION
14,900.37 SF
OUTPATIENT CARE
SERVICES
1,828.21 SF
BH EXTERIOR WALL
34,941.92 SF
INPATIENT CARE
SERVICES
2,173.03 SF
INPATIENT CARE
SERVICES
1,074.80 SF
SHARED EXTERIOR
WALL
78.08 SF
BH EXT WALL
TRUE NORTH
75°
Drn: Chk:
Sheet Name
Scale:
Sheet Number
11 North Washington Street, Suite 300Rockville, Maryland 20850Phone: (301) 217-0826Fax: (301) 217-0751
PLA
N N
OR
TH
UNIVERSITY
OF
MARYLAND -
UPPER
CHESAPEAKE
HEALTH
MEDICAL
CAMPUS
Job 628620
HAVRE DE GRACE, MD
© 2
013 E
RD
MA
N C
OM
PA
NY
1/16" = 1'-0"
C:\
Re
vit P
roje
cts
\ad_
ha
vre
de
gra
ce
_m
d_
62
86
20
_jfo
rd.r
vt
7/2
4/2
01
7 5
:42
:57
PM
GROUND FLOOR
DEPARTMENT
AREA PLAN
Author Checker
A101B
Document Release
No. Description Date
7 CON DRAFT DOCUMENTS 05/05/17
9 DRAFT CON SUBMITTAL 06/08/17
10 DRAFT CON SUBMITTAL 07/14/17
11 CON SUBMITTAL 07/19/17
12 CON SUBMITTAL 07/24/17
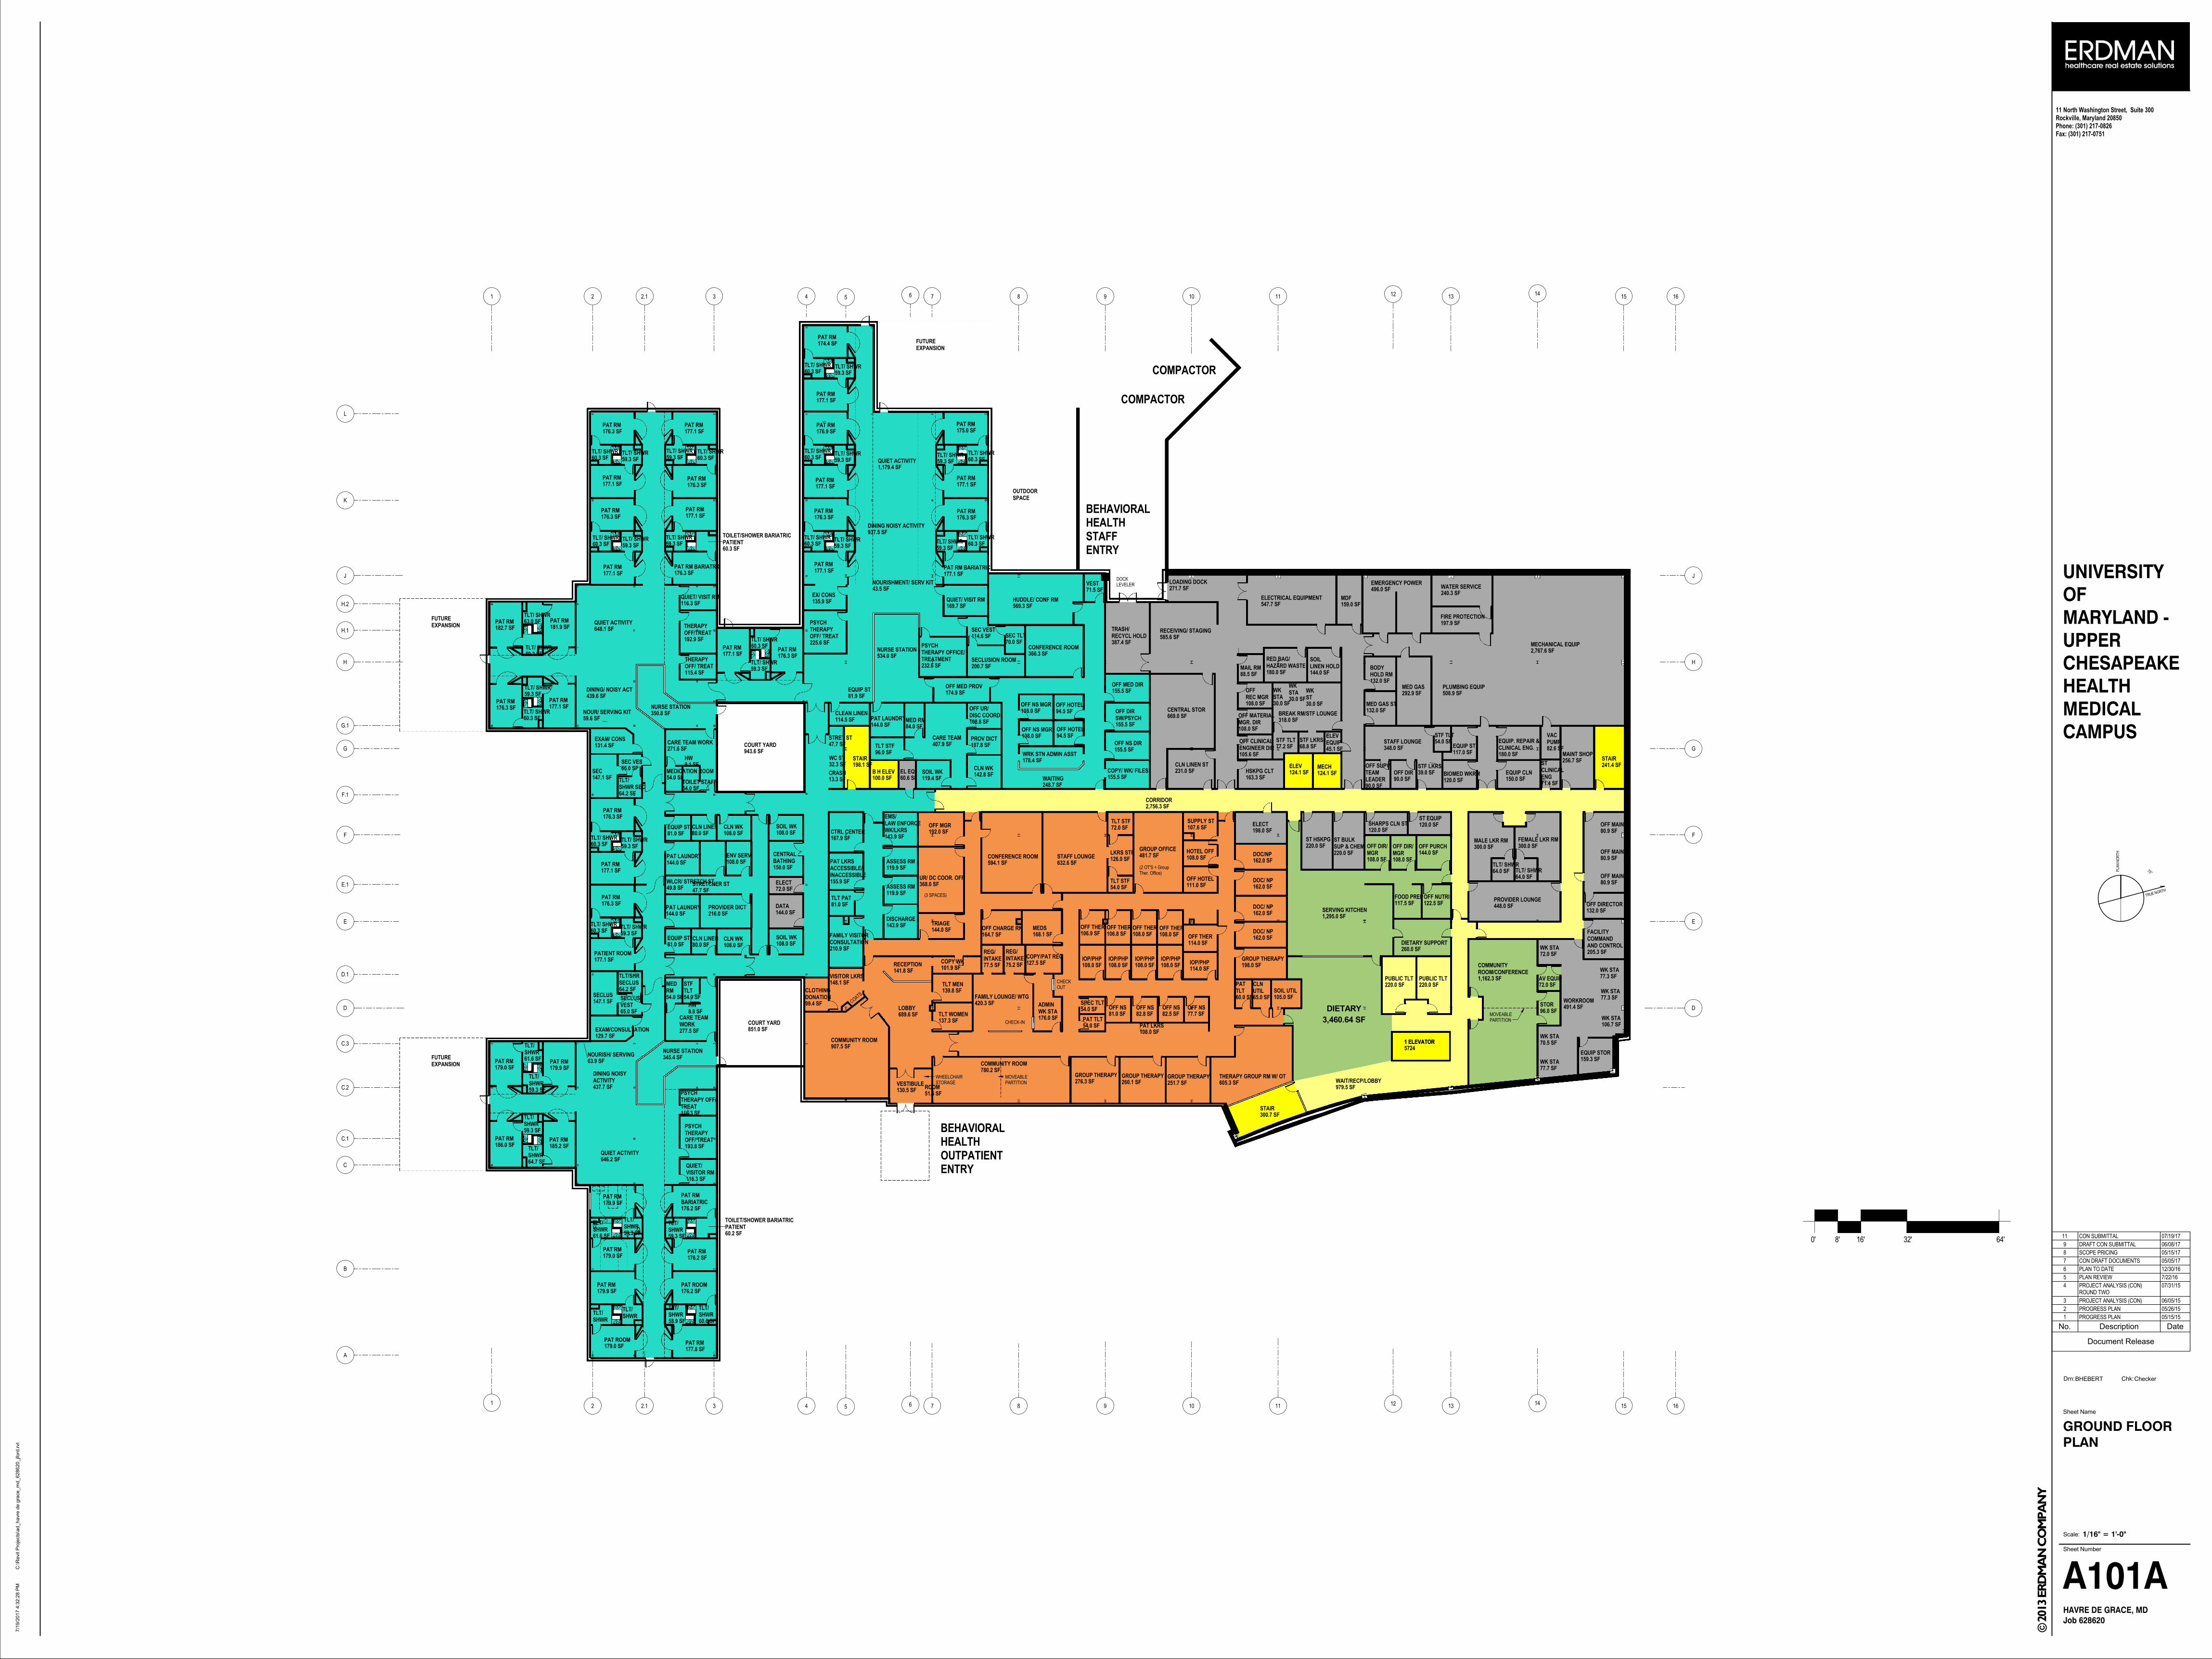
15
15
14
14
13
13
12
12
11
11
FF
EE
DD
C.2
GG
HH
JJ
16
16
10
10
8
8
7
7
5
5
3
3
2.1
2.1
2
2
1
1
0' 8' 16' 32' 64'
2,767.6 SFMECHANICAL EQUIP
547.7 SFELECTRICAL EQUIPMENT
496.0 SFEMERGENCY POWER
508.9 SFPLUMBING EQUIP
292.9 SFMED GAS
82.6 SF
VACPUMP
240.3 SFWATER SERVICE
260.0 SFDIETARY SUPPORT
96.0 SFSTOR
241.4 SFSTAIR
124.1 SFELEV
124.1 SFMECH
100.0 SFB H ELEV
177.1 SFPAT RM
59.3 SFTLT/ SHWR
60.3 SFTLT/ SHWR
176.3 SFPAT RM
177.1 SFPAT RM
59.3 SFTLT/ SHWR
176.3 SFPAT RM
60.3 SFTLT/ SHWR
59.3 SFTLT/ SHWR
177.1 SFPAT RM
182.7 SFPAT RM 63.0 SF
TLT/ SHWR
59.3 SFTLT/ SHWR
181.9 SFPAT RM
176.3 SFPAT RM
59.3 SFTLT/ SHWR
60.3 SFTLT/ SHWR
177.1 SFPAT RM
147.1 SFSEC
65.0 SFSEC VES
64.2 SF
TLT/SHWR SEC
176.3 SFPAT RM
60.3 SFTLT/ SHWR
59.3 SFTLT/ SHWR
177.1 SFPAT RM
271.6 SFCARE TEAM WORK
943.6 SFCOURT YARD
176.3 SFPAT RM
60.3 SFTLT/ SHWR
59.3 SFTLT/ SHWR
177.1 SFPATIENT ROOM
147.1 SFSECLUS
64.2 SF
TLT/SHRSECLUS
65.0 SF
SECLUSVEST
277.5 SF
CARE TEAMWORK
179.0 SFPAT RM 61.6 SF
TLT/SHWR
59.3 SF
TLT/SHWR
179.9 SFPAT RM
186.0 SFPAT RM
59.3 SF
TLT/SHWR
64.7 SF
TLT/SHWR
185.2 SFPAT RM
179.9 SFPAT RM
179.0 SFPAT RM
61.6 SF
TLT/SHWR
59.3 SF
TLT/SHWR
59.3 SF
TLT/SHWR
176.2 SFPAT RM
177.8 SFPAT RM
58.9 SF
TLT/SHWR
60.6 SF
TLT/SHWR
851.0 SFCOURT YARD
130.5 SFVESTIBULE
907.5 SFCOMMUNITY ROOM
780.2 SFCOMMUNITY ROOM
420.3 SFFAMILY LOUNGE/ WTG
139.8 SFTLT MEN
137.3 SFTLT WOMEN
141.8 SFRECEPTION
148.1 SFVISITOR LKRS
689.6 SFLOBBY
198.0 SFGROUP THERAPY
276.3 SFGROUP THERAPY
260.1 SFGROUP THERAPY
101.9 SFCOPY WK
594.1 SFCONFERENCE ROOM
176.0 SF
ADMINWK STA
192.0 SFOFF MGR
632.6 SFSTAFF LOUNGE
669.0 SFCENTRAL STOR 132.0 SF
MED GAS ST
271.7 SFLOADING DOCK
585.6 SFRECEIVING/ STAGING
937.5 SFDINING NOISY ACTIVITY
63.9 SFNOURISH/ SERVING
439.6 SFDINING/ NOISY ACT
350.8 SFNURSE STATION
648.1 SFQUIET ACTIVITY
437.7 SF
DINING NOISYACTIVITY
646.2 SFQUIET ACTIVITY
345.4 SFNURSE STATION
143.9 SF
EMS/LAW ENFORCEWK/LKRS
119.9 SFASSESS RM
119.9 SFASSESS RM
81.0 SFTLT PAT
167.9 SFCTRL CENTER
143.9 SFDISCHARGE
155.9 SF
PAT LKRSACCESSIBLE/INACCESSIBLE
177.1 SFPAT RM
176.3 SFPAT RM
176.9 SFPAT RM
177.1 SFPAT RM
176.3 SFPAT RM
177.1 SFPAT RM
175.0 SFPAT RM
177.1 SFPAT RM
176.3 SFPAT RM
177.1 SFPAT RM BARIATRIC
59.3 SFTLT/ SHWR 60.3 SF
TLT/ SHWR
59.3 SFTLT/ SHWR
60.3 SFTLT/ SHWR
60.3 SFTLT/ SHWR
60.3 SFTLT/ SHWR
59.3 SFTLT/ SHWR
59.3 SFTLT/ SHWR
60.3 SFTLT/ SHWR
59.3 SFTLT/ SHWR
144.0 SFDATA
144.0 SFPAT LAUNDRY
144.0 SFPAT LAUNDRY
180.0 SF
RED BAG/HAZARD WASTE
60.6 SFEL EQ
144.0 SF
SOILLINEN HOLD
163.3 SFHSKPG CLT
366.3 SFCONFERENCE ROOM
54.0 SFTLT STF
72.0 SFTLT STF
126.0 SFLKRS STF
1,162.3 SF
COMMUNITYROOM/CONFERENCE
605.3 SFTHERAPY GROUP RM W/ OT
54.0 SFPAT TLT
54.0 SFSPEC TLT
108.0 SFPAT LKRS
54.0 SF
MEDRM
150.0 SF
CENTRALBATHING
108.0 SFCLN WK
108.0 SFSOIL WK
80.0 SFCLN LINEN
81.0 SFEQUIP ST
80.0 SFCLN LINEN
81.0 SFEQUIP ST
108.0 SFCLN WK
108.0 SFSOIL WK
54.0 SFMEDICATION ROOM
108.8 SF
OFF UR/DISC COORD
216.0 SFPROVIDER DICT
108.0 SFENV SERV
49.8 SFWLCR/ STRETCH ST
176.2 SF
PAT RMBARIATRIC
60.2 SF
TOILET/SHOWER BARIATRICPATIENT
193.8 SF
PSYCHTHERAPYOFF/ TREAT
116.3 SF
PSYCHTHERAPY OFF/TREAT
129.7 SFEXAM/CONSULTATION
116.3 SF
QUIET/VISITOR RM
116.3 SFQUIET/ VISIT RM
59.6 SFNOUR/ SERVING KIT
115.4 SF
THERAPYOFF/ TREAT
192.9 SF
THERAPYOFF/TREAT
131.4 SFEXAM/ CONS
135.9 SFEX/ CONS
225.6 SF
PSYCHTHERAPYOFF/ TREAT
169.7 SFQUIET/ VISIT RM
43.5 SFNOURISHMENT/ SERV KIT
84.0 SFMED RM
119.4 SFSOIL WK 142.8 SF
CLN WK
96.0 SFTLT STF
54.0 SFTOILET STAFF
54.0 SF
STFTLT
176.3 SFPAT RM BARIATRIC
60.3 SF
TOILET/SHOWER BARIATRICPATIENT
114.6 SFSEC VEST
70.0 SFSEC TLT
200.7 SFSECLUSION ROOM
569.3 SFHUDDLE/ CONF RM
G.1
H.2
H.1
L
K
E.1
F.1
D.1
C.3
C.1
C
B
A
6
6
9
9
4
4
2,756.3 SFCORRIDOR
159.3 SFEQUIP STOR
491.4 SFWORKROOM
220.0 SFST HSKPG
120.0 SFST EQUIP
120.0 SFSHARPS CLN ST
39.0 SFSTF LKRS
54.0 SFSTF TLT
348.0 SFSTAFF LOUNGE
90.0 SFOFF DIR
90.0 SF
OFF SUPV/TEAMLEADER
132.0 SF
BODYHOLD RM
MOVEABLEPARTITION
80.9 SFOFF MAINT
80.9 SFOFF MAINT
80.9 SFOFF MAINT
132.0 SFOFF DIRECTOR
205.3 SF
FACILITYCOMMANDAND CONTROL
180.0 SF
EQUIP. REPAIR &CLINICAL ENG.
120.0 SFBIOMED WKRM
71.4 SF
STCLINICALENG150.0 SF
EQUIP CLN
117.0 SFEQUIP ST
220.0 SF
ST BULKSUP & CHEM
COMPACTOR
88.5 SFMAIL RM
COMPACTOR
72.0 SFAV EQUIP
1,295.0 SFSERVING KITCHEN
256.7 SFMAINT SHOP
DOCKLEVELER
72.0 SFELECT
198.0 SFELECT
MOVEABLEPARTITION
108.0 SF
OFF DIR/MGR
108.0 SF
OFF DIR/MGR 144.0 SF
OFF PURCH
122.5 SFOFF NUTRI
164.7 SFOFF CHARGE RN
82.8 SFOFF NS
81.0 SFOFF NS
111.0 SFOFF HOTEL
106.9 SFOFF THER
106.8 SFOFF THER
108.0 SFOFF THER
108.0 SFOFF THER
114.0 SFOFF THER
82.5 SFOFF NS
CHECK-IN
CHECKOUT
COATS
77.5 SF
REG/INTAKE
75.2 SF
REG/INTAKE
127.5 SFCOPY/PAT REC
368.0 SFUR/ DC COOR. OFF
(3 SPACES)
108.0 SFHOTEL OFF
481.7 SFGROUP OFFICE
(2 OT'S + GroupTher. Office)
162.0 SFDOC/NP
108.0 SFIOP/PHP
114.0 SFIOP/PHP108.0 SF
IOP/PHP108.0 SFIOP/PHP
108.0 SFIOP/PHP
155.5 SFCOPY/ WK/ FILES
178.4 SFWRK STN ADMIN ASST
108.0 SFOFF NS MGR
108.0 SFOFF NS MGR
94.5 SFOFF HOTEL
94.5 SFOFF HOTEL
168.1 SFMEDS
60.0 SF
PATTLT
77.7 SFOFF NS
65.0 SF
CLNUTIL
105.0 SFSOIL UTIL
162.0 SFDOC/ NP
162.0 SFDOC/ NP
162.0 SFDOC/ NP
179.9 SFPAT RM
177.1 SFPAT RM
60.3 SFTLT/ SHWR
59.3 SFTLT/ SHWR
176.3 SFPAT RM
BEHAVIORALHEALTHSTAFFENTRY
99.4 SF
CLOTHINGDONATION
107.6 SFSUPPLY ST
197.9 SFFIRE PROTECTION
77.2 SFSTF TLT
68.8 SFSTF LKRS
318.0 SFBREAK RM/STF LOUNGE
30.0 SF
WKSTA 30.0 SF
WKSTA
30.0 SF
WKST
114.5 SFCLEAN LINEN
107.8 SFPROV DICT
159.0 SFMDF
174.9 SFOFF MED PROV
155.5 SFOFF NS DIR
155.5 SF
OFF DIRSW/PSYCH
155.5 SFOFF MED DIR
387.4 SF
TRASH/RECYCL HOLD
45.1 SF
ELEVEQUIP
231.0 SFCLN LINEN ST
108.0 SF
OFFREC MGR
108.0 SF
OFF MATERIALMGR. DIR
105.6 SF
OFF CLINICALENGINEER DIR
71.5 SFVEST
70.5 SFWK STA
77.3 SFWK STA
77.7 SFWK STA
72.0 SFWK STA
106.7 SFWK STA
77.3 SFWK STA
300.0 SFMALE LKR RM
300.0 SFFEMALE LKR RM
64.0 SFTLT/ SHWR64.0 SF
TLT/ SHWR
407.9 SFCARE TEAM
144.0 SFPAT LAUNDRY
177.1 SFPAT RM
60.3 SFTLT/ SHWR
59.3 SFTLT/ SHWR
174.4 SFPAT RM
534.0 SFNURSE STATION
448.0 SFPROVIDER LOUNGE
248.7 SFWAITING
232.6 SF
PSYCHTHERAPY OFFICE/TREATMENT
3,460.64 SF
DIETARY
251.7 SFGROUP THERAPYWHEELCHAIR
STORAGE
1,179.4 SFQUIET ACTIVITY
47.7 SFSTRET ST
32.3 SFWC ST
210.9 SF
FAMILY VISITORCONSULTATION
117.5 SFFOOD PREP
220.0 SFPUBLIC TLT
220.0 SFPUBLIC TLT
TLT/SHWR
TLT/SHWR
51.6 SFROOM
1 ELEVATOR57241 ELEVATOR
300.7 SFSTAIR
47.7 SFSTRETCHER ST
81.9 SFEQUIP ST
13.3 SFCRASH
9.1 SFHW
8.8 SFHW
198.1 SFSTAIR
979.5 SFWAIT/RECP/LOBBY
FUTUREEXPANSION
FUTUREEXPANSION
FUTUREEXPANSION
BEHAVIORALHEALTHOUTPATIENTENTRY
144.0 SFTRIAGE
OUTDOORSPACE
176.2 SFPAT ROOM
179.0 SFPAT ROOM
TRUE NORTH
75°
Drn: Chk:
Sheet Name
Scale:
Sheet Number
11 North Washington Street, Suite 300Rockville, Maryland 20850Phone: (301) 217-0826Fax: (301) 217-0751
PLA
N N
OR
TH
UNIVERSITY
OF
MARYLAND -
UPPER
CHESAPEAKE
HEALTH
MEDICAL
CAMPUS
Job 628620
HAVRE DE GRACE, MD
© 2
013 E
RD
MA
N C
OM
PA
NY
1/16" = 1'-0"
C:\
Re
vit P
roje
cts
\ad_
ha
vre
de
gra
ce
_m
d_
62
86
20
_jfo
rd.r
vt
7/1
9/2
01
7 4
:32
:28
PM
GROUND FLOOR
PLAN
BHEBERT Checker
A101A
Document Release
No. Description Date
1 PROGRESS PLAN 05/15/15
2 PROGRESS PLAN 05/26/15
3 PROJECT ANALYSIS (CON) 06/05/15
4 PROJECT ANALYSIS (CON)ROUND TWO
07/31/15
5 PLAN REVIEW 7/22/16
6 PLAN TO DATE 12/30/16
7 CON DRAFT DOCUMENTS 05/05/17
8 SCOPE PRICING 05/15/17
9 DRAFT CON SUBMITTAL 06/08/17
11 CON SUBMITTAL 07/19/17

EXHIBIT 6
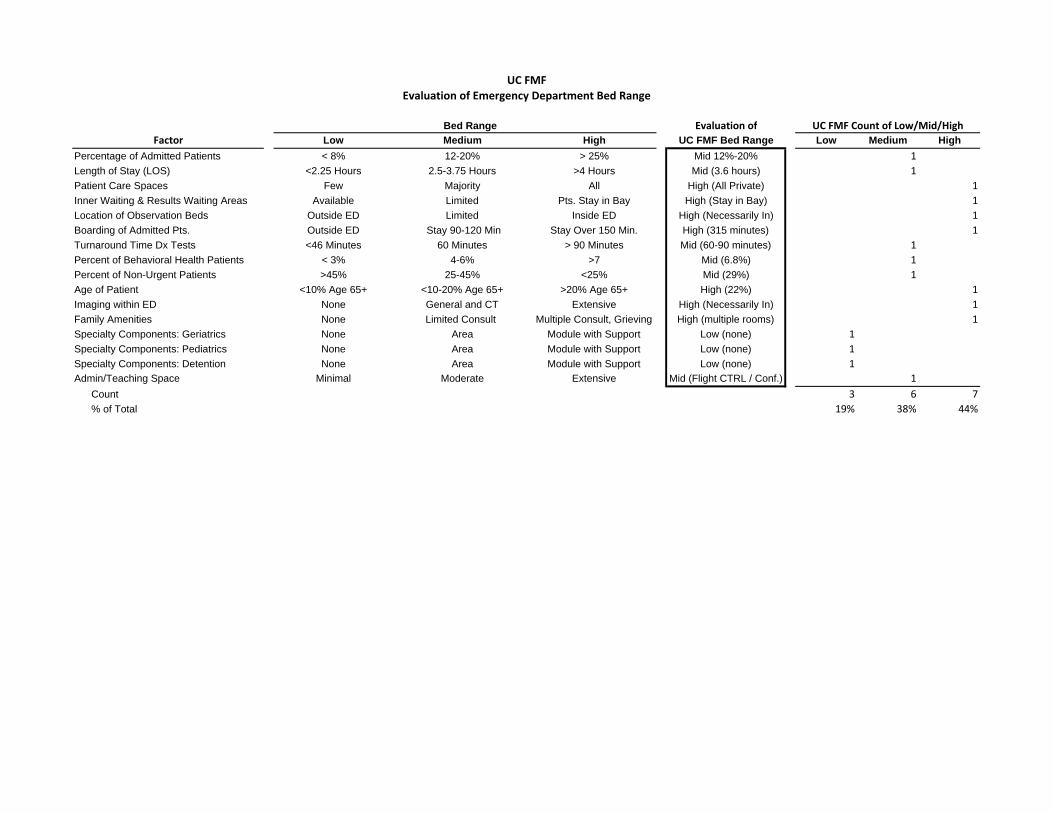
UC FMFEvaluation of Emergency Department Bed Range
Bed Range Evaluation of UC FMF Count of Low/Mid/HighFactor Low Medium High UC FMF Bed Range Low Medium High
Percentage of Admitted Patients < 8% 12-20% > 25% Mid 12%-20% 1Length of Stay (LOS) <2.25 Hours 2.5-3.75 Hours >4 Hours Mid (3.6 hours) 1Patient Care Spaces Few Majority All High (All Private) 1Inner Waiting & Results Waiting Areas Available Limited Pts. Stay in Bay High (Stay in Bay) 1Location of Observation Beds Outside ED Limited Inside ED High (Necessarily In) 1Boarding of Admitted Pts. Outside ED Stay 90-120 Min Stay Over 150 Min. High (315 minutes) 1Turnaround Time Dx Tests <46 Minutes 60 Minutes > 90 Minutes Mid (60-90 minutes) 1Percent of Behavioral Health Patients < 3% 4-6% >7 Mid (6.8%) 1Percent of Non-Urgent Patients >45% 25-45% <25% Mid (29%) 1Age of Patient <10% Age 65+ <10-20% Age 65+ >20% Age 65+ High (22%) 1Imaging within ED None General and CT Extensive High (Necessarily In) 1Family Amenities None Limited Consult Multiple Consult, Grieving High (multiple rooms) 1Specialty Components: Geriatrics None Area Module with Support Low (none) 1Specialty Components: Pediatrics None Area Module with Support Low (none) 1Specialty Components: Detention None Area Module with Support Low (none) 1Admin/Teaching Space Minimal Moderate Extensive Mid (Flight CTRL / Conf.) 1 Count 3 6 7 % of Total 19% 38% 44%

EXHIBIT 8

UC FMF Floor Plans With Exam Rooms Numbered

UC FMF Floor Plans With Exam Rooms Numbered

UC FMF Floor Plans With Exam Rooms Numbered

EXHIBIT 9

Current Year Projected
Indicate CY or FY FY 2015 FY 2016 FY 2017 FY 2018 FY 2019 FY 2020 FY 2021 FY 2022 FY 2023 FY 2024
a1. General Medical/Surgical* UCMC 8,748 9,176 9,031 9,561 10,033 10,122 10,215 13,212 13,477 13,752a2. General Medical/Surgical* HMH 2,709 2,937 3,133 3,363 3,578 3,606 3,635a3. Observation UCMC 7,562 7,460 7,479 7,070 6,662 6,683 6,707 7,026 7,071 7,119a4. Observation UC FMF 2,026 2,038 2,050a5. Observation HMH 2,887 2,664 2,669 2,473 2,277 2,283 2,290 General MSGA & Observation 21,906 22,237 22,312 22,468 22,550 22,694 22,846 22,264 22,586 22,921b1. ICU/CCU UCMC 903 814 860 842 883 891 899 1,162 1,185 1,209b2. ICU/CCU HMH 223 203 179 175 187 188 189Total MSGA 23,032 23,254 23,351 23,485 23,619 23,773 23,934 23,426 23,771 24,130c. Pediatric 119 94 85 85 85 83 81 80 80 79d. Obstetric 1,421 1,381 1,366 1,369 1,372 1,375 1,377 1,380 1,383 1,386e1. Acute Psychiatric HMH 1,222 1,230 1,172 1,106 1,044 986 931e2. Acute Psychiatric UC Behavioral Health 1,567 1,576 1,586Total Acute 25,794 25,959 25,974 26,045 26,120 26,216 26,323 26,453 26,810 27,181f. Rehabilitationg. Comprehensive Careh. Other (Specify/add rows of needed)TOTAL DISCHARGES 25,794 25,959 25,974 26,045 26,120 26,216 26,323 26,453 26,810 27,181
a1. General Medical/Surgical* UCMC 43,444 37,365 37,211 39,380 41,313 41,674 42,051 54,345 55,430 56,556a2. General Medical/Surgical* HMH 11,160 11,676 14,318 15,428 16,416 16,543 16,676a3. Observation UCMC 11,749 11,419 11,449 10,186 8,922 8,951 8,982 9,873 9,937 10,004a4. Observation UC FMF 2,418 2,433 2,448a5. Observation HMH 4,779 4,488 4,497 3,874 3,250 3,259 3,268 General MSGA & Observation 71,132 64,948 67,475 68,868 69,901 70,427 70,977 66,636 67,800 69,008b1. ICU/CCU UCMC 3,585 3,600 3,415 3,342 3,506 3,537 3,569 4,612 4,704 4,800b2. ICU/CCU HMH 1,382 1,515 1,496 1,465 1,559 1,571 1,584Total MSGA 76,099 70,063 72,386 73,675 74,966 75,536 76,130 71,248 72,504 73,808c. Pediatric 294 256 185 185 184 180 176 175 173 171d. Obstetric 2,919 2,806 2,776 2,781 2,787 2,793 2,799 2,805 2,810 2,816e1. Acute Psychiatric HMH 6,869 7,502 7,148 6,747 6,722 6,700 6,326e2. Acute Psychiatric UC Behavioral Health 12,157 12,285 12,418Total Acute 86,181 80,627 82,495 83,388 84,660 85,209 85,432 86,384 87,773 89,214f. Rehabilitationg. Comprehensive Careh. Other (Specify/add rows of needed)
2. PATIENT DAYS
TABLE F. STATISTICAL PROJECTIONS - ENTIRE FACILITY (UCMC + UC FMF + HMH + UC BEHAVIORAL HEALTH + OBSERVATION)INSTRUCTION : Complete this table for the entire facility, including the proposed project. Indicate on the table if the reporting period is Calendar Year (CY) or Fiscal Year (FY). For sections 4 & 5, the number of beds and occupancy percentage should be reported on the basis of licensed beds. In an attachment to the application, provide an explanation or basis for the projections and specify all assumptions used. Applicants must explain why the assumptions are reasonable.
Two Most Recent Years (Actual)
Projected Years (ending at least two years after project completion and full occupancy) Include additional years, if needed in order to be consistent with Tables G and H.
1. DISCHARGES
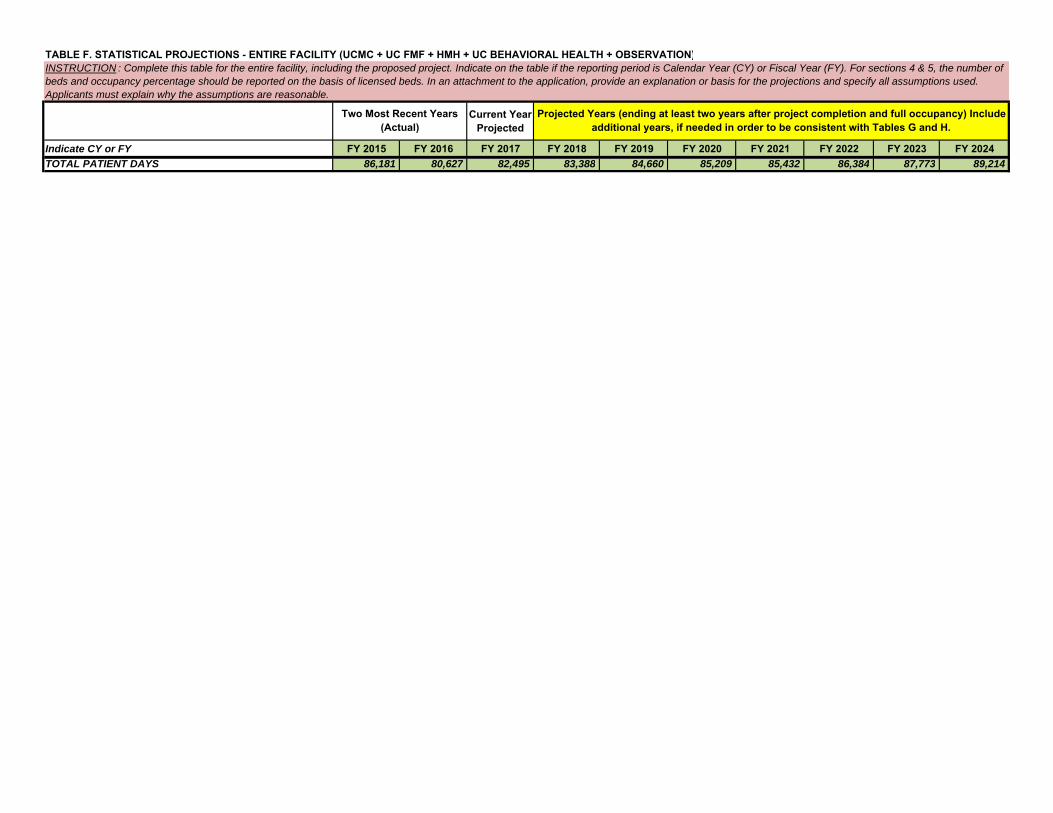
Current Year Projected
Indicate CY or FY FY 2015 FY 2016 FY 2017 FY 2018 FY 2019 FY 2020 FY 2021 FY 2022 FY 2023 FY 2024
TABLE F. STATISTICAL PROJECTIONS - ENTIRE FACILITY (UCMC + UC FMF + HMH + UC BEHAVIORAL HEALTH + OBSERVATION)INSTRUCTION : Complete this table for the entire facility, including the proposed project. Indicate on the table if the reporting period is Calendar Year (CY) or Fiscal Year (FY). For sections 4 & 5, the number of beds and occupancy percentage should be reported on the basis of licensed beds. In an attachment to the application, provide an explanation or basis for the projections and specify all assumptions used. Applicants must explain why the assumptions are reasonable.
Two Most Recent Years (Actual)
Projected Years (ending at least two years after project completion and full occupancy) Include additional years, if needed in order to be consistent with Tables G and H.
TOTAL PATIENT DAYS 86,181 80,627 82,495 83,388 84,660 85,209 85,432 86,384 87,773 89,214

Current Year Projected
Indicate CY or FY FY 2015 FY 2016 FY 2017 FY 2018 FY 2019 FY 2020 FY 2021 FY 2022 FY 2023 FY 2024
TABLE F. STATISTICAL PROJECTIONS - ENTIRE FACILITY (UCMC + UC FMF + HMH + UC BEHAVIORAL HEALTH + OBSERVATION)INSTRUCTION : Complete this table for the entire facility, including the proposed project. Indicate on the table if the reporting period is Calendar Year (CY) or Fiscal Year (FY). For sections 4 & 5, the number of beds and occupancy percentage should be reported on the basis of licensed beds. In an attachment to the application, provide an explanation or basis for the projections and specify all assumptions used. Applicants must explain why the assumptions are reasonable.
Two Most Recent Years (Actual)
Projected Years (ending at least two years after project completion and full occupancy) Include additional years, if needed in order to be consistent with Tables G and H.
a1. General Medical/Surgical* UCMC 5.0 4.1 4.1 4.1 4.1 4.1 4.1 4.1 4.1 4.1a2. General Medical/Surgical* HMH 4.1 4.0 4.6 4.6 4.6 4.6 4.6a3. Observation UCMC 1.6 1.5 1.5 1.4 1.3 1.3 1.3 1.4 1.4 1.4a4. Observation UC FMF 1.2 1.2 1.2a5. Observation HMH 1.7 1.7 1.7 1.6 1.4 1.4 1.4General MSGA & Observation 3.2 2.9 3.0 3.1 3.1 3.1 3.1 3.0 3.0 3.0b1. ICU/CCU UCMC 4.0 4.4 4.0 4.0 4.0 4.0 4.0 4.0 4.0 4.0b2. ICU/CCU HMH 6.2 7.5 8.4 8.4 8.4 8.4 8.4Total MSGA 3.3 3.0 3.1 3.1 3.2 3.2 3.2 3.0 3.1 3.1c. Pediatric 2.5 2.7 2.2 2.2 2.2 2.2 2.2 2.2 2.2 2.2d. Obstetric 2.1 2.0 2.0 2.0 2.0 2.0 2.0 2.0 2.0 2.0e1. Acute Psychiatric HMH 5.6 6.1 6.1 6.1 6.4 6.8 6.8e2. Acute Psychiatric UC Behavioral Health 7.8 7.8 7.8Total Acute 3.3 3.1 3.2 3.2 3.2 3.3 3.2 3.3 3.3 3.3f. Rehabilitationg. Comprehensive Careh. Other (Specify/add rows of needed)TOTAL AVERAGE LENGTH OF STAY 3.3 3.1 3.2 3.2 3.2 3.3 3.2 3.3 3.3 3.3
a1. General Medical/Surgical* UCMC 149 128 127 135 141 142 144 186 190 194a2. General Medical/Surgical* HMH 37 39 48 52 56 56 57a3. Observation UCMC 40 39 39 35 31 31 31 34 34 34a4. Observation UC FMF 11 11 11a5. Observation HMH 16 15 15 13 11 11 11 General MSGA & Observation 242 221 230 235 239 240 243 231 235 239b1. ICU/CCU UCMC 12 12 12 11 12 12 12 16 16 16b2. ICU/CCU HMH 6 6 6 6 6 6 6Total MSGA 260 239 247 252 257 258 261 247 251 255c. Pediatric 1 1 1 1 1 1 1 1 1 1d. Obstetric 11 10 10 10 10 10 10 10 10 10e1. Acute Psychiatric HMH 22 24 23 22 22 22 20e2. Acute Psychiatric UC Behavioral Health 40 40 40Total Acute 294 274 281 285 290 291 292 298 302 306f. Rehabilitationg. Comprehensive Careh. Other (Specify/add rows of needed)TOTAL LICENSED BEDS 294 274 281 285 290 291 292 298 302 306
3. AVERAGE LENGTH OF STAY (patient days divided by discharges)
4. NUMBER OF LICENSED BEDS

Current Year Projected
Indicate CY or FY FY 2015 FY 2016 FY 2017 FY 2018 FY 2019 FY 2020 FY 2021 FY 2022 FY 2023 FY 2024
TABLE F. STATISTICAL PROJECTIONS - ENTIRE FACILITY (UCMC + UC FMF + HMH + UC BEHAVIORAL HEALTH + OBSERVATION)INSTRUCTION : Complete this table for the entire facility, including the proposed project. Indicate on the table if the reporting period is Calendar Year (CY) or Fiscal Year (FY). For sections 4 & 5, the number of beds and occupancy percentage should be reported on the basis of licensed beds. In an attachment to the application, provide an explanation or basis for the projections and specify all assumptions used. Applicants must explain why the assumptions are reasonable.
Two Most Recent Years (Actual)
Projected Years (ending at least two years after project completion and full occupancy) Include additional years, if needed in order to be consistent with Tables G and H.
a1. General Medical/Surgical* UCMC 80.0% 80.2% 80.1% 80.2% 80.3% 80.4% 80.1% 80.0% 80.0% 80.0%a2. General Medical/Surgical* HMH 82.6% 82.0% 81.7% 81.3% 80.3% 80.9% 80.2%a3. Observation UCMC 80.1% 80.0% 80.0% 80.0% 79.9% 79.9% 79.9% 80.0% 80.1% 79.9%a4. Observation UC FMF 60.2% 60.6% 61.0%a5. Observation HMH 81.8% 82.0% 82.1% 81.6% 80.9% 81.2% 81.4%General MSGA & Observation 80.6% 80.6% 80.6% 80.5% 80.3% 80.5% 80.2% 79.0% 79.1% 79.1%b1. ICU/CCU UCMC 79.9% 80.2% 80.0% 80.3% 80.0% 80.8% 80.1% 80.0% 80.0% 80.2%b2. ICU/CCU HMH 63.1% 69.2% 68.3% 66.9% 71.2% 71.7% 72.3%Total MSGA 80.1% 80.3% 80.2% 80.1% 80.0% 80.3% 80.0% 79.1% 79.1% 79.2%c. Pediatric 80.5% 70.1% 50.7% 50.7% 50.5% 49.3% 48.2% 47.8% 47.4% 47.0%d. Obstetric 72.7% 76.9% 76.0% 76.2% 76.4% 76.5% 76.7% 76.8% 77.0% 77.2%e1. Acute Psychiatric HMH 85.5% 85.6% 85.1% 84.0% 83.7% 83.4% 86.7%e2. Acute Psychiatric UC Behavioral Health 83.3% 84.1% 85.1%Total Acute 80.3% 80.6% 80.4% 80.2% 80.1% 80.3% 80.2% 79.5% 79.6% 79.8%f. Rehabilitationg. Comprehensive Careh. Other (Specify/add rows of needed)TOTAL OCCUPANCY % 80.3% 80.6% 80.4% 80.2% 80.1% 80.3% 80.2% 79.5% 79.6% 79.8%
a1. Emergency Department UCMC (Total) 63,155 65,251 65,026 65,415 65,805 66,199 66,594 69,455 69,869 70,287a2. Emergency Department UC FMF (Total) 28,763 28,891 29,019a3. Emergency Department HMH (Total) 29,342 29,520 28,245 28,370 28,496 28,623 28,750 b1. Same-day Surgery Cases UCMC 6,034 5,890 5,678 5,621 5,652 5,685 5,719 6,174 6,211 6,249b2. Same-day Surgery Cases HMH 1,351 1,169 1,210 1,234 1,240 1,246 1,252c1. Laboratory RVUs UCMC 11,579,753 11,182,649 12,048,570 11,494,331 11,994,371 12,089,088 12,187,847 15,308,251 15,567,044 15,835,413c2. Laboratory RVUs HMH 3,020,073 2,803,257 2,695,784 2,487,416 2,575,584 2,559,873 2,546,777c3. Laboratory RVUs UC Behavioral Health 1,813,871 1,822,216 1,830,644d1. Imaging RVUs UCMC 1,789,053 1,772,683 1,905,329 1,809,354 1,888,067 1,902,976 1,918,522 2,649,594 2,691,468 2,734,861d2. Imaging RVUs HMH 613,403 590,035 615,566 582,398 603,042 599,363 596,297d3. Imaging RVUs UC Behavioral Health 496,726 499,044 501,386e. Psych Emergency Departmentf1. Outpatient Psych Clinic HMH 4,856 5,052 5,646 5,759 5,874 5,992 6,111f2. Outpatient Psych Clinic UC Behavioral Health 6,234 6,358 6,485g1. Intensive Outpatient Psych Program HMH 1,491 1,190 1,443 1,362 1,286 1,214 1,146g2. Intensive Outpatient Psych Program UC Behavioral Health 1,929 1,941 1,953h1. Partial Hospitalization Program HMH 1,300 2,600 2,600h2. Partial Hospitalization Program UC Behavioral Health 3,900 5,200 5,200TOTAL OUTPATIENT VISITS 17,108,511 16,456,696 17,372,496 16,481,259 17,170,717 17,262,858 17,361,616 20,384,897 20,698,243 21,021,495
5. OCCUPANCY PERCENTAGE *IMPORTANT NOTE: Leap year formulas should be changed by applicant to reflect 366 days per year.
6. OUTPATIENT VISITS
7. OBSERVATIONS**

Current Year Projected
Indicate CY or FY FY 2015 FY 2016 FY 2017 FY 2018 FY 2019 FY 2020 FY 2021 FY 2022 FY 2023 FY 2024
TABLE F. STATISTICAL PROJECTIONS - ENTIRE FACILITY (UCMC + UC FMF + HMH + UC BEHAVIORAL HEALTH + OBSERVATION)INSTRUCTION : Complete this table for the entire facility, including the proposed project. Indicate on the table if the reporting period is Calendar Year (CY) or Fiscal Year (FY). For sections 4 & 5, the number of beds and occupancy percentage should be reported on the basis of licensed beds. In an attachment to the application, provide an explanation or basis for the projections and specify all assumptions used. Applicants must explain why the assumptions are reasonable.
Two Most Recent Years (Actual)
Projected Years (ending at least two years after project completion and full occupancy) Include additional years, if needed in order to be consistent with Tables G and H.
a1. Number of Patients UCMC 7,562 7,460 7,479 7,070 6,662 6,683 6,707 7,026 7,071 7,119a2. Number of Patients UC FMF 2,026 2,038 2,050a3. Number of Patients HMH 2,887 2,664 2,669 2,473 2,277 2,283 2,290 b1. Hours UCMC 281,983 274,061 274,765 244,456 214,119 214,816 215,567 236,943 238,486 240,100b2. Hours UC FMF 58,043 58,385 58,743b3. Hours HMH 114,695 107,718 107,933 92,977 78,009 78,216 78,442
** Services included in the reporting of the “Observation Center”, direct expenses incurred in providing bedside care to observation patients; furnished by the hospital on the hospital’s premises, including use of a bed and periodic monitoring by the hospital’s nursing or other staff, in order to determine the need for a possible admission to the hospitals as an inpatient. Such services must be ordered and documented in writing, given by a medical practitioner; may or may not be provided in a distinct area of the hospital.
* Include beds dedicated to gynecology and addictions, if separate for acute psychiatric unit.

Current Year Projected
Indicate CY or FY FY2015 FY2016 FY2017 FY2018 FY2019 FY2020 FY2021 FY2022 FY2023 FY20241. REVENUE a. Inpatient Services 182,942$ 183,811$ 190,553$ 195,419$ 194,791$ 195,460$ 196,131$ 204,042$ 204,850$ 205,665$ b. Outpatient Services 243,927 252,316 256,945 264,030 263,175 264,111 265,051 256,363 257,344 258,329 Gross Patient Service Revenues 426,869$ 436,127$ 447,498$ 459,449$ 457,966$ 459,571$ 461,182$ 460,406$ 462,193$ 463,994$ c. Allowance For Bad Debt 18,149 12,593 14,027 13,476 13,435 13,481 13,526 13,078 13,128 13,178 d. Contractual Allowance 47,778 43,703 42,404 47,587 47,433 47,599 47,767 49,836 50,036 50,239 e. Charity Care 4,877 4,894 4,988 5,084 5,071 5,087 5,103 3,891 3,904 3,918 Net Patient Services Revenue 356,065$ 374,936$ 386,079$ 393,302$ 392,027$ 393,404$ 394,786$ 393,601$ 395,125$ 396,659$ f. Other Operating Revenues (Specify/add rows if needed) 8,474 5,719 5,056 4,728 4,728 4,728 4,728 3,755 3,755 3,755
NET OPERATING REVENUE 364,539$ 380,655$ 391,135$ 398,030$ 396,755$ 398,132$ 399,514$ 397,356$ 398,880$ 400,414$ 2. EXPENSES
a. Salaries & Wages (including benefits) 154,959$ 172,601$ 168,907$ 171,026$ 172,267$ 172,439$ 172,394$ 164,095$ 164,707$ 165,342$
b. Contractual Services 10,810 13,010 14,374 14,902 14,966 14,968 14,970 13,727 13,727 13,727 c. Interest on Current Debt 7,292 8,580 10,619 9,977 10,113 9,801 9,476 9,136 8,786 8,484 d. Interest on Project Debt - - - - - - - 7,804 7,658 7,506 e. Current Depreciation 20,531 18,432 21,116 22,409 21,738 21,106 21,162 21,339 22,398 23,790 f. Project Depreciation - - - - - - 200 7,694 7,694 7,694 g. Current Amortization - - - - - - - - - - h. Project Amortization - - - - - - - - - - i. Supplies 71,174 74,195 77,282 77,628 78,872 79,576 80,298 79,879 80,854 81,849 j. Other Expenses (Specify/add rows if needed) 56,837 56,979 63,010 68,285 68,325 68,341 68,357 68,453 68,507 68,562
TOTAL OPERATING EXPENSES 321,603$ 343,797$ 355,308$ 364,227$ 366,282$ 366,231$ 366,856$ 372,126$ 374,331$ 376,954$ 3. INCOME a. Income From Operation 42,936$ 36,858$ 35,827$ 33,803$ 30,474$ 31,901$ 32,659$ 25,230$ 24,549$ 23,460$ b. Non-Operating Income (10,186)$ 1,280$ (8,399)$ 5,615$ 5,615$ 5,615$ 5,615$ 5,615$ 5,615$ 5,615$ SUBTOTAL 32,750$ 38,138$ 27,428$ 39,418$ 36,089$ 37,516$ 38,274$ 30,845$ 30,164$ 29,075$ c. Income Taxes NET INCOME (LOSS) 32,750$ 38,138$ 27,428$ 39,418$ 36,089$ 37,516$ 38,274$ 30,845$ 30,164$ 29,075$
TABLE G. REVENUES & EXPENSES, UNINFLATED - ENTIRE FACILITY - Entire UCH Facility Components INSTRUCTION : Complete this table for the entire facility, including the proposed project. Table G should reflect current dollars (no inflation). Projected revenues and expenses should be consistent with the projections in Table F and with the costs of Manpower listed in Table L. Manpower. Indicate on the table if the reporting period is Calendar Year (CY) or Fiscal Year (FY). In an attachment to the application, provide an explanation or basis for the projections and specify all assumptions used. Applicants must explain why the assumptions are reasonable. Specify the sources of non-operating income.
Two Most Recent Years (Actual)
Projected Years (ending at least two years after project completion and full occupancy) Add columns if needed in order to document that the hospital will generate excess revenues over
total expenses consistent with the Financial Feasibility standard.

Current Year Projected
Indicate CY or FY FY2015 FY2016 FY2017 FY2018 FY2019 FY2020 FY2021 FY2022 FY2023 FY2024
TABLE G. REVENUES & EXPENSES, UNINFLATED - ENTIRE FACILITY - Entire UCH Facility Components INSTRUCTION : Complete this table for the entire facility, including the proposed project. Table G should reflect current dollars (no inflation). Projected revenues and expenses should be consistent with the projections in Table F and with the costs of Manpower listed in Table L. Manpower. Indicate on the table if the reporting period is Calendar Year (CY) or Fiscal Year (FY). In an attachment to the application, provide an explanation or basis for the projections and specify all assumptions used. Applicants must explain why the assumptions are reasonable. Specify the sources of non-operating income.
Two Most Recent Years (Actual)
Projected Years (ending at least two years after project completion and full occupancy) Add columns if needed in order to document that the hospital will generate excess revenues over
total expenses consistent with the Financial Feasibility standard.
4. PATIENT MIXa. Percent of Total Revenue 1) Medicare 47.3% 46.9% 46.9% 46.9% 46.9% 46.9% 46.9% 45.4% 45.4% 45.4% 2) Medicaid 13.0% 13.5% 13.5% 13.5% 13.5% 13.5% 13.5% 14.2% 14.2% 14.2% 3) Blue Cross 12.6% 11.2% 11.2% 11.2% 11.2% 11.2% 11.2% 11.4% 11.4% 11.4% 4) Commercial Insurance 22.2% 23.9% 23.9% 23.9% 23.9% 23.9% 23.9% 24.5% 24.5% 24.5% 5) Self-pay 0.9% 0.7% 0.7% 0.7% 0.7% 0.7% 0.7% 0.8% 0.8% 0.8% 6) Other 4.0% 3.8% 3.8% 3.8% 3.8% 3.8% 3.8% 3.7% 3.7% 3.7%TOTAL 100.0% 100.0% 100.0% 100.0% 100.0% 100.0% 100.0% 100.0% 100.0% 100.0%b. Percent of Patient Days 1) Medicare 63.6% 61.4% 61.4% 61.4% 61.4% 61.4% 61.4% 57.9% 57.9% 57.9% 2) Medicaid 11.8% 12.9% 12.9% 12.9% 12.9% 12.9% 12.9% 15.8% 15.8% 15.8% 3) Blue Cross 7.1% 6.7% 6.7% 6.7% 6.7% 6.7% 6.7% 7.0% 7.0% 7.0% 4) Commercial Insurance 13.9% 15.3% 15.3% 15.3% 15.3% 15.3% 15.3% 15.6% 15.6% 15.6% 5) Self-pay 0.7% 0.4% 0.4% 0.4% 0.4% 0.4% 0.4% 0.5% 0.5% 0.5% 6) Other 3.0% 3.3% 3.3% 3.3% 3.3% 3.3% 3.3% 3.2% 3.2% 3.2%TOTAL 100.0% 100.0% 100.0% 100.0% 100.0% 100.0% 100.0% 100.0% 100.0% 100.0%

Table G – Key Financial Projection Assumptions for UM Upper Chesapeake Medical Center (Excludes HSCRC Annual Update Factors & Expense Inflation)
1) Projection period reflects FY2018 – FY2024 2) Projection is based on the Upper Chesapeake Medical Center (UCMC) FY2018 budget with assumptions identified below. 3) Volumes Refer to COE Table F, including assumptions, and
Need Assessment section of the application for volume methodology and assumptions
4) Patient Revenue Gross Charges
o Update Factor
o Demographic Adjustment
o Variable Cost Factor
o Other
Revenue Deductions o Contractual Allowances
o Charity Care
o Allowance for Bad Debt
0.0% annual increase Remains constant at 0.37% per year 100% variable cost factor for inpatient and outpatient In total, $51.1 million shifting from HMH to UCMC in FY 2022 $1.8 million shifting from UCMC to unregulated ASC in FY 2022 Remains constant at 10.5% of gross revenue per year
Remains constant at 0.6% of gross revenue per year
- No overfunding or underfunding of UCC Remains constant at 2.48% of gross revenue per year
- No overfunding or underfunding of UCC 5) Other Revenue
Includes Rental Income, Cafeteria Revenue, Contributions and Other Miscellaneous Revenue
0.0% increase per year
6) Non-Operating Revenue Investment Income 0.0% increase per year
7) Expenses Inflation
Expense Volume Driver
Expense Variability with Volume Changes o Salaries and Benefits
o Professional Fees
o Supplies
o Purchased Services
o Other Operating Expenses
Interest Expense o Existing Debt
0.0% increase per year Identified at the cost center level and varies based on cost center level statistics and key volume drivers. Identified at the cost center level Ranges from 0% for overhead departments to 90% for inpatient nursing units. 0% for all cost centers Ranges from 0% for overhead departments to 100% for the Emergency Department and EEG Ranges from 0% for overhead departments to 100% for inpatient nursing units.
Ranges from 0% for overhead departments to 35.1% for inpatient nursing units. 88% allocation in FY2018 – FY2021 and 90% allocation in FY2022 – FY2024 of the following UCHS debt:
- 5.76% interest on $55.3M 2008C Series bonds - 5.76% interest on $118.5M 2011 B&C Series
bonds

o Project Debt
Depreciation and Amortization
- 3.6% interest on $50.0M 2011A Series bonds
4.5% interest on $67.3M bonds over 30 years Average life of 26 years on $74.4M of construction project expenditures and 10 years on routine capital expenditures
8) Routine Capital Expenditures $7.1M in FY2018 growing to $10.2M in FY2024
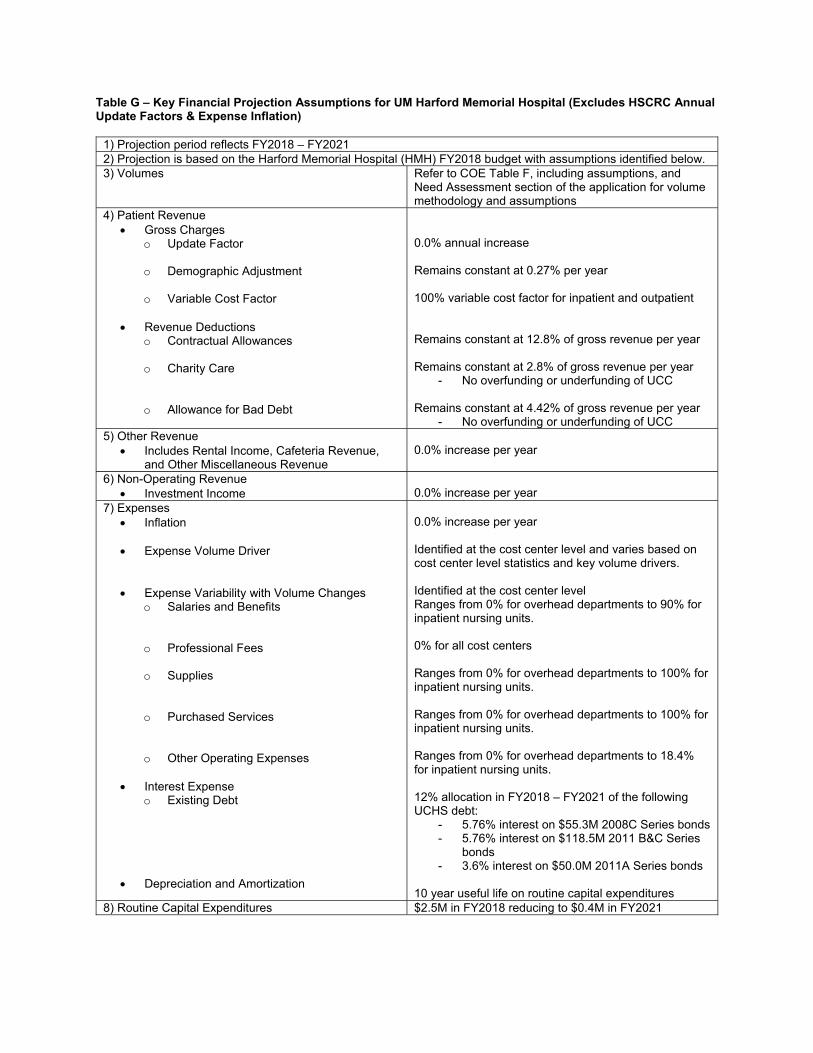
Table G – Key Financial Projection Assumptions for UM Harford Memorial Hospital (Excludes HSCRC Annual Update Factors & Expense Inflation)
1) Projection period reflects FY2018 – FY2021 2) Projection is based on the Harford Memorial Hospital (HMH) FY2018 budget with assumptions identified below. 3) Volumes Refer to COE Table F, including assumptions, and
Need Assessment section of the application for volume methodology and assumptions
4) Patient Revenue Gross Charges
o Update Factor
o Demographic Adjustment
o Variable Cost Factor
Revenue Deductions o Contractual Allowances
o Charity Care
o Allowance for Bad Debt
0.0% annual increase Remains constant at 0.27% per year 100% variable cost factor for inpatient and outpatient Remains constant at 12.8% of gross revenue per year
Remains constant at 2.8% of gross revenue per year
- No overfunding or underfunding of UCC Remains constant at 4.42% of gross revenue per year
- No overfunding or underfunding of UCC 5) Other Revenue
Includes Rental Income, Cafeteria Revenue, and Other Miscellaneous Revenue
0.0% increase per year
6) Non-Operating Revenue Investment Income 0.0% increase per year
7) Expenses Inflation
Expense Volume Driver
Expense Variability with Volume Changes o Salaries and Benefits
o Professional Fees
o Supplies
o Purchased Services
o Other Operating Expenses
Interest Expense o Existing Debt
Depreciation and Amortization
0.0% increase per year Identified at the cost center level and varies based on cost center level statistics and key volume drivers. Identified at the cost center level Ranges from 0% for overhead departments to 90% for inpatient nursing units. 0% for all cost centers Ranges from 0% for overhead departments to 100% for inpatient nursing units. Ranges from 0% for overhead departments to 100% for inpatient nursing units.
Ranges from 0% for overhead departments to 18.4% for inpatient nursing units. 12% allocation in FY2018 – FY2021 of the following UCHS debt:
- 5.76% interest on $55.3M 2008C Series bonds - 5.76% interest on $118.5M 2011 B&C Series
bonds - 3.6% interest on $50.0M 2011A Series bonds
10 year useful life on routine capital expenditures 8) Routine Capital Expenditures $2.5M in FY2018 reducing to $0.4M in FY2021

Table G – Key Financial Projection Assumptions for UC Behavioral Health (Excludes HSCRC Annual Update Factors & Expense Inflation)
1) Projection period reflects FY2022 – FY2024 2) Projection is based on the Harford Memorial Hospital (HMH) FY2018 budget with assumptions identified below. 3) Volumes Refer to CON Table F, including assumptions, and
Need Assessment section of the application for volume methodology and assumptions
4) Patient Revenue Gross Charges
o Update Factor
o Demographic Adjustment
o Variable Cost Factor
o Geriatric Psychiatry Change
o Partial Hospitalization Psychiatry Changes
o Other
Revenue Deductions
o Contractual Allowances
o Charity Care
o Allowance for Bad Debt
0.0% annual increase No demographic adjustment HMH Psychiatric revenue will shift to UC Behavioral Health at a 100% variable cost factor, while revenue from UHCC will shift at 50% Geriatric Psychiatry charge per day calculated using state-wide average Geriatric Psychiatry utilization profile multiplied by projected rates Outpatient Partial Hospitalization Psychiatry charges calculated by multiplying visits by projected PDC rate Removed assessments and quality from HMH rates and changed the mark-up based on HMH FY2016 Psychiatric payer mix Based on FY2016 HMH Psychiatric payer mix and remains constant at 17.4% of gross revenue per year
- Medicare contractual adjustments reflect an inpatient Medicare per diem rate that is 65% of the assumed charge per visit based on Sheppard Pratt average per diem
- Outpatient is assumed to be the same as inpatient
- Assumes Medicaid will pay HSCRC rates
Based on FY2016 HMH uncompensated care and remains constant at 0.5% of gross revenue per year
- No overfunding or underfunding of UCC Based on FY2016 HMH uncompensated care and remains constant at 3.1% of gross revenue per year
- No overfunding or underfunding of UCC 5) Other Revenue
Cafeteria Revenue 0.0% increase per year 6) Expenses
Inflation
Expense Volume Driver
Expense Variability with Volume Changes o Salaries and Benefits
o Professional Fees
0.0% increase per year Identified at the cost center level and varies based on cost center level statistics and key volume drivers. Identified at the cost center level Ranges from 10% for overhead departments to 100% for inpatient nursing units. 0% for all cost centers except inpatient nursing (50%) and Laboratory (100%).
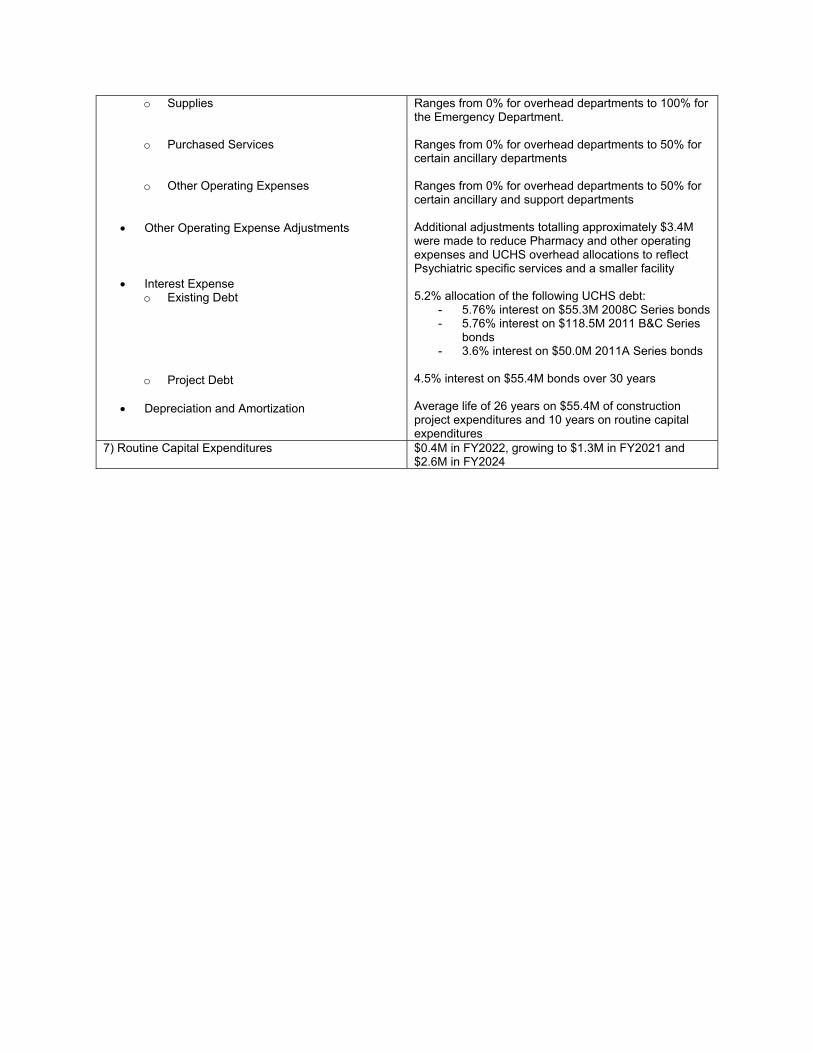
o Supplies
o Purchased Services
o Other Operating Expenses
Other Operating Expense Adjustments
Interest Expense o Existing Debt
o Project Debt
Depreciation and Amortization
Ranges from 0% for overhead departments to 100% for the Emergency Department. Ranges from 0% for overhead departments to 50% for certain ancillary departments
Ranges from 0% for overhead departments to 50% for certain ancillary and support departments Additional adjustments totalling approximately $3.4M were made to reduce Pharmacy and other operating expenses and UCHS overhead allocations to reflect Psychiatric specific services and a smaller facility 5.2% allocation of the following UCHS debt:
- 5.76% interest on $55.3M 2008C Series bonds - 5.76% interest on $118.5M 2011 B&C Series
bonds - 3.6% interest on $50.0M 2011A Series bonds
4.5% interest on $55.4M bonds over 30 years Average life of 26 years on $55.4M of construction project expenditures and 10 years on routine capital expenditures
7) Routine Capital Expenditures $0.4M in FY2022, growing to $1.3M in FY2021 and $2.6M in FY2024
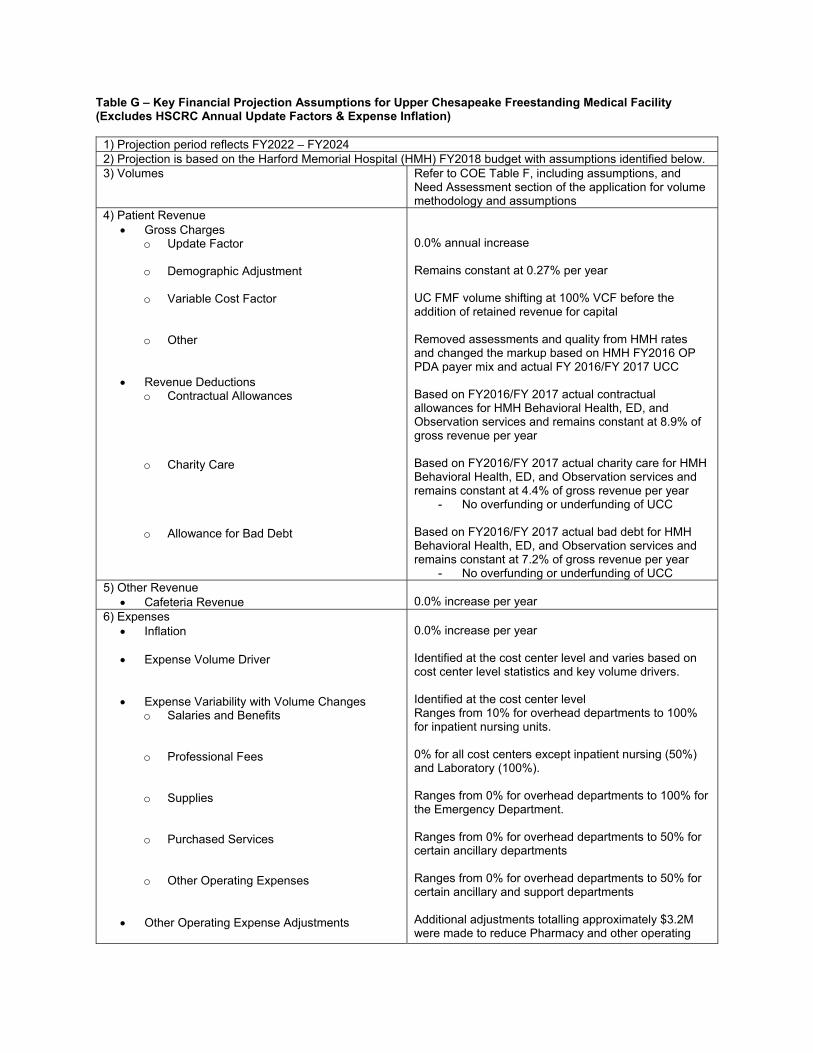
Table G – Key Financial Projection Assumptions for Upper Chesapeake Freestanding Medical Facility (Excludes HSCRC Annual Update Factors & Expense Inflation)
1) Projection period reflects FY2022 – FY2024 2) Projection is based on the Harford Memorial Hospital (HMH) FY2018 budget with assumptions identified below. 3) Volumes Refer to COE Table F, including assumptions, and
Need Assessment section of the application for volume methodology and assumptions
4) Patient Revenue Gross Charges
o Update Factor
o Demographic Adjustment
o Variable Cost Factor
o Other
Revenue Deductions
o Contractual Allowances
o Charity Care
o Allowance for Bad Debt
0.0% annual increase Remains constant at 0.27% per year UC FMF volume shifting at 100% VCF before the addition of retained revenue for capital Removed assessments and quality from HMH rates and changed the markup based on HMH FY2016 OP PDA payer mix and actual FY 2016/FY 2017 UCC Based on FY2016/FY 2017 actual contractual allowances for HMH Behavioral Health, ED, and Observation services and remains constant at 8.9% of gross revenue per year
Based on FY2016/FY 2017 actual charity care for HMH Behavioral Health, ED, and Observation services and remains constant at 4.4% of gross revenue per year
- No overfunding or underfunding of UCC Based on FY2016/FY 2017 actual bad debt for HMH Behavioral Health, ED, and Observation services and remains constant at 7.2% of gross revenue per year
- No overfunding or underfunding of UCC 5) Other Revenue
Cafeteria Revenue 0.0% increase per year 6) Expenses
Inflation
Expense Volume Driver
Expense Variability with Volume Changes o Salaries and Benefits
o Professional Fees
o Supplies
o Purchased Services
o Other Operating Expenses
Other Operating Expense Adjustments
0.0% increase per year Identified at the cost center level and varies based on cost center level statistics and key volume drivers. Identified at the cost center level Ranges from 10% for overhead departments to 100% for inpatient nursing units. 0% for all cost centers except inpatient nursing (50%) and Laboratory (100%). Ranges from 0% for overhead departments to 100% for the Emergency Department. Ranges from 0% for overhead departments to 50% for certain ancillary departments
Ranges from 0% for overhead departments to 50% for certain ancillary and support departments Additional adjustments totalling approximately $3.2M were made to reduce Pharmacy and other operating

Interest Expense o Existing Debt
o Project Debt
Depreciation and Amortization
expenses and UCHS overhead allocations to reflect specific services at UC FMF and a smaller facility 4.8% allocation of the following UCHS debt:
- 5.76% interest on $55.3M 2008C Series bonds - 5.76% interest on $118.5M 2011 B&C Series
bonds - 3.6% interest on $50.0M 2011A Series bonds
4.5% interest on $51.2M bonds over 30 years Average life of 26 years on $51.2M of construction project expenditures and 10 years on routine capital expenditures
7) Routine Capital Expenditures $0.3M in FY2022, growing to $1.2M in FY2021 and $2.4M in FY2024
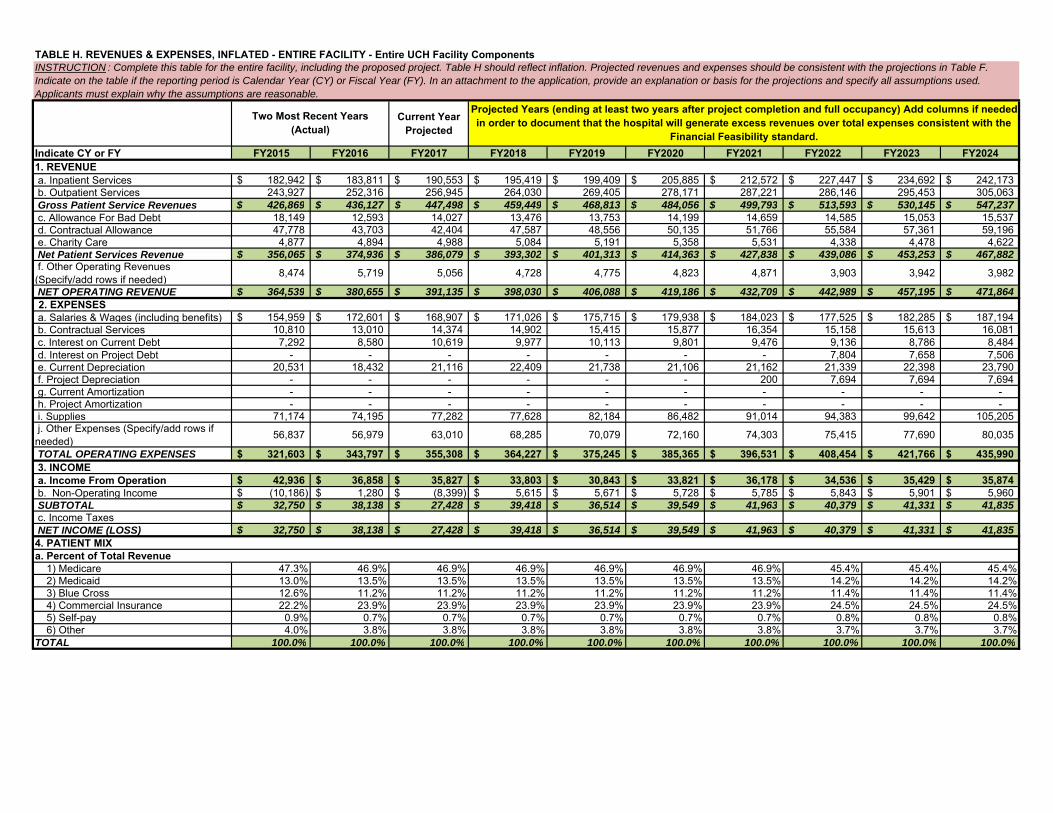
Current Year Projected
Indicate CY or FY FY2015 FY2016 FY2017 FY2018 FY2019 FY2020 FY2021 FY2022 FY2023 FY20241. REVENUE a. Inpatient Services 182,942$ 183,811$ 190,553$ 195,419$ 199,409$ 205,885$ 212,572$ 227,447$ 234,692$ 242,173$ b. Outpatient Services 243,927 252,316 256,945 264,030 269,405 278,171 287,221 286,146 295,453 305,063 Gross Patient Service Revenues 426,869$ 436,127$ 447,498$ 459,449$ 468,813$ 484,056$ 499,793$ 513,593$ 530,145$ 547,237$ c. Allowance For Bad Debt 18,149 12,593 14,027 13,476 13,753 14,199 14,659 14,585 15,053 15,537 d. Contractual Allowance 47,778 43,703 42,404 47,587 48,556 50,135 51,766 55,584 57,361 59,196 e. Charity Care 4,877 4,894 4,988 5,084 5,191 5,358 5,531 4,338 4,478 4,622 Net Patient Services Revenue 356,065$ 374,936$ 386,079$ 393,302$ 401,313$ 414,363$ 427,838$ 439,086$ 453,253$ 467,882$ f. Other Operating Revenues (Specify/add rows if needed) 8,474 5,719 5,056 4,728 4,775 4,823 4,871 3,903 3,942 3,982
NET OPERATING REVENUE 364,539$ 380,655$ 391,135$ 398,030$ 406,088$ 419,186$ 432,709$ 442,989$ 457,195$ 471,864$ 2. EXPENSES
a. Salaries & Wages (including benefits) 154,959$ 172,601$ 168,907$ 171,026$ 175,715$ 179,938$ 184,023$ 177,525$ 182,285$ 187,194$ b. Contractual Services 10,810 13,010 14,374 14,902 15,415 15,877 16,354 15,158 15,613 16,081 c. Interest on Current Debt 7,292 8,580 10,619 9,977 10,113 9,801 9,476 9,136 8,786 8,484 d. Interest on Project Debt - - - - - - - 7,804 7,658 7,506 e. Current Depreciation 20,531 18,432 21,116 22,409 21,738 21,106 21,162 21,339 22,398 23,790 f. Project Depreciation - - - - - - 200 7,694 7,694 7,694 g. Current Amortization - - - - - - - - - - h. Project Amortization - - - - - - - - - - i. Supplies 71,174 74,195 77,282 77,628 82,184 86,482 91,014 94,383 99,642 105,205 j. Other Expenses (Specify/add rows if needed) 56,837 56,979 63,010 68,285 70,079 72,160 74,303 75,415 77,690 80,035
TOTAL OPERATING EXPENSES 321,603$ 343,797$ 355,308$ 364,227$ 375,245$ 385,365$ 396,531$ 408,454$ 421,766$ 435,990$ 3. INCOME a. Income From Operation 42,936$ 36,858$ 35,827$ 33,803$ 30,843$ 33,821$ 36,178$ 34,536$ 35,429$ 35,874$ b. Non-Operating Income (10,186)$ 1,280$ (8,399)$ 5,615$ 5,671$ 5,728$ 5,785$ 5,843$ 5,901$ 5,960$ SUBTOTAL 32,750$ 38,138$ 27,428$ 39,418$ 36,514$ 39,549$ 41,963$ 40,379$ 41,331$ 41,835$ c. Income Taxes NET INCOME (LOSS) 32,750$ 38,138$ 27,428$ 39,418$ 36,514$ 39,549$ 41,963$ 40,379$ 41,331$ 41,835$ 4. PATIENT MIXa. Percent of Total Revenue 1) Medicare 47.3% 46.9% 46.9% 46.9% 46.9% 46.9% 46.9% 45.4% 45.4% 45.4% 2) Medicaid 13.0% 13.5% 13.5% 13.5% 13.5% 13.5% 13.5% 14.2% 14.2% 14.2% 3) Blue Cross 12.6% 11.2% 11.2% 11.2% 11.2% 11.2% 11.2% 11.4% 11.4% 11.4% 4) Commercial Insurance 22.2% 23.9% 23.9% 23.9% 23.9% 23.9% 23.9% 24.5% 24.5% 24.5% 5) Self-pay 0.9% 0.7% 0.7% 0.7% 0.7% 0.7% 0.7% 0.8% 0.8% 0.8% 6) Other 4.0% 3.8% 3.8% 3.8% 3.8% 3.8% 3.8% 3.7% 3.7% 3.7%TOTAL 100.0% 100.0% 100.0% 100.0% 100.0% 100.0% 100.0% 100.0% 100.0% 100.0%
TABLE H. REVENUES & EXPENSES, INFLATED - ENTIRE FACILITY - Entire UCH Facility Components INSTRUCTION : Complete this table for the entire facility, including the proposed project. Table H should reflect inflation. Projected revenues and expenses should be consistent with the projections in Table F. Indicate on the table if the reporting period is Calendar Year (CY) or Fiscal Year (FY). In an attachment to the application, provide an explanation or basis for the projections and specify all assumptions used. Applicants must explain why the assumptions are reasonable.
Two Most Recent Years (Actual)
Projected Years (ending at least two years after project completion and full occupancy) Add columns if needed in order to document that the hospital will generate excess revenues over total expenses consistent with the
Financial Feasibility standard.

Current Year Projected
Indicate CY or FY FY2015 FY2016 FY2017 FY2018 FY2019 FY2020 FY2021 FY2022 FY2023 FY2024
TABLE H. REVENUES & EXPENSES, INFLATED - ENTIRE FACILITY - Entire UCH Facility Components INSTRUCTION : Complete this table for the entire facility, including the proposed project. Table H should reflect inflation. Projected revenues and expenses should be consistent with the projections in Table F. Indicate on the table if the reporting period is Calendar Year (CY) or Fiscal Year (FY). In an attachment to the application, provide an explanation or basis for the projections and specify all assumptions used. Applicants must explain why the assumptions are reasonable.
Two Most Recent Years (Actual)
Projected Years (ending at least two years after project completion and full occupancy) Add columns if needed in order to document that the hospital will generate excess revenues over total expenses consistent with the
Financial Feasibility standard.
b. Percent of Patient DaysTotal MSGA 1) Medicare 63.6% 61.4% 61.4% 61.4% 61.4% 61.4% 61.4% 57.9% 57.9% 57.9% 2) Medicaid 11.8% 12.9% 12.9% 12.9% 12.9% 12.9% 12.9% 15.8% 15.8% 15.8% 3) Blue Cross 7.1% 6.7% 6.7% 6.7% 6.7% 6.7% 6.7% 7.0% 7.0% 7.0% 4) Commercial Insurance 13.9% 15.3% 15.3% 15.3% 15.3% 15.3% 15.3% 15.6% 15.6% 15.6% 5) Self-pay 0.7% 0.4% 0.4% 0.4% 0.4% 0.4% 0.4% 0.5% 0.5% 0.5% 6) Other 3.0% 3.3% 3.3% 3.3% 3.3% 3.3% 3.3% 3.2% 3.2% 3.2%TOTAL 100.0% 100.0% 100.0% 100.0% 100.0% 100.0% 100.0% 100.0% 100.0% 100.0%
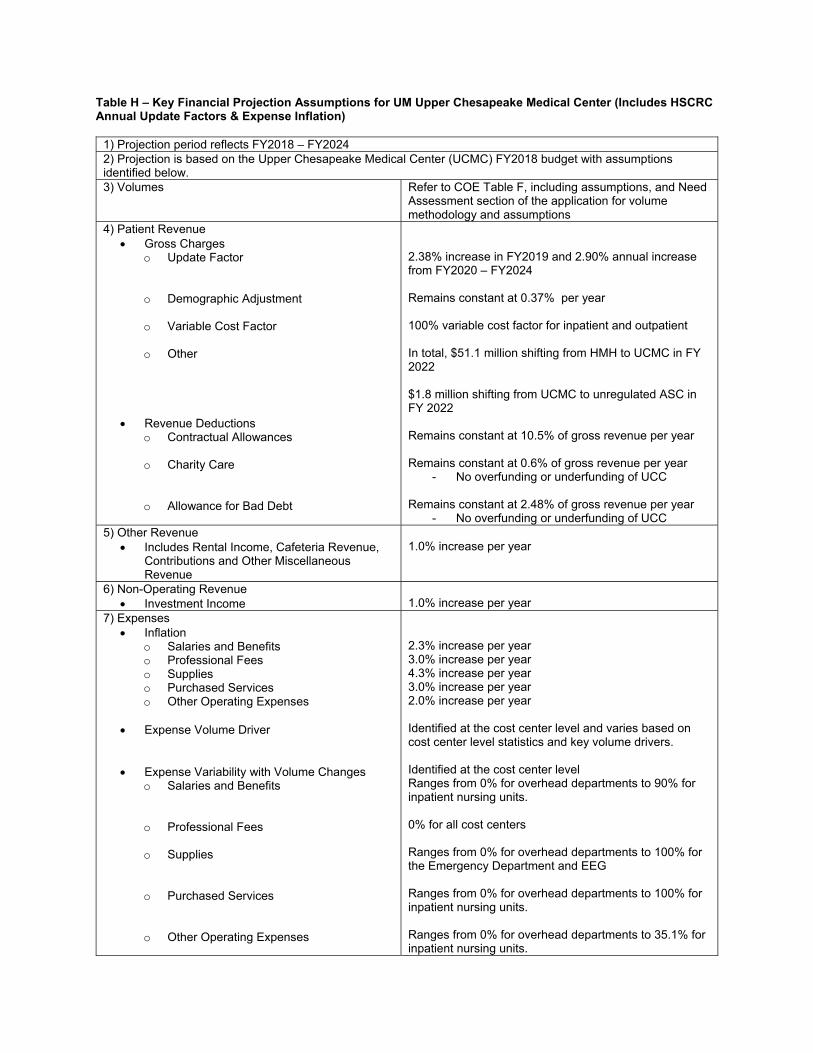
Table H – Key Financial Projection Assumptions for UM Upper Chesapeake Medical Center (Includes HSCRC Annual Update Factors & Expense Inflation)
1) Projection period reflects FY2018 – FY2024 2) Projection is based on the Upper Chesapeake Medical Center (UCMC) FY2018 budget with assumptions identified below. 3) Volumes Refer to COE Table F, including assumptions, and Need
Assessment section of the application for volume methodology and assumptions
4) Patient Revenue Gross Charges
o Update Factor
o Demographic Adjustment
o Variable Cost Factor
o Other
Revenue Deductions o Contractual Allowances
o Charity Care
o Allowance for Bad Debt
2.38% increase in FY2019 and 2.90% annual increase from FY2020 – FY2024 Remains constant at 0.37% per year 100% variable cost factor for inpatient and outpatient In total, $51.1 million shifting from HMH to UCMC in FY 2022 $1.8 million shifting from UCMC to unregulated ASC in FY 2022 Remains constant at 10.5% of gross revenue per year
Remains constant at 0.6% of gross revenue per year
- No overfunding or underfunding of UCC Remains constant at 2.48% of gross revenue per year
- No overfunding or underfunding of UCC 5) Other Revenue
Includes Rental Income, Cafeteria Revenue, Contributions and Other Miscellaneous Revenue
1.0% increase per year
6) Non-Operating Revenue Investment Income 1.0% increase per year
7) Expenses Inflation
o Salaries and Benefits o Professional Fees o Supplies o Purchased Services o Other Operating Expenses
Expense Volume Driver
Expense Variability with Volume Changes o Salaries and Benefits
o Professional Fees
o Supplies
o Purchased Services
o Other Operating Expenses
2.3% increase per year 3.0% increase per year 4.3% increase per year 3.0% increase per year 2.0% increase per year Identified at the cost center level and varies based on cost center level statistics and key volume drivers. Identified at the cost center level Ranges from 0% for overhead departments to 90% for inpatient nursing units. 0% for all cost centers Ranges from 0% for overhead departments to 100% for the Emergency Department and EEG Ranges from 0% for overhead departments to 100% for inpatient nursing units.
Ranges from 0% for overhead departments to 35.1% for inpatient nursing units.
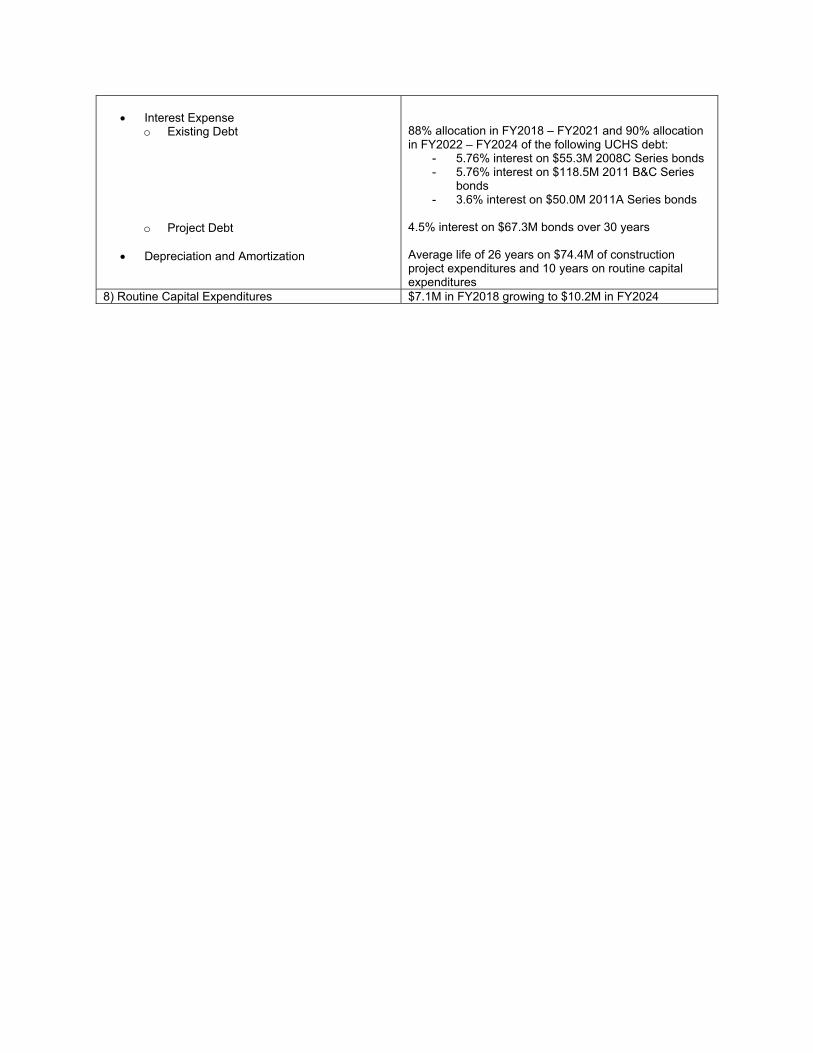
Interest Expense
o Existing Debt
o Project Debt
Depreciation and Amortization
88% allocation in FY2018 – FY2021 and 90% allocation in FY2022 – FY2024 of the following UCHS debt:
- 5.76% interest on $55.3M 2008C Series bonds - 5.76% interest on $118.5M 2011 B&C Series
bonds - 3.6% interest on $50.0M 2011A Series bonds
4.5% interest on $67.3M bonds over 30 years Average life of 26 years on $74.4M of construction project expenditures and 10 years on routine capital expenditures
8) Routine Capital Expenditures $7.1M in FY2018 growing to $10.2M in FY2024
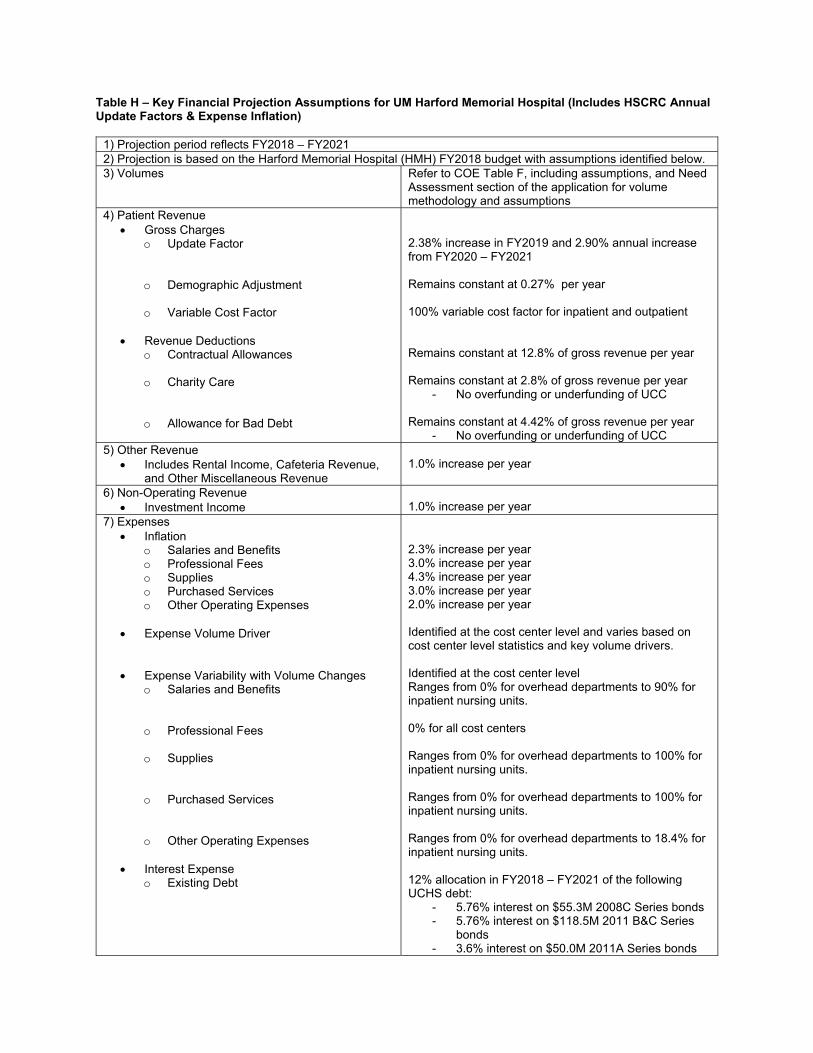
Table H – Key Financial Projection Assumptions for UM Harford Memorial Hospital (Includes HSCRC Annual Update Factors & Expense Inflation)
1) Projection period reflects FY2018 – FY2021 2) Projection is based on the Harford Memorial Hospital (HMH) FY2018 budget with assumptions identified below. 3) Volumes Refer to COE Table F, including assumptions, and Need
Assessment section of the application for volume methodology and assumptions
4) Patient Revenue Gross Charges
o Update Factor
o Demographic Adjustment
o Variable Cost Factor
Revenue Deductions o Contractual Allowances
o Charity Care
o Allowance for Bad Debt
2.38% increase in FY2019 and 2.90% annual increase from FY2020 – FY2021 Remains constant at 0.27% per year 100% variable cost factor for inpatient and outpatient Remains constant at 12.8% of gross revenue per year
Remains constant at 2.8% of gross revenue per year
- No overfunding or underfunding of UCC Remains constant at 4.42% of gross revenue per year
- No overfunding or underfunding of UCC 5) Other Revenue
Includes Rental Income, Cafeteria Revenue, and Other Miscellaneous Revenue
1.0% increase per year
6) Non-Operating Revenue Investment Income 1.0% increase per year
7) Expenses Inflation
o Salaries and Benefits o Professional Fees o Supplies o Purchased Services o Other Operating Expenses
Expense Volume Driver
Expense Variability with Volume Changes o Salaries and Benefits
o Professional Fees
o Supplies
o Purchased Services
o Other Operating Expenses
Interest Expense o Existing Debt
2.3% increase per year 3.0% increase per year 4.3% increase per year 3.0% increase per year 2.0% increase per year Identified at the cost center level and varies based on cost center level statistics and key volume drivers. Identified at the cost center level Ranges from 0% for overhead departments to 90% for inpatient nursing units. 0% for all cost centers Ranges from 0% for overhead departments to 100% for inpatient nursing units. Ranges from 0% for overhead departments to 100% for inpatient nursing units.
Ranges from 0% for overhead departments to 18.4% for inpatient nursing units. 12% allocation in FY2018 – FY2021 of the following UCHS debt:
- 5.76% interest on $55.3M 2008C Series bonds - 5.76% interest on $118.5M 2011 B&C Series
bonds - 3.6% interest on $50.0M 2011A Series bonds

Depreciation and Amortization
10 year useful life on routine capital expenditures
8) Routine Capital Expenditures $2.5M in FY2018 reducing to $0.4M in FY2021

Table H – Key Financial Projection Assumptions for UC Behavioral Health (Includes HSCRC Annual Update Factors & Expense Inflation)
1) Projection period reflects FY2022 – FY2024 2) Projection is based on the Harford Memorial Hospital (HMH) FY2018 budget with assumptions identified below. 3) Volumes Refer to CON Table F, including assumptions, and
Need Assessment section of the application for volume methodology and assumptions
4) Patient Revenue Gross Charges
o Update Factor
o Demographic Adjustment
o Variable Cost Factor
o Geriatric Psychiatry Change
o Partial Hospitalization Psychiatry Changes
o Other
Revenue Deductions
o Contractual Allowances
o Charity Care
o Allowance for Bad Debt
1.9% annual increase No demographic adjustment HMH Psychiatric revenue will shift to UC Behavioral Health at a 100% variable cost factor, while revenue from UHCC will shift at 50% Geriatric Psychiatry charge per day calculated using state-wide average Geriatric Psychiatry utilization profile multiplied by projected rates Outpatient Partial Hospitalization Psychiatry charges calculated by multiplying visits by projected PDC rate Removed assessments and quality from HMH rates and changed the markup based on HMH FY2016 Psychiatric payer mix Based on FY2016 HMH Psychiatric payer mix and remains constant at 17.4% of gross revenue per year
- Medicare contractual adjustments reflect an inpatient Medicare per diem rate that is 65% of the assumed charge per visit based on Sheppard Pratt average per diem
- Outpatient is assumed to be the same as inpatient
- Assumes Medicaid will pay HSCRC rates
Based on FY2016 HMH uncompensated care and remains constant at 0.5% of gross revenue per year
- No overfunding or underfunding of UCC Based on FY2016 HMH uncompensated care and remains constant at 3.1% of gross revenue per year
- No overfunding or underfunding of UCC 5) Other Revenue
Cafeteria Revenue 1.0% increase per year 6) Expenses
Inflation o Salaries and Benefits o Professional Fees o Supplies o Purchased Services o Other Operating Expenses
Expense Volume Driver
Expense Variability with Volume Changes o Salaries and Benefits
2.3% increase per year 3.0% increase per year 4.3% increase per year 3.0% increase per year 2.0% increase per year Identified at the cost center level and varies based on cost center level statistics and key volume drivers. Identified at the cost center level Ranges from 10% for overhead departments to 100% for inpatient nursing units.
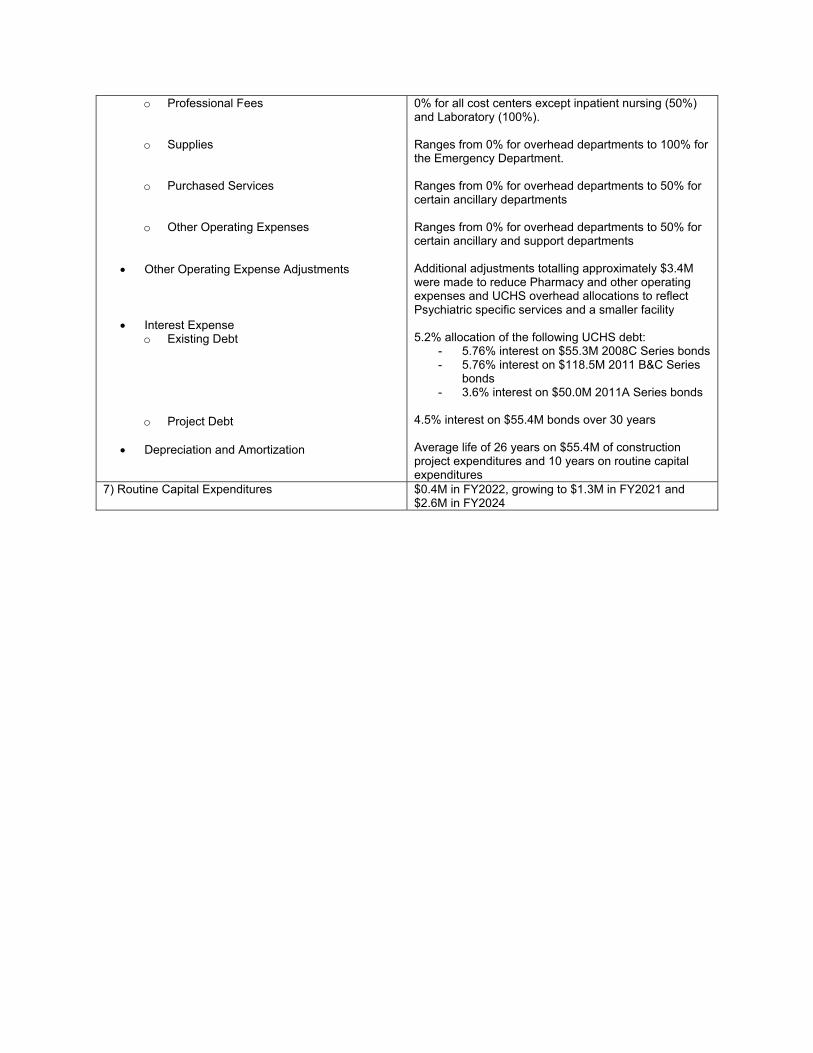
o Professional Fees
o Supplies
o Purchased Services
o Other Operating Expenses
Other Operating Expense Adjustments
Interest Expense o Existing Debt
o Project Debt
Depreciation and Amortization
0% for all cost centers except inpatient nursing (50%) and Laboratory (100%). Ranges from 0% for overhead departments to 100% for the Emergency Department. Ranges from 0% for overhead departments to 50% for certain ancillary departments
Ranges from 0% for overhead departments to 50% for certain ancillary and support departments Additional adjustments totalling approximately $3.4M were made to reduce Pharmacy and other operating expenses and UCHS overhead allocations to reflect Psychiatric specific services and a smaller facility 5.2% allocation of the following UCHS debt:
- 5.76% interest on $55.3M 2008C Series bonds - 5.76% interest on $118.5M 2011 B&C Series
bonds - 3.6% interest on $50.0M 2011A Series bonds
4.5% interest on $55.4M bonds over 30 years Average life of 26 years on $55.4M of construction project expenditures and 10 years on routine capital expenditures
7) Routine Capital Expenditures $0.4M in FY2022, growing to $1.3M in FY2021 and $2.6M in FY2024
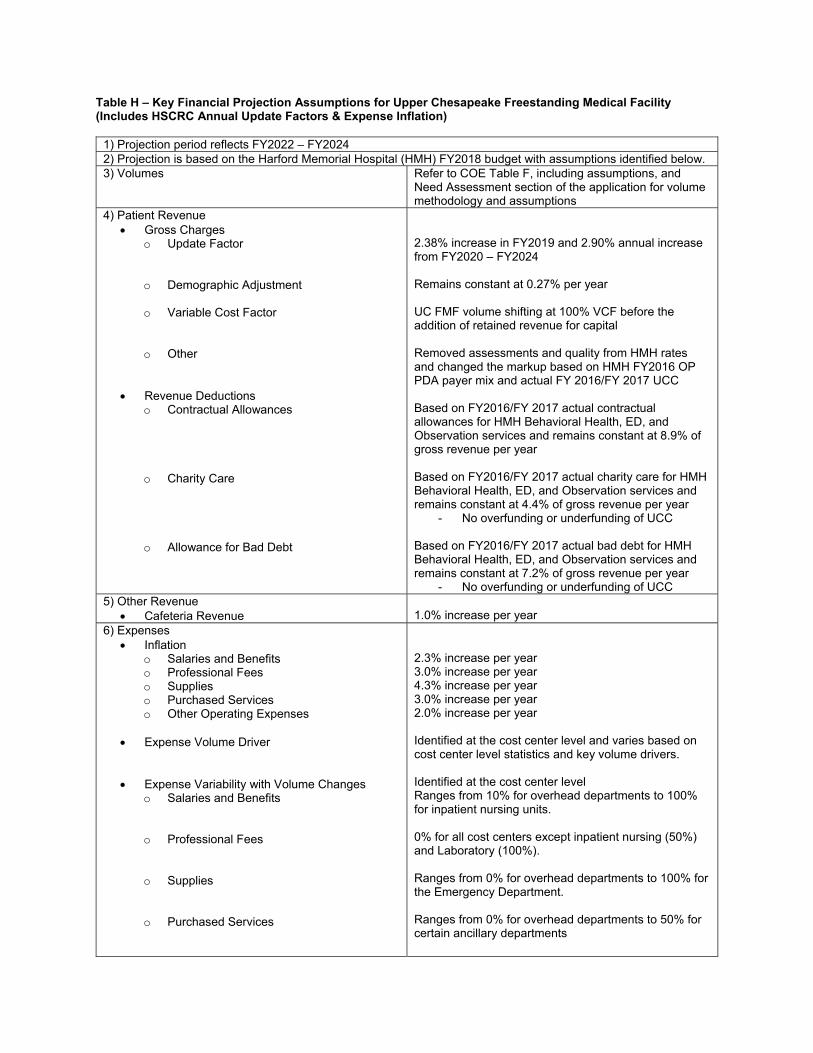
Table H – Key Financial Projection Assumptions for Upper Chesapeake Freestanding Medical Facility (Includes HSCRC Annual Update Factors & Expense Inflation)
1) Projection period reflects FY2022 – FY2024 2) Projection is based on the Harford Memorial Hospital (HMH) FY2018 budget with assumptions identified below. 3) Volumes Refer to COE Table F, including assumptions, and
Need Assessment section of the application for volume methodology and assumptions
4) Patient Revenue Gross Charges
o Update Factor
o Demographic Adjustment
o Variable Cost Factor
o Other
Revenue Deductions
o Contractual Allowances
o Charity Care
o Allowance for Bad Debt
2.38% increase in FY2019 and 2.90% annual increase from FY2020 – FY2024 Remains constant at 0.27% per year UC FMF volume shifting at 100% VCF before the addition of retained revenue for capital Removed assessments and quality from HMH rates and changed the markup based on HMH FY2016 OP PDA payer mix and actual FY 2016/FY 2017 UCC Based on FY2016/FY 2017 actual contractual allowances for HMH Behavioral Health, ED, and Observation services and remains constant at 8.9% of gross revenue per year
Based on FY2016/FY 2017 actual charity care for HMH Behavioral Health, ED, and Observation services and remains constant at 4.4% of gross revenue per year
- No overfunding or underfunding of UCC Based on FY2016/FY 2017 actual bad debt for HMH Behavioral Health, ED, and Observation services and remains constant at 7.2% of gross revenue per year
- No overfunding or underfunding of UCC 5) Other Revenue
Cafeteria Revenue 1.0% increase per year 6) Expenses
Inflation o Salaries and Benefits o Professional Fees o Supplies o Purchased Services o Other Operating Expenses
Expense Volume Driver
Expense Variability with Volume Changes o Salaries and Benefits
o Professional Fees
o Supplies
o Purchased Services
2.3% increase per year 3.0% increase per year 4.3% increase per year 3.0% increase per year 2.0% increase per year Identified at the cost center level and varies based on cost center level statistics and key volume drivers. Identified at the cost center level Ranges from 10% for overhead departments to 100% for inpatient nursing units. 0% for all cost centers except inpatient nursing (50%) and Laboratory (100%). Ranges from 0% for overhead departments to 100% for the Emergency Department. Ranges from 0% for overhead departments to 50% for certain ancillary departments

o Other Operating Expenses
Other Operating Expense Adjustments
Interest Expense o Existing Debt
o Project Debt
Depreciation and Amortization
Ranges from 0% for overhead departments to 50% for certain ancillary and support departments Additional adjustments totalling approximately $3.2M were made to reduce Pharmacy and other operating expenses and UCHS overhead allocations to reflect specific services at UC FMF and a smaller facility 4.8% allocation of the following UCHS debt:
- 5.76% interest on $55.3M 2008C Series bonds - 5.76% interest on $118.5M 2011 B&C Series
bonds - 3.6% interest on $50.0M 2011A Series bonds
4.5% interest on $51.2M bonds over 30 years Average life of 26 years on $51.2M of construction project expenditures and 10 years on routine capital expenditures
7) Routine Capital Expenditures $0.3M in FY2022, growing to $1.2M in FY2021 and $2.4M in FY2024
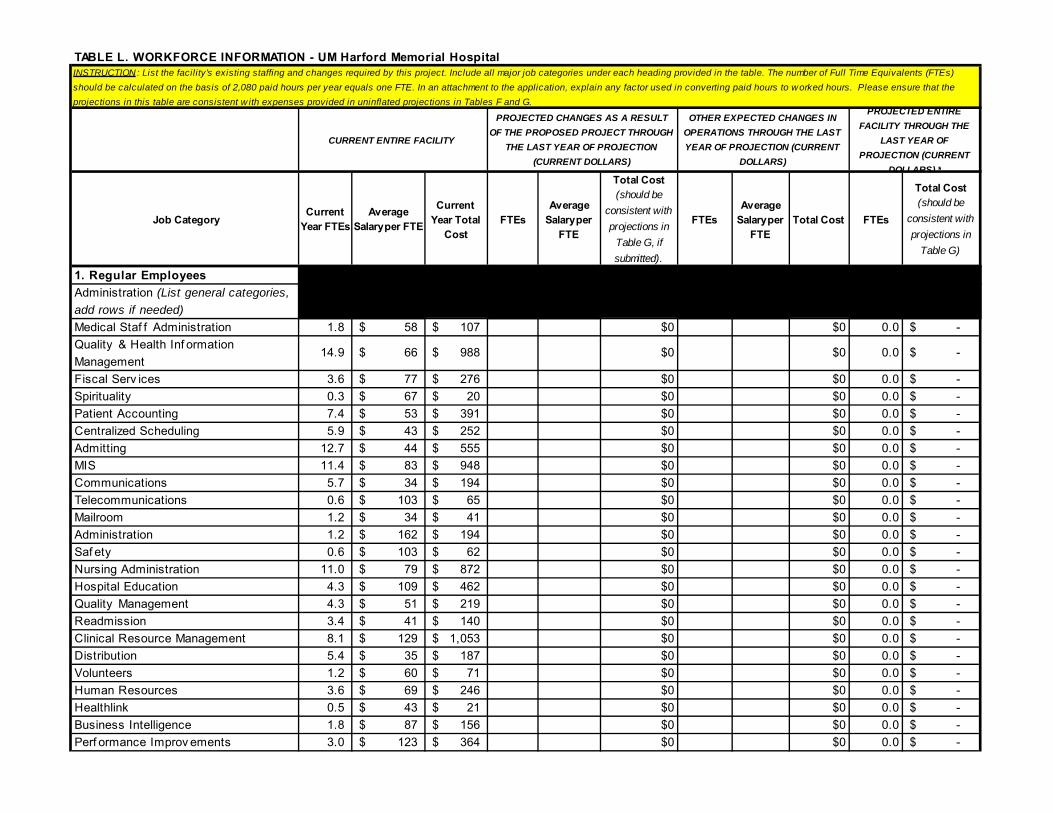
Job CategoryCurrent
Year FTEsAverage
Salary per FTE
Current Year Total
CostFTEs
Average Salary per
FTE
Total Cost (should be
consistent with projections in
Table G, if submitted).
FTEsAverage
Salary per FTE
Total Cost FTEs
Total Cost (should be
consistent with projections in
Table G)
1. Regular EmployeesAdministration (List general categories, add rows if needed)Medical Staf f Administration 1.8 58$ 107$ $0 $0 0.0 -$ Quality & Health Inf ormation Management
14.9 66$ 988$ $0 $0 0.0 -$
Fiscal Serv ices 3.6 77$ 276$ $0 $0 0.0 -$ Spirituality 0.3 67$ 20$ $0 $0 0.0 -$ Patient Accounting 7.4 53$ 391$ $0 $0 0.0 -$ Centralized Scheduling 5.9 43$ 252$ $0 $0 0.0 -$ Admitting 12.7 44$ 555$ $0 $0 0.0 -$ MIS 11.4 83$ 948$ $0 $0 0.0 -$ Communications 5.7 34$ 194$ $0 $0 0.0 -$ Telecommunications 0.6 103$ 65$ $0 $0 0.0 -$ Mailroom 1.2 34$ 41$ $0 $0 0.0 -$ Administration 1.2 162$ 194$ $0 $0 0.0 -$ Saf ety 0.6 103$ 62$ $0 $0 0.0 -$ Nursing Administration 11.0 79$ 872$ $0 $0 0.0 -$ Hospital Education 4.3 109$ 462$ $0 $0 0.0 -$ Quality Management 4.3 51$ 219$ $0 $0 0.0 -$ Readmission 3.4 41$ 140$ $0 $0 0.0 -$ Clinical Resource Management 8.1 129$ 1,053$ $0 $0 0.0 -$ Distribution 5.4 35$ 187$ $0 $0 0.0 -$ Volunteers 1.2 60$ 71$ $0 $0 0.0 -$ Human Resources 3.6 69$ 246$ $0 $0 0.0 -$ Healthlink 0.5 43$ 21$ $0 $0 0.0 -$ Business Intelligence 1.8 87$ 156$ $0 $0 0.0 -$ Perf ormance Improv ements 3.0 123$ 364$ $0 $0 0.0 -$
TABLE L. WORKFORCE INFORMATION - UM Harford Memorial Hospital INSTRUCTION: List the facility's existing staffing and changes required by this project. Include all major job categories under each heading provided in the table. The number of Full Time Equivalents (FTEs) should be calculated on the basis of 2,080 paid hours per year equals one FTE. In an attachment to the application, explain any factor used in converting paid hours to worked hours. Please ensure that the projections in this table are consistent w ith expenses provided in uninflated projections in Tables F and G.
CURRENT ENTIRE FACILITY
PROJECTED CHANGES AS A RESULT OF THE PROPOSED PROJECT THROUGH
THE LAST YEAR OF PROJECTION (CURRENT DOLLARS)
OTHER EXPECTED CHANGES IN OPERATIONS THROUGH THE LAST YEAR OF PROJECTION (CURRENT
DOLLARS)
PROJECTED ENTIRE FACILITY THROUGH THE
LAST YEAR OF PROJECTION (CURRENT
DOLLARS) *

TABLE L. WORKFORCE INFORMATION - UM Harford Memorial Hospital HC Epidemiology & Inf ection Control 1.1 85$ 94$ $0 $0 0.0 -$ Guest Serv ices 1.0 60$ 60$ $0 $0 0.0 -$ Purchasing 2.2 64$ 140$ $0 $0 0.0 -$ Risk Management 1.2 77$ 92$ $0 $0 0.0 -$ General Hospital (1.6) 115$ (187)$ $0 $0 0.0 -$
Total Administration 117.6 8,085$ $0 $0 0.0 -$ Direct Care Staf f (List general categories, add rows if needed)3 South Tele 44.1 58$ 2,571$ $0 $0 0.0 -$ ICU and CCU 38.3 76$ 2,898$ $0 $0 0.0 -$ Behav ioral Health 45.0 62$ 2,784$ $0 $0 0.0 -$ Outpatient Psy chiatric Clinic 11.7 66$ 773$ $0 $0 0.0 -$ Regional BHU Of f ice 2.0 87$ 174$ $0 $0 0.0 -$ Intensiv e Outpatient Psy chiatry 7.8 68$ 532$ $0 $0 0.0 -$ Emergency Department 53.5 76$ 4,062$ $0 $0 0.0 -$ Med/Surg 4th Tower 53.2 56$ 3,002$ $0 $0 0.0 -$ Sleep Disorder Center 4.7 52$ 243$ $0 $0 0.0 -$ Operating Room 12.2 85$ 1,038$ $0 $0 0.0 -$ Anesthesia 1.0 53$ 53$ $0 $0 0.0 -$ PACU 9.9 92$ 916$ $0 $0 0.0 -$ Bariatric 4.4 66$ 289$ $0 $0 0.0 -$ Central Supply 2.1 52$ 110$ $0 $0 0.0 -$ IV Therapy 3.1 62$ 191$ $0 $0 0.0 -$ Pharmacy 15.6 88$ 1,371$ $0 $0 0.0 -$ Anticoag Clinic 1.5 137$ 203$ $0 $0 0.0 -$ Respiratory Therapy 10.5 83$ 873$ $0 $0 0.0 -$ Speech Therapy 1.0 93$ 96$ $0 $0 0.0 -$ Phy sical Therapy 4.5 98$ 443$ $0 $0 0.0 -$ Occupational Therapy 2.3 96$ 222$ $0 $0 0.0 -$ Radiology 17.9 67$ 1,209$ $0 $0 0.0 -$ General Ultrasound 2.3 84$ 194$ $0 $0 0.0 -$ Nuclear Medicine 2.0 73$ 145$ $0 $0 0.0 -$ Cat Scan 6.7 89$ 599$ $0 $0 0.0 -$ MRI 2.5 86$ 212$ $0 $0 0.0 -$ Imaging Support RN 0.5 100$ 46$ $0 $0 0.0 -$ Cardiov ascular Institute 2.5 40$ 100$ $0 $0 0.0 -$ Interv entional Angiography 0.3 784$ 227$ $0 $0 0.0 -$ Cardiov ascular Ultrasound 6.9 74$ 510$ $0 $0 0.0 -$ Electroencephalography 1.0 47$ 47$ $0 $0 0.0 -$ Stroke Center 0.6 96$ 54$ $0 $0 0.0 -$
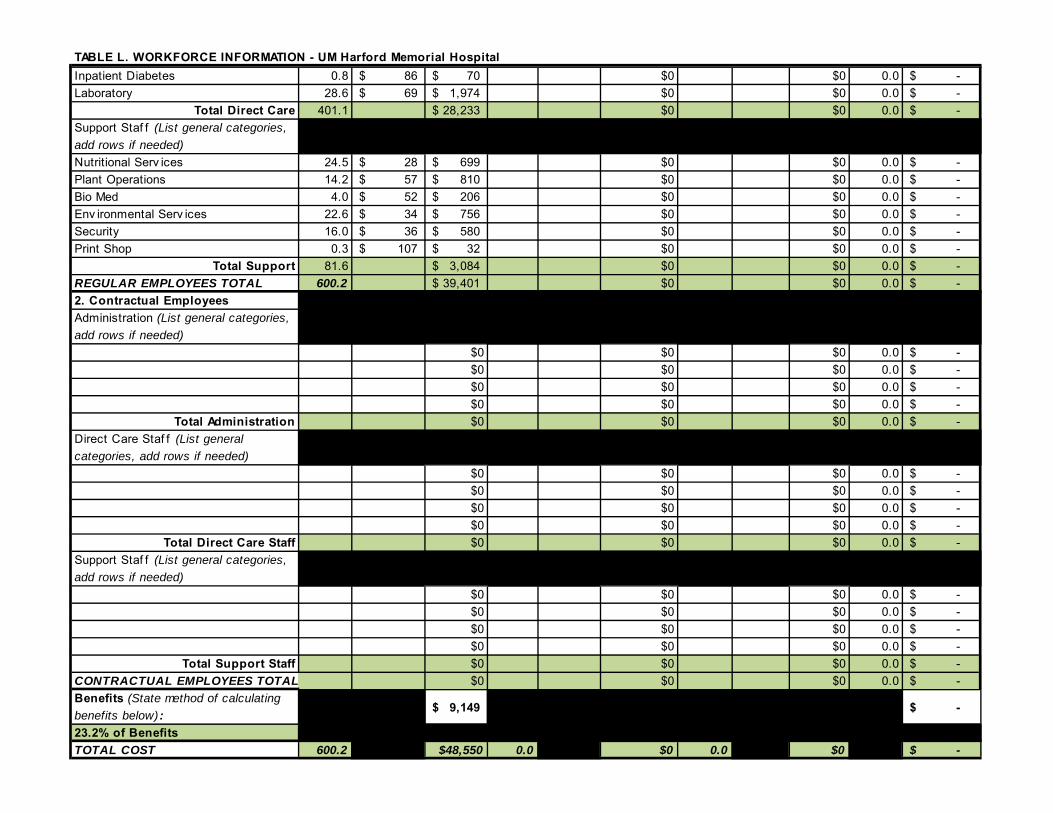
TABLE L. WORKFORCE INFORMATION - UM Harford Memorial Hospital Inpatient Diabetes 0.8 86$ 70$ $0 $0 0.0 -$ Laboratory 28.6 69$ 1,974$ $0 $0 0.0 -$
Total Direct Care 401.1 28,233$ $0 $0 0.0 -$ Support Staf f (List general categories, add rows if needed)Nutritional Serv ices 24.5 28$ 699$ $0 $0 0.0 -$ Plant Operations 14.2 57$ 810$ $0 $0 0.0 -$ Bio Med 4.0 52$ 206$ $0 $0 0.0 -$ Env ironmental Serv ices 22.6 34$ 756$ $0 $0 0.0 -$ Security 16.0 36$ 580$ $0 $0 0.0 -$ Print Shop 0.3 107$ 32$ $0 $0 0.0 -$
Total Support 81.6 3,084$ $0 $0 0.0 -$ REGULAR EMPLOYEES TOTAL 600.2 39,401$ $0 $0 0.0 -$ 2. Contractual EmployeesAdministration (List general categories, add rows if needed)
$0 $0 $0 0.0 -$ $0 $0 $0 0.0 -$ $0 $0 $0 0.0 -$ $0 $0 $0 0.0 -$
Total Administration $0 $0 $0 0.0 -$ Direct Care Staf f (List general categories, add rows if needed)
$0 $0 $0 0.0 -$ $0 $0 $0 0.0 -$ $0 $0 $0 0.0 -$ $0 $0 $0 0.0 -$
Total Direct Care Staff $0 $0 $0 0.0 -$ Support Staf f (List general categories, add rows if needed)
$0 $0 $0 0.0 -$ $0 $0 $0 0.0 -$ $0 $0 $0 0.0 -$ $0 $0 $0 0.0 -$
Total Support Staff $0 $0 $0 0.0 -$ CONTRACTUAL EMPLOYEES TOTAL $0 $0 $0 0.0 -$ Benefits (State method of calculating benefits below) : 9,149$ -$
23.2% of BenefitsTOTAL COST 600.2 $48,550 0.0 $0 0.0 $0 -$
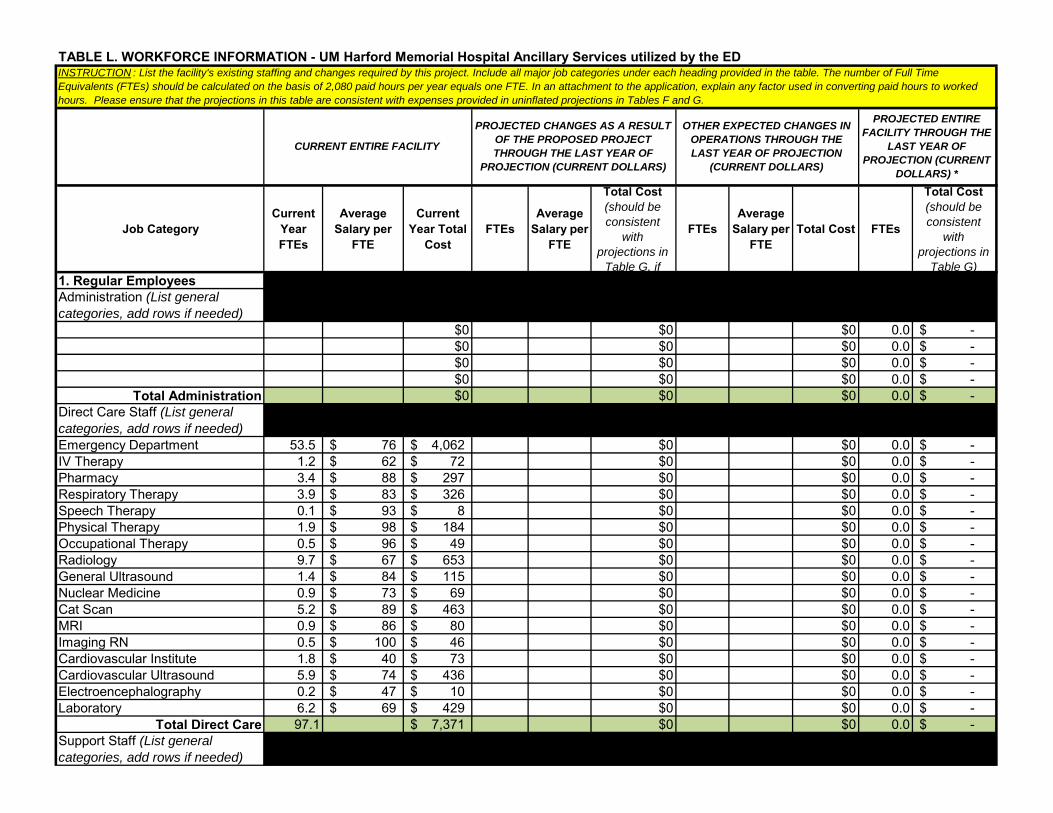
Job CategoryCurrent
Year FTEs
Average Salary per
FTE
Current Year Total
CostFTEs
Average Salary per
FTE
Total Cost (should be consistent
with projections in
Table G, if
FTEsAverage
Salary per FTE
Total Cost FTEs
Total Cost (should be consistent
with projections in
Table G)1. Regular EmployeesAdministration (List general categories, add rows if needed)
$0 $0 $0 0.0 -$ $0 $0 $0 0.0 -$ $0 $0 $0 0.0 -$ $0 $0 $0 0.0 -$
Total Administration $0 $0 $0 0.0 -$ Direct Care Staff (List general categories, add rows if needed)Emergency Department 53.5 76$ 4,062$ $0 $0 0.0 -$ IV Therapy 1.2 62$ 72$ $0 $0 0.0 -$ Pharmacy 3.4 88$ 297$ $0 $0 0.0 -$ Respiratory Therapy 3.9 83$ 326$ $0 $0 0.0 -$ Speech Therapy 0.1 93$ 8$ $0 $0 0.0 -$ Physical Therapy 1.9 98$ 184$ $0 $0 0.0 -$ Occupational Therapy 0.5 96$ 49$ $0 $0 0.0 -$ Radiology 9.7 67$ 653$ $0 $0 0.0 -$ General Ultrasound 1.4 84$ 115$ $0 $0 0.0 -$ Nuclear Medicine 0.9 73$ 69$ $0 $0 0.0 -$ Cat Scan 5.2 89$ 463$ $0 $0 0.0 -$ MRI 0.9 86$ 80$ $0 $0 0.0 -$ Imaging RN 0.5 100$ 46$ $0 $0 0.0 -$ Cardiovascular Institute 1.8 40$ 73$ $0 $0 0.0 -$ Cardiovascular Ultrasound 5.9 74$ 436$ $0 $0 0.0 -$ Electroencephalography 0.2 47$ 10$ $0 $0 0.0 -$ Laboratory 6.2 69$ 429$ $0 $0 0.0 -$
Total Direct Care 97.1 7,371$ $0 $0 0.0 -$ Support Staff (List general categories, add rows if needed)
TABLE L. WORKFORCE INFORMATION - UM Harford Memorial Hospital Ancillary Services utilized by the ED INSTRUCTION : List the facility's existing staffing and changes required by this project. Include all major job categories under each heading provided in the table. The number of Full Time Equivalents (FTEs) should be calculated on the basis of 2,080 paid hours per year equals one FTE. In an attachment to the application, explain any factor used in converting paid hours to worked hours. Please ensure that the projections in this table are consistent with expenses provided in uninflated projections in Tables F and G.
CURRENT ENTIRE FACILITY
PROJECTED CHANGES AS A RESULT OF THE PROPOSED PROJECT THROUGH THE LAST YEAR OF
PROJECTION (CURRENT DOLLARS)
OTHER EXPECTED CHANGES IN OPERATIONS THROUGH THE LAST YEAR OF PROJECTION
(CURRENT DOLLARS)
PROJECTED ENTIRE FACILITY THROUGH THE
LAST YEAR OF PROJECTION (CURRENT
DOLLARS) *

TABLE L. WORKFORCE INFORMATION - UM Harford Memorial Hospital Ancillary Services utilized by the ED $0 $0 $0 0.0 -$ $0 $0 $0 0.0 -$ $0 $0 $0 0.0 -$
Total Support $0 $0 $0 0.0 -$ REGULAR EMPLOYEES TOTAL 97.1 7,371$ $0 $0 0.0 -$ 2. Contractual EmployeesAdministration (List general categories, add rows if needed)
$0 $0 $0 0.0 -$ $0 $0 $0 0.0 -$ $0 $0 $0 0.0 -$ $0 $0 $0 0.0 -$
Total Administration $0 $0 $0 0.0 -$ Direct Care Staff (List general categories, add rows if needed)
$0 $0 $0 0.0 -$ $0 $0 $0 0.0 -$ $0 $0 $0 0.0 -$ $0 $0 $0 0.0 -$
Total Direct Care Staff $0 $0 $0 0.0 -$ Support Staff (List general categories, add rows if needed)
$0 $0 $0 0.0 -$ $0 $0 $0 0.0 -$ $0 $0 $0 0.0 -$ $0 $0 $0 0.0 -$
Total Support Staff $0 $0 $0 0.0 -$ CONTRACTUAL EMPLOYEES TOTAL $0 $0 $0 0.0 -$ Benefits (State method of calculating benefits below) : 1,711 -$
23.2% of BenefitsTOTAL COST 0.0 $9,083 0.0 $0 0.0 $0 -$