university of london goldsmiths college department of
TRANSCRIPT

UNIVERSITY OF LONDON
GOLDSMITHS COLLEGE
Department of Computing
B. Sc. Examination 2016-17
IS51009CMachine Learning
Duration: 2 hours 15 minutes
Date and time:
This paper is in two parts: part A and part B. You should answer ALL questions frompart A and TWO questions from part B. Part A carries 40 marks, and each questionfrom part B carries 30 marks. The marks for each part of a question are indicated atthe end of the part in [.] brackets.
There are 100 marks available on this paper.
THIS PAPER MUST NOT BE REMOVEDFROM THE EXAMINATION ROOM
IS51009C 2016-17 page 1 of 12 TURN OVER

Part AAnswer all questions. Each question has only one correct
answer.
IS51009C 2016-17 page 2 of 12

Question 1 General Questions
(a) Which of the following constitutes a Machine Learning task
i. Supervised Learning
ii. Unsupervised Learning
iii. Both the above
iv. None of the above.
[3]
(b) You are given a problem where the output variable y consists of a range of realvalues, i.e. for every data-point i in the training data, the corresponding yi valueis a real number (e.g., y1 = 1.5, y2 = 2.3, y3 = 3.4, ...). Which of the followingwould be most applicable?
i. Regression
ii. Classification
iii. Any type of supervised learning
iv. Any type of unsupervised learning
[3]
(c) When applying nested cross-validation, the entire data-set is split to...
i. a training and testing set
ii. a training and validation set
iii. a training, testing and validation set
iv. None of the above
[3]
IS51009C 2016-17 page 3 of 12 TURN OVER
Question 2
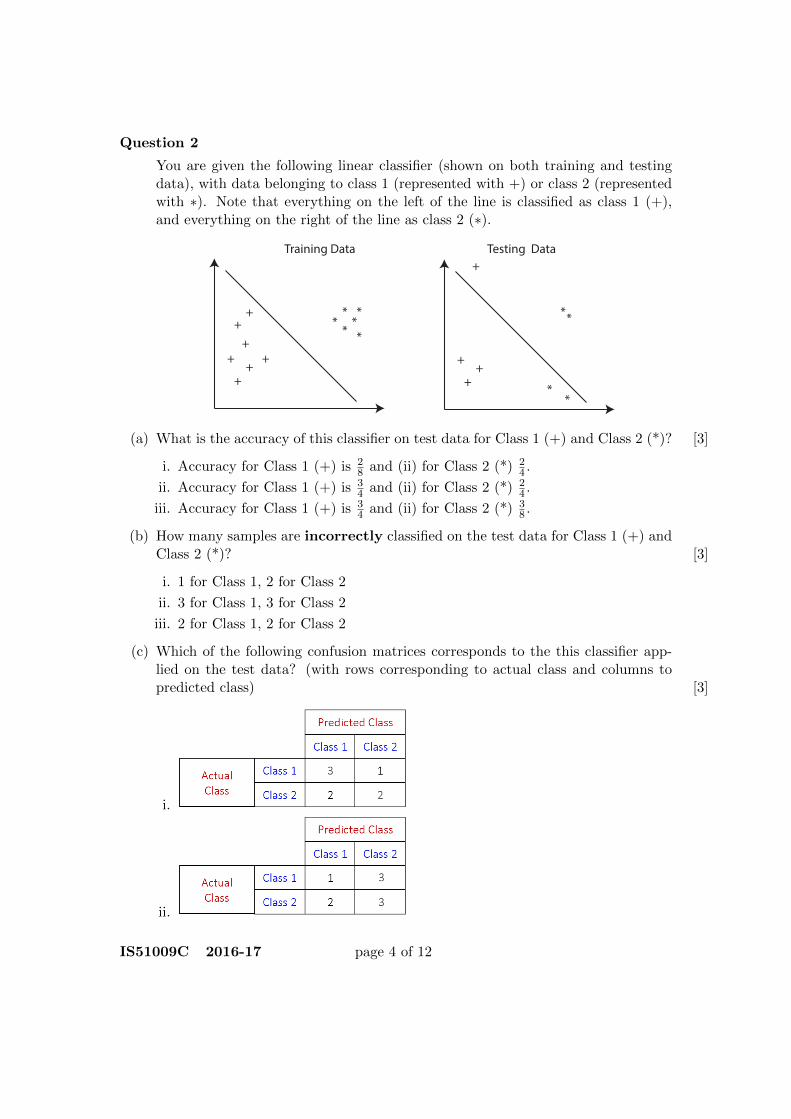
You are given the following linear classifier (shown on both training and testingdata), with data belonging to class 1 (represented with +) or class 2 (representedwith ∗). Note that everything on the left of the line is classified as class 1 (+),and everything on the right of the line as class 2 (∗).
+
++
**
* *
+
++
+*
*
+
++
*
Training Data Testing Data
*
*
+
*
(a) What is the accuracy of this classifier on test data for Class 1 (+) and Class 2 (*)? [3]
i. Accuracy for Class 1 (+) is 28 and (ii) for Class 2 (*) 2
4 .
ii. Accuracy for Class 1 (+) is 34 and (ii) for Class 2 (*) 2
4 .
iii. Accuracy for Class 1 (+) is 34 and (ii) for Class 2 (*) 3
8 .
(b) How many samples are incorrectly classified on the test data for Class 1 (+) andClass 2 (*)? [3]
i. 1 for Class 1, 2 for Class 2
ii. 3 for Class 1, 3 for Class 2
iii. 2 for Class 1, 2 for Class 2
(c) Which of the following confusion matrices corresponds to the this classifier app-lied on the test data? (with rows corresponding to actual class and columns topredicted class) [3]
i.
ii.
IS51009C 2016-17 page 4 of 12

iii.
Question 3
You are given the 2D data illustrated below:
+
++
**
* *
+
+
+
+
*
*+ Class 1* Class 2
***
(a) Which of the following is incorrect: [3]
i. The data is linearly separable (can be separated by drawing a line)
ii. The data is not linearly separable
iii. There are two classes in the dataset
(b) To correctly classify these data, we can: [4]
i. Use a more complex boundary than a line to separate the data points
ii. Project the points onto a higher dimensional space
iii. Any of the above
iv. None of the above
IS51009C 2016-17 page 5 of 12 TURN OVER

Question 4 Given the following artificial neural network.
(a) How many hidden layers does it have? [3]
i. 3
ii. 4
iii. 1
iv. 2
(b) There is a bias in the network. [3]
i. True
ii. False
iii. We do not have enough information in the diagram.
(c) Which of the following algorithms is used to fit the neural network given? [3]
i. K-means
ii. Perceptron
iii. Backpropagation
iv. Nearest Neighbour
Question 5 Overfitting
(a) Suppose we are doing linear regression and we want to make sure we are notoverfitting. We use regularization in order to do this, however, our regularizationparameter is too large. What will happen? [3]
i. We will underfit the data
ii. We will end up with a low bias
iii. We will end up with a high variance
iv. We will overfit the data
IS51009C 2016-17 page 6 of 12

(b) How can we determine the optimal regularization parameter (λ) for linear regres-sion? [3]
i. There is no need to optimize the regularization parameter λ for linear regres-sion.
ii. By plotting a bias - variance curve over various λ’s.
iii. By plotting a bias - variance curve over various iterations of the gradient descentalgorithm.
iv. By plotting the cost function, J over various λ’s.
IS51009C 2016-17 page 7 of 12 TURN OVER

Part B
IS51009C 2016-17 page 8 of 12
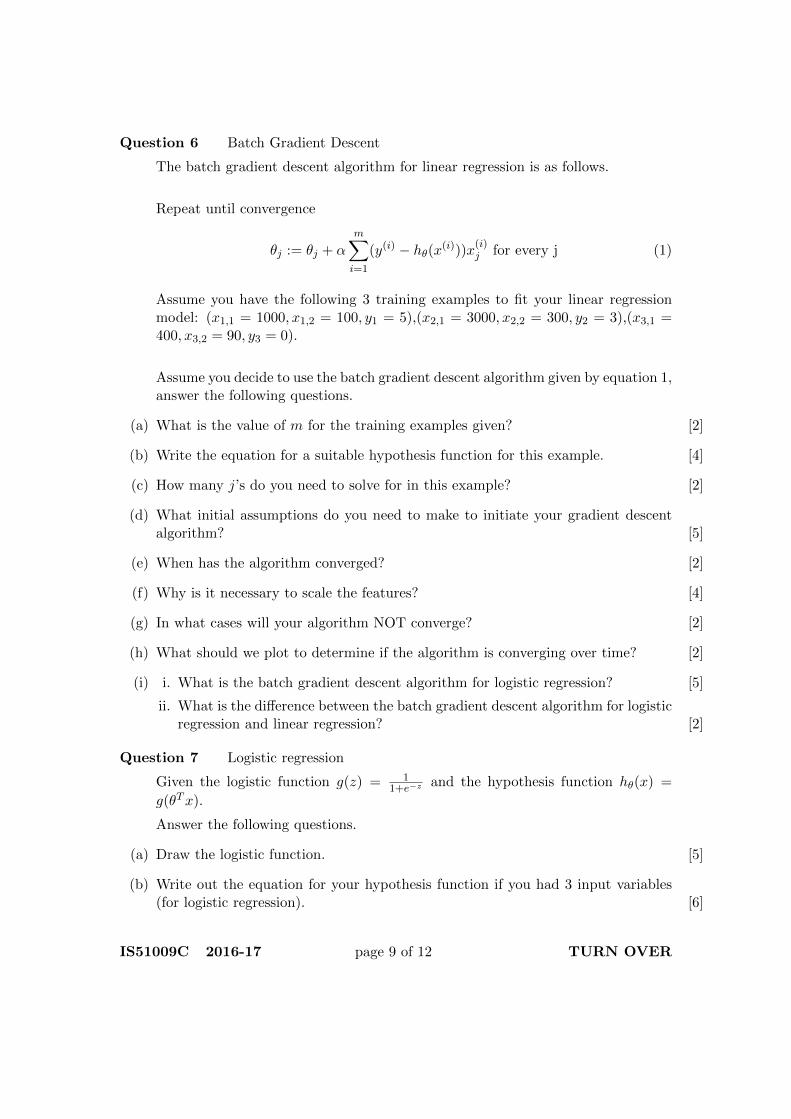
Question 6 Batch Gradient Descent
The batch gradient descent algorithm for linear regression is as follows.
Repeat until convergence
θj := θj + αm∑i=1
(y(i) − hθ(x(i)))x(i)j for every j (1)
Assume you have the following 3 training examples to fit your linear regressionmodel: (x1,1 = 1000, x1,2 = 100, y1 = 5),(x2,1 = 3000, x2,2 = 300, y2 = 3),(x3,1 =400, x3,2 = 90, y3 = 0).
Assume you decide to use the batch gradient descent algorithm given by equation 1,answer the following questions.
(a) What is the value of m for the training examples given? [2]
(b) Write the equation for a suitable hypothesis function for this example. [4]
(c) How many j’s do you need to solve for in this example? [2]
(d) What initial assumptions do you need to make to initiate your gradient descentalgorithm? [5]
(e) When has the algorithm converged? [2]
(f) Why is it necessary to scale the features? [4]
(g) In what cases will your algorithm NOT converge? [2]
(h) What should we plot to determine if the algorithm is converging over time? [2]
(i) i. What is the batch gradient descent algorithm for logistic regression? [5]
ii. What is the difference between the batch gradient descent algorithm for logisticregression and linear regression? [2]
Question 7 Logistic regression
Given the logistic function g(z) = 11+e−z and the hypothesis function hθ(x) =
g(θTx).
Answer the following questions.
(a) Draw the logistic function. [5]
(b) Write out the equation for your hypothesis function if you had 3 input variables(for logistic regression). [6]
IS51009C 2016-17 page 9 of 12 TURN OVER

(c) Given you have 3 input variables for your logistic regression model, how manyequations will you need to solve using gradient descent? [2]
(d) Assume you have the following dataset.
hrs studying hrs commuting hrs working pass
200 200 30 150 500 16 150 89 120 0
Scale the ”hrs studying” input features using the scaling equation Xi = Xi−µiSi
. [6]
(e) Assume the output of your hypothesis function h = 0.51. What will be the finaloutput of your logistic regression model? [4]
(f) Assume you have fit your logistic regression model to a hypothesis with a polyno-mial of order 10 and you are getting J = 0. You can assume the model is being”overfit”.
i. Why is it not a good idea to overfit the model to the data? [4]
ii. How does regularization address the issue of overfitting? [3]
Question 8
(a) Assume we are given the following 1 dimensional data x = [3, 4, 5, 6, 7] (i.e., x1 =3, x2 = 4, x3 = 5, x4 = 6, x5 = 7, where N = 5)
i. Estimate the mean (x̄ = 1N
∑Ni=1 xi) and variance of x (by using var(x) =
1N
∑Ni=1(xi − x̄)2) [3]
ii. Suggest one or more elements that could be added to x in such way that themean remains the same and the variance decreases. [3]
iii. Suggest one or more elements that could be added to x in such way that themean remains the same and the variance increases. [3]
(b) You are given the following data, consisting of 2D features with T samples (i.e.,data matrix X ∈ R2×T )
IS51009C 2016-17 page 10 of 12

0 2 4 6 8 10 12 14-1
-0.8
-0.6
-0.4
-0.2
0
0.2
0.4
0.6
0.8
1Feature 1 = f(x)Feature 2 = -0.5*f(x)
i. If we estimate the covariance of feature 1 to feature 2, will it be positive,negative or zero? [3]
ii. If we apply PCA on this data, how many components would we need to fullydescribe the data? [3]
(c) Assume that are given a linear system of the form
xt+1 = Axt
where the matrix A is defined as
A =
(0.8 0.50.2 0.5
)i. Starting with x0 = [0, 1]T , multiply with matrix A to arrive at x1 = Ax0.
Write down the result x1. What do you observe with respect to the values ofx0? Explain your answer. [3]
ii. Assume a general linear system of the form xt+1 = Axt. How can we tell ifthe system has a steady state? Explain your answer. [3]
iii. Can you tell if the linear system above has a steady state by just looking atA? Explain why. [3]
(d) Principal Component Analysis (PCA) is a method that maximizes the covarianceof our data in a latent space Y, with Y = WTX. We denote the covariance matrixas S, i.e. S = covariance(X).
i. Assume that you are given the following optimization problem. Which valueis assigned to W? Explain your answer.
arg maxW
cov(Y) = arg maxW
WTSW
IS51009C 2016-17 page 11 of 12 TURN OVER

[3]
ii. How would you augment the problem mentioned above in order to get a rea-sonable solution? Explain your answer. [3]
IS51009C 2016-17 page 12 of 12 END OF EXAMINATION