university of kwazulu-natal the impact of motivation on
TRANSCRIPT

i
UNIVERSITY OF KWAZULU-NATAL
The impact of motivation on job satisfaction amongst selected employees at
eThekwini Electricity
By
Jarred Irwin Paulsen
Student Number: 214579163
A dissertation submitted in partial fulfillment of the requirements for the degree
of
Master of Business Administration
College of Law and Management Studies
Graduate School of Business & Leadership
Supervisor: Dr. LN Govender
2016

ii
DECLARATION I, Jarred Irwin Paulsen declare that:
The research reported in this dissertation, except where otherwise indicated, is my original work.
This dissertation has not been submitted for any degree or examination at any other university.
This dissertation does not contain other persons’ data, pictures, graphs or other information, unless specifically acknowledged as being sourced from other person
This dissertation does not contain other persons’ writing, unless specifically acknowledged as being sourced from other researchers. Where other written sources have been quoted, then:
a) Their words have been re‐written but the general information attributed to them has been referenced;
b) Where their exact words have been used, their writing has been placed inside quotation marks, and referenced.
c) Where I have reproduced a publication of which I am author, co‐author or editor, I have indicated in detail which part of the publication was actually written by myself alone and have fully referenced such publications.
d) This thesis does not contain text, graphics or tables copied and pasted from
the Internet, unless specifically acknowledged, and the source being detailed in the thesis and in the reference sections.
Signed:

iii
ACKNOWLEDGEMENTS
I acknowledge the following individuals, who provided me with support and
encouragement during this MBA journey
Jerusha for her love, patience and kindness she has shown me over the
years.
My family for all the love and support they have given me during this
journey
MBA group mates for all the hard work and long hours we put in.
Colleagues at work for their patience and support during this period
Vernon and Cliff for enjoyable times that we had during class.
Glen Lewis for his patience and support.
All the staff at eThekwni Electricity who took part in this study.
My supervisor Dr Logan Govender for the advice and support he
provided.

iv
ABSTRACT Motivation and job satisfaction were the focus of this study that aims to assist the
eThekwini Electricity Department in South Africa, with emphasis on engineers,
technologists and technicians. The relationship among these two factors determine
levels of employee productivity, proposes solutions on how to enhance it and help the
municipality gain a corporate advantage over their competition. The objectives were set
to grasp an understanding on the factors that motivate job satisfaction, the impact of
motivation and the overall level job satisfaction as well as to determine factors that
influence job dissatisfaction. Concepts of motivation including the definitions and
theories such as Content and Process, McClelland’s Theory of Needs, Alderfers ERG,
X and Y, Vroom’s Expectancy and Self-efficacy was extrapolated from literature.
Maslow’s Hierarchy of Needs and Herzberg Two Factor Theory gave rise to the
research instrument used in the study which was quantitative in nature. A sample size
of 117 employees was asked to provide their views on a Likert-scale questionnaire.
The study found that more than 80% of the respondents were male and more than 60%
were between the ages of 25-34. The results from the questions addressed revealed
that only growth and advancement was a factor that did not motivate job satisfaction.
Furthermore, higher order needs that the employees had were deemed to be already
satisfied or in the process of being satisfied. The future recommendations would be to
include a broader professional sample, compare municipal organizations to corporate
ones and factor in employee motivational triggers in the hope that more specific details
will be revealed that will allow organizations to experience higher levels of success
while fulfilling the job expectations of each employee.

v
Contents DECLARATION ............................................................................................................ ii
ACKNOWLEDGEMENTS............................................................................................ iii
ABSTRACT ................................................................................................................. iv
Contents ....................................................................................................................... v
LIST OF FIGURES ....................................................................................................... x
LIST OF TABLES ........................................................................................................ xi
CHAPTER ONE .......................................................................................................... 1
INTRODUCTION ......................................................................................................... 1
1.1 Introduction .................................................................................................... 1
1.2 Motivation for the Study .................................................................................. 1
1.3 Focus of the Study ......................................................................................... 3
1.4 Problem Statement......................................................................................... 3
1.5 Objectives ...................................................................................................... 4
1.6 Research Questions ....................................................................................... 4
1.7 Limitations of this Study ................................................................................. 4
1.8 Outline of the study ........................................................................................ 5
1.9 Summary ........................................................................................................ 6
CHAPTER TWO .......................................................................................................... 7
LITERATURE REVIEW ON MOTIVATION AND JOB SATISFACTION ...................... 7
2.1 Introduction .................................................................................................... 7
2.2 Concept of “Motivation” .................................................................................. 7
2.2.1 Types of Motivation .................................................................................. 8
2.2.1.1 Intrinsic Motivation ............................................................................ 8
2.2.1.2 Extrinsic Motivation ........................................................................... 8
2.3 Content and Process Theory of Motivation .................................................... 9
2.3.1 Content Theory ........................................................................................ 9
2.3.2 Process Theory ........................................................................................ 9
2.4 Motivational Theories ..................................................................................... 9
2.4.1 Maslow’s Hierarchy of Needs Theory .................................................... 10
2.4.2 Herzberg’s Two Factor Theory .............................................................. 12
2.4.3 McClelland’s Theory of Needs ............................................................... 15
2.4.4 Alderfer’s ERG Theory ........................................................................... 16
2.4.5 Theory X and Theory Y of Motivation .................................................... 17

vi
2.4.5.1 Theory X.......................................................................................... 18
2.4.5.2 Theory Y.......................................................................................... 19
2.4.6 Vroom's Expectancy Theory .................................................................. 19
2.4.7 Self-Efficacy Theory ............................................................................... 23
2.4.8 Adam’s Equity Theory ............................................................................ 24
2.5 Definition of Job Satisfaction ........................................................................ 26
2.5.1 Factors of Job Satisfaction .................................................................... 26
2.5.1.1 Renumeration .................................................................................. 27
2.5.1.2 Promotion ........................................................................................ 27
2.5.1.3 Inter-Personal Relationships ........................................................... 27
2.5.1.4 Work Environment ........................................................................... 28
2.5.1.5 Work Itself ....................................................................................... 28
2.5.2 Job Characteristic Model ....................................................................... 29
2.5.2.1 Skills Variety .................................................................................... 30
2.5.2.2 Task Identity .................................................................................... 30
2.5.2.3 Task Significance ............................................................................ 30
2.5.2.4 Autonomy ........................................................................................ 30
2.5.2.5 Job feedback ................................................................................... 31
2.5.2.6 Motivational Potential Score ............................................................ 31
2.5.3 Outcomes of Job Satisfaction ................................................................ 32
2.5.3.1 Employee Turnover ......................................................................... 32
2.5.3.2 Absenteeism ................................................................................... 32
2.5.3.3 Performance .................................................................................... 33
2.6 Summary ...................................................................................................... 33
CHAPTER THREE .................................................................................................... 35
RESEARCH METHODOLOGY ................................................................................. 35
3.1 Introduction .................................................................................................. 35
3.2 Aim ............................................................................................................... 35
3.3 Objectives .................................................................................................... 35
3.4 Focus and Location ...................................................................................... 35
3.5 Research Methodology ................................................................................ 36
3.6 Target Population ......................................................................................... 36
3.7 Sample Size ................................................................................................. 37

vii
3.8 Sample Methods .......................................................................................... 37
3.9 Classification of Data .................................................................................... 40
3.10 Data Collection .......................................................................................... 40
3.11 Questionnaire ............................................................................................ 41
3.12 Likert Scale ............................................................................................... 42
3.13 Pilot Study ................................................................................................. 43
3.14 Data Analysis ............................................................................................ 43
3.15 Descriptive Statistics ................................................................................. 43
3.15.1 Frequency Distribution........................................................................ 43
3.15.2 Measures of central tendency ............................................................ 44
3.15.3 Measure of Dispersion........................................................................ 44
3.16 Inferential Statistics ................................................................................... 45
3.16.1 Correlation .......................................................................................... 45
3.16.2 Multiple Linear Regression ................................................................. 45
3.17 Reliability ................................................................................................... 46
3.18 Validity ...................................................................................................... 47
3.19 Ethics in Research .................................................................................... 48
3.20 Summary ................................................................................................... 48
CHAPTER FOUR ...................................................................................................... 49
PRESENTATION OF RESULTS ............................................................................... 49
4.1 Introduction .................................................................................................. 49
4.2 Descriptive Statistics .................................................................................... 49
4.2.1 Demographical Profile ........................................................................... 49
4.2.1.1 Gender ............................................................................................ 50
4.2.1.2 Age .................................................................................................. 51
4.2.1.3 Race ................................................................................................ 52
4.2.1.4 Job Position ..................................................................................... 53
4.2.1.5 Qualification .................................................................................... 54
4.3 Motivational Factors ..................................................................................... 55
4.3.1 Achievement .......................................................................................... 55
4.3.2 Recognition ............................................................................................ 56
4.3.3 Work Itself .............................................................................................. 57
4.3.4 Responsibility......................................................................................... 58
4.3.5 Growth and Advancement ..................................................................... 59

viii
4.4 Hygiene factors ............................................................................................ 60
4.4.1 Supervisor Relationship ......................................................................... 60
4.4.2 Peer Relationship .................................................................................. 61
4.4.3 Physical Working Conditions ................................................................. 62
4.4.4 Salary Structure ..................................................................................... 63
4.4.5 Job Security ........................................................................................... 64
4.4.6 Company Policy ..................................................................................... 65
4.5 Overall Satisfaction ...................................................................................... 66
4.6 Measure of central tendency and dispersion ................................................ 66
4.6.1 Motivational Factors ............................................................................... 67
4.6.2 Hygiene Factors ..................................................................................... 69
4.6.3 Overall Satisfaction ................................................................................ 71
4.7 Inferential Statistics ...................................................................................... 71
4.7.1 Reliability Analysis ................................................................................. 72
4.7.2 Regression Analysis .............................................................................. 72
4.7.3 Correlation Analysis ............................................................................... 74
4.8 Summary ...................................................................................................... 76
CHAPTER FIVE ........................................................................................................ 77
DISCUSSION OF RESULTS ..................................................................................... 77
5.1 INTRODUCTION .......................................................................................... 77
5.2 Objective One .............................................................................................. 77
5.2.1 Achievement .......................................................................................... 77
5.2.2 Recognition ............................................................................................ 78
5.2.3 Work Itself .............................................................................................. 79
5.2.4 Responsibility......................................................................................... 80
5.2.5 Growth and Advancement ..................................................................... 80
5.3 Objective Two .............................................................................................. 81
5.3.1 Supervisor Relationship ......................................................................... 81
5.3.2 Peer Relationship .................................................................................. 82
5.3.3 Physical Working Conditions ................................................................. 83
5.3.4 Salary Structure ..................................................................................... 83
5.3.5 Job Security ........................................................................................... 85
5.3.6 Company Policy ..................................................................................... 85
5.4 Objective Three ............................................................................................ 86

ix
5.5 Objective Four .............................................................................................. 87
5.6 Summary ...................................................................................................... 89
CHAPTER SIX .......................................................................................................... 90
RECOMMENDATIONS AND CONCLUSION ............................................................ 90
6.1 Introduction .................................................................................................. 90
6.2 Key Findings ................................................................................................ 90
6.2.1 Objective One ........................................................................................ 90
6.2.2 Objective Two ........................................................................................ 91
6.2.3 Objective Three ..................................................................................... 91
6.2.4 Objective Four ....................................................................................... 91
6.3 Recommendations ....................................................................................... 92
6.3.1 Achievement .......................................................................................... 93
6.3.2 Responsibility......................................................................................... 93
6.3.3 Work Itself .............................................................................................. 94
6.3.4 Recognition ............................................................................................ 94
6.3.5 Growth and Advancement ..................................................................... 94
6.3.6 Peer Relationship .................................................................................. 95
6.3.7 Supervisor Relationship ......................................................................... 95
6.3.8 Physical Working Conditions ................................................................. 96
6.3.9 Salary Structure ..................................................................................... 96
6.4 Future Recommendations ............................................................................ 97
6.5 Summary ...................................................................................................... 98
REFERENCES .......................................................................................................... 99
APPENDIX 1 : INFORMED CONCENT .................................................................. 110
APPENDIX 2 : QUESTIONNAIRE ........................................................................... 111
APPENDIX 3 : ETHICAL CLEARANCE .................................................................. 112
APPENDIX 4 : EDITORS LETTER .......................................................................... 113
APPENDIX 5 : TURNITIN REPORT ........................................................................ 114

x
LIST OF FIGURES
Figure 2.1 Maslow’s Hierarchy of Needs ................................................................... 10
Figure 2.2 Herzberg Two Factor Theory .................................................................. 12
Figure 2.3 Different views between traditional motivation and Herzberg’sTwo Factor
theory. ....................................................................................................................... 13
Figure 2.4 The relationship between Maslow’s and Herzberg’s Theory .................... 14
Figure 2.5 Difference between Theory X and Theory Y ............................................ 18
Figure 2.6 Vrooms Expectancy Theory ..................................................................... 21
Figure 2.7 Ratio and Perception’s for Equity Theory ................................................. 25
Figure 4.1 What is your gender? ............................................................................... 50
Figure 4.2 What is your age? .................................................................................... 51
Figure 4.3 What is your race? ................................................................................... 52
Figure 4.4 What is your current position? .................................................................. 53
Figure 4.5 What is your qualification? ....................................................................... 54
Figure 4.6 Do you feel a sense of achievement on completion of your task? ............ 55
Figure 4.7 Do you receive recognition for the work you perform? ............................. 56
Figure 4.8 Do you find the work meaningful, interesting and challenging? ................ 57
Figure 4.9 You are given complete responsibility for your work? .............................. 58
Figure 4.10 There are opportunities for growth and
advancement in the organisation? ............................................................................ 59
Figure 4.11 I have a good relationship with my supervisor? ...................................... 60
Figure 4.12 I have a good relationship with my peers? ............................................. 61
Figure 4.13 The physical working conditions are safe clean and hygienic? .............. 62
Figure 4.14 I am satisfied with the salary structure? ................................................. 63
Figure 4.15 My organisation provides job security? .................................................. 64
Figure 4.16 The company policy is fair and clear? .................................................... 65
Figure 4.17 Overall I am satisfied with my job? ......................................................... 66

xi
LIST OF TABLES
Table 2.1 Combinations of valence, expectancy and instrumentality ........................ 22
Table 3.1 Measure of strength for Regression Analysis ............................................ 46
Table 3.2 Cronbach Alpha coefficient size ................................................................ 47
Table 4.1 Mean, Standard Deviation, Minimum and Maximum Scores for Motivational
Factors. ..................................................................................................................... 67
Table 4.2 Mean, Standard Deviation, Minimum and Maximum Scores for Hygiene
Factors. ..................................................................................................................... 69
Table 4.3 Mean, Standard Deviation, Minimum and Maximum Scores for Overall
satisfaction. ............................................................................................................... 71
Table 4.4 Reliability Analysis ..................................................................................... 72
Table 4.5 Multiple Regression Analysis between factors of motivation and job
satisfaction. ............................................................................................................... 72
Table 4.6 ANOVA results from the Regression Analysis. .......................................... 73
Table 4.7 Pearson’s Correlation Analysis between the factors of motivation and Overall
Job Satisfaction. ........................................................................................................ 74

1
CHAPTER ONE
INTRODUCTION
1.1 Introduction
Job satisfaction and employee motivation has undergone a rapid change each time an
organisation experiences a paradigm shift with regard to employee motivation and job
satisfaction (Sattar, 2014). These sudden and unexpected changes leave employees
either satisfied or dissatisfied (Rodrigues and Carlos, 2010). This impacts the
organisation in either a positive or negative way. The primary reason for this research
was to investigate the impact of motivation on job satisfaction amongst selected
employees, who are professionally skilled, this includes engineers, technologists and
technicians at the eThekwini Electricity Department. This chapter presents the motivation
for the study, a snap shot of job satisfaction and its associated impact were discussed. A
bird’s eye view was presented when South Africa experienced a skills shortage and the
effect it had on eThekwini Electricity. The problem statement was broadly defined and
describes how motivation impacts on job satisfaction. The benefits and consequences
job satisfaction has on the organisation was discussed.
1.2 Motivation for the Study
Job satisfaction has become a global issue in the private and public sectors for developed
and developing countries (Sattar, 2014).The global village that we live and work in is
continuously plagued with turbulence at every corner from economic meltdowns, natural
disaster and geo-political conflict bringing about unforeseen and unprecedented changes
which has an effect on various organisations in one form or another (Akram, Faheem,
Dost and Abdulla, 2011). Organisational executives tend to take these factors into
consideration when carrying out their strategic planning and formulate the necessary
measures that need to be put in place when rocked by the turbulence of these forces
(Nezhad and Ali, 2011).

2
More often than not a critical factor that is over looked within an organisation is human
capital which is regarded as most important asset of an organisation. Employee
satisfaction offers a strategic advantage to an organisation. But the concept of job
satisfaction is a two sided coin, either positive or negative which impact an organisation.
Westover (2012) highlighted both the positive and negative impacts that are associated
with job satisfaction and dissatisfaction. These impacts are as follows:
Positive impacts are:
Greater levels of Productivity
Low employee turnover
Low rate of absenteeism and
High staff morale
Negative impacts are:
Jobs related stress
Poor productivity
Low staff morale
High employee turnover
High rate of absenteeism.
According to Thompson and Lane (2014) employers need to ensure that they maintain a
high level of job satisfaction amongst their employees. Thompson and Lane (2014) states
that the primary element for staff turn-over in an organisation is job satisfaction.
Organisations have finally come to the realisation that job satisfaction is an important
factor contributing to the wellbeing of their employees which contributes to organisation’s
success and is of the utmost importance that employees are satisfied at work ( Menezes,
2012).
The purpose of the study was to determine how motivation impacts on job satisfaction of
professionally skilled employees, this includes engineers, technologists and technicians

3
within the eThekwini Electricity Department. By establishing these factors of motivation
and the impact it has upon job satisfaction, management can use the findings of the study
when implementing policies and procedures to enhance the level of employee motivation
and job satisfaction.
1.3 Focus of the Study
EThekwini Electricity had undergone difficult circumstances previously when South Africa
experienced a mass brain drain, this had an effect on the organisation. Employees with
specialist technical skills migrated to foreign countries which led to a staff shortage
(eThekwini, 2008/2009). This resulted in the existing employees being overworked and
under immense work related pressure, which lead to low levels of motivation and job
satisfaction amongst staff. This resulted in employees being dissatisfied and the
organisation having a high employee turnover.
As an antidote to the high employee turnover, eThekwini Electricity initiated an intensive
recruitment drive aimed at filling these vacant positions which were regarded as scarce
skills (eThekwini, 2008/2009). This led to the recruitment of graduates from Universities,
Universities of technology and FET colleges, who were to be trained by the organisation
to fill in the vacant post of engineers, technologists, technicians and electricians.
1.4 Problem Statement
eThekwini Electricity having invested valuable resources to reach a full staff complement.
By having a full staff complement, eThekwini Electricity could enhance their levels of
employee productivity, operational performance and gain a competitive advantage over
other municipal distributors of electricity. Having a skilled workforce along with checks
and balances in place to retain a skilled workforce does not automatically guarantee
organisational effectiveness, efficiency and a competitive advantage. Management needs
to determine if their employees are motivated and satisfied and how it impacts on the
organisation. Positive levels of motivation and job satisfaction will reap positive results
and vice versa for negative levels of motivation and job satisfaction. The failure of the
organisation to implement effective strategies that incorporates both employee motivation

4
and job satisfaction can result in repercussions. It is extremely vital for the organisation
to establish the factors that motivate their staff and determine whether employees are
satisfied or dissatisfied at work.
1.5 Objectives
The objectives of this study are to determine the following with regards to the relationship
between motivation and job satisfaction amongst employees:
Objective 1: To determine the factors that motivate job satisfaction.
Objective 2: To establish the factors that influence job dissatisfaction.
Objective 3: To ascertain the overall level of job satisfaction.
Objective 4: To evaluate the impact motivation has on job satisfaction.
1.6 Research Questions
The following key research questions were used in reaching the objectives of the study:
What are the factors that motivate job satisfaction?
What are the factors that influence job dissatisfaction?
What is the overall level of job satisfaction?
What impact does motivation have on job satisfaction?
1.7 Limitations of this Study
The limitations of the research study are as follows:
The study is limited to engineers, technologists and technicians that are
employed within the eThekwini’s electricity department.
Owing to time constraints artisans have been excluded from the study.
Only permanent employees participated in the study. Contractors, consultants
and trainees have been excluded from the study.
Managers who have skilled backgrounds have been excluded from the study.

5
Human resources, administration and finance staff will be excluded in the
study.
Web links to the online questionnaire proved to be limiting as not all staff had
open access to the internet at work.
1.8 Outline of the study
The study consist of the following chapters
Chapter One – Introduction
This chapter identified the challenges eThekwini Electricity were faced with, the
motivation for the study, the focus of the study, the problem statement, research
objectives, research questions and the limitations of the study.
Chapter Two – Literature review
In this chapter an in-depth literature review of the concepts of motivation and job
satisfaction was undertaken. Academic resources such as peer reviewed academic
journals, books and previous studies was consulted during the literature review. The
literature review further examined the positive and negative effects of job satisfaction on
employees.
Chapter Three – Research methodology
This chapter outlines the steps that were taken in research methodology for this study.
Clear justification was given for the selection of each approach taken in the research
process. The research approach selected, the development and administration of the
questionnaire were discussed. The method of sampling, the population and sample size
was explained. Data collection and data analysis techniques were also included in the
discussion. The testing for the reliability and validity of the questionnaire was also
explained.

6
Chapter Four – Presentation of results
In this chapter the presentation of the results from the questionnaire was presented in the
form of descriptive statistics consisting of graphs and tables, the measures of central
tendency and dispersion. Inferential statistics were used to conduct a reliability analysis,
a multiple regression analysis and correlation analysis between factors of motivation and
job satisfaction.
Chapter Five – Discussion of results
The data analysis conducted in Chapter Four formed the basis for the discussion in this
chapter. This chapter achieved the objectives set out in Chapter One. In addition to the
results obtained from the questionnaire, the theory discussed in Chapter Two and the
finding from previous study conducted on motivation and job satisfaction wasl be used to
support the findings of the current study.
Chapter Six – Recommendation and conclusion
In this chapter the key findings of the study was be discussed. Both conclusions,
recommendations and future recommendation based on the current study was be
explored.
1.9 Summary
This chapter highlighted the following aspects of the study: the motivation of the study,
focus, problem statement, research objectives, research questions and limitations. The
outline of the study for each chapter was presented. The next chapter presents literature
review that was conducted on theories of motivation and job satisfaction.

7
CHAPTER TWO
LITERATURE REVIEW ON MOTIVATION AND JOB SATISFACTION
2.1 Introduction
In this chapter a literature review was conducted with specific focus on the concepts of
motivation, motivational theories as well as the concept of job satisfaction. The outcomes
of job satisfaction and dissatisfaction was be explored. The link between motivation and
job satisfaction was established.
2.2 Concept of “Motivation”
Researchers and academics alike have discussed and conceptualised motivation over
the greater part of the 21st century. No single definition of motivation can encapsulate the
concept of motivation in its totality. An exploration of the different definitions of motivation
will be examined to establish a common ground of what it encompasses which will be
used as a point of reference in the study.
According to Nasri and Charfeddine (2012) motivation can be described as a process that
drives an individual both physiologically and psychologically to pursue their goals which
fulfils both their needs and expectations. Joseph (2015) states that motivation is a driving
force which is placed within an individual that they use in order to accomplish certain
goals to fulfil certain needs or expectation of that individual. Motivation can be described
as a process which internally encourages employees to act in a certain way which leads
to the achievement of their goals and tasks (Sohail, Sadar, Saleem, Ansar and
Azeem,2014). Uzonna (2013) argues that motivation can be viewed as a combination of
an individual’s goals which directs the way in which one would behave in pursuit and
achievement of these goals.
In addition to the above definitions Saleem,Mahmood and Mahmood (2010) defines the
construct of motivation as a process that gives rise, energises and direct as well as
sustains a person’s actions towards the accomplishment of a desired goal.

8
It can be concluded that motivation has a few elements that are common which are the
following: It can be seen as a driving force, can be attributed to the internal workings of
an individual and it energises and gives direction for an individual in achieving their goals.
2.2.1 Types of Motivation The concept of motivation has been treated by theorist as a one-dimensional concept
comprising of three types, intrinsic, extrinsic and amotivational of which intrinsic and
extrinsic motivation are the primary concepts of motivation which has been studied by
academics. (Areepattamannil,Freeman and Klinger , 2011).
2.2.1.1 Intrinsic Motivation According to Ogunnaike,Akinbola and Ojo (2014) intrinsic motivation can be defined as
engaging in an activity or task for its internal satisfaction rather than its external reward.
Areepattamannil, et al (2011) states that intrinsic motivated behaviour is based on the
internal satisfaction rather than the types of reinforcements that are attached with that
activity. Areepattamannil, et al (2011) further states that intrinsically motivated people
engage in tasks and activities freely and remain motivated by the interest and enjoyment
of the task and activity.
2.2.1.2 Extrinsic Motivation Individuals can be motivated by methods such as remuneration, promotion and praise
which are termed as extrinsic motivation as these are seen as external factors of
motivation (Nyarko ,2014). According to Nyarko (2014) extrinsic motivational factors can
have an instantaneous and powerful effect on an individual, however this may not have
a lasting effect on people.

9
2.3 Content and Process Theory of Motivation
Motivational Theory can be divided into two categories, namely content and process
theory which are discussed below. The theories content and process theories that are
discussed in the literature review are critical for the study and relate to key variables of
motivation and job satisfaction.
2.3.1 Content Theory The content theories of motivation makes the assumption that certain factors exist within
an individual that is able to energise, direct and sustain their behaviour, it further identifies
critical elements which are important in motivating people (Nasri and Charfeddine, 2012).
According to Kian,Yusof and Rajah. (2014), content theories concentrate on the internal
factors which energise and direct the behaviour of individuals towards a certain goal. The
content theories of motivation include the following: Maslow’s hierarchy of need,
Alderfer’s ERG Theory, Hertzberg’s Two Factor Theory and McClelland’s Theory of
Needs.
2.3.2 Process Theory Kian, et al. (2014) suggest that process theories of motivation are the opposite of content
theories whereby an individual’s behaviour is driven by their needs; process theory when
applied to a working context, can be viewed as the employees being motivated in their
job by meeting their needs and expectation. The process theories of motivation include
the following: Adam’s equity theory, Vroom’s expectancy theory and Self-efficacy theory.
2.4 Motivational Theories
Motivation can have a significant impact on the behaviour of an individual in both their
personal and work life. Motivational theories have emerged and evolved over the years
from the early theories of motivation such as Maslow’s Needs Theory to more
contemporary theories which have been empirically tested.

10
2.4.1 Maslow’s Hierarchy of Needs Theory Abraham Maslow’s Hierarchy of Needs Theory is a widely known theory on motivation.
He developed this theory in the 1943 (Pulasinghage ,2010). According to Cao,Jisng,Oh,Li
and Liao (2013), Maslow identified that a hierarchy of needs exist within each individual.
Maslow’s hierarchy model consists of five levels of basic human needs arranged in
ascending order. Figure 2.1 illustrates Maslow’s Hierarchy needs arranged in ascending
order on a pyramid structure with the lower order needs (physiological) at the base of the
pyramid and higher order needs (Self-actualisation) at the apex of the pyramid.
Figure 2.1 Maslow’s Hierarchy of Needs
Adapted from Adapted form Jerome (2013, p.41)
Jerome (2013) defines and discusses these five levels of needs as follows.
Physiological – This is a first level of needs. These are the basic needs an
individual will have. This includes the need to satisfy hunger, thirst, shelter, sex
and other physiological needs associated with human needs.

11
Safety – These are second level needs and is concerned with security from both
physical and emotional harm such as: security, law and order and protection from
the natural elements.
Belongingness and love needs – These are third level needs which an individual
has the need to be accepted, have a sense of belongingness, giving and receiving
affection.
Self Esteem – These needs are forth level needs of an individual and comprises
of internal factors such as self-respect, autonomy and achievement. Factors such
as status, recognition and attention are external factors.
Self-actualisation – This fifth level of need addresses an individuals need to
become what he is capable of becoming and realising their personal potential. This
need relates to personal growth and development.
Kaur (2013) highlights the fact that the needs described in Maslow’s Need’s Theory, are
activated in a hierarchical manner from lowest to the highest order. A lower order need
has to be fulfilled before the next order need is activated and the process continues. Kaur
(2013) further explains it is vital in knowing where a person is on the hierarchical structure
of the pyramid in order to motivate them. Maslow has been met with many criticism with
regard to his theory of needs.
Al-Kalbani (2014) highlights the following criticism with Maslow’s theory:
The needs theory is more applicable in developed countries where employees
satisfy their lower order needs and most upper order needs, whereas in developing
countries which may suggest less levels of satisfaction in the lower order needs.
Maslow did not take into account when ranking the pyramid of needs that the
priority of needs vary amongst individuals and different environments.
Bouzenita and Boulanouar (2016) states the following with regards to criticism of
Maslow’s Theory of needs:

12
Maslow’s Theory lacked empirical evidence and did not cover different
backgrounds of Americans when he conducted his study. Maslow’s research was
based mostly on his immediate surroundings.
Psychologist Edwin C. Nevis who worked in China identified that this model is not
applicable for the Chinese context. He stated that the hierarchy of needs for
different cultures are classified on the following dimensions of individualism-
collectivism and ego-social dimension.
2.4.2 Herzberg’s Two Factor Theory Psychologist Frederick Herzberg’s work on motivation led him to pose the basic question
“what do people want from their jobs“ (Swanepoel, Erasmus, Schenk and
Tshilongamulenzhe 2014, p363). Hertzberg conducted a survey of 200 workers which
included engineers and accountants from nine different companies, these groups of
professional workers were asked to specify the job conditions in which they felt either
satisfied or dissatisfied with their jobs. Figure 2.2 illustrates Herzberg’s two factor theory
and how these factors can be seen to influence satisfaction and dissatisfaction.
Figure 2.2 Herzberg Two Factor Theory
Adapted From Ozguner and Ozguner (2014, p.212)
According to Ozguner and Ozguner (2014), Hertzberg then classified these conditions
experienced by the respondents in the study as either motivators (satisfiers) or hygiene

13
factors (dissatisfies). According to Ghazi,Shahzasa and Khan (2013), the Two Factor
Theory suggest that factors which are job content related such as achievement, growth
and advancement, responsibility and recognition can be considered as motivators in the
workplace and factors which are job context related such as pay, working conditions,
inter-personal relationship with co-workers and supervisors are hygiene factors. Teck-
Hong and Waheed (2011) states that motivators are intrinsic factors that are built into the
job such as achievement, growth and advancement, responsibility and recognition and
Hygiene factors are factors which brings about job dissatisfaction- these are factors
extrinsic to the job such as salary structure, interpersonal relations (peer, supervisor and
subordinate).
Figure 2.3 shows the traditional view of satisfaction and dissatisfaction as compared to
Herzberg’s view of satisfaction and dissatisfaction.
Figure 2.3 Different views between traditional motivation and Herzberg’s Two Factor Theory.
Adapted from: Chu and Kuo (2015, p.56)
Herzberg gathered from his data collection that the opposite of satisfaction is not
dissatisfaction as it was traditionally depicted but no satisfaction whereas the opposite of

14
dissatisfaction is no dissatisfaction rather that satisfaction as traditionally viewed (Chu
and Kuo, 2015).
The Two Factor Theory has implications for managers who are of the view that by meeting
the lower order needs of their employees, will motivate them to be more productive and
enhance their performance at work, this notion is dispelled by Herzberg’s finding as
mentioned above (Lukwago,Basheka and Odubuker , 2014).
According to Malik and Naeem (2013) Herzberg’s Theory has been attacked by critics,
who state that both motivators and hygiene factors are unidirectional, when tested by
researchers noted that not all factors of motivation are considered motivators but are in
fact hygiene factors and not all hygiene factor are considered dissatisfies but are in actual
fact motivators. This may be attributed to the fact that there are different sources of
satisfaction and dissatisfaction (Malik and Naeem 2013).
Figure 2.4 represents the close relationship between Maslow’s Needs Theory and
Herzberg’s Two Factor Theory.
Figure 2.4 The relationship between Maslow’s and Herzberg’s Theories.
Adapted from Ozguner and Ozguner (2014, p.213)
According to Ozguner and Ozguner (2014) Maslow’s and Herzberg’s theories share a
close relationship, Herzberg’s motivation factors are related to Maslow’s esteem and self-
15
actualisation needs and the hygiene factors are related to the physiological needs, safety
needs and social needs. Hertzberg’s Two Factor Theory can be seen as closely related
to Maslow’s Theory of Needs but describes how individuals are motivated at work (Ghazi,
et al., 2013). Ghazi, et al. (2013) states that Hertzberg proposed that by meeting the lower
level needs which he describes as hygiene factors would not motivate an individual to
exert extra effort in their work but will prevent dissatisfaction. Hertzberg goes on to state
that only when higher order needs which are the motivators are met then will an individual
be motivated.
Edrak, et al. (2013) states that Herzberg’s Theory does differ from Maslow’s Hierarchy
of Needs by making the assumption that the lower order needs of an individual are
satisfied already and they are only motivated by higher order needs. Their lower order
needs have to be continuously satisfied in order to maintain their present situation of
satisfaction.
2.4.3 McClelland’s Theory of Needs David McClelland built on the work of Maslow’s Theory of Needs, he identified three
motivational factors that all individuals have which formulated the need’s model according
to McClelland (Ondabu, 2014). He proposed that over time a person’s specific needs are
shaped and acquired, furthermore his motivational theory of needs focuses essentially on
three needs which are dissimilar but influences an employee’s motivation and
effectiveness on work related functions (Lăzăroiu, 2015).
Royle and Hall (2012) identified and explained the three dimensions which affect the
individual’s levels of motivation according McClelland, are listed below.
The need for achievement (nAch) - The need for achievement describes an
individual’s drive to succeed and excel. A person who has a high need for
achievement dislike success by any form of chance. They are able to identify the
sources of their success and failure instead of relying on the probability of a
favourable outcome from a situation. Those individuals who seek a high need for

16
achievement are motivated to seek difficult tasks and jobs that require high levels
of skills and difficult challenges.
The need for affiliation (nAff) - The need for affiliation represents one’s desire to
have friendly and close interpersonal relationship with others. Individuals high on
this dimension spend time seeking to interact with others. High levels of affiliation
can be used as a tool of motivating an individual to be sympathetic and
accommodating towards others.
The need for power (nPow) - This need symbolises the individuals desire to be in
a position of power and influence. Those who are high in this need aim for
positional power where they can influence the actions and decision of others who
are under them. These individuals are seen as highly competitive and status
driven. Need for power consist of two type of power, personal power and
institutional power. The need for personal power is the need to direct others, this
type of power is seen as undesirable. The need for institutional power focuses on
furthering the goals of the organisation by directing the efforts of others.
2.4.4 Alderfer’s ERG Theory Clayton Alderfer developed his theory based on an empirical study conducted on
relationship that exist between human needs and satisfaction (Chennamaneni and Teng,
2012). This study addresses the short comings of Maslow’s Needs Theory by having
empirical data to support the study (Caulton, 2012). Alderfer added a new viewpoint
compared to Maslow’s Needs Theory by looking at the five needs proposed by Maslow
and compressing them into three needs (Chennamaneni and Teng, 2012).
Alderfer’s ERG theory states that individuals have three core needs which are existence
needs, relatedness needs and growth needs according Swanepoel, et al. (2014, p.362)
which are explained below.
Existence Needs - This encompasses our basic needs such as physiological
and safety needs.

17
Relatedness Needs - This is the basic human desire for interaction,
interpersonal relationships and social esteem which exist as part of self-esteem
needs.
Growth Needs - This is an individual’s desire for personal development, it also
takes into account the need for growth in self-esteem and self-actualisation.
According to Yang (2011) Alderfer’s ERG Theory differs from Maslow Theory on
these following aspects:
ERG Theory does not contain a hierarchy structure whereby low order needs
have to be satisfied first before attaining the higher order needs.
ERG Theory suggest that should an individual remain unsatisfied on one of the
levels of needs, that individual will revert to a lower order need. Whereas
Maslow theory states that the individual will remain fixed on that need level until
they have been satisfied.
According to Caulton (2012) Alderfer made two important conclusions with regard to his
theory, firstly, needs are not presented in a chronologically order from lower to higher
order needs, human needs are not one dimensional and more than one need can be
activated at the same time in an individual. Secondly an employee who is unable to satisfy
a higher order need will display an exaggerated need to fulfil a lower order need.
2.4.5 Theory X and Theory Y of Motivation Douglas McGregor devised two distinct theoretical views of individuals in his book The
Human Side of Enterprise in which management’s assumptions are vital in determining
their style of operation and behaviour in the work place (Gürbüz,Sahin and Koksal, 2014).
Figure 2.5 highlights the differences between Theory X and Theory Y.

18
Figure 2.5. Difference between Theory X and Theory Y
Source: Adapted from Kayode (2013, p.2)
According to Kayode (2013) who states that these two theories developed by McGregor
are known as Theory X and Theory Y which are essentially theories of employee
motivation, basically describing managements’ two distinct and different attitudes towards
workforce motivation.
2.4.5.1 Theory X An assumption is made by management that their employees are naturally lazy and will
by all means avoid work whenever possible, as a result workers need to be closely and
constantly supervised by putting in place a system of control (Aydin, 2012). For the
effective management of these employees a hierarchical reporting structure needs to be
in place with management in control at every aspect. Managers who adopt Theory X have
an authoritarian style based approach amongst their staff and prefer the carrot stick
approach to managing their staff (Mohamed and Nor, 2013).

19
2.4.5.2 Theory Y This is the opposite of Theory X in that it assumes that employees do not dislike work,
they have self-direction and display the willingness to work. According to Aina (2014)
managers who are under the assumptions of Theory Y, have optimistic views of their
employees and believe that if their employees are given a chance and autonomy, will
display creativity and enhance their performance and productivity without being shackled
down by organisational policy and red tape.
2.4.6 Vroom's Expectancy Theory Developed by Victor Vroom, the Expectancy Theory of Motivation is one of the prominent
theories on motivation (Liao,Lui and Pi, 2011). Lăzăroiu (2015) states that this theory
represents our tendency to act in a certain way and depends strongly on our expectation
of a given outcome and a degree to which one may desire that outcome. This can be
contextualised into a more practical scenario whereby employees are motivated by the
expectation of being rewarded by monetary value or appraisal for displaying high levels
of performance. Parijat and Bagga (2014) states that the Expectancy Theory is based on
the four variables presented below:
Employees join an organisation do so with expectations in mind of their needs,
motivation and past working experience. This has a strong influence on how
these employees perform in the organisation.
An individual’s behaviour is a resulting factor of the conscious decisions that
they make.
Each person wants different things from the organisation they join for example:
job security, market related salaries and challenging work.
An individual will choose amongst the different choices they have in order to
optimise the outcomes of their personal choice.

20
These four variables consist of three key elements which are: expectancy, instrumentality
and valence (Parijat and Bagga, 2014).
Expectancy - This is the relationship between efforts and performance. Lunenburg
(2011) defines expectancy as the probability of an individual’s job related effort
that will result in a certain level of performance outcome. The range of the
probability is from 0 to 1. If an employee sees that there is no chance that the effort
they put in will lead to the desired performance level then their expectancy is 0.
The opposite can be held to be true if an employee believes that the effort put in
can lead to the desired performance their expectancy is 1 (Lunenburg, 2011).
Instrumentality - This consist of the relationship between performance and
rewards. Instrumentality can be defined as an estimate of the probability that an
employee perceives, that a given level of performance will lead to organisational
rewards (Simone, 2015). According to Simone (2015), if there is no perception by
an employee between performance and rewards the instrumentality is 0. If there is
a high perception between performance and rewards then the instrumentality is 1.
Valence - This comprises of the relationship between rewards and personal goals.
Valence is defined as how strong an employee’s preference is for a particular
reward (Lunenburg, 2011). Valence can either be positive or negative unlike
expectancy and instrumentality (Parijat and Bagga, 2014). An outcome can be
seen as positively valent if an individual’s perception is towards attaining their
goals and negatively valent is if an individual prefers not to attain their goal and
lastly the outcome can have a zero valence when an individual is indifferent
whether or not to attain the goal (Parijat and Bagga,2014).

21
Figure 2.6 illustrates the three keys elements in Vroom’s expectancy theory as stated
above and how its leads to motivation of individuals.
Figure 2.6. Vroom’s Expectancy Theory
Adapted from Lee (2007, p.790)
According to Lee (2007) an individual is motivated to the point that they believe the effort
they put in will lead to an acceptable performance (this is the expectancy), they will be
rewarded for their performance (instrumentality) and the reward they receive will be
positive (valance).Nasri and Charfeddine (2012) notes that Vroom goes on to suggest
that a relationship exist between motivation, expectancy, instrumentality and valance
which is given by the following equation; Motivational Force = Expectancy x
Instrumentality x Valence. It is also known as the EVI model of motivation.
Lunenbrg (2011) explains the effect the multiplication factor has in the Motivation Force
equation as follows: In order for motivation to be high all three factors need to be high, if
any of the three factors is zero then overall motivation is zero. Expectancy theory model
has its implications in motivating employees by altering one or all of the following
expectancy, instrumentally and valence. Table 2.1 provides an understanding of Vroom’s
Expectancy Theory.

22
Table 2.1 Combinations of valence, expectancy and instrumentality
Adapted from Parijat and Bagga (2014, p.3)
SITUATION VALENCE EXPECTANCY INSTRUMENTALITY MOTIVATION
1 High
positive
High High Strong
Motivation
2 High
positive
High Low Moderate
Motivation
3 High
positive
Low High Moderate
Motivation
4 High
positive
Low Low Weak
Motivation
5 High
positive
Low Low Weak
Avoidance
6 High
negative
High Low Moderate
Avoidance
7 High
negative
Low High Moderate
Avoidance
8 High
negative
High High Strong
Avoidance
According to Parijat and Bagga (2014) this table represents the possible combinations of
expectancy, instrumentality and valence which produce the different levels of motivation
ranging from strong motivation to a strong avoidance of motivation. Motivation is the
product of high levels of expectancy, instrumentality and valence. Table 2.1 is self-
explanatory and the level of motivation can be derived from the different combinations of
expectancy, instrumentality and valence.

23
According to Parijat and Bagga (2014) Vroom’s theory being more realistic than other
motivational theories but suffers from the following limitation:
It can be complicated and has many variables.
The complex nature of Vrooms theory makes it both difficult to test and implement.
Reliable measures of expectancy, instrumentally and valence needs to be
developed.
Owing to the quantitative nature of the Expectancy Theory it presents difficulty in
calculating or at times not possible.
Employees may not have the time nor the abilities to calculate their motivation in
the manner in which the theory describes.
2.4.7 Self-Efficacy Theory The constructs of Bandura’s Self-Efficacy Theory refers to an individual’s belief that they
have the capability to use their internal resources to successfully accomplish their goal
(Pfitzner-eden, 2016). Bandura believes a person has their internal resources such as
talent, ability and knowledge needed to successfully perform a task (Ben-Ami, Jacob,
Eden and Kaplan, 2014). The higher an individual’s self-efficacy, the higher the level of
confidence they have in their abilities to succeed. Employees who are found to possess
high self- efficacy are more engaged in their work which leads to greater productivity and
performance than a person with lower levels of self-efficacy (Cherian and Jacob,
2013).The response to negative feedback differs between employees with high and low
self-efficacy. High self-efficacy employees will increase their effort and be more motivated
opposed to low self-efficacy employees who are most likely to lessen their efforts
(Seyithan, 2015)
Robbins and Judge (2013, p.216) highlights Albert Bandura’s four ways in which self-
efficacy can be increased.
Enactive mastery - The more confident you become with a task you have done
previously by relevant experience gained, this will enable you to carry out the task
successfully in the future.

24
Vicarious modelling - By witnessing someone else perform the same task, you will
enhance your confidence. Vicarious modelling is effective when the person you
are witnessing is similar to yourself.
Verbal persuasion - This is achieved by being influenced by a person that possess
the skills needed to be successful in carrying out a task.
Arousal - Arousal can been seen to increase self-efficacy by psyching up an
individual to improve their performance on a given task.
2.4.8 Adam’s Equity Theory
Stacey Adam’s Equity Theory is a form of motivational theory which explains how
individuals aim for fairness and justice in a social system (Banks,Patel and Moola, 2012).
According to Nawaz (2011), equity theory is of the notion that individuals work alongside
each other and not in a vacuum, their reward will only serve as a motivating factor if
individuals perceive the reward to be fair and equal. Employee’s compare their perceived
efforts to the rewards gained against other employee’s efforts and rewards.
Equity Theory states that employees compare their input to output ratio to that of relevant
employees and if the ratio of both employees are seen to be equal this will lead
employee’s to experience job satisfaction which has a direct effect on the employees
motivation whereby they are motivated to maintain their current input to output ratio or
raise their inputs to produce higher levels of outputs (Nawaz, 2011). If the ratios are
unequal then inequality exist and this state is seen to be unfair which will cause the
employees to become demotivated and the employee’s wanting to make necessary
changes to bring about equality once more (Kaur,Aggarwal and Khaitan 2014). Figure 2.7
shows the ratio comparison ratios between two employee’s A and B, followed by their
state of perception.

25
Figure 2.7. Ratio and Perception’s for Equity Theory
Adapted from Robbins and Judge (2013: p.220)
According to Robbins and Judge (2013, p.220), equality is perceived by employee A when
the input to output ratios of both employee A and employee B are equal. If employee A is
of the perception that they are being under or over rewarded, a state of inequality is
present. Robbins and Judge (2013, p.220) reiterate that employees who perceive any
form of inequity in the ratio comparison can take the following step to go about restoring
equity in the process.
By changing their own inputs and outputs
Complete withdraw of themselves from the situation
By changing the person whom the comparison is made against
Displaying certain behaviour to influence a change in the inputs and outputs of
others.
Altering the inputs and outputs of both parties.
The practical implication of Equity Theory is the difficulty in creating equity in the
workplace due to the fact that it is only human nature in underestimating or overestimating
the inputs and outputs of two different individuals which may lead to the wrong decisions
regarding equity bringing about dissatisfaction, demotivation and resentment therefore
management needs to be transparent and open with regards to the inputs and outputs
for the different jobs when comparisons are made (Aik, 2015).

26
2.5 Definition of Job Satisfaction
Job satisfaction has been a widely-researched topic over the years and has proven to be
a rather complex subject matter for researcher, academics and business practitioners.
The term job satisfaction is used to describe how an employee feels and the attitude that
they have regarding their job (Oyeba, 2013).
Job satisfaction can be defined as a state in which an employee feels positive and
experiences emotional pleasure from his job (Shaikh,2012). According to Alajlouni (2015)
the extent to whether employees like or dislike their jobs is known as job satisfaction.
Mohammed and Eleswed (2013, p 44) cites Robbins and Judge (2009) who defines job
satisfaction as “a positive feeling about a job resulting from an evaluation of its
characteristics“. Mohammed and Eleswed (2013) states that job satisfaction comprises
of two components which are intrinsic factors which describes how employees feel about
the job itself and extrinsic factors which describes how employees feel about the aspects
that are external to the job itself. Finally job satisfaction can be used as an assessment
of the attitudes of “overall accepted, contentment and enjoyment” in the work life of an
individual.
2.5.1 Factors of Job Satisfaction It is vital to understand that individuals spend majority of their time at work. Alshitri (2013)
states that studies have indicated that employees who are satisfied in their jobs remain
loyal and committed to the organisation are the most likely to deliver on productivity and
services. The following describes the dimensions of job satisfaction. According to
Rehman,Rehman, Saif, Khan, Nawaz and Rehman (2013) an extensive literature
conducted on the factors that largely have an effect on an individual’s job satisfaction are
the following: work itself, pay, promotion, inter-personal relationship, working environment
and work itself each factor is discussed below.

27
2.5.1.1 Renumeration Pay is the financial remuneration an employee receives according to the requirements
and description of his job. According to Oyeba (2013) pay helps people to attain their
basic needs which in-turn is vital in satisfying higher order needs of individuals. There are
different systems of pay which is dependent on what is adopted by each organisation.
Malik,Qaiser and Munir.( 2012)) states that pay has an impact on job satisfaction and that
lower paid employees experience lower levels of job satisfaction and higher paid
employees experience higher levels of job satisfaction.
2.5.1.2 Promotion Promotion can be described as the upward vertical movement of an employee in the
organisations hierarchy structure (Malik, et al. 2012). Promotion provides an individual
with more responsibilities, higher compensation, personal growth and higher social status
(Alshitri ,2013). According to Ahmad,Ing and Bujang (2014) previous research has shown
that there is a positive relationship between promotion and job satisfaction. Rehman, et
al.( 2013) states that when an individual gets promoted this gives a clear reflexion of their
true potential and can be seen as a type of acknowledgement which results in an
improvement of their level of job satisfaction and organisational commitment.
2.5.1.3 Inter-Personal Relationships Noor (2010) states that a supervisor’s behaviour has an impact on the attitude, morale
and job satisfaction of their employees. By changing the supervisor, the behaviour and
attitude of the employees also change. Supervision involves technical, non-technical skills
and the co-ordination of work activities amongst staff. Supervision is a vital factor in the
success or failure of an organisation (Adebayo and Ogunsina ,2011).Lin, Shu and Lin.
(2011) states that Duchormoe and Martin (2000) conducted a study that proved there is
a positive correlation between co-worker relationship and the level of job satisfaction.
Iqbal (2013) states that the support and relationship formed by co-workers can create a
positive environment in the workplace which improves an individual’s performance and

28
productivity. Higher levels of job satisfaction are produced as a result of positive co-
worker relationship.
2.5.1.4 Work Environment The work environment can be described to have different dimensions such as social,
economic and technical which forms a relationship between an individual and their work
environment. This will influence the job satisfaction of an employee for example a physical
working environment that provides comfort will have an influence on the job satisfaction
of an employee (Salunke, 2015).The effect that the physical working condition has on
employees has been studied by many researchers which are briefly highlighted as
follows. The concept of the work environment according to Jain, Ruchi and Kaur (2014)
includes the physical, psychological and social dimension that make up the working
environment in an organisation. Jain, Ruchi and Kaur (2014) states that the work
environment can have both a positive and negative effect on the psychological welfare of
the employees. Atambo, Otundo and Nyamwamu (2013) states there was a positive
correlation between job satisfaction and the working condition. According to Atambo, et
al. (2013) by improving the working conditions this resulted in an increase in the level of
job satisfaction which is evident in the improved levels of productivity in an organisation.
A good working environment can be viewed as one which reduces the amount of sick
leave taken by employees and has a low turn-over rate and increases the level of
efficiency (Salunke, 2015).
2.5.1.5 Work Itself This refers to the extent which an individual finds the work in which they are engaged in
to be stimulating, given complete autonomy by management on the task they carrying out
and presents an opportunity for both learning and growth within the organisation (Oyeba,
2013). Work that is interesting and challenging is more likable and enjoyed by employees
who are reported to be more satisfied compared to those workers who are placed in less
stimulating jobs (Rehman, et al., 2013).

29
2.5.2 Job Characteristic Model The Job Characteristics Model was developed by Hackman and Lawler and later revised
by Hackman and Oldham, was developed to evaluate and improve the employee’s jobs
(Ayandele and Nnamseh, 2014). The objective of diagnosing an existing job and
evaluating the effects that changes in the job, has on the motivation, satisfaction and
productivity of an employee (Batchelor,Lawlor and Burch ,2014).The Job Characteristics
Model is noted as an important motivational theory for organisations. The characteristics
of an individual’s job leads to a person’s psychological state which in-turn leads to
personal and work related outcomes which is essentially moderated by one’s own growth
(Mukul ,2013).
Hackman and Oldham also proposed that critical psychological states of “experienced
meaningfulness of work, experienced responsibility for outcomes of work and knowledge
of actual results of work activity” has its inclination to be internally motivated, satisfied at
work and produces higher quality of work output, higher levels of motivation, job
satisfaction and performance, lower levels of absenteeism and staff turn-over (Kumar,
Abbas, Ghumro and Zeeshan,2011).
The model comprises of five job characteristics which affect an employee in three
psychological states: which are the personal and affective state which deals with the
employee’s satisfaction and motivation. The behavioural state which is the employee’s
performance and quality of work along with their absenteeism. All three states deals with
the employee’s responses to their work (Kumar, et al., 2011).
In order for a desirable outcome to be achieved an individual has to experience all three
outcomes, if one of these states is absent, the outcome variable such as motivation and
satisfaction will be reduced (Mukul ,2013). According to Mukul (2013) the relationship
between how an individual responds to work and characteristics of one’s job is described
by the Job Characteristics Model. The five core characteristics of the model are skills
variety, task identity, task significance, autonomy and feedback (Batchelor, et al., 2014).

30
2.5.2.1 Skills Variety Skills variety is the degree which a job requires a variety of skills in order to carry out and
execute different tasks (Onimole and Mni, 2015). The various activities that are required
in a job places a requirement and demand on the worker to develop various talents and
skills to be successful in the job, jobs high on skills variety provide employees with more
challenging tasks and projects as this requires the use of a variety of skills set which can
enhance motivation (Na-Nan and Pukkeeree, 2013).
2.5.2.2 Task Identity The degree to which the job requires an identifiable piece of work from the stages of
inception to the stages of completion (Casey, 2009). By employees being involved in a
complete project, this gives them a sense of completion and responsibility for the work
they accomplished. Task identity can be established by increasing the tasks to an
individual who can then identify with the task as a complete or an identifiable part of the
task (Casey, 2009).
2.5.2.3 Task Significance Task significance refers to the degree in which the job impacts the lives of other people
(Onimole and Mni, 2015). The smallest contribution of an individual’s efforts in an
organisation can be considered important by making employees aware of the role that
their contribution provides to the organisation and society as a whole (Fan Wuhan 2014).
2.5.2.4 Autonomy Autonomy refers to the degree in which the job provides substantial independence,
freedom and discretion whereby an individual can carry out the planning, procedures and
execution of the work (Piccolo, Greenbaum,Den Hartogand and Folger, 2010) . The
independence and discretion given to the employee by the employer when carrying out

31
their work consists of: the level of planning and implementation of the work and the degree
in which the employee determines the procedures to be carried out upon implementing
the work (Johari,Yean,Yahya and Adnan 2015). This can enhance productivity as the
employee plans on the most suitable and effective way in which to carry out their work
and increase their levels of motivation and job satisfaction.
2.5.2.5 Job feedback Job feedback refers to the degree to which carrying out the activities that are required by
the job provides direct and clear feedback (information) to the individuals with regards to
the effectiveness about how they carry out their work (Na-Nan and Pukkeeree, 2013).
Feedback can be in either in the form of positive or negative and can allow employees to
make the necessary adjustments with regard to their performance (Onimole and Mni
,2015).
2.5.2.6 Motivational Potential Score According to Casey (2009), Hackman and Oldham claim that motivation will be highest
when jobs which rate high on the job characteristics model. Each characteristics can be
changed which can enrich the job as a whole and increase the motivational potential of
that job. According to Rahman and Nurullah (2014) the Job Diagnostic Survey (JDS)
yields an index known as motivational potential score (MPS). This represents the degree
to which the job has the potential for motivating individuals.
According to Mukul (2013), five characteristics can be combined into a single index which
reflects the overall motivating potential of a job which leads to the development of the
formula for motivating potential score (MPS) as follows:
MPS = {[skills variety + task identity + tasks significance] / 3} x autonomy x feedback
An employee’s meaningfulness of work is affected by skills variety, task identity and tasks
significance and the responsibility for the outcomes is influenced by the autonomy and
job feedback which acknowledges the results obtained from the activities of a given task

32
(Rahman and Nurullah 2014).For a job that has a low MPS, the outcomes that are
expected from a job will be low and the employee’s feelings will not be affected by how
well they perform on a specific task (Kass,Vodanovich and Khosravi, 2011). When job
has a high MPS, good performance will be reinforced and the employees will have
positive feeling as a result of their work activities (Kass, et al., 2011).
2.5.3 Outcomes of Job Satisfaction The level of job satisfaction that employees experience can be associated with both
positive and negative outcome. These outcomes can have a constructive or destructive
effect on an organisation. Each outcomes is discussed below.
2.5.3.1 Employee Turnover Employee turnover is a reality that all organisation eventually face. Employees leave the
organisation voluntarily when one chooses to leave or involuntarily were one is forced to
leave depending on the circumstances (Khan and Aleem 2014) . Turnover has a negative
impact on the organisation, resources such as time and money are used towards
recruiting and selecting new employees (Saeed, et al., 2014). When employees are
satisfied in their jobs the turnover ratio in the organisation is low however when they are
not satisfied in their jobs the turnover ratio is high indicating a negatively proportional
relationship between job satisfaction and employee turnover (Balouch and Hassan 2014).
2.5.3.2 Absenteeism Singh (2015) states that research has revealed that there is an inverse relationship
between job satisfaction and absenteeism, when job satisfaction amongst employees,
high absenteeism is low and when job satisfaction is low amongst employees,
absenteeism is high. Thirulogasundaram and Sahu (2014) states that absenteeism can
be seen as a form of routine behaviour or none attendance at work on a voluntary basis.
Absenteeism is known to be an indicator of poor performance, the higher the rate of

33
absenteeism in the work place gives an indication of low employee levels of job
satisfaction (Ali Jadoo, Alijunid, Dastan and Tawfeeq, 2015). According to Kehinde (2011)
individual who are experience dissatisfaction in the jobs are the most likely be absent
more regular.
2.5.3.3 Performance The relationship between job satisfaction and performance has been a topic of interest
for many researcher over the years and has been imperative in understanding how the
employee’s levels of job satisfaction plays a vital role in the productivity of an employee
(Giacopelli,Simpsonm Dakak, Randolph and Holland,2013). According to Hira (2012)
studies from the 1930’s on the topic of job satisfaction and performance showed that there
was a weak and negative relationship between the two, however from 1985 onwards as
more studies started to develop which showed a positive correlation of 0.17 between
performance and job satisfaction was found. A happier worker is a more satisfied worker
and productive worker resulting in enhanced performance levels at their jobs. (Shaikh
,2012).The discussion on outcomes provides a realistic view of the impact job satisfaction
has on turnover, absenteeism and performance.
2.6 Summary
This chapter examined the different types of motivational concepts and theories which
have been developed by many researchers over the decades. The concept and theory of
job satisfaction has also been examined. The theories were compared, contrasted and
drawn out in fair detail to implicate the aspects of purpose, meaningful work, identifying
with the work, and higher level indications of job satisfaction. In the corporate context,
various categories of personal involvement are at play – especially in sectors that are
heavily reliant on employees (people) to carry out the essential tasks. The personal
involvement from employees has a myriad of complex job-personality, work-attitude and
personal-professional interactions that was incorporated in the literature review.
Motivational theories such as Herzberg’s Two Factor Theory were shown to be related to

34
the satisfaction and dissatisfaction of employees in the work place. Factors which are
described as motivational and hygiene are classified as factors that contribute to job
satisfaction and dissatisfaction. It is clear from these theories that there is a link between
employee motivation and job satisfaction. The next chapter presents research
methodology that has been adopted for the current study.

35
CHAPTER THREE
RESEARCH METHODOLOGY
3.1 Introduction
This chapter outlines the aim, objective and focus of the study. The implementation of the
research design used in the study included the research methodology, sampling
techniques, research instrument, data collection instrument, data analysis techniques and
ethical considerations.
3.2 Aim
The aim of the study was to identify how motivation impacts on job satisfaction amongst
selected employees at eThekwini Electricity department.
3.3 Objectives
The objective of this study was to analyse the relationship between motivation and job
satisfaction amongst employees and identify the following:
Objective 1: To determine the factors that motivate job satisfaction;
Objective 2: To establish the factors that influence job dissatisfaction;
Objective 3: To ascertain the overall level of job satisfaction.
Objective 4: To evaluate the impact motivation has on job satisfaction; and
3.4 Focus and Location
The study mainly focused on the impact that motivation has on job satisfaction amongst
selected employees at the eThekwini Electricity Department which is located in the city
of eThekwini in South Africa. The study was conducted at the various departments
located at the head office and the six operation depots located with eThekwini region. The
employees which the study primarily focused on were engineers, technologists and
technicians who are permanently employed by eThekwini Electricity.

36
3.5 Research Methodology
There are different philosophical views regarding research. The positivist approach takes
the traditional viewpoint of research and can be identified with quantitative analysis which
uses scientific research used to identify the truth (Castellan,2010). A positivist viewpoint
is that “the world operates by the law of cause and effect that we can discern if we use a
scientific approach to research” (Crestwell, 2014, p7). The key to a positivist researcher
is an experiment which allows the cause and effect relationship to be tested through
manipulation and observation (Castellan, 2010).On the opposite end of the spectrum is
what is known as constructivism. Constructivism aims to understand how knowledge is
constructed by people and how people make use of a set of rules to make sense of the
world by what happens in people’s minds (Sekaran and Bougie, 2013, p29). The
constructivist researcher makes use of qualitative research methods.
Sukamolson (2007, p11) state that quantitative research has the following advantages:
It makes provision for a large population.
A statistical comparison can be made between two groups.
It is precise, definitive and provides standardisation.
Owing to the large sample size that was investigated a quantitative approach was
adopted during the study.
3.6 Target Population
Sekaran and Bougie (2013, p240) defines the research population as “the entire group of
people, events or things of interest that the researcher wishes to investigate”. The target
population selected for the current study comprised of engineers, technologists and
technicians employed on a permanent basis at the eThekwini Electricity Department.
Information pertaining to the number of employees falling into these categories was made
available from eThekwini Electricity’s human resources department. The total number of
employees that made up the target population was 162 employees. Below is a categorical
breakdown of employees by job position:

37
Technicians = 110
Technologists = 8
Engineers = 44
3.7 Sample Size
A sample can be defined as a small subset of the population (Hair Jr,Babin,Money and
Samouel,2003:p208). Hair Jr, et al.(2003, p208) further describes a sample population as
the representation of the entire population that is being researched. According to Singh
and Masuku (2014) the sample size can be calculated by means of a simplified formula
for proportions which is given as follows: 𝑛 = 𝑁
[1+𝑁 (𝑒)2] . Where n is the sample size, N is
the target population and e is the level of precision (margin of error).
For a target population of 162 employees, a confidence interval of 95 % and 5 % margin
of error, the sample size can be calculated as follows:
𝑛 =162
[1 + 162 (0.05)2]
n = 115
A sample size of 115 was calculated to be adequate from the target population.
3.8 Sample Methods
Sampling methods can be divided into two categories namely, probability and non-
probability sampling. In probability sampling, the sampling units has a known probability
of being selected and is selected at random. With non-probability sampling the inclusion
or exclusion of the sampling element within the target population is left entirely to the
discretion of the researcher (Hair Jr, et al., 2003, p.210)
Sekaran and Bougie (2013, p.245) defines probability and non-probability sampling as
follows: probability sampling is when “each sampling element in the population have some
known, nonzero chance or probability of being selected as sample subjects”. In non-

38
probability sampling “the elements do not have a known or predetermined chance of
being selected as sample subjects”.
Collis and Hussey (2009, pp.211–212) describes the different methods of probability
sampling are as follows:
Random sampling – This is the simplest form of sampling and occurs when each
sampling unit in the population sample size has a known and equal chance of
being selected.
Systemic sampling – This involves the selection of every nth element in the sample
population starting by randomly choosing the first sample and then every nth
sample thereafter.
Stratified sampling – This process involves the stratification (segregation) of the
sample population into their respective strata and then randomly selecting
sampling units from each of the strata. Stratified sampling can be categorised into
either proportionate or disproportionate stratified random sampling.
Proportionately stratified sampling is described as follows: the number of elements
chosen from each strata is proportionate to the size of a particular strata relative
to the overall sample size.
Disproportionately stratified sampling: Sample elements are chosen in either one
of the following ways:
I. This approach the elements from each strata are chosen based on its
importance.
II. This approach the elements from each strata are selected based on the
relative variability of the elements. Strata with high relative variability will
contribute a higher proportion of elements to the total sample.
Cluster sampling – This method of sampling is used when the target population is
dispersed over a geographical region. The target population is then divided into
groups known as cluster and random sample is selected from each cluster to
represent the target population.

39
Saunders and Thornhill (2006, pp.170–177) describe the methods of non-probability
sampling as follows:
Convenience sampling – This type of sampling is known as accidental sampling.
In this method of sampling the researcher selects a sample from part of the
population that is readily available or most convenient for the researcher.
Quota sampling – This type of sampling is similar to stratified sampling in which
the total sample of the population is represented in the form of different strata in
order to have a proportional representation of the population. The difference
between quota sampling and stratified sampling is t the selection of the samples
which is conducted on a convenience basis.
Purposive sampling – This method of sampling is also known as judgement
sampling. In this type of sampling each sample is selected on the basis of being
positioned as most advantageous in providing the required information.
In this study, random proportionately stratified sampling is selected as the method of
sampling. The sample size consists of three strata of different proportions. The
percentage that each strata makes up of the total target population is given by the
following equation:
Engineers = 44
162 = 27 %
Technologist = 8
162 = 5 %
Technicians = 110
162 = 68 %
The composition of each strata which is based on the sample size which is derived from
the percentage that each strata makes up from the target population and is calculated as
follows:
Engineers: 27 % of 115 = 31
Technologists: 5 % of 115 = 6

40
Technicians: 68% of 115 = 78
The sample size consisted of 78 technicians, 31 engineers and 6 technologists.
3.9 Classification of Data
According to Saunders, Lewis and Thornhill ( 2003, p.188) data that is used for research
can be obtained from one or both of the following sources:
Primary data which is described as the data obtained from the researcher on the
variables that are of interest relating to the study.
Secondary data relates to information that already exist and can be obtained for
the purpose of conducting research, this can be obtained from raw and published
summaries.
In this study, primary data was used as the source of data. This allowed the researcher
to obtain data pertaining to the objectives of the study, secondary data was avoided as it
may contain data that has been contaminated.
3.10 Data Collection
Data collection process that was carried out made use of a structured close ended
questionnaire which was distributed and collected from each of the respondents. Each
questionnaire was given to the respondent in the form of a hard copy. The reason behind
this was twofold, firstly not all respondents have access to the internet, secondly
respondents may disregard an email link sent to them or have limited or no internet
access while answering the questionnaire online and disregard the questionnaire
thereafter. Thirdly respondents were able to clarify any misconceptions with regard to the
questions.
According to Siniscalco, Auriat and Ross (2005, p23) Closed ended questionnaires were
used because of the following advantages it offers over open ended questionnaires:
The process of answering the questionnaire is easy thus making it easy for the
respondents to complete.

41
Respondents are restricted to a set of responses.
Easy to compare answers amongst respondents and also determine the
relationship between the variables.
Clarifies the meaning of the question for the respondent.
The questionnaires were personally administrated owing to the following advantages
(Sekaran and Bougie 2013, p.148):
Less expensive to administer to respondents;
Almost 100 percent return rate ensured;
Any doubts surrounding the questions can be clarified; and
Anonymity of the respondents can guaranteed.
3.11 Questionnaire
The questionnaire was constructed after conducting an extensive literature review on
motivational theory. The format of the questionnaire was adapted from the study by
Ghazi, et al. (2013). In order for the questionnaire to be applicable to the current study
the following changes were made:
Growth and advancement were combined as a single factor of motivation
(Question 6).
Personal life and status were excluded from the hygiene factors.
An additional question was added which asked the respondents to indicate their
overall job satisfaction (Question 17). The purpose of determining the overall level
of job satisfaction of the respondents, this takes into account any variables that
have not been included the questionnaire opposed to the summation of mean
values to determine the overall level of job satisfaction.
The questionnaire consisted of the following four section:
Section A: Question 1 to 5.This section pertained to the respondent’s biographical
data such as gender, age and race;

42
Section B: Question 6 to 10. This section is related to factors of motivation that
bring about job satisfaction;
Section C: Question 11 to 16.This section is related to hygiene factors that bring
about job dissatisfaction; and.
Section D: Question 17. This section dealt with the overall level of job satisfaction.
The Question relating to the respondent’s relationship with their subordinates was omitted
from the data analysis, due the respondents misunderstanding of the question. The
omission prevented any form of data contamination which would influence the data
analysis. The return rate of the questionnaire was successful as 117 questionnaire were
returned from the respondents, this surpassed the sample size of 115. The actual number
of collected questionnaire (117) was used as the same size. The questionnaire used in
the current study is found in the attachment in Appendix 2.
3.12 Likert Scale
Likert Scale was used in the study. The respondents specify the level to which they either
agree or disagree to a series of statements on a Likert scale type questionnaire (Barua,
2013). According to Tsang (2012) researchers claim that the use of the midpoint
(undecided) on the Likert scale can increase the reliability of the measurement. A 5 point
Likert scale was used to determine how strongly the respondents disagree or agree with
each statement in the questionnaire. The responses on the scale are as follows: Strongly
disagree (1), Disagree (2), Undecided (3), Agree (4), Strongly agree (5).
A five point Likert scale was selected in the study. According to Croasmun and Ostrom
(2011, p20) a 5 point Likert Scale offers the following advantage:
Using an odd numbered Likert scale provides the respondent with the choice of
neutrality by having the neutral or undecided item incorporated into the scale. This
reduces the response bias of the respondents by not allowing a respondent to
favour one response over the other.
Using a 5 point scale offers a high internal reliability and additional discriminating
power.

43
According to Subedi (2016), the Likert scale can be either of the Likert Type Data
which non-parametric data or of the Likert Scale Data which is parametric data. In the
current study Likert Scale Data was used.
3.13 Pilot Study
A pilot study was conducted. This consisted of 12 questionnaire being distributed to the
respondents. The purpose of the pilot study was to check for the validity of the content,
spelling, grammar and terminology used in the questionnaires and to ensure that the
questions are clearly understood. Minor changes were made accordingly from the
feedback received from the respondents.
3.14 Data Analysis
The data analysis was conducted with the aid of a software program called Statistical
Software form Social Sciences (SPSS Version 23). All data was entered in manually. All
data were analysed and presented in the following manner as stated below.
3.15 Descriptive Statistics
Descriptive statistics was used to summaries the information collected in the study from
the sample size and comprises of frequency distribution, measures of central tendency
and measures of dispersion (Libman, 2010).
3.15.1 Frequency Distribution The simplest format for the presentation of descriptive data is in a tabulated format which
is a frequency distribution table. However, the draw back with this representation is that
it does not provide any visual significance with regard to the highest and lowest values
obtained (Saunders, et al., 2003, p.339). Saunders, et al. (2003, pp.342–343) states that
bar chats are used in providing a more accurate representation of the data with the height
of the bar charts representing the frequency of occurrences. The pie charts is used to

44
represent a proportional segment of the value under examination. Both bar chats and pie
chats were used in the study as they are both suitable in the presentation of results in
research reports.
3.15.2 Measures of central tendency According to Hair Jr, et al. (2003, pp.239–240) the measure of central tendency locates
where the centre of the distribution can be found and it is accomplished by one of the
following methods:
i. Mean - The mean is the arithmetic average and is the most commonly used
form of measurement for central tendency.
ii. Median - The medium is the next measure of central tendency which is the
middle value of the distribution. The medium is value which is either above or
below where half of the values fall in the sample distribution.
iii. Mode - The mode is described as a measure of central tendency which
identifies value that has the most common occurrence in the simple distribution.
In this study the mean values were used as a measure of central tendency.
3.15.3 Measure of Dispersion The measure of dispersion is a technique that is used to describe how the data is
dispersed around the central tendency according to Bell, Lee and Yeung ( 2006) and is
conducted by the following measures:
i. Range - This is the simplest form of measurement for dispersion, it defines the
range of data from the lowest to the highest values.
ii. Variance – This is used to determine as to how far the respondents values are
from the mean value calculated.
iii. Standard deviation – This measure of dispersion is used to overcome the draw
backs of using variance as a measure of central tendency as the variance is a

45
value that has been squared. The value of the standard deviation is obtained
by taking the square root of the variance value. The standard deviation is
considered the most important index of dispersion and describes the variability
of the sample distribution values from the mean.
The standard deviation was used as a measure of dispersion in the current study.
3.16 Inferential Statistics
According to Collis and Hussey (2009, pp.221–222) inferential statistics are statistical test
that are conducted and used in developing conclusions about the target population based
on sampling distribution.
3.16.1 Correlation Correlation describes the relationship between two quantitative variables, it measures
both the strength and direction of the linear relationship between the variables (Sekaran
and Bougie, 2013, p.289). The two variables are not classified as dependent and
independent variables because there is no cause and effect relationship between both
variables and the variables are measured simultaneously (Hair Jr, et al., 2003, pp.283–
289).
A Pearson’s Correlation Analysis was used in the current study to determine the strength
and direction of the relationship between motivation factors, hygiene factors and the
overall level of job satisfaction.
3.16.2 Multiple Linear Regression Simple linear regression is used to measure the relationship between two quantitative
variables, namely an independent variable and a dependent variable. and gives an
indication of the effect that the independent variable has on the dependent variable
(Saunders, et al., 2003, pp.364–365). Multiple regression is the relationship of more than
one independent variable on a single dependent variable (Hair Jr, et al., 2003, p.296). In

46
the current study multiple regression was applied to determine how each independent
(motivation and hygiene factors) variable combined impacts the dependent variable
(overall level of job satisfaction).
Table 3.1 Measure of strength for Regression Analysis
Adapted from Ghazi, et al. (2013, p.449)
R Squared Effect Size
˂ 0.1 poor
˂ 0.11 modest
˂ 0.31 moderate
˃ 0.5 strong
According to Ghazi, et al. (2013) Table 3.1 can be used to measure the strength of the
relationship between variables in a regression analysis.
3.17 Reliability
Reliability refers to consistency of the research instrument. The research instrument
should produce the same results if testing is done repeatedly (Lameck, 2013).
Sekaran and Bougie (2013, p 228-229) described the following test for reliability of the
research instrument.
Stability of measures is the ability of a measure to remain constant over time
regardless of test conditions or the state of the respondents.
Test-retest reliability this is obtained by repeated measurement from the same
respondents tested previously using the same instrument and test conditions

47
Internal consistency of measure is indicative of the homogeneity of the items in the
measure that taps the construct.
The Cronbach’s Alpha Measurement was applied in the study to measure the internal
consistency of the different factors of motivation and overall job satisfaction.
Table 3.2 Cronbach Alpha coefficient size
Adapted from Hair Jr et al. (2003:p 172)
Alpha Coefficient Range Strength of Association
˂ 0.6 Poor
0.6 to ˂ 0.7 Moderate
0.7 to ˂ 0.8 Good
0.8 to ˂ 0.9 Very Good
0.9 Excellent
Table 3.2 indicates the strength of association for the different range of Cronbach Alpha
coefficients (Hair Jr, et al.,2003).
3.18 Validity
Validity is described as the degree to which the research instrument measures what is
actually meant to measure (Lameck, 2013).
According to Bryman and Bell (2007, pp.164–165) there are different types of validity:
Face validity “involves the systemic but subjective assessment of a scale’s ability
to measure what it is supposed to measure “.
Construct validity “this assesses what the construct (scale) or scale is, in fact,
measuring”
Criterion validity this “assess whether a construct performs as expected relative to
other variables identified as meaningful criteria”.

48
Based on the feedback given from respondent during the pre-testing the researcher
concluded that there was face validity in the current study.
3.19 Ethics in Research
Ethics is a critical aspect in research. Johnson (2014) states that the researcher needs to
understand and take into consideration ethical issues during the planning stages of the
research. Daymon and Holloway (2011) states that the researcher needs to ensure that
respondents who participated on the basis of an anonymity remain unidentified. Prior to
the distribution of questionnaire and collection of data for the research study being
conducted, ethical clearance had to be granted from University of KwaZulu-Natal’s Ethical
Clearance Committee (Appendix 3). Ethics ensures that each respondent is treated
according to the ethical guidelines for the research by the University. All respondents
were made aware that participation in the research was completely voluntary and they
could opt out at any time. All responses to the questionnaire where conducted on the
basis of anonymity, this was acknowledged by the respondent signing a letter of informed
consent which states the title, objectives of the study and the rights of the respondents
(Appendix 1).
3.20 Summary
Chapter three described the research methodology applied when conducting this study.
It described the aims, objectives, research approach, sample size, research instrument,
data gathering and analysis techniques which were used in the study. Justification was
given for each selection when constructing the research methodology for the study. The
next chapter presents the results obtained from the respondents.

49
CHAPTER FOUR
PRESENTATION OF RESULTS
4.1 Introduction
This chapter deals with the responses collected from the questionnaire handed out to the
respondents. The analysis of the results was broken up into descriptive statistics which
comprises of graphs for the demographic profile, motivational factors, hygienic factors
and the overall the overall level job satisfaction of the respondents. The measures of
central tendency and dispersion were calculated for the motivational factors, hygienic
factors and overall job satisfaction. The inferential statistics conducted were reliability
analysis to determine the reliability of the questionnaire, multiple regression analysis to
determine the impact that motivation has on job satisfaction and Pearson’s correlation
analysis described the relationship motivation and job satisfaction.
4.2 Descriptive Statistics
The descriptive statistics were conducted for each section of the questionnaire and are
presented in the form of both pie and bar graphs.
4.2.1 Demographical Profile The demographical profile of all respondents was obtained from Questions 1-5. This
addressed factors such as race, gender, age group, qualification and job position.

50
4.2.1.1 Gender The gender of the respondents are illustrated in Figure 4.1.
Figure 4.1 What is your gender?
Figure 4.1 represents the gender distribution which indicates that 88.03 % of the
respondents are male and 11.97 % female.
88.03%
11.97%
MALE
FEMALE

51
4.2.1.2 Age The age group of the respondents are illustrated in Figure 4.2.
Figure 4.2. What is your age?
Figure 4.2 represents the age group of the respondents, 1.71 % are between 18-24 years
age group, 60.68% are between 25-34 years age group, 22.22 % are between 35-44
years age group, 9.40 % are between 45-54 years age group and 5.98 % are between
55-64 years age group.
1.71%
60.68%
22.22%
9.40%
5.98%
18 - 24 25 - 34 35 - 44 45 - 54 55 -64

52
4.2.1.3 Race The race group of the respondents are illustrated in Figure 4.3
Figure 4.3. What is your race?
Figure 4.3 represents the racial demographics it is divided into 53.85 % of African’s which
make of the majority followed by 32.48 % Indian’s, 8.55 % Coloured’s and 5.13 % Whites
that make up the minority.
32.48%
8.55%
5.13%
53.85%
INDIAN WHITE COLORED BLACK

53
4.2.1.4 Job Position The job positions that the respondents occupy are illustrated in Figure 4.4
Figure 4.4.What is your current position?
Figure 4.4 represents the current position the respondents occupy, majority of the
respondents were made up of technicians which comprised of 66.67 %, engineers made
up 28.21 % and technologists made up 5.13 %.
66.67%
5.13%
28.21%
0
10
20
30
40
50
60
70
Technicians Technologists Engineers
Technicians
Technologists
Engineers

54
4.2.1.5 Qualification The qualification of the respondents are illustrated in Figure 4.5
Figure 4.5. What is your qualification?
Figure 4.5 represents the different levels of qualifications amongst the respondents. 41.88
% are holders of B Tech Degree which is the majority, BSc Degree’s make up 28.21 %
followed by 24.79 % which comprise of National Diploma’s. Both National Higher
Diploma’s and other qualifications both make up the minority at 2.56 % each.
41.88%
28.21%24.79%
2.56% 2.56%
0.00
5.00
10.00
15.00
20.00
25.00
30.00
35.00
40.00
45.00
B Tech Degree BSc Degree NationalDiploma
National HigherDiploma
Other

55
4.3 Motivational Factors
The responses for the motivational factors were obtained from Questions 6-10. These
questions take into account the different factors of motivation that bring about job
satisfaction amongst employees.
4.3.1 Achievement The respondents’ views towards the sense of achievement they feel on completion of
their task are illustrated in Figure 4.6.
Figure 4.6 Do you feel a sense of achievement on completion of your task?
Figure 4.6 illustrates that 56.41 % of the respondents agree that they feel a sense of
achievement on completion of a task, 34.19 % strongly agree. 5.13 % of the respondents
feel that they are undecided and the remaining 4.27 % are in disagreement (disagree and
strongly disagree).
0.85%3.42%
5.13%
56.41%
34.19%
0.00
10.00
20.00
30.00
40.00
50.00
60.00
StronglyDisagree
Disagree Undecided Agree Strongly Agree
Pe
rce
nta
ge %

56
4.3.2 Recognition The respondents’ views towards the recognition they receive for the work they perform
are illustrated in Figure 4.7.
Figure 4.7. Do you receive recognition for the work you perform?
According to Figure 4.7, 45.30 % of the respondents agree that they receive recognition
for the work they perform, while 25.64 % are undecided and 19.66 % disagree. This figure
shows that 5.98 % strongly agree and 3.42 % strongly disagree.
3.42%
19.66%
25.64%
45.30%
5.98%
0.00
5.00
10.00
15.00
20.00
25.00
30.00
35.00
40.00
45.00
50.00
StronglyDisagree
Disagree Undecided Agree StronglyAgree
Pe
rce
nta
ge %

57
4.3.3 Work Itself The respondents’ views towards the work they perform being meaningful, interesting and
challenging are illustrated in Figure 4.8.
Figure 4.8 Do you find the work meaningful, interesting and challenging?
Figure 4.8 represents that 58.12 % of respondents agree that they find the work itself
meaningful, interesting and challenging followed by 18.80 % who strongly agree while
12.82 % remained undecided. Those who disagree make up 9.40% and those who
strongly disagree make up 0.85 %.
0.85%
9.40%12.82%
58.12%
18.80%
0.00
10.00
20.00
30.00
40.00
50.00
60.00
70.00
StronglyDisagree
Disagree Undecided Agree StronglyAgree
Pe
rce
nta
ge %

58
4.3.4 Responsibility The respondents’ views towards the responsibility that they are given for the work they
perform are illustrated in Figure 4.9
Figure 4.9. You are given complete responsibility for your work?
Figure 4.9 reveals that 78.63 % of respondents are in agreement (agree and strongly
disagree) that they are given complete responsibility for the work they perform, 8.55 % of
the respondents are undecided and 12.82 % are in disagreement (disagree and strongly
disagree).
1.71%
11.11%8.55%
48.72%
29.91%
0.00
10.00
20.00
30.00
40.00
50.00
60.00
StronglyDisagree
Disagree Undecided Agree StronglyAgree
Pe
rce
nta
ge %

59
4.3.5 Growth and Advancement
The respondents’ views towards growth and advancement within the organisation are
illustrated in Figure 4.10
Figure 4.10.There are opportunities for growth and advancement in the organisation?
Figure 4.10 represents the responses for the opportunities for growth and advancement.
Disagreement makes up majority of the response, 20.51 % strongly disagree and 29.06
% disagree. 17.09 % are undecided while 26.50 % agree and 6.84% strongly agree.
20.51%
29.06%
17.09%
26.50%
6.84%
0.00
5.00
10.00
15.00
20.00
25.00
30.00
35.00
StronglyDisagree
Disagree Undecided Agree Strongly Agree
Pe
rce
nta
ge %

60
4.4 Hygiene factors
The responses for the hygiene factors were obtained from Questions 11-16. These
questions take into account the different hygiene factors that bring about job
dissatisfaction amongst employees.
4.4.1 Supervisor Relationship The respondents’ views towards the relationship with their supervisor are illustrated in
Figure 4.11.
Figure 4.11. I have a good relationship with my supervisor?
The supervisor relationship is represented in Figure 4.11.This shows that 62.9 % of the
respondents agree that they have a good relationship with their supervisors, 23.28 %
strongly agree, 7.76 % remain undecided and 3.45 % disagree and strongly disagree.
3.45% 3.45%7.76%
62.93%
23.28%
0.00
10.00
20.00
30.00
40.00
50.00
60.00
70.00
StronglyDisagree
Disagree Undecided Agree StronglyAgree
Pe
rce
nta
ge %

61
4.4.2 Peer Relationship The respondents’ views towards the relationship with their peers are illustrated in Figure
4.12.
Figure 4.12. I have a good relationship with my peers?
Figure 4.12 illustrates that the peer relationship the respondents experience. Majority of
66.67 % agree to have a good peer relationship followed by 29.91 % who strongly agree
while 2.56 % are undecided about their peer relationship and 0.86% are in strong
disagreement.
0.85% 0.00% 2.56%
66.67%
29.91%
0.00
10.00
20.00
30.00
40.00
50.00
60.00
70.00
StronglyDisagree
Disagree Undecided Agree StronglyAgree
Pe
rce
nta
ge %

62
4.4.3 Physical Working Conditions The respondent’s views towards the physical working conditions are illustrated in Figure
4.13.
Figure 4.13 The physical working conditions are safe clean and hygienic?
Figure 4.13 represents the physical working conditions with emphasis on safety,
cleanliness and overall hygiene which are experienced by the respondents. The
responses indicate that 52.99% agree with the conditions being safe, clean and hygienic,
18.80 % disagree, 15.38 % are undecided about the physical conditions, 10.26 % strongly
agree and 2.56 % strongly disagree.
2.56%
18.80%15.38%
52.99%
10.26%
0.00
10.00
20.00
30.00
40.00
50.00
60.00
StronglyDisagree
Disagree Undecided Agree StronglyAgree
Pe
rce
nta
ge %

63
4.4.4 Salary Structure The respondents’ views towards the salary structure within the organisation are illustrated
in Figure 4.14.
Figure 4.14 I am satisfied with the salary structure?
Figure 4.14 highlights the preception of the respondents that are satisfied with the salary
structure, 35.90 % disagree followed by 33.33 % who agree, 16.24 % strongly disagree.
12.82 % are undecided and 1.71 % strongly agree.
16.24%
35.90%
12.82%
33.33%
1.71%
0.00
5.00
10.00
15.00
20.00
25.00
30.00
35.00
40.00
StronglyDisagree
Disagree Undecided Agree Strongly Agree
Pe
rce
nta
ge %

64
4.4.5 Job Security The respondents’ views towards the job security provided by their organisation are
illustrated in Figure 4.15.
Figure 4.15. My organisation provides job security?
Figure 4.15 represents the respondents’ views with regard to the organisation providing
job security. 59.48 % agree followed by 35.34 % that strongly agree, 2.59 % disagree and
1.72 % are either undecided and strongly disagree.
1.72% 2.59% 1.72%
59.48%
35.34%
0.00
10.00
20.00
30.00
40.00
50.00
60.00
70.00
StronglyDisagree
Disagree Undecided Agree StronglyAgree
Pe
rce
nta
ge %

65
4.4.6 Company Policy The respondents’ views towards the company policy being fair and clear are illustrated in
Figure 4.16.
Figure 4.16 The company policy is fair and clear?
With regards to the fairness and clarity of the company policy, Figure 4.16 indicates that
39.32 % agree, 23.93 % being undecided, 23.08 % disagree and 6.84 % both strongly
agree and disagree.
6.84%
23.08% 23.93%
39.32%
6.84%
0.00
5.00
10.00
15.00
20.00
25.00
30.00
35.00
40.00
45.00
StronglyDisagree
Disagree Undecided Agree StronglyAgree
Pe
rce
nta
ge %

66
4.5 Overall Satisfaction
The response for the overall satisfaction were obtained from Questions 17.
The respondents’ views towards their overall job satisfaction are illustrated in Figure 4.17.
Figure 4.17 Overall I am satisfied with my job?
The overall job satisfaction of the respondents is shown in Figure 4.17. It can be seen
that majority of the respondents which makes up 58.12 % agree that they are satisfied
with their job, this is followed by 19.66 % who are undecided, 17.09 % that disagree, 3.42
% strongly agree and 1.72 % who strongly disagree.
4.6 Measure of central tendency and dispersion
This section includes the means, standard deviation, minimum and maximum values
which were calculated from the descriptive statistics based on the questionnaire. Table
4.1 relates to the motivational factors. Table 4.2 relates to the hygiene factors and table
4.3 relates to the overall job satisfaction. These tables indicates the average responses
for each of the questions and the deviation in responses from the average response.
1.71%
17.09%19.66%
58.12%
3.42%
0.00
10.00
20.00
30.00
40.00
50.00
60.00
70.00
StronglyDisagree
Disagree Undecided Agree StronglyAgree
Pe
rce
nta
ge %
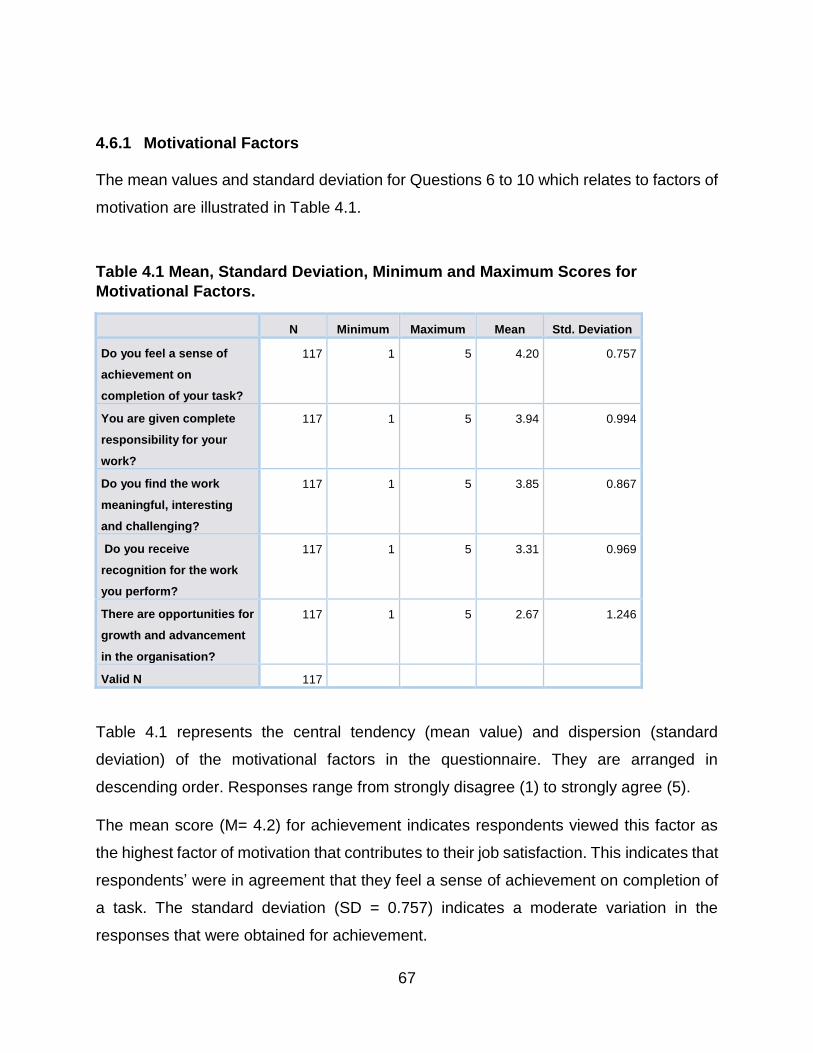
67
4.6.1 Motivational Factors The mean values and standard deviation for Questions 6 to 10 which relates to factors of
motivation are illustrated in Table 4.1.
Table 4.1 Mean, Standard Deviation, Minimum and Maximum Scores for
Motivational Factors.
N Minimum Maximum Mean Std. Deviation
Do you feel a sense of
achievement on
completion of your task?
117 1 5 4.20 0.757
You are given complete
responsibility for your
work?
117 1 5 3.94 0.994
Do you find the work
meaningful, interesting
and challenging?
117 1 5 3.85 0.867
Do you receive
recognition for the work
you perform?
117 1 5 3.31 0.969
There are opportunities for
growth and advancement
in the organisation?
117 1 5 2.67 1.246
Valid N 117
Table 4.1 represents the central tendency (mean value) and dispersion (standard
deviation) of the motivational factors in the questionnaire. They are arranged in
descending order. Responses range from strongly disagree (1) to strongly agree (5).
The mean score (M= 4.2) for achievement indicates respondents viewed this factor as
the highest factor of motivation that contributes to their job satisfaction. This indicates that
respondents’ were in agreement that they feel a sense of achievement on completion of
a task. The standard deviation (SD = 0.757) indicates a moderate variation in the
responses that were obtained for achievement.

68
The mean score (M= 3.94) for responsibility is the second highest factor of motivation that
the respondents’ view as contributor to job satisfaction. It indicates that the respondents
were in agreement that they are given complete responsibility for the task they perform.
The standard deviation (SD= 0.994) indicates a large variation in response from the
respondents with regards to responsibility as a factor of job satisfaction.
The mean score (M =3.85) for the work itself indicates that the respondents’ were in
agreement that the work itself is a contributor towards their job satisfaction. The standard
deviation (SD= 0.867) indicates a moderate variation in the responses obtained from the
participants.
The mean score (M= 3.31) for recognition as factor that contributes to job satisfaction,
indicates that the respondents were in agreement that they are given recognition for the
work they perform. The standard deviation (SD=0.969) indicates a large variation in the
responses received with regard to this factor of job satisfaction.
Growth and advancement received the lowest mean score (M=2.67) of all the motivational
factors and indicates that the respondents were in disagreement with growth and
advancement as a contributor towards job satisfaction. The standard deviation
(SD=1.246) indicates an extremely large variation from average responses obtained.

69
4.6.2 Hygiene Factors The mean values and standard deviation for Questions 11 to 16 which relates to hygiene
factors are illustrated in Table 4.2.
Table 4.2 Mean, Standard Deviation, Minimum and Maximum Scores for Hygiene Factors.
N Minimum Maximum Mean Std. Deviation
I have a good relationship
with my peers?
117 1 5 4.25 0.586
My organisation provides
job security?
117 1 5 4.23 0.759
I have a good relationship
with supervisor?
117 1 5 3.98 0.871
The physical working
conditions are safe, clean
and hygienic?
117 1 5 3.50 0.997
The company policy is fair
and clear?
117 1 5 3.16 1.074
I am satisfied with the
salary structure?
117 1 5 2.68 1.150
Valid N 117
Table 4.2 represents the central tendency and dispersion of the hygienic factors in the
questionnaire. They are arranged in descending order. Responses range from strongly
disagree (1) to strongly agree (5).
The interpersonal relationship as a hygienic factor can be broken up into two aspects
which are as follows: relationship with your supervisor and relationship with your peers.
The highest mean score (M= 4.25) is from an aspect of interpersonal relationship. The
peer relationship indicates that the respondents were in agreement that the relationship
with their supervisor is good and not a contributor towards dissatisfaction. The standard

70
deviation (SD =0.586) is a moderate and indicates a slight variation form the mean score
which indicates that the respondents were still in agreement that they have a good peer
relationship.
Job security produced a mean score (M= 4.23) indicating that the respondents were in
agreement that the organisation provides job security. This indicates that job security
cannot be considered as a hygiene factor. The deviation (SD =0.759) is moderate and
indicates a slight variation from the mean result obtained.
The mean score (M= 3.98) for the supervisor relationship which is the second aspect of
the interpersonal relationship indicates that the respondents were in agreement that a
good relationship exist with their supervisor. This factor cannot be considered as a
hygiene factor that promotes dissatisfaction. The deviation (SD =0.871) is moderate
variation from the mean results.
The mean score (M= 3.50) for the physical working conditions indicate that the
respondents were in agreement that the physical condition are good in which they work
in. The standard deviation (SD = 0.997) indicates a large variation in the results. This
factor cannot be consider to be a hygiene.
The mean score (M = 3.16) for the company policy being fair indicates that the
respondents were in agreement that the company policy is fair and clear. The standard
deviation (SD = 1.074) indicates an extremely large variation in the responses regarding
company policy. Company Policy cannot be considered as a contributing factor to job
dissatisfaction.
The salary structure obtained the lowest mean score (M = 2.68) which indicates that the
respondents were disagreement with being satisfied with the salary structure. The
standard deviation (SD= 1.150) indicates an extremely large variation in the responses.
The salary structure can be considered to be a hygiene factor that contributes to
dissatisfaction.

71
4.6.3 Overall Satisfaction The mean values and standard deviation for Questions 17 which relates to the overall job
satisfaction of the respondents is illustrated in Table 4.3.
Table 4.3 Mean, Standard Deviation, Minimum and Maximum Scores for Overall Satisfaction.
N Minimum Maximum Mean Std. Deviation
Overall I am Satisfied with
my job?
117 1 5 3.44 0.875
Valid N 117
Table 4.3 indicates the mean score (M= 3.44) that was obtained for the overall job
satisfaction indicating that respondents were in agreement that overall they are satisfied
with their job. The standard deviation (SD = 0.875) indicates a moderate variation in the
results.
4.7 Inferential Statistics
Inferential statistics test were conducted to determine the reliability of the questionnaire
by means of a Cronbach’s alpha test. The strength of association between motivational
factors, hygiene factors and job satisfaction was conducted by correlation analysis and
multiple regression analysis.

72
4.7.1 Reliability Analysis The reliability analysis of the question is presented in Table 4.4. Table 4.4 Reliability Analysis
Cronbach's
Alpha N of Items
.724 13
Table 4.4 indicates the measurement for the reliability of the questionnaire which is given
by the measure of the Cronbach's Alpha of 0.724. A Cronbach's Alpha result of ˃ 0.7
indicates that the internal consistency of the questionnaire is good (Table 3.2).
4.7.2 Regression Analysis The multiple linear regression analysis that was conducted between the independent
variables and dependent variable is shown in Table 4.5. Multiple linear regression was
used cause the Likert scale data is parametric.
Table 4.5 Multiple Regression Analysis between factors of motivation and job satisfaction.
Model R R Square
Adjusted R
Square
Std. Error of the
Estimate
1 0.692a 0.479 0.425 0.664
The results from the multiple regression analysis in Table 4.5 indicate that there is a
moderate and positive relationship between all the dimensions of motivation and job
satisfaction this is given by the adjusted R square value of r = 0.425. This show that the
independent variables (motivation and hygienic factors) have a positive impact on the
dependent variable (job satisfaction).

73
Table 4.6. ANOVA results for the Regression Analysis.
The results for the Anova table is shown in table 4.6
ANOVAa
Model Sum of
Squares df Mean
Square F Sig.
1 Regression 42.595 11 3.872 8.783 .000b
Residual 46.294 105 .441
Total 88.889 116
The Anova results from table 4.6 indicate that the regression model is statistically
significant at 0.05 level of significance.

74
4.7.3 Correlation Analysis The correlation analysis between factors of motivation, hygiene and the overall level of
job satisfaction are indicated in Table 4.7.
Table 4.7 Pearson’s Correlation Analysis between the factors of motivation and Overall Job Satisfaction.
Correlation
Pearson Correlation Sig. (2-tailed) N
Do you feel a sense of achievement on completion of your task? .296** .001
117 Do you receive recognition for the work you perform? .366** .000
117 Do you find the work meaningful, interesting and challenging? .352** .000
117 You are given complete responsibility for your work? .308** .001
117 There are opportunities for growth and advancement in the organisation?
.248** .007
117 I have a good relationship with supervisor? .451** .000
117 I have a good relationship with my peers? .136 .143
117 The physical working conditions are safe, clean and hygienic? .220* .017
117 I am satisfied with the salary structure? .346** .000
117 My organisation provides job security? .386** .000
117 The company policy is fair and clear? .326** .000
117
**. Correlation is significant at the 0.01 level (2-tailed).
*. Correlation is significant at the 0.05 level (2-tailed).
Table 4.7 represents the strength and direction of the relationship between each
independent variable (factor of motivation) and the dependent variable (job satisfaction).

75
The Pearson Product Movement Coefficient Correlation was used to determine the
correlation (Likert scale data) between motivational factors, hygiene factors and the
overall level of job satisfaction. The values of the correlation coefficient range from the
lowest value of 0.02 to the highest value of 0.452.
Achievement: The result depicts that there is a small and positive relationship which is
statistically significant, between achievement and job satisfaction. This is indicated by the
following results (r=0.296, p=0.001).
Recognition: The result depicts that there is a small and positive relationship which is
statistically significant between recognition and job satisfaction. This is indicated by the
following results (r= 0.366, p=0.000).
Work itself: The result depicts that there is small and positive relationship which is
statistically significant between work itself and job satisfaction. This is indicated by the
following results (r=0.352, p=0.000).
Responsibility: The result depicts that there is a small and positive relationship which is
statistically significant between responsibility and job satisfaction. This is indicated by the
following results (r= 0.308, p = 0.001).
Growth and Advancement: The result depicts that there is a small and positive
relationship which is statistically significant between growth and advancement and job
satisfaction. This is given by the following results (r=0.248, p= 0.007).
Supervisor relationship: The result depicts that there is a moderate and positive
relationship which is statistically significant between supervisor relationship and job
satisfaction. This is given by the following results (r=0.451, p= 0.000).
Physical working conditions: The result depicts that there is a small and positive
relationship which is statistically significant between physical relationship and job
satisfaction. This is given by the following results (r=0.220, p= 0.017).
Salary structure: The result depicts that there is a moderate and positive relationship
which is statistically significant between salary structure and job satisfaction. This is given
by the following results (r=346, p = 0.000).

76
Job security: The result depicts that there is a moderate and positive relationship which
is statistically significant, between job security and job satisfaction. This is indicated by
the following results (r=0.398, p =0.000)
Company policy: The result depicts that there is a small and positive relationship which
is statistically significant, between company policy and job satisfaction. This is given by
the following results (r=0.326, p= 0.000).
Peer relation: The result depicts that there is a small and positive relationship which is not
statistically significant, between peer relationship and job satisfaction. This is given by the
following results (r=0.130, p= 0.163).
4.8 Summary
The results of the study were presented in the form of descriptive statistics, measures of
central tendency and dispersion and inferential statistics. The data was also given a
graphical outlook along with tabulated information in the responses received from
respondents. The results outlined that the responses obtained from the questionnaire
played a pivotal role in answering the research questions and achieving the research
objectives outlined. The next chapter focuses on the discussion of the results and relates
the findings to literature.

77
CHAPTER FIVE
DISCUSSION OF RESULTS
5.1 INTRODUCTION
This chapter deals with the discussion of the results that were presented in Chapter Four
in conjunction with the literature review presented in Chapter Two regarding motivation
and job satisfaction. This will be used in explaining the research objectives that were
presented in Chapter One. The empirical study conducted will provide the data that
supports the discussion of the results.
5.2 Objective One
This objective set out to determine the factors that motivate job satisfaction.
5.2.1 Achievement The responses received in the current study, with regard to achievement as a motivational
factor, showed that majority of the respondents were in agreement that they felt a sense
of achievement on completion of a task and viewed achievement as a factor that
contributed toward their level of motivation. Figure 4.6 indicates that a total of 90.6 % of
the responses were in agreement (agree and strongly agree) with Question 6 which
relates to achievement. Table 4.1 indicates a mean score (M = 4.2) for achievement which
further indicates that the average response gather indicated that the respondents were in
agreement with feeling a sense of achievement on completing a task.
This finding is supported by the literature in Chapter two on Herzberg’s Two Factor Theory
of motivation which list achievement as a motivational factor. Previous studies conducted
on motivational factors and job satisfaction has also concluded that achievement was a
source of motivation and job satisfaction. The following studies strengthen the finding of
the current study.
Achievement was proven to have a positive effect on job satisfaction according to a study
conducted by Raza, Akhtar and Husnain.(2015) which investigated the impact that

78
various intrinsic motivational factors had on job satisfaction. For a percentage increase in
achievement one can expect a 23.7 percent increase in motivation and job satisfaction.
Achievement was found to have a positive and significant relationship between motivation
and job satisfaction according to respondents who took part in the study. This supports
the researcher’s hypothesis that achievement is an important variable in explaining the
employee’s levels of job satisfaction ( Malik, et al. 2012).
It is conclusive from the findings in the current study, literature review and finding from
previous studies conducted, that achievement was found to be a factor that motivates job
satisfaction in the current study.
5.2.2 Recognition The empirical evidence gathered in the current study indicates that recognition can be
viewed as a motivational factor which is in agreement with Herzberg’s Two Theory
discussed in Chapter two which established recognition as a factor of motivation.
The finding of the study indicates that 51.28 % of the respondents were in agreement that
they had felt a sense of recognition for the work they perform (Question7). From table 4.1
the mean value (M=3.94) obtained for the average response which indicates that the
respondents were in agreement that they received recognition for they work they perform.
In a study conducted by Waqas, Bashir, Sattar and Abdulla ( 2014), it was found that
recognition was the most important motivational factor that impacts job satisfaction and it
had a direct and statistically significant relationship that was justified with the regression
analysis conducted from the responses gathered during the study (r=0.498,p˂0.001) on
job satisfaction.
A study conducted amongst hotel staff in India indicated that a direct and positive
relationship existed between recognition and job satisfaction, the research translated the
finding of the study by concluding that the greater the recognition that employees received
the greater their levels of motivation and job satisfaction (Sarwar and Abugre, 2013).
Manzoor (2011) identified recognition as a factor that contributed to employee motivation.

79
A positive relationship between motivation and recognition was found which was further
supported by the empirical evidence of the current study. It is conclusive from the findings
in the current study, literature review and finding from previous studies conducted, that
recognition was found to be a factor that motivates job satisfaction in the current study.
5.2.3 Work Itself With regard to work itself (Question 8) addressed in the current study, Figure 4.8 indicates
that the respondents were in agreement (76.3 %), they found the work itself in which they
are engaged in to be meaningful, interesting and challenging. The mean score of 3.85
(Table 4.1) was obtained for the average response indicated that respondents were in
agreement with the work itself being meaningful, interesting and challenging .
Motivational Theory reviewed in Chapter two regards the work itself as a motivational
factor. This supports the finding of the current study. To further support the empirical
evidence of the current study, alternate studies conducted explored the work itself as a
factor of motivation are discussed below. Raza, et al. (2015) accepted the null hypothesis
which stated that work itself had a positive effect on job security. The empirical evidence
suggested that there was a positive relationship between the work itself and job
satisfaction, a percentage change in the work itself increased the level of job satisfaction
by 19.6 %. Raza, et al. (2015) stated that work itself is considered as a factor of motivation
that had a positive impact on job satisfaction.
In a study conducted by Malik, et al. (2012) amongst 250 employees across different
sectors, it was concluded that the relationship between the work itself and job satisfaction
was positive and statically significant. The respondents perceived their work to be
interesting, meaningful and challenging. Thus describing the work itself as a motivational
factor that contributed to their level of job satisfaction amongst a diverse group of
employees belonging to various sectors. It is conclusive from the findings in the current
study, literature review and finding from previous studies conducted, that work itself was
found to be a factor that motivates job satisfaction in the current study.

80
5.2.4 Responsibility Respondents were asked if they are given complete responsibility for the work they
perform (Question 9). The analysis of the data collected revealed that majority of the
respondents (76.63 %) were in agreement that they were given complete responsibility in
carrying out their work. Figure 4.9 provides a graphical representation on the responses
gathered. Table 4.1 indicates a mean score of 3.31 which indicates that the respondents
were in agreement that responsibility is given to them with regards to the work they
undertake.
The motivational theory discussed in Chapter Two indicates that Herzberg’s Two Factor
Theory regarded responsibility as a factor that contributes towards motivation. Alternate
studies which were conducted proved that responsibility was regarded as a contributing
factor of motivation. Responsibility was found to have a positive effect on job satisfaction
according to Raza, et al. (2015 ), this study was conducted amongst employees in the
city of Islamabad. It is conclusive from the findings in the current study, literature review
and finding from previous studies conducted that, responsibility was found to be a factor
that motivates job satisfaction in the current study.
5.2.5 Growth and Advancement The responses gathered from growth and advancement as a factor motivation indicates
that the opportunities for growth and advancement within the organisation (Question 10)
was met with a 49.56 % majority of the respondents who were in disagreement, 33.33 %
who were in agreement and 17.09 % who were undecided with the opportunities for
growth and advancement (Figure 4.10). A mean score of 2.67 (Table 4.1) was obtained
indicating that respondents were in disagreement with opportunities for growth and
advancement in the organisation.
The empirical evidence gathered from the current study is contrary to Herzberg’s theory
which regarded growth and advancement as a factor of motivation. The results obtained
in the current study was not an isolated incident were the findings indicated that growth
and advancement do not contribute towards job satisfaction. A study conducted by Parvin

81
and Karbin (2011) established that growth and advancement was not perceived by
employees as a factor that contributed to their level of motivation and job satisfaction. The
average response collected, noted that employees feel unhappy with the opportunities
for advancement within the pharmaceutical sector. It was concluded from the study that
growth and advancement had a direct and positive relationship on job satisfaction.
It is conclusive from the findings in the current study, literature review and finding from
previous studies conducted, that growth and advancement was not found to be a factor
that motivates job satisfaction in the current study.
5.3 Objective Two
This objective set out to establish the factors that influence dissatisfaction.
5.3.1 Supervisor Relationship The current study shows that the respondents viewed their relationship with their
supervisors to be good. A majority of 86.21 % (Figure 4.11) of the respondents were in
agreement that they have a good relationship with their supervisor (Question 11). A mean
value of 3.98 was obtained for the supervisor relationship which indicates that the
respondents were in agreement that they have a good relationship with their supervisors.
The empirical evidence gathered from the current study is contrary to Herzberg’s Two
Theory which regarded peer relationship as a factor of dissatisfaction.
Herzberg classified supervisor relationship as a hygienic factor which brought about
dissatisfaction, which does not contribute to employee motivation according to the
literature review. An assumption can be made based on the finding of the study, that
supervisor relationships can lead one to be of the view that the supervisors (manager)
have adopted the Theory Y (Aina, 2014) approach in how they perceive their subordinates
to be in the workplace.
The findings of the current study were supported by Shah,Rehman, Akhtar, Zafar and
Riaz (2012) who conducted a study amongst teachers and found that the highest positive

82
correlation amongst all factors of motivation was between the supervisor relationship and
job satisfaction. Employees viewed supervisor relationship as a motivational factor which
contributed towards their level of job satisfaction.
It is conclusive from the findings in the current study, literature review and finding from
previous studies conducted that supervisor relationship was not found to be a factor that
influence job dissatisfaction.
5.3.2 Peer Relationship The responses gathered from the current study indicates that 96.58 % of the respondents
were in agreement that they have a good relationship with their peers (Figure 4.12). A
mean score of 4.25 was obtained which is the highest mean score amongst all hygiene
factors (Table 4.1). This indicated that respondents were in agreement to having a good
peer relationship. The respondents did not perceive peer relationship to be a hygiene
factor causing dissatisfaction.
The empirical evidence gathered from the current study is contrary to Herzberg’s Two
Theory which regarded peer relationship as a factor of dissatisfaction. A study conducted
in the pharmaceutical industry found that the peer relationship between employees
influenced the employees motivation and job satisfaction in both a positive or negative
way (Parvin and Karbin,2011). The mean score of 3.3 for peer relationship indicated that
employees were satisfied with their peer relationship.
In a similar study conducted in the construction sector in Iran by Chevalier (2015), it was
found that peer relationship amongst employees was an important motivational factor.
The results of the study indicated that peer relations is of equal importance as
achievement and advancement which are factors of motivation that influence job
satisfaction. It is conclusive from the findings in the current study, literature review and
finding from previous studies conducted that peer relationship was not found to be a factor
that influence job dissatisfaction.

83
5.3.3 Physical Working Conditions The current study shows 63.25 % of the respondents were in agreement that the physical
working conditions are clean, safe and hygienic (Figure 4.15). This factor has a mean
score of 3.5 which indicates that the respondents were in agreement with physical
working conditions being clean, safe and hygienic. This is contrary to Herzberg who
regarded that the physical working conditions as hygiene factor that brought about
dissatisfaction of employees in the workplace. Further studies which are discussed below
were in support of the finding in the current study. Waqas,Bashir, Sattar and Abdulla
(2014) state that in the study conducted in Pakistan, it was noted that the working
environment played a crucial role which affected the level of the employee’s job
satisfaction in a direct and positive way.
Ali, Edwin and Tirimba (2015) noted that working condition had a strong and positive
effect on employee’s job satisfaction. The employees of the Somtel group who
participated in the study revealed that 83 % of the respondents who took part in the study
agreed that working conditions had a strong and positive effect on their job satisfaction.
This study indicated that having a positive work environment affected the employees
positively which resulted in higher performance levels of the employees, this is due the
fact that working conditions proved to be a motivating factor which brought about job
satisfaction. It is conclusive from the findings in the current study, literature review and
finding from previous studies conducted that physical working conditions was not found
to be a factor that influence job dissatisfaction.
5.3.4 Salary Structure The current study noted that 52.14 % of respondent were in disagreement with being
satisfied with the salary structure within the organisation, while 35.04 % were in
agreement and 12.82 % were undecided if they were satisfied with the salary structure
as shown in Figure 4.14. Table 4.1 shows a mean value of 2.68 which indicates that the
respondents were in disagreement with being satisfied with the salary structure. The
correlation analysis indicates there is a moderate and positive relationship between salary

84
structure and the overall level of job satisfaction experienced by the respondents. These
finding were supported by Herzberg’s Two Factor Theory that classified salary structure
as a source of dissatisfaction. To further support the finding of the current study
researchers have identified the following key findings:
According to Ali, Edwin and Tirimba (2015) a study conducted on extrinsic rewards and
job satisfaction in the telecommunications sector in Somaliland found that employees
were not happy with the salary structure that was offered to them by management.
Management does not use the employee’s salary as a mechanism to motivate them in
the work place. This proved to be a factor that brought about job dissatisfaction amongst
the employees, which identified a clear and direct association between salary structure
and job satisfaction. Employees who are better remunerated are much more satisfied at
work and vice versa.
In the study conducted by Pandţa, Deri, Galambos and Galambos. (2015) the empirical
evidence showed that salary is complex issue when being regarded as motivational factor
and found that salary received from the respondents were poorly rated as a factor of
motivation. According to Pandţa, et al. (2015) salary was a significant factor that
contributes to dissatisfaction and further stated, that an individual who receives a high
income, may not be happy or satisfied but rather indicates that they are not dissatisfied .
The mean score for salary as a motivating factor of 2.4 was obtained in Postal traffic
sector in Serbia by Pandţa et al. (2015).It is conclusive from the findings in the current
study, literature review and finding from previous studies conducted that the salary
structure was found to be a factor that influence job dissatisfaction.

85
5.3.5 Job Security The responses gathered from this hygiene factor indicates that 94.82 % of the
respondents were in agreement that the organisation provides job security (Figure 4.15).A
mean score of 4.23 (Table 4.1) was obtained indicated that the respondents were in
agreement with the organisation providing job that the respondents did not perceive this
as a hygiene factor. The empirical evidence gathered from the current study was contrary
to Herzberg’s two factor theory which identified job security as a hygiene factor.
According to Parvin and Karbin (2011) a study conducted in the pharmaceutical sector
on job satisfaction found that job security influenced job satisfaction in the pharmaceutical
sector. A study conducted in both the private and public sector employees indicated that
in both sectors job security was viewed by employees as a vital factor of motivation
(Masood,2014). The study showed that there was a positive relationship between job
security and job satisfaction. Job security contributed to 9 % of the overall job satisfaction.
It is conclusive from the findings in the current study, literature review and finding from
previous studies conducted that job security was not found to be a factor that influence
job dissatisfaction.
5.3.6 Company Policy The responses gathered from the company policy being fair and clear (Question 16) was
met with a 46.16 % of the respondents who were in agreement, 29 % who were in
disagreement and 23.93 % who were undecided (Figure 4.16). The mean score of 3.16
(Table 4.1) was obtained indicated that respondents were in agreement that the company
policy is fair and clear. The empirical evidence gathered from the current study was
contrary to Herzberg’s Two Factor Theory which regarded the company policy as a
hygiene factor.
Pandţa, et al. (2015) found that employees were motivated by the company policy and
this was a factor that contributed to employee’s satisfaction rather than dissatisfaction in
the organisation. A study conducted amongst teaching staff in Ugandan university by
Pule,Mwesigye and Mbado (2014) indicated that respondents were found to be satisfied

86
with the university policies regarding promotion, reward, training and development. It is
conclusive from the findings in the current study, literature review and finding from
previous studies conducted that company was not found to be a factor that influence job
dissatisfaction.
5.4 Objective Three
This objective set out to establish the overall level of job satisfaction experienced by the
respondents. Respondents were asked if overall they were satisfied with their jobs. Figure
4.17 shows that 61.52 % of the respondents were in agreement that they were satisfied
with their jobs while the remainder were either undecided or in disagreement. A mean
value of 3.44 (Table 4.3) indicated that the respondents were in agreement in being
satisfied with their jobs.
The finding and discussion from objective two stated that the respondents were satisfied
with their lower order needs according to Maslow’s Needs Theory and according to
objective one respondents were satisfied with their higher order needs as well. The
comparison between Herzberg and Maslow as described in Chapter Two stated that
individuals who were motivated by higher order needs, first have to satisfy their lower
order needs. A clear link was proven based on the findings of the correlation and
regression analysis which established that motivation has a direct and positive impact on
job satisfaction. Taking into consideration that the respondents were satisfied by higher
order needs which promotes motivation. It can be concluded that the respondents are
motivated and satisfied in the work place as motivation is positively correlated with job
satisfaction. Overall the respondents are in agreement that they are satisfied with their
jobs. Objective three on the study was achieved which ascertained the overall level of job
satisfaction.

87
5.5 Objective Four
This objective set out to identify the impact that motivation has on job satisfaction amongst
the respondents that took part in the study. A correlation analysis was conducted to
establish the relationship that existed between factors of the factors motivation, hygiene
factors and the overall level of job satisfaction. A regression analysis was conducted
which established how the independent variables (factors of motivation and hygiene
factors) impacts the dependent variable (overall job satisfaction).
The results and discussion around both these analysis was conducted in Chapter Four,
reference will be made to Tables 4.5, 4.6 and 4.7, including the discussions around them.
The correlation analysis between each of the motivational factors and overall job
satisfaction indicated that there was a small but positive relationship that existed with
each factor of motivation and the overall level job satisfaction as shown in Table 4.7. It
was noted that each relationship tested was statistically significant.
A correlation analysis was conducted between each hygiene factors and the overall level
of job satisfaction which indicated that a small and positive relationship exists between
each hygiene factor and the overall level of job satisfaction as shown in Table 4.7. All the
relationships proved to be statistically significant, the only exception to this was the
relationship between the peer relationship and the overall level of job satisfaction which
was not statistically significant. The results obtained from the multiple regression analysis
indicated that 42.5 % of the variation in the overall level job satisfaction was attributed
from both motivational factors and hygiene factors (Figure 4.5).The multiple regression
model is statistically significant at a 0.05 level of significant (Table 4.6).
Based on the empirical evidence from both the correlation and regression analysis
conducted in the current study it was found that motivation has a direct and positive
impact on the respondents overall level of job satisfaction. Respondents who are
motivated or have high levels of motivation based on the factors which were discussed in
the study will experience high levels of job satisfaction and the opposite can be said for
respondents who experienced low levels of motivation will experience low levels of job
satisfaction in the workplace. Previous studies conducted on the relationship and impact

88
that motivation had on job satisfaction are discussed below and can be used to strengthen
the finding of the current study.
A study conducted on selected sales representatives concluded that motivation has a
positive relationship with job satisfaction. (Ogunnaike, et al., 2014)The results from a
study conducted on teachers in the public sector by Shah, et al. (2012) supported the
finding of the current study conducted at eThekwini Electricity which proved a positive
relationship exist between motivation and job satisfaction. The results of the study
conducted by Shah, et al. (2012) on selected factors of motivation and job satisfaction
were as follows:
The correlation analysis conducted between the following factors of motivation and job
satisfaction yielded the following results: supervision (r = 0.62), rewards and recognition
(r= 0.52), work itself (r= 0.43). The regression analysis between these factors of
motivation and job satisfaction yielded the following results: supervision (r= 0.4043),
rewards and recognition (r= 0.1474), work itself (r= 0.2892). The difference in values were
attributed to the fact that the study was conducted in Pakistan amongst teachers in a
public sector.
According to Chevalier (2015) a study conducted amongst three levels of employees
namely: workers, office staff and managers at a Concrete factory in Iran highlighted that
motivational factors had a significant impact on job satisfaction. According to Toe, et al.
(2013) the study conducted amongst 40000 employees at IBM was to determine the
correlation between job satisfaction and motivation. The study found that a positive
correlation existed between job satisfaction and motivation amongst the employees at
IBM. A study conducted by Scheers and Botha (2014) amongst employees and
customers in a customer service environment, proved by means of a quantitative
analysis, a positive correlation existed between motivation and job satisfaction amongst
employees. Objective four of the study was achieved, from the evaluation based on the
regression and correlation analysis it was found that motivation has a direct and positive
impact on job satisfaction.

89
5.6 Summary
This chapter accomplished the research objectives that were outlined in the study. The
factors that motivate job satisfaction were determined, factors that influence job
dissatisfaction were established, the impact of motivation on job satisfaction was
evaluated and the overall level of job satisfaction was ascertained. The next chapter
presents the key finding of the study, recommendations and recommendations for future
studies.

90
CHAPTER SIX
RECOMMENDATIONS AND CONCLUSION
6.1 Introduction
This chapter will explore the key findings of the study, recommendations based on the
study as well as recommendations for future studies to be conducted.
6.2 Key Findings
The current study investigated a sample size of 117 employees from the target
population. This was accomplished by means of stratified random sampling and research
questionnaires that were distributed amongst the respondents. An extensive literature
review was conducted to provide a more structured approach in analysing and
interpreting the findings of the study.
The results obtained were used to establish the key findings which aided in accomplishing
the research objectives set out in Chapter One. The outcomes from the current study
developed the following key finding for each objectives.
6.2.1 Objective One Amongst the motivational factor according to Herzberg’s Two Factor Theory that led to
job satisfaction the following was noted: Achievement ranked the highest of all factors,
followed by responsibility thereafter by the work itself and lastly recognition. These factors
were found to factors that motivate job satisfaction amongst the respondents. Growth and
advancement was not found to be a factor that motivate job satisfaction. They are of the
view that there is very little or not much room for growth and advancement within the
organisation and reached a glass ceiling within the organization.

91
6.2.2 Objective Two This took into account the hygiene factors which are responsible for dissatisfaction
according to Herzberg’s Two Factor Theory. From the study it was found that the only
factor that influence job dissatisfaction was the salary structure. Hygiene factors such as
supervisor and peer relationship, job security, physical working conditions, and company
policy were not found to be factors that influence job dissatisfaction by the respondents
as traditionally believed by Herzberg. These four factors do not bring about dissatisfaction
and should not to be mistaken as factors that will lead to or improve employee motivation
and job satisfaction.
6.2.3 Objective Three This objective set out to evaluate the impact that motivation has on job satisfaction
amongst the respondents. The current study established by conducting both a correlation
and regression analysis that there is a positive relationship that exist between motivation
and job satisfaction. The correlation analysis gave an indication that both motivational
and hygiene factors have a direct and positive relationship on the overall level job
satisfaction amongst respondents and the regression analysis explained that there is a
relationship between independent variables and dependent variable. The relationship
between the independent variables and dependent variable pointed out that 42.5 % of the
variation in job satisfaction was attributed to both the motivational and hygiene factors.
The findings highlighted the importance that the motivation of employees has on their
overall level job satisfaction. A correlation and regression analysis was conducted and
both confirm that a positive relationship exist between both variables. The more motivated
the respondents were the more satisfied they are in their jobs and vice versa.
6.2.4 Objective Four The aim of this objective was to ascertain the overall level of job satisfaction amongst the
respondents by taking a practical approach, having the respondents answer if overall they
are satisfied with their jobs opposed to the summation of mean scores for the motivation

92
and hygiene factors. It was found that 61.5 % of all respondents were in agreement that
overall they were satisfied with the jobs (Figure 4.17) and a mean score of 3.44 (Table
4.3) indicates that respondents were in agreement that overall they were satisfied with
their jobs
6.3 Recommendations
It is important for the organisation to have an in-depth understanding as to what exactly
motivates and demotivates their employees, what brings about employee satisfaction and
dissatisfaction, in order for the organisation to be successful. Having such a wealth of
knowledge can assist management and policy makers within the organisation to
understand what are the driving factors behind their employees.
Below is a list of recommendations that can be used to encourage management and the
human resources team to help develop and empower these selected groups of
employees in order to boost their levels of motivation which will have a direct and positive
impact on their overall level of job satisfaction, producing higher levels of job satisfaction
amongst the respondents. A workforce that is highly motivated and satisfied can be of a
strategic significance to the organisation. The recommendations were based on the
outcomes of the current study and can be implemented by the organisation in order to
maintain and improve the level of employee satisfaction. This is presented in a practical
and holistic manner. No recommendations have be made for hygiene factors such job
security as respondents view their job to be secure, the primary reason for this is that
eThekwini electricity falls under the municipality which forms part of the local government
structure and is not a competitive environment unlike their counter parts in other countries
that are private run utilities. The changing of company policy presents its difficulties in
large organisations such as the municipality. The company policy is not only applicable
to employees of the electricity department but to all employees within the municipality and
the findings of this current study may differ between the various divisions in the
municipality, therefore recommendations to company policy should be looked at across
the board in the municipality and not just one division.
93
6.3.1 Achievement Achievement ranked the highest of all motivational factors and the organisations needs
to maintain and improve on this factor amongst employees who do not feel a sense of
achievement by considering the following:
Making employees aware of their level of task involvement in a project by
presenting a holistic view of how their contribution fits into the bigger picture.
Have employees engage in more community based project or projects that deal
with the electrification of rural areas that are being provided with electricity for the
first time. This can give employees a sense of achievement as they realise how
their contribution to society impacts the lives of people in a positive way.
Create a corporate culture whereby employees realise that they are not just
employees of the organisation but also customer of the organisation due to the fact
they live and work in the municipal region of eThekwini. This will instil a sense of
pride and achievement when undertaking their duties.
6.3.2 Responsibility Responsibility ranked as the second highest factor of motivation amongst the
respondents, to maintain and improve this rating the organisation needs to have their
employees take on more responsibilities in the work place without becoming overloaded.
This can be achieved by implementing the following
Drawing up a roster which allows for the rotation of various responsibilities
including managing the department under the mentorship of their supervisors.
Grant employees full autonomy on the projects from inception to completion once
it is allocated to them.

94
6.3.3 Work Itself Respondents ranked the work itself as the third highest factor of motivation and the study
found that the respondents agreed that they found the work meaningful, interesting and
challenging.
Managers should encourage their staff to get involved in tasks that are more
interesting and challenging.
Have employees engage in tasks that requires the use of a variety of skills to
enhance their motivation.
Employees must be given unrestricted access to the latest resources within the
boundary of their job description. This will enhance the effectiveness and
productivity of employees and make their work more enjoyable.
6.3.4 Recognition
The organisation should introduce a culture of recognition whereby on a weekly or
monthly basis employees from each department receive some form of recognition
for their contribution.
Managers need to acknowledge employees on a daily basis by means of appraisal
for the excellent work they have performed. This can be both a morale booster and
a form of enhancing the employee’s intrinsic motivation.
The organisation should put in place a system of rewards for employees who are
recognised for their outstanding performance.
6.3.5 Growth and Advancement This factor had the lowest mean score and indicated that respondents do not view this as
a factor that motivates them. Employees may feel that they have reached a glass ceiling
within the organisation and cannot progress beyond their current position. The
organisation will need to address this factor both with caution and seriousness as this can
eventually turn out to be a push factor which will lead staff to exit the organisation. The
following can be taken into consideration:

95
Mangers can sit down and engage with their employees on a one on one basis to
discuss and implement a progression plan with regular feedback meetings.
The organisation needs to encourage their staff to obtain any form of additional
qualification that is justifiable in assisting employees to grow and advance not only
in eThekwini Electricity but also within eThekwini Municipality.
6.3.6 Peer Relationship The respondents revealed that they have a good peer relationship and this is contrary to
Herzberg’s classification of peer relationship as a hygiene factor. This needs to be
maintained and improved in order to remove job dissatisfaction. The following can be
implemented.
Employees can engage in team building activities on a regular basis to strengthen
peer relations.
The organisation or each department can have social events whereby employees
can include their families, this can create an atmosphere were all employees feel
more like members of a family. This can create a sense of warmth amongst
employees.
Management needs to encourage more team based work activities in the each
department to enhance and strengthen peer relations.
6.3.7 Supervisor Relationship
The study shows that the respondents have a good relationship with their supervisors
and this is contrary to Herzberg’s classification of supervisor relationship as a hygiene
factor. This needs to be maintained and improved in order to remove job dissatisfaction.
The following can be implemented:
Supervisors should promote an open door policy this displays high levels of
integrity and trust with their staff.

96
Supervisors should attend advance training on motivation and leadership and find
mechanisms that is best suited to be implemented in their departments.
Supervisors need to make themselves visible to their employee’s without being
autocratic at the same time. This ensure that employees do not view their
supervisors as absent managers thus causing a breakdown in relations between
staff and supervisors.
6.3.8 Physical Working Conditions Respondents did not view the physical working conditions as a hygiene factor but viewed
it as being safe and clean. Management needs to take into account the need to alter the
working environment of both the physical and social aspect where it is possible to
enhance the level of job satisfaction amongst employees. This can be achieved in the
following manner namely:
An ergonomic design of the employees work space.
Include an adequate level of lighting in the work place.
Reduction in noise levels in the office environment.
This is possible to accomplish in the office environment however it is much more difficult
to accomplish for those workers who are field bound. Many factors come into play for field
works such that the physical location where the actual work is taking place, adequate
water and sanitation being provided, third party contractor who are allocated to maintain
such location.
6.3.9 Salary Structure The respondent indicated that the salary structure brought about dissatisfaction. The
organisations needs to review the existing salary structure. They can use the salary
structure as a mechanism to motivate and retain staff by reviewing the following:

97
Offering more market related salaries however it will be met with difficulty as the
salary scales are not just applicable to the electricity department by applicable
across the municipality.
Increase the employee’s scarce skills allowance annually.
Offer a special allowance for people who are in key strategic and operational
positions that are vital to the organisation.
Employees should be given allowances for the training, development, progression
of junior staff and employees who are on full time training programs which will
eventually lead to permanent employment as engineers, technicians and
technologists.
6.4 Future Recommendations
This study included a select group of employees that make up part of the engineering
workforce within eThekwini Electricity. Certain groups of employees such as artisans,
clerk of works, superintendents and technical officers had been excluded from the study.
A future study on either motivation or job satisfaction can included these groups of
employees who were excluded.
A mixed methods approach can be implemented in a future study, such as the use of
open ended questions which will allow future researchers to reveal in-depth and richer
information regarding how employee’s feel towards their levels of motivation and job
satisfaction.
Management can be included in the study to express their viewpoints regarding
motivation and or job satisfaction experienced by their staff member and can provide
valuable insights on how to go about motivating staff from a more practical point of view
whilst keeping within the policy and boundaries of the organisation.
The current study used Herzberg’s Two Factor Theory to examine motivation and the
impact it has on job satisfaction. Future researcher can examine the same cause and
effect relationship between motivation and job satisfaction within the organisation using

98
other motivation theories such as Maslow’s Theory of Needs or Vroom’s Expectancy
Theory amongst many others.
A more comparative study can be conducted between departments or between different
groups of engineering staff. This provides vital insight to which category of staff or
departments are more motivated and experiences higher levels of job satisfaction than
the others.
6.5 Summary
The study achieved all the research objectives that were set out. The findings of the study
determined the factors that motivate job satisfaction, the factors that influence job
dissatisfaction, evaluated the impact that motivation has on job satisfaction and
ascertained the overall level of job satisfaction. Recommendations were presented on
how to improve job satisfaction by addressing each of the motivational and hygiene
factors. It is conclusive from the study that by having a motivated workforce, leads to
positive results such as employee retention. Organisations need to include a strategic
human resource plan which can be incorporated into the overall strategy for the
organisation to create a winning formula.

99
REFERENCES Adebayo, S.O. and Ogunsina, S.O., 2011. Influence of Supervisory Behaviour and Job
Stress on Job Satisfaction and Turnover Intention of Police Personnel in Ekiti State. Journal of Management and Strategy, vol.2, no.3, pp13-20.
Aftab and Hira, 2012. A Study of Job Satisfaction and IT’s Impact on the Performance
in the Banking Industry of Pakistan. International Journal of Business and Social Science, vol.3, no 19, pp 174-180
Ahmad, R., Ing, H.I.I.E.E. and Bujang, S., 2014. Relationship Between Selected Factors
of Job Satisfaction and Job Performance Among Workers at Palm Oil Industries. International Review of Management and Business Research, vol.3,no.3, pp.1751–1766. Aik, A., 2015. Application of Equity Theory on Skilled Manpower Retention: a Study of
Medical Practitioners in Public Specialist Hospitals in Enugu Metropolis, Nigeria. International Journal of Research in Business Management, vol.3, no.11, pp.95-110.
Aina, O.O., 2014. Application of Motivation Theories in the Construction Industry.
Journal of Business and Management,vol.16, no.7, pp.1–6. Akram Ch., M., Faheem.M.A.,Dost.M.K.B and Abdullah.I., 2011. Globalization and its
impacts on the world economic development. International Journal of Business and Social Science, vol.2, no.23, pp.291–297.
Alajlouni, J.A., 2015. Job Satisfaction and Performance in Jordanian Banks.
International Journal of Humanities and Social Science, vol.5, no.11, pp.110–119. Al-Kalbani, K. and Al-Aufi, A., 2014. Assessing work motivation for academic librarians
in Oman. Library Management, vol.35,no.3, pp.199–212.. Ali, A.A., Edwin, O. and Tirimba, O.I., 2015. Analysis of Extrinsic Rewards and
Employee Satisfaction: Case of Somtel Company in Somaliland. International Journal of Business Management & Economic Research, vol.6,no.6, pp.417–435.
Ali Jadoo, S.A., Aljunid.S.M., Dastan, I.,Tawfeeq, R.S., et al, 2015. Job satisfaction and
turnover intention among Iraqi doctors - a descriptive cross-sectional multicentre study. Human Resources for Health, vol.13,no.1, pp. 1-11.
Alshitri, K., 2013. An Investigation of Factors Affecting Job Satisfaction among R and D
Center Employees in Saudi Arabia. The Journal of Human Resources Management Research, 2013, pp.1–10.

100
Areepattamannil, S., Freeman, J.G. and Klinger, D.A., 2011. Intrinsic motivation,
extrinsic motivation, and academic achievement among Indian adolescents in Canada and India. Social Psychology of Education, vol.14, no.3, pp.427–439.
Atambo, W.N., Otundo, E. and Nyamwamu, W.B., 2013. The effect of perceived work
conditions on job satisfaction: a survey of the ministry of education field officers, Kenya. Global Business and Economics Research Journal, vol.2,no.5, pp.25–41.
Ayandele, I.A. and Nnamseh, M.P., 2014. Hackman and Oldham Job Characteristics
Model (JCM) and Akwa Ibom State Civil Servants’ Performance. Canadian Social Science, vol.10, no.2, pp.89–97.
Aydin, O.T., 2012. The Impact of Theory X , Theory Y and Theory Z on Research
Performance : An Empirical Study from A Turkish University. International Journal of Advances in Management and Economics, vol.1,no.5, pp.24–31.
Balouch, R. and Hassan, F., 2014. Determinants of Job Satisfaction and its Impact on
Employee Performance and Turnover Intentions. International Journal of Learning and Development, vol.4,no.2, pp.120–140.
Banks, J.,Patel,C.J. and Moola, M.A., 2012. Perceptions of inequity in the workplace :
Exploring the link with unauthorised absenteeism. , (2002), pp.1–8. Barua, A., 2013. Methods for Decision-Making in Survey Questionnaires Based on
Likert Scale. Journal of Asian Scientific Research, vol.3,no.1, pp.35–38. Batchelor, J.H., Lawlor, K.B. and Burch, G.F., 2014. The Job Characteristics Model : An
Extension to Entrepreneurial Motivation. Small Business Institute Journal Small Business Institute, vol.10, no.1, pp.1–10.
Bell, B.S., Lee, S. and Yeung, S.K., 2006. Hrm : Implications for the Professionals.
Human Resource Management, 45(3), pp.295–308. Ben-Ami, M.Jacob, H.,Eden,D. and Kaplan, O., 2014. Boosting consumers’ self-efficacy
by repositioning the self. European Journal of Marketing, vol.48, no 11/12, pp.1914–1938.
Bouzenita, A.I. and Boulanouar, A.W., 2016. Maslow ’ s hierarchy of needs : An Islamic
critique. Intellectual Discourse, vol.24,no.1, pp.59–81. Bryman, A. and Bell, E., 2007. Business research methods.2ND ed, New York:Oxford
University Press Inc

101
Cao, H.,Jisng,J.,Oh,L., Li,H. and Liao, X, 2013. A Maslow’s hierarchy of needs analysis of social networking services continuance. Journal of Service Management, vol.24,no.2, pp.170–190.
Casey, R., 2009. A Comparison Of The Elements Of Motivation In The Hospital Industry
Versus The Retail And Manufacturing Sectors. Journal of Diversity Management, 4(3), pp.13–20.
Castellan, C.M., 2010. Quantitative and Qualitative Research: A View for Clarity.
International Journal of Education, 2(2), pp.1–14. Caulton, J.R., 2012. Caulton,J.R, 2012.The Development and Use of the Theory of ERG: A Literature
Review. Emerging Leadership Journeys, vol.5,no.1, pp.2–8. Chennamaneni, A. and Teng, J.T.C., 2012. Types of Human Needs that Motivate
knowledge sharing in organisations: A comprehensive empirical study based on the ERG theory. Journal of Information Technology Management, vol.23,no.3, pp.65–80.
Cherian, J. and Jacob, J., 2013. Impact of Self Efficacy on Motivation and Performance
of Employees. International Journal of Business and Management, vol.8,no.14, pp.80–88.
Chevalier, F. and Motevali, M., 2015 Satisfaction, J. and Company, 2015. THE EFFECT
OF WORK MOTIVATION ON JOB SATISFACTION : A CASE OF FARASHIAN PRE-CAST CONCRETE COMPANY IN IRAN. International Journal of Managment Resource and Bussiness Strategy. vol.4,no.1, pp.59–82.
Chu, H. and Kuo, T.Y., 2015. Testing Herzberg ’ s Two-Factor Theory in Educational
Settings in Taiwan.The Journal of Human Resource and Adult Learning , vol.11, no.1, pp.54–65.
Collis, J. and Hussey, R., 2009. Business Research: A Practical Guide for
Undergraduate and Postgraduate Students. 3rd ed. Newyork: Palgrave Macmillian. Crestwell, J.W., 2014. Research Design: Qualitative,Quantitative and Mixed Methods
Approach. 4th ed., Carlifornia: Sage Publications Inc. Croasmun, J.T. and Ostrom, L., 2011. Using Likert-Type Scales in the Social Sciences.
Journal of Adult Education, vol.40,no.1, pp.19–22. Daymon, C. and Holloway, I., 2011. Qualitative Research Methods in Public Relations
and Marketing Communications 2nd ed. New York: Routledge .

102
Edrak, B. et al., 2013. The Effectiveness of Intrinsic and Extrinsic Motivations: A Study
of Malaysian Amway Company’s Direct Sales Forces. International Journal of Business and Social Science, vol.4,no.9, pp 96-103.
eThekwini Electricity. 2008/2009. Annual Report, eThekwini Electricity. Durban Fan Wuhan, D., 2014. Job characteristics Model and job Satisfaction. International
Journal of Education and Research, vol.2, no.11, pp.241-262. Ghazi, S.R., Shahzada, G. and Khan, M.S., 2013. Resurrecting Herzberg’s Two Factor
Theory: an Implication to the University Teachers. Journal of Educational and Social Research, vol.3,no.2, pp.445-451.
Giacopelli, N.M.,Simpson,K.M,Dalal,R.S,Randolph,K.L and Holland, 2013. Maximizing
as a predictor of job satisfaction and performance: A tale of three scales. Judgment and Decision Making, vol.8,no.4, pp.448–469.
Gürbüz, S., Şahin, F. and Köksal, O., 2014. Revisiting of Theory X and Y. Management
Decision, vol.52,no.10, pp.1888–1906. Hair Jr, J.F.,Babin,B.,Money,A.H and Samouel,P., 2003. Essentials of Business
Research Methods., Hoboken, Wiley and Son. Iqbal, A., 2013. Impact of Job Autonomy and Supervisor’s and Co-Workers’ Support on
Job Burnout and Satisfaction: The mediating Role of Emotional Labor. International Journal of Economics and Management Sciences, vol.2,no.6, pp.67–73.
Jain, Ruchi, Kaur, S., 2014. Impact of Work Environment on Job Satisfaction.
International Journal of Scientific and Research Publication, vol.4,no.1, pp.1–8. Jerome, N., 2013. Application of the Maslow ’ s hierarchy of need theory ; impacts and
implications on organizational culture , human resource and employee ’ s performance. International Journal of business and Management, vol.2,no.3, pp.39–45.
Johari, J.,Yean,T.F., Yahya,K.K, and Adnan,Z., 2015. Elevating Job Performance
Through Job Characteristics and Work Involvement. International Academic Research Journal of Social Science, vol.1,no.2, pp.69–82.
Johnson, B., 2014. Ethical issues in shadowing research Qualitative Research in
Organizations and Management: An International Journal, vol.9,no.1, pp.21–40. Joseph, B., 2015. The effect of employees’ motivation on organizational performance

103
Journal of Public Administration and Policy Research. vol.7,no.4, pp.62–75. Kass, S., Vodanovich, S. and Khosravi, J., 2011. Applying the job characteristics model
to the college education experience. Journal of the Scholarship of Teaching and Learning, vol.11,no.4, pp.56–68.
Kaur, A., 2013. Maslow’s Need Hierarchy Theory: Applications and Criticisms. Global
Journal of Management and Business Studies, vol.3,no.10, pp.2248–9878. Kaur, R., Aggarwal, P. and Khaitan, N., 2014. THE INTERNATIONAL JOURNAL OF
BUSINESS & MANAGEMENT Equity Sensitivity. The International Journal Of Business & Management, pp.2321–8916..
Kayode, O., 2013. Applicationof Theory Xand Y In a classroom Management.
International Journal of education and Research, vol.1,no.5, pp.1–10. Kehinde, O.K., 2011. Impact of Job Satisfaction on Absenteeism : A Correlative Study.
European Journal of Humanities and Social Sciences, vol.1,no.1, pp.25–49. Khan, A.H. and Aleem, M., 2014. Impact of job satisfaction on employee turnover: an
empirical study of autonomous medical institutions of Pakistan. Journal of International Studies, vol.7,no.1, pp.122–132.
Kian, T.S., Yusof, W.F.W. and Rajah, S., 2014. Job satisfaction and motivation - What
are the difference among these two ? European Journal of Business and Social Sciences, , pp.94–102.
Kumar, A.,Abbas,Q.,Ghumro,I.A. and Zeeshan,A. 2011. Job characteristics as
predictors of job satisfaction and motivation. Asian Journal of Business and Management Sciences, vol.1,no.4, pp.206–216.
Lameck, W.U., 2013. Sampling design, validity and reliability in general social survey.
International Journal of Academic Research in Business and Social Sciences, vol.3,no.7, pp.212–218.
Lăzăroiu, G., 2015. Work Motivation and Organizational Behavior. Contemporary
Readings in Law and Social Justice, vol.7,no.2, pp.66–75. Lee, S., 2007. Vroom’s expectancy theory and the public library customer motivation
model. Library Review, vol.56,no.9, pp.788–796. Liao, H.-L., Liu, S.-H. and Pi, S.-M., 2011. Modeling Motivations for Blogging: An
Expectancy Theory Analysis. Social Behavior and Personality: an international journal, vol.39,no.2, pp.251–264.

104
Libman, Z., 2010. Integrating Real-Life Data Analysis in Teaching Descriptive Statistics:
A Constructivist Approach. Journal of Statistics Education, vol.18,no.1,pp.1-23 Lin, S.-C., Shu, J. and Lin, J., 2011. Impacts of coworkers’ relationships on
organizational commitment-and intervening effects of job satisfaction. African Journal of Business Management, vol.5,no.8, pp.3396–3409.
Lukwago, G., Basheka, B.C. & Odubuker, E.P., 2014. Using Herzberg’s two factor
theory to develop a construct validity for motivation of employees in Uganda’s National Agricultural Research Organisation (NARO): A preliminary analysis. Global Journal of Commerce & Management Perspective, 3(3), pp.59–65.
Lunenburg, F.C., 2011. Expectancy Theory of Motivation : Motivating by Altering
Expectations. International journal of business administration, vol.15,no.1, pp.1–6. Malik, M.E. and Naeem, B., 2013. Towards Understanding Controversy on Herzberg
Theory of Motivation. World Applied Sciences Journal, vol.24,no.8, pp.1031–1036. Malik, M.E., Qaiser Danish, R. and Munir, Y., 2012. The Impact of Pay and Promotion
on Job Satisfaction: Evidence from Higher Education Institutes of Pakistan. American Journal of Economics, vol.2,no.4, pp.6–9.
Manzoor, Q., 2011. Impact of Employees Motivation on Organizational Effectiveness.
Business Management and Strategy, vol.3,no.1, pp.1–12. Masood, A. et al., 2014. Factors Affecting Employee Satisfaction of the Public and
Private Sector Organizations of Pakistan. International Journal of Human Resource Studies, vol.4,no.2, p.97
Menezes, L.M., 2012. Job satisfaction and quality management: an empirical analysis.
International Journal of Operations & Production Management, vol.32,no.3, pp.308–328.
Mohamed, R. and Nor, C., 2013. The relationship between McGregor’s XY Theory
management style and fulfillment of psychological contract: A literature review. International Journal of Academic Research in Business and Social Science, vol.3,no.5, pp.715–720.
Mohammed, F. and Eleswed, M., 2013. Job Satisfaction and Organizational
Commitment : A Correlational Study in Bahrain Fatema Mohammed.International Journal of Business, Humanities and Technology, vol.3,no.5, pp.43–53.
Mukul, A.Z.A., 2013. Job Characteristics Model of Hackman and Oldham in Garment

105
Sector in Bangladesh: A Case Study in Savar Area in Dhaka District. International Journal of Economics, Finance and Management Sciences, vol.1,no.4, pp.188-195.
Na-Nan, K. and Pukkeeree, P., 2013. Influence of Job Characteristics and Job
Satisfaction Effect Work Adjustment for Entering Labor Market of New Graduates in Thailand. International Journal of Business and Social Science, vol.4,no.2, pp.95–103.
Nasri, W. & Charfeddine, L., 2012. Motivating Salespeople to Contribute to Marketing
Intelligence Activities: An Expectancy Theory Approach. International Journal of Marketing Studies, vol.4, no.1, pp.168–175.
Nawaz, A.S.M., 2011. Employee motivation: A study on some selected McDonalds in
the UK. African Journal of Business Management, vol.5,no.14, pp.5541–5550. Nezhad, F. & Ali, H., 2011. Globalization and Challenges ; What are the globalization ’ s
contemporary issues ? International Journal of Humanities and Social Science, vol1,no.6, pp.216–218.
Noor, M., 2010. Supervision , Salary and Opportunities for Promotion as Related to Job
Satisfaction. ASA University Review, vol.4,no.1, pp.255–261. Nyarko, K. and Corresponding, P.D., 2014. The Influence of Motivation On The Job
Satisfaction of Junior High School Teachers In Ghana. , vol.5,no.5, pp.202–209. Ogunnaike, O.O., Akinbola, O.A. and Ojo, O.A., 2014. Effect of Motivation on Job
Satisfaction of Selected Sales Representatives. Journal of Educational and Social Research, vol.4,no.1, pp.197–204.
Ondabu, I.T., 2014. A Theory of Human Motivation: The Tirimba Grouping Theory of
Motivation. Sop Transactions on Economic Research, vol.1,no.1, pp.16–21 Onimole, S.O. and Mni, P., 2015. Work Design and Job Satisfaction. International
Journal of Humanities and Social Science, vol.5,no.10, pp.202–207. Ozguner, Z. and Ozguner, M., 2014. A Managerial Point of View on the Relationship
between of Maslow ’ s Hierarchy of Needs and Herzberg ’ s Dual Factor Theory. International Journal of Business and Social Science, vol.5,no.7, pp.207–216.
Pandţa, J.,Deri,J.,Galambos,A. and Galambos, T., 2015. Two-factor Analysis of
Employee Motivation at "Postal Traffic – Department in Novi Sad" European Journal of Economic Studies, vol.12,no.2, pp.101–111.
Parijat, P. and Bagga, S., 2014. Victor Vroom’s Ecpectancy Theory of Motivation - An

106
Evaluation. International Research Journal of Business and Management, vol.7,no.9, pp.1–8.
Parvin, M.M. and Karbin, M.M.N., 2011. Factors Affecting Employee Job Satisfaction of
Pharmaceutical Sector. Journal of Business and Management Research, vol.1,no.9, pp.113–123.
Pfitzner-eden, F., 2016. Why do I feel more confident? Bandura’s sources predict
preservice teachers’ latent changes in teacher self-efficacy. Frontiers in psychology, pp.1–17.
Piccolo, R. F., Greenbaum, R., Den Hartog, D. N., Folger, R., 2012. The relationhip
between ethical leaderhip and core job characteristics. Journal of Organizational Behavior, vol.17,no.2, pp.1–20.
Pulasinghage, C., 2010. Employee motivation: What factors motivate employees to
work in Nongovernmental Organizations (NGO) in Sri Lanka: A study according to Maslow’s hierarchy of needs model. International Journal of Interdisciplinary Social Sciences, vol.5,no.4, pp.197–211.
Pule, S.,Mwesigye,J. and Mbado,R.E, 2014. Human Resource Policy And Job
Satisfaction Of Employees In Knowledge-Based Enterprises: A Comparative Study Of The Indigenous And Expatriate Teaching Staffs Of Kampala International University, Uganda. Global Journal of Human Resource Management, vol.22,no.33, pp.13–2713.
Rahman,H. and Nurullah.S.M., 2014. A Comparative Study of Motivating Potential
Score of Employees of Public and Private Commercial Banks: An Assessment of Demographics Influence. Global Journal of Management and Business Research, vol.14,no.4.
Raza, M.Y.Akhtar,M.W.and Husnain,M., 2015. The Impact of Intrinsic Motivation on
Employee’s Job Satisfaction. Management and Organizational Studies, vol.2,no.3, pp.80-88.
Rehman, K.,Rehman,Z.A.,Saif,N.,Khan,A.S.,Nawaz,.A. and Rehman,S., 2013. Impacts
of Job Satisfaction on Organizational Commitment: A Theoretical Model for Academicians in HEI of Developing Countries like Pakistan. International Journal of Academic Research in Accounting Finance and Management Sciences, vol.3,no.1, pp.80–89.
Robbins, S.P. and Judge, T.A., 2013. Organizational Behaviour 15th ed. New Jersey:
Pearson Education, Inc., publishing as Prentice Hall.

107
Rodrigues, A.P. and Carlos M., J., 2010. Market orientation, job satisfaction,
commitment and organisational performance. Transforming Government: People, Process and Policy, vol.4,no.2, pp.172–192.
Royle, M.T. and Hall, A.T., 2012. Theory of Needs , Feeling Individually. International
Journal od Management and Marketing Research, vol.5,no.1, pp.21–42. Saeed, I., 2014. The relationship of Turnover intention with job satisfaction, job
performance, Leader member exchange, Emotional intelligence and organizational commitment. International Journal of Learning & Development, vol.4,no.2, pp.242–256.
. Saleem, R., Mahmood, A. and Mahmood, A., 2010. Effect of Work Motivation on Job
Satisfaction in Mobile Telecommunication Service Organizations of Pakistan. International Journal of Business and Management, vol.5,no.11, pp.213–222.
Salunke, G., 2015. Work Environment and Its Effect on Job Satisfaction in Cooperative
Sugar Factories in Maharashtra, India. Abhunav International Monthly Refereed Journal Of Research in Management and Technology, vol.4,no.5, pp.21-31
Sarwar, S. and Abugre, J., 2013. The Influence of Rewards and Job Satisfaction on
Employees in the Service Industry And Key words. The Business & Management Review, vol.3.no.2, pp.22–32.
Sattar, A., 2014. Job Satisfaction of District Officers: A Global Perspective Job
Satisfaction of District Officers: A Global Perspective. Global Journal of Management and Business Research: A Administration and Management, vol.14,no.6.
Saunders, M. and Thornhill, A., 2006. Forced employment contract change and the
psychological contract. Employee Relations, vol.28,no.5, pp.449–467. Saunders, M.N.K., Lewis, P. and Thornhill, A., 2003. Research methods for business
students, Prentice Hall. Scheers, L. Van and Botha, J., 2014. Analysing relationship between employee job
satisfaction and motivation. Journal of Business and Retail Management Research, vol.9,no.1,pp.98-109.
Sekaran, U. and Bougie, R., 2013. Research methods for business : a skill-building
approach.6th ed.West Sussex:John Wiley and Son Ltd.

108
Seyithan,D., A., 2015. Assessing Teacher Self-Efficacy and Job Satisfaction: Middle
School Teachers. Journal of Educational and Instructional Studies in the World, (August), pp.2146–7463.
Shah,K.,Rehman,M.,Akhtar,G.,Zafar,H and Riaz,A., 2012. Job Satisfaction and
Motivation of Teachers of Public Educational Institutions. International Journal of Business and Social Science, vol.3,no.8, pp.271-281
Shaikh, M.A., 2012. Facets of Job Satisfaction and Its Association with Performance.
International Journal of Business and Social Science, vol.3,no.7, pp.322–326. Simone, S. De, 2015. Expectancy Value Theory : Motivating Healthcare Workers
Institute for Research on Innovation and Services for Development. Ameican International Journal of Contemporay Research, vol.5,no.2, pp.19–23.
Singh, A. and Masuku, M., 2014. Sampling Techniques & Determination of Sample Size
in Applied Statistics Research: an Overview. Ijecm.Co.Uk, vol.2.no.11, pp.1–22. Singh, K., 2015. Relationship between Job Satisfaction and Absenteeism Trends - A
Case Study of College Teachers of Non-Professional Institutions in Punjab, vol.2,no.2, pp.365–370.
Siniscalco, M.T., Auriat, N. and Ross, K.N., 2005. Questionnaire design: Module 8;
Quantitative research methods in educational planning; 2005. Sohail, B.A. et al., 2014. Effect of Work Motivation and Organizational Commitment on
Job Satisfaction: (A Case of Education Industry in Pakistan) , vol.14,no.6. Subedi, B.P., 2016. Using Likert type data in social science research: confusion, Issues
and challenges: International Journal of Contemporary Applied Sciences, vol.3,no.2 Sukamolson, S., 2007. Fundamentals of quantitative research,. Language Institut of
Chulalongkorn University Abstracte, pp.1-20. Swanepoel,B.J,Erasmus,B.,Schenk,.H.W. and Tshilongamulenzhe,M.C., 2014. South
African Human Resource Management Theory and Practice Fifth Edit. B. Swanepoel, ed., Praal: Juta and Company Ltd.
Teck-Hong, T. and Waheed, A., 2011. Herzberg’s Motivation-Hygiene Theory And Job
Satisfaction In The Malaysian Retail Sector: The Mediating Effect Of Love of Money. Asian Academy of Management Journal, vol.16,no.1, pp.73–94.

109
Thirulogasundaram, P.V.P. and Sahu, D.P.C., 2014. Job Satisfaction and Absenteeism
interface in Corporate Sector – A study. IOSR Journal of Humanities and Social Science, vol.19,no.3, pp.64–68.
Thompson, C. and Lane, S., 2014. Intelligence and job satisfaction in the USA and
China. Journal of Technology Management in China, vol.9,no.3, pp.232–244. Toe, T.T., Murhadi, W.R. & Wanglin, 2013. RESEARCH STUDY ON THE
CORRELATION BETWEEN EMPLOYEE JOB SATISFACTION AND EMPLOYEE MOTIVATION. , vol.6,no.1, pp.142–166.
Tsang, K.K., 2012. The use of midpoint on Likert Scale:The implications for educational
research. Hong kong Teachers’ Centre Journal, vol.11, pp.121–130. Uzonna, R., 2013. Impact of motivation on employees performance: A case study of
CreditWest Bank Cyprus. Journal of Economics and International Finance, vol.5,no.5, pp.199–211.
Waqas, A., Bashir,U.,Sattar,M.F and Abdulla,H.M., 2014. Factors Influencing Job
Satisfaction and Its Impact on Job Loyalty. International Journal of Learning and Development, vol.4,no.2, pp.141–161.
Westover, J.H., 2012. Comparative welfare state impacts on work quality and job
satisfaction. International Journal of Social Economics, vol.39,no.7, pp.503–525. Yang, C.L, 2011. An empirical study of the existence, relatedness, and growth (ERG)
theory in consumer’s selection of mobile value-added services. African Journal of Business Management, vol.5,no.19, pp.7885–7898.

110
APPENDIX 1 : INFORMED CONCENT

Informed Consent Letter 3C
UNIVERSITY OF KWAZULU-NATAL
GRADUATE SCHOOL OF BUSINESS AND LEADERSHIP
Dear Respondent,
MBA Research Project
Researcher: Jarred Paulsen -0725832965
Supervisor: Dr L.N.Govender - 0312607048
Research Office: Ms P Ximba 031-2603587
I, Jarred Irwin Paulsen an MBA student, at the Graduate School of Business and Leadership, of
the University of KwaZulu Natal. You are invited to participate in a research project entitled
Impact of Motivation on Job Satisfaction amongst selected employees at eThekwini Electricity The aim of this study is to: Determine the following The factors that motivate job satisfaction The factors that influence job dissatisfaction The overall level of job satisfaction The impact motivation has on job satisfaction
Through your participation I hope to understand how factors of motivation impact on job
satisfaction. The results of the focus group are intended to contribute to management decision
making. Your participation in this project is voluntary. You may refuse to participate or withdraw
from the project at any time with no negative consequence. There will be no monetary gain from
participating in this survey/focus group. Confidentiality and anonymity of records identifying you
as a participant will be maintained by the Graduate School of Business and Leadership, UKZN.
If you have any questions or concerns about completing the questionnaire or about participating
in this study, you may contact me or my supervisor at the numbers listed above.
The survey should take you about 10 minutes to complete. I hope you will take the time to
complete this survey.
Sincerely
Investigator’s signature____________________________________ Date_________________
This page is to be retained by participant

UNIVERSITY OF KWAZULU-NATAL
GRADUATE SCHOOL OF BUSINESS AND LEADERSHIP
MBA Research Project
Researcher: Jarred Paulsen -0725832965
Supervisor: Dr L.N.Govender - 0312607048
Research Office: Ms P Ximba 031-2603587
CONSENT
I………………………………………………………………………… (full names of
participant) hereby confirm that I understand the contents of this document and the nature
of the research project, and I consent to participating in the research project.
I understand that I am at liberty to withdraw from the project at any time, should I so
desire.
SIGNATURE OF PARTICIPANT DATE
………………………………………………………………………………………………
This page is to be retained by researcher

111
APPENDIX 2 : QUESTIONNAIRE

Section ADemographic Information
Impact of Motivation on Job Satisfaction
Male Female
1. What is your gender?
18 to 24 25 to 34 35 to 44 45 to 54 55 to 64 65 to 74
2. What is your age?
African Indian Colored White
3. What is your race ?
Technician Technologist Engineer
.
4. What is your current position ?
Bsc Degree BTech Degree National Diploma National Higher Diploma Other
Other (please specify)
5. What is your qualification ?
1

Indicate which factors increases your level of job satisfaction
Section BMotivational Factors
Impact of Motivation on Job Satisfaction
Strongly Disagree Disagree Undecided Agree Strongly Agree
6. Do you feel a sense of achievement on completion of your task ?
Strongly Disagree Disagree Undecided Agree Strongly Agree
7. Do you recieve recognition for the work you perform ?
Strongly Disagree Disagree Undecided Agree Strongly Agree
8. Do you find the work meaningful, interesting and challenging ?
Strongly Disagree Disagree Undecided Agree Strongly Agree
9. You are given complete responsibility for your work ?
Strongly Disagree Disagree Undecided Agree Strongly Agree
10. There are opportunities for growth and advancement in the organisation ?
2

Indicate which of these factors cause job dissatisfaction
Section CHygine Factors
Impact of Motivation on Job Satisfaction
Strongly Disagree Disagree Undecided Agree Strongly Agree
11. I have a good relationship with supervisor ?
Strongly Disagree Disagree Undecided Agree Strongly Agree
12. I have a good relationship with my peers ?
Strongly Disagree Disagree Undecided Agree Strongly Agree
13. The physical working conditions are safe, clean and hygienic?
Strongly Disagree Disagree Undecided Agree Strongly Agree
14. I am satisfied with the salary structure ?
Strongly Disagree Disagree Undecided Agree Strongly Agree
15. My organisation provides job security ?
Strongly Disagree Disagree Undecided Agree Strongly Agree
16. The company policy is fair and clear ?
3

Section D- Job Satisfaction
Impact of Motivation on Job Satisfaction
Strongly Disagree Disagree Undecided Agree Strongly Agree
17. Overall I am Satisfied with my job ?
4

112
APPENDIX 3 : ETHICAL CLEARANCE


113
APPENDIX 4 : EDITORS LETTER

Professional Editors (South Africa)
To: Jarred Paulsen
Email: [email protected] / [email protected]
Number: 0725832965
From: Valentina Govender
Email: [email protected]
Number: 0744046913 / 0627647363
30 January 2017
Please accept this letter in lieu of work completed. MBA thesis (132 pages) due by
31 January 2017. The entire document has been improved with due effort. Editing
was carried out according to the scope and criteria as per candidate’s instructions.
1. Sentence structure, correction of grammar, clarification of expression and
spelling.
2. Logical flow of ideas throughout the document.
3. The abstract has been reworked and inserted before the commencement of
chapter 1.
6. The reference list has been checked cosmetically.
7. Formatting of the text has been carried out along with insertions of figure
and table captions and the appropriate re-sizing of figures and tables.

I trust that you may find the work satisfactory as per our discussed expectations.
Please direct any queries to me via email or WhatsApp. I wish you all the best in
your submissions and in the completion of your degree..
Thank you kindly,
Valentina Govender
Professional Editor and Writer (South Africa)
CEO – Magnify Mega Media

114
APPENDIX 5 : TURNITIN REPORT
