university of kwazulu-natal macro-environmental factors
TRANSCRIPT

UNIVERSITY OF KWAZULU-NATAL
Macro-environmental factors influencing Chinese enterprises development in
KwaZulu-Natal (KZN)
By
Fuzhuan Chen
207502219
A dissertation submitted in partial fulfillment of the requirements for the degree
of
Master of Commerce
School of Management
Faculty of Management Studies
Supervisor: Dr. A. S. Gani
Co-Supervisor: Prof. S. Perumal
2010

DECLARATION
I ……Fuzhuan Chen………………………………declare that
(i) The research reported in this dissertation/thesis, except where otherwise
indicated, is my original research.
(ii) This dissertation/thesis has not been submitted for any degree or examination
at any other university.
(iii) This dissertation/thesis does not contain other persons’ data, pictures, graphs
or other information, unless specifically acknowledged as being sourced from
other persons.
(iv) This dissertation/thesis does not contain other persons’ writing, unless
specifically acknowledged as being sourced from other researchers. Where
other written sources have been quoted, then:
a) their words have been re-written but the general information
attributed to them has been referenced:
b) where their exact words have been used, their writing has been
placed inside quotation marks, and referenced.
Signature:

Acknowledgements
I would like to express my sincere appreciation towards the following persons and
institutions:
� The University of KwaZulu-Natal (UKZN) for giving me an opportunity to study
at the University for the past five years.
� Dr. A. S. Gani, my supervisor, who has guided me and pushed the boundaries to
ensure that the process has been both enjoyable and stimulating.
� Professor S. Perumal, my co-supervisor, for the professional assistance rendered
to me.
� My friends, who had faith that I would be successful in my studies.
� My Wife, YingYing Shi, who always encouraged me when I encountered
problems in my lives and in my studies.
� My mother and father who have both sacrificed so much in the past to ensure that
they could bring me up in the best way that they saw fit. I hope and pray that
one-day I am able to repay them for all the love and support that they have given
so freely.

ABSTRACT
The macro-environmental factors of an organization are external environmental
factors, which are largely uncontrollable by an organization. This study analyses the
macro-environment in which Chinese enterprises in KwaZulu-Natal (KZN) operate in
order to identify the factors that have influenced the development of these enterprises
in the past ten years.
Today’s companies are evolving in turbulent and equivocal environments. Although
most of the Chinese enterprises cannot control these macro- environment factors,
they need to be aware of them and identify those factors that could constrain their
future development.
Table of Contents
PAGES
CHAPTER ONE: INTRODUCTION
1.1. Introduction 1
1.2. Background 2
1.3. Significance of the proposed study 5
1.4. Problem statement 5
1.5. Objectives of the study 5
1.6. Key problems 6
1.7. Limitation of the study 6
1.7.1. Geographic factors 6
1.7.2. The types of enterprises 6
1.8. Structure of the study 6
1.9. Conclusion 7
CHAPTER TWO: LITERATURE REVIEW
2.1. Introduction 8
2.2. The definition of macro-environment factors 11
2.3. Economic review in KZN 12
2.3.1. Economic growth trend in KZN 13
2.3.2. Business confidence in KZN 14
2.3.3. The Unemployment Rate in KZN 15
2.3.4. Contribution to Provincial GDP per Sector 16
2.3.5. Economic indicators in KZN 17
2.3.6. KwaZulu-Natal’s contribution to South African Exports 17
2.4. The characteristics of Chinese enterprises in KZN 18
2.4.1. Distribution by areas 18
2.4.2. History 19
2.4.3. Size of Chinese enterprises 19
2.4.4. Distribution by industry 20
2.5. Reasons for investing in KZN in the past decade 20

PAGES
2.5.1. Locational aspects 20
2.5.1.1. Market size and attractiveness 21
2.5.1.2. Growing demand 21
2.5.2. Workforce aspects 22
2.5.3. Government Factors 23
2.5.3.1. Taxation in South Africa 23
2.5.3.2. The openness of the economy in KZN 24
2.5.3.3. Local political environment 24
2.5.3.4. The level of infrastructure in KZN 25
2.6. Macro-environmental factors influencing Chinese enterprise
development in KZN
25
2.6.1. Exchange rate 28
2.6.2. Crime rate 31
2.6.3. Infrastructure services 32
2.6.4. Inflation 35
2.6.4.1. Real rates of return 35
2.6.4.2. Inflation’s inconveniences 36
2.6.5. Union problems 37
2.6.6. Taxation 38
2.6.7. Competition 40
2.7. Conclusion 41
CHAPTER THREE: RESEARCH METHODOLOGY
3.1. Introduction 42
3.2. Type of Study 42
3.3. Qualitative and Quantitative Research Design 43
3.4. Time horizon 44
3.5. Sampling design of study 45
3.6. Data collection 47
3.7. The Questionnaire 49
3.8. Measuring instruments 50
3.9. Data analysis 52
3.10. Conclusion 52
CHAPTER FOUR: FINDINGS
4.1. Introduction 53
4.2. Biographical aspects of the sample 54
4.2.1. Age of respondents 54

PAGES
4.2.2. Gender of respondents 55
4.2.3. Contribution by age of business in KZN 56
4.2.4. The number of employees in your company 57
4.2.5. Contribution by industry of Chinese enterprises in KZN 57
4.2.6. Contribution by locations of Chinese enterprises
in KZN
58
4.2.7. Business conditions in the last year 59
4.2.8. Macro environment in the next year 59
4.3. Reasons for investing in KZN 60
4.3.1. Market size and attractiveness 60
4.3.2. Growing demand 61
4.3.3. Labor cost 62
4.3.4. Taxation 63
4.3.5. The openness of the economy 64
4.3.6. Local political environment 65
4.3.7. The level of infrastructure 66
4.4. Macro-environment factors in KZN 66
4.4.1. The weak exchange rate 67
4.4.2. Rising crime rate 68
4.4.3. Higher inflation rate 69
4.4.4. Union activity 70
4.4.5. Taxation 71
4.4.6. The level of infrastructure 72
4.4.7. Competitive environment 73
4.5. Aspects influenced by macro-environment factors 74
4.5.1. Increase in the cost of materials imported from China 74
4.5.2. Down turn in business development in KZN 75
4.5.3. The effect of the level of infrastructure in KZN 76
4.5.4. Reductions in the real rate of return 76
4.5.5. Hindrances to entrepreneurial activity in KZN 77
4.5.6. Reductions to business profits in KZN 78
4.5.7. Return on investment in KZN 78
4.6. Conclusion 79
CHAPTER FIVE: RECOMMENDATIONS
5.1. Introduction 80
5.2. Recommendations 80
5.2.1. For Chinese enterprises
5.2.2. For the province Government
80
82
5.3. Areas for Further Research 83

PAGES
References 85-93
Questionnaire
Ethical Clearance

LIST OF TABLES
Table 2.1: Global Economic Outlook, July 2009 13
Table 2.2: Growth Trends in South Africa and KwaZulu- Natal 14
Table 2.3: Unemployment Statistics in KwaZulu-Natal 16
Table 2.4: The definition of SMEs in South Africa 19
Table 2.5: Headline inflation rate in KwaZulu-Natal (KZN) 2008 36
Table 3.1: Terms of sampling 46
Table 3.2: The sections of the questionnaire 50
Table 3.3: Four types of scales 51
Table 4.1: The number of employees in your company 57
Table 4.2: Business condition in the past year 59
Table 4.3: Macro-environment in the following year 59
Table 4.4: The weak exchange rate influence 74
Table 4.5: The rising crime rate influence 75
Table 4.6: Power shortage influence 76
Table 4.7: Higher inflation influence 76
Table 4.8: Union activity influence 77
Table 4.9: Taxation influence 78
Table 4.10: The competitive environment influence 78

LIST OF FIGURES
Figure 1.1: Trade between China and Africa in 2003 3
Figure 1.2: China’s total investments in Africa between 1979 and 2002 4
Figure 2.1: Macro-environmental influences 9
Figure 2.2: SACOB and KwaZulu-Natal (KZN) business indices compared 11
Figure 2.3: KwaZulu-Natal (KZN) business confidence index 15
Figure 2.4: Contribution to Provincial GDP per Sector (2000-2007) 16
Figure 2.5: Economic indicators 17
Figure 2.6: South African Provincial Exports in 2006 18
Figure 2.7: Hourly wage cost 23
Figure 2.8: Business limitations 27
Figure 2.9: Key factors affecting FDI flows into Southern African countries 28
Figure 2.10: Exchange rate between Rand and US Dollar 30
Figure 2.11: World electricity prices 2007 34
Figure 2.12: Comparative tax rates around the world 39
Figure 3.1: Sampling techniques 47
Figure 3.2: Types of questionnaire 49
Figure 4.1: The response rate in this study 53
Figure 4.2: Age of respondents 54
Figure 4.3: Gender of respondents 55
Figure 4.4: Contribution by age of business in KZN 56
Figure 4.5: Contribution by industry of Chinese enterprises in KZN 57
Figure 4.6: Contribution by locations of Chinese enterprises in KZN 58
Figure 4.7: Market size and attractiveness in KZN 60
Figure 4.8: Growing demand in KZN 61
Figure 4.9: Labour cost in KZN 62
Figure 4.10: Taxation in KZN 63
Figure 4.11: The openness of the economy in KZN 64
Figure 4.12: Local political environment in KZN 65
Figure 4.13: The level of infrastructure in KZN 66
Figure 4.14: Effect of the weak exchange rate on macro-environment 67
Figure 4.15: Effect of rising crime rate on macro-environment 68
Figure 4.16: Effect of higher inflation rate on macro-environment 69
Figure 4.17: Effect of union activity on macro-environment 70
Figure 4.18: Effect of taxation on macro-environment 71
Figure 4.19: Effect of the level of infrastructure on macro-environment 72
Figure 4.20: Effect of competitive environment on macro-environment 73

LIST OF ABBREVIATIONS
BCI: Business Confidence Index
DED: Department of Economic Development
FDI: Foreign direct investment
GDP: Gross domestic product
ICF: Investment Climate Facility for Africa
IMF: International Monetary Fund
KNBCI: KwaZulu-Natal (KZN) Business Confidence Index
KNCOB: Kwazulu-Natal Chamber of Business
KZN: Kwazulu-Natal
OECD: Organization of Economic Cooperation and Development
PGDS: Provincial Growth and Development Strategy
SADC: Southern African Development Community
SACOB: South African Chamber of Business
SMEs: Small and medium enterprises
SMMEs: Small, Medium and Micro Enterprises
SPSS: Statistical Package for the Social Sciences or Statistical Product and Service
Solutions
TIKZN: Trade and Investment KwaZulu-Natal
UNCTAD: United Nations Conference on Trade and Development
UNDP: United Nations Development Programe
VAT: Value Added Tax

Macro-environmental factors analyzing Chapter 1
1
CHAPTER ONE
INTRODUCTION
1.1. Introduction
South Africa has an enormous potential as an investment destination, offering a
unique combination of highly developed first world economic infrastructure and a
vibrant emerging market economy. It is also one of the most advanced and productive
economies in Africa. Since the advent of democracy in 1994, South Africa's economy
has been undergoing structural transformation, with the implementation of
macro-economic policies aimed at promoting domestic competitiveness, growth and
employment and increasing the economy's outward orientation. Key economic
reforms have given rise to a high level of macro-economic stability. Taxes have been
reduced, tariffs lowered, the fiscal deficit brought under control, and exchange
controls relaxed. However, more and more Chinese enterprises that have invested in
KwaZulu-Natal (KZN) are under pressure due to the complexity of the local
macro-environment.
Theoretically, factors in the macro-environment could be considered as the external
business environment conditions of a region as well as a nation. According to
Mahadea and Pillay (2008), external business environment conditions refer to the
factors outside the firm over which the entrepreneur has little control. In general,
these conditions include the political, economic, social, technological, environmental,
and legal factors.

Macro-environmental factors analyzing Chapter 1
2
This chapter covers the background to study, the significance of the study, the
problem statement, the objectives and the key questions of study, the limitations of the
study, and finally the outline of the study.
1.2. Background
The new South African government has identified foreign direct investment (FDI) as
an important factor for local economic development from a regional and national
perspective. Johan, Ernst and Neels (2006) have shown that foreign direct investment
(FDI) has played an important role in stimulating economic growth in many
developing countries, through:
� The transfer of modern technology and production techniques;
� The transfer of skills, management expertise, and high-level training;
� The enhancement of access to international sources of finance, and
� The facilitation of access to global markets.
KZN is South Africa’s second most populous province and is the second largest
provincial economy (South Africa at a Glance, 2009-10). The province has been seen
as an ideal investment destination for many Chinese enterprises. Although there is a
wide range of investment incentives available to foreign companies, Chinese
enterprises face an uncertain macro-environment in KZN.
Mr Zhong Jiang-Hua, the ambassador of the People’s Republic of China in South
Africa, stated that over the past 10 years, there has been a rapid, all-round
development in bilateral relations between China and South Africa and the two
countries have established a strategic partnership with fruitful cooperation in bilateral
and international affairs. The Chinese-South African relationship has become one of

Macro-environmental factors analyzing Chapter 1
3
the most important (see Figure 1.1) and dynamic between China and any African
country, as well as any major developing nation. In 2007, the bilateral trade volume
reached US$14.04 billion, 6.5 times 10 years ago.
Figure 1.1: Trade between China and Africa in 2003 (in billions of dollars)
Source: Ministry of Commerce of the People’s Republic of China, 2004
Chinese firms from different sectors have invested in South Africa. Some of these
companies include:
• Hisense – The electronic goods producer ( producers of TVs, DVD players,
Hi-fi's and home theatre systems) entered the South African market in 1997,
expanded its facilities and service offerings to the South African public in
2004 and complete another US$19-million expansion in 2009, introducing
washing machines and refrigerators to its product range. The company has
maintained a 20-30% growth rate in the past decade.
• Sinoprima Investment and Manufacturing South Africa, a subsidiary of
Xiamen Overseas Chinese Electronic Co., has been manufacturing and
distributing consumer electronics (CRT TVs, Plasma and LCD TVs) in South
Africa since 1998.

Macro-environmental factors analyzing Chapter 1
4
• FAW Vehicle Manufacturer manufactures heavy vehicles.
• Hence Trade 88 spins yarn and distributes cotton to South African companies.
• Zhongzing Communications (ZTE)
• Huawei Technologies
FDI in Africa by developing Asian economies is growing and has the potential to
reach much higher levels. A joint report by the United Nations Conference on Trade
and Development (UNCTAD) and the United Nations Development Program (UNDP)
states that over the past decade, the African continent has become the main investment
destination for China. South Africa has become the second largest investment
destination for Chinese investors in all of Africa (see Figure 1.2). In addition, the
South African government has made it clear that foreign investment is welcome in
South Africa, and investor-friendly policies support these public pronouncements.
Figure 1.2: China’s total investments in Africa between 1979 and 2002
Source: CNUCED, “China an emerging FDI outward investor”, December 4th
2003.
Chinese enterprise investment in KZN has substantially increased in the past decade.
More and more Chinese enterprises have invested in this province. KZN is an

Macro-environmental factors analyzing Chapter 1
5
emerging market, which is a very attractive investment destination for Chinese
enterprises. However, currently these enterprises are facing a capricious macro
environment. These Chinese enterprises need to be able to identify various
macro-environmental factors, which could seriously influence their business
development, even result them exiting the local market in years to come.
1.3. Significance of the Proposed Study
The significance of proposed study is that it would provide accurate information about
the macro-economic environmental situation in South Africa and assist Chinese
enterprises that have invested in KZN or intend to invest in the province.
Furthermore, the study would provide reliable sources of evidence that should assist
the national and provincial governments to formulate attractive FDI policies aimed at
Chinese investors. Finally, proposed study will enable researcher to gain insight into
and understanding of South Africa’s macro-environmental factors and policies.
1.4. Problem Statement
The study will identify the macro-environmental factors influencing the development
of Chinese enterprises in KZN and examine what aspects of Chinese enterprises'
development will be constrained in the province.
1.5. Objective of the Study
The objective of the study is to investigate the macro-environmental factors that may
affect Chinese enterprises’ business strategy and development.

Macro-environmental factors analyzing Chapter 1
6
1.6. Key Questions
Based on the above-mentioned objectives, the three main questions of the study are as
follows:
� What are the major reasons for Chinese investment in KZN in the past
decade?
� What are the macro-environmental factors that could constrain the Chinese
enterprises' development in KZN?
� What are the aspects that influence the macro-environmental factors that affect
Chinese enterprise development in KZN?
1.7. Limitations of the Study
The limitations of the research project are listed as specific categories below.
1.7.1. Geographic Factors
The study was restricted to the province of KZN.
1.7.2. The Types of Enterprises
The researcher primarily focused on Chinese enterprises located within KZN.
1.8. Structure of the study
The study is divided into five chapters.

Macro-environmental factors analyzing Chapter 1
7
Chapter one provided the background to the study, the significance of the study, the
problem statement, the objectives of the study, the key questions, the structure of the
study, and the outline of the study.
Chapter two presents a detailed literature review in relation to macro-environmental
factors and other related subjects. The chapter also covers aspects that influence re the
macro-environmental factors of the study.
Chapter three outlines the research methodology and techniques used to acquire data
for analysis. It deals with the type of study, qualitative and quantitative research
design, time horizon, the sampling design of the study, data collection, questionnaire
of the study, measuring instruments, data analysis and the conclusion.
Chapter four presents an analysis of the empirical data. The data was analyzed using
SPSS, and the results will be interpreted in this chapter.
Chapter five reviews the main research questions and presents conclusions and
recommendations based on this study.
1.9. Conclusion
This chapter highlighted the need for the study and presented the research design that
will be followed. The next chapter will focus on the literature review.

Macro-environmental factors analyzing Chapter 2
8
CHAPTER TWO
Literature review
2.1.Introduction
Fry, Stoner and Hattwick (2001:13) note that businesses are neither independent nor
completely isolated from the internal and external environment within which they
function. In other words, an enterprise does not develop in a vacuum, but is
influenced by the context in which it operates. The business environment is made up
of constantly changing factors (both micro and macro in nature) that affect the
development of the organization.
Micro environmental factors are internal factors close to the organization and have a
direct impact on the organizations strategy (Campbell and Craig, 2005). In contrast,
macro environment factors include the economy, technology, society, government and
the competitive environmental factors that can influence an organization, but are
outside of the organization’s sphere of control (Campbell and Craig, 2005). These
factors will obviously affect the decisions made by the management of any
organization. Management can categorize these factors by using the PESTEL model
(as shown in Figure 2.1). According to Johnson, Scholes and Whittington (2006), the
external environment for a firm will mainly focus on the macro-environmental factors
that may influence the firms’ development in the real business world. These factors
should include political, economic, social, technological, environmental, and legal
factors. Macro-environmental factors can be considered as external factors, which

Macro-environmental factors analyzing Chapter 2
9
affect the development of most enterprises and are beyond their control (Mahadea and
Pillay, 2008).
Figure 2.1: Macro-environmental influences (the PESTEL framework)
Source: Johnson, Scholes and Whittington. (2006). Exploring Corporate
Strategy: Text and Case.
Macro-environmental
factors
Environmental
�Environmental
protection laws
�Waste disposal
�Energy
consumption
Economic factors
�Business cycles
�GNP trends
�Interest rates
�Money supply
�Inflation
�Unemployment
�Disposable income
Legal
�Competition law
�Employment law
�Health and safety
�Product safety
Social factors
�Population
demographics
�Income distribution
�Social mobility
�Lifestyle changes
�Attitudes to work and
leisure
�Consumerism
�Levels of education
Technological
�Government spending on
research
�Government and industry
focus on technological
effort
�New discoveries/
developments
�Speed of technology
transfer
�Rates of obsolescence
Political
�Government stability
�Taxation policy
�Foreign trade regulations
�Social welfare policies

Macro-environmental factors analyzing Chapter 2
10
The external environment relates to factors outside the firm over which the
entrepreneur has little control (Mahadea and Pillay, 2008). It means that the firm may
be influenced by changes within the external environment but can not itself influence
the environment. Furthermore, forces in the external environment can help or hinder a
firm’s performance. In a sense, the entrepreneur has almost no control over the
external environment.
The World Bank and International Finance Corporation's Doing Business 2008 Report
showed that South Africa was placed ninth for its protection of investors. There has
been continuous improvement in investor confidence in South Africa (World Bank,
“African Economic Outlook” 2007). According to the KwaZulu-Natal Business
Confidence Index (KNBCI) published by the KwaZulu-Natal Chamber of Business
(KNCOB), the trend in KwaZulu-Natal (KZN) business confidence is broadly similar
to the national trend (see Figure 2.2). Figure 2.2 shows that the macro-economic
environment has been improved in KZN in the past years. The overall economic
environment in South Africa has been extremely positive in recent times, with growth
averaging around five per cent since 2003 (Mboweni, 2007). According to Palmi
(2007), companies in KZN are doing fairly.
“Although the investment climate for large formal enterprises in South Africa appears
favorable in many ways, some challenges remain,” said Ritva Reinikka, the World
Bank Country Director for South Africa. In a survey of clothing companies in KZN in
2007, most of the clothing companies agreed that various macro-environmental
factors, such as the exchange rate, union, labour problems, and wage costs, have
affected their business recently (Palmi, 2007). Rodrik (2008) in his research
illustrated that despite the numerous positive economic achievements since 1994,
South Africa has struggled to attract significant foreign direct investment (FDI). He
also pointed out that investment in South Africa remains low at around 17 percent of
GDP.

Macro-environmental factors analyzing Chapter 2
11
SACOB and KZN business indices compared
90
94
98
102
106
110114
118122
126
130
134
2003
Q1
2003
Q3
2004
Q1
2004
Q3
2005
Q1
Kwazulu-Natal South Africa
Figure 2.2: SACOB and KwaZulu-Natal (KZN) business indices compared
Source: KwaZulu-Natal (KZN) Business Confidence Index, Second Quarter 2005
Some economists, therefore, note that while KZN is a province of opportunities, it
also poses big challenge for the development of Chinese enterprises. It is interesting
that despite economic services in KZN being significantly lower than the other South
African provinces (Palmi, 2007), a number of Chinese enterprises have invested in the
province. It is worth to note that Chinese enterprises have to be aware of
macro-environmental factors if they want to survive in the current market in KZN.
2.2.The definition of macro-environmental factors
The macro-environmental factors of an organization are basically its external
environment factors, which are largely uncontrollable by an organization. In terms of
the business dictionary, the definition of the macro-environment can be categorized
into two groups.

Macro-environmental factors analyzing Chapter 2
12
Firstly the macro-environment can be defined as, “Major external and
uncontrollable factors that influence an organization's decision making, and affect its
performance and strategies. These factors include the economic, demographic, legal,
political, and social conditions, technological changes, and natural forces.”
Secondly the macro-environment can be defined as, “Factors that influence a
company's or product's development but that are outside of the company's control. For
example, the macro environment could include competitors, changes in interest rates,
changes in cultural tastes, or government regulations.”
According to Johnson, Scholes and Whittington (2006), the PESTEL model could be
used to analyze the macro-environmental factors of an enterprise or industry. The
model shows that the macro-environmental factors should include political, economic,
social, technological, and environmental factors as well as legal factors. By using the
PESTEL framework we can identify the macro-environmental factors that most
Chinese enterprises are facing in KwaZulu-Natal (KZN).
Based on the above-analyzed, the definition of macro-environmental factors in the
study could be defined as “factors that influence Chinese enterprises development in
KZN but are outside of the Chinese entrepreneurs’ control in the current situation.”
2.3. Economic review of KZN
KZN is emerging as South Africa's economic and business hub as a result of
significant economic growth (Velia and Valodia, 2003). The province's contribution to
South African Gross Domestic Product (GDP) is second only to that of Gauteng. Dr
Kwazi Mbanjwa, Director-General ofKZN, stated in 2007 that over the past five years
the province's contribution to the GDP has been 3, 11 percent, against the national

Macro-environmental factors analyzing Chapter 2
13
norm of 3, 24 percent. However, KZN face major challenges because of the global
economic situation. According to the Department of Economic Development
KwaZulu-Natal (KZN) Report in 2009, KZN has not been spared by the wrath of the
financial crisis due to global financial turmoil (see Table 2.1). In Quarter One of 2009,
the provincial economy declined by 6.7% which was 0.03% more than the national
economy. In line with national developments, KZN slipped into a recession in the first
quarter.
Table 2.1: Global Economic Outlook, July 2009
Geographic regions Forecast Projections
2007 2008 2009 2010
World output
Advanced economies
United States
Euro Area
Japan
United Kingdom
Emerging and developing
Africa
China
5.1
2.7
2.0
2.7
2.3
2.6
8.3
6.2
13.0
2.5
0.8
1.1
0.8
- 0.7
0.7
6.0
5.2
9.0
- 1.4
- 3.8
- 2.6
- 4.8
- 0.6
- 4.2
1.5
1.8
7.5
2.5
0.6
0.8
- 0.03
1.7
0.2
4.7
4.1
8.5
Source: IMF World Economic Outlook, July 2009
2.3.1. Economic growth trend in KwaZulu-Natal
Cosma and Enough (2008) found that the KZN provincial economy grew at an
average of 4.4% between 2000 and 2007. During this period, the national economy
thus grew by an average of 4.3% (see Table 2.2). KZN remains one of the major
economic power houses of South Africa contributing an average of 16.5% to the total
South Africa GDP during the period under review.

Macro-environmental factors analyzing Chapter 2
14
Table 2.2: Growth Trends in South Africa and KwaZulu-Natal
Year South Africa
Real GDP
Growth Rate
Real GDP
Growth Rate
% Share of
KWAZULU-NATAL
(KZN) GDP
2000 4.4 4.9 16.4
2001 2.9 4.2 16.6
2002 3.8 2.9 16.5
2003 3.2 3.0 16.4
2004 4.8 4.7 16.4
2005 5.0 5.4 16.5
2006 5.3 5.3 16.5
2007 5.1 4.8 16.4
Average 4.3 4.4 16.5
Source: Quantec Statistical Data Base
2.3.2. Business confidence in KwaZulu-Natal
According to the KwaZulu-Natal Department of Economic Development Reported in
the second quarter of 2005, business confidence in KZN had been increasing since the
first quarter of 2003 (see Figure 2.3). This makes the province a major business
destination for foreign investment.

Macro-environmental factors analyzing Chapter 2
15
Figure 2.3::::KwaZulu-Natal (KZN) business confidence index
Source: KwaZulu-Natal (KZN) department of economic development reported
in second quarter 2005.
2.3.3. The Unemployment Rate in KwaZulu-Natal
One of the main goals of the Provincial Growth and Development Strategy (PGDS) is
to reduce poverty and unemployment by 50% by the year 2014. However, current
employment trends contradict this goal. Statistics reveal that while the economy grew
by at least 4.8% in 2007, the average percentage of unemployed people has only
changed marginally in the past seven years. Although the unemployment statistics
(see Table 2.3) have been fluctuating, the fact that 28.8% of the labour force was
unemployed in 2000 and 28.7% in 2007 implies that the economy is not creating
enough jobs. Unemployment has been a severe problem in KwaZulu-Natal (KZN).

Macro-environmental factors analyzing Chapter 2
16
Table 2.3: Unemployment Statistics in KwaZulu-Natal
Year 2000 2001 2002 2003 2004 2005 2006 2007
Average
Unemployment
28.8%
29.6%
34.0%
33.3%
30.2%
31.8%
27.8%
28.7%
Source: Quantec
2.3.4. Contribution to Provincial GDP per Sector
The manufacturing sector is by far the largest sector in KZN contributing about 23.9%
to the total provincial GDP. Wan (2007) pointed out that most Chinese enterprises are
centered on manufacturing. Figure 2.4 below indicates that manufacturing, finance,
retail and trade, and transport and communication are also the major sectors in the
provincial economy.
Contribution to Provincial GDP
per Sector (2000- 2007)
0
5
10
15
20
25
30
Ag
ricultu
re
Min
ing
Man
ufactu
ring
Electricity
Co
nstru
ction
Retail &
Acco
mo
datio
n
Tran
spo
rt &
com
mn
Fin
ance
Co
mm
un
ity
services
Avera
ge G
DP
Gro
wth
Figure 2.4: Contribution to Provincial GDP per Sector (2000-2007)
Source: H. Cosma and S. Enough, 2008:5.

Macro-environmental factors analyzing Chapter 2
17
2.3.5. Economic indicators in KwaZulu-Natal
Figure 2.5 shows that KZN was second only to Gauteng in 2008 in terms of its
economic contributor to South Africa.
Economic indicators
At current prices GDP GDP per % Contribution
Rbn capital Rands to National GDP Eastern Cape 155.52 23,635 7.8
Free State 108.89 37,810 5.4
Gauteng 668.93 64,012 33.5
KwaZulu-Natal 324.22 32,069 16.2
Limpopo 138.16 26,217 6.9
Mpumalanga 138.73 38,644 6.9
North West 129.87 37,864 6.5
Northern Cape 44.16 39,079 2.2
Western Cape 290.61 55,248 14.5
Figure 2.5: Economic indicators
Source: Statistics SA, Annual GDP Estimates 2008
2.3.6. KwaZulu-Natal’s contribution to South African Exports
KZN plays an important role in terms of South African’s export trade. The province's
share of overall South African exports has remained constant over a 10-year period, at
around 17 percent (http://sharondavis.co.za). In 2006, KZN was the second largest
export province out of the nine provinces in South Africa (see Figure 2.6).

Macro-environmental factors analyzing Chapter 2
18
Figure 2.6: South African Provincial Exports in 2006
Source: http://www.quantec.co.za/aboutus/news/200709
"Foreign direct investment into KwaZulu-Natal is increasing exponentially," said
Zweli Mkhize, Provincial Minister for Finance and Economic Development in his
2007/08 Budget Speech. "Between 2000 and 2005 over R27-billion was invested in
the province by foreign companies."
2.4. The characteristics of Chinese enterprises in KwaZulu-Natal
In order to understand the characteristics of Chinese enterprises in KZN, the
researcher visited some of these enterprises.
2.4.1. Distribution by areas
KwaZulu-Natal’s economic activity is concentrated in three centers: Durban,
Pietermaritzburg and Richards Bay (Altman, 2002). Most industries are located in
Newcastle, Ladysmith, Dundee, Richards Bay, Durban, Hammarsdale, Richmond,
Pietermaritzburg and Mandini (Official Yearbook, 2007/2008). Most of Chinese

Macro-environmental factors analyzing Chapter 2
19
enterprises in KZN are concentrated in developed areas, such as Durban,
Pietermaritzburg, Richards Bay, and Port Shepstone as well. Chinese enterprises are
also to be found in industrial hubs like Newcastle, Mandini, Springfield, and
Pinetown.
2.4.2. History
Chinese enterprises in KZN have a short history with most coming to the province
after 1998 (Wan, 2007), when the bilateral relation between the People’s Republic of
China and the Republic of South Africa was established.
2.4.3. Size of Chinese enterprises
The Africa Growth Institute Report in 2008 pointed out that KZN was one of three
provinces (Gauteng, Western Cape, and KZN) in South Africa with the highest
concentration of small and medium sized enterprises (SMEs). Many Chinese
enterprises in KZN fit into this category (see Table 2.4). Family businesses are also a
popular form for Chinese enterprises in the province.
Table 2.4: The definition of SMEs in South Africa
Annual turnover Employees
Micro
Very small
<100,000
<500,000
1 to 2
2 to 5
Small R50-24m 2 to 20
Medium 24-60m 20 to 200
Sources: KNC and associates (2003:3)

Macro-environmental factors analyzing Chapter 2
20
2.4.4. Distribution by industry
Although a few Chinese enterprises in South Africa have invested in
advanced-technology industries (such as the automobile, electronic products, and
energy industry), most of chinese enterprises focus on labour-intensive industries,
which include textiles, toys, restaurants, building materials, wholesale shops, and
retail shops (Wan, 2007).
2.5. Reasons for investing in KwaZulu-Natal in the past decade
Why have so many Chinese enterprises invested in KZN in the past decade?
Logically, a Chinese enterprise must incur additional transportation costs and consider
the cultural diversity and tax barriers and other risks if it decides to do business in KZN.
Theoretically, the reasons for Chinese enterprises crossing borders and expanding
their businesses in the province can be explained by the theories of FDI that can be
traced back to the theory of transaction costs postulated by Hymer (1976) and Hennart
(1982); the product life cycle theory put forward by Vernon (1966); the locational
advantage theory proposed by Dunning (1977, 1980, 1981); the “follow the
competitor” theory of Knickerbocker (1973); and the “follow the client” theory
offered by Contractor, Kundu and Chun Hsu (2003).
In terms of these theories, the reasons why Chinese enterprises selected KZN as their
business destination can be categorized into three aspects. These include:
2.5.1. Locational aspects
Different countries are faced with different location factors because of the diversity of
culture and the social background of the nation. Location can be a critical path to or

Macro-environmental factors analyzing Chapter 2
21
constraint on growth. There is no doubt that Chinese enterprises enter KZN after
identifying location factors.
2.5.1.1. Market size and attractiveness
According to Knickerbocker (1973), FDI was influenced by market size and
attractiveness of the host country. A number of studies (Bagchi-Sen and Wheeler,
1989; McConnell, 1980; Mandell and Killian, 1974; Arpan and Ricks, 1995) have
suggested that market-related factors, such as market proximity, population size and
growth rates, and levels of per capital retail spending and regional infrastructure
provision are of importance in attracting FDI at the regional level. A lot of Chinese
enterprises came to KZN due to local market size and attractiveness. They measured
local market size and attractiveness by examining the population, GDP growth, the
inflation rate, the exchange rate, competition and other aspects before building
businesses in the province. An investigation by Chandprapalert (2000); Erdal and
Tatoglu (2001) found market size to be a very important determinant of FDI. They
found the size of domestic markets to be positively related to FDI inflow.
2.5.1.2. Growing demand
Galan and Benito (2001) showed that growing demand was an important determinant
of FDI in the manufacturing sectors. Chinese enterprises in KZN are centered on
manufacturing, such as clothing, footwear, equipment, and construction materials.
Growing demand in the province is a huge opportunity for Chinese enterprises.
Economic growth in South Africa has been steady and unprecedented. It has been the
world's 22nd-largest economy by gross domestic product (GDP), and 28th-largest by
population. Annual GDP in South Africa rose by 5.1% after 2004. This increases its

Macro-environmental factors analyzing Chapter 2
22
attractiveness as a destination for Chinese investors.
2.5.2. Workforce aspects
Workforce factors refer to variables such as the cost of labour, and education levels,
and skill levels (Sandhu and Fredericks, 2005). In general, wages are negatively
associated with FDI (Kravis and Lipsey, 1989). The higher the cost of wages, the
lower the level of FDI. The cost of labour is an important factor to attract foreign
direct investment (FDI) (Kerr and Peter, 2001). Mbekeani (1999) in his research on
FDI in South Africa found that multi-national companies (MNCs) are attracted to
invest in countries with low-cost skilled labour. In the case of FDI into China, studies
have shown that the cost of labour is a significant factor (Kerr and Peter, 2001; Zhang
and Po Yuk 1998). According to a World Bank survey, Enterprises managers saw that
worker skills as a more serious obstacle to their enterprises’ operations and growth
than any other area of the investment climate. The survey also found that per worker
labour costs are very high in South Africa-over three and a half times higher than in
the most productive areas of China, over two and a half times higher than in Brazil
and Lithuania and over 75 percent higher than in Malaysia or Poland. Moreover,
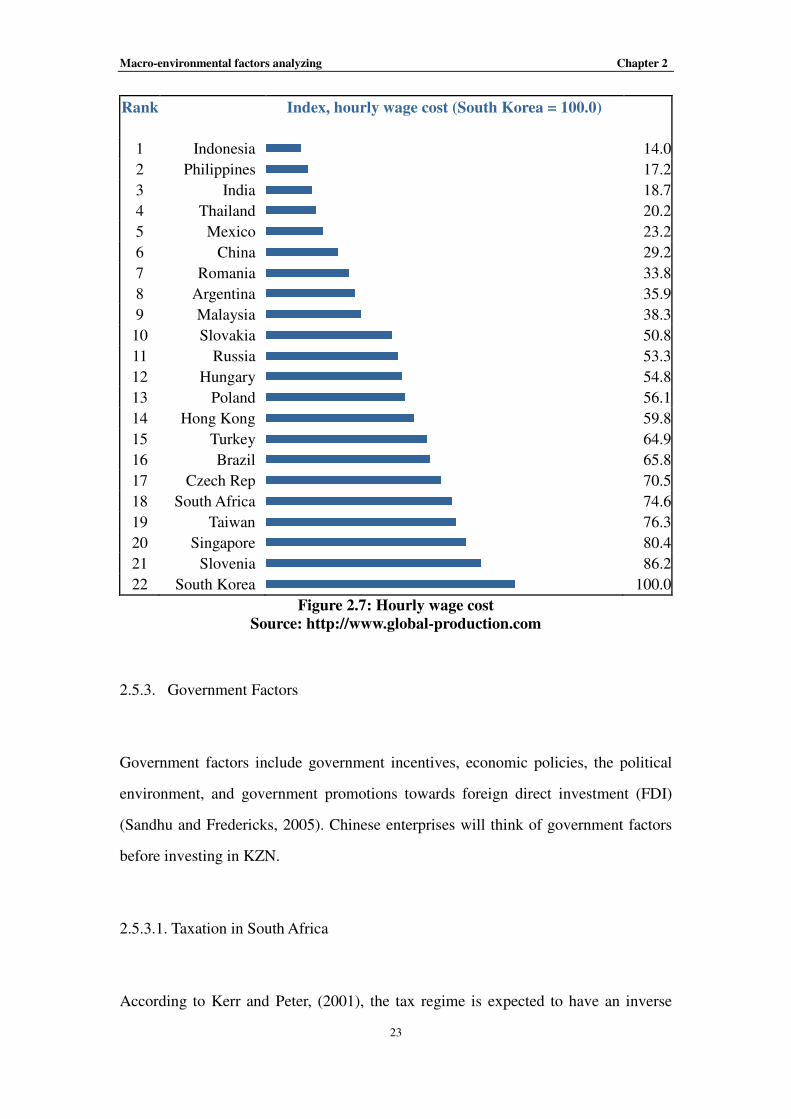
Rodrik (2007) points out that a cursory comparison of wages across countries showed
that South African wages (in the formal sector) are quite high by the standards of
countries at similar income levels (see Figure 2.7).
Macro-environmental factors analyzing Chapter 2
23
Rank Index, hourly wage cost (South Korea = 100.0)
1 Indonesia 14.0
2 Philippines 17.2
3 India 18.7
4 Thailand 20.2
5 Mexico 23.2
6 China 29.2
7 Romania 33.8
8 Argentina 35.9
9 Malaysia 38.3
10 Slovakia 50.8
11 Russia 53.3
12 Hungary 54.8
13 Poland 56.1
14 Hong Kong 59.8
15 Turkey 64.9
16 Brazil 65.8
17 Czech Rep 70.5
18 South Africa 74.6
19 Taiwan 76.3
20 Singapore 80.4
21 Slovenia 86.2
22 South Korea 100.0
Figure 2.7: Hourly wage cost
Source: http://www.global-production.com
2.5.3. Government Factors
Government factors include government incentives, economic policies, the political
environment, and government promotions towards foreign direct investment (FDI)
(Sandhu and Fredericks, 2005). Chinese enterprises will think of government factors
before investing in KZN.
2.5.3.1. Taxation in South Africa
According to Kerr and Peter, (2001), the tax regime is expected to have an inverse

Macro-environmental factors analyzing Chapter 2
24
relationship with FDI. In other words, lower taxes promote FDI and vice versa. They
pointed out that tax incentives had a positive effect on FDI. According to statistics
South Africa, South Africa's corporate tax rate was down to 28% for 2008/09
compares favorably against a number of developing countries, and the prospects of
further reductions are good (www.statssa.gov.za). Thus, taxation is an important
determinant influencing Chinese enterprise development in KZN, currently and in the
near future.
2.5.3.2. The openness of the economy in KwaZulu-Natal
The openness of the economy also explains why many Chinese enterprises have been
investing in KZN. According to Kerr and Peter (2001), the degree of openness has a
positive impact on FDI for many countries. These findings were corroborated by
Wilhelms (1998), who found economic openness to have a positive impact on FDI.
KZN has been a more open economy since 1994.
2.5.3.3. The local political environment
The political environment refers to the laws and regulations passed by governments
that can affect the viability of MNCs’ operations in the host country (Griffin and
Pustay 1999). International evidence suggests that the regulatory environment can be
a major hurdle to the survival and growth of small and new business (Mahadea and
Pillay, 2008). Rigid labour regulations can discourage firms from hiring new workers.
Close to one-third of enterprise managers said that labour regulations were a serious
problem in South Africa. Objective indicators suggest that labour regulation is more
rigid in South Africa than it is in many other middle income countries (World Bank,
2006). In the most recent Doing Business Report, a World Bank report that
compares the burden of regulation across countries, South Africa ranked 28th - higher

Macro-environmental factors analyzing Chapter 2
25
than many developed economies. Chinese enterprises may be wary of the laws and
regulations in KZN.
2.5.3.4. The level of infrastructure in KwaZulu-Natal
The level of infrastructure in the host country refers to the quality of roads, railroad,
dependable energy and telecommunication availability, credit and banking facilities
and other financial, legal and transport systems (Wilhelms, 1998; Griffin and Pustay,
1999). Cheng and Kwan (2000) found that the quality of infrastructure is a very
important factor influencing FDI. South Africa's transportation infrastructure is
among the best in Africa, supporting both domestic and regional needs. South Africa
also has several major ports that make it a central point for most trade in the Southern
African region. KZN offers an established and advanced transport infrastructure and
modes of transport to move people, goods and services between the main centres of
its province, neighbouring countries and on a global scale. Categories of transport
include rail, road, maritime, pipeline and air (http://www.transnet.co.za). Chinese
enterprises in KZN can distribute their products and services throughout the Southern
African region and the African continent by making use of South African transport
systems.
2.6. Macro-environmental factors influencing Chinese enterprise development in
KwaZulu-Natal
The macro environment refers to the external factors which affect a company's
planning and performance, and are beyond its control: for example, socio-economic,
legal and technological change. According to the government report ‘Towards a Ten
Year Review’ (The Presidency, 2004), South Africa has achieved levels of economic
stability “not seen in the country for forty years.” However, when Chinese enterprises
are doing business in KZN, they must face heterogeneous environmental factors.
Macro-environmental factors analyzing Chapter 2
26
Johan, Ernst and Neels (2006) found that the heterogeneous environmental factors
include four aspects:
� Different cultures, languages, education levels, beliefs, and behaviors;
� Different political, economic, and legal systems;
� Different levels of technological development and infrastructure, and
� Different geographies, physical landscapes, climates, and means of
accessibility.
These above factors are likely to be encountered by Chinese enterprises when
engaging business activity in KZN. These factors pose a potential business risk to
them in KZN. According to the Investment Climate Facility for Africa (ICF) Report,
the eight factors that will be considered key to a healthy macro-environment in
African countries and regions are:
� Property rights and contract enforcement
� Business registration and licensing
� Taxation and customs
� Financial markets
� Infrastructure facilitation
� Labour markets
� Competition
� Corruption and crime
As mentioned previously, most Chinese enterprises in KZN are Small, Medium and
Micro Enterprises (SMMEs). According to the Africa Growth Institute Report in 2008,
SMMEs had to face various business limitations in South Africa (see Figure 2.8).
What factors could constrain the development of Chinese enterprises in KZN and

Macro-environmental factors analyzing Chapter 2
27
what could the consequences of these uncertain factors be? Using the PESTEL model
Johnson, Scholes and Whittington (2006) identify some of the factors that could be
closely related to chinese enterprises development in KZN.
Figure 2.8: Business limitations
Source: Africa Growth Institute, South African SMME Business Confidence
Index Report: First Quarter 2008
Recognition that a healthy investment climate is vital for the continent's economic
growth led to the establishment of the Investment Climate Facility for Africa (ICF) in
2006. At the same time, according to the ICF Report in 2006, improvement of the
macro-environmental is crucial for wider economic growth for many countries. Johan,
Ernst and Neels (2006) point out key factors affecting FDI flows into Southern
African countries (see Figure 2.9). Furthermore, the recent economic growth enjoyed
by Africa can, at least partly, be attributed to strengthening macro environments
across the continent (World Bank, “Africa economic outlook”, 2007). Although a joint
Department of Trade and Industry and World Bank Investment Climate Survey show
that South Africa’s investment climate is favorable when compared to the investment
climates of other countries in Sub-Saharan Africa and other middle-income countries
Access to bank credit Govern taxes and regulations
Competitions from imports The exchange rate
Access to markets Insufficient demand
Shortage of skilled labour Employees costs
Impacts of HIV/Aids Operating & capital costs
Crime Other
BEE Procurement & supplier

Macro-environmental factors analyzing Chapter 2
28
throughout the world, the external economic environment still constrains the
development of Chinese enterprises in KZN. This study focuses on seven
macro-environmental factors that could constrain Chinese enterprise’s development in
KZN.
68%
48.70%
28.50%
28.10%
27.80%
25.20%
24.80%
21.20%
19.50%
17.50%
13.90%
11.30%
10.30%
0% 10% 20% 30% 40% 50% 60% 70% 80%
Political stability
Crime
Economic stability
Infrastructural development
Corruption
Government spending
Labor productivity
Exchange control
Pool of human resources
Training of people
Tax system
Bureaucracy
International competitiveness
Figure 2.9: Key factors affecting FDI flows into Southern African countries
Source: Johan, Ernst and Neels (2006:411)
2.6.1. Exchange rate
Currency exchange rates define the value of different national currencies against each
other (Moor, 2004). MacDermott (2008) defined the exchange rate as the ratio of the
currency of the host country divided by that of the parent country. Rapid changes in
the value of the local currency, coupled with fluctuating commodity prices affect
revenue and cost projections (Singh, 2006:20). Exchange rate movements have long

Macro-environmental factors analyzing Chapter 2
29
been considered to be a crucial factor for FDI (Lee, 2005). Changes in exchange rates
will change production costs if imported raw materials are an important factor of
production, that is, variability in exchange rates will make profits uncertain (Ghatak,
Healey and Jackson, 1995:245). Movement in the currency exchange rates has a
direct impact on the development of Chinese enterprises in KZN because most
Chinese enterprises import raw materials, semi-manufactured products and
final-products from China. It is important that Chinese companies understand the
movement in exchange rates. For a Chinese enterprise, the returns on investment in
KZN will depend upon the exchange rates in South Africa (Ghatak, Healey and
Jackson, 1995:245). The exchange rate between the Rand and US Dollar will be of
particular concern to Chinese enterprises. Suppose a Chinese enterprise needs to
import materials from China, which are worth a $1,000. If the Rand to US dollar
exchange rate is R8/$1, then the total cost of materials is R8, 000. However, if the
Rand to US dollar exchange rate is R9/$, then the total cost of materials is R9, 000.
In other words, they have to pay an additional R1, 000. When the exchange rate was
weak, Chinese enterprise in KZN had to spend more money to purchase similar
materials. The exchange rate has taken an unfortunate turn since 2005 (as shown in
Figure 2.9).

Macro-environmental factors analyzing Chapter 2
30
Figure 2.10: Exchange rate between Rand and US Dollar
Source: Board of Governors of the Federal Reserve System
On the other hand, the weak exchange rate means the depreciation of South Africa
Rand. Depreciation causes the cost of capital to rise, reduces investments, reduces
growth rates and leaves many developing economies in a poor state
(http://www.highbeam.com/doc). According to a survey by the World Bank, despite
South Africa’s relatively strong macro-economic performance-modest GDP growth
and moderate inflation-about one third of enterprise managers said that
macroeconomic instability was a serious problem. This is due to exchange rate
instability-in real terms the Rand has been one of the unstable of the World’s major
currencies. In a survey of South African clothing companies in KZN in 2007, 80
percent of the sample responded in the affirmative when asked whether the exchange
rate had affected their operations.

Macro-environmental factors analyzing Chapter 2
31
2.6.2. Crime rate
According to a World Bank Report, the cost of crime, although lower than in the
worst performing middle-income economies, is higher in South Africa than it is in
many of its competitors. Enterprises in South Africa also considered crime a major
problem for development. About 29 per cent of the respondents in the 2004
Investment Climate Survey rated crime as a major or very severe problem in South
Africa (World Bank, 2006). Direct losses due to crime and the cost of security were
equal to about 1.1 per cent of sales, a figure that is much higher than in many
middle-income countries such as China, Poland, Brazil and even Russia (World Bank,
2004:12). Therefore, it is not surprising that crime has been a costly burden to
Chinese enterprises in KZN. According to Business Against Crime (BAC) (2006),
crime affects business directly, including theft of property and financial crimes. Crime
has indirectly and directly reduced business confidence, led to a loss of investment,
emigration and the steady erosion of the foundations upon which the economy is built.
Furthermore, according to a World Bank report, high crime rates in South Africa
remain a deterrent to the investment attractiveness of the country, even though
improvements are appearent.
A Nedcor-sponsored study estimated that the cost of crime in South Africa was at
least R31 billion in 1995. The figure is undoubtedly much higher now, as most South
Africans think crime is still prevalent in every facet of business in South Africa.
Crime statistics released by government in June 2008, for the period April
2007-March 2008, indicated that the number of reported murder cases in South Africa
was 18 487 (giving a rate of 38.6 per 100 000 of the population, apparently one of the
highest in the world). Although crime was not as big an issue in Gauteng, home
robbery, one of the most-feared crimes increased from 2 667 to 3 480 cases (30
percent) in KZN, while business robbery increased from 997 cases to 1923 (92 per
cent) over the same period (Natal Witness, 1/7/08). Per person government spending

Macro-environmental factors analyzing Chapter 2
32
on social security in KZN was higher than the national average (Statistics South
Africa recently released a document tabling provincial expenditure in 2003/2004.).
What does crime mean for the macro-environment? Mauro (1995) has shown that
crime, together with corruption, constitutes a serious obstacle to doing business and
adds a transaction cost. Mahadea and Pillay (2008) point out that crime hinders
entrepreneurial activity, viability and profitability of firms and slows down business
development and the growth of the economy. A recent study commissioned by the
Presidency confirms this: over half of South Africa’s small businesses were victims of
crime in 2008, while about a quarter were reluctant to expand or employ more labour;
as they could lose at least a fifth of their annual turnover to crime through direct and
indirect costs (Benjamin, 2008). Although authorities have set a target of reducing
“contact crimes”, the Police Service’s crime statistics released in September 2006
showed the crime rate increased by 11.3 per cent between April 1994 and March 2006
in South Africa. Moreover, the number of serious crimes remained high at some 2.17
million in 2005/06, and some of them, including homicides, residential robberies and
especially drug-related crimes are still on the rise. (World Bank, Africa economic
outlook, 2007)
2.6.3. Infrastructure services
Infrastructure services include power, roads, transport services, information and
communication technologies, and other exigencies as well (Mahadea and Pillay,
2008:46). In the host country, the level of infrastructure refers to the quality of roads,
railroad, dependable energy and telecommunication availability, credit and banking
facilities and other financial, legal and transport systems (Wilhelms, 1998). Wilhelms
(1998) econometric study also found that institutional factors such as commercial
energy are positively correlated with FDI. Cheng and Kwan (2000) found that quality
of infrastructure is a very important factor influencing FDI. Dunning (1981), he points

Macro-environmental factors analyzing Chapter 2
33
out that the level of infrastructure development was a more important determinant of
FDI for MNCs. Root and Ahmed (1978) in their empirical investigation also found
that effective services in terms of adequate infrastructure in the area of banking,
finance, insurance, telecommunication, transportation and distribution had a positive
impact on the ability of the host country to attract FDI.
Infrastructure, in all its forms, is a catalyst for development. Well-planned and
managed infrastructure can enhance costs. It enables established businesses to expand
their production levels. It also promotes trade and supports economic concentration
(http://www.anc.org.za/ancdocs/history/mbeki). KZN has a well-developed
infrastructure of roads, railways and telecommunications, plentiful semi-skilled
labour, and a sophisticated commercial and financial business structure,
complemented by a full range of professional services, good access to overseas
markets, quality housing, and excellent medical, social and cultural facilities. Modern
industrial parks are found throughout the province and standard factory buildings are
available, while custom-built factories can be constructed according to specification.
In addition, KZN is experiencing the biggest investment in infrastructure programmes
in its history. Then KZN Premier S’bu Ndebele commented in his State of the
Province Address that the province would enter a robust investment period. The
projects completed for the 2010 FIFA World Cup served as a main catalyst for the
development of transport infrastructure in the province, and integrated road, rail, air
and marine transport in an effort to boost economic growth in KZN, with an emphasis
on incorporating previously marginalized communities into the urban framework.
Local government has identified massive infrastructure projects as key to boosting the
KZN's economic growth rate and creating employment, and is spending billions of
Rands on getting the investment ball rolling. Rrecognising the economic importance
of a good road structure, the KZN Department of Transport has instituted an ongoing,
long-term programme to continually upgrade the province’s road network.

Macro-environmental factors analyzing Chapter 2
34
Although energy costs have been increased, South Africa's energy costs are still
among the lowest in the world (see Figure 2.11). Compared to most industrial
countries in the world, South Africa has very competitive prices for industrial and
commercial electricity. For example, the price of a kilowatt of electricity in South
Africa is only one third of the price in the UK. However, power shortages have
become a negative factor for the level of infrastructure in KZN. KZN receives its
electricity supply via the national supply grid from the state-owned electricity
supplier, Eskom. The municipalities carry out local reticulation in the cities. In 2007
Eskom started experiencing a lack of capacity in electrical generating and reticulation
infrastructure. This led to an inability to meet the routine demands of industry and
consumers, resulting in countrywide rolling blackouts. The supplier has been widely
criticized for failing to adequately maintain existing power stations or plan for and
construct sufficient electrical generating capacity.
Figure 2.11: World electricity prices 2007
Source: United Nations

Macro-environmental factors analyzing Chapter 2
35
2.6.4. Inflation
Hellerstein (1997) defins inflation as “a sustained rise in the general price level”.
According to Reilly and Brown (2006), higher inflation would cause higher market
interest rates, increases uncertainty about future prices and costs, and harms firms that
cannot pass on their cost increases. Although South African inflation rate has declined
significantly during the past 10 to 15 years (Philiph Mohr, 2008:1), inflation is still
one of the most hotly debated economic issues in KZN. According to a survey of
leading economists by I-Net Bridge, the annual inflation rate of KZN was 9.4% in
June 2009. It was higher than the headline inflation, which was the inflation target of
South African Reserve Bank. Statistics released in June 2008 by Statistics South
Africa showed that the food inflation averaged 18, 9 percent in KZN and was six
percentage points above the national average of 18, 3 percent.
2.6.4.1. Real rates of return
Why do Chinese enterprises worry about inflation? The answer is that a high inflation
rate would reduce their rates of return (Ghatak, Healey and Jackson, 1995). According
to Ghatak, Healey and Jackson (1995), the nominal rate of return was defined as the
sum received next year, minus the sum invested now, divided by the sum invested
now. The nominal rate of return can be formulated by the following:
Nominal rate of turn =
Assume that a Chinese enterprise invests R100, 000 this year and expect R150, 000
next year. The nominal rate of return of Chinese enterprise is:
Sum received next year - Sum invested now
Sum invested now

Macro-environmental factors analyzing Chapter 2
36
Nominal rate of turn = = 15%
Inflation should be taken into account by investors in investment decisions (Frost and
Hager, 1986). The real rate of return for Chinese enterprises must take into account
the inflation rate in KZN. According to Ghatak, Healey and Jackson (1995), the real
rate of return can be calculated by the following formulation:
Real rate of return= Nominal rate of return-rate of inflation
According to Table 2.5, KZN headline inflation rate in 2008 was 12.3%. Thus, the
Chinese enterprise’s real rate of return is 2.7% (15% minus 12.3%) in the above
example. Higher inflation rate in South Africa will greatly reduce Chinese enterprises’
rate of return in KZN.
Table 2.5: Headline inflation rate in KwaZulu-Natal (KZN) 2008
Geographical Area Headline Inflation (%)
KwaZulu-Natal 12.3
Province excluding rural areas 12.2
Durban/Pinetown 12.2
Pietermaritzburg 14.7
Other Urban areas 11.5
Rural areas 13.2
Source: Statistics South Africa
2.6.4.2. Inflation’s inconveniences
The inflation rate not only impacts on the real rate of return for Chinese enterprises,
but also created more inconveniences in the operation for Chinese enterprises in KZN.
Economists in the United States (US) have analyzed the inconveniences caused by
150,000-100,000
100,000

Macro-environmental factors analyzing Chapter 2
37
inflation. They highlight two aspects as follows (Hellerstein, 1997):
i. Menu costs: Firms must alter their nominal prices to keep up with inflation.
These adjustments require both time and money. The classic restaurant
example underlines the time the manager must spend to set new prices and
the money then spent to print new menus.
ii. Shoe leather costs: People must spend more time searching for good prices
when inflation is high, as relative prices may be more variable.
It is generally accepted that higher inflation is indicative of poor economic
performance and is a major determinant of FDI (Hamadziripi, 2008). In this regard,
higher inflation could scare investors.
2.6.5. Union problems
Unions can be an instrument of social change but even when they play a larger role in
society, their core activity remains focused at the workplace. Finnemore and Merwe
(1989:39) define a trade union as an organization of workers who by collective action,
strive to defend and advance their interests. In many instances, union actions have the
effect of restraining productivity or efficiency (Slichter, Healy and Livernash, 1960).
Sutherland (2006) defined a trade union as a continuous association of wage earners
for the purpose of maintaining or improving the conditions of their working lives. He
argued that unions go beyond wage negotiations, maintaining or improving conditions
of working lives in the 21st century. Research by Freeman and Medoff (1984)
indicates that unions can have a negative impact on competitiveness. They do this by
using their monopoly position to drive up wages and to introduce restrictive work
practices that inhibit management’s ability to introduce productive work practices. In

Macro-environmental factors analyzing Chapter 2
38
other words, unions use their monopoly power to force employers to pay better wages
and benefits. Freeman and Medoff also argued that unions greatly affect outcomes
such as productivity. Vedder and Gallaway (2002) point out that the union could
reduce the level of an organization’s productivity. As a result, output will decline. In
addition, unions impact on the organizational climate and workplace culture in a
variety of ways (Verma, 2005). Verma (2005) also found that managements in
non-union environments are able to build a climate of effective communication and
strong identification with organizational goals. This finding is supported by
Cohen-Rosenthal, Edward and Burton (1993), who note that unions are a barrier to
effective communications with management.
Although trade unions in South Africa protect members against unfair labour
practices, they also have some negative effects enterprises, especially for foreign
organizations (Cebekhulu, 2001). Present day economists and entrepreneurs in South
Africa have identified unions as a problem, and state that they are a major limitation
for business development. Rodrik (2008) notes that trade unions played an important
role in wage determination in South Africa (Rodrik, 2008). In a survey of South
African clothing companies in KZN in 2007, more than eight per cent of respondents
believed that unions had affected their businesses recently. Palmi (2007) points out
that at notable concern relating to union activity is a disturbing outcome.
2.6.6. Taxation
In South Africa, government revenue is derived primarily from a residence-based
income tax on business, individuals and trusts and a 14% value added tax (VAT) on
nearly all goods and services (South Africa at a Glance, 2009-10). The corporate tax
rate in South Africa is far lower than in the US, Australia, Brazil, India and China (see
Figure 2.11). However, high tax rates and complex tax administration are constraints
to enterprise development and can force firms to operate in the “grey” economy,

Macro-environmental factors analyzing Chapter 2
39
where the pay-off from productive and non-productive activities can be high, with
possible tax evasion or avoidance (Mahadea and Pillay, 2008). Mahadea and Pillay
(2008) also showed that the cost of tax compliance is regressive, and that the annual
cost of tax compliance for the small business (with an annual turnover of about R1m),
is almost 3 per cent of turnover in South Africa. SMMEs compliance cost in South
Africa was R79 billion (about 6.5 per cent of SA’s GDP) in 2004, whereas in OECD
(the Organization for Economic Co-operation and Development) countries it was less
than 3 percent (Theunissen, 2006). According to a World Bank Report (2007),
companies in South Africa take about 350 hours (almost nine standard working
weekdays) a year for a medium-sized firm to prepare, file and pay taxes, a much
higher figure compared with the U.K.(105 hours) and Botswana (140 hours).
COMPARATIVE TAX RATES (%)
Corporate Value Added
South Africa 28 14
Argentina 35 21
Australia 30 10
Brazil 34 17-25
China 25 17
Czech rep. 21 90
France 33.3 19.6
Germany 30-33 19
India 30-40 12.5
Italy 31 20
Japan 30 5
Poland 19 22
Russia 20 18
Spain 30 16
Sweden 26 25
UK 28 15
USA 35 15
Figure 2.12: Comparative tax rates around the world
Source: ACCF, Worldwide-tax
In South Africa, small business corporations are taxed at a rate of 0 per cent on the
Macro-environmental factors analyzing Chapter 2
40
first R40,000 of taxable income, at 10 percent for income between R40,001 and
R300,000, and at 29 per cent for amounts above R300,000. VAT (Value Added Tax)
and income tax can be considered as an important factors (Mahadea and Pillay, 2008)
constraining business growth in KZN for most Chinese enterprises. Taxes affect
business in various ways, which include taxes “take up too much time/attention”,
“time involved in paperwork/record keeping”, “impact of paying tax on cash flow”,
and “penalties for late payment are excessive” as well as “competition from
businesses that avoid tax” (Mahadea and Pillay, 2008).
2.6.7. Competition
An entrepreneur cannot exist without competition because a business must face
competition from different sources. Though a business might does not want
competition from other businesses, inevitably most will face a degree of competition.
A business could react to an increase in competition (e.g. a launch of a rival product)
in the following ways (http://tutor2u.net):
� Cut prices (but can reduce profits)
� Improve quality (but increases costs)
� Spend more on promotion (e.g. do more advertising, increase brand loyalty;
but costs money)
� Cut costs, e.g. use cheaper materials, make some workers redundant
Porter (1985) point out that competition can severely constrain the growth of a
business; unless a firm has effective mechanisms like overall cost leadership,

Macro-environmental factors analyzing Chapter 2
41
differentiation and focus strategies. Most Chinese enterprises have put sufficient effort
into confronting this issue although. They have to face various competitions from
different sources. Surveys have confirmed that disregard of competition was listed a
major cause of business failure (www.fin24.co.za). To survive in the current market,
Chinese enterprises should be able to monitor competition all the time because
competition may come from their followers or even their business partners.
Competitors may undertake promotional strategies which are uneconomical for
chinese enterprises in KZN. Today’s cutthroat competitive environment in KZN has
greatly harmed the development of Chinese enterprises, especially in the clothing and
textile industry (LingLing, 2003).
2.7. Conclusion
For a Chinese enterprise to succeed in KZN, one needs to consider not only the
internal environment of the company, but also the external factors – the macro
environment. The literature review focused on macro-environmental factors related to
the development of Chinese enterprises in KZN. This will assist the researcher in
formulating a theoretical framework for the study. The empirical study is presented in
the next chapter.

Macro-environmental factors analyzing Chapter 3
42
CHAPTER THREE
RESEARCH METHODOLOGY
3.1. Introduction
This chapter outlines the research methodology and the techniques used to acquire data
for analysis. It deals with the type of study, the qualitative and quantitative research
design, the time horizon, the sampling design of the study, data collection, the
questionnaire used for the study, measuring instruments, data analysis and the
conclusion. The purpose of this research is to investigate macro-environmental factors
influencing the development of Chinese enterprises in KwaZulu-Natal (KZN).
3.2. Type of Study
The type of design applied for the study is exploratory in nature. Robson (2002) states
that an exploratory study is a valuable means of finding out ‘what is happening; to seek
new insights; to ask questions and to assess phenomena in a new light’. Sekaran (2003),
adds that an exploratory study is undertaken when very little is known about the
situation at hand, or no information is available on how similar problems or research
issues have been solved in the past. The researcher has made use of the exploratory
study technique because there is little understanding of the macro-environmental
factors influencing the development of Chinese enterprises in KZN in recent years. An
exploratory study is particularly useful if one wish to clarify one’s understanding of a
problem, such as when one is unsure of the precise nature of the problem (Mark, Philip,

Macro-environmental factors analyzing Chapter 3
43
and Adrian, 2007:133). Through exploration, researchers develop concepts more
clearly, establish priorities, develop operational definitions, and improve the final
research design (Cooper and Schindler, 2008:145). In this study, the exploratory study
aims at bringing macro-environmental factors influencing the development of Chinese
enterprises in KZN to the fore. “In essence, exploratory studies are undertaken to better
comprehend the nature of the problem since very few studies might have been
conducted in that area…exploratory studies are also necessary when some facts are
known, but more information is needed for developing a viable theoretical
framework… exploratory studies are important for obtaining a good grasp of the
phenomena of interest and advancing knowledge through subsequent theory building
and hypothesis testing” (Sekaran 2003:135). Finally, exploration may also save time
and money in the whole process of research (Cooper and Schindler, 2008:145).
3.3. Qualitative and Quantitative Research Design
The objectives of exploration may be accomplished with different techniques (Cooper
and Schindler, 2008:146). Although exploration relies more heavily on qualitative
techniques, both the qualitative and quantitative method of research will be applied in
this study. The terms “quantitative” and “qualitative” are used widely in business and
management research to differentiate both data collection techniques and data analysis
procedures. A qualitative method is used predominantly as a synonym for any data
collection technique (such as an interview) or data analysis procedure (such as
categorizing data) that generates or uses non-numerical data (Mark, Philip and Adrian,
2007:145). Moreover, according to Sekaran (2003:185-191), qualitative research
includes an “array of interpretive techniques which seek to describe, decode, translate,
and otherwise come to terms with the meaning, not the frequency of certain more or
less naturally occurring phenomena in the social world.” Qualitative techniques are
used at both the data collection and the data analysis stages of a research project. At
the data collection stage, the array of techniques includes focus groups, individual

Macro-environmental factors analyzing Chapter 3
44
depth interviews, case studies, ethnography, grounded theory, action research, and
observation. During analysis, the qualitative research includes behavioral
observations, debriefing of observers, and artifacts. The researcher chose a qualitative
methodology based on the project’s purpose, schedule, budget, issues or topics being
studied, the target group required, and the researcher’s skill, personality, and
preferences. Qualitative research provides well grounded, rich descriptions and
explanations of processes occurring in the local context.
In contrast, quantitative research is predominantly used as a synonym for any data
collection technique (such as a questionnaire) or data analysis procedure (such as
graphs or statistics) that generates or uses numerical data (Mark, Philip and Adrian,
2007:145). Cooper and Schindler (2008) point out that quantitative research attempts
precise measurement of something. In quantitative research, data often consist of
participant responses that are coded, categorized, and reduced to numbers so that
these data may be manipulated for statistical analysis. Quantitative research is the
systematic scientific investigation of properties and phenomena and their
relationships. The objective of quantitative research is to develop and employ
mathematical models, theories and/or hypotheses pertaining to natural phenomena.
The process of measurement is central to quantitative research because it provides the
fundamental connection between empirical observation and the mathematical
expression of quantitative relationships. Quantitative methods are research techniques
that are used to gather quantitative data - information dealing with numbers and
anything that is measurable. Statistics, tables and graphs, are often used to present the
results of these methods (www.en.wikipedia.org).
3.4. Time horizon
The time horizon of this study is cross-sectional where there is representation at only
one point in time. “A study can be done in which data are gathered just once, perhaps

Macro-environmental factors analyzing Chapter 3
45
over a period of days or weeks or months, in order to answer a research question.
Such studies are called one-shot or cross-sectional studies” (Sekaran, 2003: 135).
Furthermore, according to Mark, Philip and Adrian (2007) the cross-sectional study
refers to a particular phenomenon at a particular time. In this study, data was collected
via questionnaires in September 2009.
3.5. Sampling design of study
Sekaran (2003) defines sampling as the process of selecting a sufficient number of
elements from the population so that by studying the sample and understanding the
properties of the characteristics of the sample subjects (statistics), the properties or
characteristics may be generalized to the population elements (parameter). He adds
that in research investigations involving several hundreds and even thousands of
elements, it would be practically impossible to collect data from, or test, or examine
every element. For some research questions it is possible to collect data from an entire
population as it is of a manageable size. However, you should not assume that a
census would necessarily provide more useful results than collecting data from a
sample which represents the entire population (Mark, Philip and Adrian, 2007). Henry
(1990) argues that using sampling makes possible a higher overall accuracy than a
census. Furthermore, Cooper and Schindler (2008) point out that the basic idea of
sampling is that by selecting some of the elements in a population, we may draw
conclusions about the entire population. In conclusion, there are several compelling
reasons for sampling, including (1) lower cost, (2) greater accuracy of results, (3)
greater speed of data collection, and (4) availability of population elements (Cooper
and Schindler, 2008:375).
In the process of sampling design, the five terms – population, element, population
frame, sample, and subject - should be identified by researcher first (see Table 3.1).

Macro-environmental factors analyzing Chapter 3
46
Table 3.1::::Terms of sampling
Terms Definitions In the study
Population Refers to the entire group of
people, events, or things of
interest that the researcher
wishes to investigate
All owners of Chinese
enterprises in KZN
Element Is a single member of the
population
An owner of Chinese
enterprises in KZN
Population frame Is a listing of all the elements
in the population from which
the sample is drawn
Chinese enterprise owners
who have invested in KZN
Sample Is a subset of the population 50 owners of Chinese
enterprises in KZN
Subject Is a single member of the
sample
Owners from 50 Chinese
enterprises in KZN
Source: Uma Sekaran (2003:265-266)
Basically, there are two major types of sampling design: probability and
non-probability sampling. Both types include various sampling techniques (see figure
3.1) (Mark, Philip and Adrian, 2007:207). When elements in the population have a
known chance of being chosen as subjects in the sample, we resort to a probability
sampling design (Sekaran 2003:270). Mark, Philip and Adrian (2007)note that
probability sampling is most commonly associated with survey-based research
strategies where you need to make inferences from your sample about a population to
answer your research question(s) or to meet your objectives. According to Sekaran
(2003), simple random sampling is used when researchers draw the elements from the
population, it is most likely that the distribution patterns of the characteristics
researchers are interested in investigating in the population are also likewise
distributed in the subjects researchers draw from for their sample. Furthermore,
simple random sampling involves you selecting the sample at random from the
sampling frame using a computer (Mark, Philip and Adrian, 2007:215). Based on the
analysis above, the probability sampling method and simple random sampling will be

Macro-environmental factors analyzing Chapter 3
47
used for this study.
Figure 3.1: Sampling techniques
Source: Mark, Philip and Adrian, 2007:207
3.6. Data collection
It is logical to assume that the way researchers collect their data is going to yield valid
data (Mark, Philip and Adrian, 2007:152). Appropriate data collection methods
enhance the value of the research. There are several data collection methods, each
with its advantages and disadvantages. Data can be collected in a variety of ways.
Interviewing, administering questionnaires, and observation a phenomena are the
three main data collection methods in the survey research (Sekaran, 2003:223). In this
study, the researcher administered questionnaires to collect data.
A questionnaire is a pre-formulated written set of questions to which respondents
Sampling
Probability Non-probability
Simple
Random
Systematic
Stratified
Random
Cluster
Multi-stage
Quota Snowball Convenience
Purpose Self-selection
Extreme
Case
Homogeneous Typical
Case
Heterogeneous Critical
Case

Macro-environmental factors analyzing Chapter 3
48
record their answers, usually within rather closely defined alternatives. Questionnaires
are an efficient data collection mechanism when the researcher knows exactly what is
required and how to measure the variables of interest. Questionnaires can be
administered personally, mailed to the respondents, or electronically distributed
(Sekaran, 2003: 236).
According to Mark, Philip and Adrian (2007), different types of questionnaires can be
used during the data collocation stage (see Figure 3.2). The choice of type of
questionnaire is obviously important. Mark, Philip and Adrian (2007) note that the
choice of questionnaire will be influenced by a variety of factors related to your
research question(s) and objectives, and in particular the:
� Characteristics of the respondents from whom researcher wish to collect data;
� Importance of reaching a particular person as respondent;
� Importance of respondents’ answers not being contaminated or distorted;
� Size of the sample researcher require for their analysis, taking into account the
likely response rate;
� Types of question researcher need to ask to collect the data; and
� Number of questions researcher need to ask to collect the data.
They also point out that the choice of questionnaire will be affected by the resources
the researcher has available and in particular the:
� Time available to complete the data collection;
� Financial implications of data collection and entry;
� Availability of interviewers and field workers to assist; and
� Ease of automating data entry

Macro-environmental factors analyzing Chapter 3
49
Figure 3.2: Types of questionnaire
Source: Mark, Philip and Adrian (2007:357)
In this study, personally administered questionnaires will be applied by the researcher
as shown in the shaded portion in Figure 3.2. Researcher will deliver questionnaires
by hand to each respondent and collect the questionnaire at another point in time. The
main advantage of this method is that the researcher(s) can collect all the completed
responses within a short period of time. Any doubts that the respondents might have
on any question could be clarified on the spot. Moreover, the researcher(s) is also
afforded the opportunity to introduce the research topic and motivate the respondents
to offer their frank answers (Sekaran, 2003: 236).
3.7. The Questionnaire
A questionnaire (see appendix A) was constructed as the primary data collection
method. The questionnaire was designed according to the research purposes and
conceptual framework described in the previous chapter. The questionnaire format
was chosen because of time and resource constrains on the part of both the
respondents and the researcher. To gather more precise information through the
questionnaire, pre-testing took place where the questionnaire was given to nine
respondents to establish whether it was user-friendly and ensures that all the questions
were clear. Based on 2.4.1 discussion in Chapter Two, Fifty of the respondents in this
Questionnaire
Interviewer-administered Self-administered
Postal
Questionnaire
Internet-mediated
Questionnaire
Delivery and
Collection
Questionnaire
Telephone
Questionnaire
Structured
Questionnaire

Macro-environmental factors analyzing Chapter 3
50
study were selected from different areas where Chinese enterprises were concentrated
in KZN. The researcher found respondents by Chinese community and sent
questionnaires to them by e-mail and hand. The researcher sent fifty questionnaires to
fifty owners of Chinese enterprise in KZN. However, three questionnaires were not
returned by respondents. It means that the response rate was 94 per cent. According to
Sekaran (2000:237), a 30% response rate is considered acceptable. The questionnaire
in this study consisted of 29 questions with four sections, as follows:
Table 3.2: The sections of the questionnaire
3.8. Measuring instruments
Measurement is an integral part of research design. Measurement in research consists
of assigning numbers to empirical events, objects or properties, or activities in
compliance with a set of rules. The goal of measurement is to provide the
highest-quality, lowest-error data for testing hypotheses, estimation or prediction, or
description. Furthermore, the object of measurement is a concept, the symbols
researcher attach to bundles of meaning that they hold and share with others (Cooper
and Schindler, 2008:279). A scale is a tool or mechanism by which individuals are
distinguished as to how they differ from one another on the variables of interest to the
study. The scale or tool could be a gross one in the sense that it would only broadly
Content
Section one Personal details
Section B Reasons for investing in KwaZulu-Natal
Section C Macro-environmental factors
Section D Aspects influencing by macro-environmental factors

Macro-environmental factors analyzing Chapter 3
51
categorize individuals on certain variables, or it could be a fine-tuned tool that would
differentiate individuals on the variables with varying degrees of sophistication
(Sekaran, 2003:185). According to Sekaran (2003), there are four basic types of scales
(as shown in Table 3.3).
Table 3.3: Four types of scales
Type Definition
Nominal scale A nominal scale is one that allows the researcher to assign subjects
to certain categories or groups. It splits data into groups.
Ordinal scale An ordinal scale not only categorizes the variables in such a way as
to denote differences among the various categories, it also
rank-orders the categories in some meaningful way. It ranks data in
some order
Interval scale An interval scale allows us to perform certain arithmetical
operations on the data collected from the respondents. It sets data
on a continuum.
Ratio scale A ratio scale not only measures the magnitude of the differences
between points on the scale but also taps the proportions in the
differences. It starts with absolute zero and indicates proportion.
Scales in this study include nominal, interval, and ratio. (See Appendix 1 for
questionnaire).
Different rating scales are used in organizational research. This study mainly uses the
category scale (which uses multiple items to elicit a single response (Sekaran,
2003:197)), and the likert scale (which is designed to examine how strongly subjects
agree or disagree with statements on a 5-point scale (Sekaran, 2003:197)).

Macro-environmental factors analyzing Chapter 3
52
3.9. Data analysis
Data from closed questions was coded and captured on SPSS Version 13.0 where it
was analyzed using the descriptive statistical techniques. Graphical techniques and
visual representations were used to represent the statistical data results. Examples of
these would include frequency tables, and bar, and pie charts. The analysis revealed
some interesting findings, which are discussed in the next chapter.
3.10. Conclusion
A clear and rational research methodology and technique is an extremely important
for the researcher. It will provide clear guidelines for the study. In this chapter, the
researcher clarified the type of study, the qualitative and quantitative research design,
time horizon, sampling design, data collection, questionnaire, measuring instrument,
data analysis, and conclusion. It designs the research methodology and procedures
utilized to attain data for analysis.

Macro-environmental factors analyzing Chapter 4
53
CHAPTER FOUR
Findings
4.1. Introduction
The researcher sent questionnaires to 50 owners of Chinese enterprises in KZN. 47
respondents completed the questionnaire. Therefore, the response rate is 94%, that is,
the response rate of the questionnaire is 94 percent (see Figure 4.1). According to
Sekaran (2003:237), a 30% response rate is considered acceptable.
94%
6%
Validity Invalidity
Figure 4.1::::The response rate in this study
Statistical analysis was conducted on each and every question asked. Descriptive
statistics involve transformation of raw data into a form that provides information to
describe a set of factors in a situation. This is done through ordering and manipulation
of the raw data collected. The exploratory data analysis approach emphasizes the use

Macro-environmental factors analyzing Chapter 4
54
of diagrams to understand the data. Descriptive statistics enable the researcher to
describe and compare variables numerically (Mark, Philip and Adrian, 2007:433-434).
Descriptive statistics are provided by frequencies, measures of central tendency, and
dispersion (Sekaran 2003:135). The data was analyzed by using SPSS (Statistical
Package for the Social Sciences) and the results will be interpreted as follows.
4.2. Biographical aspects of the sample
The following Tables and Figures present the findings related to biographical aspects
of the sample.
4.2.1. Age of respondents
21%21%21%21%
19%19%19%19% 51%51%51%51%
9%9%9%9%
Over 51Over 51Over 51Over 51
41-5041-5041-5041-50
31-4031-4031-4031-40
Under 30Under 30Under 30Under 30AgeAgeAgeAge
Figure 4.2: Age of respondents
As Figure 4.2 shows, 9% of respondents are under 30 years of age, 51% of
respondents are between 31 and 40, 19% of respondents are between 41 and 50, and
21% of respondents are over 51.

Macro-environmental factors analyzing Chapter 4
55
4.2.2. Gender of respondents
malemalemalemalefemalefemalefemalefemale
G e n d e rG e n d e rG e n d e rG e n d e r
40404040
30303030
20202020
10101010
0000
Co
un
tC
ou
nt
Co
un
tC
ou
nt
12121212
35353535
Figure 4.3: Gender of respondents
Of 47 people who responded, as Figure 4.3 shows the majority of respondents in this
study were male (35) and 12 were female.

Macro-environmental factors analyzing Chapter 4
56
4.2.3. Contribution by age of business in KZN
Mor e than 11 year sMor e than 11 year sMor e than 11 year sMor e than 11 year sFr om 6 to 10 year sFr om 6 to 10 year sFr om 6 to 10 year sFr om 6 to 10 year sFrom 3 to 5 year sFrom 3 to 5 year sFrom 3 to 5 year sFrom 3 to 5 year sFrom 1 to 2 year sFrom 1 to 2 year sFrom 1 to 2 year sFrom 1 to 2 year sLess than 1 yearLess than 1 yearLess than 1 yearLess than 1 year
Ye a rsYe a rsYe a rsYe a rs
60.0%60.0%60.0%60.0%
50.0%50.0%50.0%50.0%
40.0%40.0%40.0%40.0%
30.0%30.0%30.0%30.0%
20.0%20.0%20.0%20.0%
10.0%10.0%10.0%10.0%
0.0%0.0%0.0%0.0%
Pe
rce
nt
Pe
rce
nt
Pe
rce
nt
Pe
rce
nt
11%11%11%11%
17%17%17%17%
53%53%53%53%
13%13%13%13%
6%6%6%6%
Figure 4.4: Contribution by age of business in KZN
Figure 4.4 shows that most of the respondents (53%) have been in KZN for more than
three years but less than five years; 17% of respondents have been in KZN for 6 years
but less than 10 years; 13% of respondents have been in KZN for a year but less than
2 years; 11% of respondents have been in KZN for more than 11 years; and finally
only 6% of respondents have been in KZN for less than a year.

Macro-environmental factors analyzing Chapter 4
57
4.2.4. The number of employees
Table 4.1::::The number of employees
Frequency Percent
Valid
Percent
Cumulative
Percent
Valid 1-5 3 6 6 6
5-20 29 62 62 68
20-200 11 23 23 91
More than 200 4 9 9 100.0
Total 47 100.0 100.0
Of the 47 people who responded, most (62%) had five but less than twenty employees;
23% of respondents had twenty but less than two hundreds employees; 9% of
respondents had more than two hundreds; and only 6% of respondents had one but
less than five employees.
4.2.5. Contribution by industry of Chinese enterprises in KZN
4%4%4%4%4%4%4%4%
23%23%23%23%
17%17%17%17%
11%11%11%11%
28%28%28%28%
13%13%13%13%
otherotherotherother
advanced-technologyadvanced-technologyadvanced-technologyadvanced-technologysectorsectorsectorsector
manufactur ing firmsmanufactur ing firmsmanufactur ing firmsmanufactur ing firms
r etailr etailr etailr etail
expor t and impor texpor t and impor texpor t and impor texpor t and impor t
textile industr ytextile industr ytextile industr ytextile industr y
r estaur antr estaur antr estaur antr estaur antIndustr yIndustr yIndustr yIndustr y
Figure 4.5: Contribution by industry of Chinese enterprises in KZN

Macro-environmental factors analyzing Chapter 4
58
Of the 47 people who responded, 13% of respondents were from the restaurant
industry; 28% from the textile industry; 11% are part of the export and import trade
industry; 17% of respondents were from the retail sector; 23% of respondents own
manufacturing firms; 4% of respondents were from the advanced-technology sector;
and 4% of respondents represent other industries.
4.2.6. Contribution by locations of Chinese enterprises in KZN
OtherOtherOtherOtherPor tPor tPor tPor tShepstoneShepstoneShepstoneShepstone
MandiniiMandiniiMandiniiMandiniiNewcastleNewcastleNewcastleNewcastleRichar dsRichar dsRichar dsRichar dsBayBayBayBay
Pieter mar izPieter mar izPieter mar izPieter mar iztburgtburgtburgtburg
Dur banDur banDur banDur ban
Lo c a tio nLo c a tio nLo c a tio nLo c a tio n
30.0%30.0%30.0%30.0%
20.0%20.0%20.0%20.0%
10.0%10.0%10.0%10.0%
0.0%0.0%0.0%0.0%
Per
cent
Per
cent
Per
cent
Per
cent
13%13%13%13%
4%4%4%4%
11%11%11%11%
19%19%19%19%
6%6%6%6%
15%15%15%15%
32%32%32%32%
Figure 4.6: Contribution by locations of Chinese enterprises in KZN
Figure 4.6 shows that 32% of respondents were from Durban, 19% from Newcastle;
15% of respondents were from Pietermaritzburg; 11% were from Mandini Industrial
Park; 6% were from Richards Bay; and only 4% of respondents were from Port
Shepstone. In addition, 13% of respondents were from other towns in KZN.

Macro-environmental factors analyzing Chapter 4
59
4.2.7. Business conditions in the past year
Table 4.2: Business conditions in the past year
Frequency Percent
Valid
Percent
Cumulativ
e Percent
Valid Not very successful 2 4 4 4
Not successful 5 11 11 15
Neutral 23 49 49 64
Successful 13 28 28 92
Very successful 4 8 8 100.0
Total 47 100.0 100.0
Table 4.2 shows that 49% of respondents were neither successful nor unsuccessful in
the past year; 28% of respondents were successful in the past year and 8% of
respondents were very successful; then 11% of respondents were not successful in the
past year; and only 4% of respondents were not very successful in the past year.
4.2.8. Macro environment in the following year
Table 4.3: Macro-environment in the following year
Frequency Percent
Valid
Percent
Cumulative
Percent
Valid not very
bright 19 40 40 40
not bright 13 28 28 68
neutral 10 21 21 89
bright 4 9 9 98
very bright 1 2 2 100.0
Total 47 100.0 100.0
Of the 47 people who responded, 40% of respondents thought the macro environment
would be not be very bright in KZN in the following year; 28% thought it would be
not bright in KZN in the following year; 21% of respondents thought the macro

Macro-environmental factors analyzing Chapter 4
60
environment would neither be bright nor not bright in the following year; 9% thought
the macro environment would be bright in KZN in the following year; and only 2% of
respondents thought the macro environment would be very bright in KZN in the
following year.
4.3. Reasons for investing in KZN
Section two of the questionnaire aimed to discuss and identify the reasons why so
many Chinese enterprises invested in KZN. This section utilized a five-point Likert
scale. The findings indicate what attracted Chinese enterprises to KZN in the past
decade.
4.3.1. Market size and attractiveness
str ongly agr eestr ongly agr eestr ongly agr eestr ongly agr eeagr eeagr eeagr eeagr eeneutr alneutr alneutr alneutr aldisagr eedisagr eedisagr eedisagr ee
60.0%60.0%60.0%60.0%
50.0%50.0%50.0%50.0%
40.0%40.0%40.0%40.0%
30.0%30.0%30.0%30.0%
20.0%20.0%20.0%20.0%
10.0%10.0%10.0%10.0%
0.0%0.0%0.0%0.0%
Per
cent
Per
cent
Per
cent
Per
cent 32%32%32%32%
53%53%53%53%
11%11%11%11%
4%4%4%4%
Figure 4.7: Market size and attractiveness in KZN

Macro-environmental factors analyzing Chapter 4
61
Figure 4.7 shows that 32% of respondents strongly agreed that market size and
attractiveness were a reason for investing in KZN; 53% of respondents agreed; 11%
of respondents neither agreed nor disagreed; only 4% of respondents disagreed; and
no respondents strongly disagreed. In other words, most of the respondents (85%)
thought that market size and attractiveness were a reason for investing in KZN.
4.3.2. Growing demand
str ongly agr eestr ongly agr eestr ongly agr eestr ongly agr eeagr eeagr eeagr eeagr eeneutr alneutr alneutr alneutr al
70.0%70.0%70.0%70.0%
60.0%60.0%60.0%60.0%
50.0%50.0%50.0%50.0%
40.0%40.0%40.0%40.0%
30.0%30.0%30.0%30.0%
20.0%20.0%20.0%20.0%
10.0%10.0%10.0%10.0%
0.0%0.0%0.0%0.0%
Pe
rce
nt
Pe
rce
nt
Pe
rce
nt
Pe
rce
nt
32%32%32%32%
62%62%62%62%
6%6%6%6%
Figure 4.8: Growing demand in KZN
As Figure 4.8 shows that 32% of respondents strongly agreed that growing demand
was a reason for investing in KZN; 62% agreed; 6% of respondents neither agreed nor
disagreed; and no respondent disagreed or strongly disagreed. Ninety-four percent of

Macro-environmental factors analyzing Chapter 4
62
respondents (94%) thought that growing demand was a reason for investing in KZN.
4.3.3. Labour cost
13%13%13%13%
17%17%17%17%
13%13%13%13%
51%51%51%51%
6%6%6%6%
str ongly agr eestr ongly agr eestr ongly agr eestr ongly agr ee
agr eeagr eeagr eeagr ee
neutr alneutr alneutr alneutr al
disagr eedisagr eedisagr eedisagr ee
str onglystr onglystr onglystr onglydisagr eedisagr eedisagr eedisagr ee
Figure 4.9: Labour costs in KZN
Figure 4.9 shows that 13% of respondents strongly agreed that labour costs was a
reason for investing in KZN; 17% agreed; 13% of respondents neither agreed nor
disagreed; 51% disagreed; and 6% of respondents strongly disagreed. Thus, 57% of
respondents thought that labour costs were a reason for investing in KZN.

Macro-environmental factors analyzing Chapter 4
63
4.3.4. Taxation
15%15%15%15%
49%49%49%49%
36%36%36%36%
neutr alneutr alneutr alneutr al
disagr eedisagr eedisagr eedisagr ee
str onglystr onglystr onglystr onglydisagr eedisagr eedisagr eedisagr ee
Figure 4.10: Taxation in KZN
As Figure 4.10 shows, 36% of respondents strongly disagreed that taxation was a
reason for investing in KZN; 49% disagreed; 15% of respondents neither agreed nor
disagreed. Not a single respondent thought that taxation was a reason for investing in
KZN.

Macro-environmental factors analyzing Chapter 4
64
4.3.5. The openness of the economy
s tro n g ly a g re es tro n g ly a g re es tro n g ly a g re es tro n g ly a g re e
a g re ea g re ea g re ea g re e
n e u tra ln e u tra ln e u tra ln e u tra l
d is a g re ed is a g re ed is a g re ed is a g re e
s tro n g ly d is a g re es tro n g ly d is a g re es tro n g ly d is a g re es tro n g ly d is a g re e
50.0%50.0%50.0%50.0%40.0%40.0%40.0%40.0%30.0%30.0%30.0%30.0%20.0%20.0%20.0%20.0%10.0%10.0%10.0%10.0%0.0%0.0%0.0%0.0%
P e rc e n tP e rc e n tP e rc e n tP e rc e n t
21%21%21%21%
45%45%45%45%
13%13%13%13%
15%15%15%15%
6%6%6%6%
Figure 4.11: The openness of the economy in KZN
Figure 4.11 shows that 21% of respondents strongly agreed that the openness of
economy was a reason for investing in KZN; 45% agreed; 13% of respondents neither
agreed nor disagreed; 15% of respondents disagreed; and 6% of respondents strongly
disagreed. Thus, most respondents (67%) thought that the openness of economy was a
reason for investing in KZN.

Macro-environmental factors analyzing Chapter 4
65
4.3.6. Local political environment
str ongly agr eestr ongly agr eestr ongly agr eestr ongly agr eeagr eeagr eeagr eeagr eeneutr alneutr alneutr alneutr aldisagr eedisagr eedisagr eedisagr eestr ongly disagr eestr ongly disagr eestr ongly disagr eestr ongly disagr ee
40.0%40.0%40.0%40.0%
30.0%30.0%30.0%30.0%
20.0%20.0%20.0%20.0%
10.0%10.0%10.0%10.0%
0.0%0.0%0.0%0.0%
Pe
rce
nt
Pe
rce
nt
Pe
rce
nt
Pe
rce
nt
26%26%26%26%
36%36%36%36%
11%11%11%11%
21%21%21%21%
6%6%6%6%
Figure 4.12: Local political environment in KZN
Figure 4.12 shows that 26% of respondents strongly agreed that the local political
environment was a reason for investing in KZN; 36% agreed; 11% of respondents
neither agreed nor disagreed; 21% disagreed; and 6% of respondents strongly
disagreed. Thus, most of the respondents (62%) thought that the local political
environment was a reason for investing in KZN.

Macro-environmental factors analyzing Chapter 4
66
4.3.7. The level of infrastructure
6%6%6%6%
19%19%19%19%
24%24%24%24%
51%51%51%51%
0.0%
10.0%
20.0%
30.0%
40.0%
50.0%
60.0%
disagree neutral agree strongly agree
Figure 4.13: The level of infrastructure in KZN
Figure 4.13 shows that 24% of respondents strongly agreed that the level of
infrastructure was a reason for investing in KZN; 51% agreed; 19% of respondents
neither agreed nor disagreed; only 6% of respondents disagreed; and no respondents
strongly disagreed. In other words, most of the respondents (75%) thought that the
level of infrastructure was a reason for investing in KZN.
4.4. Macro-environmental factors in KZN
In Section three of the questionnaire, the researcher identified negative
macro-environmental factors for Chinese enterprises development in KZN. This
section of the questionnaire also utilized a five-point Likert scale. The findings of this
section are presented as follows:

Macro-environmental factors analyzing Chapter 4
67
4.4.1. The weak exchange rate
81%81%81%81%
19%19%19%19%
str ongly agr eestr ongly agr eestr ongly agr eestr ongly agr ee
agr eeagr eeagr eeagr ee
Figure 4.14: Effect of the weak exchange rate on the macro-environment
Figure 4.14 show that all of the respondents agreed that the weak exchange rate
negatively influenced the development of Chinese enterprises in KZN.

Macro-environmental factors analyzing Chapter 4
68
4.4.2. The rising crime rate
68%68%68%68%
30%30%30%30%
2%2%2%2%str ongly agr eestr ongly agr eestr ongly agr eestr ongly agr ee
agr eeagr eeagr eeagr ee
neutr alneutr alneutr alneutr al
Figure 4.15: Effect of rising crime rate on the macro-environment
Figure 4.15, 68% of respondents strongly agreed that the rising crime rate negatively
influenced the development of Chinese enterprises in KZN; 30% agreed; and only 2%
of respondents neither agreed nor disagreed. In other words, the finding shows almost
all of the respondents (98%) agreed that the rising crime rate negatively influenced
the development of Chinese enterprises in KZN.

Macro-environmental factors analyzing Chapter 4
69
4.4.3. Higher inflation rate
14%14%14%14%
26%26%26%26%
60%60%60%60%
0.0% 10.0% 20.0% 30.0% 40.0% 50.0% 60.0% 70.0%
neutral
agree
strongly agree
Figure 4.16: Effect of the higher inflation rate on the macro-environment
Figure 4.16, 60% of respondents strongly agreed that higher inflation rate negatively
influenced the development of Chinese enterprises in KZN; 26% agreed; and 14% of
respondents neither agreed nor disagreed. In other words, the finding shows most of
the respondents (86%) agreed that the higher inflation rate negatively influenced the
development of Chinese enterprises in KZN.

Macro-environmental factors analyzing Chapter 4
70
4.4.4. Union activity
str ongly agr eestr ongly agr eestr ongly agr eestr ongly agr ee
agr eeagr eeagr eeagr ee
neutr alneutr alneutr alneutr al
100.0%100.0%100.0%100.0%80.0%80.0%80.0%80.0%60.0%60.0%60.0%60.0%40.0%40.0%40.0%40.0%20.0%20.0%20.0%20.0%0.0%0.0%0.0%0.0%
P e rc e n tP e rc e n tP e rc e n tP e rc e n t
85%85%85%85%
11%11%11%11%
4%4%4%4%
Figure 4.17: Effect of union activity on the macro-environment
Figure 4.17, 85% of respondents strongly agreed that union activity negatively
influenced the development of Chinese enterprises in KZN; 11% of respondents
agreed; and only 14% of respondents neither agreed nor disagreed. In other words, the
finding shows almost all of the respondents (96%) agreed that the union activity
negatively influenced the development of Chinese enterprises in KZN.

Macro-environmental factors analyzing Chapter 4
71
4.4.5. Taxation
64%64%64%64%
25%25%25%25%
11%11%11%11%
neutralneutralneutralneutral
agreeagreeagreeagree
strongly agreestrongly agreestrongly agreestrongly agree
Figure 4.18: Effect of taxation on the macro-environment
Figure 4.18, 64% of respondents strongly agreed that taxation negatively influenced
the development of Chinese enterprises in KZN; 25% agreed; and 11% of respondents
neither agreed nor disagreed. In other words, the finding shows almost ninety per cent
of respondents (89%) agreed that taxation negatively influenced the development of
Chinese enterprises in KZN.

Macro-environmental factors analyzing Chapter 4
72
4.4.6. The level of infrastructure
23%23%23%23%
38%38%38%38%
30%30%30%30%
7%7%7%7%
2%2%2%2%
0.0%
10.0%
20.0%
30.0%
40.0%
stronglystronglystronglystrongly
disagreedisagreedisagreedisagree
disagreedisagreedisagreedisagree neutralneutralneutralneutral agreeagreeagreeagree stronglystronglystronglystrongly
agreeagreeagreeagree
Figure 4.19: Effect of the level of infrastructure on the macro-environment
Figure 4.19, 23% of respondents strongly agreed that the level of infrastructure
negatively influenced the development of Chinese enterprises in KZN; 38% agreed;
30% of respondents neither agreed nor disagreed; 7% disagreed; and only 2% of
respondents strongly disagreed. Therefore, more than sixty per cent of respondents
(62%) agreed that the level of infrastructure negatively influenced the development of
Chinese enterprises in KZN.

Macro-environmental factors analyzing Chapter 4
73
4.4.7. Competitive environment
26%26%26%26%
51%51%51%51%
11%11%11%11%8%8%8%8%
4%4%4%4%
0.0%
10.0%
20.0%
30.0%
40.0%
50.0%
60.0%
strongly
disagree
disagree neutral agree strongly agree
Figure 4.20: Effect of competitive environment on the macro-environment
Figure 4.20, 26% of respondents strongly agreed that the competitive environment
negatively influenced the development of Chinese enterprises in KZN; 51% agreed;
11% of respondents neither agreed nor disagreed; 8% disagreed; and only 4% of
respondents strongly disagreed. Therefore, almost eighty per cent of respondents
(77%) agreed that the competitive environment negatively influenced the
development of Chinese enterprises in KZN.

Macro-environmental factors analyzing Chapter 4
74
4.5. Aspects influenced by macro-environmental factors
The purpose of this section is to examine the aspects of each macro-environmental
factor that influences the management and development of Chinese businesses in
KZN. The findings will be shown in the following tables.
4.5.1. Increase in the cost of materials imported from China
Section four: Statement 1: The weak exchange rate between the Rand and Dollar
could increase the cost of materials imported from China.
Table 4.4::::The weak exchange rate influence
Frequency Percent
Valid
Percent
Cumulative
Percent
Valid
strongly disagree 1 2 2 2
disagree 3 6 6 8
Neutral 6 13 13 21
Agree 16 34 34 55
strongly agree 21 45 45 100.0
Total 47 100.0 100.0
Table 4.4 shows that 45% of respondents strongly agreed with statement 1; 34% of
respondents agreed; 13% of respondents neither agreed nor disagreed with statement
1; 6% disagreed; and finally 2% of respondents strongly disagreed with statement 1.
Almost eighty per cent of respondents (79%) agreed with statement 1.

Macro-environmental factors analyzing Chapter 4
75
4.5.2. Down turn in business development in KZN
Section four: Statement 2: The rising crime rate in KwaZulu-Natal could slow down
business development in KZN.
Table 4.5: The rising crime rate influence
Frequency Percent Valid Percent
Cumulative
Percent
Valid strongly disagree 3 6 6 6
disagree 5 11 11 17
neutral 5 11 11 28
Agree 11 23 23 51
strongly agree 23 49 49 100.0
Total 47 100.0 100.0
Table 4.5 shows that 49% of respondents strongly agreed with statement 2, 23%
agreed; 11% of respondents neither agreed nor disagreed with statement 2; 11%
disagreed; and finally 6% of respondents strongly disagreed with statement 2. 71% of
respondents agreed with statement 2.
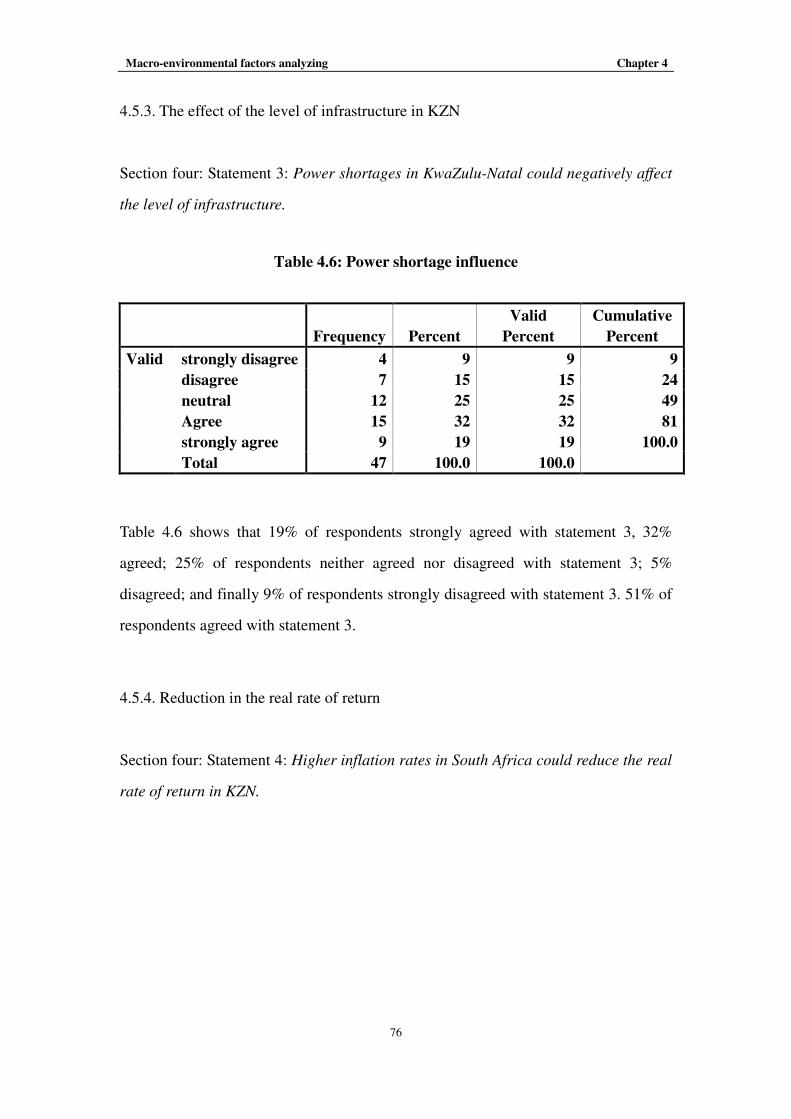
Macro-environmental factors analyzing Chapter 4
76
4.5.3. The effect of the level of infrastructure in KZN
Section four: Statement 3: Power shortages in KwaZulu-Natal could negatively affect
the level of infrastructure.
Table 4.6: Power shortage influence
Frequency Percent
Valid
Percent
Cumulative
Percent
Valid strongly disagree 4 9 9 9
disagree 7 15 15 24
neutral 12 25 25 49
Agree 15 32 32 81
strongly agree 9 19 19 100.0
Total 47 100.0 100.0
Table 4.6 shows that 19% of respondents strongly agreed with statement 3, 32%
agreed; 25% of respondents neither agreed nor disagreed with statement 3; 5%
disagreed; and finally 9% of respondents strongly disagreed with statement 3. 51% of
respondents agreed with statement 3.
4.5.4. Reduction in the real rate of return
Section four: Statement 4: Higher inflation rates in South Africa could reduce the real
rate of return in KZN.

Macro-environmental factors analyzing Chapter 4
77
Table 4.7: Higher inflation influence
Frequency Percent
Valid
Percent
Cumulative
Percent
Valid disagree 3 6 6 6
neutral 3 6 6 12
Agree 16 34 34 46
strongly agree 25 54 54 100.0
Total 47 100.0 100.0
Table 4.7 shows that 54% of respondents strongly agreed with statement 4, 34%
agreed; 6% of respondents neither agreed nor disagreed with statement 4; and finally
6% of respondents disagreed with statement 4. Almost ninety per cent of respondents
(88%) agreed with statement 4.
4.5.5. Hindrances to entrepreneurial activity in KZN
Section four: Statement 5: Union activity in KwaZulu-Natal could hinder
entrepreneurial activity.
Table 4.8: Union activity influence
Frequency Percent
Valid
Percent
Cumulative
Percent
Valid strongly disagree 2 4 4 4
disagree 6 13 13 17
neutral 4 9 9 26
Agree 10 21 21 47
strongly agree 25 53 53 100.0
Total 47 100.0 100.0
Table 4.8 shows that 53% of respondents strongly agreed with statement 5, 21%
agreed; 9% of respondents neither agreed nor disagreed with statement 5; 13%

Macro-environmental factors analyzing Chapter 4
78
disagreed; and only 4% of respondents disagreed with statement 5. Almost 74% of
respondents agreed with statement 5.
4.5.6. Reductions to business profits in KZN
Section four: Statement 6: Taxation could reduce the business profits.
Table 4.9: Taxation influence
Frequency Percent
Valid
Percent
Cumulative
Percent
Valid strongly disagree 4 9 9 9
disagree 7 15 15 24
neutral 9 19 19 43
Agree 16 34 34 77
strongly agree 11 23 23 100.0
Total 47 100.0 100.0
Table 4.9 shows that 23% of respondents strongly agreed with statement 6, 34%
agreed; 19% of respondents neither agreed nor disagreed with statement 6; 15%
disagreed; and finally 9% of respondents strongly disagreed with statement 6. 57% of
respondents agreed with statement 6.
4.5.7. Return on investment in KZN
Section four: Statement 7: The competitive environment in KwaZulu-Natal could
affect return rates on investment.

Macro-environmental factors analyzing Chapter 4
79
Table 4.10: The competitive environment influence
Frequency Percent
Valid
Percent
Cumulative
Percent
Valid strongly disagree 3 6 6 6
disagree 2 4 4 10
neutral 7 15 15 25
Agree 14 30 30 55
strongly agree 21 45 45 100.0
Total 47 100.0 100.0
Table 4.10 shows that 45% of respondents strongly agreed with statement 7, 30%
agreed, 15% of respondents neither agreed nor disagreed with statement 7, 4%
disagreed, and finally 6% of respondents strongly disagreed with statement 7. 75% of
respondents agreed with statement 7.
4.6. Conclusion
This chapter analyzed the raw data obtained from administration of the questionnaire.
The results were calculated using SPSS, which the researcher observed and
interpreted. The implications of these results will be discussed in more detail in the
next chapter.

Macro-environmental factors analyzing Chapter 5
80
CHAPTER FIVE
RECOMMENDATIONS
5.1. Introduction
The results of the data analysis were outlined in the previous chapter. Based on the
findings, the researcher focuses on recommendations in this chapter.
5.2. Recommendations
The results of the data analysis in chapter four have revealed that: the
macro-environment in KZN has been a bottleneck for the development of Chinese
enterprises. Recommendations are provided below that suggest areas for possible
improvement. The recommendations are based on the results of the survey and
represent an attempt to propose effective methods to negate harmful
macro-environment influences.
5.2.1. For Chinese enterprises
Today’s companies are evolving in turbulent and equivocal environments. Although
an entrepreneur can do almost nothing to influence the macro-environment, the
entrepreneur can reduce the loss of earnings by identifying what macro-environmental
factors could constrain the development of their enterprise in KZN. Chinese
enterprises in KZN can use environmental scanning to monitor important events in

Macro-environmental factors analyzing Chapter 5
81
their surrounding environment. Environmental scanning is a way to answer the
question, "What's happening in my environment that will affect my future?"
Choo (2001) notes that environmental scanning is the acquisition and use of
information from events, trends, and relationships in an organization’s external
environment, the knowledge of which would assist management in planning the
organization’s future course of action. In other words, organizations scan the
environment in order to understand the external forces of change so that they may
develop effective responses which secure or improve their position in the future.
According to Dess, Gregory, Lumpkin and Taylor (2005), successful environmental
scanning alerts the organization to critical trends and events before the changes have
developed a discernible pattern and before competitors recognize them.
Environmental scanning can help Chinese enterprises minimize possible risk in the
future and gain competitive advantages in the current market. Slaughter (2003) points
out that environmental scanning is the communication of external information about
facts that could influence an organization in its strategic decision-making process, that
is, it is a method of analyzing relevant gathered information and using it to determine
strategic and premeditated action in the business environment. Environmental
scanning focuses on the detection of emerging issues, circumstances, and potential
issues that could determine an organization’s future. It is also used to evaluate an
organization’s strengths and weaknesses in response to external threats and
opportunities. In essence, environmental scanning is a process to identify, collect, and
transmit information about external factors that can be converted into plans and
decisions. Environmental scanning assesses the internal strengths and weaknesses of
an organization in relation to the external opportunities and threats it faces.
By using environmental scanning, Chinese enterprises in KZN could recognize
external factors that could affect their position in the market. This could help them in
KZN to formulate successful responses to protect or improve their position in the

Macro-environmental factors analyzing Chapter 5
82
future. In addition, environmental scanning can help Chinese enterprises be wary of
any surprises, spot pressure and opportunities, increase competitive advantage, and
also improve long-term and immediate planning.
5.2.2. For the province Government
Although the macro-environment still poses a big challenge for the provincial
government, the good news is that the local government is starting to recognize the
value of improving the macro environment. This is well-articulated in the Report of
the Commission for Africa (2005), where it is noted that African governments need to
play an active role in creating business environments to unlock local opportunities.
The past two years have been marked by an increasing appetite for improvement in
the investment climate on the part of governments across African continent.
According to findings in Chapter Four, it is evident that taxation is not a reason for
Chinese enterprise investment to be attracted to KZN. The government also needs to
improve the level of infrastructure, control labour costs, enhance the level of the
openness of the economy, and create a stable political environment. The market size
and growing demand are attractive factors; the government still needs to be aware of
these issues in the coming years.
The researcher observed in Chapter Four that all seven macro-environmental factors
that were tested in the study negatively influenced the development of Chinese
enterprises in KZN. Provincial government must pay more attention to creating a
better macro environment for investors. Many economists believe that improving the
macro-environment for domestic and foreign enterprises will help drive demand for
investment and boost investor confidence in the business environments.
KwaZulu-Natal’s economy will thrive through the implementation of strategies aimed

Macro-environmental factors analyzing Chapter 5
83
at strengthening the macro-environment for domestic and foreign enterprises.
Based on the above-analysis, recommendations are listed for provincial governments
below:
• The government should make KZN a fantastic place to do business, that is,
they must improve KwaZulu-Natal’s (KZN) attractiveness for investors.
• They should deliver tangible and self-sustaining reform and focus on the
fundamentals critical of a healthy investment climate. For example, they must
put more resources into reducing the crime rate and future improving the level
of infrastructure.
• They should pay more attention to create an excellent macro-environment for
entrepreneurs, not only for Chinese enterprises but also for domestic
entrepreneurs.
• They should formulate more friendly policies and laws to create an excellent
external business environment for foreign investment wherever they come
from.
5.3. Areas for Further Research
This study focused on macro-environmental factors influencing the development of
Chinese enterprises in KZN; therefore it did not concentrate on the development of
Chinese enterprises in South Africa as a whole or the Southern African Development
Community (SADC).

Macro-environmental factors analyzing Chapter 5
84
Suggested area for further research is as follows:
• The determination of succession and failure of Chinese business in the past
decade in KZN.

85
References
Africa Growth Institute. South African SMME Business Confidence Index Report:
First Quarter 2008.
Altman, M. (2002). KwaZulu-Natal Economic Review. Human Science Research
Council.
Arpan, J. and Ricks, D.A. (1995). Directory of Foreign Manufacturers in the United
States. Atlanta: School of Business Administration, Georgia State University.
B A C (2006) “Business against crime”: Executive Brief. www.bac.bac.co.za.
Bagchi-Sen, S. and Wheeler, J.D. (1989). A Spatial and Temporal Model of Foreign
Investment in the US.
Benjamin, C. (2008). South Africa: Crime crippling small business, Business Day, 17
July.
Campbell, D. and Craig, T. (2005). Organizations and the business environment.
Second Edition.
Cebekhulu, E.M. (2001). Challenges facing South African Trend: Unions in the new
Millennium.
Chandprapalert, A. (2000). The determinants of United States direct investment in
Thailand: A survey on managerial perspective. Unpublished doctoral dissertation,
University of Sarasota, Florida.
Cheng, L.K. and Kwan, Y.K. (2000). What are the determinants of the location of

86
foreign direct investment? The Chinese experience. Journal of International
Economics, 51.
Choo, C.W. (2001). Information Management for the Intelligent Organization: The
Art of Scanning the Environment. Third Edition.
CliffsNotes.com. How to Cite "The External Environment". The External
Environment.26Sep2009.http://www.cliffsnotes.com/WileyCDA/CliffsReviewTopic/t
opicArticleId-8944,articleId-8859.html.
Cohen-Rosenthal, Edward and Burton, C. (1993). Mutual Gains: A Guide to
Union-Management Cooperation. Second Edition.
Contractor, F.J. Kundu, S. and Chun Hsu, C. (2003). A three stage theory of
international expansion: The link between multinationality and performance in the
service sector. Journal of International Business Studies, 34(1).
Cooper, D.R. and Schindler, P.S. (2008). Business Research Methods. Tenth Edition.
Cosma, H. and Enoughj, S. (2008). A snap shot of the KwaZulu- Natal economic
growth and unemployment trends (2000-2007).
Dess, D. Gregory, G.T. Lumpkin and Taylor, M.L. (2005). Strategic Management.
Second Edition. New York: McGraw-Hill Irwin.
Dunning, J.H. (1977). The Multinational enterprise. London; Allen and Unwin.
Dunning, J.H. (1980). Towards an eclectic theory of international production: some
empirical tests. Journal of International Business Studies.

87
Dunning, J.H. (1981).Multinational production and the multinational enterprise.
London; Allen and Unwin.
Erdal, F. and Tatoglu, E. (2001). Locational determinants of foreign direct investment
in an emerging market economy: Evidence from Turkey. Multinational Business
Review, 10(1).
Finnemore and Merwe, V.D.(1989). Introduction of labour law in South Africa.
Freeman, R. and Medoff, J. (1984). What do unions do? New York: Basic Books.
Frost, A.J. and Hager, D.P. (1986). A general introduction to: Institutional investment.
First Edition.
Fry, F.L. Stoner, C.R. and Hattwick, R.E. (2001). Business: An integrative approach,
McGraw-Hill: Boston.
Galan, J.I. and Benito, J.G. (2001). Determinant factors of foreign direct investment:
some empirical evidence. European Business Review, 13(5).
Ghatak, S. Healey, N.M. and Jackson, P. (1995). The macroeconomic environment.
Griffin, R.W. and Pustay, M.W. (1999). International business: A managerial
perspective, Massachusetts: Addison Wesley. Second Edition.
Hamadziripi, C. (2008). An analysis of drivers of inflation in KwaZulu- Natal.
Hellerstein, D. (1997). The Impact of Inflation.
Hennart, J.F. (1982). A theory of multinational enterprise, Ann Arbor: University of
Michigan Press.

88
Henry, G.T. (1990). Practical Sampling.
Hymer, S.H. (1976). The International Operations of National Firms: A Study of
Direct Foreign investment. Cambridge, Massachusetts: MIT Press.
IMF World Economic Outlook, July 2009.
Johan, H. Ernst, N. and Neels, B. (2006). Global Business: Environments and
Strategies.
Johnson, G. Scholes, K. and Whittington. (2006). Exploring Corporate Strategy: Text
and Case.
Kerr, I.A. and Peter, V.M. (2001). The determinants of FDI in China. Paper presented
at the 30th
Annual Conference of Economists, University of Western Perth, Australia.
Kindleberger, C.P. (1969).American business abroad. New Haven: Yale University
Press.
Knickerbocker, F.T. (1973).Oligopolistic reaction and multinational enterprise,
Boston, MA: Harvard University.
Kravis, I.B. and Lipsey, R.E. (1989). The location of overseas production and
production for exports by US multinational firms. Journal of International Economics,
25.
Lee, J. (2005). Cross-country evidence on the effectiveness of foreign investment
policies. International Trade Journal, Vol.19, No.4, P368.
Ling, L. (2003). Liberalization of trade with china in relation to the textile and

89
clothing industry in South Africa.
Macdermott, D. (2008).Linking exchange rates to foreign direct investment,
International Trade Journal, Vol.22, No.1, P78.
Mandell, S.L. and Killian, C.D.(1974). An Analysis of Foreign Investment in Selected
Areas of the United States, A Research paper on Behalf of the New England Regional.
Mahadea, D. and Pillay, M.(2008). Environmental conditions for SMME development
in a South Africa province, South Africa Journal of Economic and Management
Sciences, Vol. 11, No 4.
Mark, S. Philip, L. and Adrianj, T. (2007). Research Methods for Business Students.
Fourth edition.
Mauro, P. (1995). Corruption and growth, Quarterly Journal of Economics, Vol. 110,
No.3, P681-712.
Mbekeani, K.K. (1999). Foreign direct investment and economic growth. Retrieved
January 15, 2004.
Mboweni, T.T. (2007). The commodity price boom and the South African economy,
Governor of the South African Reserve Bank, at the Regional Business Achievers
Awards Dinner of the Businesswomen’s Association, Pretoria, 27 June 2007.
McConnell, J.E. (1980).Foreign Direct Investment in the US, Annals of the Institute
of American Geography, pp259-270.
Mohr, P. (2008). Economics for South African Students. Fourth Edition.
Moor, G. (2004). Foreign Exchange Risk Management Strategies: The South African

90
Sugar Association.
Natal Witness. (2008). “KZN home invasion shock”, 1 July.
Official Yearbook. (2007-2008). Local Government in South Africa.
Palmi, R. (2007). A survey of South African clothing companies in Kwazulu-Natal in
2007.
Porter, M. (1985). Competitive advantage, Free Press: New York.
Reilly and Brown. (2006). Investment analysis and portfolio management. Eighth
Edition.
Robson, C. (2002).Real World Research. Oxford, Blackwell. Second edition.
Rodrik. D. (2008).Understanding South Africa’s economic puzzles,John F. Kennedy
School of Government, Harvard University, Cambridge, MA, USA. Economics of
Transition, Volume 16(4).
Root, F.R. and Ahmed, A.A. (1978).The influence of policy instruments on
manufacturing direct foreign investment in developing countries. Journal of
International.
Sandhu, M.S. and Fredericks, L.J. (2005). Factors influencing foreign direct
investment in the Malaysian services sector: a theoretical framework, unitary
e-journal vol. 1. No. 1 June 2005.
Sekaran, U. (2003). Research Methods for business: A skill building approach. Fourth
edition.

91
Singh, S. (2006). Experience of South African Firms Trading in Africa.
Slaughter, R.A. (2003). Reframing Environmental Scanning. Australian Foresight
Institute Monograph Series.
Slichter, S.H. Healy, J.J. and Livernash, E.R.(1960).The impact of collective
bargaining on management. Washington: Brookings Institution.
South Africa at a Glance.2009-10.
Sutherland, M.L. (2006). Conflict Management: A union’s approach at the Durban
University of Technology (DUT).
Theunissen, G. (2006). SMME compliance cost, Finance Week (19/10/06).
Vedder, R. and Gallaway, L.(2002). The Economic Effects of Labor Unions Revisited.
Journal of Labor Research, 23, 1, p105-130.
Velia, M. and Valodia, I. (2003). Key features of the post-1994 pattern of trade of the
KwaZulu-Natal province with the rest of the world: emerging trends and issues,
Verma, A. (2005).What Do Unions Do to the Workplace? Union Impact on
Management and HRM Policies. The Journal of Labor Research, University of
Toronto.
Vernon, R. (1966). International investment and international trade in the product
cycle. Quarterly Journal of Economics, p190-207.
Wan, X.H. (2007).The current condition of Chinese in South Africa, Oversees
Chinese journal of Bagui.

92
Wilhelms, S.K.S. (1998). Foreign direct investment and its determinants in emerging
economies. African Economic Policy.
World Bank (2004) “South African investment climate survey”, Investment climate
survey, www.worldbank.org.
World Bank (2006) World Bank Indicators, Washington D.C.
World Bank, “Africa economic outlook”, 2007.
Zhang, X. and Po Yuk, H. (1998). Determinants of Hong Kong manufacturing
investment in China: A survey of Marketing Intelligence and Planning, 16(4),
p260-267.

93
Internet references
http://www.highbeam.com/doc
www.statssa.gov.za
www.info.gov.za
ww.tips.org.za
www.businessmonitor.com
www.KZNtopbusiness.co.za
http://geographicalmedia.com
www.sds.ukzn.ac.za
http://sharondavis.co.za
http://www.southafrica.info
http://allafrica.com
http://www.bos.frb.org/economic/nerr/rr1997
http://www.thetimes.co.za
www.kznctc.org.za
www.kznded.gov.za
http://www.transnet.co.za
http://www.reservebank.co.za
www.fin24.co.za
www.chinadailynews.com.cn
http://tutor2u.net
http://www.global-production.com

1
APPENDIX A: QUESTIONNAIRE
Macro-environmental factors influencing Chinese enterprises
development in KwaZulu-Natal
Prepared by: F CHEN (207502219)
The questionnaire has been prepared for a dissertation required towards the
completion of the Master of commerce in management in the University of
KwaZulu-Natal. The purpose of the questionnaire is to gather information with
regards to macro-environmental factors influencing Chinese enterprises
development in KwaZulu-Natal.
Questionnaire Number (to be filled in by researcher)
Survey Guidelines
� The participant’s responses are kept confidential
� The survey analysis and results will be provided to participants on demand
� The participants are welcome to discuss any issues related to the
questionnaire with the author/researcher
Section one: personal details
1. Please indicate your age (mark with “×”)?
Under 30 31-40 41-50 Over50
2. Please indicate your gender (mark with “×”)?
Female Male

2
3. Please indicate approximately how old is the business in KwaZulu-Natal
(mark with “×”)?
Less than 1 year
From 1 to 2 years
From 3 to 5 years
From 6 to 10 years
More than 10 years
4. Please indicate number of employees in your organization (mark with “×”)?
1-5
5-20
20-200
More than 200
5. Please indicate the sector of your business (mark with “×”)?
6. Please indicate where your factory or workshop is situated in KwaZulu-Natal
(mark with “×”)?
Durban Pietermariztburg
Richards Bay Newcastle
Mandini Port Shepstone
Other
Restaurant
Textile industry
Export and import
Retail
Manufacturing firms
Advanced-technology sector
other

3
7. How would you describe the condition of your business in the last year in
KwaZulu-Natal (mark with “×”)?
Not very Not Neutral Successful Very
Successful Successful Successful
8. In your opinion, what is the future of macro environment for Chinese
enterprises development in KwaZulu-Natal like (mark with “×”)?
Not very Not Neutral Bright Very
Bright Bright Bright
Section two: Reasons for investing in KwaZulu-Natal
The purpose of this part is to discuss what were the major reasons for investing
in KwaZulu-Natal (KZN) in the past decade. This part consists of seven
questions and you are asked to read each question carefully and then mark your
responses in the appropriate box.
In your opinion, was…a reason for investing in KwaZulu-Natal (mark with
“×”)?
Reasons Strongly
disagree
Disagree Neutral Agree Strongly
Agree
9.Market size and attractiveness
10. Growing demand
11. Labor cost
12. Taxation
13. The openness of economy
14. Local political environment
15. The level of infrastructure

4
Section three: macro-environmental factors
The purpose of this part is to identify negative macro-environmental factors for
Chinese enterprises development in KwaZulu-Natal (KZN) at the moment. This
part consists of seven questions and you are asked to read each question carefully
and then mark your responses in the appropriate box.
In your opinion, does…negatively influence the development of Chinese
enterprises in KwaZulu-Natal (mark with “×”)?
Statements Strongly
disagree
Disagree Neutral Agree Strongly
Agree
16. The weak exchange rate
17. Raising crime rate
18. Higher inflation rate
19. Union activity
20. Taxation
21. The level of infrastructure
22. Competitive environment
Section Four: Aspects influencing by macro-environmental factors
The purpose of this part is to examine the aspects of each macro-environmental
factors influencing in the management and development of the business in
KwaZulu-Natal (KZN). This part consists of seven questions and you are asked
to read each question carefully and then mark your responses in the appropriate
box.
23. In your opinion, the weak exchange rate between Rand and Dollar could
increase the cost of materials imported from China (mark with “×”).
Strongly Disagree Neutral Agree Strongly
Disagree agree

5
24. In your opinion, rising crime rate in KwaZulu-Natal could slow down
business development in KwaZulu-Natal (mark with “×”).
Strongly Disagree Neutral Agree Strongly
Disagree agree
25. In your opinion, power shortage in KwaZulu-Natal could negatively affect
the level of infrastructure (mark with “×”).
Strongly Disagree Neutral Agree Strongly
Disagree agree
26. In your opinion, higher inflation rate in South Africa could reduce the real
rate of return in KwaZulu-Natal (mark with “×”).
Strongly Disagree Neutral Agree Strongly
Disagree agree
27. In your opinion, union activity in KwaZulu-Natal could hinder
entrepreneurial activity (mark with “×”).
Strongly Disagree Neutral Agree Strongly
Disagree agree
28. In your opinion, taxation could reduce the business profits (mark with “×”)?
Strongly Disagree Neutral Agree Strongly
Disagree agree

6
29. In your opinion, competitive environment in KwaZulu-Natal could affect
return rates on investment (mark with “×”).
Strongly Disagree Neutral Agree Strongly
Disagree agree
Thank you for your help and your time. Date:
