university of kentucky€¦ · · 2012-02-03university of kentucky is re sponsible for dry ice,...
TRANSCRIPT
University of Kentucky
Strategic Sourcing Business CaseScientific Supplies – Distributors and Select Niche Vendors
January 25th, 2012

Contents
Our Approach Perspectives Business Case Savings Summary Strategy Recommendation Implementation Timeline
© 2011 Huron Consulting Group. All Rights Reserved. Proprietary & Confidential. 2

Our Approach Strategic Sourcing Guiding Principles
3© 2011 Huron Consulting Group. All Rights Reserved. Proprietary & Confidential.
• Total delivered cost reduction focus
• Maintain or enhance quality
• Optimize behavior change
• Fact based negotiations
• Deliver savings within a compressed time frame
• Leverage Huron knowledge and client team expertise
• Strengthen overall supplier relationships
Our ApproachStrategic Sourcing Methodology
4© 2011 Huron Consulting Group. All Rights Reserved. Proprietary & Confidential.
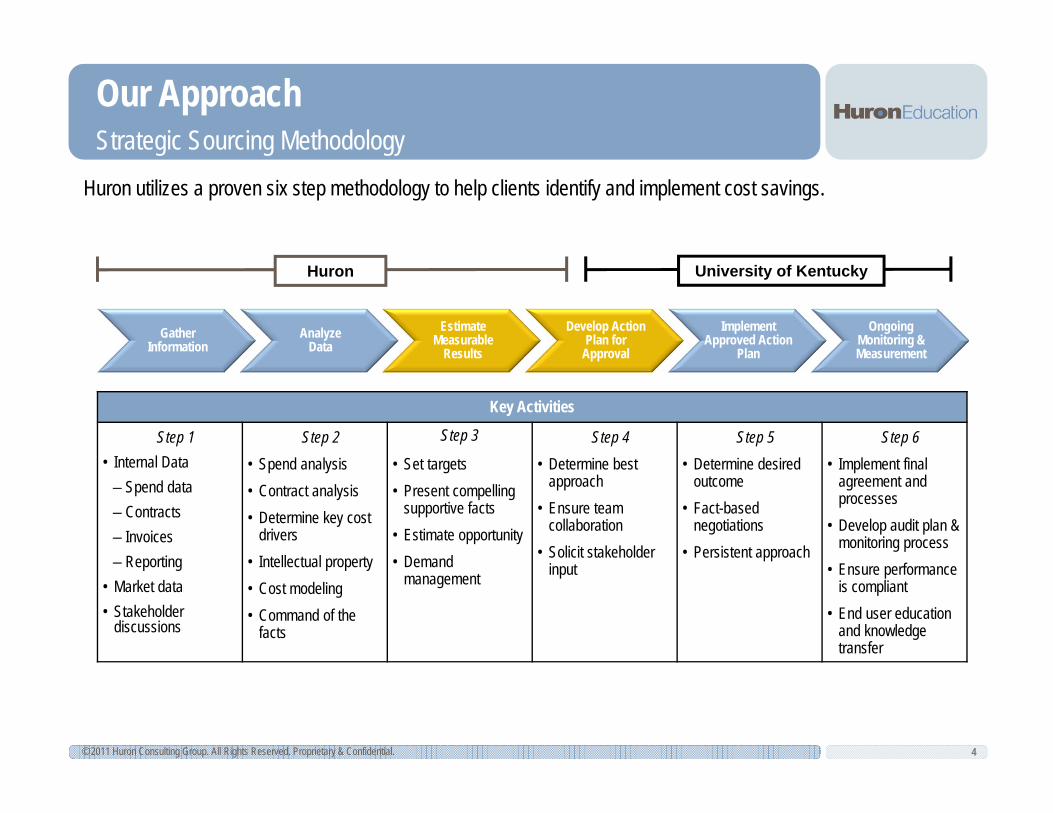
Huron utilizes a proven six step methodology to help clients identify and implement cost savings.
Huron University of Kentucky
Gather Information
Analyze Data
Estimate Measurable
Results
Develop Action Plan for
Approval
Implement Approved Action
Plan
Ongoing Monitoring & Measurement
Key Activities
Step 1 Step 2 Step 3 Step 4 Step 5 Step 6• Internal Data
– Spend data– Contracts– Invoices– Reporting
• Market data• Stakeholder
discussions
• Spend analysis• Contract analysis• Determine key cost
drivers• Intellectual property• Cost modeling• Command of the
facts
• Set targets• Present compelling
supportive facts• Estimate opportunity• Demand
management
• Determine best approach
• Ensure team collaboration
• Solicit stakeholder input
• Determine desiredoutcome
• Fact-based negotiations
• Persistent approach
• Implement final agreement and processes
• Develop audit plan & monitoring process
• Ensure performance is compliant
• End user education and knowledge transfer
5© 2011 Huron Consulting Group. All Rights Reserved. Proprietary & Confidential.
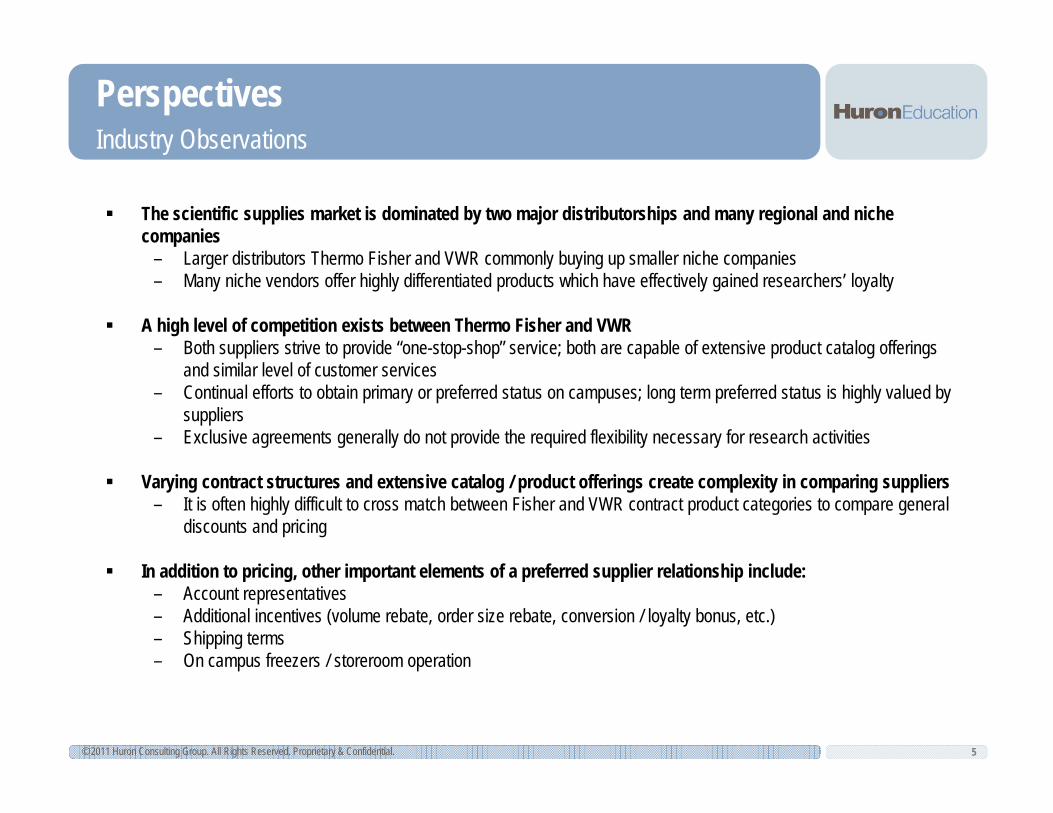
PerspectivesIndustry Observations
The scientific supplies market is dominated by two major distributorships and many regional and niche companies
– Larger distributors Thermo Fisher and VWR commonly buying up smaller niche companies – Many niche vendors offer highly differentiated products which have effectively gained researchers’ loyalty
A high level of competition exists between Thermo Fisher and VWR– Both suppliers strive to provide “one-stop-shop” service; both are capable of extensive product catalog offerings
and similar level of customer services– Continual efforts to obtain primary or preferred status on campuses; long term preferred status is highly valued by
suppliers– Exclusive agreements generally do not provide the required flexibility necessary for research activities
Varying contract structures and extensive catalog / product offerings create complexity in comparing suppliers– It is often highly difficult to cross match between Fisher and VWR contract product categories to compare general
discounts and pricing
In addition to pricing, other important elements of a preferred supplier relationship include:– Account representatives– Additional incentives (volume rebate, order size rebate, conversion / loyalty bonus, etc.)– Shipping terms– On campus freezers / storeroom operation
6© 2011 Huron Consulting Group. All Rights Reserved. Proprietary & Confidential.
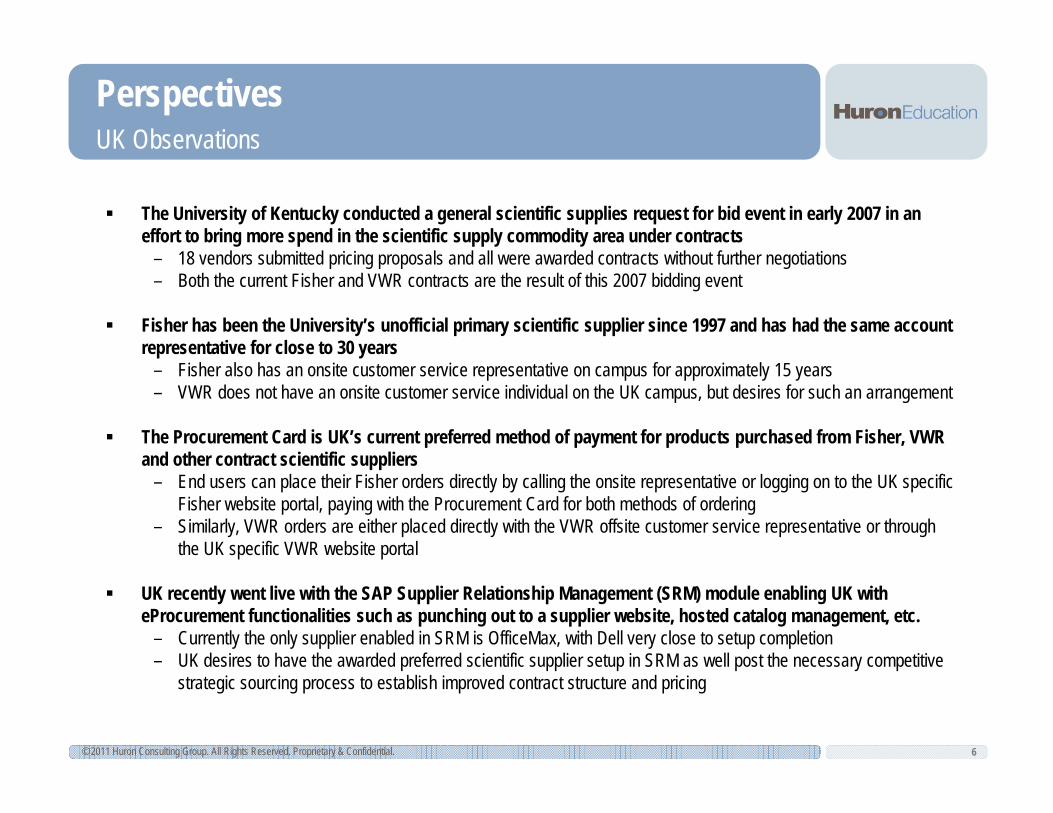
PerspectivesUK Observations
The University of Kentucky conducted a general scientific supplies request for bid event in early 2007 in an effort to bring more spend in the scientific supply commodity area under contracts
– 18 vendors submitted pricing proposals and all were awarded contracts without further negotiations– Both the current Fisher and VWR contracts are the result of this 2007 bidding event
Fisher has been the University’s unofficial primary scientific supplier since 1997 and has had the same account representative for close to 30 years
– Fisher also has an onsite customer service representative on campus for approximately 15 years– VWR does not have an onsite customer service individual on the UK campus, but desires for such an arrangement
The Procurement Card is UK’s current preferred method of payment for products purchased from Fisher, VWR and other contract scientific suppliers
– End users can place their Fisher orders directly by calling the onsite representative or logging on to the UK specific Fisher website portal, paying with the Procurement Card for both methods of ordering
– Similarly, VWR orders are either placed directly with the VWR offsite customer service representative or through the UK specific VWR website portal
UK recently went live with the SAP Supplier Relationship Management (SRM) module enabling UK with eProcurement functionalities such as punching out to a supplier website, hosted catalog management, etc.
– Currently the only supplier enabled in SRM is OfficeMax, with Dell very close to setup completion– UK desires to have the awarded preferred scientific supplier setup in SRM as well post the necessary competitive
strategic sourcing process to establish improved contract structure and pricing

7© 2011 Huron Consulting Group. All Rights Reserved. Proprietary & Confidential.
PerspectivesCommodity Area Spend Overview
Large scientific supply distributors Thermo Fisher and VWR are the primary focus of the Huron strategic sourcing business case development; high level assessments are also conducted for select high spend niche vendors.
Source: UK FY11 AP and P-Card spend for contract scientific suppliers; FY 2011 12 months supplier sample data for select distributors and niche vendors.
Thermo Fisher84%
VWR16%
Spend Distribution Between Thermo Fisher and VWR
Scientific Suppliers Spend Overview
Fiscal Year 2011 AP and P-Card data reveals that the University of Kentucky spent approximately $9.5M with Thermo Fisher and VWR combined
Detailed transactional data was requested from Thermo Fisher and VWR and are utilized as the basis for all subsequent analysis
Combined, Thermo Fisher and VWR account for approximately 55% of scientific supply commodity area spend
Fisher accounts for approximately 84% of total distributors spend while VWR accounts for the other 16%, making Thermo Fisher the clear primary supplier
($'s in 000s)
Supplier NameEst. Annl.
Spend% of Total
Spend Contract Supplier Supplier Sample Data
Major DistributorThermo Fisher $8,605 50% Yes $5,155VWR 885 5% Yes $960
Major Distributor Subtotal $9,490 55% $6,115
High Spend Niche VendorInvitrogen Corp. $1,355 8% Yes $1,740Sigma-Aldrich 985 6% No -Beckman Coulter, Inc. 930 5% Yes 450Applied Biosystems 810 5% Yes 585
Target Niche Vendor Subtotal $4,080 24%
Other Scientific Suppliers (19) $3,500 21% All Contract Vendors
Total $17,070 100%

8© 2011 Huron Consulting Group. All Rights Reserved. Proprietary & Confidential.
PerspectiveFisher and VWR Contract Summary
Terms and Conditions Thermo Fisher VWR
Contract Term 1 year initial term; March 1, 2007 through February 28, 2008
Contract pricing has been extended since the last update in March 1, 2009 until July 31, 2012
1 year initial term; March 1, 2007 through February 28, 2008
Contract pricing has been extended until July 31, 2012
Termination University of Kentucky, Division of Purchasing, reserves the right to terminate all or part of the contract without cause, with a 30 day written notice
University of Kentucky, Division of Purchasing, reserves the right to terminate all or part of the contract without cause, with a 30 day written notice
Pricing Terms General CDC discount schedule Approximately 420 C-Contract pricing for Corning items
through Fisher Other special pricing such as manufacturer pricing for
Falcon products
General discounts by product / vendor category and subcategories
ShippingTerms
Normal freight prepaid and absorbed by Fisher University of Kentucky is responsible for dry ice, fuel
charges, hazardous material, special handling, and third party shipping charges
Normal freight prepaid and absorbed by VWR University of Kentucky is responsible for dry ice, fuel
charges, hazardous material, special handling, and third party shipping charges
Thermo Fisher and VWR are on the same contract cycle, both contracts were established in March 2007 and are currently set to expire at the end of January, 2012.
Thermo Fisher
VWR

9© 2011 Huron Consulting Group. All Rights Reserved. Proprietary & Confidential.
Business CaseSpend by Manufacturer
Analysis of spend by manufacturer indicates that products made by many identical and similar manufacturers are currently purchased from both Fisher and VWR.
($'s in 000s) ($'s in 000s)
ManufacturerEst. Annl.
Spend% of
Spend ManufacturerEst. Annl.
Spend% of
SpendAlso Purchased /
Available through Fisher
THERMO FISHER $2,285 44% VWR INTERNATIONAL $205 21% Fisherbrand Private LabelBD 350 7% EPPENDORF 75 8% Fisher Top 10 Mfr.CORNING 340 7% BD 65 7% Fisher Top 10 Mfr.EPPENDORF 225 4% THERMO FISHER 50 5% Fisher Top 10 Mfr.MILLIPORE 210 4% PROMEGA CORPORATION 40 4% Fisher Top 10 Mfr.PROMEGA CORPORATION 195 4% QUANTA BIOSCIENCES 35 4% NoNALGE NUNC INTERNATIONAL 115 2% GE HEALTHCARE 30 3% Fisher Top 10 Mfr.GE HEALTHCARE 75 1% CORNING 30 3% Fisher Top 10 Mfr.KIMBERLY CLARK 60 1% MILLIPORE 30 3% Fisher Top 10 Mfr.CEPHEID 55 1% OMEGA BIO-TEK 30 3% No
Top 10 Manufacturer Subtotal $3,910 75% Top 10 Manufacturer Subtotal $590 61%
Other (518) $1,245 25% Other Mfrs. (238) $370 39%
Total $5,155 100% Total $960 100%
Thermo Fisher – Top 10 Manufacturers VWR – Top 10 Manufacturers
Thermo Fisher
VWR
Overall, products made by over 130 manufacturers were purchased from both Fisher and VWR during FY 2011; over 75% of spend from VWR could also be purchased from Thermo Fisher
Both Thermo Fisher and VWR carry private label supplies and equipment which are mostly technical equivalentsSource: FY 2011 12 months supplier sample data provided by Fisher and VWR.
10© 2011 Huron Consulting Group. All Rights Reserved. Proprietary & Confidential.
Business CasePurchase Duplications (1 of 2)
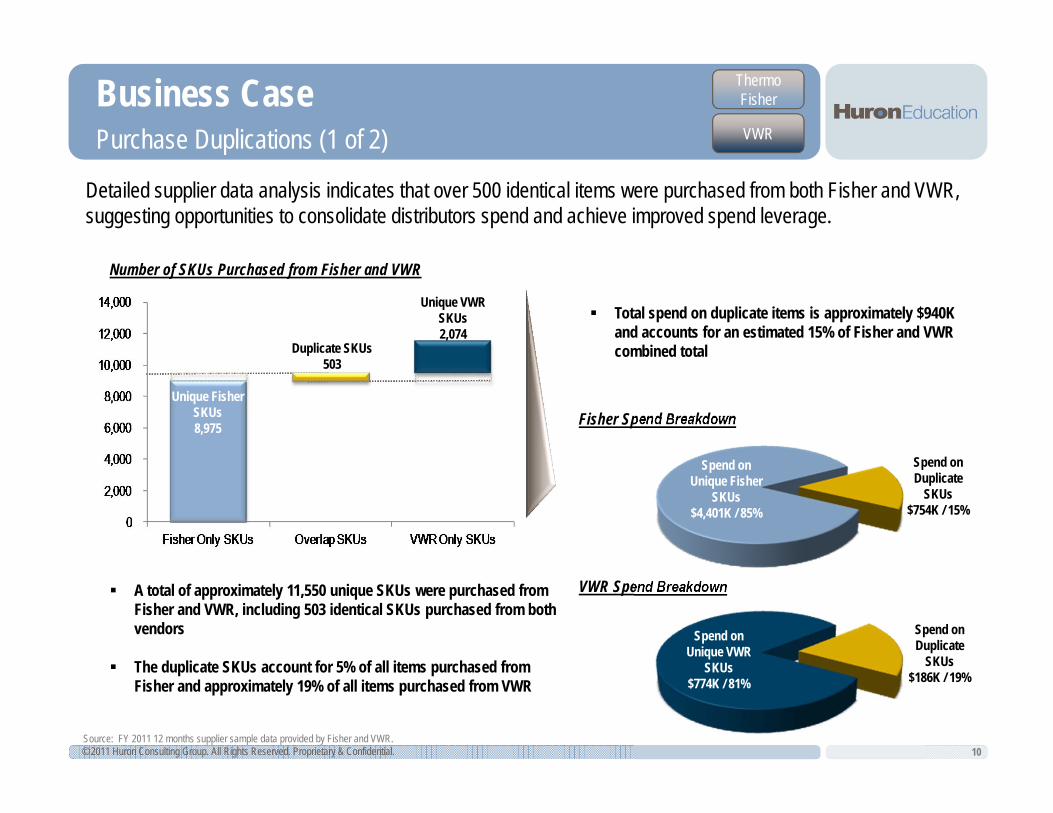
Detailed supplier data analysis indicates that over 500 identical items were purchased from both Fisher and VWR, suggesting opportunities to consolidate distributors spend and achieve improved spend leverage.
Thermo Fisher
VWR
Number of SKUs Purchased from Fisher and VWR
Unique Fisher SKUs8,975
Unique VWR SKUs2,074
Duplicate SKUs503
Fisher Spend Breakdown
VWR Spend Breakdown
Spend on Unique Fisher
SKUs$4,401K / 85%
Spend on Duplicate
SKUs$754K / 15%
Spend on Duplicate
SKUs$186K / 19%
Spend on Unique VWR
SKUs$774K / 81%
A total of approximately 11,550 unique SKUs were purchased from Fisher and VWR, including 503 identical SKUs purchased from both vendors
The duplicate SKUs account for 5% of all items purchased from Fisher and approximately 19% of all items purchased from VWR
Total spend on duplicate items is approximately $940K and accounts for an estimated 15% of Fisher and VWR combined total
Source: FY 2011 12 months supplier sample data provided by Fisher and VWR.
Mfr. # Item Description Total Qty.
Est. Annl. Spend Qty Average
Unit Price Qty Average Unit Price
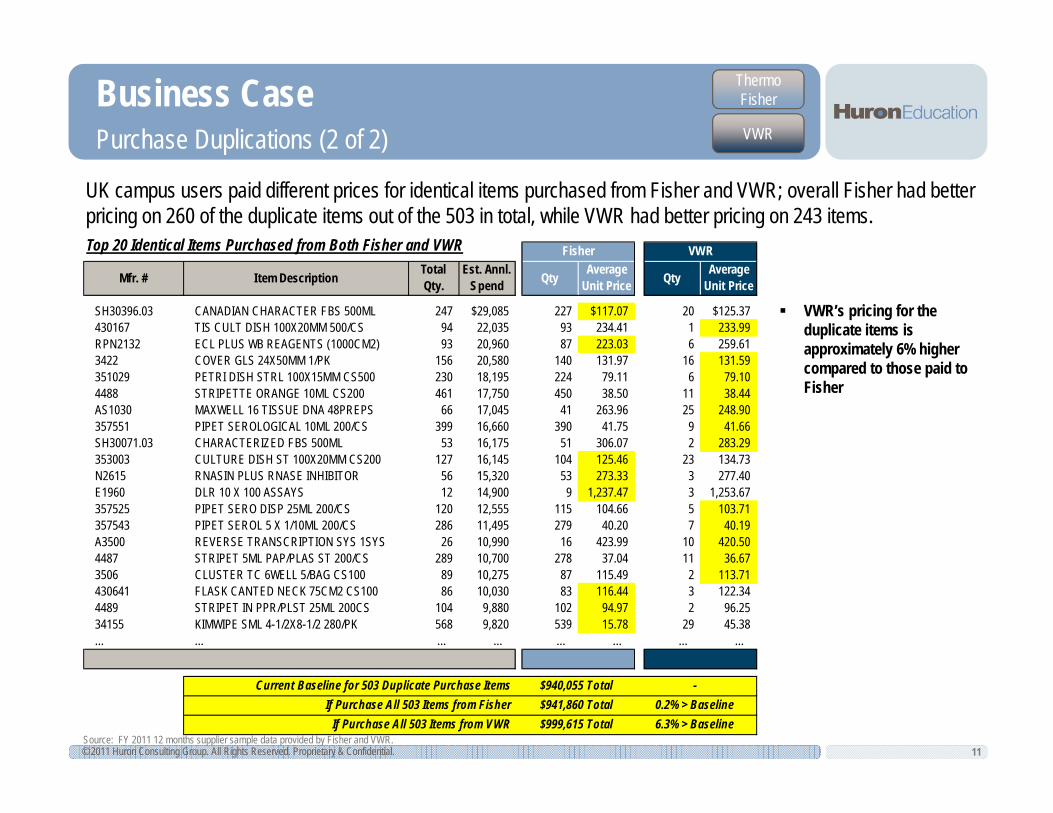
SH30396.03 CANADIAN CHARACTER FBS 500ML 247 $29,085 227 $117.07 20 $125.37430167 TIS CULT DISH 100X20MM 500/CS 94 22,035 93 234.41 1 233.99RPN2132 ECL PLUS WB REAGENTS (1000CM2) 93 20,960 87 223.03 6 259.613422 COVER GLS 24X50MM 1/PK 156 20,580 140 131.97 16 131.59351029 PETRI DISH STRL 100X15MM CS500 230 18,195 224 79.11 6 79.104488 STRIPETTE ORANGE 10ML CS200 461 17,750 450 38.50 11 38.44AS1030 MAXWELL 16 TISSUE DNA 48PREPS 66 17,045 41 263.96 25 248.90357551 PIPET SEROLOGICAL 10ML 200/CS 399 16,660 390 41.75 9 41.66SH30071.03 CHARACTERIZED FBS 500ML 53 16,175 51 306.07 2 283.29353003 CULTURE DISH ST 100X20MM CS200 127 16,145 104 125.46 23 134.73N2615 RNASIN PLUS RNASE INHIBITOR 56 15,320 53 273.33 3 277.40E1960 DLR 10 X 100 ASSAYS 12 14,900 9 1,237.47 3 1,253.67357525 PIPET SERO DISP 25ML 200/CS 120 12,555 115 104.66 5 103.71357543 PIPET SEROL 5 X 1/10ML 200/CS 286 11,495 279 40.20 7 40.19A3500 REVERSE TRANSCRIPTION SYS 1SYS 26 10,990 16 423.99 10 420.504487 STRIPET 5ML PAP/PLAS ST 200/CS 289 10,700 278 37.04 11 36.673506 CLUSTER TC 6WELL 5/BAG CS100 89 10,275 87 115.49 2 113.71430641 FLASK CANTED NECK 75CM2 CS100 86 10,030 83 116.44 3 122.344489 STRIPET IN PPR/PLST 25ML 200CS 104 9,880 102 94.97 2 96.2534155 KIMWIPE SML 4-1/2X8-1/2 280/PK 568 9,820 539 15.78 29 45.38… … … … … … … …
$999,615 Total
Current Baseline for 503 Duplicate Purchase ItemsIf Purchase All 503 Items from Fisher
If Purchase All 503 Items from VWR
-0.2% > Baseline6.3% > Baseline
$941,860 Total
VWRFisher
$940,055 Total
11© 2011 Huron Consulting Group. All Rights Reserved. Proprietary & Confidential.
Business CasePurchase Duplications (2 of 2)
UK campus users paid different prices for identical items purchased from Fisher and VWR; overall Fisher had better pricing on 260 of the duplicate items out of the 503 in total, while VWR had better pricing on 243 items.
Thermo Fisher
VWR
Top 20 Identical Items Purchased from Both Fisher and VWR
Source: FY 2011 12 months supplier sample data provided by Fisher and VWR.
VWR’s pricing for the duplicate items is approximately 6% higher compared to those paid to Fisher
12© 2011 Huron Consulting Group. All Rights Reserved. Proprietary & Confidential.
Business CasePricing Variance
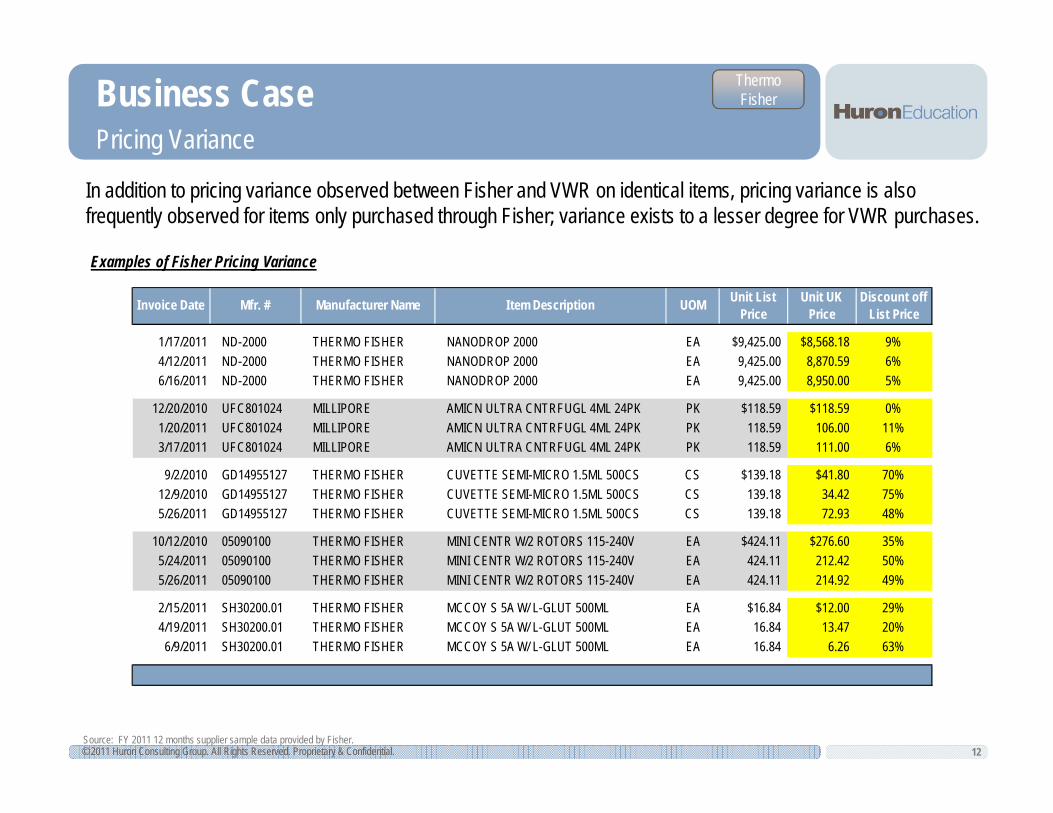
In addition to pricing variance observed between Fisher and VWR on identical items, pricing variance is also frequently observed for items only purchased through Fisher; variance exists to a lesser degree for VWR purchases.
Thermo Fisher
Examples of Fisher Pricing Variance
Source: FY 2011 12 months supplier sample data provided by Fisher.
Invoice Date Mfr. # Manufacturer Name Item Description UOM Unit List Price
Unit UK Price
Discount off List Price
1/17/2011 ND-2000 THERMO FISHER NANODROP 2000 EA $9,425.00 $8,568.18 9%4/12/2011 ND-2000 THERMO FISHER NANODROP 2000 EA 9,425.00 8,870.59 6%6/16/2011 ND-2000 THERMO FISHER NANODROP 2000 EA 9,425.00 8,950.00 5%
12/20/2010 UFC801024 MILLIPORE AMICN ULTRA CNTRFUGL 4ML 24PK PK $118.59 $118.59 0%1/20/2011 UFC801024 MILLIPORE AMICN ULTRA CNTRFUGL 4ML 24PK PK 118.59 106.00 11%3/17/2011 UFC801024 MILLIPORE AMICN ULTRA CNTRFUGL 4ML 24PK PK 118.59 111.00 6%
9/2/2010 GD14955127 THERMO FISHER CUVETTE SEMI-MICRO 1.5ML 500CS CS $139.18 $41.80 70%12/9/2010 GD14955127 THERMO FISHER CUVETTE SEMI-MICRO 1.5ML 500CS CS 139.18 34.42 75%5/26/2011 GD14955127 THERMO FISHER CUVETTE SEMI-MICRO 1.5ML 500CS CS 139.18 72.93 48%
10/12/2010 05090100 THERMO FISHER MINI CENTR W/2 ROTORS 115-240V EA $424.11 $276.60 35%5/24/2011 05090100 THERMO FISHER MINI CENTR W/2 ROTORS 115-240V EA 424.11 212.42 50%5/26/2011 05090100 THERMO FISHER MINI CENTR W/2 ROTORS 115-240V EA 424.11 214.92 49%
2/15/2011 SH30200.01 THERMO FISHER MCCOY S 5A W/ L-GLUT 500ML EA $16.84 $12.00 29%4/19/2011 SH30200.01 THERMO FISHER MCCOY S 5A W/ L-GLUT 500ML EA 16.84 13.47 20%
6/9/2011 SH30200.01 THERMO FISHER MCCOY S 5A W/ L-GLUT 500ML EA 16.84 6.26 63%
79 119 358
1,340
3,754
5,901
$555K$450K
$715K
$1,140K
$1,580K $1,675K
($’s in 000s)
13© 2011 Huron Consulting Group. All Rights Reserved. Proprietary & Confidential.
Business CaseCore List Establishment and Target
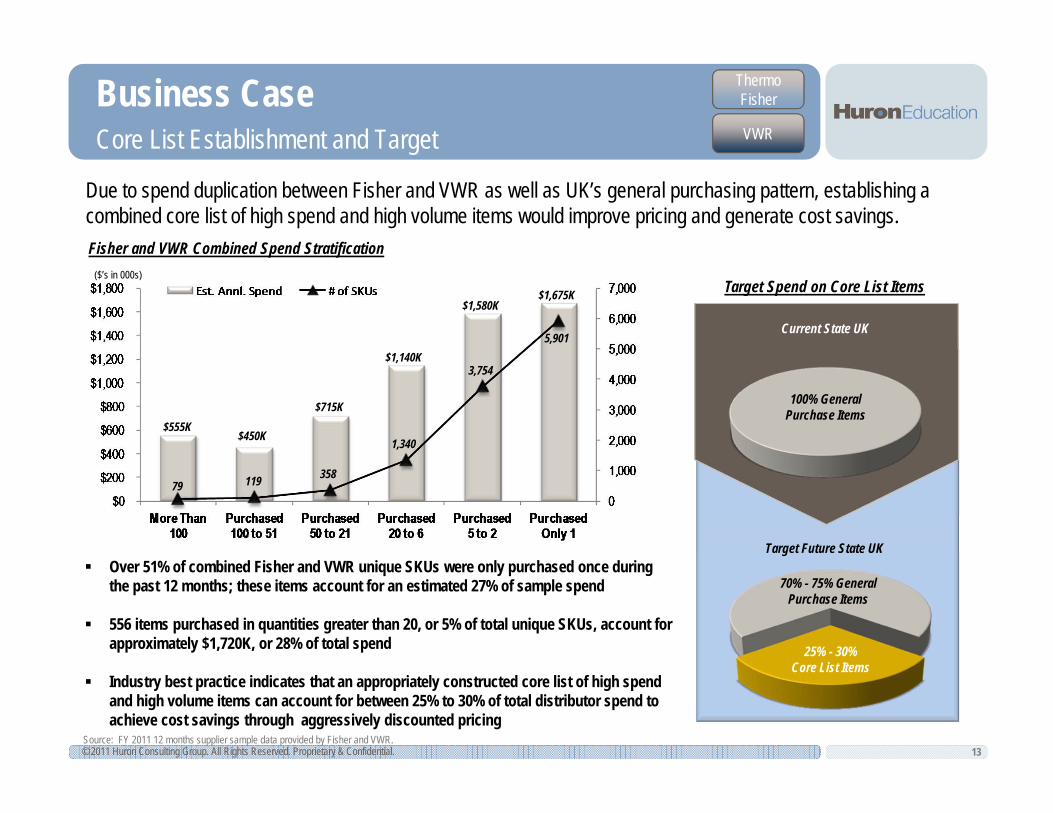
Due to spend duplication between Fisher and VWR as well as UK’s general purchasing pattern, establishing a combined core list of high spend and high volume items would improve pricing and generate cost savings.
Thermo Fisher
VWR
Fisher and VWR Combined Spend Stratification
Current State UK
Target Future State UK
100% General Purchase Items
70% - 75% General Purchase Items
25% - 30% Core List Items
Target Spend on Core List Items
Source: FY 2011 12 months supplier sample data provided by Fisher and VWR.
Over 51% of combined Fisher and VWR unique SKUs were only purchased once during the past 12 months; these items account for an estimated 27% of sample spend
556 items purchased in quantities greater than 20, or 5% of total unique SKUs, account for approximately $1,720K, or 28% of total spend
Industry best practice indicates that an appropriately constructed core list of high spend and high volume items can account for between 25% to 30% of total distributor spend to achieve cost savings through aggressively discounted pricing

14© 2011 Huron Consulting Group. All Rights Reserved. Proprietary & Confidential.
Business CasePotential UK Core Items
Detailed data analysis indicates that a list of 370 combined high spend and high volume Fisher and VWR items would account for approximately 27% of total combined spend, which makes those items good core list candidates.
Thermo Fisher
VWR
Examples of Ideal Core List ItemsMfr # Item Description Manufacturer UOM Total
QtyEst. Annl.
SpendPurchased
From Discount Received
Potential Core I tem
SC2500461 SMARTCYCLER II, 2 BLOCK LAPTOP CEPHEID EA 1 $55,700 Fisher 2%30450-01 VIDAS BRAHMS PCT 60/PK BIOMERIEUX PK 20 40,075 Fisher 6% YesSH30396.03 CANADIAN CHARACTER FBS 500ML THERMO FISHER EA 247 29,085 Fisher / VWR 22% Yes4951PLUS-600621 SLIDE SUPERFR + 25X75MM144/GR THERMO FISHER GR 445 27,220 Fisher 46% Yes1387 CLASS II A2 6 115V PACKAGE THERMO FISHER EA 3 26,675 Fisher 15%ND-2000 NANODROP 2000 THERMO FISHER EA 3 26,390 Fisher 7%DEL/46900 WX 80 ULTRA SORVALL THERMO FISHER EA 1 25,970 Fisher 35%11386R9A1D0 ULT1386-9-A -86C 115V UPRIGHT THERMO FISHER EA 2 25,420 Fisher 13%316-156 PF 10% FORMAL 90/45ML PP 75/CS THERMO FISHER CS 374 22,890 Fisher 0% Yes11210807 LEGEND 14 MICROCENTRIFUGE THERMO FISHER EA 28 22,820 Fisher 40% YesPICM03050 MILLICELL CM .4UM 30MM 50/PK MILLIPORE PK 91 22,685 Fisher 13% Yes993/DEL ULT FORMA FRZR 17 UR DBLDR 120 THERMO FISHER EA 2 22,595 Fisher 25%DEL/46900 SORVALL WX 80 ULTRA THERMO FISHER EA 1 22,215 Fisher 44%430167 TIS CULT DISH 100X20MM 500/CS CORNING CS 94 22,035 Fisher / VWR 69% Yes51027120/SPEC KS18 BIO SAFTEY CABINET 6' THERMO FISHER EA 2 21,085 Fisher 25%RPN2132 ECL PLUS WB REAGENTS (1000CM2) GE HEALTHCARE EA 93 20,960 Fisher / VWR 16% Yes3422 TC INSRT 24WL 6.5MM 8UM 48/CS CORNING CS 154 20,580 Fisher / VWR 36% YesM1369-1125 FERMENTOR ADVNCD 120V 7.5L HB EPPENDORF EA 1 20,270 Fisher 14%9741WGYPLUS PROB-ON PLS SLDE GRYTAB 144/PK THERMO FISHER PK 308 19,840 Fisher 9% Yes2131031813 ISOTEMP 3016S STD 115/60 EA THERMO FISHER EA 10 19,555 Fisher 30%… … … … … … … … …
Total SKUs on Core List 370Unique Fisher 231Unique VWR 25Purchased from Both 114
$1,645K
27%
45%
53% - 58%
Current Weighted Average Discount
Weighted Average Discount Target
Savings Opportunities
Core List Selection CriteriaTotal Quantity > 20Total Spend > $1,000
Potential Core List Summary
% of Total Fisher and VWR Spend
Est. Total Core Item Spend
Significant savings opportunities exist to establish a core list of combined Fisher and VWR high spend and high volume items;aggressively discounted pricing for core items can be achieved during the negotiation process
Source: FY 2011 12 months supplier sample data provided by Fisher and VWR.

15© 2011 Huron Consulting Group. All Rights Reserved. Proprietary & Confidential.
Business CaseDiscount by Category Opportunities
Outside of net priced core list items, the primary discount and pricing mechanism that Fisher utilizes is the Category Discount Codes or CDCs; contract discounts are often established for over 120 different CDC numbers.
Thermo Fisher
General CDC Discount Opportunities
The top 15 contract CDCs account for approximately $1,445K or 39% of remaining Fisher spend outside of potential core list items
Observed actual CDC discounts received are usually higher than those stated in the contract due to periodic supplier and manufacturer promotions
Experience suggests that opportunities exist to improve select CDC general contract discounts and actual discounts received
($'s in 000s)
CDC # CDC Description
999 Miscellaneous Supplies and Equipment $890 24% N/A 17%
082 Life Science Accommodation 235 6% 2% 4% 15% - 18%011 Vacuum pumps, centrifuges, stereo scopes, etc. 190 5% 22% 26% 30% - 34%015 Belt guards, cages, weights, tissue grinder, etc. 120 3% 23% 30% 34% - 38%016 Gloves, ampoules, filters, weights, balances, etc. 110 3% 27% 34% 36% - 40%014 Scope accessories, chromatography paper, etc. 105 3% 15% 30% 34% - 37%028 Fisher Private Label instruments 90 2% 22% 28% 30% - 32%018 Lab coats, coveralls, weights, beakers, etc. 80 2% 34% 38% 46% - 48%012 Vacuum pumps, microscopes/accessories, etc. 80 2% 22% 30% 34% - 37%081 Life Science Biochemicals. 80 2% 21% 25% 32% - 35%033 Acros Chemicals. 75 2% 9% 10% 12% - 15%017 Statfree wear, vacutainer tubes, bottles, etc. 70 2% 29% 33% 41% - 45%001 Centrifuges, rotors, incubator ovens, etc. 60 2% 26% 44% 37% 41%030 Cover glass, slides, vials, separators, etc. 60 2% 50% 51% 58% - 62%065 Life Science Exclusives/Premium Products 45 1% 4% 5% 8% - 12%021 Lab coats, autoclaving, weights, beakers, etc. 45 1% 49% 52% 58% - 62%
$1,445 39%
Other (117) $1,350 37%
$3,685 100%
% of Non-Core
Spend
Est. Annl. Non-Core
Spend
UK Contract Discount
Actual Wtd. Avg.
Disc.
Huron ExperienceContract Discount
Various Levels Various Levels
No contract discount for CDC 999
Total Non-Core CDC Spend
Top 15 CDC Subtotal
Source: FY 2011 12 months supplier sample data provided by Fisher.
16© 2011 Huron Consulting Group. All Rights Reserved. Proprietary & Confidential.
Business CaseCDC 999 Analysis
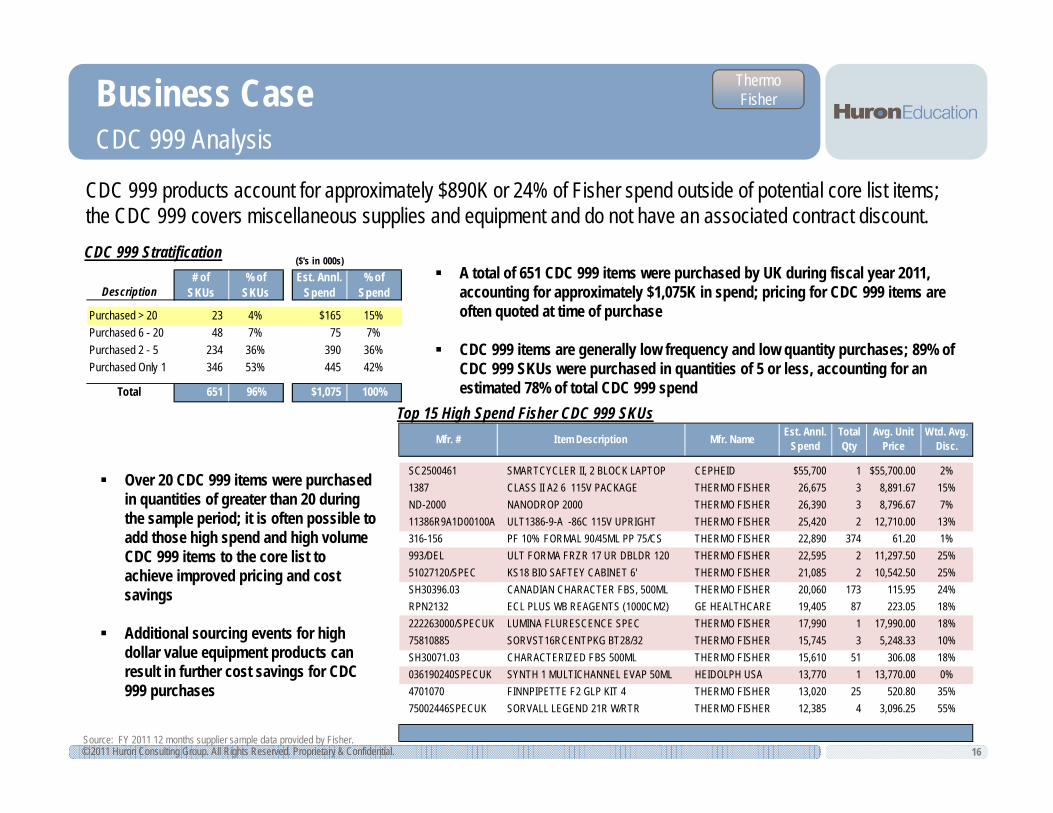
CDC 999 products account for approximately $890K or 24% of Fisher spend outside of potential core list items; the CDC 999 covers miscellaneous supplies and equipment and do not have an associated contract discount.
Thermo Fisher
Mfr. # Item Description Mfr. Name Est. Annl. Spend
Total Qty
Avg. Unit Price
Wtd. Avg. Disc.
SC2500461 SMARTCYCLER II, 2 BLOCK LAPTOP CEPHEID $55,700 1 $55,700.00 2%1387 CLASS II A2 6 115V PACKAGE THERMO FISHER 26,675 3 8,891.67 15%ND-2000 NANODROP 2000 THERMO FISHER 26,390 3 8,796.67 7%11386R9A1D00100A ULT1386-9-A -86C 115V UPRIGHT THERMO FISHER 25,420 2 12,710.00 13%316-156 PF 10% FORMAL 90/45ML PP 75/CS THERMO FISHER 22,890 374 61.20 1%993/DEL ULT FORMA FRZR 17 UR DBLDR 120 THERMO FISHER 22,595 2 11,297.50 25%51027120/SPEC KS18 BIO SAFTEY CABINET 6' THERMO FISHER 21,085 2 10,542.50 25%SH30396.03 CANADIAN CHARACTER FBS, 500ML THERMO FISHER 20,060 173 115.95 24%RPN2132 ECL PLUS WB REAGENTS (1000CM2) GE HEALTHCARE 19,405 87 223.05 18%222263000/SPECUK LUMINA FLURESCENCE SPEC THERMO FISHER 17,990 1 17,990.00 18%75810885 SORVST16RCENTPKG BT28/32 THERMO FISHER 15,745 3 5,248.33 10%SH30071.03 CHARACTERIZED FBS 500ML THERMO FISHER 15,610 51 306.08 18%036190240SPECUK SYNTH 1 MULTICHANNEL EVAP 50ML HEIDOLPH USA 13,770 1 13,770.00 0%4701070 FINNPIPETTE F2 GLP KIT 4 THERMO FISHER 13,020 25 520.80 35%75002446SPECUK SORVALL LEGEND 21R W/RTR THERMO FISHER 12,385 4 3,096.25 55%
Top 15 High Spend Fisher CDC 999 SKUs
CDC 999 Stratification ($'s in 000s)
Description# of
SKUs% of
SKUsEst. Annl.
Spend% of
Spend
Purchased > 20 23 4% $165 15%Purchased 6 - 20 48 7% 75 7%Purchased 2 - 5 234 36% 390 36%Purchased Only 1 346 53% 445 42%
Total 651 96% $1,075 100%
Source: FY 2011 12 months supplier sample data provided by Fisher.
Over 20 CDC 999 items were purchased in quantities of greater than 20 during the sample period; it is often possible to add those high spend and high volume CDC 999 items to the core list to achieve improved pricing and cost savings
Additional sourcing events for high dollar value equipment products can result in further cost savings for CDC 999 purchases
A total of 651 CDC 999 items were purchased by UK during fiscal year 2011, accounting for approximately $1,075K in spend; pricing for CDC 999 items are often quoted at time of purchase
CDC 999 items are generally low frequency and low quantity purchases; 89% of CDC 999 SKUs were purchased in quantities of 5 or less, accounting for an estimated 78% of total CDC 999 spend

17© 2011 Huron Consulting Group. All Rights Reserved. Proprietary & Confidential.
Business CaseVWR Pricing and Contract Structure Overview
Spend with VWR accounts for approximately 16% of scientific supply distributor spend at an estimated $885K annually; VWR has its own unique contract structure which is very different from that of Fisher.
VWR
VWR Pricing Method and Weighted Average Discount
($’s in 000s)
$300K / 31% $660K / 69%
39%
26%
VWR Contract Pricing Structure
Discount By
Example Life Sciences BD and Company 15% Private Label - Spec Wipes 15%Discount off Molecular Bio/Spec. Reagents 4% Private Label - Cell Dividers 15%List Price Microbiology - Exclusive 5% BD Labware / Clinical Private Label - Wipers 30%
Cell Culture - Exclusive 5% Plasticware - Tissue Culture 27% Private Label - Pad W/Plastic 10%In Silico - Exclusive 5% Private Label - Gloves 25%
Product Group Vendor Other Discounts
Source: FY 2011 12 months supplier sample data provided by VWR.
VWR FY 2011 supplier usage data shows that approximately 69% of the spend or $660K were priced based on contract discounts; the remaining were priced from special quotes
Analysis further reveals that special quoted items received a higher weighted average discount compared to contract priced items, 39% versus 26% respectively
The VWR contract structure first divides items into Product Group and Vendor Group, each group of products are then divided into subcategories and often further divided again based on product type or unit of purchase, making contract comparison and audit of VWR items extremely difficult
18© 2011 Huron Consulting Group. All Rights Reserved. Proprietary & Confidential.
Business CaseVWR Spend by Category and Subcategory
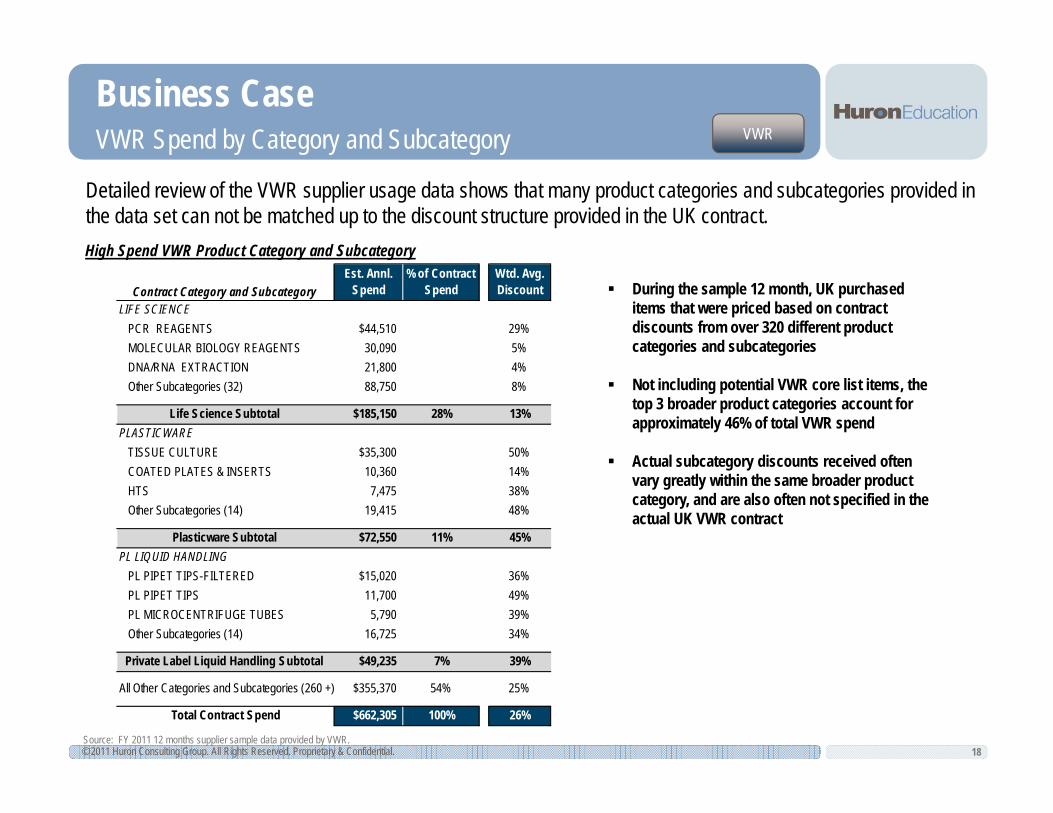
Detailed review of the VWR supplier usage data shows that many product categories and subcategories provided in the data set can not be matched up to the discount structure provided in the UK contract.
VWR
Contract Category and SubcategoryEst. Annl.
Spend% of Contract
SpendWtd. Avg. Discount
LIFE SCIENCEPCR REAGENTS $44,510 29%MOLECULAR BIOLOGY REAGENTS 30,090 5%DNA/RNA EXTRACTION 21,800 4%Other Subcategories (32) 88,750 8%
Life Science Subtotal $185,150 28% 13%PLASTICWARE
TISSUE CULTURE $35,300 50%COATED PLATES & INSERTS 10,360 14%HTS 7,475 38%Other Subcategories (14) 19,415 48%
Plasticware Subtotal $72,550 11% 45%PL LIQUID HANDLING
PL PIPET TIPS-FILTERED $15,020 36%PL PIPET TIPS 11,700 49%PL MICROCENTRIFUGE TUBES 5,790 39%Other Subcategories (14) 16,725 34%
Private Label Liquid Handling Subtotal $49,235 7% 39%
All Other Categories and Subcategories (260 +) $355,370 54% 25%
Total Contract Spend $662,305 100% 26%
Source: FY 2011 12 months supplier sample data provided by VWR.
During the sample 12 month, UK purchased items that were priced based on contract discounts from over 320 different product categories and subcategories
Not including potential VWR core list items, the top 3 broader product categories account for approximately 46% of total VWR spend
Actual subcategory discounts received often vary greatly within the same broader product category, and are also often not specified in the actual UK VWR contract
High Spend VWR Product Category and Subcategory

19© 2011 Huron Consulting Group. All Rights Reserved. Proprietary & Confidential.
Business CaseVWR Pricing and Discount Variance
Data review shows that items falling under the same product category / subcategory combination often received a wide range of different discounts.
VWR
Product Category Product Subcategory Mfr. # Item Description Manufacturer Name Pricing Method UOM Qty Est. Annl.
SpendWtd. Avg.
Disc.
LIFE SCIENCE PCR REAGENTS 95048-100 QSCRIPT CDNA SUPERMIX, 100R QUANTA BIOSCIENCES Contract Pricing EA 32 $9,370 42% LIFE SCIENCE PCR REAGENTS 95073-05K PERFECTA SYBR FASTMX ROX 5000 QUANTA BIOSCIENCES Contract Pricing EA 4 8,250 37% LIFE SCIENCE PCR REAGENTS 95048-500 QSCRIPT CDNA SUPERMIX, 500R QUANTA BIOSCIENCES Contract Pricing EA 3 4,390 40% LIFE SCIENCE PCR REAGENTS M8298 TAQ FLEXI DNA POLYMERASE10000U PROMEGA Contract Pricing EA 3 3,180 5% LIFE SCIENCE PCR REAGENTS 95054-500 PERFECTA SYBR SUPERMIX, 500R QUANTA BIOSCIENCES Contract Pricing EA 5 2,900 27% LIFE SCIENCE PCR REAGENTS 95073-012 PERFECTA SYBR FASTMX ROX 1250 QUANTA BIOSCIENCES Contract Pricing EA 4 2,370 32% LIFE SCIENCE PCR REAGENTS 95071-012 PERFECTA SYBR FASTMX IQ 1250R QUANTA BIOSCIENCES Contract Pricing EA 4 2,370 33% LIFE SCIENCE PCR REAGENTS M7123 GOTAQ GREEN MASTER MIX PROMEGA Contract Pricing EA 6 1,980 5% LIFE SCIENCE PCR REAGENTS 95073-250 PERFECTA SYBR FASTMX ROX 250R QUANTA BIOSCIENCES Contract Pricing EA 8 1,470 4% LIFE SCIENCE PCR REAGENTS 95047-100 QSCRIPT CDNA SYN KIT 100R QUANTA BIOSCIENCES Contract Pricing EA 2 720 0%
Product Category Product Subcategory Mfr. # Item Description Manufacturer Name Pricing Method UOM Qty Est. Annl.
SpendWtd. Avg.
Disc.
LIFE SCIENCE MOLECULAR BIO REAGENTS 21059 BOTTLE RESTORE W/B STRIPPING PIERCE CHEMICAL Contract Pricing EA 10 $1,155 0% LIFE SCIENCE MOLECULAR BIO REAGENTS 1700 ACRYL/BIS 29:1 40% W/VSL 500ML Millipore Contract Pricing EA 9 655 22% LIFE SCIENCE MOLECULAR BIO REAGENTS 4099-06 TRIS(BUFFER) BKR ANL UPR RE5KG AVANTOR Contract Pricing EA 2 475 28% LIFE SCIENCE MOLECULAR BIO REAGENTS 50081 NUSIEVE GTG AGAROSE LONZA WALKERSVILLE INC Contract Pricing EA 2 250 6% LIFE SCIENCE MOLECULAR BIO REAGENTS 4095-02 SODIUM DODECYL SULFATE REG 1KG AVANTOR Contract Pricing EA 1 240 14% LIFE SCIENCE MOLECULAR BIO REAGENTS 230760-10MG CHRYSAMINE G-10MG Millipore Contract Pricing EA 1 110 0% LIFE SCIENCE MOLECULAR BIO REAGENTS 786-046 APROTININ 100MG G-BIOSCIENCES Contract Pricing EA 1 110 4% LIFE SCIENCE MOLECULAR BIO REAGENTS 786-460 PCR DNTP SET 4 X 25UMOLE G-BIOSCIENCES Contract Pricing EA 1 80 5% LIFE SCIENCE MOLECULAR BIO REAGENTS 10082180 5-AZACYTIDINE 100.00 MG MP BIOMEDICALS Contract Pricing EA 1 30 3% LIFE SCIENCE MOLECULAR BIO REAGENTS 17-942E TRYPAN BLUE 0.4% SOLTION 100ML LONZA WALKERSVILLE INC Contract Pricing EA 1 10 13%
Source: FY 2011 12 months supplier sample data provided by VWR.
Discount Variance Example I: Product Category / Subcategory Combination Not Included in UK Contract
Discount Variance Example II: UK Stated Contract Discount for Life Science / Molecular Bio Reagents is 4%
20© 2011 Huron Consulting Group. All Rights Reserved. Proprietary & Confidential.
Business CasePrivate Label Products
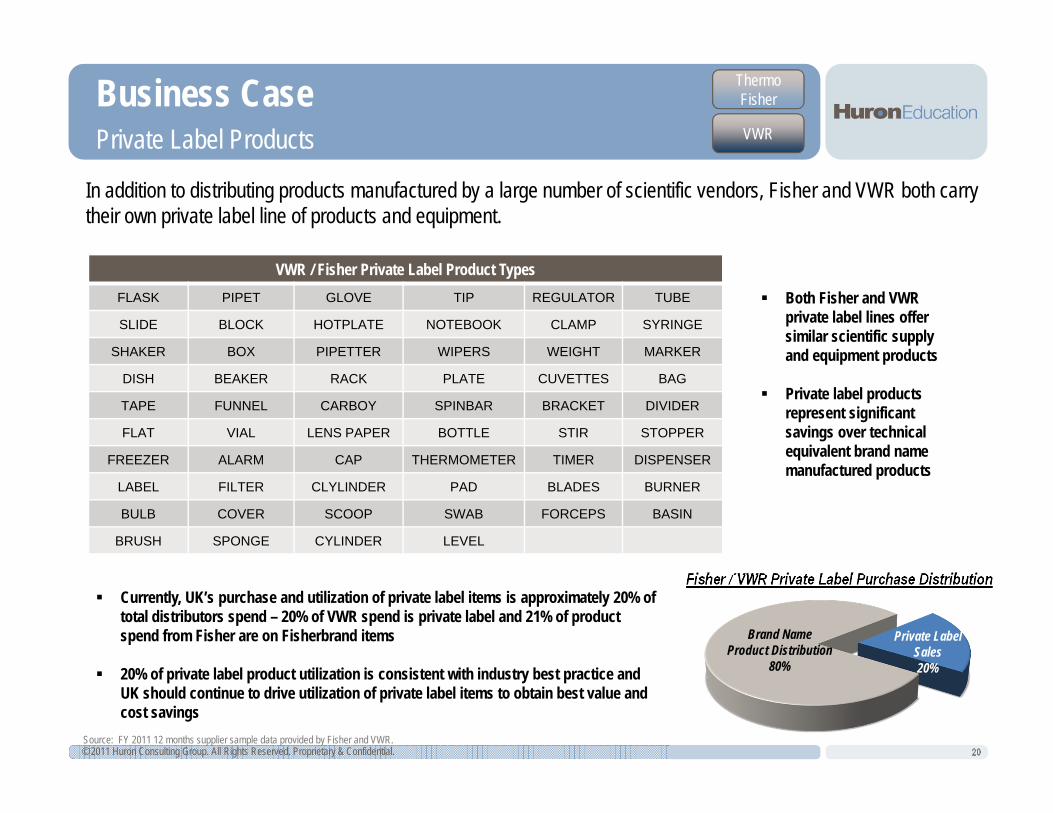
In addition to distributing products manufactured by a large number of scientific vendors, Fisher and VWR both carry their own private label line of products and equipment.
Thermo Fisher
VWR
Fisher / VWR Private Label Purchase Distribution
Both Fisher and VWR private label lines offer similar scientific supply and equipment products
Private label products represent significant savings over technical equivalent brand name manufactured products
Source: FY 2011 12 months supplier sample data provided by Fisher and VWR.
VWR / Fisher Private Label Product TypesFLASK PIPET GLOVE TIP REGULATOR TUBE
SLIDE BLOCK HOTPLATE NOTEBOOK CLAMP SYRINGE
SHAKER BOX PIPETTER WIPERS WEIGHT MARKER
DISH BEAKER RACK PLATE CUVETTES BAG
TAPE FUNNEL CARBOY SPINBAR BRACKET DIVIDER
FLAT VIAL LENS PAPER BOTTLE STIR STOPPER
FREEZER ALARM CAP THERMOMETER TIMER DISPENSER
LABEL FILTER CLYLINDER PAD BLADES BURNER
BULB COVER SCOOP SWAB FORCEPS BASIN
BRUSH SPONGE CYLINDER LEVEL
Brand Name Product Distribution
80%
Private Label Sales20%
Currently, UK’s purchase and utilization of private label items is approximately 20% of total distributors spend – 20% of VWR spend is private label and 21% of product spend from Fisher are on Fisherbrand items
20% of private label product utilization is consistent with industry best practice and UK should continue to drive utilization of private label items to obtain best value and cost savings
21© 2011 Huron Consulting Group. All Rights Reserved. Proprietary & Confidential.
Business CaseHigh Level Analysis – Life Technologies
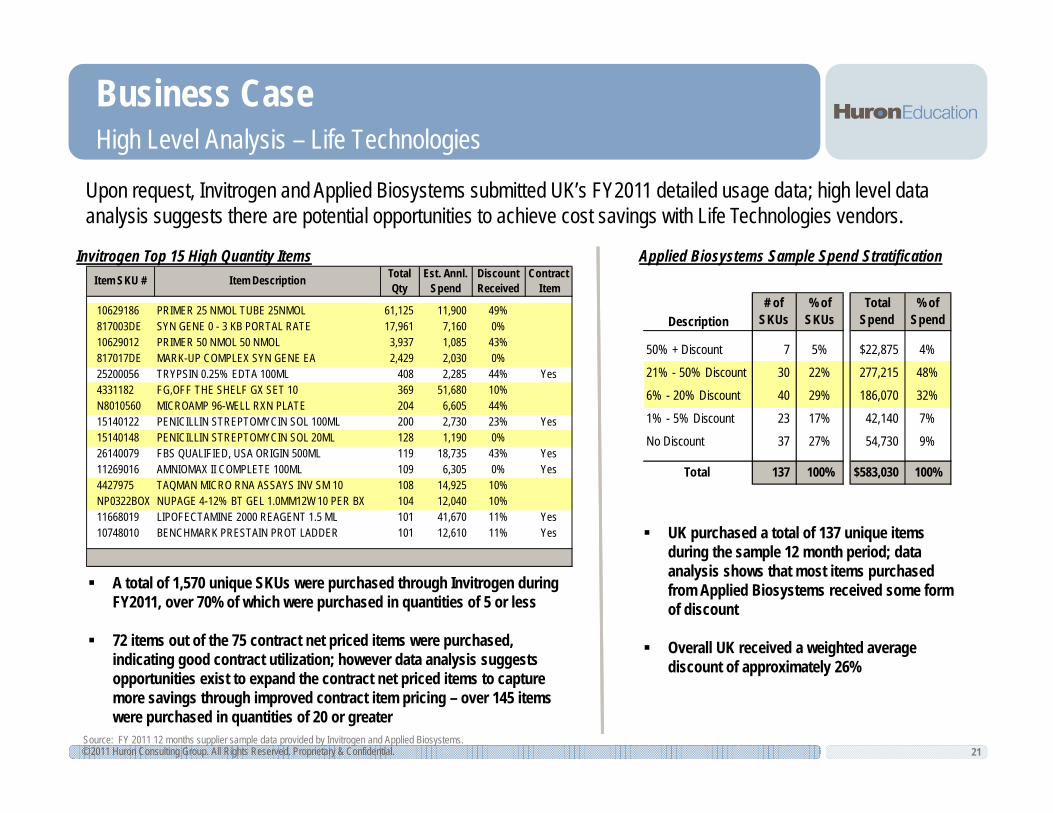
Upon request, Invitrogen and Applied Biosystems submitted UK’s FY2011 detailed usage data; high level data analysis suggests there are potential opportunities to achieve cost savings with Life Technologies vendors.
Invitrogen Top 15 High Quantity ItemsI tem SKU # Item Description Total
QtyEst. Annl.
SpendDiscount Received
Contract Item
10629186 PRIMER 25 NMOL TUBE 25NMOL 61,125 11,900 49%817003DE SYN GENE 0 - 3 KB PORTAL RATE 17,961 7,160 0%10629012 PRIMER 50 NMOL 50 NMOL 3,937 1,085 43%817017DE MARK-UP COMPLEX SYN GENE EA 2,429 2,030 0%25200056 TRYPSIN 0.25% EDTA 100ML 408 2,285 44% Yes4331182 FG,OFF THE SHELF GX SET 10 369 51,680 10%N8010560 MICROAMP 96-WELL RXN PLATE 204 6,605 44%15140122 PENICILLIN STREPTOMYCIN SOL 100ML 200 2,730 23% Yes15140148 PENICILLIN STREPTOMYCIN SOL 20ML 128 1,190 0%26140079 FBS QUALIFIED, USA ORIGIN 500ML 119 18,735 43% Yes11269016 AMNIOMAX II COMPLETE 100ML 109 6,305 0% Yes4427975 TAQMAN MICRO RNA ASSAYS INV SM 10 108 14,925 10%NP0322BOX NUPAGE 4-12% BT GEL 1.0MM12W 10 PER BX 104 12,040 10%11668019 LIPOFECTAMINE 2000 REAGENT 1.5 ML 101 41,670 11% Yes10748010 BENCHMARK PRESTAIN PROT LADDER 101 12,610 11% Yes
A total of 1,570 unique SKUs were purchased through Invitrogen during FY2011, over 70% of which were purchased in quantities of 5 or less
72 items out of the 75 contract net priced items were purchased, indicating good contract utilization; however data analysis suggests opportunities exist to expand the contract net priced items to capture more savings through improved contract item pricing – over 145 items were purchased in quantities of 20 or greater
Source: FY 2011 12 months supplier sample data provided by Invitrogen and Applied Biosystems.
Description# of
SKUs% of
SKUsTotal
Spend% of
Spend
50% + Discount 7 5% $22,875 4%
21% - 50% Discount 30 22% 277,215 48%
6% - 20% Discount 40 29% 186,070 32%
1% - 5% Discount 23 17% 42,140 7%
No Discount 37 27% 54,730 9%
Total 137 100% $583,030 100%
Applied Biosystems Sample Spend Stratification
UK purchased a total of 137 unique items during the sample 12 month period; data analysis shows that most items purchased from Applied Biosystems received some form of discount
Overall UK received a weighted average discount of approximately 26%

22© 2011 Huron Consulting Group. All Rights Reserved. Proprietary & Confidential.
Business CaseHigh Level Analysis – Beckman Coulter
Beckman Coulter also responded to UK’s supplier data request by submitting detailed transactional data for FY2011; a similar data request was also sent to Sigma-Aldrich but the supplier did not respond.
Source: FY 2011 12 months supplier sample data provided by Beckman Coulter.
Beckman Coulter Sample Spend by Product Type
Data analysis shows that majority of UK spend through Beckman Coulter are equipment maintenance related charges, such as labor and travel for service, which are not covered under the current agreement
Consumables which account for 11% of Beckman Coulter purchases are also not covered under the current contract
The current contract only covers Hardware and Rotors which together account for approximately 25% of total Beckman Coulter sample spend; however since the supplier did not provide the list pricing, Huron was unable to assess current discount level received
Hardware and Consumables Spend Breakdown
Product Class Qty Sample Total
% of Product Class Spend
HardwareInstrument Sales Group 1 $53,295 60%Instrument 1 33,925 39%Accessory 1 375 < 1% Part 4 160 < 1% Adapter 1 90 < 1%
Hardware Subtotal 8 $87,845 100%
ConsumablesReagent 203 $24,510 49%Consumable 21 12,050 24%Tubes 72 9,305 19%Supply 49 3,220 6%Kit 2 540 1%Calibrator 3 340 1%
Consumable Subtotal 350 $49,965 100%
Services$285K / 64%
Hardware$88K / 19%Consumable
$50K / 11%
Rotors$30K / 6%

23© 2011 Huron Consulting Group. All Rights Reserved. Proprietary & Confidential.
Business CaseHigh Spend Niche Vendor Summary and Next Steps
In additional to large distributors such as Fisher and VWR, UK also spends considerable amount annually with various niche scientific vendors, namely Life Tech (Invitrogen / Applied Bio), Sigma-Aldrich and Beckman Coulter.Description Invitrogen (Life Tech) Sigma-Aldrich Beckman Coulter Applied Bio (Life Tech)
Est. Annl. Spend ~$1,355K ~ $985K ~ $930K ~ $810K
Contract Status Established in April 2007; Latest modification extends the contract through July 2011, on a month to month extension
UK currently does not have a contract with Sigma-Aldrich
Established in May 2007; latest modification extends the contract through July 2011, on a month to month extension
Established in April 2007; Latest modification extends the contract through July 2011, on a month to month extension
Supplier Overview
Life Tech is a global biotechnology tools company providing premier systems, consumables, and services for scientific researchers around the world
Specialty chemical supplier Beckman Coulter focuses on manufacturing biomedical laboratory instruments such as centrifuges and liquid handling systems
Life Tech is a global biotechnology tools company providing premier systems, consumables, and services for scientific researchers around the world
Pricing / Discount Details
• Latest version contains 75+net priced items for the Life Science Center receiving discounts between 5% - 55%
• Original contract contains 165+ net priced items receiving 5% - 55% discount
• Many if not all items potentially being purchased at list price or receiving minimal discounts
• Contract for instrument and major accessories, does not cover consumables
• Contract has 600 plus net priced items receiving discounts between 0%-14%
• Contract structure includes net priced items and discount off list price by product categories ranging from 0% up to 75%; also includes list and net pricing for thousands of catalog items
Other Terms • $15 flat fee per order; UK responsible for dry ice, haz mat and other special shipping – Haz Mat is approximately $20/applicable order
• UK end users pay full shipping cost when purchasing from Sigma
• Does not charge regular shipping • Does not charge regular shipping
Suggested Next Steps / Strategy
• Update list of net priced contract items to better align with actual purchase
• Potentially negotiate more favorable haz mat charges per order
• Bring Sigma into conversation to establish an UK specific pricing agreement
• Discuss with Beckman Coulter UK’s current spend pattern and how best to incorporate consumables and services into the overall contract
• UK has a fairly comprehensive overall contract agreement with Applied Bio; pricing negotiation should focus on high spend high volume items
Challenges • Life Technologies is very difficult to work with due to established industry market share and brand prominence
• Sigma did not want to enter into contract with UK previously
• Potentially challenging to successfully negotiate more favorable service and maintenance fees
• Life Technologies is very difficult to work with due to established industry market share and brand prominence
Source: UK contract documents for Invitrogen, Beckman Coulter and Applied Biosystems.
Savings Summary
24© 2011 Huron Consulting Group. All Rights Reserved. Proprietary & Confidential.
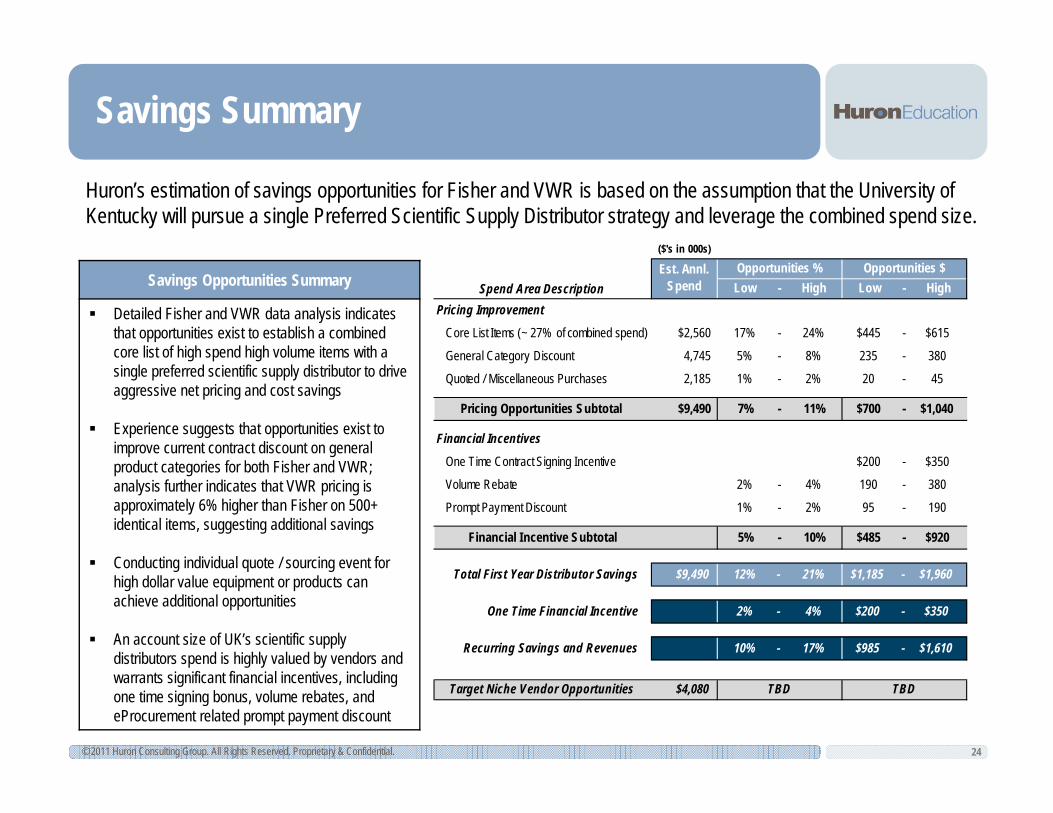
Huron’s estimation of savings opportunities for Fisher and VWR is based on the assumption that the University of Kentucky will pursue a single Preferred Scientific Supply Distributor strategy and leverage the combined spend size.
Savings Opportunities Summary
Detailed Fisher and VWR data analysis indicates that opportunities exist to establish a combined core list of high spend high volume items with a single preferred scientific supply distributor to drive aggressive net pricing and cost savings
Experience suggests that opportunities exist to improve current contract discount on general product categories for both Fisher and VWR; analysis further indicates that VWR pricing is approximately 6% higher than Fisher on 500+ identical items, suggesting additional savings
Conducting individual quote / sourcing event for high dollar value equipment or products can achieve additional opportunities
An account size of UK’s scientific supply distributors spend is highly valued by vendors and warrants significant financial incentives, including one time signing bonus, volume rebates, and eProcurement related prompt payment discount
($'s in 000s)
Low - High Low - HighPricing Improvement
Core List Items (~ 27% of combined spend) $2,560 17% - 24% $445 - $615
General Category Discount 4,745 5% - 8% 235 - 380
Quoted / Miscellaneous Purchases 2,185 1% - 2% 20 - 45
Pricing Opportunities Subtotal $9,490 7% - 11% $700 - $1,040
Financial Incentives
One Time Contract Signing Incentive $200 - $350
Volume Rebate 2% - 4% 190 - 380
Prompt Payment Discount 1% - 2% 95 - 190
Financial Incentive Subtotal 5% - 10% $485 - $920
Total First Year Distributor Savings $9,490 12% - 21% $1,185 - $1,960
One Time Financial Incentive 2% - 4% $200 - $350
Recurring Savings and Revenues 10% - 17% $985 - $1,610
Target Niche Vendor Opportunities $4,080
Est. Annl. SpendSpend Area Description
Opportunities % Opportunities $
TBD TBD

Strategy Recommendation
25
Scientific Supply Distributors Strategy – Fisher and VWR– Combine spend and establish a single non-exclusive Preferred Scientific Supply Distributor contract through a
competitive RFP process– Establish a joint core list of high spend high volume items and negotiate aggressively discounted net pricing; core list
shall be updated periodically going forward to align with purchase pattern– Improve general product category based contract discounts, especially for high spend product categories /
subcategories– Increase and improve sourcing events for high dollar equipment and product purchases to achieve additional savings –
establish single sourcing even dollar threshold– Negotiate market competitive financial incentives appropriate for the combined UK distributors account size including
one time contract signing and recurring volume rebate, prompt payment discount, etc.– Setup the newly awarded preferred distributor in the SRM system; also setup the other large distributor in SRM but with
limited catalog product offerings
Select Target High Spend Niche Manufacturers Strategy– Focus negotiation effort on high spend high volume items that are frequently purchased by UK– Negotiate free standard shipping and favorable / reduced charges related to dry ice, haz mat, and other delivery fees– Work with the awarded Preferred Scientific Supply Distributor to understand to what degree these high premium
proprietary branded products can be substituted by same quality, lower cost technical equivalents; partner with the preferred distributor to market and promote technical equipment products to the research community
© 2011 Huron Consulting Group. All Rights Reserved. Proprietary & Confidential.
Detailed implementation strategy recommendation is as below for scientific supply distributors as well as target high spend niche vendors.

Implementation Timeline
26© 2011 Huron Consulting Group. All Rights Reserved. Proprietary & Confidential.
Huron estimates that it would take approximately between 15 to 17 weeks to approve and implement the recommended preferred scientific supply distributor strategy.
1 2 3 4 5 6 7 8 9 10 11 12 13 14 15 16 17Week Beginning 1/23 1/30 2/6 2/13 2/20 2/27 3/5 3/12 3/19 3/26 4/2 4/9 4/16 4/23 4/30 5/7 5/14
Key Implementation ActivitiesPresent business case draft to Purchasing team; make suggested edits and changesPresent the updated business case to the Scientific Advisory Committee; incorporate any edits and changesDiscuss and finalize implementation strategy for select target scientific suppliersDiscuss and form implementation core team; assign roles and responsibilitiesDraft scientific supply distributor RFP document and supporting materials such as the core list, market basketImplementation team and Scientific Advisory Committee review and approval of documentsSend RFP to Fisher and VWR and allow time for suppliers to submit their proposalsReview and analyze supplier initial proposals, identify gaps and prepare negotiation materials, i.e. MOT
Conduct subsequent rounds of distributor negotiations
Discuss and determine specific implementation strategy for other high spend niche scientific vendorsWrap up scientific supply distributor negotiation and award Preferred Distributor statusFinalize the MOT document and roll out contract to campus users