university of illinois at springfield dashboard indicators · state university of new york at...
TRANSCRIPT

T U I T I O N A N D F E E S A N D F I N A N C I A L A I D U P D AT E S BY:
U N I V E R S I T Y O F F I C E F O R P L A N N I N G A N D B U D G E T I N G
D E C E M B E R 1 0 , 2 0 1 4
P R E S E N T E D BY:
C H A N C E L L O R S U S A N J . KO C H
J A N UA R Y 1 5 , 2 0 1 5
University of Illinois at Springfield
Dashboard Indicators
Page 1/21
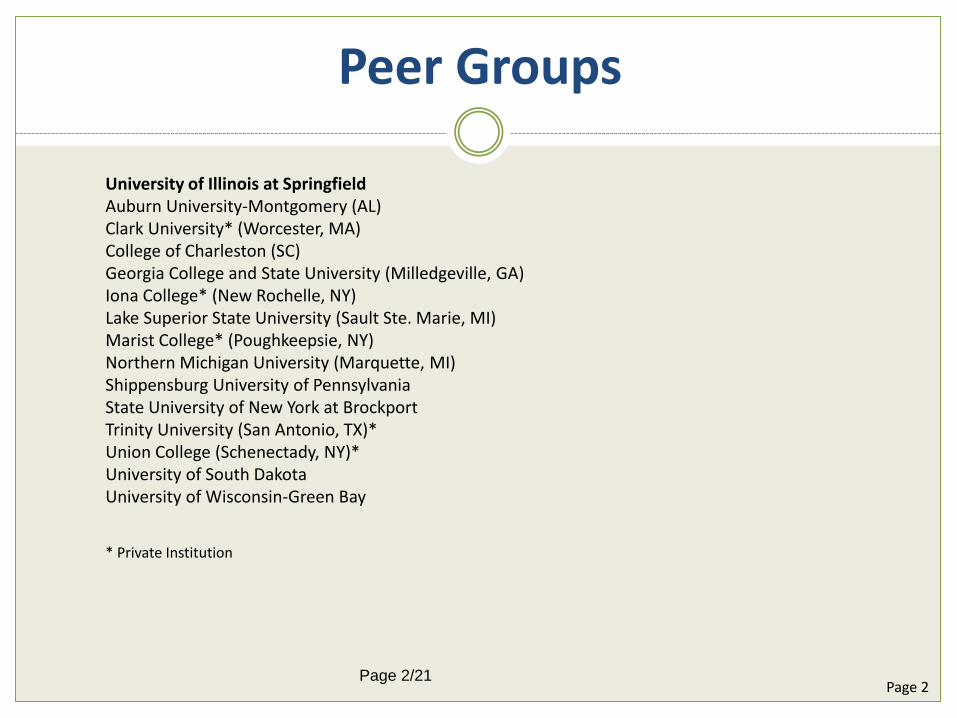
Peer Groups
University of Illinois at Springfield Auburn University-Montgomery (AL) Clark University* (Worcester, MA) College of Charleston (SC) Georgia College and State University (Milledgeville, GA) Iona College* (New Rochelle, NY) Lake Superior State University (Sault Ste. Marie, MI) Marist College* (Poughkeepsie, NY) Northern Michigan University (Marquette, MI) Shippensburg University of Pennsylvania State University of New York at Brockport Trinity University (San Antonio, TX)* Union College (Schenectady, NY)* University of South Dakota University of Wisconsin-Green Bay
* Private Institution
Page 2 Page 2/21
Tuition and Financial Aid
Page 3 Page 3/21

Undergraduate In-State Tuition and Fees Per Academic Year AY 2009 – AY 2014
Page 4
Undergraduate tuition and fees at the University of Illinois at Springfield are higher than its peer median.
9,007 9,815 10,408 10,865 11,132 11,367
$0
$5,000
$10,000
$15,000
$20,000
$25,000
$30,000
$35,000
2009 2010 2011 2012 2013 2014
UIS
Peer 75th Percentile
Peer Median
Peer 25th Percentile
Page 4/21

Percent Undergraduate Students Receiving Federal, State, or Local Institutional or Other Sources of Need or Merit Grant Aid: AY 2008 – AY 2012
Page 5
Percent of students receiving aid at the University of Illinois at Springfield is below its peer median. 56%
60% 63% 63% 65%
0%
10%
20%
30%
40%
50%
60%
70%
80%
90%
2008 2009 2010 2011 2012
UIS
Peer 75th Percentile
Peer Median
Peer 25th Percentile
Page 5/21
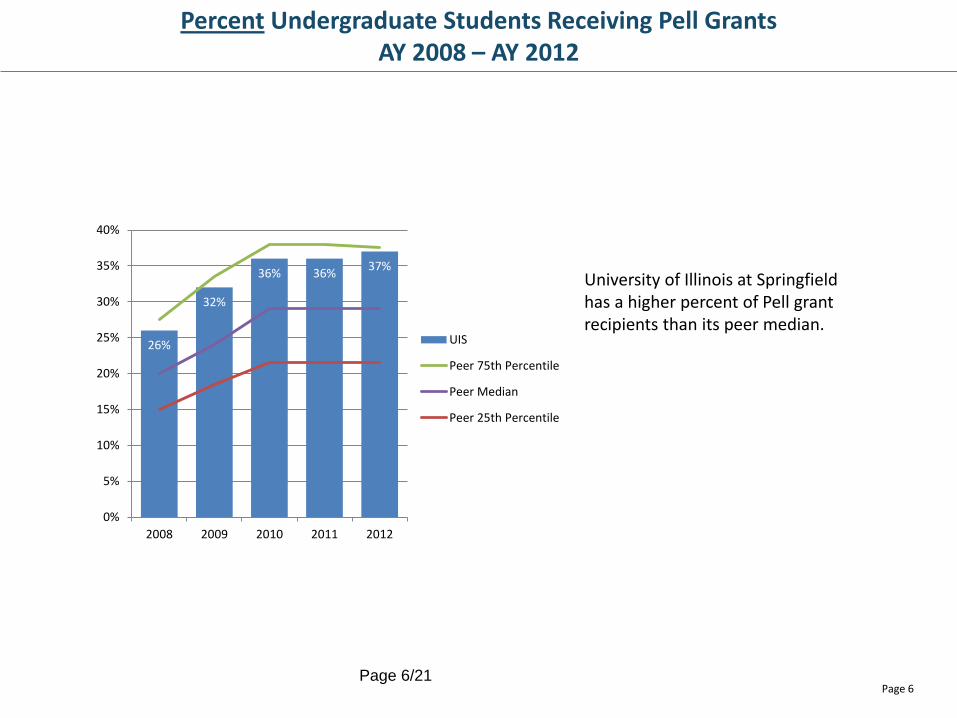
Percent Undergraduate Students Receiving Pell Grants AY 2008 – AY 2012
Page 6
University of Illinois at Springfield has a higher percent of Pell grant recipients than its peer median.
26%
32%
36% 36% 37%
0%
5%
10%
15%
20%
25%
30%
35%
40%
2008 2009 2010 2011 2012
UIS
Peer 75th Percentile
Peer Median
Peer 25th Percentile
Page 6/21
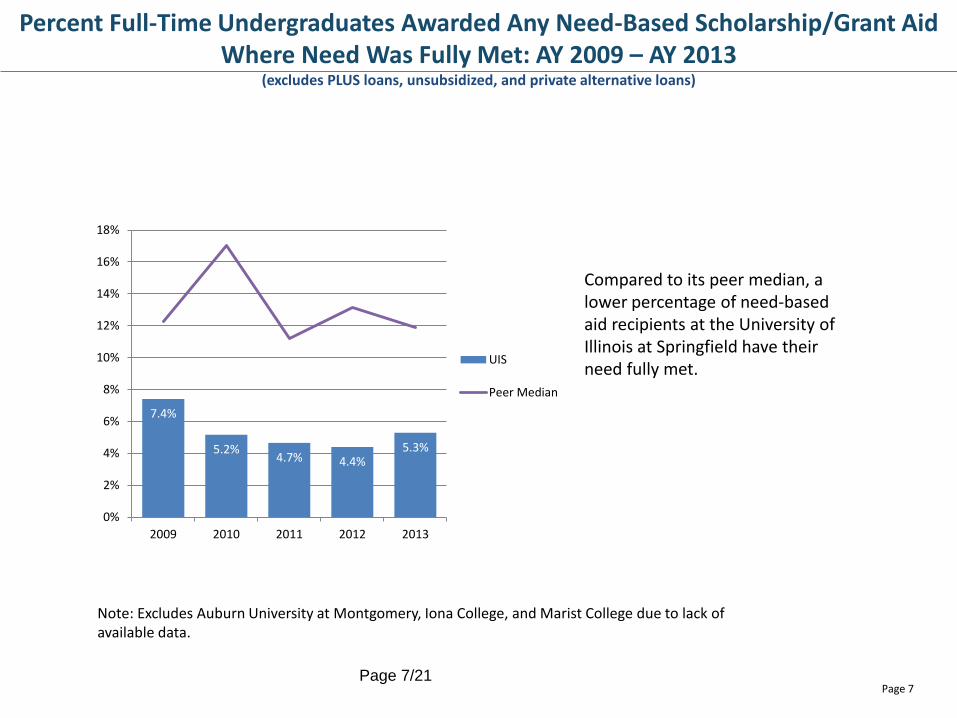
Percent Full-Time Undergraduates Awarded Any Need-Based Scholarship/Grant Aid Where Need Was Fully Met: AY 2009 – AY 2013
(excludes PLUS loans, unsubsidized, and private alternative loans)
Page 7
Note: Excludes Auburn University at Montgomery, Iona College, and Marist College due to lack of available data.
Compared to its peer median, a lower percentage of need-based aid recipients at the University of Illinois at Springfield have their need fully met.
7.4%
5.2% 4.7% 4.4%
5.3%
0%
2%
4%
6%
8%
10%
12%
14%
16%
18%
2009 2010 2011 2012 2013
UIS
Peer Median
Page 7/21
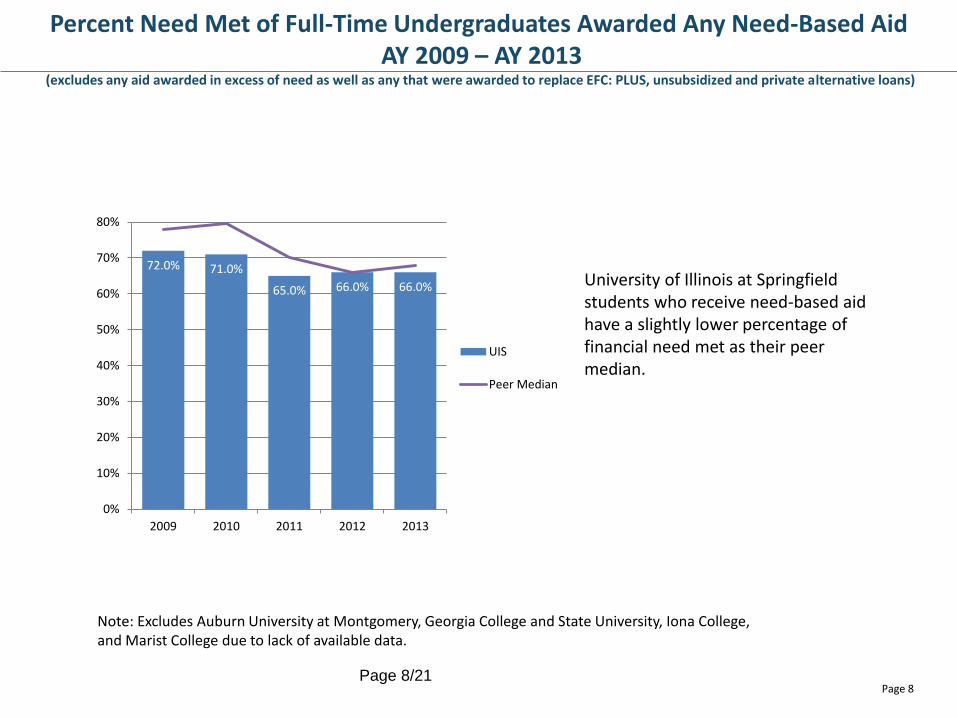
Percent Need Met of Full-Time Undergraduates Awarded Any Need-Based Aid AY 2009 – AY 2013
(excludes any aid awarded in excess of need as well as any that were awarded to replace EFC: PLUS, unsubsidized and private alternative loans)
Page 8
Note: Excludes Auburn University at Montgomery, Georgia College and State University, Iona College, and Marist College due to lack of available data.
University of Illinois at Springfield students who receive need-based aid have a slightly lower percentage of financial need met as their peer median.
72.0% 71.0%
65.0% 66.0% 66.0%
0%
10%
20%
30%
40%
50%
60%
70%
80%
2009 2010 2011 2012 2013
UIS
Peer Median
Page 8/21

Average Per Undergraduate-Borrower Cumulative Principal Borrowed AY 2009 – AY 2013
(excludes any aid awarded in excess of need as well as any that were awarded to replace EFC: PLUS, unsubsidized and private alternative loans)
Page 9
Note: Excludes Auburn University at Montgomery, Iona College, Trinity University, and University of South Dakota due to lack of available data.
Compared to the peer median, the average debt of University of Illinois at Springfield students is lower.
$14,717
$17,335
$20,323 $21,057
$23,766
$0
$5,000
$10,000
$15,000
$20,000
$25,000
$30,000
$2,009 $2,010 $2,011 $2,012 $2,013
UIS
Peer Median
Page 9/21

Percent Full-Time Undergraduates Paying Less than $3,000 Per Semester Fall 2009 – Fall 2013
(Includes all forms of financial aid and tuition waivers. Excludes loans and employment)
Page 10
About one-half of undergraduates at the University of Illinois at Springfield pay less than $3,000 per semester for tuition.
30%
29%
28% 28%
29%
25%
26%
25%
28% 28%
22%
23%
24%
25%
26%
27%
28%
29%
30%
31%
2009 2010 2011 2012 2013
$0
$1 - $2,999
Page 10/21

Tuition and Financial Aid: Goals
Page 11
• Campus goal
• Campus goal
Page 11/21
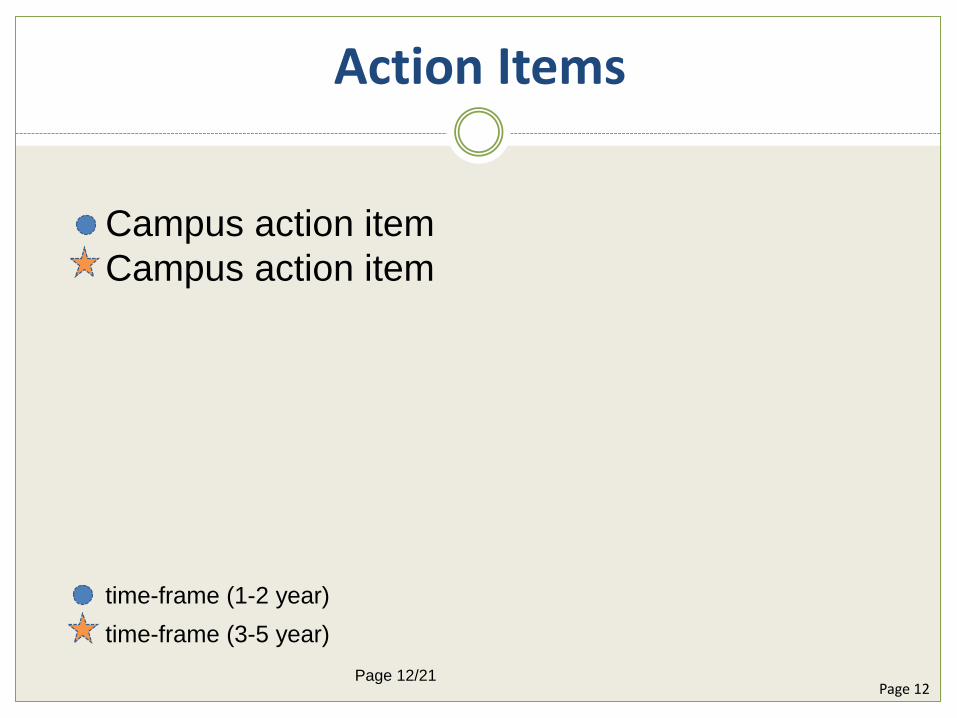
Action Items
Page 12
Campus action item
Campus action item
time-frame (1-2 year)
time-frame (3-5 year)
Page 12/21

Questions?
Page 35 Page 13/21

University of Illinois at Springfield
TUITION AND FEES AND FINANCIAL AID UPDATES
PRESENTED BY:
CHANCELLOR SUSAN J. KOCH
JANUARY 15, 2015
Analysis of Dashboard Indicators
Page 14/21
Areas Meeting or Exceeding Expectations
• UIS is attracting an economically diverse student body
• Average debt of UIS students is lower than students at its peer institutions
• UIS financial assistance has kept pace with increased educational costs
• UIS has increased scholarship awards
Page 15/21
Accomplishments
• UIS continues to increase the enrollment of students from under-represented groups many of whom are first generation and economically disadvantaged
• Strategic packaging of financial aid continues to enhance
affordability and accessibility
• UIS tuition remains highly competitive compared to private university peers
• UIS has implemented a new on-campus student employment program that provides additional employment opportunities
Page 16/21

Areas Needing Improvement
• Staffing in the Office of Financial Assistance
• Student financial literacy
• Need-based scholarships
Page 17/21

Strategy to improve Staffing in the Office of Financial Assistance
• Action: – Add two staff positions
Page 18/21

Strategy to improve Student Financial Literacy
• Action:
- Financial Literacy Workshops are being
provided from orientation through
graduation for students and parents
Page 19/21
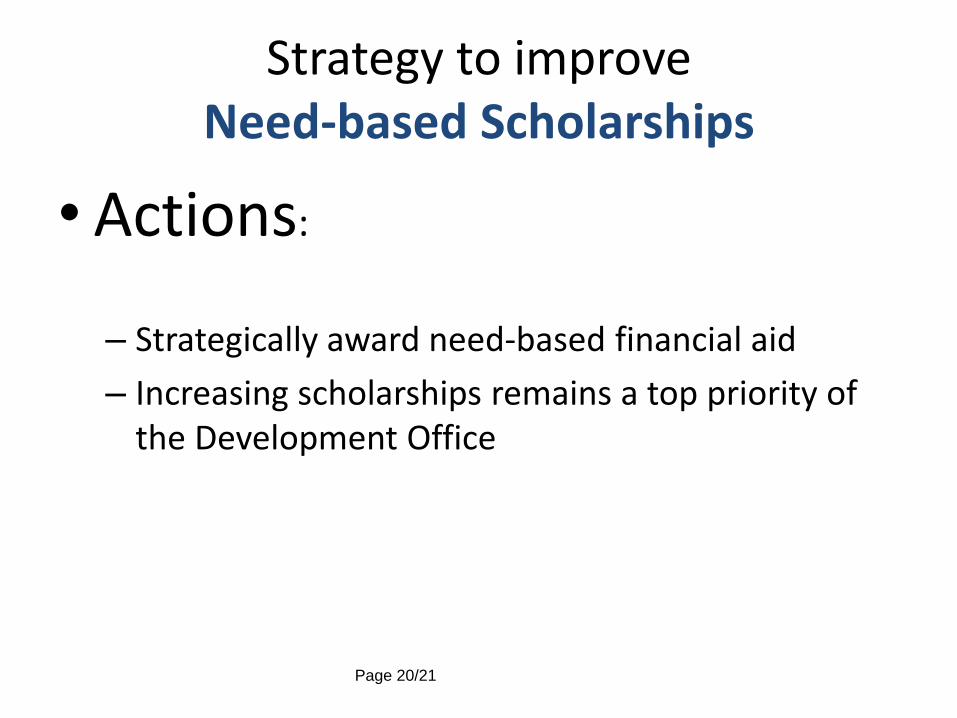
Strategy to improve Need-based Scholarships
• Actions:
– Strategically award need-based financial aid
– Increasing scholarships remains a top priority of the Development Office
Page 20/21
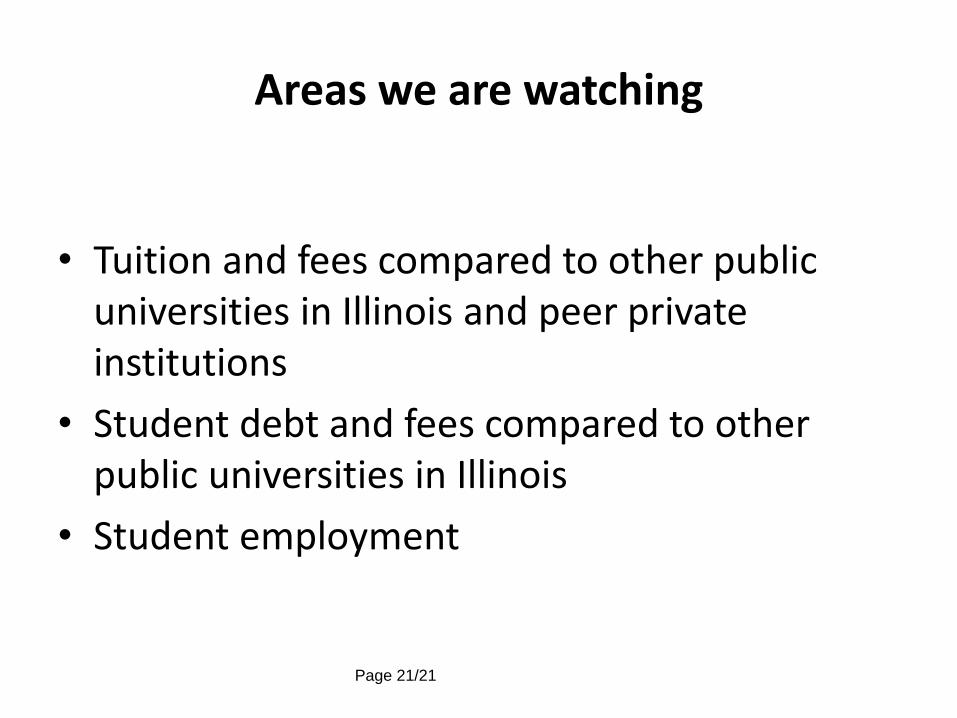
Areas we are watching
• Tuition and fees compared to other public universities in Illinois and peer private institutions
• Student debt and fees compared to other public universities in Illinois
• Student employment
Page 21/21