university of huddersfield repositoryeprints.hud.ac.uk/id/eprint/31960/1/pid4806641.pdftowards...
TRANSCRIPT

University of Huddersfield Repository
Hill, Richard, Devitt, James, Anjum, Ashiq and Ali, Mohammad
Towards InTransit Analytics for Industry 4.0
Original Citation
Hill, Richard, Devitt, James, Anjum, Ashiq and Ali, Mohammad (2017) Towards InTransit Analytics for Industry 4.0. In: IEEE International Conference on Internet of Things (iThings 2017), 2123 June 2017, Exeter, UK. (Unpublished)
This version is available at http://eprints.hud.ac.uk/id/eprint/31960/
The University Repository is a digital collection of the research output of theUniversity, available on Open Access. Copyright and Moral Rights for the itemson this site are retained by the individual author and/or other copyright owners.Users may access full items free of charge; copies of full text items generallycan be reproduced, displayed or performed and given to third parties in anyformat or medium for personal research or study, educational or notforprofitpurposes without prior permission or charge, provided:
• The authors, title and full bibliographic details is credited in any copy;• A hyperlink and/or URL is included for the original metadata page; and• The content is not changed in any way.
For more information, including our policy and submission procedure, pleasecontact the Repository Team at: [email protected].
http://eprints.hud.ac.uk/
Towards In-Transit Analytics for Industry 4.0
Richard Hill and James DevittSchool of Computing and Engineering
University of HuddersfieldUnited Kingdom
Email: {r.hill},{j.devitt}@hud.ac.uk
Ashiq Anjum and Muhammad AliCollege of Engineering and Technology
University of DerbyUnited Kingdom
Email: {a.anjum},{m.ali}@derby.ac.uk
Abstract—Industry 4.0, or Digital Manufacturing, is a vision ofinter-connected services to facilitate innovation in the manufac-turing sector. A fundamental requirement of innovation is theability to be able to visualise manufacturing data, in order todiscover new insight for increased competitive advantage. Thisarticle describes the enabling technologies that facilitate In-Transit Analytics, which is a necessary precursor for IndustrialInternet of Things (IIoT) visualisation.
Industrial Internet of Things, edge computing, streaminganalytics, data visualisation, digital manufacturing
1. IntroductionThe IoT is a logical progression as computing process-
ing, storage and network infrastructure becomes both moreaccessible to use and cheaper to purchase. As manufacturerscontinue to reduce the physical form factor of wirelesscommunication equipment, together with a desire to con-verge myriad communication protocols, it has become morefeasible to enable sensors, actuators and other devices toconnect to networks and exchange data from Machine toMachine (M2M).
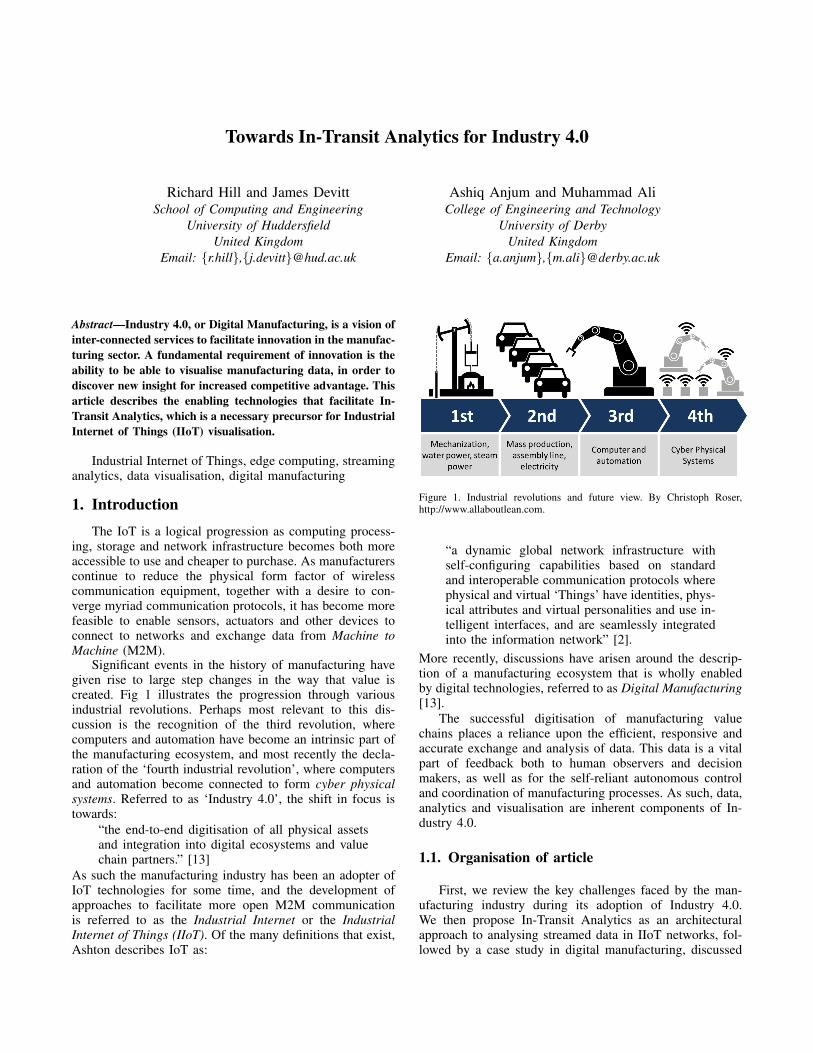
Significant events in the history of manufacturing havegiven rise to large step changes in the way that value iscreated. Fig 1 illustrates the progression through variousindustrial revolutions. Perhaps most relevant to this dis-cussion is the recognition of the third revolution, wherecomputers and automation have become an intrinsic part ofthe manufacturing ecosystem, and most recently the decla-ration of the ‘fourth industrial revolution’, where computersand automation become connected to form cyber physicalsystems. Referred to as ‘Industry 4.0’, the shift in focus istowards:
“the end-to-end digitisation of all physical assetsand integration into digital ecosystems and valuechain partners.” [13]
As such the manufacturing industry has been an adopter ofIoT technologies for some time, and the development ofapproaches to facilitate more open M2M communicationis referred to as the Industrial Internet or the IndustrialInternet of Things (IIoT). Of the many definitions that exist,Ashton describes IoT as:
Figure 1. Industrial revolutions and future view. By Christoph Roser,http://www.allaboutlean.com.
“a dynamic global network infrastructure withself-configuring capabilities based on standardand interoperable communication protocols wherephysical and virtual ‘Things’ have identities, phys-ical attributes and virtual personalities and use in-telligent interfaces, and are seamlessly integratedinto the information network” [2].
More recently, discussions have arisen around the descrip-tion of a manufacturing ecosystem that is wholly enabledby digital technologies, referred to as Digital Manufacturing[13].
The successful digitisation of manufacturing valuechains places a reliance upon the efficient, responsive andaccurate exchange and analysis of data. This data is a vitalpart of feedback both to human observers and decisionmakers, as well as for the self-reliant autonomous controland coordination of manufacturing processes. As such, data,analytics and visualisation are inherent components of In-dustry 4.0.
1.1. Organisation of article
First, we review the key challenges faced by the man-ufacturing industry during its adoption of Industry 4.0.We then propose In-Transit Analytics as an architecturalapproach to analysing streamed data in IIoT networks, fol-lowed by a case study in digital manufacturing, discussed

in the context of the ITA architecture and a simulated set ofresults. Finally, conclusions will be drawn.
2. Current challenges for manufacturing
As mentioned above, manufacturing organisationsdemonstrate the most maturity at present in terms of theadoption of IoT architectures. Enterprises that make physicalgoods need to keep track and coordinate people, plant,tools and raw materials. The inter-connectedness of physicalsystems is not a new topic for the manufacturing industry,but it is only the recent efforts to miniaturise hardware,reduce costs of implementation, and to break-away fromproprietary communication protocols that has acceleratedthe uptake of IoT approaches [16].
2.1. Data volume
Wireless Sensor Networks (WSN) are an example ofhow IoT technology can be used to enable new possibilities[4], [10].
Utility computing, such as cloud computing, has facil-itated the growth of WSN in that scalable processing andstorage can be requested on demand, without requiring alarge investment in infrastructure and hardware [11]. Or-ganisations that own large data centres make the necessaryinvestment and provide the cloud computing utility on apay-per-use basis.
If we now consider a collection of IoT devices as similarto the organisation of a WSN, we can see that alongside thepotential to create new ways of working, there is also theprospect of producing vast quantities of data. This increasein data production creates significant challenges for its sub-sequent analysis, contextualisation and comprehension [6].
2.2. Visualising the value chain
Although interconnected machines that exchange databetween themselves and central IT systems is not a newconcept for the manufacturing industry, such connectivitywas often proprietory and “siloed” in nature; data commu-nication between machine tools might not be connected tosubsequent production processes, therefore limiting the in-telligence that could be available to guide or automate man-ufacturing system decisions. Since connectivity between thevarious organisational units within a manufacturing systemis restricted, there is a risk of preventing the visualisation ofa ‘complete picture’ and in many cases this directly inhibitsinnovation. IoT opens up manufacturing beyond process-centric visualisation towards a wider, sector-based view, thatfacilitates cooperative and collaborative, cloud-enabled busi-ness intelligence strategies [1] across geographical regions,sectors of industry or both.
2.3. Resource constraints
The growth of devices becoming interconnected hasbeen rapid, and will only increase at a greater rate [7]
as more devices become network enabled through eitherretrofit or as manufacturers include this capability into newdevices. As IoT becomes more pervasive, increased volumesof data will be harvested, together with a greater demandfor analytic capability within clouds for data visualisa-tion. Therefore, both network bandwidth and computationalpower are constraints of current architectures for the furtherdevelopment of IoT. This is a major challenge for domainssuch as manufacturing, where in-process data is producedin large quantities [14].
2.4. Data velocity
An additional challenge of more M2M communicationis data velocity - the rate at which data is produced - whichis an area of particular interest to those in the Big Dataresearch community. As we find more situations in whichto embed sensors, or more machines to control, we alsoincrease the rate at which data is produced. Process leveldata is produced in real-time, and as the potential value ofprocess monitoring is realised, more real-time data will becollected by manufacturers. This will place more strain onthe traditional bottleneck of the network infrastructure; thegateway between IoT devices and utility computing servicesfor storage, processing and visualisation [17], [18].
2.5. IT architecture
Traditional Information Technology (IT) environments,such as a client-server network architecture, might approachthe design of networks with reference to a three, or n-tiermodel, to distribute the processing and storage demandsacross a range of resources. As IoT devices have developedand matured, there is now more potential for compute powerand storage to be located within or close to the device thatsenses or actuates; in effect the incorporation of processingand storage at the edge of the network, commonly referredto as Edge computing [5].
The enhancement of devices to include processing andstorage means that varying degrees of analysis can be per-formed on continuous streams of real-time data, prior toeventual transfer of the data to a cloud-based data centre.
In the remainder of this article we propose an architec-ture that enables the exploitation of local compute powerand storage at the edge of networks, to facilitate analyticsprocessing upon streamed data from IoT devices.
3. In-Transit Analytics
Table 1 illustrates three different scenarios of data use.Analysis of historical data is the most traditional under-standing of data processing in an enterprise system. Asthe costs of computational power and storage have reduced,organisations have been able to process larger queries upontheir repositories. Similarly, organisations have also utilisedenterprise systems to forecast and plan the deployment ofresources. The use of data in the present has been less
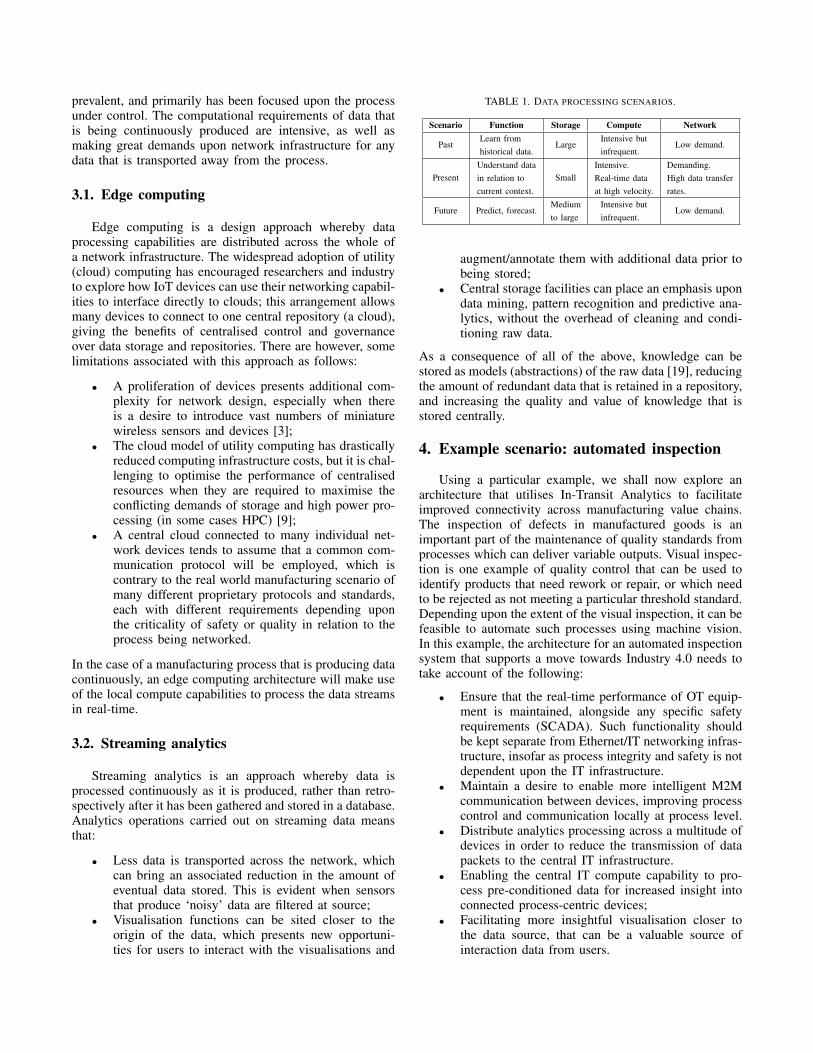
prevalent, and primarily has been focused upon the processunder control. The computational requirements of data thatis being continuously produced are intensive, as well asmaking great demands upon network infrastructure for anydata that is transported away from the process.
3.1. Edge computing
Edge computing is a design approach whereby dataprocessing capabilities are distributed across the whole ofa network infrastructure. The widespread adoption of utility(cloud) computing has encouraged researchers and industryto explore how IoT devices can use their networking capabil-ities to interface directly to clouds; this arrangement allowsmany devices to connect to one central repository (a cloud),giving the benefits of centralised control and governanceover data storage and repositories. There are however, somelimitations associated with this approach as follows:
• A proliferation of devices presents additional com-plexity for network design, especially when thereis a desire to introduce vast numbers of miniaturewireless sensors and devices [3];
• The cloud model of utility computing has drasticallyreduced computing infrastructure costs, but it is chal-lenging to optimise the performance of centralisedresources when they are required to maximise theconflicting demands of storage and high power pro-cessing (in some cases HPC) [9];
• A central cloud connected to many individual net-work devices tends to assume that a common com-munication protocol will be employed, which iscontrary to the real world manufacturing scenario ofmany different proprietary protocols and standards,each with different requirements depending uponthe criticality of safety or quality in relation to theprocess being networked.
In the case of a manufacturing process that is producing datacontinuously, an edge computing architecture will make useof the local compute capabilities to process the data streamsin real-time.
3.2. Streaming analytics
Streaming analytics is an approach whereby data isprocessed continuously as it is produced, rather than retro-spectively after it has been gathered and stored in a database.Analytics operations carried out on streaming data meansthat:
• Less data is transported across the network, whichcan bring an associated reduction in the amount ofeventual data stored. This is evident when sensorsthat produce ‘noisy’ data are filtered at source;
• Visualisation functions can be sited closer to theorigin of the data, which presents new opportuni-ties for users to interact with the visualisations and
TABLE 1. DATA PROCESSING SCENARIOS.
Scenario Function Storage Compute Network
PastLearn fromhistorical data.
LargeIntensive butinfrequent.
Low demand.
PresentUnderstand datain relation tocurrent context.
SmallIntensive.Real-time dataat high velocity.
Demanding.High data transferrates.
Future Predict, forecast.Mediumto large
Intensive butinfrequent.
Low demand.
augment/annotate them with additional data prior tobeing stored;
• Central storage facilities can place an emphasis upondata mining, pattern recognition and predictive ana-lytics, without the overhead of cleaning and condi-tioning raw data.
As a consequence of all of the above, knowledge can bestored as models (abstractions) of the raw data [19], reducingthe amount of redundant data that is retained in a repository,and increasing the quality and value of knowledge that isstored centrally.
4. Example scenario: automated inspection
Using a particular example, we shall now explore anarchitecture that utilises In-Transit Analytics to facilitateimproved connectivity across manufacturing value chains.The inspection of defects in manufactured goods is animportant part of the maintenance of quality standards fromprocesses which can deliver variable outputs. Visual inspec-tion is one example of quality control that can be used toidentify products that need rework or repair, or which needto be rejected as not meeting a particular threshold standard.Depending upon the extent of the visual inspection, it can befeasible to automate such processes using machine vision.In this example, the architecture for an automated inspectionsystem that supports a move towards Industry 4.0 needs totake account of the following:
• Ensure that the real-time performance of OT equip-ment is maintained, alongside any specific safetyrequirements (SCADA). Such functionality shouldbe kept separate from Ethernet/IT networking infras-tructure, insofar as process integrity and safety is notdependent upon the IT infrastructure.
• Maintain a desire to enable more intelligent M2Mcommunication between devices, improving processcontrol and communication locally at process level.
• Distribute analytics processing across a multitude ofdevices in order to reduce the transmission of datapackets to the central IT infrastructure.
• Enabling the central IT compute capability to pro-cess pre-conditioned data for increased insight intoconnected process-centric devices;
• Facilitating more insightful visualisation closer tothe data source, that can be a valuable source ofinteraction data from users.

Figure 2. In-Transit Analytics for defect detection process.
The diagram in Fig 2 illustrates how the ITA architectureinfluences the enablement of machine vision inspection forIndustry 4.0. Images (either single frames or video) arecaptured by the inspection camera. A limited amount ofprocessing is performed by the camera (image compression),before the image data is passed to a Field ProgrammableGate Array (FPGA), which is an embedded systems devicethat can be re-programmed to suit different needs. An FPGAis an example of the type of hardware that is requiredto be SCADA compliant, yet it is now feasible to scalethe computational power and storage in a way that wasnot previously possible with more traditional embeddedsystems.
The FPGA is located at the edge of the network andis used to process the camera data stream by filtering forany anomalies (potential defects). This requires processingpower that is beyond that of the sensing device (the cam-era), and because of the inclusion of Graphics ProcessingUnits, computationally intensive data conditioning can takeplace. This immediately reduces data feeds in the order ofTerabytes down to Gigabytes after post-processing, whichstarts to alleviate the network of data that is redundant forthe purposes of defect identification. As an edge device,the FPGA is connected to a Cloudlet, which is a small-scale data centre also located at the edge of the network.Further processing can take place upon the output datastreams, which have now been filtered and conditioned tosome degree, ready for more detailed analysis, such as theapplication of pattern recognition techniques to identify aspecific type of defect.
Finally, the output (which is now in the order ofMegabytes) is available for storage within the central ITinfrastructure such as a cloud. The cloud is then used as arepository for enterprise resource planning as well as forpredictive analytics and modelling. At each stage of thearchitecture there is an opportunity to visualise the data.For instance, filtration of anomalies at the FPGA edge devicecould be used by an operator so that they can aid the trainingof the system. The operator would examine the exceptionsthat are presented by the system and provide expert guidanceto augment the data collected, assisting identification furtherdownstream. Similarly, visualisation at the cloudlet provides
feedback for the control of the process. This can be observedat a local level, which is the traditional process-centricview that persists within the manufacturing industry. FPGAhardware can already host software that utilises MachineLearning techniques, presenting more possibilities to im-prove the resolution, quality and usefulness of data that isstreamed from edge devices.
5. System Architecture
We have investigated the potential for improved per-formance that is possible with the ITA architecture. Asper Fig 2, the ITA architecture consists of three tiers. Thefirst tier represents data sources such as sensor and cameradevices. Edge processing and storage capability such asFPGA/embedded systems and in-transit analytics processingnodes reside in the second tier of the ITA architecture. Inthe third tier, we represent cloud-based central processingand storage systems. It is assumed that components in thesecond tier will be located in closer proximity to first tierdata sources, than the centralised resources of tier three.The architecture can be improved for different workflowsto maximize compute and data optimization as discussedin [8]. The simulation has been implemented in OMNet++5.1 (https://omnetpp.org). It consists of components, connec-tions and messages which represent the traffic flow betweenthe components. Fig 3 illustrates the organisation of themodel which consists of the following:
• Sensor - a component that provides data in relationto physical sensing of an environment e.g image sen-sor e.g camera or raw data sensor e.g temperature,humidity, light, etc.
• Camera - a camera device which generates im-age/video data after regular intervals e.g 20 framesper second
• Intermediate Network Node (INN) - a networknode that enables data packets to be transportedwithout performing any processing upon the mes-sage content e.g router, switch,hub.
• Edge - an in-transit component that has the capa-bility to process and/or store limited amounts ofdata. This might be used for pre-processing, filter-ing/conditioning or transformation of data prior toits transfer to subsequent components.
• Monitor - this component can be used to visualisedata, as well as providing a means of input tointeract with system parameters. For instance, wemight modify the analysis criteria of an edge nodecomponent.
The sensor component in the simulation has been configuredto produce a temperature reading at certain intervals definedby the sensor delay parameter, which specifies the delay inseconds. For example, a value of ‘1.0’ means that the sensorwill be read every second. Similarly, a camera device pro-duces image data at regular intervals defined by the cameradelay parameter representing a real camera device moni-toring some industry scenario and continuously producing

Figure 3. Simulated In-Transit Analytics architecture.
TABLE 2. CONNECTION SPEED BETWEEN DIFFERENT COMPONENTS
Connection SpeedSensor and Camera to INN 1 GbpsSensor and Camera to Edge 1 GbpsINN to cloud 100 MbpsEdge to Cloud 100 Mbps
data in the network. As shown in Fig 3, there are two dataproduction sources (a sensor and a camera device) withinTier 1. Tier 2 contains INN and Edge components. Both INNand Edge receive the same copy of messages from the sensorand camera components through a wired connection. Thelines in Fig 3 depicts two way wired connection betweennetwork resources,whose speed is defined by channel delayparameters as shown in Table 2.
5.1. Analysis criteria
A key challenge of a generalisable multi-tier and in-transit analytics architecture is to identify the criteria foranalysis and algorithm processing required on each pro-cessing nodes of the network. The analytics requirementswill vary depending upon specific applications and theirdomains. Based on industry 4.0 scenarios, we have evaluatedthe in-transit analytics architecture by considering two spe-cific cases. First, we look at an IoT scenario that makes useof simple sensors, producing raw data at regular intervals.Second, we study the more complex situation of cameradevice producing image data that may need post-processing.In the first case, raw sensor data can be processed by a ruleengine in near real time and is less CPU intensive, whereasimage processing is a more CPU and data intensive task.Such processing has to be done under strict time constraintsto provide feedback and real time analytics/visualisation. Toassist with data intensive jobs, a meta-scheduling approachsuch as DIANA [12] maybe used to significantly improvethe execution time of the data intensive applications. Formultiple clouds, scheduling algorithms such as [15] can be
used to improve the performance for number of metrics suchas execution and turnaround time.
5.1.1. Case One: Raw data processing.In raw sensor processing, the goal is to either forward orreject the message based on simple rule based processing.To process raw data, there are three stages:
1) Decode and determine the data priority.2) Process the incoming message.3) Decide whether to forward or reject the message.
First, we decode the message and then determine its priority.In cases where streaming analytics cannot be achieved innear real time, it is necessary to prioritise the order inwhich data is processed. Processing of data is an applicationspecific task, so understanding of the domain is necessaryto devise the data priortisation order. Our experiments haveutilised data provided by the MIT Artificial Intelligence Lab(http://db.csail.mit.edu/labdata/labdata.html), as the basis ofthe raw data processing scenario (Case One). It consistsof data from 54 sensors with time, date, temperature,humidity, light and voltage readings. For sensor data whichprovides raw readings, the following rules apply:
Rule 1:For Sensor
if (temp>50){ {//forward data}else //do not forward }
Rule 2: For IoT device:
if (humidity<30 || light>35 ||voltage>500){ { //forward data }
else //don’t forward}
In both rules, we aim to forward data which is outside ofa pre-defined range, indicating a significant event, whichneeds visualisation, monitoring or feedback from subsequentnetwork nodes. In Rule 1, we only forward sensor readingswhere the temperature is greater than a threshold, in thiscase 50. For Rule 2, we check for exceptional levels forthe IoT device. Any data passing Rule 1 or Rule 2 will beforwarded to the next in-transit node.
5.1.2. Case Two: Image based sensor processing.For Case Two, we use data coming from a camera device,which produces image data at a rate of 20 image framesper second. The goal is to analyse the data in real time,placing time constraints on the processing latency atthe edge/in-transit nodes. As for Case One, the analysisconsists of three stages. After decoding and data prioritydetermination, we decompose our analytics algorithm intoN stages, where N indicates the number of in-transit/edgeand cloud nodes. We have two processing nodes, edge andcloud, and we divide our analytics algorithm into two parts,

TABLE 3. EDGE NODE ANALYTICS PARAMETERS
Name Description ValueAnalyticsDeadline Max Time for processing buffer 1 sec
BufferStorage Edge items capacity 20AlgorithmTime Time to process one data item 0.01 sec
i) light part and ii) heavy part. For image datasets, wecan perform image preprocessing, enhancement, dilation,scaling, transformation and similar (less CPU intensivealgorithms) on the in-transit/edge nodes. On the cloudnode, we can perform more CPU and memory demandingtasks such as image segmention, object detection, anddeep learning algorithms. To optimise edge processing, wedefine a parameter AnalyticsDeadline which defines thetime by which edge node can complete its tasks. The stagethree forwarding or rejection rule for this case is given by:
Algorithm for Image Analysis on the Edge node
Mutex<DataBuffer> buffer;while(simulation){addIncomingMessageToBuffer();timer=startTimerThread();for each item in buffer{executeAlgorithm(item);
} }TimerThread{if (timer.time>AnalyticsDeadlineTime){sendBufferDataToCloud();//rejection casebreak;}}
The objective is to reduce the time taken by the cloud toperform complete analytics of the data under time con-straints. Performing part of the algorithm on the edge canalso provide the end user with useful analytics/visualisationclose to the data source as the data is in transit. We haveidentified parameters which can be used to configure thebehaviour of the edge node to conform with applicationbased constraints in Table 3.
As shown in the pseudocode, AnalyticsDeadline is im-plemented as a timer which is triggered after every x secondswhere x is ‘1’. If an algorithm takes more than one second toperform the analytics, the time out is triggered, processingis halted and all the data items are forwarded to the cloudas they are. We seek to maximise the number of data itemsthat are processed by the edge node before forwarding. Byvarying these parameters, system performance can be testedfor different applications.
5.2. Priority scheduling
We have adopted a workflow based approach to theconsideration of how activity will be allocated to the ar-chitectural components. Data arriving from different sources
Figure 4. Storage required by Edge and INN nodes on cloud.
(such as sensors and IoTs) is considered a job. If several jobsarrive at an edge node for processing, the edge nodes mayneed to prioritise the processing of data type (or value) first,followed by the source location. Based on prioritisation,a software defined network (SDN) and network functionvirtualisation (NFV) can be used to route data to differentedge/in-transit nodes. With SDN and NFV, existing net-work infrastructure can be employed to provide in-transitcomputational capability under constraints to improve theefficiency of the analytics [20].
5.3. Results
After determining the analysis criteria and the workflowtask priorities for the dataset, the simulation produced aset of experimental results. Data produced from the sensoramounts to about 98 MB, and 990MB of image data forthe camera, for the duration of the simulation (1000 sec-onds). Data from both of these components was transportedthrough edge and INN components. The destination (cloud)component receives data from the Edge and INN compo-nents respectively.
5.3.1. Case One: Raw Data Sensor Processing.As shown in Fig 4, data processing performed at the
edge component has reduced the amount of data that wastransferred to the cloud by 62%, in comparison to the totaldata transferred via the INN component to the cloud. Even-tually, all messages received at the destination cloud needto be processed, which consumes compute resources andtime depending upon the individual algorithm or processingworkflow.
Within the simulation, the time taken by an algorithmto process one message is specified as parameter Algorithm-Time, and can be used to calculate the total time taken bya cloud to process all of the messages. For example, If ittakes 10 ms to process one message, by multiplying theindividual message processing duration by the total numberof messages to be processed, we can predict the total timetaken by the cloud to process all of the messages.
Thus, as shown in Fig 5 the time taken to processINN messages is 20 seconds, and time taken to processedge messages is 9.3 seconds, a reduction of 10.7 seconds

Figure 5. Time taken to process edge and simple network messages.
Figure 6. Bandwidth consumed by Edge and INN messages.
in total or 53.5% saving in compute time. In Fig 6, ECBandwidth Available indicates total connection bandwidthavailable from edge to cloud node and IC Bandwidth Avail-able shows the bandwidth available from INN node tocloud. As illustrated, bandwidth consumed by Edge nodeis significally less than bandwidth consumed by the INN(approximately 55% less).
Whilst the same data was sent to both Edge node andINN nodes, due to edge processing, the amount of data wasreduced and hence less bandwidth was ultimately consumed.It should also be noted that bandwidth consumed by INNis approaching the total bandwidth available from INN tocloud, while bandwidth consumed by Edge node is withinthe bandwidth available.
5.3.2. Case Two: Image Sensor Based Processing.In this case images from a camera sensor are computedunder stringent time constraints. Messages which cannotbe processed due to AnalyticsDeadline timeout or bufferoverflow are forwarded to the cloud without processing. Fig7 shows the cloud processing of INN and edge messages. Ifmessages are processed by an edge node under constraintse.g. buffer not full, and the AnalyticsDeadline has not timedout, they are not forwarded to the cloud.
As shown in fig 7, for the first 10 seconds, the number ofedge node and INN node messages processed by cloud nodeare identical. After 500 seconds, cloud node has finishedprocessing all of the edge messages, as the sensor data rate istwice that of the camera device and also the number of edge
Figure 7. Number of messages processed in time.
Figure 8. Bandwidth consumed with one sensor and IoT device.
node messages to process are less than the INN messages(about 600 in contrast to 2000 cloud messages).
The cloud continues to process the INN messages untilthe end of the simulation (t=1000). In conclusion, for INNnode, cloud node has to process 2000 messages, and in caseof edge node with in-transit processing, cloud node only hasto process 600 messages making the edge based networkmore productive by approximately 70% in this case.
The efficiency gained by incorporating edge computingdepends on a range of factors and parameters setting for e.ganalytics criteria, algorithm time, number of edge nodes andphysical topology of the network including communicationmedium and channel speeds. Fig 8 shows the bandwidthconsumed by edge node and INN nodes with respect totime as the messages are in-transit. The total bandwidthfor connections from Edge to Cloud and INN to Cloud isapproximately 2GB. The network bandwidth consumed byINN shows processing of all the messages during simulationinterval of 1000. The graph is generated with one sensorand one camera device and indicates a steady-state networksimulation, as bandwidth required by both edge node andINN components is less than the total bandwidth of the chan-nel. A key aspect of these results is the reduced bandwidthrequired by the Edge node (56% less), as compared to anINN. We again calculate the bandwidth consumed in fig9. However, in addition to sensor and camera devices, aftert=500, we add 3 other sensor nodes to observe the effect ofthe bandwidth consumption from Edge and INN nodes.
After t=800 we add another 4 sensors to determine theeffect on the bandwidth consumed. As mentioned earlier

Figure 9. Bandwidth consumed with 1, 4 and 8 sensors.
both Edge and INN receive redundant copy of the messagesfrom sensor and camera device and are independent fromeach other. The simulation is run for 1000 seconds, from 0to 500 simulation seconds and the graph is identical to Fig 8.However, after t=500 (when 3 extra sensors start producing),data rates increase and more bandwidth is required by bothEdge and INN nodes.
We observe that the curve for Edge bandwidth consumedis less steep than the curve for INN, which indicates thatthe Edge node is less prone to changes in network than theINN node. At t=800 with an additional sensors are addedthere is a steep rise in the data rate consumed by INNnode and reduced rise by the edge node. At t=900, justbefore the simulation is about to finish, the data rate capacityrequired by INN exceeds the total bandwidth available onthe network, whereas data rate capacity required by theEdge node is still below the total bandwidth curve. Thisgraph proves, edge computing can reduce the bandwidthrequirement of the network topology, in this case savingapproximately 54.%.
6. Conclusions
We have considered some of the issues facing themanufacturing value chain whilst it undergoes the fourthindustrial revolution. Specifically, we have identified dataanalytics and visualisation as fundamental topics that canassist manufacturers to gain the capability to be truly digital;this requires the interconnection of devices (through IoTtechnologies) as well as innovative approaches to includemyriad legacy architectures and equipment, to enable thefree exchange of dat from M2M.
Our proposed architecture, In-Transit Analytics, servesto augment existing legacy SCADA and IT architectureswith the capability to capture and process data at differentstages of the data pipeline. The use of an edge analyticsapproach enables significant data transfer savings whilst alsofacilitating richer, more relevant analytics to occur, whilstalso mitigating the endless progression of capturing andstoring more data, some of which is often redundant.
References
[1] H. Al-Aqrabi, L. Liu, R. Hill, N. Antonopoulos, Taking the Busi-ness Intelligence to the Clouds. 9th International Conference onEmbedded Software and Systems (HPCC-ICESS), Liverpool, IEEEComputer Society, pp953-958, 2012.
[2] K. Ashton, That “Internet of Things” thing, RFiD Journal, 2009.[3] M. Beer, W. Huang, R. Hill. Designing community care systems
with AUML. In: Proceedings of the International Conference onComputer, Communication and Control Technologies (CCCT ’03),IEEE Computer Society, 247-253, 2003.
[4] N. Bessis, F. Xhafa, D. Varvarigou, R. Hill, M. Li, Internet of Thingsand Inter-cooperative Computational Technologies for CollectiveIntelligence. Studies in Computational Intelligence 460, Springer,ISBN 978-3-642-34951-5, 2013.
[5] J. Gubbi, R. Buyya, S. Marusic, M. Palaniswami, Internet of Things(IoT): A vision, architectural elements, and future directions. Futuregeneration computer systems, 29(7), pp1645-1660, 2013.
[6] F. Chen, P. Deng, J. Wan, D. Zhang, A. Vasilakos, X. Rong, Datamining for the Internet of things: Literature review and challenges,International Journal of Distributed Sensor Networks, vol. 11, no.8, 2015.
[7] Gartner, “Gartner Says 6.4 Billion Connected ‘Things? Will Bein Use in 2016, Up 30 Percent From 2015?, Gartner web-site, http://www.gartner.com/newsroom/id/3165317, 10th Novem-ber 2015.
[8] I. Habib, A. Anjum, R. McClatchey, O. Rana. Adapting scientificworkflow structures using multi-objective optimization strategies,ACM Transactions on Autonomous and Adaptive Systems (TAAS)8, no. 1, 4, 2013.
[9] A. Ikram, A. Anjum, R. Hill, N. Antonopoulos, L. Liu, S. Sotiriadis,Approaching the Internet of things (IoT): a modelling, analysis andabstraction framework. Concurrency and Computation: Practiceand Experience, 27(8), pp1966-1984, 2015.
[10] X. Li, D. Li, J. Wan, A. Vasilakos, C. Lai, S. Wang, A review ofindustrial wireless networks in the context of industry 4.0, WirelessNetworks, pp1-19, 2015.
[11] Q. Liu, J. Wan, K. Zhou, Cloud manufacturing service systemfor industrial-cluster-oriented application, /emphJournal of InternetTechnology, vol. 15, no. 3, pp.373-380, 2014.
[12] R. McClatchey, A. Anjum, H. Stockinger, A. Ali, I. Willers, M.Thomas. Data intensive and network aware (DIANA) grid schedul-ing, Journal of Grid computing, 5, no. 1, pp43-64, 2007.
[13] PWC, Industry 4.0: building the digital enterprise,http://www.pwc.com/industry40, 2016.
[14] Z. Shu, J. Wan, D. Zhang, D. Li, Cloud-integrated cyber-physicalsystems for complex industrial applications, Mobile Network Appli-cations, pp1-14, 2015.
[15] S. Stelios, N. Bessis, A. Anjum, and R. Buyya. An inter-cloudmeta-scheduling (icms) simulation framework: Architecture andevaluation, IEEE Transactions on Services Computing, 2015.
[16] H. Sundmaeker, P. Guillemin, P. Friess, S. Woelffle, Vision andchallenges for realising the Internet of Things, Cluster of EuropeanResearch Projects on the Internet of Things, CERP IoT, 2010.
[17] S. Wang, J.Wan, D. Zhang, D. Li and C. Zhang, Towards thesmart factory for Industrie 4.0: A self-organized multi-agent systemassisted with big data based feedback and coordination, ComputerNetworks, Elsevier, vol. 101, pp158-168, 2016.
[18] S. Wang, J. Wan, D. Li, C. Zhang, Implementing smart factoryof industrie 4.0: An outlook, International Journal of DistributedSensor Networks., vol. 12, 1, 2016.
[19] M.U. Yaseen, A. Anjum, O. Rana, R. Hill, Cloud-basedscalable object detection and classification in video streams,Future Generation Computer Systems, ISSN 0167-739X,https://doi.org/10.1016/j.future.2017.02.003, 2017.
[20] A. R. Zamani, M. Zou, J. Diaz-Montes, I. Petri, O. Rana, A.Anjum, M. Parashar. Deadline constrained video analysis via in-transit computational environments, IEEE Transactions on ServicesComputing, 2017.